Article

Spatio-Temporal Pattern and Conflict Identification of Production–Living–Ecological Space in the Yellow River Basin

1
China Institute of Geo-Environment Monitoring, Beijing 100081, China
2
Key Laboratory of Mine Ecological Effects and Systematic Restoration, Ministry of Natural Resources, Beijing 100081, China
3
School of Geography and Information Engineering, China University of Geosciences, Wuhan 430074, China
*
Author to whom correspondence should be addressed.
Land 2022, 11(5), 744; https://doi.org/10.3390/land11050744
Submission received: 15 April 2022 / Revised: 13 May 2022 / Accepted: 15 May 2022 / Published: 18 May 2022

Abstract

:
Production–living–ecological space (PLES) is the main body of the optimization of the development and protection pattern of territorial space, and the spatial conflict in PLES reflects a struggle for ecological protection and socio-economic development in the process of spatial development and utilization. The Yellow River Basin is one of the most concentrated and prominent areas of spatial conflict of PLES in China. Therefore, clarifying the spatio-temporal pattern of PLES of the region and scientifically identifying the characteristics of its spatial conflict will significantly improve the efficiency of comprehensive utilization of spatial resources, promote the integrated and orderly development of resource elements in the basin, and eventually achieve the strategic goals of ecological protection and high-quality development of the Yellow River Basin. In this research, the CA–Markov model was applied to simulate the spatio-temporal pattern of PLES in the Yellow River Basin from 2010 to 2025, and the landscape ecology method was adopted to construct the spatial conflict of the PLES measurement model for identifying the spatio-temporal trends of conflicts and their intensity. The results reveal that, from 2010 to 2025, ecological–production space (EPS) dominates the PLES in the Yellow River Basin, as its total area remains stable amid fluctuations; living–production space (LPS) shows the most notable change, as it grows yearly along with urbanization and industrialization process of the region; the transition between ecological–production space (EPS) and production–ecological space (PES) is the most frequent, and the two also account for the largest area. Spatial conflict of PLES in the Yellow River Basin is mainly reflected in the encroachment of LPS on other PLES, concentrated in the regions from Hekou Town to the left bank of Longmen, Fen River, Shizuishan to the southern bank of Hekou Town, and Daxia River and Tao River in the Yellow River Basin. From 2010 to 2025, the space conflict composite index of PLES (SCCI) of most regions in the basin lies within 0.7, which is a stable or basically controllable level. Among the 29 tertiary water resource divisions in the Yellow River Basin, the SCCI of 15 indicate a major, decreasing trend.

1. Introduction

1.1. Motivation and Literature Review

Due to the rapid development of the economy and the advancement of urbanization, the highly intensified exploitation of spatial resources has become a distinctive feature of urban and rural spatial development processes. As the number of spatial resources is limited, while their functions are highly adjustable, different groups utilize these resources in various intensities to meet their own interests, and therefore, the use of spatial resources is at times not in line with the ecological environment protection. As a result, a series of spatial conflicts have emerged, such as the uncontrolled expansion of urban space, the imbalance between agricultural space and ecological space, the degradation of ecosystems due to the encroachment of ecological space, and the unreasonable layout and function of various spaces within cities.
The human–land space competition and conflict of interests caused by land use have gradually become a hot issue in the international community [1], receiving close attention from global stakeholders such as NGOs, the United Nations, and governments [2,3]. To properly alleviate land-use conflicts, the Food and Agriculture Organization of the United Nations (FAO) formulated and promulgated the Land Evaluation Outline, proposing that land-use planning should be carried out scientifically based on land suitability. Accordingly, countries around the world established their own land-use suitability evaluation systems on the basis of this outline, for the purposes of coordinating the relationship between land resource supply and human demand and realizing the sustainable use of land resources [4]. At the same time, studies on land-use conflicts, concerning the areas of society, economy, geography, and environment are increasing in academia [5,6,7,8,9]. Research in this area is mainly focused on the sources, types, identification, evolution, and management of spatial conflicts [10,11,12,13,14,15,16,17,18].
Spatial resources can be functionally divided into three types: production space, living space, and ecological space [19]. Production–living–ecological space (PLES) basically covers the scope of spatial activities of human work and life and is the basic carrier of human socio-economic development. As the main body of the optimization of the spatial pattern of territorial space, PLES becomes an important basis for the implementation of the main functional area planning at all levels, the construction of the spatial planning system, and the improvement of the spatial development and protection system of the territorial space [20].
Spatial conflict in PLES is mainly manifested by the imbalance of structure and function of PLES, inappropriate territorial combination, and uncontrolled transformation of spatial types. In particular, it reveals the unreasonable occupation of living and ecological spaces by production space and the destruction of ecological space by spaces of living and production. The identification of spatial conflict of PLES, simulation of spatial conflict pattern in PLES, and analysis of its development and evolutionary characteristics can effectively reveal the complexity and vulnerability of the human–land relationship, fully reflecting the results and characteristics of spatial resource competition in the process of human–land interaction, and provide basic support for the optimization of regional territorial development and protection pattern [21].
The spatial conflict of PLES, in essence, belongs to the category of land-use conflicts. The study of land-use conflicts dates back to the 18th century and was initially focused on the conflict between the added economic value of land, human demand, and the land system [22]. Since the 1960s and 1970s, land-use conflicts have been characterized by interdisciplinary and diversified integration, and scholars’ research perspectives have been enriched, revealing the causes, forms, and characteristics of land-use conflicts in relation to different dimensions such as regional deprivation [23,24,25], spatial competition [26,27,28], spatial integration [29,30,31], spatial control [32,33,34,35,36], ecological security [37], non-cooperative games [38], energy security and climate change [39], etc., as well as their impacts on socio-economic development and resources. In terms of research content, the spatial spillover effects of talent, policy, capital, technology, and resources [40,41,42] have been explored, the conflicts in spatial resource utilization between different interest groups and conflicts between spatial utilization and regional ecological environmental protection [43,44] have been analyzed, the conflicts in land-use subjects, land planning, and land systems [45,46,47] have been evaluated, and the spatial conflicts have been measured from the perspectives of economics and ecology, respectively. This body of research provides a basic framework for exploring the process of urbanization to promote the stability and harmony of human–land relationships and optimize the regional ecological security pattern. In terms of evaluation methods, scholars have mainly adopted the participatory survey method [48], PSR model and fuzzy evaluation method [49], multiobjective planning method [50], land–scape pattern analysis method [21,37], coupled coordination degree method [51], suitability evaluation [52,53], and actor–network analysis method [54], focusing on the scale of administrative regions such as urban agglomerations, provinces, and cities or special regions such as mining areas [45,55], and initially built a theoretical framework and methodological system for spatial conflict research.
To ensure that production space is used intensively and efficiently, living space is pleasant and proper in size, and ecological space is unspoiled and beautiful are important goals to realize the construction of ecological civilization in China [56]. From 2012 to 2017, the central working conference of urbanization, the 13th Five-Year Plan, and the report of the 19th National Congress of China set the coordinated development of the PLES as an essential strategic initiative to enhance the modernization of the spatial governance system and governance capacity of the country. How to alleviate the spatial conflicts among different PLES systems has become a primary issue that needs to be solved [57].
Although scholars have made some progress in spatial conflict identification, there are still certain shortcomings. First of all, at the spatial scale, previous studies mainly focus on administrative units such as urban agglomerations, provinces, and cities, and there are fewer studies at the watershed scale; in terms of research content, previous studies on spatial conflicts mostly concerned the space of land-use types, and there are fewer studies on the analysis of conflicts within the PLES system; at the temporal scale, most of the research considered the current situation of spatial conflicts, but less attention has been given to the evolution of future spatial conflicts. This becomes particularly important in the context of the recent emphasis on nature-based solutions for climate change mitigation [58].

1.2. Objective and Contribution

Based on the abovementioned state of research, in this paper, the Yellow River Basin was taken as the study area of spatial conflict of PLES, and the CA–Markov model was used to predict the future land-use pattern of the basin (until 2025). On account of the multifunctionality and composite nature of land use, four types of PLES were classified and analyzed. Using the grid as the basic evaluation unit and the 29 tertiary water resource divisions in the Yellow River Basin as the basic study unit for spatial conflicts, the spatial conflict of the PLES measurement model was constructed by adopting the landscape ecological index to evaluate the current and future spatial patterns of the spatial conflicts (until 2025), providing a basis for mitigating the spatial conflicts and optimizing the spatial development and protection pattern. It also provides a scientific reference to support and serve the major national strategies for ecological protection and high-quality development in the Yellow River Basin and helps to achieve sustainable development in relation to the economic, social, and ecological dimensions of the environment.

2. Research Methodology
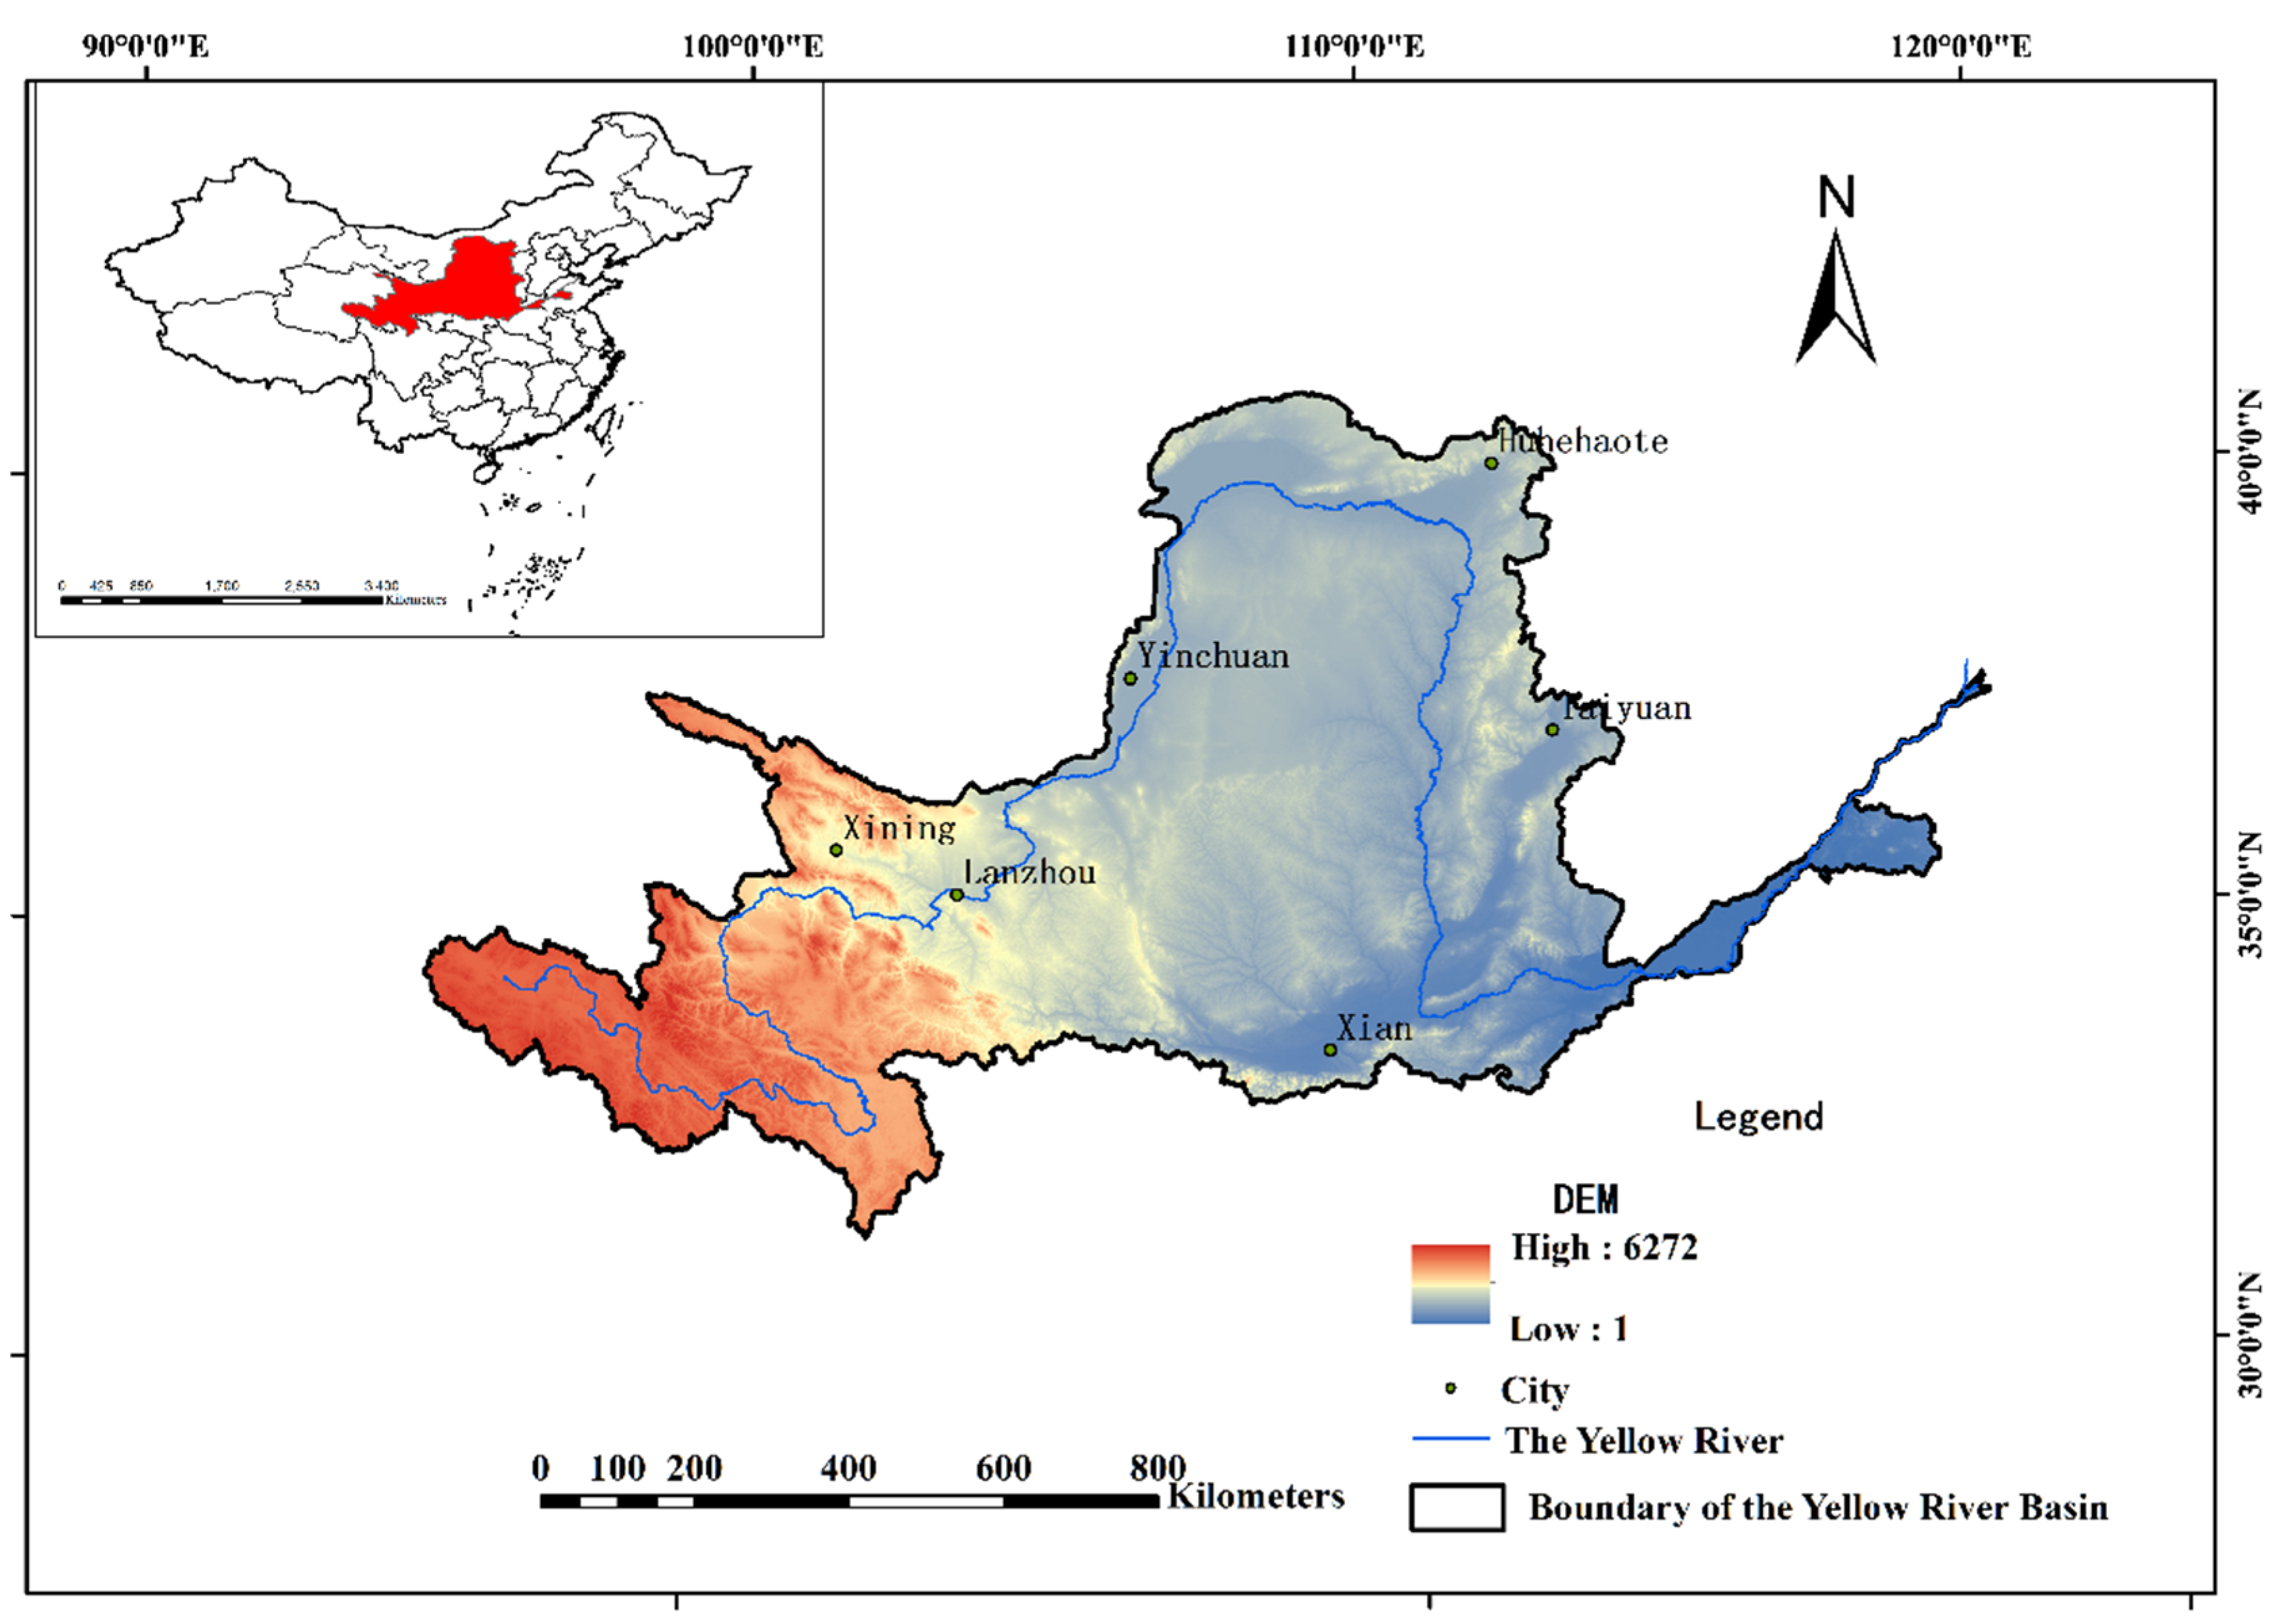
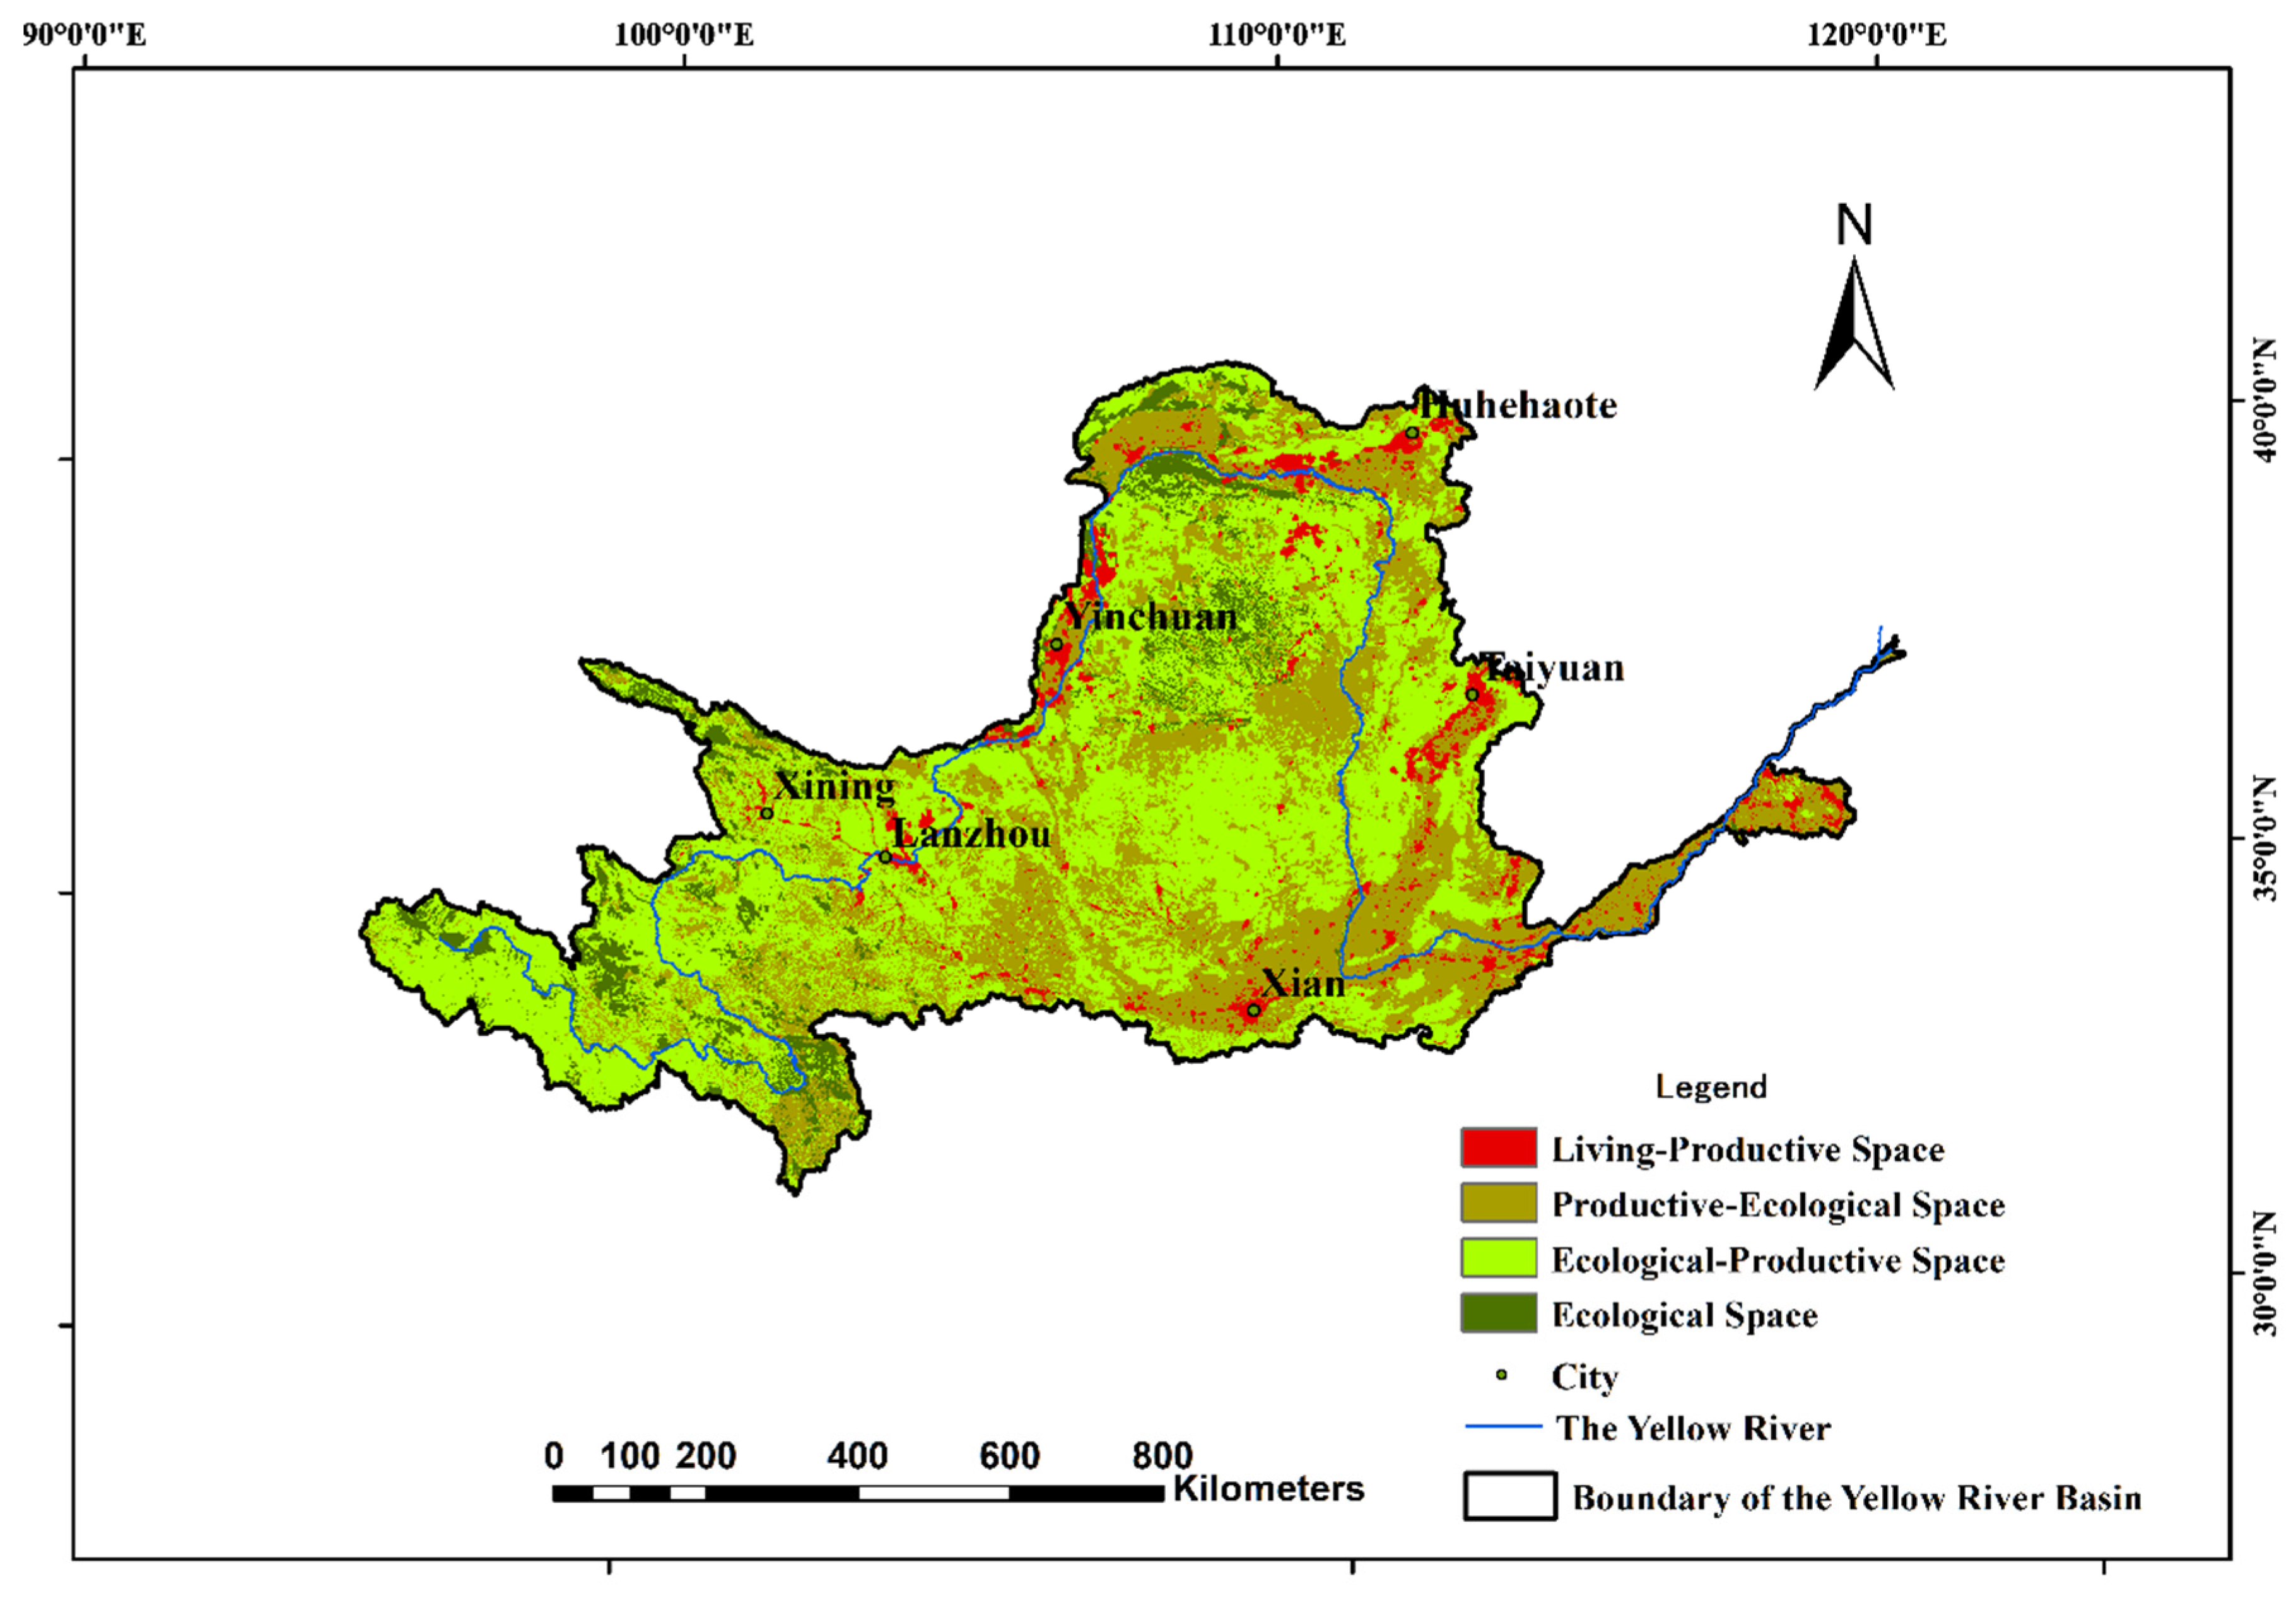
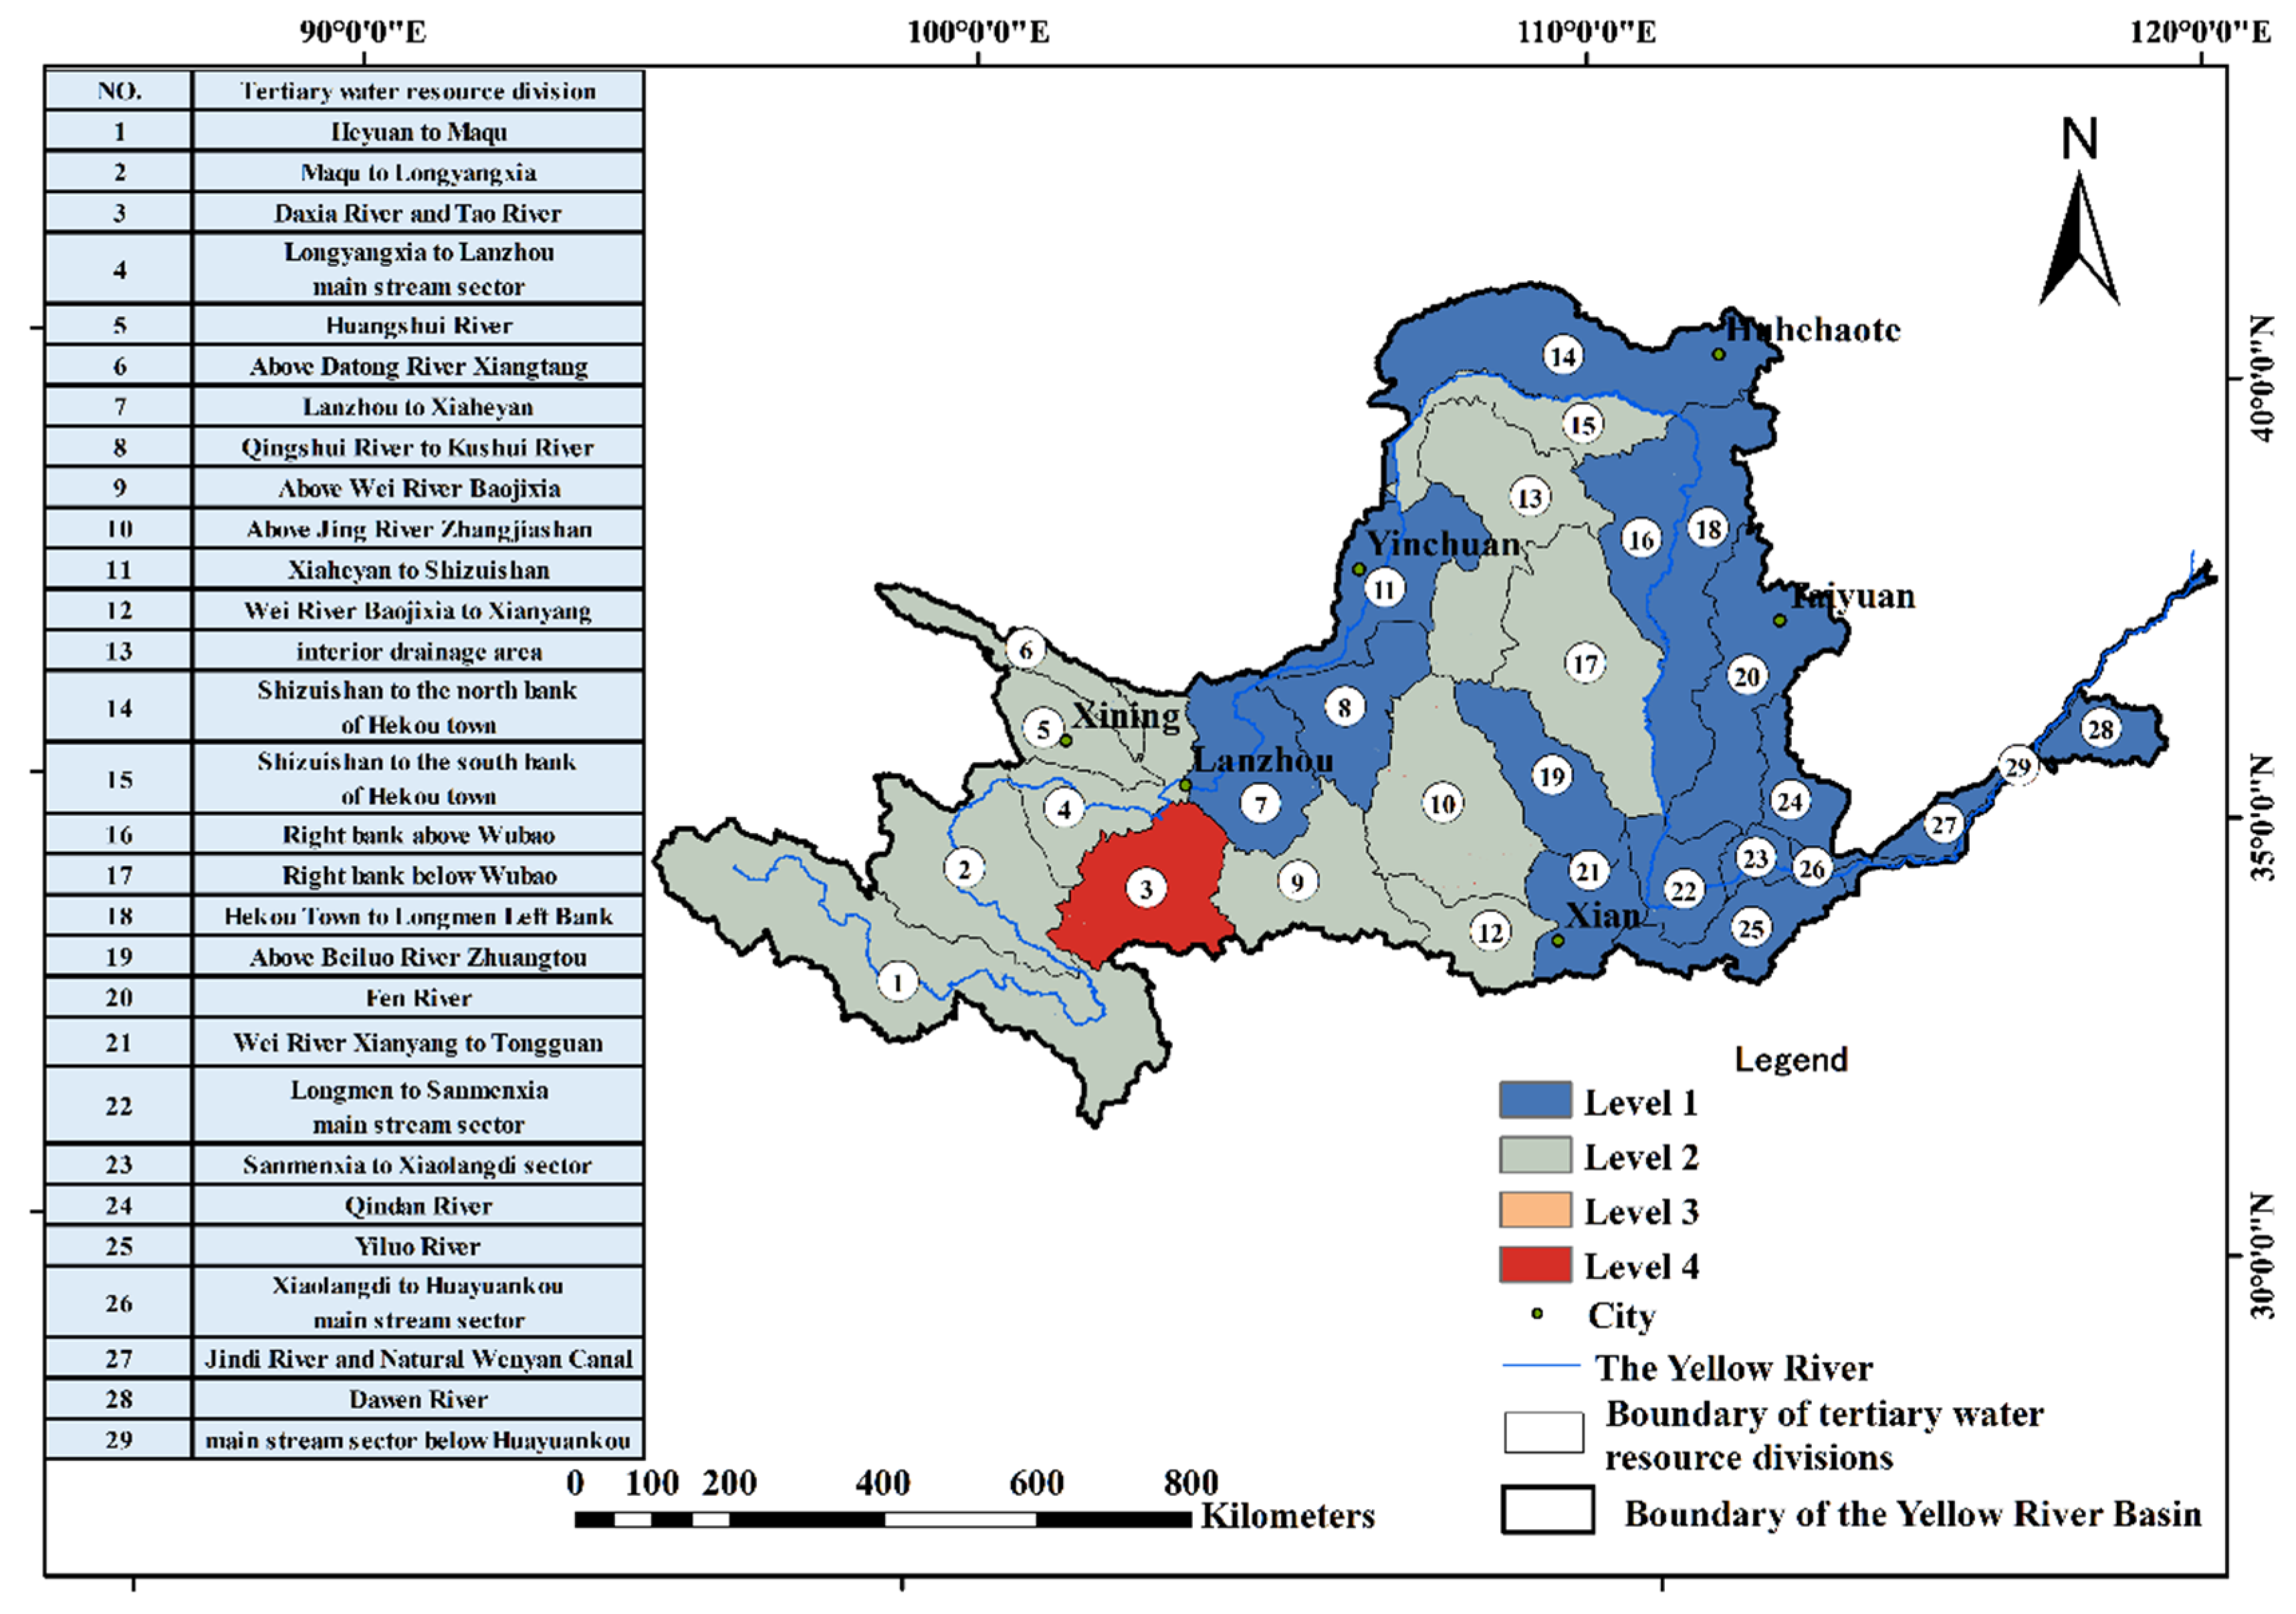
2.1. Study Area

Yellow River, the second-largest river in China, originates in the Yueguzonglie Basin at the northern foot of the Bayan Khara Mountains in Qinghai. Its main stream is 5464 km long, flowing through nine provinces and regions in China—namely, Qinghai, Sichuan, Gansu, Ningxia, Inner Mongolia, Shaanxi, Shanxi, Henan, and Shandong—and finally running into the Bohai Sea. The Yellow River is regarded as the mother river of China, as Chinese civilization was born in the Yellow River Basin, which is also an important ecological barrier and economic zone in China. The Yellow River Basin covers an area of about 795,000 km2, located between 95°59′–118°58′ E and 31°56′–42°03′ N (Figure 1). It amounts to 8.3% of China’s land area, and the total population of provinces in which the Yellow River Basin is located was 420 million in 2018, accounting for 30.3% of China’s population, with a regional gross national product of over 23.9 trillion yuan, making up 26.5% of China’s GDP in 2018. Known as the “energy basin”, the Yellow River Basin is rich in coal, oil, natural gas, and non-ferrous metals, among which coal reserves account for more than half of China’s total amount, making it an important base for energy, chemical, raw material, and basic industrial production in China. At the same time, the Yellow River Basin connects the Qinghai–Tibet Plateau, the Loess Plateau, and the North China Plain, and has many national parks and national key ecological function areas such as the Sanjiangyuan and Qilian Mountains, making it an important ecological security barrier in northern China.
In recent years, the rapid industrialization and urbanization of the Yellow River Basin have accelerated the evolution of its natural geographic pattern, and the unreasonable human development and utilization activities have aggravated the deterioration of the ecological environment, resulting in the tightening of resource and environmental constraints in the basin, and the intensity of territorial space development is on the verge of overload. Since industries in the Yellow River Basin rely heavily on energy, and economic zones and urban agglomerations generally use land carelessly, the encroachment of production and living spaces on ecological space is serious, and the problem of spatial conflict of PLES is very prominent, which seriously restricts the high-quality socio-economic development. To achieve the strategic goal of ecological priority and green development, scientific implementation of territorial planning and land-use control and optimization of spatial development and protection pattern are first required to identify the spatio-temporal pattern of spatial conflict of PLES in the Yellow River Basin.

2.2. Research Framework

The framework of PLES simulation and identification of spatial conflict of PLES in the Yellow River Basin is as follows:
Step 1: Simulation of PLES distribution pattern in the Yellow River Basin in 2025 based on the CA–Markov model;
Step 2: Analysis of the spatio-temporal patterns of PLES in the Yellow River Basin from 2010 to 2025;
Step 3: Quantification of the spatial conflict of PLES in the Yellow River Basin from 2010 to 2025 using the Spatial Conflict Composite Index evaluation method of landscape ecology and evaluation of the degree of spatial conflict of PLES and its spatio-temporal pattern.

2.3. Data Sources and PLES Classification

The vector data of the boundaries of the Yellow River, Yellow River Basin, tertiary water resource divisions, and the land-use raster data of the Yellow River Basin in 2010, 2015, and 2018 were provided by the Resource and Environment Science and Data Center of the Chinese Academy of Sciences (https://www.resdc.cn/, accessed on 10 March 2022). The land-use data of the Yellow River Basin have a spatial resolution of 30 m × 30 m. Land-use types included 6 primary types—namely, arable land, forest land, grassland, waters, residential land, and unused land—and 25 secondary types.
Considering the multifunctional complexity of spatial resources, the same space resource may have one or more complex functions, including functions related to production, living, and ecology. In this research, the PLES classification of the Yellow River Basin was formed by referring to the current research results of other scholars on PLES classification [44,59,60], integrating and reclassifying the existing land-use types based on the actual situation of the Yellow River Basin, and forming the PLES classification in accordance with the classification principles of dominant and secondary functions, which contains living–production space (LPS), production–ecological space (PES), ecological–production space (EPS), and ecological space (ES), as shown in Table 1.

2.4. Space Conflict Composite Index (SCCI) of PLES

Based on the theory of landscape ecology, the characteristics of spatial complexity, spatial vulnerability, and spatial stability were used to determine the spatial conflict of the PLES index and quantitatively evaluate its intensity in the Yellow River Basin. The evaluation method using the space conflict composite index of PLES (SCCI) is described in [61], and the calculated SCCI values are normalized within the 0–1 interval. SCCI can be expressed as follows:
SCCI = CI + FISI
where CI is the spatial complexity index, which is quantified by using the area-weighted average patchwork fractal index (AWMPFD) in landscape ecology. With the rapid socio-economic development, land development and utilization activities gradually intensify; as a result, the shapes of patches tend to be complex, and spatial utilization conflicts grow accordingly. Therefore, the area-weighted average patch fractal index (AWMPFD) can better characterize the degree of interference of neighboring patches to the measured patches, which reflects the degree of influence of human development and utilization activities on the space. The higher the value, the greater the external force on the patches. The AWMPFD can be calculated as follows:
A W M P F D = i = 1 m j = 1 n [ 2 ln ( 0.25 P i j ) ln ( a i j ) ( a i j A ) ]
In this formula, Pij is the perimeter of the patch, aij is the area of the patch, A is the total area of the spatial type, i and j are the j-th spatial type in the i-th spatial unit; m is the total number of units involved in the evaluation in the study area, and n is the number of PLES.
FI is the spatial vulnerability index, which is measured by using the vulnerability of each landscape type within the study area in landscape ecology. FI characterizes the ability of spatial patches to resist external pressure, which directly affects the degree of spatial vulnerability. The weaker the resistance, the more vulnerable to external influence, the stronger the spatial vulnerability, and the higher the level of spatial conflict. PLES is a redistribution of the landscape types, referring to the related literature [21,22,37,44,45,62,63], the vulnerability of each type of PLES is assigned as LPS −0.1, PES −0.44, EPS −0.3, and ES −0.75. The FI calculation equation is as follows:
F I = i = 1 n F i × a i S
In the above formula, Fi is the vulnerability index of class i spatial type, n is the total number of PLES classifications, and ai is the area of patches of various landscape types within the unit; S is the total spatial area.
SI is the spatial stability index, which is measured through the landscape fragmentation index in landscape ecology. The main effect of spatial conflict on the regional spatial pattern can lead to landscape patch fragmentation. The more fragmented the spatial pattern, the more homogeneous the type, the less spatial stability, and the higher the intensity of the spatial conflict. The SI value is calculated by the following formula:
S I = 1 P D
P D = n i A
where PD is the patch density; the larger the PD value, the higher the fragmentation of the space, the lower the spatial stability, and the lower the stability of the corresponding spatial ecosystem. ni is the number of patches of type i spatial type in each spatial unit, and A is the area of each spatial unit.

2.5. CA–Markov Scenario Simulation

The CA–Markov model predicts land-use change by combining the principles of cellular automata (CA), Markov chains, and multiobjective land allocation [64]. It also has the ability to predict and model spatial changes in complex systems over time. The CA–Markov model integrates spatio-temporal factors in a land-use raster map, treats the land-use type represented by each raster as a metacell state, and uses a land-use transfer area matrix and probability matrix to determine the transfer of metacell states and simulate the change in land-use pattern in a certain region in a specific time.
The simulation process for the PLES distribution of the Yellow River Basin in 2025 was as follows:
The spatial overlay analysis of the land-use data was first processed in ArcGIS and imported into IDRISI software; then, the probability matrix of PLES shift in the Yellow River Basin from 2010 to 2015 was calculated using the Markov model. Considering the data of terrain slope, elevation, and road, the MCE module was used to construct the land-use transfer suitability atlas, and the CA–Markov model was applied to simulate and generate the PLES distribution in 2018. Finally, using the PLES classification data in 2018 as the benchmark, the number of CA cycles was set to 7, based on which the CA–Markov model was used to simulate the PLES distribution of the Yellow River Basin in 2025.

3. Results

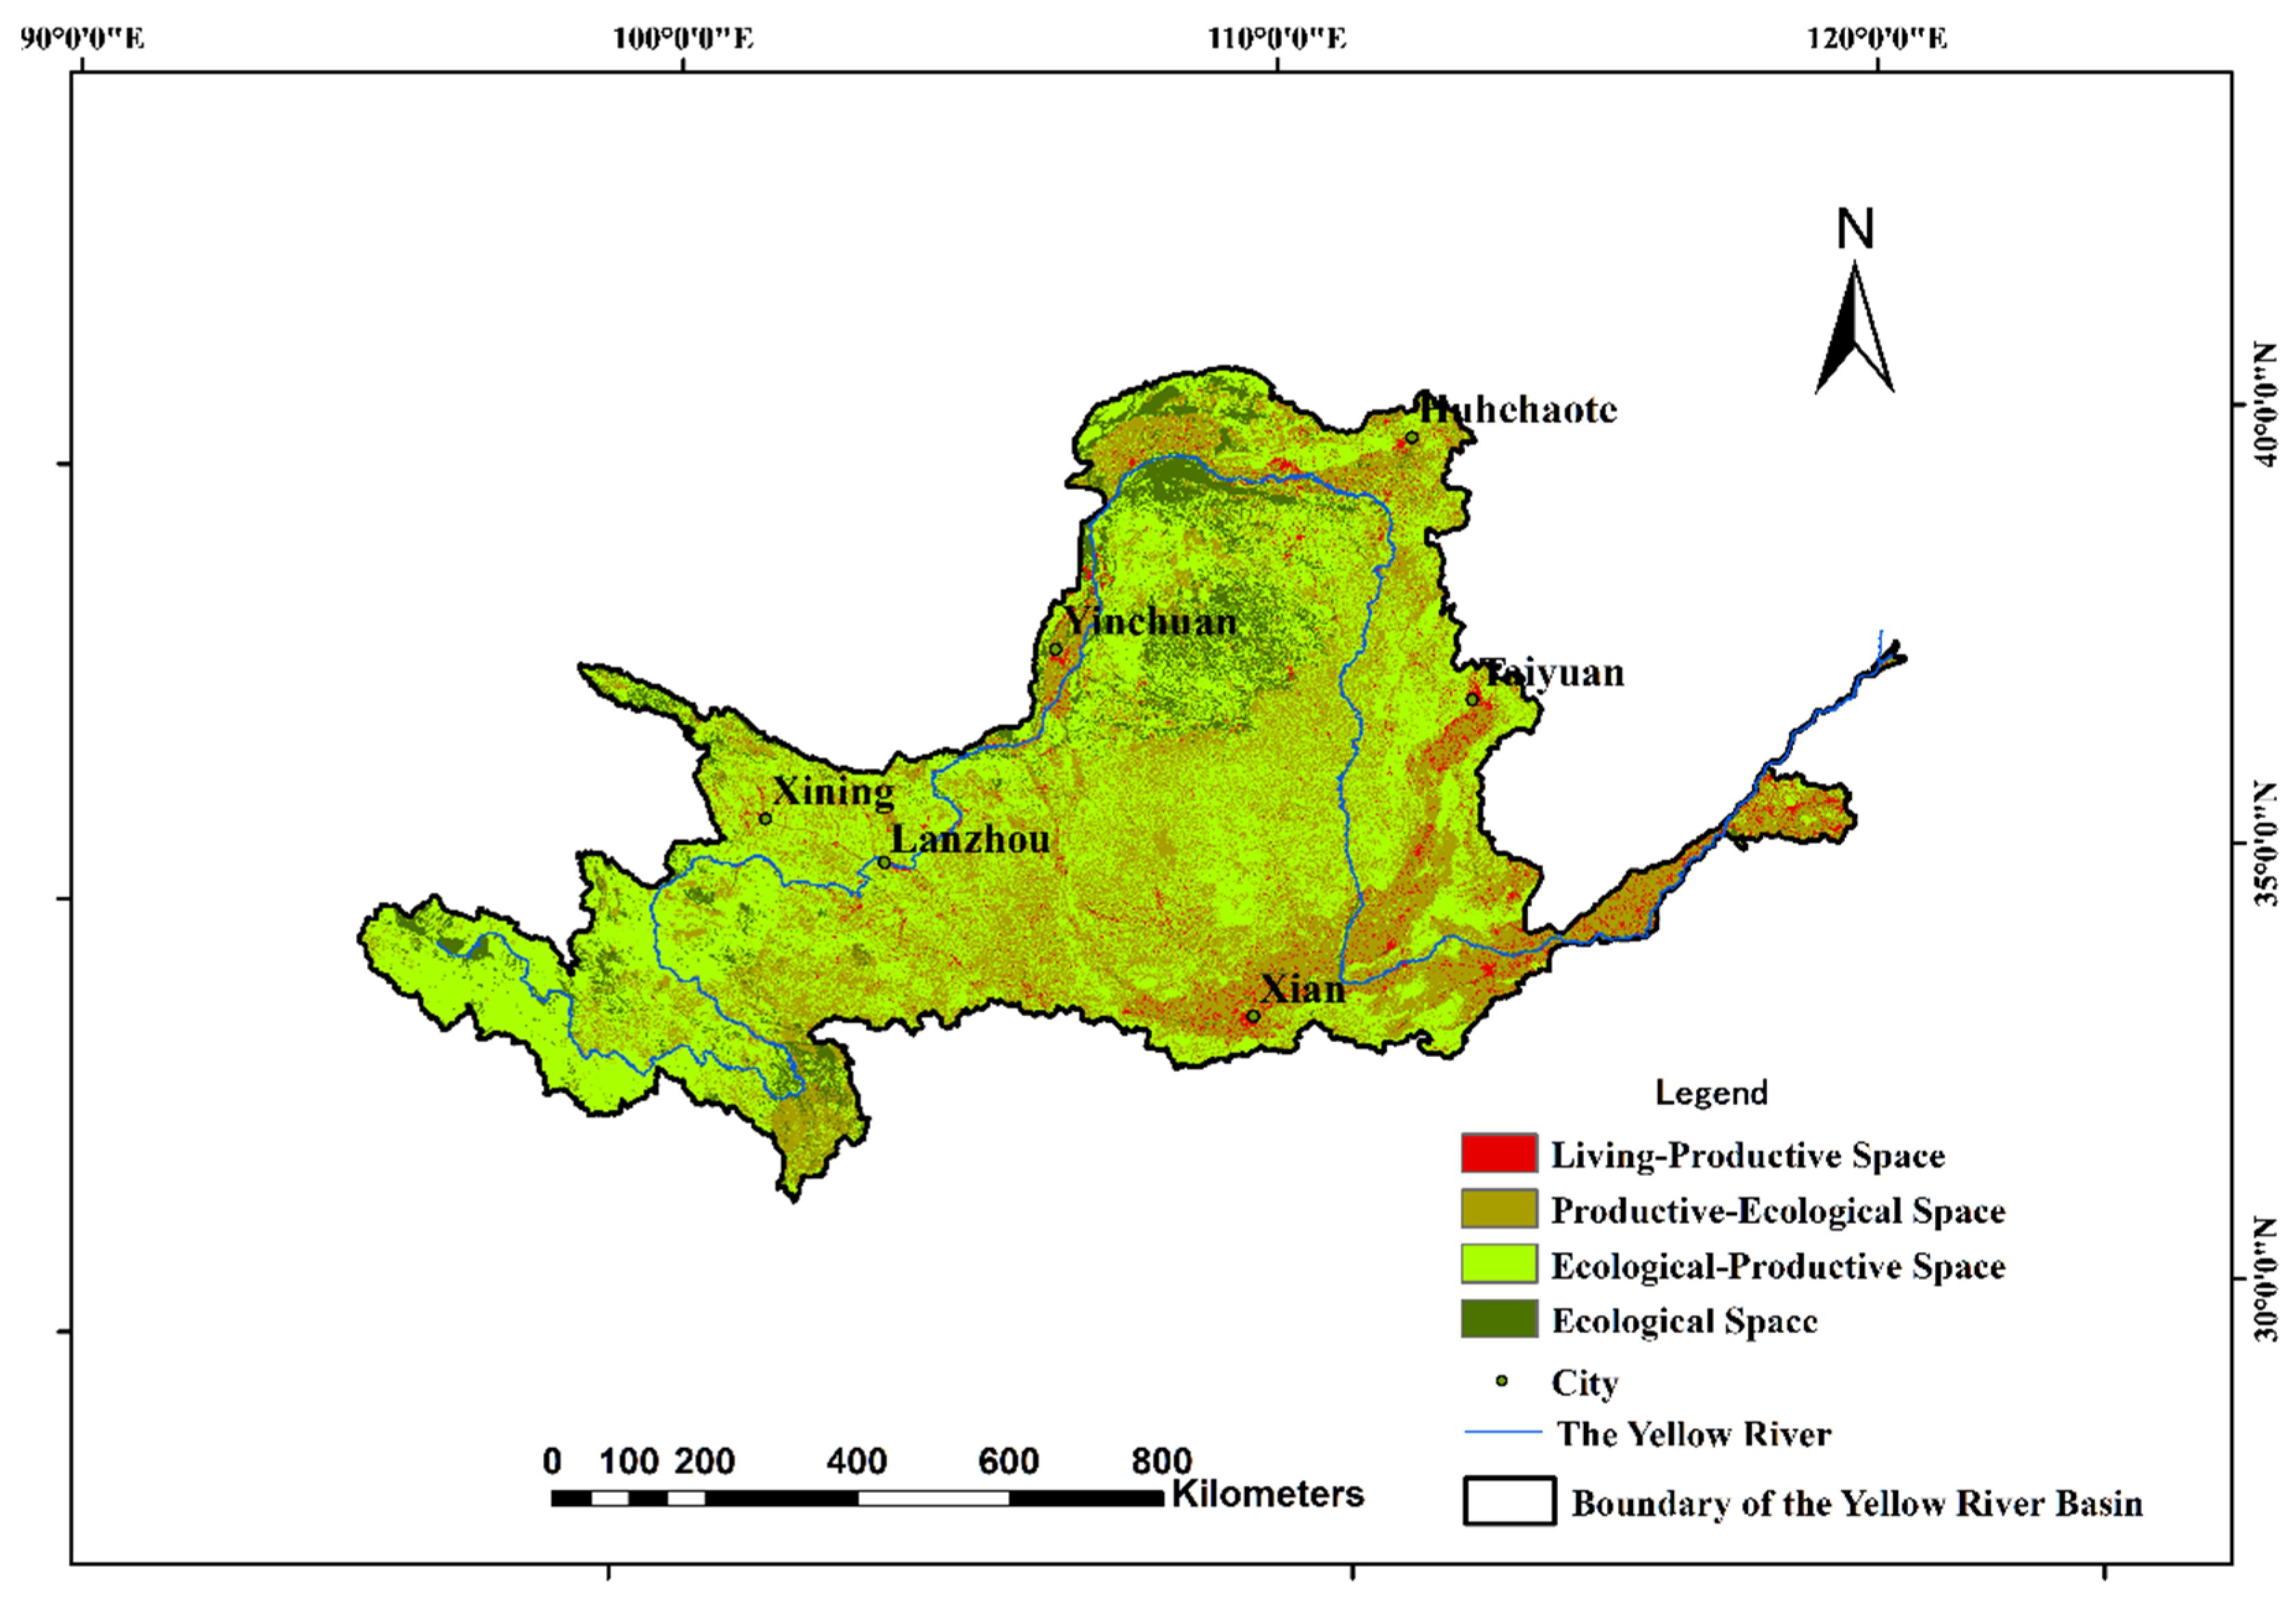
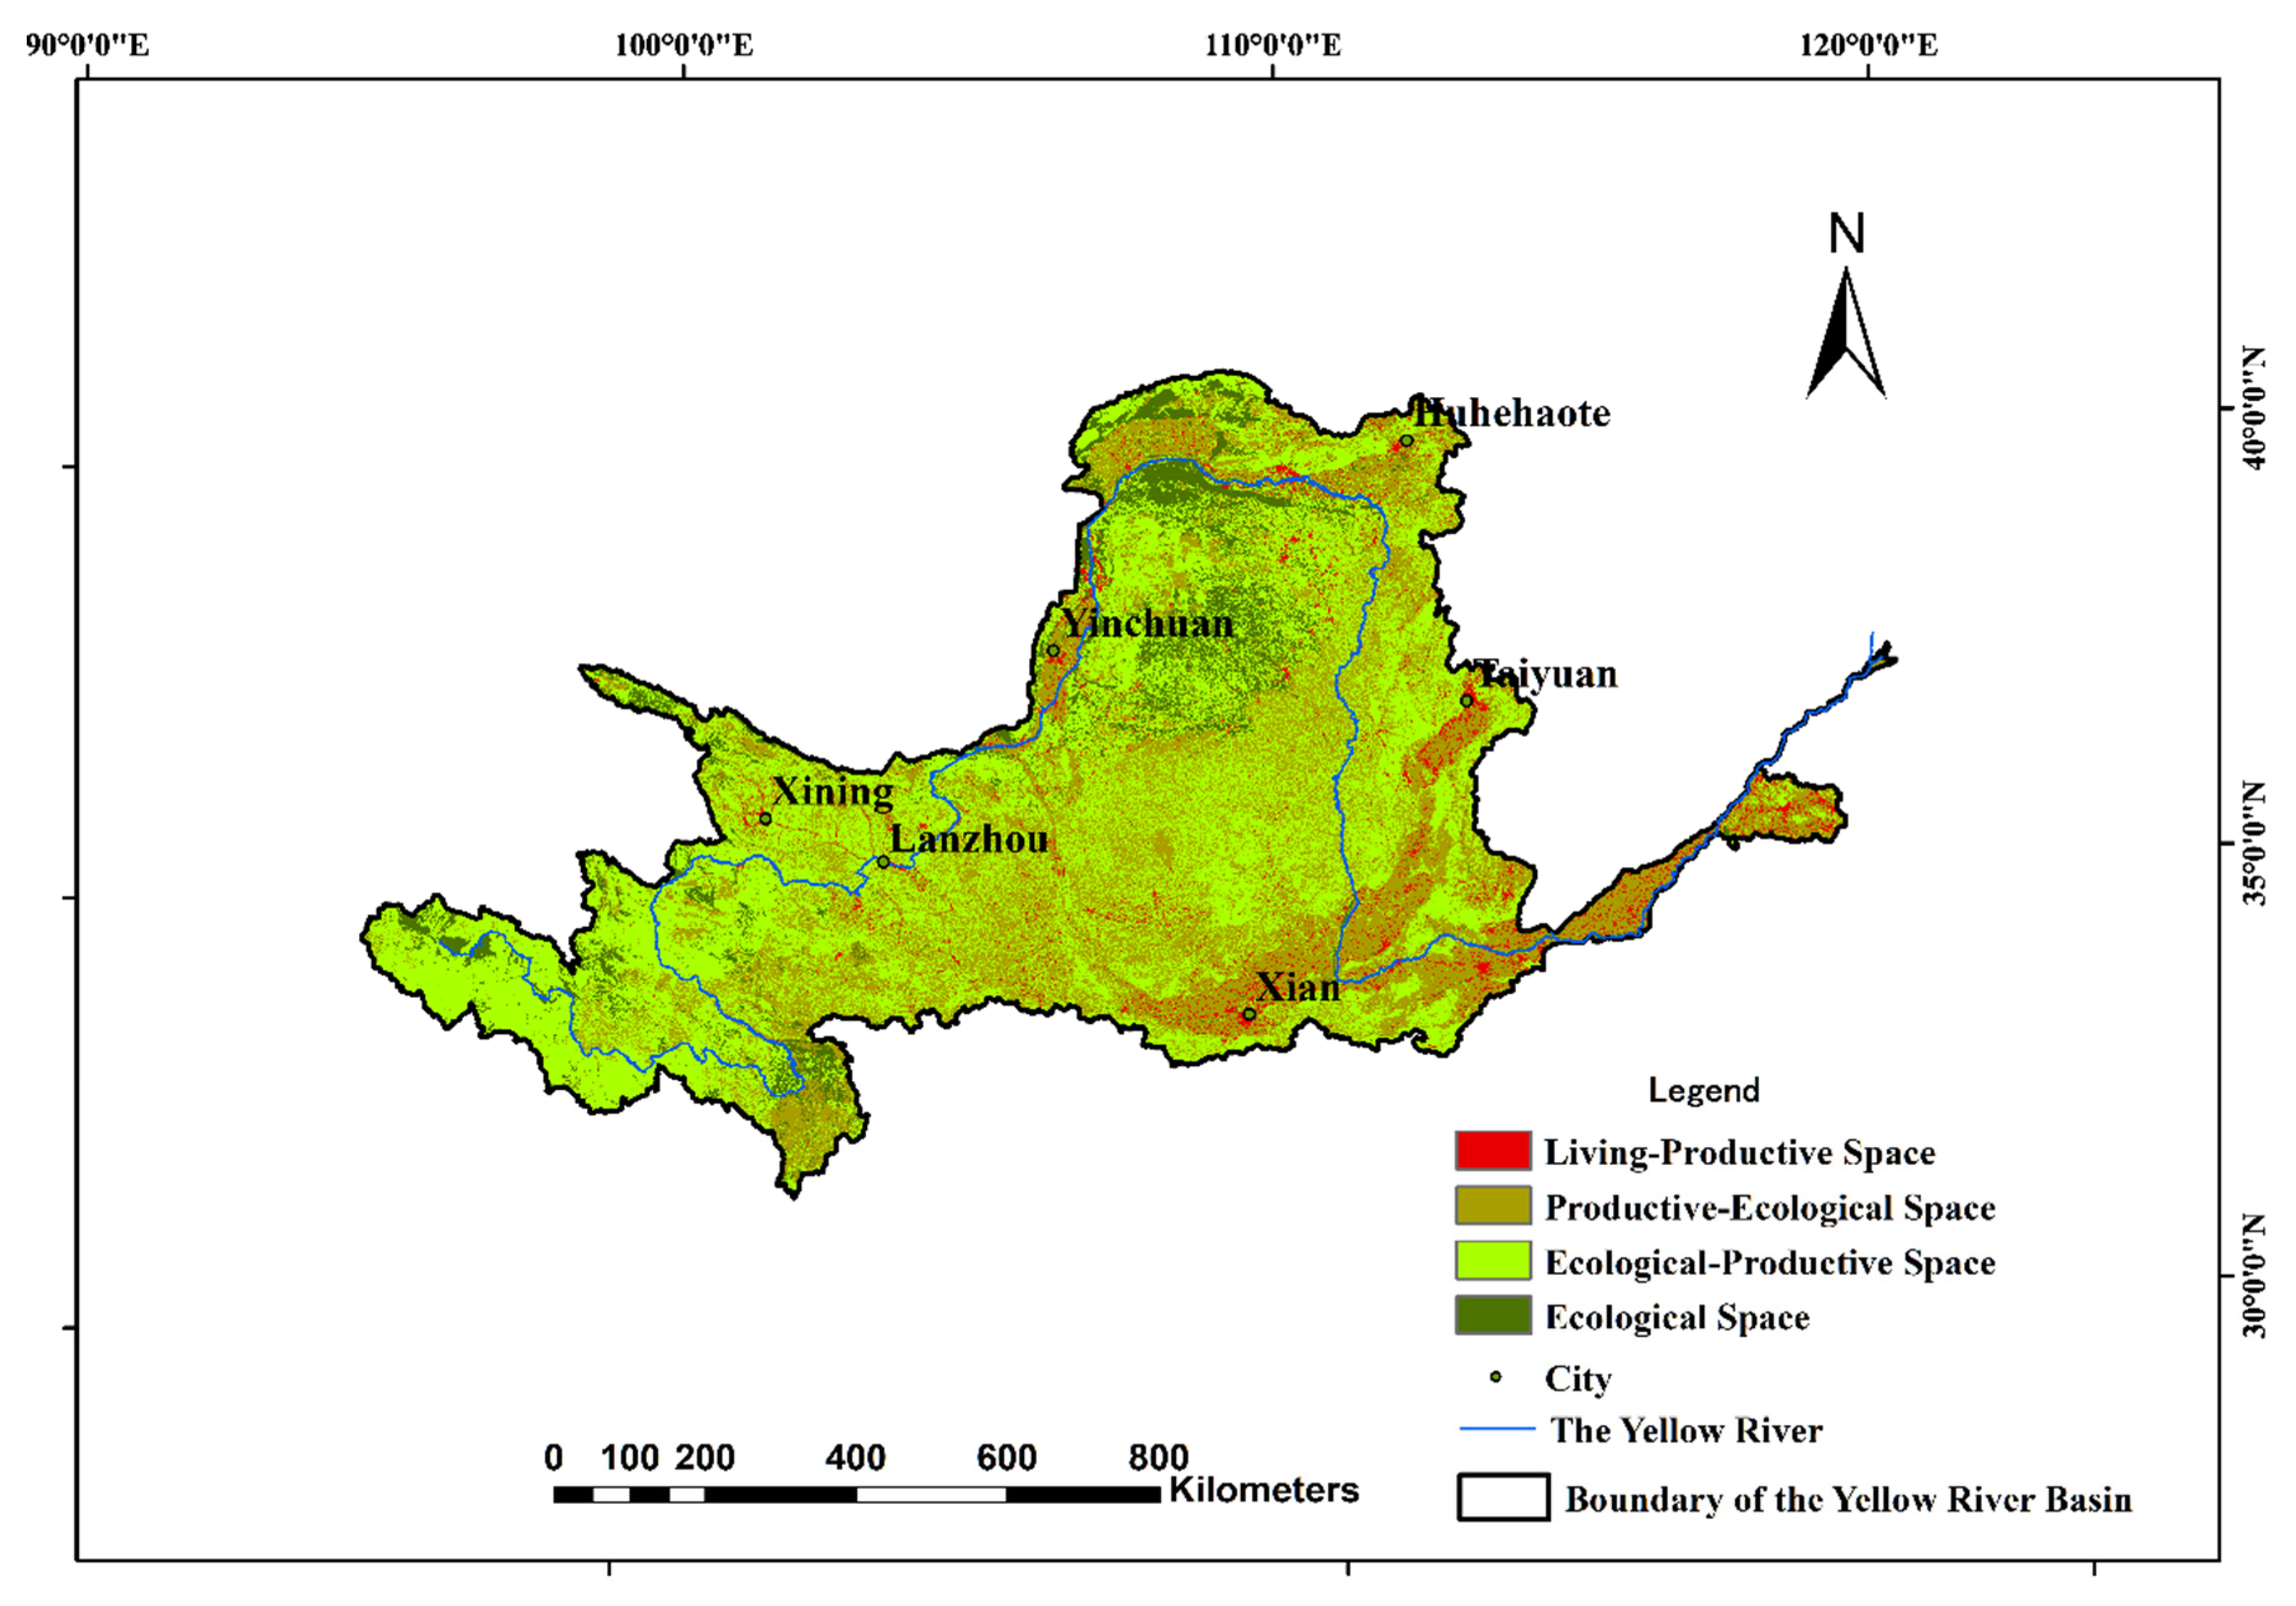
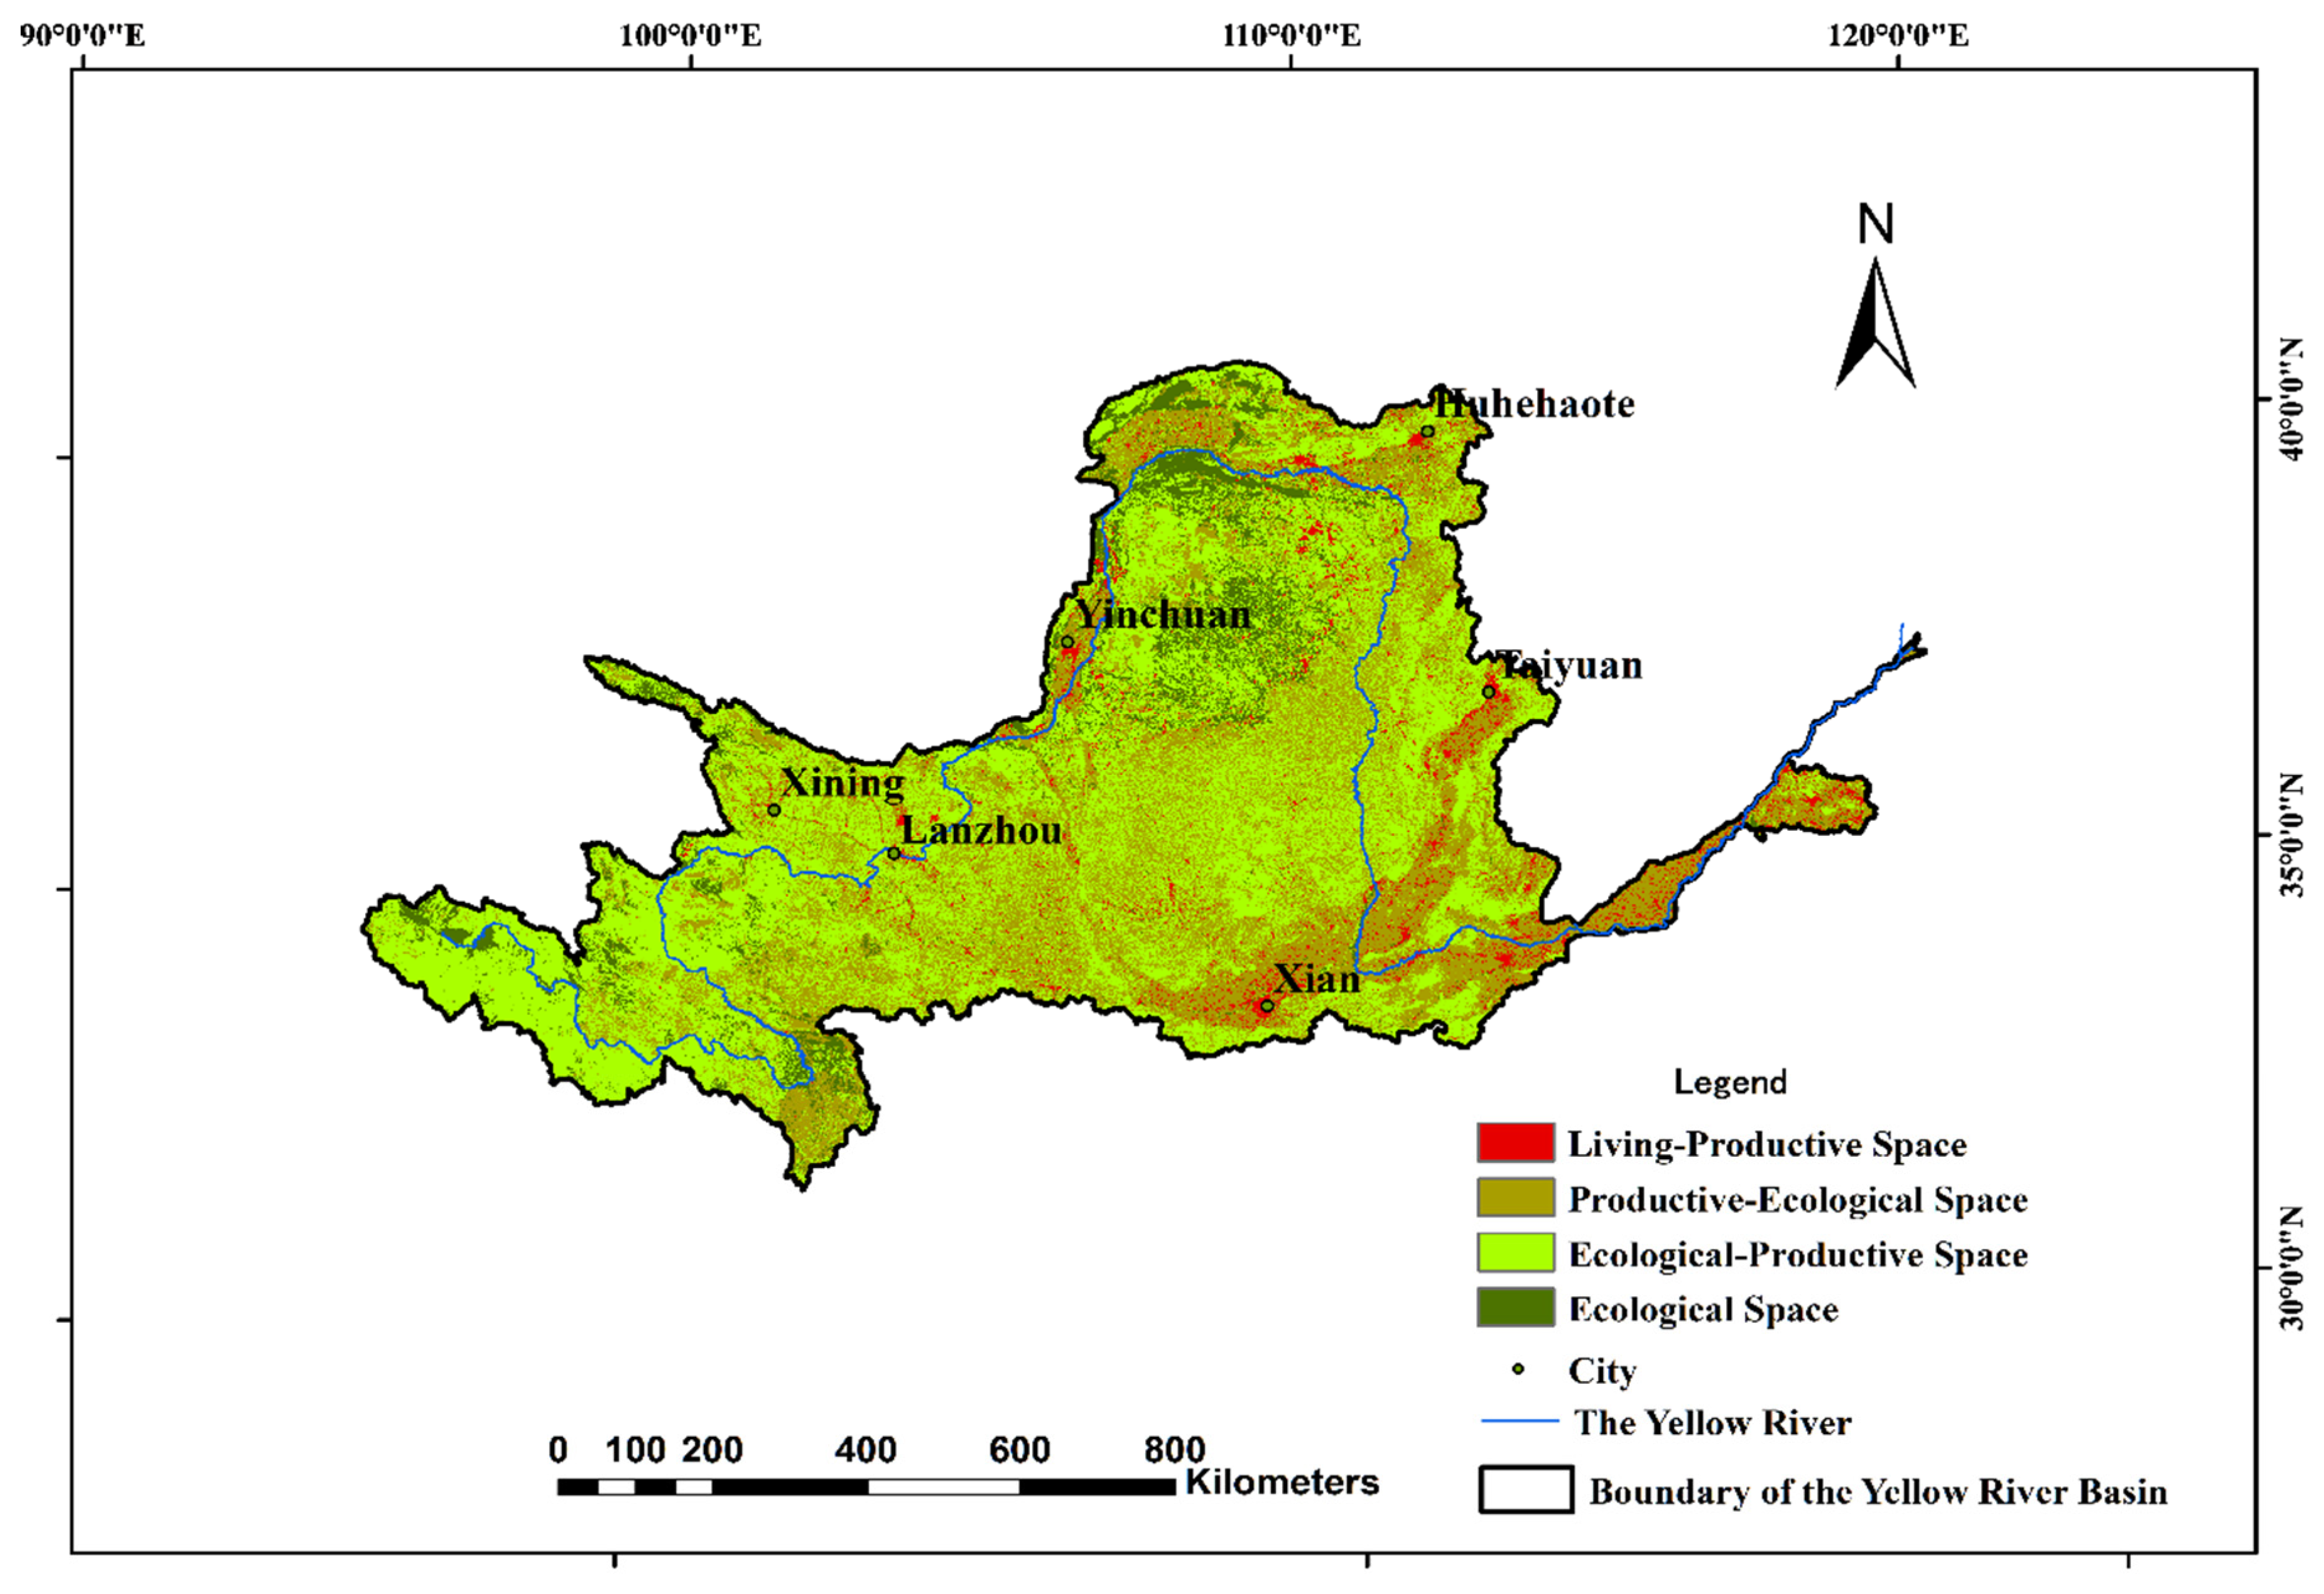
3.1. Spatio-Temporal Pattern of PLES

As shown in Table 1, land use in the Yellow River Basin was reclassified into living–production space (LPS), production–ecological space (PES), ecological–production space (EPS), and ecological space (ES) by using LUCC data. Additionally, the PLES distribution patterns in 2010, 2015, and 2018 were obtained (Figure 2, Figure 3 and Figure 4). The CA–Markov model was applied to predict and analyze the distribution pattern of PLES in the Yellow River Basin in 2025, using the kappa coefficient to test the consistency between the simulation results and the current distribution of land-use types in 2018; the results suggested that the kappa value was greater than 0.85, indicating that the simulation results of the CA–Markov model were more satisfactory. The spatial pattern of PLES in the Yellow River Basin in 2025 is shown in Figure 5.
From 2010 to 2025, EPS remains the most prominent among PLES categories in the Yellow River Basin, which is concentrated and widely distributed in the middle and upper reaches of the Yellow River Basin, with an annual average area that exceeds 50% of the total area of the basin. PES in the Yellow River Basin is widely distributed as well, with an annual mean area of about 36%, concentrated in the Yellow Huaihai Plain, Fenwei Plain, Ning-Meng Plain, and other major agricultural production areas, and also widely scattered in the Loess Plateau and other areas. ES is spread mostly in the upper reaches of the Yellow River Basin and the source region of the Yellow River, mainly in form of desert, sand, Gobi, bare land, and other unused land types, with an average area of about 9% for many years. LPS is found mostly in Jinan, Zhengzhou, Xi’an, Taiyuan, Hohhot, Yinchuan, Lanzhou, Xining, and their surrounding areas, with a cluster-like concentrated distribution, sharing only a minimum area of about 4%.
Table 2 shows the changes in the PLES area and their proportion in the Yellow River Basin from 2010 to 2025. Overall, EPS and PES are still the dominant PLES types in this period—the combined area of both exceeds 85% of the total area of the basin. The spatial area of the two does not vary significantly with time, and the year-to-year variation is mostly less than 0.1%, which is basically a stable state. In contrast, the LPS area of the Yellow River Basin shows a yearly growth trend, expected to increase from 2.51 × 10⁴ km2 in 2010 to 4.28 × 10⁴ km2 in 2025—an expansion of nearly 70% in 15 years, and the growth rate is increasing year by year. In addition, the ES area of the Yellow River Basin is gradually decreasing, from 7.59 × 10⁴ km2 in 2010 to 6.48 × 10⁴ km2 in 2025, and the decreasing trend is expected to gradually intensify from 2018 to 2025.

3.2. PLES Transfer Matrix Analysis

According to Table 3, all four types of PLES have different degrees of transfer in and out of each other. The area where PLES type conversion occurs is 10,686.02 km2, accounting for about 1.34% of the total area. The amounts of EPS and PES are larger than the amounts of the other three types of spatial transformation, with a total of 4481.32 and 4276.73 km2, respectively. Among them, the type shift between EPS and PES is especially drastic. The transfer volume of EPS to PES is about 2910.06 km2, amounting to 64.94% of its total transfer volume. The transfer from PES to EPS is also greater, about 2489.50 km2, accounting for about 58.21% of its total spatial transfer. In comparison, the transfer between LPS and ES is more stable. The transfer from ES to LPS is 215.79 km2, while the transfer from LPS to ES is the smallest among all PLES types, with an area of 11.15 km2.
According to Table 4, the area where PLES type transfer occurred is 64,586.46 km2, accounting for about 8.12% of the total area, which shows a substantial growth trend, compared with the PLES transfer from 2010 to 2015. In terms of the proportion of PLES type transfer, it is roughly similar to the percentage in 2010–2015. PES and EPS are less stable, as their transfer to other PLES types has the largest areas of 29,715.94 and 25,050.59 km, respectively. Among them, the transfer from EPS to PES is about 20,547.12 km2, occupying more than 80% of their total transfer. The area where PES transferred to EPS remains the largest among all PLES types, about 23,211.14 km2, taking up about 78.11% of its total transfer. In comparison, the transfer volume between LPS and ES is smaller, with 664.27 km2 transferred from ES to LPS, while the transfer volume from LPS to ES is only 212.07 km2, which is the smallest area among all PLES types.
The PLES distribution of the Yellow River Basin in 2025 was predicted with the CA–Markov model. From the PLES area transfer matrix of the Yellow River Basin for 2018–2025 shown in Table 5, it is evident that the PLES transfer area will continue to grow substantially, to about 205,740.87 km2, and the average annual PLES transfer area is 29,391.43 km2, which is about 1.36 times that of 2015–2018, but the PLES transfer growth rate indicates a decreasing trend. With the same pattern of PLES transfer changes in the cycles of 2010–2015 and 2015–2018, EPS and PES are less stable, and the spatial type transfers in and out are relatively large. Among them, EPS and PES transfer areas are 87,864.46 and 83,044.38 km2, respectively, both of which account for more than 40% of the total transfer volume. In comparison, LPS and ES are relatively stable, for which the area transferred from LPS to ES is the smallest, only 272.25 km2, accounting for about 0.13% of the total transferred area.

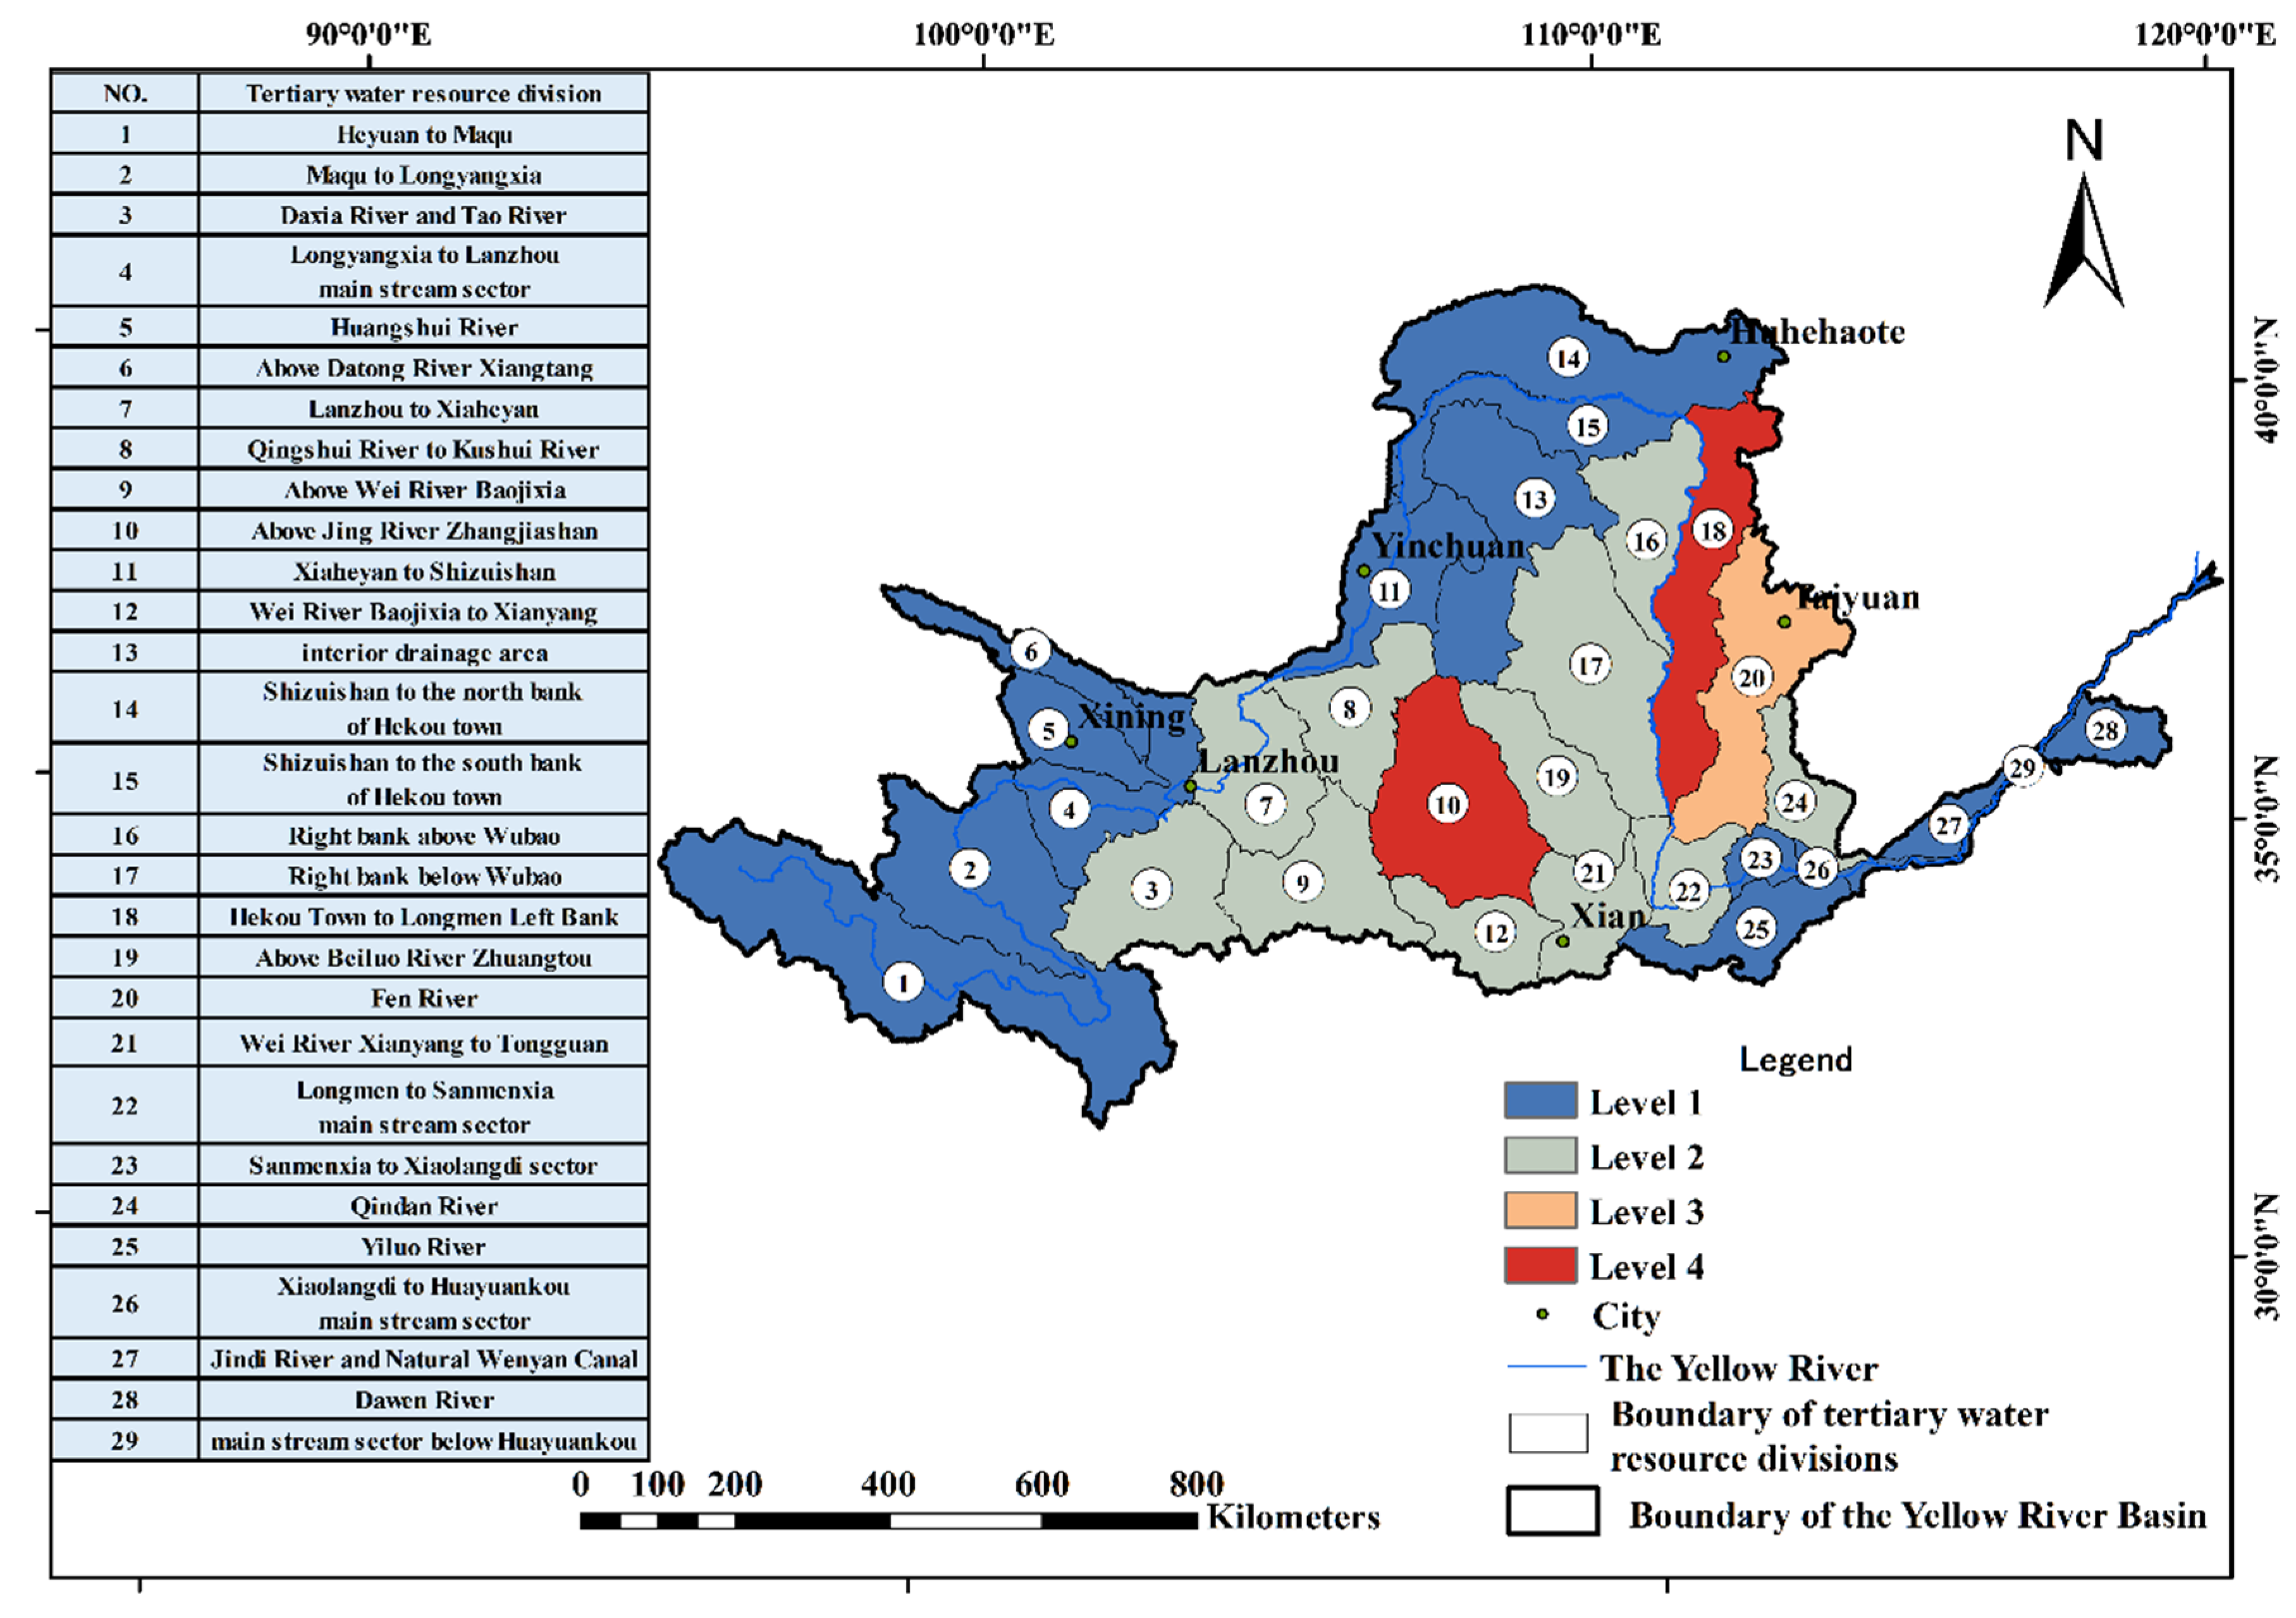
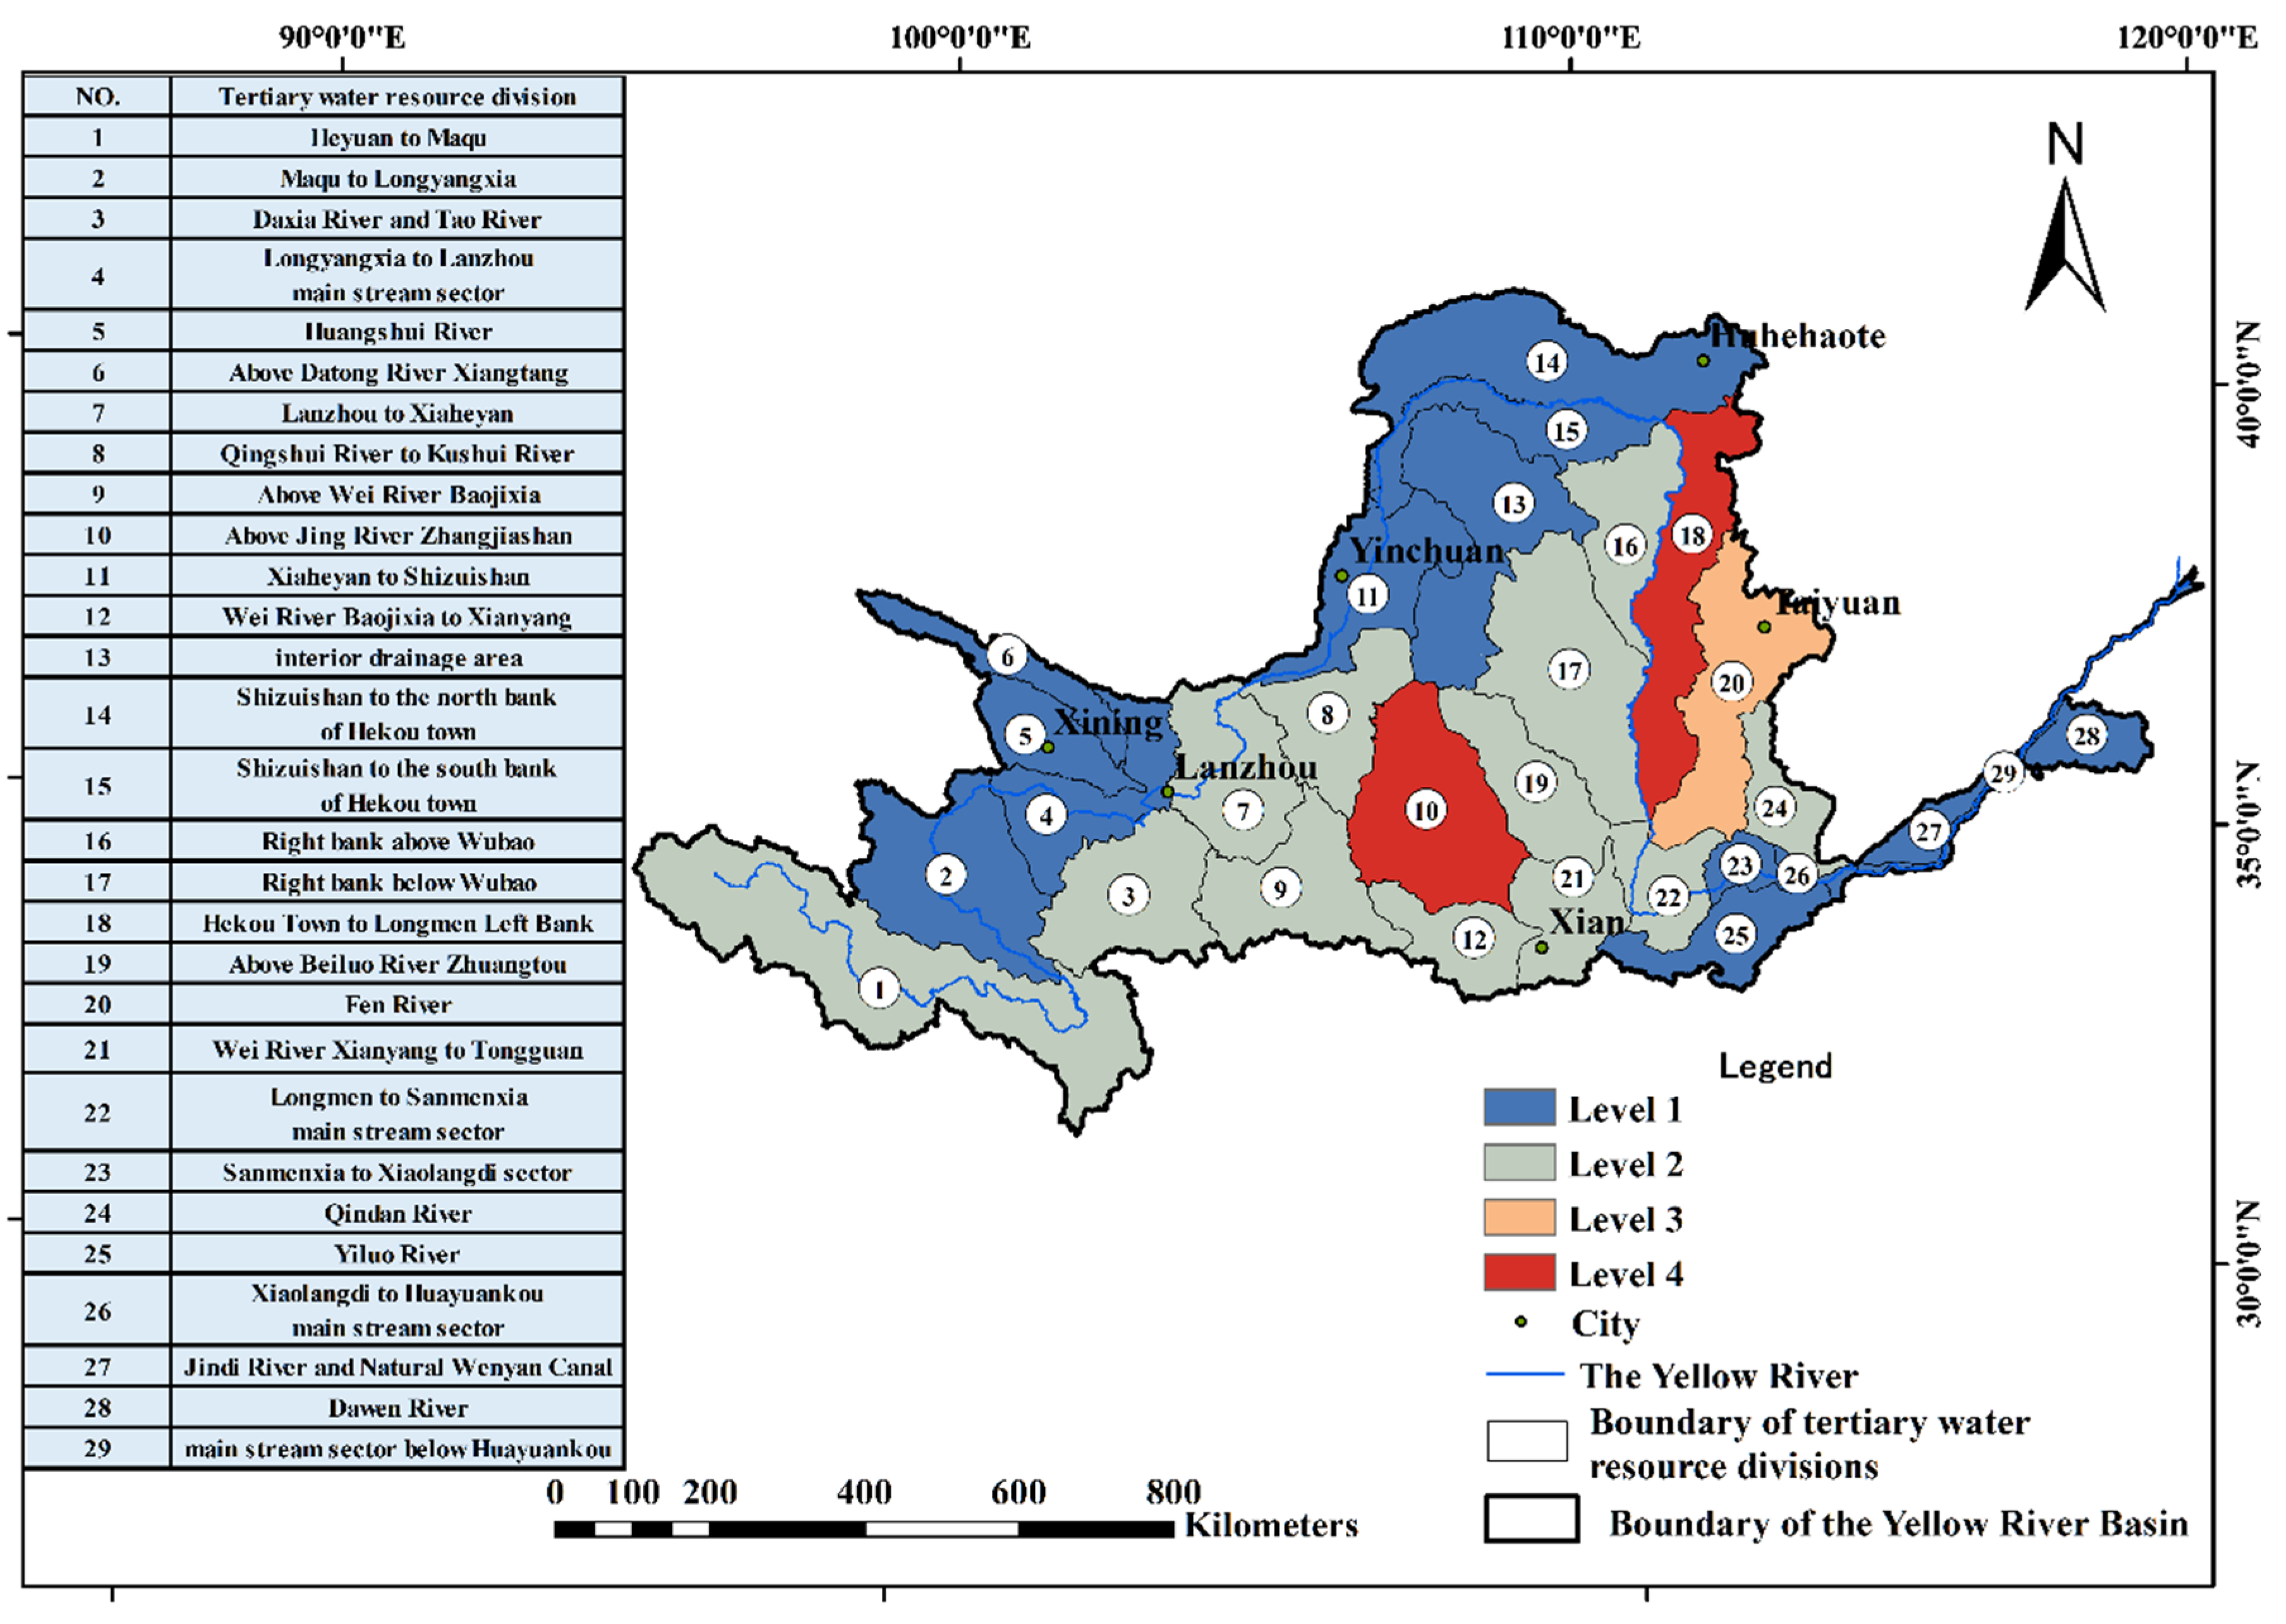
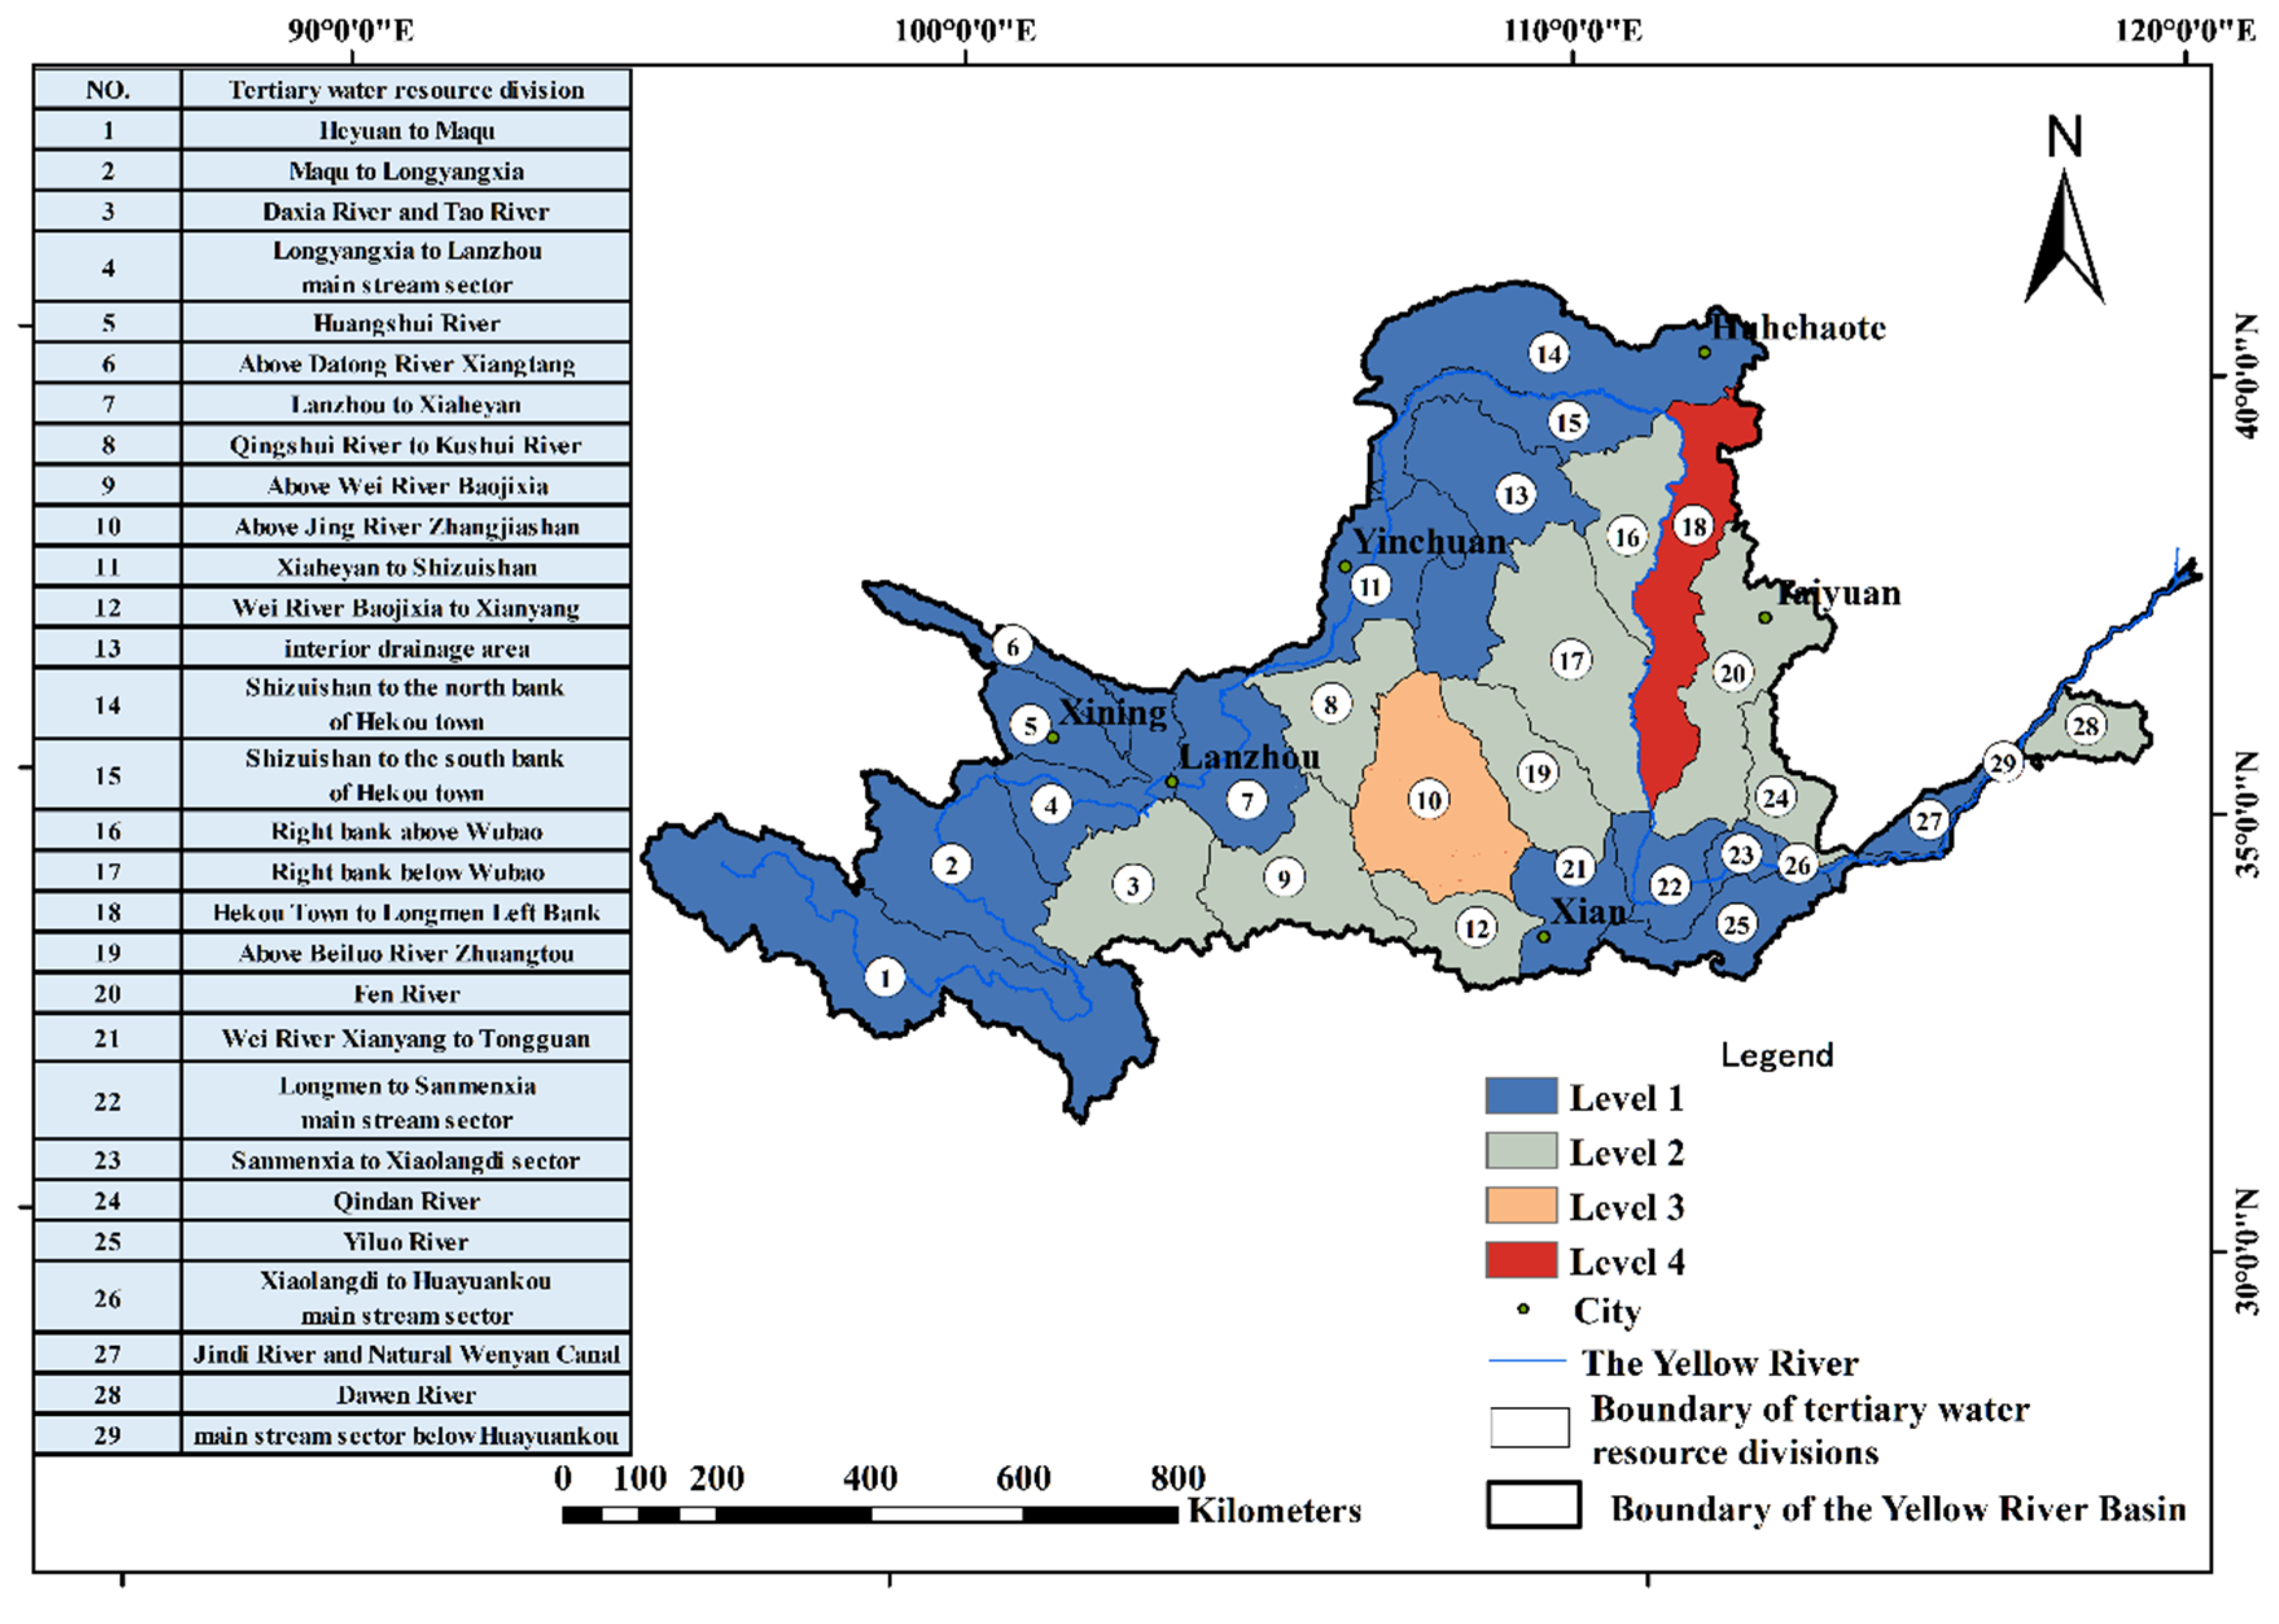
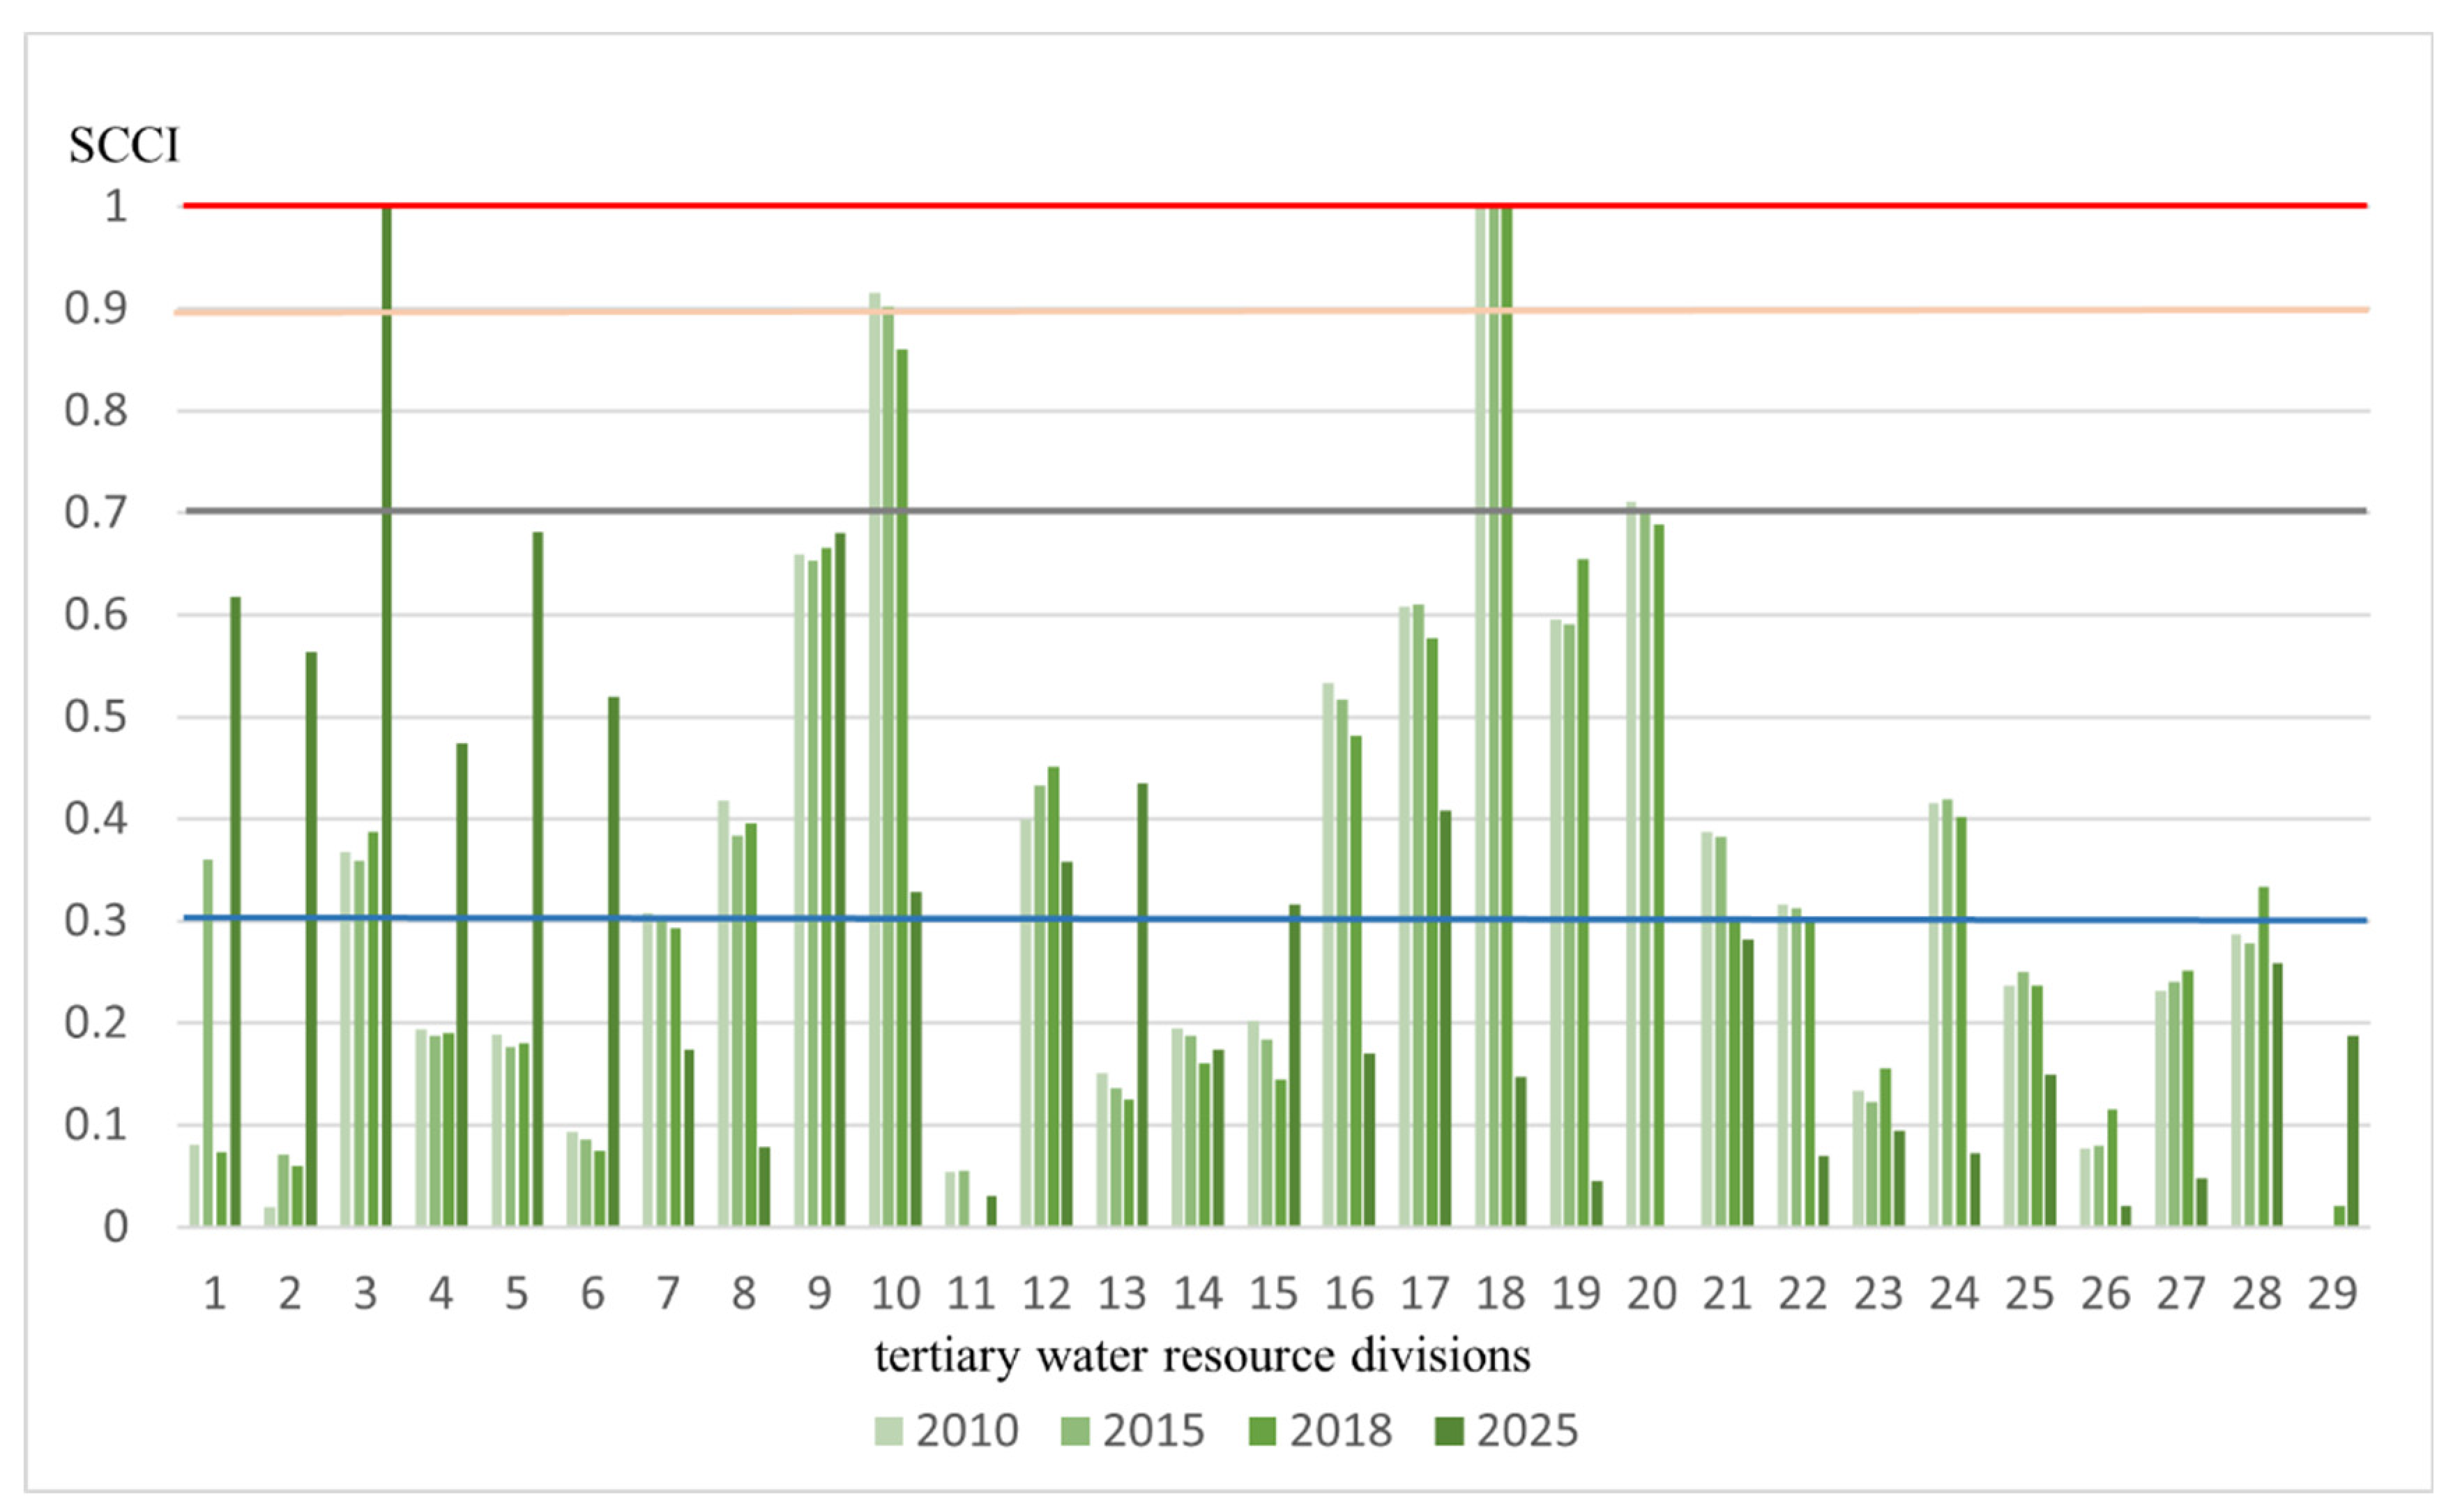
3.3. Spatial Conflict of PLES

The space conflict composite index values (SCCI) of the 29 tertiary water resource divisions in the Yellow River Basin were calculated in 2010, 2015, 2018, and 2025 (Table 6), respectively, based on the SCCI calculation method. According to the statistical distribution characteristics of the SCCI, the SCCI values were standardized and then classified into four levels: stably controllable, basically controllable, basically out of control, and seriously out of control. The specific division intervals are as follows: level 1: “stably controllable” [0.00, 0.30); level 2: “basically controllable” [0.30, 0.70); level 3: “basically out of control” [0.70, 0.90); and level 4: “seriously out of control” [0.90, 1.00].
In 2010, the Loess Plateau area of the middle reaches of the Yellow River showed a severe spatial conflict of PLES in the Yellow River Basin (Figure 6). In this area, the conflict levels in the region of Hekou Town to the left bank of Longmen and the region above Jing River Zhangjiashan were level 4, indicating that the region was seriously out of control; the spatial conflict of PLES level in the Fen River Basin area was level 3, which was within basically out-of-control status; most other areas in the Loess Plateau were considered level 2, meaning that the spatial conflict of PLES was basically controllable. In comparison, the spatial conflicts of PLES in most of the other basin regions such as the lower reaches of the Yellow River, the Ningxia plain, the Inner Mongolia irrigation area, the inland flow area, the Hehuang area, and the source region of the Yellow River were relatively mild and in a stably controllable state of level 1.
The spatial distribution of spatial conflict of PLES in the Yellow River Basin in 2015 (Figure 7) was basically the same as that in 2010, and the out-of-control regions, the ones measured as level 3 and level 4, which were located in the middle reaches of the Yellow River Loess Plateau area, still had not been improved, while the spatial conflict of PLES in the region from Heyuan to Maqu area had deteriorated from the stably controllable level 1 to the basically controllable level 2.
In 2018, the spatial conflict of the PLES situation in the Yellow River Basin (Figure 8) improved—only the region from Hekou Town to the left bank of Longmen remained at level 4, indicating a seriously out-of-control status. The region above Jing River Zhangjiashan changed from level 4 to level 3 status, the region Fen River improved from level 3 to level 2 status, and the region from Heyuan to Maqu was at that point at level 1 instead of level 2. Only spatial conflict of PLES of the region Dawen River deteriorated from level 1 to level 2, and the other areas were relatively stable.
As is shown in the simulation results of spatial conflict of PLES in the Yellow River Basin in 2025 (Figure 9), the spatial conflict of PLES in the Yellow River Basin will continue to improve, and the situation in the Loess Plateau and most of the lower reaches will be in a level 1 or level 2 controllable state. However, the spatial conflict of PLES in the upper reaches of the Yellow River is deteriorating: the conflict level of the Daxia River and Tahoe River region has risen to the seriously out-of-control state of level 4, and the source region of the Yellow River shows different degrees of deterioration, from level 1 to the basically controllable state of level 2.
As can be seen from Figure 10, from 2010 to 2025, the spatial conflict of PLES in the Yellow River Basin is in the basically controllable level 1. Among the 29 tertiary water resource divisions, except for the regions of Daxia River and Tao River, above Jing River Zhangjiashan, Hekou Town to the left bank of Longmen, and Fen River, the SCCI values are in a stable and controllable state. From the development trend of spatial conflict of PLES in the Yellow River Basin, from 2010 to 2025, 15 of the 29 tertiary water resource divisions in the Yellow River Basin show a significantly decreasing trend of SCCI, with a percentage of more than 51%. There are eight regions where spatial conflict of PLES fluctuates (decreasing and then increasing or increasing and then decreasing), accounting for about 28%. At the same time, there are six regions in the basin where spatial conflict of PLES reveals a gradually strengthening trend, accounting for 21%.

4. Discussion

The analysis of the spatio-temporal changes in PLES in the Yellow River Basin from 2010 to 2025 indicates that the urbanization process in the basin has further intensified—the LPS area has further increased, and metropolitan areas with a certain scale have gradually formed around provincial capital cities with population and economic siphoning effects, such as Jinan, Zhengzhou, Xi’an, Taiyuan, Hohhot, Yinchuan, and Lanzhou. In addition, the development of energy and mining industries in the Yellow River Basin continues to be the pillar industries supporting industrial and economic development, and therefore, their areas basically remain stable. The Yellow River Basin still has a pivotal and important role in securing China’s energy and mineral resources. The area of PES is still unchanged, compared with 2010. PES is distributed more concentrated in the Loess Plateau of the middle reaches and the upper reaches of the Yellow River, which proves that the construction of concentrated contiguous high-standard farmland for modern agricultural development has achieved its initial results. The EPS in the Yellow River Basin is basically stable, but the EPS connectivity and agglomeration degree increased significantly. The unobstructed degree of biological habitat was strongly guaranteed, so an imminent increase in biodiversity of the basin could be expected. Saline and desertified land management in the upper reaches of the Yellow River Basin and parts of the Loess Plateau continues to be effective, as their total areas continued to decrease, resulting in a slight decrease in ES in the basin. At the same time, owing to the positive impact of the implementation of China’s nature reserve policy, the disturbance of ES in the upper Yellow River Basin will be significantly reduced by people’s work and living activities, and the ES area will increase significantly. As a result, large areas with national representative natural ecosystem values will be effectively protected.
Judging from the seriousness of spatial conflict of PLES, the encroachment of LPS on other PLES is the most prominent in the Yellow River Basin. With the urbanization of the basin and the strengthening of energy and mineral resources development, the encroachment of LPS on other types of PLES is increasing, which is mainly reflected in the encroachment of PES, EPS, and ES around the periphery of urban development zones and townships, and the phenomenon of “pie spreading” caused by the excessive and disorderly development of towns. The development of energy and chemical bases encroaches on regional EPS and ES, giving rise to regional pasture degradation, soil erosion, land desertification, and soil pollution. This is seen mostly in the regions from Hekou Town to the left bank of Longmen, Fen River, and Shizuishan to the south bank of Hekou Town. In addition, LPS encroachment on EPS and ES in the upper reaches of the Yellow River Basin mainly manifested as the encroachment of urban development, overgrazing, water conservancy, transportation facilities construction, etc. on the plateau grassland meadow, wetlands, and other natural water space, resulting in degradation of grassland meadow and peat swamp wetland and other ecological impacts, concentrated in the area of Daxia and Tao River and other areas.
As revealed from the area of spatial conflict of PLES, the spatial conflict of PLES in the Yellow River Basin mainly focuses on the conflict between PES and EPS, specifically the conversion of land-use types between grassland and cropland. In space, the PES and EPS change areas are highly spatially coordinated. On the one hand, the Ningmeng irrigation area, the Fenwei basin, and the lower Yellow River plain are the main agricultural production regions in China, responsible for the mission of ensuring national food security. The continuous expansion of arable land has inevitably caused encroachment on EPS, especially in some ecologically fragile areas of the Loess Plateau where water and soil resources do not align with each other. Excessive agricultural cultivation has caused the destruction of surface vegetation, increased soil erosion, and deterioration of ecosystem services. In recent years, owing to the continuous promotion of the national project of returning farmland to forest and high standard farmland construction, the original arable land with unsuitable water resources carrying capacity or mismatched soil and water conditions has been gradually withdrawn. Thus, the level of agricultural modernization has continuously increased, alleviating the problem of PES encroachment on EPS to some extent. On the other hand, in recent years, with the overlapping impacts of industrial transformation, population migration, agricultural price fluctuations, etc., the Loess Plateau and other areas that used to be agriculturally dominated regions have lost a large number of their rural population. The phenomenon of abandonment of arable land is very common, resulting in the loss of a large amount of suitable arable land, which formed the passive encroachment of EPS on PES, especially in the region above Jing River Zhangjiashan.
From the perspective of the research scale, there have been few studies on spatial conflicts of PLES in the Yellow River Basin, which mainly focus on administrative units such as urban agglomerations, provinces, and cities [65,66,67]. However, this study adopted tertiary water resource divisions as the basic research unit to analyze the distribution characteristics of spatial conflicts of PLES, thus enriching the scales of research related to the Yellow River Basin. At the same time, the CA–Markov model was used to simulate the spatial pattern of conflicts, which is highly practical for policymakers to formulate corresponding land-use optimization plans. In terms of research methods, GIS and RS technology are the main means to monitor land-use changes by using raster and vector data [68,69]. In this study, land-use change in the Yellow River Basin was analyzed using classified raster data. Compared with other studies [70,71,72], this method, based on landscape ecology, obtained good credibility, since it focused on revealing the spatio-temporal evolution of PLES conflicts from the perspective of spatial morphological changes by using relatively few volumes of data.
Water resources are the core resource elements for socio-economic development and ecological protection since the ecosystem service functions such as water connotation, soil conservation, sand fixation, and flood regulation are closely related to water resources. Therefore, this study took the 29 tertiary water resource divisions in the Yellow River Basin as the basic research unit. Moreover, in this research, analyses of PLES patterns and internal mechanisms were carried out, considering the distribution of administrative regions, topography, national economic development, watershed size, and maintaining the unity, combination, and integrity of administrative regions and basin zoning. To analyze the crux of ecological protection and high-quality economic and social development in the Yellow River Basin effectively, the study approach was to examine the coupling relationship between man and land system, based on the internal mechanism of spatial conflict of PLES. Meanwhile, other factors, including the laws of physical geography and socio-economic development, the carrying capacity of resources and environment, the rigid constraint of ecological protection on water resources and high-quality development of the Basin, and the administrative requirements of regional ecological protection and socio-economic construction, were also considered.
Due to climatic challenges, the changes in land use in the Yellow River Basin had more profound impacts on the surface water cycle now. In recent years, the climate in the Loess Plateau area of the middle reaches of the Yellow River Basin has become warmer and drier. Furthermore, a decrease in atmospheric precipitation recharge and an increase in terrestrial evapotranspiration have led to a decrease in available land serving as water resources. Meanwhile, the Chinese government has implemented a large-scale greening action in the Loess Plateau region [73], increasing the conversion from PES to EPS. Large-scale afforestation improves the regional ecological environment, but also changes the underlying surface structure of the region, affects the local water cycle process, and decreases the gradual surface runoff. According to relevant studies [74], due to the impact of climate change and human activities, the carrying capacity of water resources in the Loess Plateau has been on the verge of overload. At the same time, land-use change in the Yellow River Basin will also affect the local climate by changing the carbon cycle.
There is a large amount of unused land (ES) in the upper reaches of the Yellow River. In the future, following the principle of not affecting the ecological environment, these types of unused land can be fully utilized for the development of renewable energy, including wind, solar, and biomass. Firstly, it can reduce the occupation of limited construction and cultivated land resources in socio-economic development, and lower the conflict between ES, PES, and LPS, and secondly, it will reduce the dependence on fossil fuels to promote carbon neutrality, thus mitigating the adverse effects of climate change.
The spatial conflict of PLES resonates with the game process of ecological protection and socio-economic development in the process of territorial space development and utilization. The macroscopic natural geographical background conditions lay the geographical foundation for the construction of the spatial development and protection pattern of the Yellow River Basin, while socio-economic development, urbanization and industrialization processes, exploitation of mineral resources, and other human activities are the key driving force behind the spatial pattern of land space, accelerating the process of change in spatial patterns of the Yellow River Basin. The ecological conditions in Yellow River Basin are fragile, manifested in its serious shortage of water resources, ecologically sensitive areas and fragile areas, and massive pressure on ecological protection under climate change conditions. Meanwhile, in the process of rapid socio-economic development, disordered and uncontrolled urbanization, industrialization, and exploitation activities of mineral resources have caused a disproportionate spatial pattern of PLES and deterioration in the quality of the ecological environment. Therefore, it is of great practical significance to understand the spatio-temporal pattern of PLES in the Yellow River Basin and identify the characteristics of spatial conflict of PLES scientifically. In this way, the PLES layout of the Yellow River Basin, the efficiency of PLES comprehensive utilization, and the PLES service function will be collectively improved, which eventually will assist in achieving the strategic goals of ecological protection and high-quality development in the Yellow River Basin.

5. Conclusions

Ecological protection and high-quality development of the Yellow River Basin is an essential national strategy in China. The spatial pattern of the Yellow River Basin is evolving from a dominant space of production to one with a coordinated pattern of development of production–living–ecological space. In this study, we simulated the pattern of PLES in the Yellow River Basin from 2010 to 2025. Based on the scientific understanding of the spatial pattern of the Yellow River Basin, we adopted the landscape ecology method to identify the spatial conflict of PLES in the Yellow River Basin and quantitatively analyze the severity of spatial conflict of PLES and its spatio-temporal pattern; thus, the following conclusions were obtained:
(1) As revealed by the spatio-temporal pattern of PLES in the Yellow River Basin in the past 15 years (2010–2025), the distribution of PLES in the Yellow River Basin had obvious spatially divergent characteristics. EPS has the highest percentage of area among all PLES types and is concentrated in most areas in the upper and middle reaches of the Yellow River, showing an inverted U-shaped changing trend in 2010–2025, while the total area remains stable in terms of fluctuation. PES is distributed in the Ningmeng Irrigation Area, Fenwei Plain, part of the Loess Plateau, and most of the lower reaches of the Yellow River, presenting a U-shaped trend from 2010 to 2025, with the total area remaining stable in terms of fluctuation. Due to the urbanization and industrialization of the Yellow River Basin, the LPS area increases yearly, mainly seen around the metropolitan areas of provincial capitals and secondary cities in nine provinces in the Yellow River Basin. In contrast, due to the industrial construction and ecological restoration projects, the ES area, which can be found in the upper and middle parts of the Yellow River Basin, indicates a decreasing trend year by year. In terms of PLES type conversion relationship, the conversion between EPS and PES is the most frequent, and the conversion area accounts for the highest percentage.
(2) During 2010–2025, the spatial conflict of PLES in the Yellow River Basin is mainly reflected in the encroachment of LPS on other PLES, seen mostly in the areas from Hekou Town to the left bank of Longmen, Fen River, Shizuishan to the southern bank of Hekou Town, and Daxia and Tao River. In addition, from the spatial conflict of the PLES area, the conflict between PES and EPS accounts for the largest area, which is concentrated in certain regions of the Loess Plateau and the region above Jing River Zhangjiashan. In terms of the degree of spatial conflict of PLES, from 2010 to 2025, the average SCCI of the Yellow River Basin lies within 0.7, meaning a basically controllable degree. From the development trend of spatial conflict of PLES, 15 of the 29 study regions have major decreasing trends of SCCI, 8 regions are in a state of fluctuation, and 6 regions show gradually increasing trends, accounting for 51%, 28%, and 21%, respectively.
(3) From the analysis of the attribution of spatial conflict of PLES, it was revealed that natural ecological conditions are the important foundation of PLES patterns, while human activities are the driving force guiding the evolution of PLES patterns, which accelerates the process of change in spatial patterns. In recent years, the implementation of major ecological protection actions in the Yellow River Basin, especially the large-scale project of returning farmland to forest and grass, the construction of nature reserve systems, and major ecological restoration projects, have played important roles in alleviating the spatial conflict of PLES. Thus, the area and severity of spatial conflict of PLES have been decreasing year by year. However, overexploitation of resources (including agricultural irrigation areas and energy bases) and disorderly construction due to urbanization remain the main causes of spatial conflict of PLES in the basin. Thus, a scientific, efficient, and reasonable pattern of land space development and utilization is key to optimizing PLES in the Yellow River Basin.
(4) This research applied the CA–Markov model and landscape ecology method to evaluate and analyze the evolution of spatial conflict of PLES and accurately identified the spatio-temporal pattern of spatial conflict of PLES in the Yellow River Basin. The study provides important theoretical references and decision-making principles for later analysis of PLES formation mechanisms and internal evolution mechanisms; research on the driving mechanism, formulation of measures and countermeasures to optimize the spatial development and protection pattern of the land; targeting natural resource management, spatial planning and use control of the land; and promoting ecological and environmental protection and high-quality economic and social development in the basin.
(5) This research emphasizes the relationship revealed in the human–land coupled system in the basin, which affects the layout of PLES. Based on the important role of water resources carrying capacity for ecological protection and high-quality socio-economic development, a new perspective for basin PLES research was proposed, taking into account tertiary water resource divisions as the basic study unit. It is also worth noting that the SCCI of the basic study unit is a standardized relative value, so the different study scales will have a direct impact on the study results. At the same time, the differences in PLES classification and the use of different simulation model parameters can lead to some bias in the study results. This research analyzed the spatio-temporal pattern of PLES conflicts in the Yellow River Basin only from the perspective of spatial morphology. Spatial suitability was not considered; thus, it is impossible to dissect the main influencing factors of the conflicts. In addition, due to the limitation of space, in this paper, we did not discuss the optimal adjustment strategy to deal with the spatial conflict in PLES. These research directions and contents remain to be discussed in depth by subsequent scholars.

Author Contributions

F.X. and J.S. contributed to all aspects of this work. R.W., J.Z. and Y.Y. conducted data analysis and cartographic expression. F.X. and J.S. wrote the main manuscript text. N.W. and Z.W. gave some useful suggestions for this work. All authors have read and agreed to the published version of the manuscript.

Funding

This work was supported by the National Natural Science Foundation of China (Grant No. 41907402).

Institutional Review Board Statement

Not applicable.

Informed Consent Statement

Not applicable.

Data Availability Statement

The data presented in this study are available on request from the author.

Conflicts of Interest

The authors declare no conflict of interest.

References

  1. Campbell, D.J.; Gichohi, H.; Mwangi, A.; Chege, L. Land use conflict in Kajiado District, Kenya. Land Use Policy 2020, 17, 337–348. [Google Scholar] [CrossRef]
  2. Aero, E.; Anderson, G.; Augustinus, C.; Aero, E.; Anderson, G.; Augustinus, C. Land and Conflict: Lessons from the Field on Conflict Sensitive Land Governance and Peacebuilding; United Nations Human Settlements Programme (UN-Habitat): Nairobi, Kenya, 2018. [Google Scholar] [CrossRef]
  3. Berry, D.; Plaut, T. Retaining agricultural activities under urban pressures: A review of land use conflicts and policies. Policy Sci. 1978, 9, 153–178. [Google Scholar] [CrossRef]
  4. Zou, L.; Liu, Y.; Wang, J.; Yang, Y.; Wang, Y. Land use conflict identification and sustainable development scenario simulation on China’s southeast coast. J. Clean. Prod. 2019, 238, 117899. [Google Scholar] [CrossRef]
  5. Ishiyama, N. Environmental justice and American Indian tribal sovereignty: Case study of a land–use conflict in Skull Valley, Utah. Antipode 2003, 35, 119–139. [Google Scholar] [CrossRef]
  6. Coyle, D.J. This land is your land, this land is my land: Cultural conflict in environmental and land-use regulation. In Politics, Policy, and Culture; Routledge: Milton Park, UK, 2019; pp. 33–50. [Google Scholar] [CrossRef]
  7. Ayhan, Ç.K.; Taşlı, T.C.; Özkök, F.; Tatl, H. Land use suitability analysis of rural tourism activities: Yenice, Turkey. Tour. Manag. 2020, 76, 103949. [Google Scholar] [CrossRef]
  8. Willemen, L.; Hein, L.; van Mensvoort, M.E.; Verburg, P.H. Space for people, plants, and livestock? Quantifying interactions among multiple landscape functions in a Dutch rural region. Ecol. Indic. 2010, 10, 62–73. [Google Scholar] [CrossRef]
  9. Guo, B.; Wang, X.; Pei, L.; Su, Y.; Zhang, D.; Wang, Y. Identifying the spatiotemporal dynamic of PM2.5 concentrations at multiple scales using geographically and temporally weighted regression model across China during 2015–2018. Sci. Total Environ. 2021, 751, 141765. [Google Scholar] [CrossRef]
  10. Andrew, J.S. Potential application of mediation to land use conflicts in small-scale mining. J. Clean. Prod. 2003, 11, 117–130. [Google Scholar] [CrossRef]
  11. Wehrmann, B. Land Conflicts: A Practical Guide to Dealing with Land Disputes; Deutsche Gesellschaft für Technische Zusammenarbeit: Eschborn, Germany, 2008; pp. 12–13. [Google Scholar] [CrossRef]
  12. Pavón, D.; Ventura, M.; Ribas, A. Land use change and socio-environmental conflict in the Alt Empordà county (Catalonia, Spain). J. Arid Environ. 2003, 54, 543–552. [Google Scholar] [CrossRef] [Green Version]
  13. De Groot, R. Function-analysis and valuation as a tool to assess land use conflicts in planning for sustainable, multi-functional landscapes. Landsc. Urban Plan. 2006, 75, 175–186. [Google Scholar] [CrossRef]
  14. Ioja, C.I.; Nita, M.R.; Vanau, G.O.; Onose, D.A.; Gavrilidis, A.A. Using multicriteria analysis for the identification of spatial land-use conflicts in the Bucharest Metropolitan Area. Ecol. Ind. 2014, 42, 112–121. [Google Scholar] [CrossRef]
  15. Kim, I.; Arnhold, S. Mapping environmental land use conflict potentials and ecosystem services in agricultural watersheds. Sci. Total Environ. 2018, 630, 827–838. [Google Scholar] [CrossRef] [PubMed]
  16. Adam, Y.O.; Pretzsch, J.; Darr, D. Land use conflicts in central Sudan: Perception and local coping mechanisms. Land Use Policy 2015, 42, 1–6. [Google Scholar] [CrossRef]
  17. Delgado-Matas, C.; Mola-Yudego, B.; Gritten, D.; Kiala-Kalusinga, D.; Pukkala, T. Land use evolution and management under recurrent conflict conditions: Umbundu agroforestry system in the Angolan Highlands. Land Use Policy 2015, 42, 460–470. [Google Scholar] [CrossRef]
  18. Petrescu-Mag, R.M.; Petrescu, D.C.; Azadi, H.; Ioan, V. Agricultural land use conflict management—vulnerabilities, law restrictions and negotiation frames. A wake-up call. Land Use Policy 2018, 76, 600–610. [Google Scholar] [CrossRef]
  19. Wu, Z.Y. Space optimization of “Production-Living-Ecological lives” and ecological environment protection of Beijing, Tianjin and Hebei. City 2014, 12, 26–29. [Google Scholar] [CrossRef]
  20. Lin, G.; Jiang, D.; Fu, J.Y. Discussion on scientific foundation and approach for the overall optimization of “Production-Living-Ecological” space. J. Nat. Resour. 2021, 36, 1085–1101. [Google Scholar]
  21. He, Y.H.; Tang, C.L.; Zhou, G.H.; He, S.; Qiu, Y.H.; Shi, L.; Zhang, H.Z. The Analysis of Spatial Conflict Measurement in Fast Urbanization Region from the Perspective of Geography—A Case Study of Changsha-Zhuzhou-Xiangtan Urban Agglomeration. J. Nat. Resour. 2014, 29, 1660–1674. [Google Scholar] [CrossRef]
  22. Carpenter, S.L.; Kennedy, W.J.D. Environmental conflict management: New ways to solve problems. Mt. Res. Dev. 1981, 1, 65–70. [Google Scholar] [CrossRef]
  23. Cabrera-Barona, P.; Murphy, T.; Kienberger, S.; Blaschke, T. A multi-criteria spatial deprivation index to support health inequality analyses. Int. J. Health Geogr. 2015, 14, 11. [Google Scholar] [CrossRef] [Green Version]
  24. Ouyang, W.; Wang, B.; Tian, L.; Niu, X. Spatial deprivation of urban public services in migrant enclaves under the context of a rapidly urbanizing China: An evaluation based on suburban Shanghai. Cities 2017, 60, 436–445. [Google Scholar] [CrossRef]
  25. Fang, C.L.; Liu, H.Y. The Spatial Privation and the Corresponding Controlling Paths in China’s Urbanization Process. Acta Geogr. Sin. 2007, 62, 849–860. [Google Scholar] [CrossRef]
  26. Debolini, M.; Valette, E.; Francois, M.; Chery, J.P. Mapping land use competition in the rural-urban fringe and future perspectives on land policies: A case study of Meknès (Morocco). Land Use Policy 2015, 47, 373–381. [Google Scholar] [CrossRef]
  27. Moein, M.; Asgarian, A.; Sakieh, Y.; Soffianian, A. Scenario-based analysis of land-use competition in central Iran: Finding the trade-off between urban growth patterns and agricultural productivity. Sustain. Cities Soc. 2018, 39, 557–567. [Google Scholar] [CrossRef]
  28. Xu, C.X.; Wang, F.Y.; Wang, K.Y.; Li, P. Exploring destination spatial competition rules: A case study of Hunan province. Geogr. Res. 2017, 36, 321–335. [Google Scholar] [CrossRef]
  29. Zhang, L.; Wan, R.R.; Hu, H.B.; Dong, Y.W. Environmental function and spatial integration of ecological land—A case study of Nanjing. Resour. Environ. Yangtze Basin 2011, 20, 1222–1227. [Google Scholar]
  30. Wagner, P.D.; Bhallamudi, S.M.; Narasimhan, B.; Kantakumar, L.N.; Sudheer, K.P.; Kumar, S.; Schneider, K.; Fiener, P. Dynamic integration of land use changes in a hydrologic assessment of a rapidly developing Indian catchment. Sci. Total Environ. 2016, 539, 153–164. [Google Scholar] [CrossRef]
  31. Tu, S.S.; Long, H.L.; Zhang, Y.N.; Ge, D.Z.; Qu, Y. Rural restructuring at village level under rapid urbanization in metropolitan suburbs of China and its implications for innovations in land use policy. Habitat Int. 2018, 77, 143–152. [Google Scholar] [CrossRef]
  32. Richardson, H.W. Optimality in city size, systems of cities and urban policy: A skeptic’s view. Urban Stud. 1972, 1, 29–48. [Google Scholar] [CrossRef]
  33. Mubarak, F.A. Urban growth boundary policy and residential suburbanization: Riyadh, Saudi Arabia. Habitat Int. 2004, 28, 567–591. [Google Scholar] [CrossRef]
  34. Zhang, J.X. Urban and region governance research and application in China. Urban Probl. 2000, 6, 40–44. [Google Scholar]
  35. Gu, C.L.; Shen, J.F.; Yao, X. Urban Governance: Concept, Theory, Method and Empirical Research; Southeast University Press: Nanjing, China, 2003. [Google Scholar]
  36. Peng, J.J.; Zhou, G.H.; Tang, C.L.; He, Y.H. The Analysis of Spatial Conflict Measurement in Fast Urbanization Region Based on Ecological Security—A Case Study of Changsha-Zhuzhou-Xiangtan Urban Agglomeration. J. Nat. Resour. 2012, 27, 1507–1519. [Google Scholar] [CrossRef]
  37. Fan, J. Social demands and new propositions of economic geography discipline development based on the eleventh national five-year plan. Econ. Geogr. 2006, 26, 545–550. [Google Scholar] [CrossRef]
  38. Ruan, S.T.; Wu, K.N. Research of the Land Use Conflict and Mitigation Mechanism during the Urbanization in China. China Popul. Resour. Environ. 2013, 23, 388–392. [Google Scholar]
  39. Jaiswal, D.; De Souza, A.P.; Larsen, S. Brazilian sugarcane ethanol as an expandable green alternative to crude oil use. Nat. Clim. Chang. 2017, 7, 788–792. [Google Scholar] [CrossRef]
  40. Xie, Y.; Chen, Y.; Han, F.; Fang, J.Y. Research on Influence and Time-space Effect of New-type Urbanization on Urban Eco-environmental Quality. Manag. Rev. 2018, 30, 230–241. [Google Scholar]
  41. Qi, X.; Wang, Y.L. An Empirical Study of the Spatial Spillover Effects of the Development of Urbanization Economy from the Perspective of Cities, Markets and Urbanization. J. Financ. Econ. 2013, 39, 84–92. [Google Scholar]
  42. Zhou, K.; Wang, Q.; Fan, J. Impact of economic agglomeration on regional water pollutant emissions and its spillover effects. J. Nat. Resour. 2019, 34, 1483–1495. [Google Scholar] [CrossRef]
  43. Wang, Z.B.; Liang, L.W.; Fang, C.L.; Zhuang, R.L. Study of the evolution and factors influencing ecological security of the Beijing-Tianjin-Hebei Urban Agglomeration. Acta Ecol. Sin. 2018, 38, 4132–4144. [Google Scholar] [CrossRef]
  44. Liao, L.H.; Dai, W.Y.; Chen, J.; Huang, W.L.; Jiang, F.Q.; Hu, Q.F. Spatial conflict between ecological-production-living spac-es on Pingtan Island during rapid urbanization. Resour. Sci. 2017, 39, 1823–1833. [Google Scholar] [CrossRef] [Green Version]
  45. Song, Z.J.; Li, Z.; Yang, J. Study on the calculation of land use conflict intensity in mineral grain complex area—Taking the polluted areas of Dexing Copper Mine and Yongping Copper Mine in Jiangxi Province as an example. Chin. J. Agric. Resour. Reg. Plan. 2018, 39, 78–85. [Google Scholar] [CrossRef]
  46. Ma, X.G.; Wang, A.M.; Yan, X.P. A Study on land use conflict in the process of urban spatial reconstruction—Taking Guangzhou city as an example. Hum. Geogr. 2010, 25, 72–77. [Google Scholar]
  47. Kalabamu, F.T. Land tenure reforms and persistence of land conflicts in Sub-Saharan Africa-the case of Botswana. Land Use Policy 2019, 81, 337–345. [Google Scholar] [CrossRef]
  48. Yang, Y.F.; Zhu, L.Q. The Theory and Diagnostic Methods of Land Use Conflicts. Resour. Sci. 2012, 34, 1134–1141. [Google Scholar]
  49. Qin, K. The Analysis of Land Use Spatial Conflicts Based on Ecological Security—A Case Study of the Urban Agglomeration Around. Master’s Thesis, Wuhan University, Wuhan, China, 2017. [Google Scholar]
  50. Yao, J.; Chen, J.L.; Yao, S.M. Research on Coordination of Spatial Plans Based on New Regionalism: A Case Study of the Coastal Region in Jiangsu Province. China Soft Sci. 2011, 7, 102–110. [Google Scholar] [CrossRef]
  51. Wang, H.Y.; Qin, F.; Zhang, X.C. The Scenario Analysis on Urban Ecological Land Spatial Conflict and Ecological Security Hidden Danger in Guangzhou. J. Nat. Resour. 2015, 30, 1304–1318. [Google Scholar] [CrossRef]
  52. Min, J.; Wang, Y.; Bai, R.Y.; Zhang, J.; Kong, X.Y. The Research on Identification of Land Use Potential Conflict Based on Multiobjective Suitability Evaluation on Mountainous City: A Case Study of Qijiang District of Chongqing Municipality. J. Chongqing Norm. Univ. 2018, 35, 82–89. [Google Scholar] [CrossRef]
  53. Liu, Q.Q.; Zhao, H.F.; Wu, K.N.; Yu, X.; Zhang, Q.J. Identifying Potential Land use Conflict Based on Competitiveness of Different Land Use Types in Beijing, China. Resour. Sci. 2014, 36, 1579–1589. [Google Scholar]
  54. Wang, A.M.; Ma, X.G.; Yan, X.P. Land Use Conflicts and Their Governance Mechanics on Actors Network Theory: A Case of Fruit Tree Protection Zone of Haizhu District, Guangzhou City. Sci. Geogr. Sin. 2010, 30, 80–85. [Google Scholar]
  55. Feng, Y.; Bi, R.T.; Wang, J.; Lv, C.J.; Zhang, Q.Q. Spatial Conflict of Land Use Caused by Mining Exploitation and Optimal Allocation Scheme of Land Resources in River Basin. China Land Sci. 2016, 30, 32–40. [Google Scholar] [CrossRef]
  56. Huang, J.C.; Lin, H.X.; Qi, X.X. A literature review on optimization of spatial development pattern based on Ecological-Production-Living space. Prog. Geogr. 2017, 36, 378–391. [Google Scholar] [CrossRef] [Green Version]
  57. Zhao, X.; Tang, F.; Zhang, P.T.; Hu, B.Y.; Xu, L. Dynamic simulation and characteristic analysis of county production-living-ecological spatial conflicts based on CLUE-S model. Acta Ecol. Sin. 2019, 39, 5897–5908. [Google Scholar]
  58. Cohen-Shacham, E.; Walters, G.; Janzen, C. Nature-based solutions to address global societal challenges. IUCN Gland Switz. 2016, 97, 2016–2036. [Google Scholar] [CrossRef] [Green Version]
  59. Liu, J.L.; Liu, Y.S.; Li, Y.R. Classification evaluation and spatial-temporal analysis of “production-living-ecological” spaces in China. Acta Geogr. Sin. 2017, 72, 1290–1304. [Google Scholar] [CrossRef]
  60. Zhang, H.; Xu, E.; Zhu, H. Ecological-living-productive land classification system in China. J. Resour. Ecol. 2017, 8, 121–128. [Google Scholar] [CrossRef]
  61. Liao, G.; He, P.; Gao, X.; Deng, L.; Zhang, H.; Feng, N.; Deng, O. The Production–Living–Ecological Land Classification System and Its Characteristics in the Hilly Area of Sichuan Province, Southwest China Based on Identification of the Main Functions. Sustainability 2019, 11, 1600. [Google Scholar] [CrossRef] [Green Version]
  62. Zhou, G.H.; Peng, J.J. The Evolution Characteristics and Influence Effect of Spatial Conflict. A Case Study of Changsha-Zhuzhou-Miangtan Urban Agglomeration. Prog. Geogr. 2012, 31, 717–723. [Google Scholar]
  63. Zhou, D.; Xu, J.C.; Wang, L. Process of Land Use Conflict Research in China during the Past Fifteen Years. China Land Sci. 2015, 29, 21–29. [Google Scholar] [CrossRef]
  64. Sang, L.; Zhang, C.; Yang, J.; Zhu, D.; Yu, W. Simulation of land use spatial pattern of towns and villages based on CA–Markov model. Math. Comput. Model. 2011, 54, 938–943. [Google Scholar] [CrossRef]
  65. Lu, C.P.; Ji, W.; Liu, Z.L.; Mao, J.H.; Li, J.Z.; Li, J.Z.; Xue, B. The spatial and temporal pattern of functional space in Gansu section of the Yellow River Basin. Sci. Geogr. Sin. 2022, 44, 1–10. [Google Scholar]
  66. Wang, X.F.; Zhang, X.; Wang, Y.; Yan, Y. The spatial evolution and driving force analysis of the Loess Plateau. J. Anhui Agric. Univ. 2022, 49, 112–121. [Google Scholar] [CrossRef]
  67. Li, J.S.; Sun, W.; Yu, J.H. The Evolution and regional difference of Sansheng Space in the Yellow River Basin- based on the comparison of resource-based and non-resource-based cities. Resour. Sci. 2020, 42, 2285–2299. [Google Scholar]
  68. Wang, T.; Kazak, J.; Han, Q. A framework for path-dependent industrial land transition analysis using vector data. Eur. Plan. Stud. 2019, 27, 1391–1412. [Google Scholar] [CrossRef]
  69. Kumar, P.; Dobriyal, M.; Kale, A. Temporal dynamics change of land use/land cover in Jhansi district of Uttar Pradesh over past 20 years using Landsat TM, ETM+ and OLI sensors. Remote Sens. Appl. Soc. Environ. 2021, 23, 100579. [Google Scholar] [CrossRef]
  70. Wei, W.; Yin, L.; Xie, B.; Bo, L.M. The evolution characteristics and mechanism of “three zones” in the Yellow River Basin under the background of territorial spatial planning. Econ. Geogr. 2022, 42, 44–55+86. [Google Scholar] [CrossRef]
  71. Chang, T.Y.; Zhang, Z.W.; Qiao, X.N.; Zhang, Y.F. Land use transformation and its ecological environment effect from 2000 to 2020 in the Yellow River Basin. Bull. Soil Water Conserv. 2021, 41, 268–275. [Google Scholar] [CrossRef]
  72. Zhang, Y.Z.; Chen, Y.; Wang, J.; Ye, J.P.; Zhang, B.B. Functional coordination measure of “three students” in the Yellow River Basin. J. Agric. Eng. 2021, 37, 251–261+321. [Google Scholar]
  73. Chen, H.; Fleskens, L.; Baartman, J.; Wang, F.; Moolenaar, S.; Ritsema, C. Impacts of land use change and climatic effects on streamflow in the chinese loess plateau: A meta-analysis. Sci. Total Environ. 2020, 703, 134989. [Google Scholar] [CrossRef]
  74. Feng, X.; Fu, B.; Piao, S. Revegetation in China’s Loess Plateau is approaching sustainable water resource limits. Nat. Clim. Chang. 2016, 6, 1019–1022. [Google Scholar] [CrossRef]
Figure 1. Location of the Yellow River Basin.
Land 11 00744 g001
Figure 2. Spatial pattern of PLES in the Yellow River Basin in 2010.
Land 11 00744 g002
Figure 3. Spatial pattern of PLES in the Yellow River Basin in 2015.
Land 11 00744 g003
Figure 4. Spatial pattern of PLES in the Yellow River Basin in 2018.
Land 11 00744 g004
Figure 5. Predicted spatial pattern of PLES in the Yellow River Basin in 2025.
Land 11 00744 g005
Figure 6. Spatial conflict of PLES in the Yellow River Basin in 2010.
Land 11 00744 g006
Figure 7. Spatial conflict of PLES in the Yellow River Basin in 2015.
Land 11 00744 g007
Figure 8. Spatial conflict of PLES in the Yellow River Basin in 2018.
Land 11 00744 g008
Figure 9. Predicted spatial conflict of PLES in the Yellow River Basin in 2025.
Land 11 00744 g009
Figure 10. PLES spatial conflict changes in 29 tertiary water resource divisions from 2010 to 2025.
Land 11 00744 g010
Table 1. PLES classification.
Ecological–Living–Production Space (PLES) ClassificationLand-Use Types
Living–production space (LPS)Urban and rural land, Industrial and mining land, Residential land (urban land, rural residential land, other types of construction land)
Production–ecological space (PES)Cultivated land (paddy field, dry land)
Ecological–production space (EPS)Forest land, grassland
Ecological space (ES)Unused land (sand land, Gobi desert land, saline–alkali land, marshland, bare land, bare rock land, oceans, other types of unused land), water area
Table 2. Area statistics of PLES from 2010 to 2025 (area in 104 km2, rate in %).
Ecological–Living–Production Space (PLES)
Classification
2010201520182025
AreaRateAreaRateAreaRateAreaRate
Living–production space (LPS)2.513.162.713.413.083.884.285.38
Production–ecological space (PES)28.7436.1228.6536.0428.2135.4828.3235.62
Ecological–production space (EPS)40.6651.1440.5851.0440.8251.3440.4250.84
Ecological space (ES)7.599.587.569.517.399.306.488.16
Table 3. PLES transfer matrix for 2010–2015 (km2).
20102015
LPSPESEPSES
LPS 248.39157.5811.15
PES1434.18 2489.50353.05
EPS786.052910.06 785.21
ES215.79377.99917.07
Note: PES: production–ecological space; LPS: living–production space; ES: ecological space; EPS: ecological–production space.
Table 4. PLES transfer matrix for 2015–2018 (km2).
20152018
LPSPESEPSES
LPS 2591.671017.29212.07
PES4687.27 23,211.141817.53
EPS2188.1020,547.12 2315.37
ES664.272060.413274.22
Table 5. PLES transfer matrix for 2018–2025 (km2).
20182025
LPSPESEPSES
LPS 9552.252421.51272.25
PES14,136.75 62,574.326333.31
EPS7886.5267,904.43 12,073.51
ES2084.757363.7513,137.52
Table 6. SCCI of the tertiary water resource division from 2010 to 2025.
NO.Tertiary Water Resource DivisionSCCI
(2010)
SCCI
(2015)
SCCI (2018)SCCI (2025)
1Heyuan to Maqu0.080.360.070.62
2Maqu to Longyangxia0.020.070.060.56
3Daxia River and Tao River0.370.360.391
4Longyangxia to Lanzhou main stream sector0.190.190.190.47
5Huangshui River0.190.180.180.68
6Above Datong River Xiangtang0.090.090.070.52
7Lanzhou to Xiaheyan0.310.310.290.17
8Qingshui River to Kushui River0.420.380.400.08
9Above Wei River Baojixia0.660.650.670.68
10Above Jing River Zhangjiashan0.920.900.860.33
11Xiaheyan to Shizuishan0.050.0600.03
12Wei River Baojixia to Xianyang0.400.430.450.35
13Interior drainage area0.150.140.130.44
14Shizuishan to the northern bank of Hekou Town0.190.190.160.17
15Shizuishan to the southern bank of Hekou Town0.200.180.140.32
16Right bank above Wubao0.530.520.480.17
17Right bank below Wubao0.610.610.580.41
18Hekou Town to left bank of Longmen1110.15
19Above Beiluo River Zhuangtou0.600.590.660.05
20Fen River0.710.700.690
21Wei River Xianyang to Tongguan0.390.380.300.28
22Longmen to Sanmenxia main stream sector0.320.310.300.07
23Sanmenxia to Xiaolangdi sector0.130.120.160.09
24Qindan River0.420.420.400.07
25Yiluo River0.240.250.240.15
26Xiaolangdi to Huayuankou main stream sector0.080.080.120.02
27Jindi River and Natural Wenyan Canal0.230.240.250.05
28Dawen River0.290.280.330.26
29Main stream sector below Huayuankou000.020.19
Publisher’s Note: MDPI stays neutral with regard to jurisdictional claims in published maps and institutional affiliations.

