Article

Ecological Security and Ecosystem Quality: A Case Study of Xia-Zhang-Quan Metropolitan Area in China

1
School of Politics and Public Administration, Huaqiao University, Quanzhou 362021, China
2
Political Development and Public Governance Research Center, Huaqiao University, Quanzhou 362021, China
3
School of Public Administration and Policy, Renmin University of China, Beijing 100872, China
4
Department of Public Administration, Law School, Ningbo University, Ningbo 315211, China
*
Author to whom correspondence should be addressed.
Land 2022, 11(5), 707; https://doi.org/10.3390/land11050707
Submission received: 2 April 2022 / Revised: 5 May 2022 / Accepted: 7 May 2022 / Published: 8 May 2022
(This article belongs to the Special Issue Territory Spatial Planning toward High-Quality Development in China)

Abstract

:
Ecological security patterns are an effective tool by which to balance economic development with ecological protection. This study used the Integrated Valuation of Ecosystem Services and Tradeoffs (InVEST) model in conjunction with circuit theory to evaluate ecosystem quality from four dimensions: background conditions, topography, landscape structure, and ecological resistance. Our objective was to identify ecological “pinch points” in order to create an ecological security pattern that would be sustainable under a range of land use functions. We selected as the research target the Xia-Zhang-Quan metropolitan area in China due to the extensive soil erosion and general degradation of ecosystems caused by its rapid socio-economic development. Our analysis identified 17 ecological source sites covering 11,512 km2, which accounts for 45.36% of the total area. The inter-source corridor includes 31 key corridors and 10 potential corridors covering 3305 km. The average ecosystem quality of this area was estimated at 0.65 at an optimal granularity of 400 m. The distribution of resistance values in the study area was relatively concentrated with the land divided into an ecological buffer zone (34.6%), an environmentally sensitive zone (10.9%), and a blocking zone (9.2%). Our analysis also revealed various corridors based on the regional and functional characteristics of ecological elements and improvement strategies at the pinch points to help restore the function of ecological sources. Protection of these corridors will help to maintain regional ecological security patterns and optimize the structure of ecological spaces with the aim of achieving sustainable development.

1. Introduction

Rapid urbanization has led to widespread ecological decay, including the fragmentation of ecosystem patches and a loss of biodiversity [1]. In 2012, the central government in China introduced measures by which to promote the construction of an ecological civilization. In 2017, the National Congress of the Communist Party of China announced their intention to build nationwide ecological security patterns, aimed at creating ecological corridors and systems to protect biodiversity through the implementation of restoration projects. Their aim was to promote the healthy development of the ecosystem by optimizing ecological security barriers [2].
Many researchers, both at home and abroad, have subsequently examined the construction of ecological security patterns from multiple perspectives including sustainable landscape management and ecological infrastructure planning [3,4]. Ecological security patterns in metropolitan areas can be used to identify environmental risks and guide the allocation of resources aimed at maintaining biodiversity through the restoration of important ecological elements [5,6,7]. The ecological security patterns proposed by Yu [8] focus on landscape features, including ecological sources, buffer zones, inter-source connections, radiating points, and points that are key to ecological processes. An ecological source can be defined as an ecosystem patch with important ecological significance or radiating function as the source point of biological population dispersal and diversity maintenance. Ecological sources form the basis for the construction of regional ecological security patterns and the subsequent identification of corridors and pinch points. In this paper, the eco-systems that play important ecological functions in the region and have good landscape connectivity are identified as ecological source sites. Ecological sources have been identified based on service value, sensitivity, and connectivity [9,10,11]; however, few researchers have considered the issue from the perspective of ecosystem quality.
The Integrated Valuation of Ecosystem Services and Tradeoffs (InVEST) model is an ecosystem service evaluation tool jointly developed by a number of ecological and environmental research institutions and the conservation association in the United States. Its ecosystem quality module jointly measures the adaptability of ecosystem patches and the influence of various threat sources in the matrix. The biodiversity conservation service function is widely used in regional ecosystem quality assessment due to its high accuracy and spatial analysis capability. Miguel et al. used the InVEST model to assess the ecosystems quality in the Portuguese Azores to provide decision support for regional ecological management [12]. Nematollahi et al. quantified the ecosystem services in Chaharmahal and Bakhtiari provinces of Iran through the ecosystem quality to evaluate the impact of the road network on the regional ecological space, and carried out ecological security pattern protection and planning based on the results of the ecological space vulnerability distribution [13]. The setting of the resistance surface is key to the accurate identification of ecological corridors. In constructing resistance surfaces, scholars tend to assign values uniformly to land types [14,15]. Barnett and Belote also identified excellent ecological corridors and pinch areas between large, protected areas in North America to construct a corridor system to maintain the connectivity of regional networks and planning on the North American continental scale [16]. Indeed, while measurements of artificial light have been applied to measure urban spread, the complex interaction between natural conditions and resistance to human activity have been largely ignored.
The minimum cumulative resistance model (MCR), which has been widely used to extract ecological corridors, disregards the random aspect of species dissemination, which makes it difficult to reflect the actual distribution of corridors, including the circulation of ecological processes and strong key nodes, which have received less attention [17]. Circuit theory has been used to simulate the movement of species across landscape resistance surfaces [18]. Kwon et al. utilized circuit theory and the least cost path method to identify ecological corridors and pinch areas in Korean urban areas for building a green network system [19]. Most existing research in China has focused on isolated cities [20], coastal zones [21], and watersheds [22,23]. The strongest focus in the literature is on urban agglomeration areas with overlapping functions, accelerated expansion of physical space, and threats to ecological space. The expansion of relevant research would be conducive to regional integrated ecological risk management and spatial development.
Referring to relevant literature [24,25], this paper employed the InVEST model in conjunction with particle size inversion in the construction of a resistance evaluation index system from four dimensions of landscape structure and built-up area resistance, starting from the regional ecological attributes and ecological disturbance, and following the principles of overall systemicity and data availability, selecting natural background conditions and topography. We then used the minimum cumulative resistance model (MCR) to form regional resistance surfaces and Circuitscape to identify key ecological corridors and ecological pinch points. We combined circuit theory with current land uses to construct the ecological security patterns of the Xia-Zhang-Quan metropolitan area in the pursuit of sustainable development. The Xiamen-Zhangquan-Spring urban agglomeration is located on the west coast of the Taiwan Strait. It is an important fulcrum for economic and cultural linkages between the two sides of the Taiwan Strait. It also features the hilly conditions of the southeastern coast of China, which create unique ecological characteristics. Rapid socio-economic development in the Xiamen, Zhangzhou, and Quanzhou metropolitan area has led to extensive soil erosion and the general degradation of ecosystems.
This paper proposes strategies by which to protect the environment of the Xia-Zhang-Quan metropolitan area through optimization of the urban landscape from a holistic view of risk prevention and ecosystem protection, rather than a narrow focus on local ecological elements. An evaluation of these elements in isolation increases the challenges associated with the cooperation between administrative units that is necessary across varying ecological scales. The Xia-Zhang-Quan metropolitan area has achieved rapid development due to its good location and abundant ecological resources. The lack of relevant economic and social spatial datasets for this area impedes formulation of an ecological network structure. In its failure to clarify the distribution characteristics of its landscape, this region is rife with ecological problems, which are likely to escalate in the near future.

2. Materials and Methods

2.1. Overview of Research Area

The Xia-Zhang-Quan metropolitan area, including Xiamen, Zhangzhou, and Quanzhou city, is located in the southern part of Fujian Province on the southeastern coast of China (Figure 1), between 23°48’~25°56’ N and 117°~119°05’ E with the Taiwan Strait at the east and Chaoshan of Guangdong to the south. Altitude range is 0~1814 m. The study area covers 25,400 km2. The altitude range is 0~1814 m. The Xia-Zhang-Quan area possesses a subtropical marine monsoon climate and the average annual temperature is 20 °C~26 °C. The vegetation in the region is rich in types, with subtropical rain forests, evergreen coniferous forests, shrubs, grasses, and mountain meadows distributed according to the topography, with an average forest coverage rate of 56.3%. It also possesses a complex topography that includes mountains, hills, plains, and coastal zones interlaced with a general trend of highlands in the northwest and the sea to the southeast [26]. The water system has been extensively developed, including Jinjiang, Jiulongjiang, and Zhangjiang streams. The Xia-Zhang-Quan metropolitan area represents the core of the Haixi Economic Zone. In 2020, its 19 million permanent residents accounted for 45% of the total regional population, 21% of the land area, and 50% of the GDP. Its uniform cultural environment is conducive to the construction of a regional ecological security space.

2.2. Data Sources

This study used data related to spatial distributions, economic and social development, and the natural environment. Spatial data were obtained from the website of the Center for Resources, Environment and Science of the Chinese Academy of Sciences (https://www.resdc.cn/, accessed on day month year). The 30 m raster data for land use types in the Xia-Zhang-Quan metropolitan area (2020) based on Landsat 8 remote sensing image data identified six primary land categories (cultivated land, forest land, grassland, water area, residential land, and unused land) and 25 secondary categories. Due to space considerations, we do not list the latter here. More information can be found at https://www.resdc.cn/data.aspx?DATAID=335, accessed on 27 April 2022. Data pertaining to rivers were obtained from the OpenStreetMap (OSM) platform and data related to roads were obtained from the Resource and Environment Data Cloud of the Chinese Academy of Sciences. Digital Elevation Model (DEM) data were obtained from the Geospatial Data Cloud Platform. The spatial distribution of land types was used to identify ecological sources and construct ecological resistance surfaces, including the slope, elevation, and roads. ArcGIS 10.2, Fragstats, and Circuitscape were used for processing data, which was divided into cell grids of 400 m × 400 m for evaluation.

2.3. Research Methods

In the current study, we used differences in ecosystem quality and connectivity at various granularity levels to represent the interactions among landscape types and the state of ecological networks. Coordinating economic development within a healthy ecological system requires an understanding of ecological security patterns over a range of scales [27]. In the current study, we used quantitative analysis to identify key areas within the Xia-Zhang-Quan metropolitan region requiring ecological protection and restoration. We propose a point-line-surface representation of symbiotic relationships in the region to integrate optimization of the space. The research framework includes four steps for the construction of ecological patterns (See Figure 2): (1) source identification based on InVEST model, (2) resistance surface establishment based on MCR, (3) corridor extraction based on circuit theory with Circuitscape software, (4) construction of landscape ecological security pattern. These steps are described in detail in the following subsections.

2.3.1. Identifying Ecological Sources Based on Ecosystem Quality with InVEST Model

The term “ecological sources” refers to high-quality ecosystems with sufficient connectivity to preserve the stability of regional ecosystems. In this study, the InVEST model was used to identify ecological sources and analyze threats to ecosystems in the matrix. We focused on the relative impact of each threat source, the sensitivity of ecosystem type to threat sources, and the distance between ecosystems and threat sources. The model includes assessment of ecosystem degradation degree Dxj and assessment of ecosystem quality Qxj [28]. These are calculated as follows:
D xj = r = 1 R y = 1 Y r x w r r = 1 R w r r y i rxy β x S jr ,
Q x j = H j 1 D xj z D xj z + k z ,
where Dxj is the degree of ecosystem degradation of grid x in land use/cover type j; R is the number of threat sources; Yr is a group of grids on the r threat grid map; Wr is the weight of threat sources; ry is the threat factor value of grid y; irxy is the spatial distance attenuation function of ecosystem type in grid x and y; βx is the accessibility of the threat factor; Sjr is the sensitivity of ecosystem type j to threat source r; Qxj is the ecosystem quality index of grid x in land use/cover type j; Hj is the ecosystem suitability of land use/cover type j, ranging from 0 to 1; k is the half-saturation constant, which is half of the maximum degradation degree; and z is the default normalization constant parameter of the model.
In accordance with the operating guide for the InVEST model (see https://naturalcapitalproject.stanford.edu/software/invest, accessed on 27 April 2022) and the recommendations of previous studies [29,30], we identified forest land, grassland, cultivated land, and water areas as ecosystem and urban land, rural settlements, unused land, and traffic land as threat sources. Ecosystem suitability and the susceptibility of land types to threats are listed in Table 1 and Table 2.
Granularity inversion (GI) is based on the concept of mathematical proof via contradiction. GI can be used to analyze the connectivity of landscape features at various levels of granularity for use in selecting ecological sources [31]. We referred to Guo [32] to determine the number of patches (NP), patch density (PD), maximum patch index (LPI), landscape separation index (DIVISION), and patch association degree (COHESION) in the initial ecological sources and aggregation degree (AI) to generate raster maps at granularity levels of 100 m, 200 m, 400 m, 600 m, 800 m, 1000 m, and 1200 m. We then integrated small patches through increasing granularity levels to obtain connectivity among landscape components with good properties. Conventionally, ecosystem quality is classified according to five grades based on the optimal granularity level. Guo [32] used the natural breakpoint method and screened patches of the first three grades of areas greater than 2 km2. We applied this approach to determine closely connected ecological sources of suitable functions and scale in the region.

2.3.2. Construction of Ecological Resistance Surfaces Based on MCR

The theory of ecological security makes it clear that species migration and energy flow can be disturbed by natural background conditions and human activities. This makes it necessary to measure resistance to ecological source diffusion to other landscape components and identify ecological corridors. Resistance surfaces are generally based on expert experience using single indicators. In [33], the researchers created a resistance evaluation index system that accounts for regional environmental conditions and interference to the outward expansion of ecological sources resulting from human activity. In the current paper, we adopted a hierarchical approach to assigning resistance scores (five levels), in which a higher score indicates higher resistance and weights are calculated via spatial principal component analysis. The factors and their weights are listed in Table 3. The formula used to calculate the minimum cumulative resistance model is as follows:
M C R = f min j = n i = m D xj × R j ,
where MCR refers to the cumulative resistance between a given landscape feature and the corresponding ecological source; f indicates the correlation between cumulative resistance and ecological processes; Dij indicates the distance between source i and j; m and n indicate the number of sources; and Ri is the resistance coefficient of ecological source i to ecological process.
We rotated the axis of spatial coordinates to enable the conversion of multivariate spatial data into several comprehensive indicators to obtain simplified high-dimensional variables and objectively determine the weight of each indicator [34]. By rasterizing the vector data, the results of principal component analysis were presented visually within a grid corresponding to two-dimensional space in order to obtain a map of the spatial load and cumulative contribution of the principal components using ArcGIS 10.2. Finally, we calculated the weights used to obtain the spatial distribution of ecological resistance surfaces.

2.3.3. Extraction of Ecological Corridors and Pinch Points Based on Circuit Theory

Ecological corridors are important bridges linking source patches and the routes by which information and species flow through metropolitan areas. We used the random walk of electrons (i.e., circuit theory) as a proxy by which to simulate the migratory movement of species in heterogeneous landscapes [35]. Circuit theory, first proposed by McRae et al., simulates ecological processes with physical circuits. Species are represented as electrons and the regional landscape is represented as a conductive surface, where current flows from one pinch point to another pinch point and the current density between two points is based on the likelihood of a given species moving along a path. Based on the Circuitscape platform (https://circuitscape.org/, accessed on 27 April 2022), this paper uses the Linkage Mapper tool to simulate a corridor similar to the minimum cost path. Each ecological source is treated as a circuit node and the cost-weighted distance (CWD) between the conductive surface and the ecological source are calculated. The smaller the cost-weighted distance and the longer the corridor length, the lower the resistance of the path. Therefore, through the results of CWD/LCPL, the key structural corridors and potential structures in the area can be further identified.
Ecological pinch points are areas of good ecosystem quality, which are key for ecological protection and restoration. They are crucial for the dispersal and flow of species, and are beneficial to ecosystem stability and biodiversity conservation. We used the Pinchpoint Mapper tool on the Circuitscape platform (https://circuitscape.org/, accessed on 27 April 2022) to identify pinch points. A many-to-one model allows us to fully reflect the connectivity role of ecological pinch points in the landscape. Combined with the constructed comprehensive resistance surface, the current density distribution from all patches can be iteratively calculated. The top 20% of this area serves as an ecological pinch point, playing an important connecting role.

2.3.4. Construction of Landscape Ecological Security Patterns

Ecological security patterns in the Xia-Zhang-Quan metropolitan area were based on ecological landscape features and their spatial distribution as well as regional geographic features, disturbances due to human activity, and current land use patterns. We identified the basic ecological security pattern of the Xiamen-Zhang-Spring urban agglomeration by taking the identified ecological source as the ecological matrix, combined with distribution characteristics of the comprehensive resistance surface [10]. We developed an ecological network based on major river systems and ecological corridors with ecological pinch points as the central points of regional buffer zones by which to strengthen the effectiveness of key ecological areas as dissemination hubs. We also sought to optimize the spatial structure of ecological elements, including source areas, pinch points, and ecological corridors with the aim of promoting the harmonious coexistence of human and nature in the region.

3. Results

3.1. Identification of Ecological Sources

As shown in Figure 3a, the spatial distribution and ecosystem quality in the Xiamen-Zhang-Quan metropolitan area were derived using the InVEST model. A good proportion of the area was identified as intact ecosystems (68%) with a high average quality (0.65). The quality of the ecosystems decreased gradually from the central and southern regions (Dehua, Yongchun, Anxi, Nanjing, Pinghe) due to forestry. The quality of the ecosystems in the central urban areas of Xiamen and Quanzhou (Quangang, Licheng, Jinjiang, Shishi, Hui’an, Xiang’an and Tong’an) was relatively low, and accounted for only 11.27% of the total area. In well-resourced areas, such as those with arable land and water resources, the level of urbanization is high, leading to high levels of disturbance to the ecosystem and other threats related to human activities.
Based on the 30 m high-precision land use raster map, we used Fragstats software package to calculate landscape patterns at various levels of granularity. LPI decreased inversely with particle size, and the maximum patch index values dropped off rapidly at a particle size of >200 m and stabilized at >400 m, fluctuating around 37.6%. This indicates that at the 400 m granularity level, the landscape patches begin to concentrate, and landscape connectivity is enhanced. For DIVISION, its size first increased to a peak value of 0.8 at the particle size level of 200 m, then showed a downward trend, and stabilized to 0.78 after 400 m, obtaining the same suitable particle size. For NP, PD, COHESION and AI, they all decreased slowly with the increase of particle size, and gradually stabilized after a slight mutation at 400 m. Therefore, 400 m is the key point for the mutation of different landscape connectivity indices, and this particle size is selected as an effective reference for identifying ecological sources.
The identification of ecological sources depends largely on the quality of ecosystems within a patch and the degree to which they radiate outward, i.e., their structural and functional utility within the ecological landscape. Thus, we applied the natural breakpoint method to the results of InVEST in order to classify patches. Patches that fell within the top three grades and ecosystem areas exceeding 2 km2 were identified as ecological sources (Figure 3b). We identified 17 ecological source areas in the Xia-Zhang-Quan metropolitan area, covering an area of 11,512 km2 (45.36% of the total area), most of which was woodland, grassland, and water. Most of the ecological sources were in the Daiyun Mountains in the northwest (Dehua, Anxi, and Yongchun counties) and the hilly area to the southwest. Dehua County provided the largest ecological source area (1676 km2). Dispersed ecological sources in the east included small woodland areas and bodies of water embedded within urban circles. Note that ecological source areas in Fengze, Licheng, and Luojiang accounted for only 1.2% of the total source area.

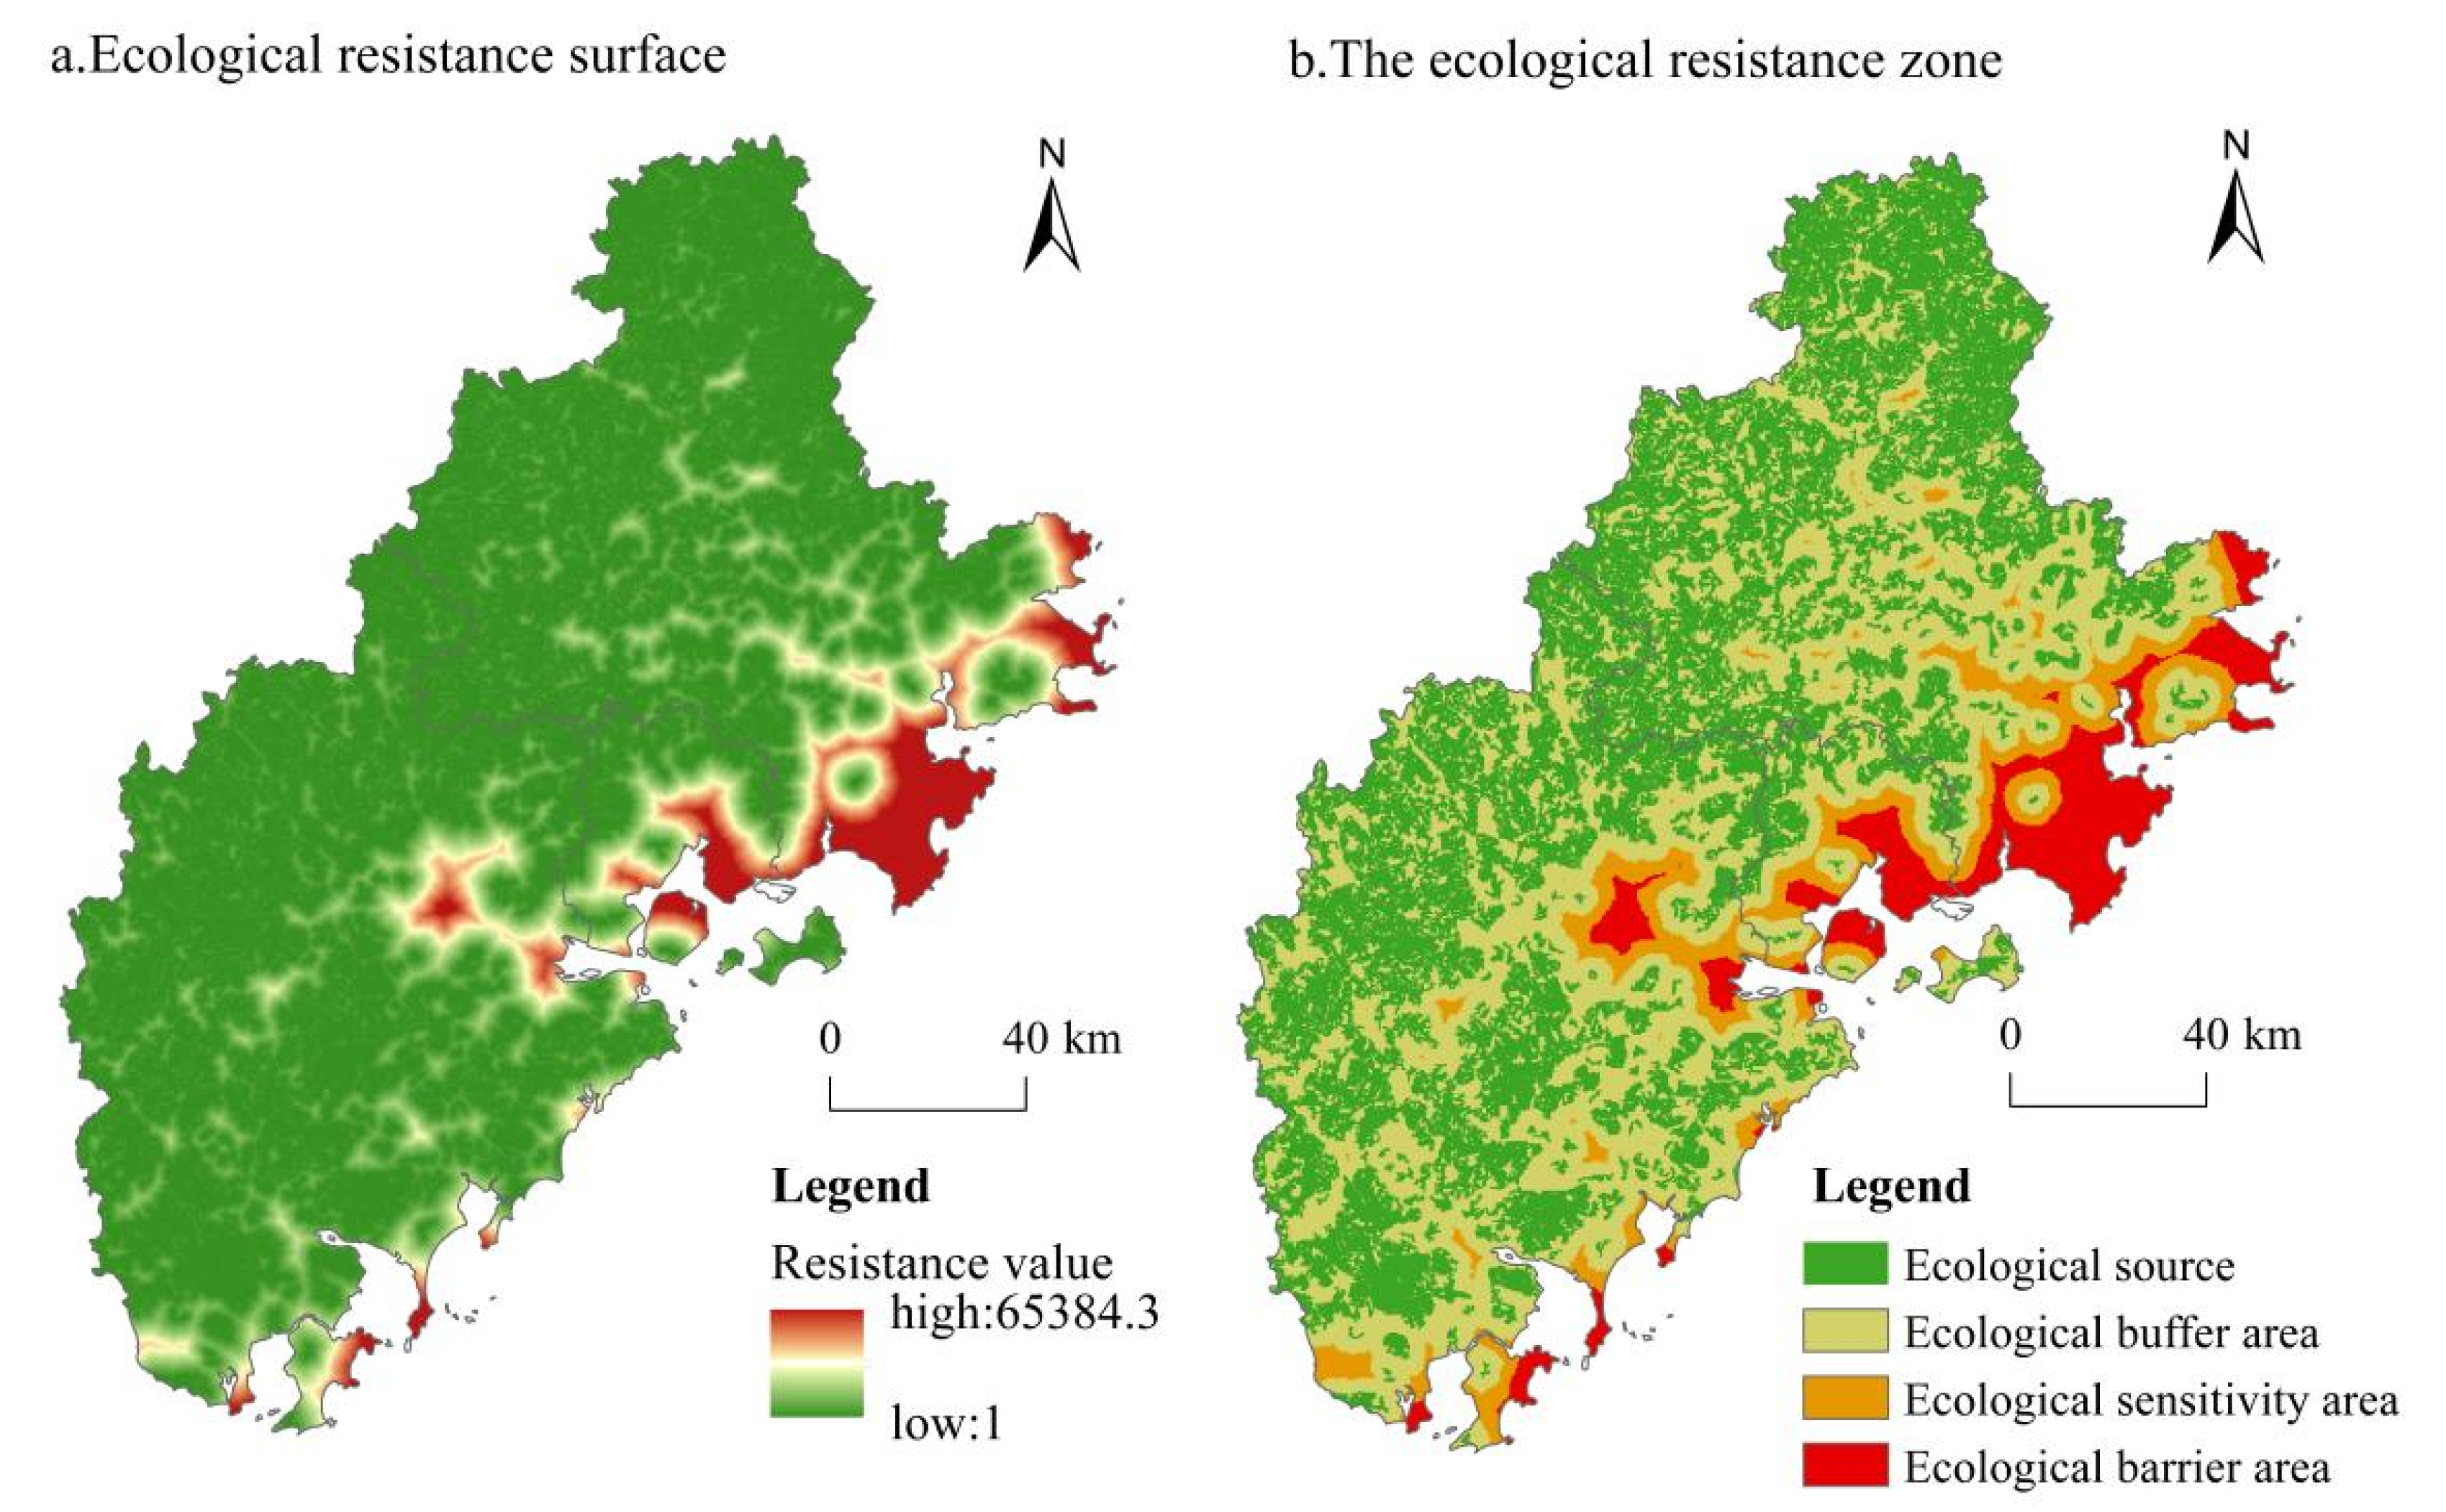
3.2. Construction of Resistance Surfaces and Ecological Security Patterns

We constructed resistance surfaces based on the data in Table 3 (Figure 4a). Overall, most of the resistance was concentrated in specific areas, indicating that the distribution of good ecosystems is conducive to flow. Most of the high resistance values were located in industrial and commercial areas along the eastern coast. Most of the terrain in this area is plains and low hills with wide expanses of urban construction land. Frequent and large-scale human activities have created great obstacles to maintaining the balance and stability of the ecosystem. Patches with low resistance and high-quality ecosystems tend to coincide. This is because widely-spread forest vegetation is well-suited to ecological adjustment. We superimposed ecological source patches over resistance surfaces to obtain basic ecological security patterns in the Xia-Zhang-Quan metropolitan area (Figure 4b). Spreading outwards from the ecological source area, the surrounding area features low resistance. This area is the first important barrier helping to maintain ecosystem services. It presents an “S”-shaped distribution characteristic, accounting for 34.59% of the total area. While the resistance is relatively low, it can alleviate some external ecological risks. Low-resistance regions in the middle of the study area (Nan’an, Yongchun, Changtai, Zhangpu, Yunxiao counties) are ideal ecological buffer zones, which should be protected against excessive development. Areas of medium resistance adjacent to the ecological buffer zone account for 10.89% of the study area. Areas of high resistance accounted for 9.16% of the total study area, most of which was in coastal zones with flat terrain and dense populations.

3.3. Identified Key Ecological Corridors and Ecological Pinch Points

Ecological corridors play a key role in connecting ecological landscapes. The Linkage Mapper module identified 41 ecological corridors in the Xia-Zhang-Quan metropolitan area, including 31 key corridors and 10 potential corridors. We also identified natural corridors formed by the Jiulongjiang, Zhangjiang, Jinjiang, and Minjiang and their main tributaries. The longitudinal spatial distribution becomes increasingly complex from southwest to northeast. The key corridors and potential corridors are connected in series through ecological buffer zones and ecologically sensitive areas.
Ecological pinch points refer to low-resistance, high-current areas deemed critical to species migration. Using the Pinchpoint Mapper module, we identified 73 pinch points (see Figure 4) scattered along the various ecological corridors. Most of the pinch points were located in the transition section between the source area and the ecological buffer zone, particularly in the mountainous areas of Anxi (n = 23), Zhangpu (n = 9), and Yongchun counties (n = 6). Most of the pinch points in the Xia-Zhang-Quan metropolitan area were located between ecological sources and inter-source corridors. We also identified 13 ecological pinch points along river corridors. In these areas, it is particularly important to implement riverbank restoration and eliminate water pollution.

3.4. Landscape Ecological Security Patterns

As shown in Figure 5, based on the above results, the landscape ecological security pattern of the Xiamen-Zhangquan metropolitan was jointly constructed. Most of the ecological pinch points in the Xiamen-Zhangquan area are at the border between the ecological source and the inter-source corridor, which is a key position to promote the circulation of species between the sources. Identifying, diagnosing, and reconstructing the spatial structure and ecological layout of source sites, corridors, and pinch points can make them more rational and large-scale. This serves to protect the integrity of the ecological network between the original ecological land and improve ecologically sensitive areas and cities as well as the anti-interference ability and ecosystem service supply ability of the coastal blocking area. This enables the building of a sustainable green landscape.

4. Discussion

Urban ecosystems and landscapes in China are on an unsustainable trajectory, especially in highly developed urban agglomerations, which play a key role in the transition to sustainability [2]. As a high-level giant system in which humans and the environment co-evolve, urban agglomerations are difficult to completely predict or control, but human development and construction activities can and should be planned and designed based on ecological landscape theory and sustainable development principles. In the current planning of many urban spaces in China, the ecological factors at the scale of urban agglomerations have yet to be linked to the network structure of ecological landscapes [36] and the security state of the wider ecosystem. Therefore, in this study, in order to more clearly diagnose the status of regional ecosystem quality and service function, we refine the methods of resistance surface construction and corridor identification.
Based on the principles of landscape ecology, this study considers various ecological elements such as sources, corridors, and pinch points in the ecological security pattern. We integrate the InVEST model and the landscape pattern index to comprehensively consider species activities and the value of ecological patches. The size of the block is used to identify high-quality ecological sources, which makes up for the shortcomings of previous studies based on single identification methods and neglecting species migration. Our approach reduces the interference of human subjective factors in the process of ecological source identification, and more truly reflects the spatial distribution pattern of regional ecosystem quality, so as to be able to effectively characterize the systematic correlation of ecological elements between regions.
The proposed regional ecological network will greatly improve the connectivity and network closure of urban corridors, and enhance the resilience of the region to resist ecological risks. According to the ecological characteristics of each region in the Xia-Zhang-Quan metropolitan area, specific pattern construction and restoration measures are proposed as follows:
(1)
Ecologically-stagnant areas: This area is dominated by coastal metropolitan circles, coastal zones, and fragile ecosystems where a few key corridors and ecological pinch points exist. In these areas, comprehensive estuary pollution control projects and water testing and protection can be carried out.
(2)
Complex urban agglomeration areas: In these areas, population control, industrial upgrading, ecological infrastructure construction, and garbage classification and recycling are recommended. A long-term monitoring and feedback mechanism for human activities disturbing the natural environment should also be established.
(3)
Traffic land that is solidified within the scope of human activities: The construction of ecological buffer zones around roads should be strengthened, and landscape transition zones should be established. These would include flow channels reserved for wildlife.
(4)
Cultivated land distributed in buffer zones, sensitive areas, and blocking areas: Sporadic plots can be appropriately merged and green ecological agriculture can be carried out according to local conditions. This would serve to promote the modernization and large-scale development of agriculture.
In order to promote the long-term stability of the ecological security pattern, planning documents and specific measures for trial implementation can be released, and an ecological protection and restoration information sharing and exchange platform can be established to mobilize the public. The establishment of a long-term ecosystem monitoring and feedback mechanism is also key. This would enable authorities and experts to check the current situation and effect of ecological security pattern construction in a timely manner, and continuously provide new ideas for security pattern construction.
The proposed model does not incorporate complex functions such as aesthetic landscaping and humanistic leisure. This requires improvement. Future research should continue to explore methodologies for the coupling and superposition of integrated and coordinated ecological networks for both land and sea. Methods of identifying and diagnosing ecological spatial structure are still under development. Current trends in ecological network construction are focused on the dynamism of ecological processes and elements, including the connectivity between them. Although circuit theory helps to describe ecological corridors by identifying the trajectories of species migration, species activity trajectories are more complicated, as these are impacted by real-world conditions. Means of identifying landscape structures of different types based on the element-structure-function framework remain to be explored. With the rapid development of satellite remote sensing, UAV aerial photography, network tracking, artificial intelligence, and other technologies, the transformation of data acquisition methods provides infinite possibilities for the deepening of research. In addition, the complex structure and function of ecological corridors make their widths uncertain [37]. Therefore, in-depth discussion of the thresholds of ecological corridor widths is also required to construct more scientific, rational, and effective landscape ecological security patterns.

5. Conclusions

This study used the InVEST model to assess ecosystem quality in the Xia-Zhang-Quan metropolitan area to develop ecological resistance surfaces based on four dimensions: natural background conditions, topography, landscape structure, and urban built-up areas. Our analysis identified ecological corridors and pinch points that are crucial to the protection and restoration of the ecology of the Xia-Zhang-Quan metropolitan area. Results indicated that ecosystem quality of over 0.6 accounted for 67.65% at an optimal granularity of 400 m. The distribution of resistance values in the study area was relatively concentrated with the land divided into ecological buffer zones (34.6%), environmentally sensitive zones (10.9%), and blocked zones (9.2%). We identified 17 ecological source sites covering 11,512 km2, accounting for 45.36% of the total area. The inter-source corridor includes 31 key corridors and 10 potential corridors covering 3305 km2. We identified 41 corridors between sources, including 31 key corridors and 10 potential corridors, covering a distance of 3305 km.
The high concentration of resistance values in the study area corresponded with the spatial distribution of the ecosystem, indicating that good ecosystem conditions are conducive to the smooth flow of the ecosystem. The resistance surface was divided into various grades spreading outward from ecological sources. Low-resistance areas surrounding ecological sources are used as ecological buffer areas. Medium-resistance areas are adjacent to the ecological buffer area. The basic ecological security pattern of the Xia-Zhang-Quan metropolitan area was obtained by superimposing the ecological source patches. Based on this basic pattern, combined with the spatial distribution characteristics of various ecological elements and the status quo of land use, targeted suggestions are put forward, which is conducive to the development of regional ecological protection and restoration work, thereby forming a sustainable landscape ecological security pattern.

Author Contributions

Conceptualization, F.L.; methodology, Q.H.; software, M.B. and Q.H.; validation, S.-H.L.; formal analysis, M.B. and Q.H.; investigation, M.B.; resources, F.L.; data curation, Q.H.; writing—original draft preparation, F.L.; writing—review and editing, F.L. and Q.H.; visualization, S.-H.L.; supervision, S.-H.L.; funding acquisition, F.L. All authors have read and agreed to the published version of the manuscript.

Funding

This research was funded by National Natural Science Foundation of China (Grant No. 42001224 and 41401210), and funding Project of the Outstanding Young Scientific Research Talents Cultivation Program in Fujian Province (Grant No. 2018).

Institutional Review Board Statement

Not applicable.

Informed Consent Statement

Not applicable.

Data Availability Statement

The data presented in this study are available on request from the corresponding author. The data are not publicly available because it contains non–public data.

Conflicts of Interest

The authors declare no conflict of interest.

References

  1. Liu, J.; Yin, H.W.; Kong, F.H.; Li, M.H. Structure optimization of circuit theory-based green infrastructure in Nanjing, China. Acta Ecol. Sin. 2018, 38, 4363–4372. [Google Scholar]
  2. Yang, L.J.; Wang, J.; Wei, W. Ecological security pattern construction and optimization in Arid Inland River Basin: A case study of Shiyang River Basin. Acta Ecol. Sin. 2020, 40, 5915–5927. [Google Scholar]
  3. De Montis, A.; Caschili, S.; Mulas, M.; Modica, G.; Ganciu, A.; Bardi, A.; Ledda, A.; Dessena, L.; Laudari, L.; Fichera, C.R. Urba-rural ecological networks for landscape planning. Land Use Policy 2016, 50, 312–327. [Google Scholar] [CrossRef]
  4. Huang, L.; Wang, J.; Chen, X. Ecological infrastructure planning of large river basin to promote nature conservation and ecosystem functions. J. Environ. Manag. 2022, 306, 114482. [Google Scholar] [CrossRef] [PubMed]
  5. Xu, Y.W.; Dai, W.Y.; Huang, W.L.; Huang, K.; Hu, H.X. Spatiotemporal evolution and correlation analysis of ecosystem service values and ecological risk in Fuzhou central city. Ecol. Sci. 2021, 40, 92–101. [Google Scholar]
  6. Zhang, X.M.; Dong, Y.X.; Du, H.M.; Liao, C.L.; Wang, F. Optimization of landscape pattern in Fujiang River Basin based on landscape ecological risk assessment. Acta Ecol. Sin. 2021, 41, 3940–3951. [Google Scholar]
  7. Li, T.; Gong, Y.B.; Ge, J.Z.; Qi, Z.X.; Xie, S.B. Construction of urban landscape ecological security pattern based on circuit theory: A case study of Hengyang City, Hunan Province, China. Chin. J. Appl. Ecol. 2021, 32, 2555–2564. [Google Scholar]
  8. Yu, K.J. Landscape ecological security patterns in biological conservation. Acta Ecol. Sin. 1999, 19, 10–17. [Google Scholar]
  9. Cen, X.T.; Wu, C.F.; Xing, X.S.; Fang, M.; Garang, Z.; Wu, Y. Coupling intensive land use and landscape ecological security for urban sustainability: An integrated socioeconomic data and spatial metrics analysis in Hangzhou city. Sustainability 2015, 7, 1459–1482. [Google Scholar] [CrossRef] [Green Version]
  10. Peng, J.; Pan, Y.J.; Liu, Y.X.; Zhao, H.; Wang, Y. Linking ecological degradation risk to identify ecological security patterns in a rapidly urbanizing landscape. Habitat Int. 2018, 71, 110–124. [Google Scholar] [CrossRef]
  11. Chen, X.; Peng, J.; Liu, Y.X.; Yang, Y.; Li, G.C. Constructing ecological security patterns in Yunfu city based on the framework of importance-sensitivity-connectivity. Geogr. Res. 2017, 36, 471–484. [Google Scholar]
  12. Miguel, M.; Catarina, F.; Marta, V.; Calado, H.; Gil, A. Spatial assessment of habitat conservation status in a Macaronesian island based on the InVEST model: A case study of PicoIsland (Azores, Portugal). Land Use Policy 2018, 78, 637–649. [Google Scholar]
  13. Nematollahi, S.; Fakheran, S.; Kienast, F.; Jafari, A. Application of InVEST habitat quality module in spatially vulnerability assessment of natural habitats (case study: Chaharmahal and Bakhtiari province, Iran). Environ. Monit. Assess. 2020, 192, 1–17. [Google Scholar] [CrossRef] [PubMed]
  14. Li, H.; Yi, N.; Yao, W.J.; Wang, S.; Li, Z.; Yang, S. Shangri-La county ecological land use planning based on landscape security pattern. Acta Ecol. Sin. 2011, 31, 5928–5936. [Google Scholar]
  15. Huang, L.Y.; Liu, S.H.; Fang, Y.; Zou, L. Construction of Wuhan’s ecological security pattern under the “quality-risk-requirement” framework. Chin. J. Appl. Ecol. 2019, 30, 615–626. [Google Scholar]
  16. Barnett, K.; Belote, R.T. Modeling an aspirational connected network of protected areas across North America. Ecol. Appl. 2021, 31, e02387. [Google Scholar] [CrossRef]
  17. Pan, J.H.; Li, L. Optimization of ecological security pattern in Gansu section of the Yellow River Basin using OWA and circuit model. Trans. Chin. Soc. Agric. Eng. 2021, 37, 259–268. [Google Scholar]
  18. Sun, F.; Zhang, J.H.; Wang, P.J.; Wei, G.; Chu, G.; Cao, Y. Construction and evaluation of urban ecological security pattern: A case study of Suzhou city. Geogr. Res. 2021, 40, 2476–2493. [Google Scholar]
  19. Kwon, O.S.; Kim, J.H.; Ra, J.H. Landscape Ecological Analysis of Green Network in Urban Area Using Circuit Theory and Least-Cost Path. Land 2021, 10, 847. [Google Scholar] [CrossRef]
  20. Qing, F.T.; Peng, Y. Temporal and spatial characteristics of ecological risk in Shunyi, Beijing, China based on landscape structure. Chin. J. Appl. Ecol. 2016, 27, 1585–1593. [Google Scholar]
  21. Chen, X.Y.; Xie, G.Z.; Zhang, J.P. Landscape ecological risk assessment of land use changes in the coastal area of Haikou City in the past 30 years. Acta Ecol. Sin. 2021, 41, 975–986. [Google Scholar]
  22. Pan, J.H.; Liu, X. Landscape ecological risk assessment and landscape security pattern optimization in Shule River Basin. Chin. J. Ecol. 2016, 35, 791–799. [Google Scholar]
  23. Kang, Z.W.; Zhang, Z.Y.; Wei, H.; Liu, L.; Ning, S.; Zhao, G.N.; Tian, H. Landscape ecological risk assessment in Manas River Basin based on land usechange. Acta Ecol. Sin. 2020, 40, 6472–6485. [Google Scholar]
  24. Dai, L.; Liu, Y.B.; Huang, K.Z. Construction of an ecological security network for waterfront cities based on MCR model and DO index:A case study of Jiujiang city. Acta Geogr. Sin. 2020, 75, 2459–2474. [Google Scholar]
  25. Chen, Y.Y.; Luo, Z.J.; Qi, S.; Zhao, J.; Yuan, Y.; Li, F. Ecological security pattern construction of Nanchang city based on ecological sensitivity and ecological network. Res. Soil Water Conserv. 2021, 28, 342–349. [Google Scholar]
  26. Hu, Q.Y.; Chen, S.L. Optimizing the ecological networks based on the supply and demand of ecosystem services in Xiamen-Zhangzhou-Quanzhou region. J. Nat. Resour. 2021, 36, 342–355. [Google Scholar] [CrossRef]
  27. Liang, F.C.; Hu, Q.Y.; Qi, X.X. Risk assessment of landscape ecology and its control strategy based on life community: A case study of Chengdu-Chongqing urban agglomeration. Econ. Geogr. 2021, 41, 152–159. [Google Scholar]
  28. Sharp, R.; Tallis, H.T.; Ricketts, T.; Guerry, A.D.; Wood, S.A.; Chaplin-Kramer, R.; Nelson, E.; Ennaanay, D.; Wolny, S.; Olwero, N.; et al. InVEST 3.5.0 User’s Guide. The Natural Capital Project; The Nature Conservancy, and World Wildlife Fund; University of Minnesota: Minneapolis, MN, USA, 2018. [Google Scholar]
  29. Wu, J.S.; Zhang, L.Q.; Peng, J.; Feng, Z.; Liu, H.M.; He, S.B. The integrated recognition of the source area of the urban ecological security pattern in Shenzhen. Acta Ecol. Sin. 2013, 33, 4125–4133. [Google Scholar]
  30. Hao, Y.; Zhang, N.; Du, Y.J.; Wang, Y.H.; Zheng, Y.D.; Zhang, C.C. Construction of ecological security pattern based on habitat quality in Tang County, Hebei, China. Chin. J. Appl. Ecol. 2019, 30, 1015–1024. [Google Scholar]
  31. Fang, Y.; Wang, J.; Huang, L.Y.; Zhai, T.L. Determining and identifying key areas of ecosystem preservation and restoration for territorial spatial planning based on ecological security patterns: A case study of Yantai city. J. Nat. Resour. 2020, 35, 190–203. [Google Scholar]
  32. Gao, Y.; Liu, Y.X.; Qian, J.L.; Guo, Y.; Hu, Y. Improving ecological security pattern based on the integrated observation of multiple source data: A case study of Wannian County, Jiangxi Province. Resour. Sci. 2020, 42, 2010–2021. [Google Scholar] [CrossRef]
  33. Yang, Q.K.; Wang, L.; Li, Y.L.; Qin, X.H. Urban Spatial Expansion Mode Based on the construction of landscape ecological security pattern: A case of the coastal area of Jiangsu. Sci. Geogr. Sin. 2021, 41, 737–746. [Google Scholar]
  34. Li, H.H.; Ma, T.H.; Wang, K.; Tan, M.; Qu, J.F. Construction of Ecological Security Pattern in Northern Peixian Based on MCR and SPCA. J. Ecol. Rural. Environ. 2020, 36, 1036–1045. [Google Scholar]
  35. Zhu, J.; Su, J.; Yin, H.W.; Kong, F.H. Construction of Xuzhou ecological network based on comprehensive sources identification and multi-scale nesting. J. Nat. Resour. 2020, 35, 1986–2001. [Google Scholar]
  36. Wu, J. Urban ecology and sustainability: The state-of-the-science and future directions. Landsc. Urban Plan. 2014, 125, 209–221. [Google Scholar] [CrossRef]
  37. Zhu, Q.; Yu, K.J.; Li, D.H. The width of ecological corridor in landscape planning. Acta Ecol. Sin. 2005, 25, 2406–2412. [Google Scholar]
Figure 1. Geographical location and elevation of study area.
Land 11 00707 g001
Figure 2. Research Procedure.
Land 11 00707 g002
Figure 3. Spatial distribution map of ecosystem quality and ecological sources: (a) ecosystem quality where high quality is represented by 1 and low quality is represented by 0; (b) ecological sources (top three grades and ecosystem areas exceeding 2 km2 were identified as ecological sources).
Land 11 00707 g003
Figure 4. Distribution of minimum cumulative resistance difference and ecological resistance zones.
Land 11 00707 g004
Figure 5. Spatial distribution map of ecological security patterns.
Land 11 00707 g005
Table 1. Ecosystem suitability and susceptibility of land types to threats.
Land-Use TypesEcosystem
Suitability
Sensitivity
Urban LandRural SettlementsRoadsUnused Land
Cultivated land0.60.50.40.50.3
Forest0.90.80.60.70.4
Grassland0.80.70.50.60.5
Water area0.70.80.70.50.3
Notes: Data from operating guide for InVEST model (see https://naturalcapitalproject.stanford.edu/software/invest, accessed on 27 April 2022) and related studies [23,24].
Table 2. Attributes of threat factors.
Threat FactorsWeightMaximum Influence
Distance (km)
Decay
Correlation
Urban land0.86Exponential
Rural settlements0.64Exponential
Roads0.73Linear
Bare land0.42Linear
Notes: Data from operating guide for InVEST model (see https://naturalcapitalproject.stanford.edu/software/invest, accessed on 27 April 2022) and related studies [23,24].
Table 3. Criteria used to calculate resistance values.
Evaluation DimensionsResistance
Factors
FeatureResistance
Value
Natural background conditionsLandscape typesForest, water area1
Grassland2
Cultivated land3
Unused land4
Residential land5
Topography and landformsSlope/°0~51
5~152
15~253
25~354
>355
Elevation/m<1001
100~4002
400~8003
800~12004
>12005
Landscape structureFragmentation index<0.1251
0.125~0.1852
0.185~0.2553
0.255~0.3254
>0.3255
Construction resistanceDistance from urban construction area/m>30001
2000~30002
1000~20003
500~10004
<5005
Distance from rural construction area/m>20001
1000~20002
500~10003
250~5004
<2505
Publisher’s Note: MDPI stays neutral with regard to jurisdictional claims in published maps and institutional affiliations.

