
Changes in Cultivated Land Loss and Landscape Fragmentation in China from 2000 to 2020


Key Laboratory of Land Surface Pattern and Simulation, Institute of Geographic Sciences and Natural Resources Research, Chinese Academy of Sciences, Beijing 100101, China
Land 2022, 11(5), 684; https://doi.org/10.3390/land11050684
Submission received: 16 April 2022
/
Revised: 28 April 2022
/
Accepted: 30 April 2022
/
Published: 4 May 2022
(This article belongs to the Special Issue Agricultural Land Use and Food Security)
Abstract
:Cultivated land area and fragmentation are two crucial elements that influence food production in China. However, few studies have analyzed the fine-grained changes in both the area and the fragmentation of cultivated land from a national perspective. Using a 30 m annual land-cover dataset with the help of cultivated land area (CA) and a newly constructed coupling landscape fragmentation index (CLFI), this research identified the spatial distribution characteristics of both the area and the landscape fragmentation of cultivated land in Chinese counties and simultaneously analyzed the changes in the above two elements since the beginning of the 21st century. The results showed that the distribution pattern of CA in China’s counties was large in the north and small in the south. During the first two decades of the 21st century, the total CA of China decreased, but the decrease rate decreased from 2.91% in 2000–2010 to 0.41% in 2010–2020; in contrast, the CLFI of China showed an increasing trend, but the increase rate also decreased, from 4.06% in 2000–2010 to 0.51% in 2010–2020. Spatially, from 2000 to 2010, there was an obvious reverse distribution pattern between counties with large CA changes and those with large CLFI changes; however, this pattern became less obvious from 2010 to 2020. Urban expansion, sloping land conversion programs and other ecological protection programs, and land development and consolidation programs were major causes of changes in the CA and CLFI across China. The findings of this research provide a data basis and scientific support for the protection and large-scale utilization of cultivated land, where this information is necessary to ensure food security.
1. Introduction
Cultivated land is the most important foundation for food production, agro-ecosystem service provision, agricultural civilization continuation and so on [1,2,3,4,5,6], and was reported to expand to marginal areas with low productivity worldwide [7,8]. Additionally, the phenomenon of construction land occupying cultivated land of high quality is common, especially in developing countries [9,10,11]. Therefore, global cultivated land systems are under tremendous pressure to support a continually rising population, while the fragmented cultivated land operated by small farms (<2 ha in size) plays an important role in ensuring food security [12,13,14]. Globally, the loss of cultivated land, mainly due to urban expansion and the fragmentation of small farms, may not only damage the ecosystem service functions of cultivated land, such as food production and biodiversity, but also pose a threat to ecosystem security due to excessive use of chemical fertilizers [15,16,17,18].
China has a decreasing cultivated land area and a large percentage of smallholder farms [19,20]. Since the implementation of the reform and opening-up policy in 1978, China’s urbanization rate has been accelerating, and cultivated land has been the main source of construction land expansion, resulting in the shrinkage of cultivated land, which was particularly evident during 1990–2010 [21,22]. It is obvious that China is facing record-breaking pressure to provide sufficient food for approximately one-fifth of the global population [23,24]. Additionally, the fragmentation of cultivated land, characterized by the fact that more than 70% of the country’s cultivated land is managed by farms with a farm size of less than 0.6 ha, is another prominent problem that limits the efficient use of cultivated land in China [25]. Land fragmentation is widely recognized as one of the main causes of the disintensification of cultivated land, resulting in declining productivity and increasing production costs and, thus, low land-use efficiency [25,26,27]. It should be noted that along with the loss of cultivated land area, the degree of fragmentation of China’s cultivated land is increasing. This can not only cause a decrease in the value of ecosystem service functions and biodiversity, but can also exacerbate the inefficient use of cultivated land and have a negative impact on national food production [28,29,30,31].
Since the 1980s, the central government of China has given much attention to curbing the loss of cultivated land area, and a series of laws and institutional guarantee systems have been implemented, including the Land Administration Law; the Land Use Control System; the Cultivated Land Occupation and Compensation Balance System; and the Land Development, Consolidation and Reclamation System [24]. Since the 2010s, the fragmentation of cultivated land has also attracted significant attention from the central government of China. In 2014, the “Trifurcation of Land Rights” policy was introduced, and the transfer of land management rights was encouraged, which aims to reduce cultivated land fragmentation and thus improve the efficiency of cultivated land use [32,33]. In the context of the above policy interventions, what are the respective trends in cultivated land area and fragmentation over the first 20 years of the 21st century? The results of a comprehensive national-wide analysis can not only provide a database for the evaluation of the implementation effect of relevant policies but also provide scientific suggestions for the improvement of relevant policy measures.
However, there have been many studies on the change in cultivated land area in China, yet the data sources have not been consistent and the results may differ significantly. Specifically, from 2000 to 2010, the data from Wu et al. [34] and Yang et al. [35] showed reductions in China’s cultivated land area of 4.80 × 10⁶ hm2 and 5.62 × 10⁶ hm2, respectively, and were relatively close. In contrast, GlobeLand 30 showed that the decrease in China’s cultivated land during the same period was approximately 1.77 × 10⁶ hm2 [36], which was much smaller than the above data, yet more consistent with the results of Liu et al. [21] (1.02 × 10⁶ hm2). When analyzing the change in cultivated land area in the last decade, the differences in the results of existing studies were less pronounced. Specifically, the data from Yang and Huang [35] showed a 0.41% reduction in cultivated land area from 2010 to 2020, which is a value close to the 0.29% reduction from 2009 to 2018 obtained by Yuan et al. [37] based on the land survey grid data of China. In addition, the accessibility of different data varies. Among the abovementioned data, the GlobeLand 30 and the 30 m annual land-cover dataset of China were relatively more accessible and are freely available, providing scholars with more convenience in using these data for research.
Cultivated land fragmentation can be roughly divided into ownership fragmentation and landscape fragmentation [38]. Most studies focusing on ownership fragmentation are conducted from the microscopic perspective of the households and consider that fragmentation is the result of infinite subdivision of cultivated land property rights; additionally, these studies mainly use household survey data to analyze the impact of fragmentation on land-use behaviors, such as the intensive use and transfer of cultivated land [32,39,40,41]. In contrast, landscape fragmentation is more characterized by the dispersion of cultivated land parcels in space, and relevant research focuses mainly on the assessment of the fragmentation status and its influencing factors, including natural environment conditions, socio-economic development represented by urban expansion, ecological protection program and land consolidation programs [42,43,44]. Commonly used indices include the number of household plots (N), plot density (PD), land plot accessibility (LPA), landscape shape index (LSI), aggregation index (AI) or different combinations of these indices [44,45,46]. However, it should be noted that most relevant studies were conducted at the local or regional scales, while few studies have been conducted to analyze the fine-grained landscape fragmentation of cultivated land and its changes from a China-wide perspective [28].
Considering the above, this study used the 30 m annual land-cover dataset of China to obtain the trend of cultivated land change in China from 2000 to 2020 and constructed a comprehensive coupling index for landscape fragmentation to analyze the change in landscape fragmentation in this period. The main purpose of this study was to comprehensively and systematically analyze the cultivated land change from the perspectives of both area and fragmentation across China since the beginning of the 21st century and to explore the causes for the changes from the perspective of changes in land-use types. These can provide a scientific basis for relevant policy recommendations on cultivated land protection, reduction of fragmentation and promotion of large-scale utilization, ultimately achieving the goal of improving the productivity of cultivated land and ensuring national food security.
2. Materials and Methods
2.1. A General Framework for the Construction of a Coupling Index for Land Fragmentation
To comprehensively analyze the change in cultivated land in China, changes in both the area and the fragmentation of cultivated land in China were considered in this study. Fragmentation means that cultivated land is divided among several spatially separated plots, adding difficulty to the concentrated and contiguous operation of cultivated land [47]. As mentioned, cultivated land fragmentation can be divided into ownership fragmentation and landscape fragmentation, which are both interconnected and differentiated [38]. In this study, we mainly analyzed the changes in landscape fragmentation of cultivated land in China.
Regarding the selection of indices, most studies used multiple landscape pattern indices to analyze their changes separately; in recent years, some studies also adopted comprehensive methods, such as principal component analysis, to construct a comprehensive indicator for the evaluation of landscape fragmentation by using multiple landscape pattern indices [4,46]. To reduce the redundancy of index selection, a coupling landscape fragmentation index (CLFI) was constructed in this study, combining the two most representative indicators of landscape fragmentation, namely, PD and LSI, to describe the fragmentation of cultivated land more accurately and concisely across China.
Specifically, PD was selected as one of the key proxies for fragmentation; it was widely adopted by many relevant studies on landscape fragmentation and ownership fragmentation [4,45]. Under the background of the same total farm area, the larger the PD is, the smaller the average plot size and the higher the dispersion degree of the cultivated land [44]. However, for specific farms, in addition to the size and dispersion degree of the plot having a significant impact on the tillage process, its shape affects the ease of cultivation and, in particular, the use of machinery [38,42,48]. For the same-sized farm with the same PD, generally, the more regular the shape is, the more conducive the land is to mechanical use and vice versa; whether cultivated land is conducive to mechanical cultivation is often an important factor that influences farmers’ land allocation decisions and, thus, the type and intensification of cultivated land use [48,49]. Therefore, the LSI, in addition to PD, was selected for the construction of the comprehensive index, i.e., the CLFI. The specific index construction methods are detailed in Section 2.3.
2.2. Land-Cover Data
The 30 m annual land-cover dataset of China produced by Yang and Huang [35] was the first fine-resolution annual land-cover dataset for China produced using observational images, which contained the 30 m annual land cover and its dynamics from 1985 to 2020. This dataset was extracted from more than 300,000 Landsat images on the Google Earth Engine (GEE) and contained nine land-cover types, which were available for free at https://zenodo.org (accessed on 5 January 2022). The overall accuracy of this dataset in China (79.31%) outperforms that of many world-scale land-use datasets, such as MCD12Q1 and GlobaLand30 [35]. Considering the high accessibility, relatively high spatial resolution and long time series, this dataset provides possibilities for the analysis of spatial and temporal changes in the area and fragmentation of cultivated land in China and was therefore chosen as the data source for this study.
2.3. Characterization of Cropland Area and Fragmentation and Their Changes
Spatial land-cover data were analyzed at the county-level scale and for agricultural regions (Figure 1). The calculation of the cultivated land area (CA) and fragmentation index, including the PD and LSI, was mainly performed using FRAGSTATS software [50]. The natural breakpoint method was applied to group the CA, PD, LSI and CLFI of each county in the analysis of the spatial distribution of the above indices in 2020 (Figure 2a–c). As mentioned in Section 2.1, the CLFI is the integrated landscape fragmentation index coupling the PD and LSI, whose calculation formulas are shown as follows:
where CLFIi refers to the coupling land fragmentation index of the PD and LSI in county i. A higher value of CLFI represents a higher coupling degree, higher values of PD and LSI, and thus a high landscape fragmentation of cultivated land. PDi and LSIi are the standard scores of the PD and LSI in county i, which can be obtained using Formulas (2)–(5), where and refer to the PD and LSI in county i; N and refer to the total patch number and the total length of all patch boundaries of cultivated land in county i.
When comparing the landscape fragmentation of cultivated land between agricultural regions in 2020, the mean values of the PD, LSI and CLFI in each agricultural region were first divided by the national mean values, and the differences between each indicator of agricultural regions and the national mean were analyzed according to the quotient of the division (Figure 2d).
The trends of cultivated land area and landscape fragmentation in China during 2000–2020 were assessed mainly based on the changes in two indices, namely, the CA and CLFI, from 2000 to 2010 and from 2010 to 2020. Specifically, at the national scale, a histogram-based method was used to measure the distribution of the CA and CLFI changes, where the bin width was determined using the Freedman–Diaconis rule with the following equation [28]:
where BW is the bin width of the CA or CLFI, IQR is the interquartile range of the CA or CLFI and N is the number of counties in China, equal to 2825. Specifically, the BW values for the CA and CLFI obtained from the above formula were 2.0% and 2.5%, respectively. Therefore, a CA change between −2.0% and 2.0% in a county can be considered stable, while a CA change above 2.0% or below −2.0% is classified as an increase or decrease in total cultivated land area, respectively. The CLFI change can be grouped in a similar scheme, but the corresponding threshold should be changed to ±2.5%. Subsequently, counties across the country can be classified into eleven bands according to the change in CA or CLFI. Here, for the CA changes, we considered the three groups with the largest and smallest change rates as the large increase groups and the large decrease groups, respectively, and the CA change rates for counties in these groups were ≥10% and <−10%, respectively; for the CLFI changes, the CLFI change rates for counties in the large increase groups and the large decrease groups were no less than 12.5% and no more than −12.5%, respectively.
When comparing the trend of CA changes in a county during 2000–2020, nine scenarios occurred depending on the difference in the direction of change for the two time periods, i.e., 2000–2010 and 2010–2020. However, there were six scenarios where the number of counties appeared to be more than 5% of the total number of counties, i.e., continuous increase during the two time periods (1I2I); first increase then decrease (1I2D), first stable then decrease (1C2D), first decrease then increase (1D2I), first decrease then stable (1D2C) and continuous decrease (1D2D), and the number of relevant counties was close to 90% of the total number of counties (2825). The situation was roughly similar for the CLFI changes.
2.4. Causes of Changes in Cultivated Land Area and Fragmentation in China
The area of transfer between land-use types was calculated to find possible causes for the change in cultivated land area and fragmentation. The land-use transfer matrix was first constructed, from which the land-use types and specific areas of cultivated land transferred in and out were identified, and their ratios to the area of cultivated land in the initial year were calculated. It should be pointed out that the analysis focused on the changes in land-use types with ratios exceeding 5% within each agricultural region.
3. Results
3.1. Spatial Variation in Cultivated Land Area and Fragmentation in 2020
Cultivated land was unevenly distributed among counties in China, with the total CA of the 20% of counties with the smallest CA accounting for only 3.24% of the total CA nationwide, while the total CA of the 20% of counties with the largest CA accounted for more than one-third (34.70%) (Figure 3). In terms of the spatial distribution, the CAs of counties in China roughly showed a distribution pattern of large in the north and small in the south. Specifically, the counties with a larger CAs were mainly distributed in the NER, the GXR, the southern HHH, the northern YRR and the central SWR; compared with them, the CAs of counties in the SER, the LPR, the TPR, the western SWR, and the eastern and southern parts of the YRR were relatively small (Figure 1). From the perspective of agricultural regions, the YRR, SWR and HHH had the largest total CA, while the GXR, IMR and TPR had relatively small total cultivated areas (Figure 1).
The distribution patterns of cultivated land fragmentation indices were not consistent with those of CA. Specifically, the relatively high-value counties in terms of PD (>3.28) were concentrated in the LPR and SWR, and the PD values in other regions were relatively low (Figure 2a). For the LSI, in addition to the LPR and SWR, the high-value counties were concentrated in the IMR, TPR and YRR, and only the central counties of the HHH and NER had relatively low LSI values (Figure 2b). As a coupling indicator of the PD and LSI, the high-value counties of the CLFI were mainly located in the strip area along the northwest of the NER—east of the IMR—the LPR—the SWR—west of the SER, as well as the southern YRR and eastern SER, while the CLFI of the counties in the remaining areas was relatively small (Figure 2c). In general, two-thirds of the counties (68.71%) had CLFI values between 0.13 and 0.31, and the ratios of counties with severely fragmented (CLFI > 0.31) and mildly fragmented (CLFI < 0.13) cultivated land to the total number of counties in China were within 20% (Figure 3). From the perspective of the agricultural regions, the SWR, IMR, SER and LPR had higher values of each indicator of cultivated land fragmentation than the national average, the values of each indicator in the YRR were basically the same as the national average, the values in the HHH and NER were slightly lower than the national average, and the GXR and TPR were the two regions with the lowest levels of cultivated land fragmentation, among which, the values of each indicator of cultivated land fragmentation in the TPR were much lower than the national average (Figure 2d).
Overall, a roughly inverse distribution relationship was obtained between the spatial distribution of CA and the CLFI at the county level. That is, counties with a larger CA, such as those distributed in the NER, GXR and central SWR, tended to have lower CLFI values; conversely, counties with a smaller CA, such as those distributed in the SER, the western SWR, and the eastern and southern parts of the YRR, mostly had higher CLFI values.
3.2. Changes in Cultivated Land Area and Fragmentation from 2000 to 2020
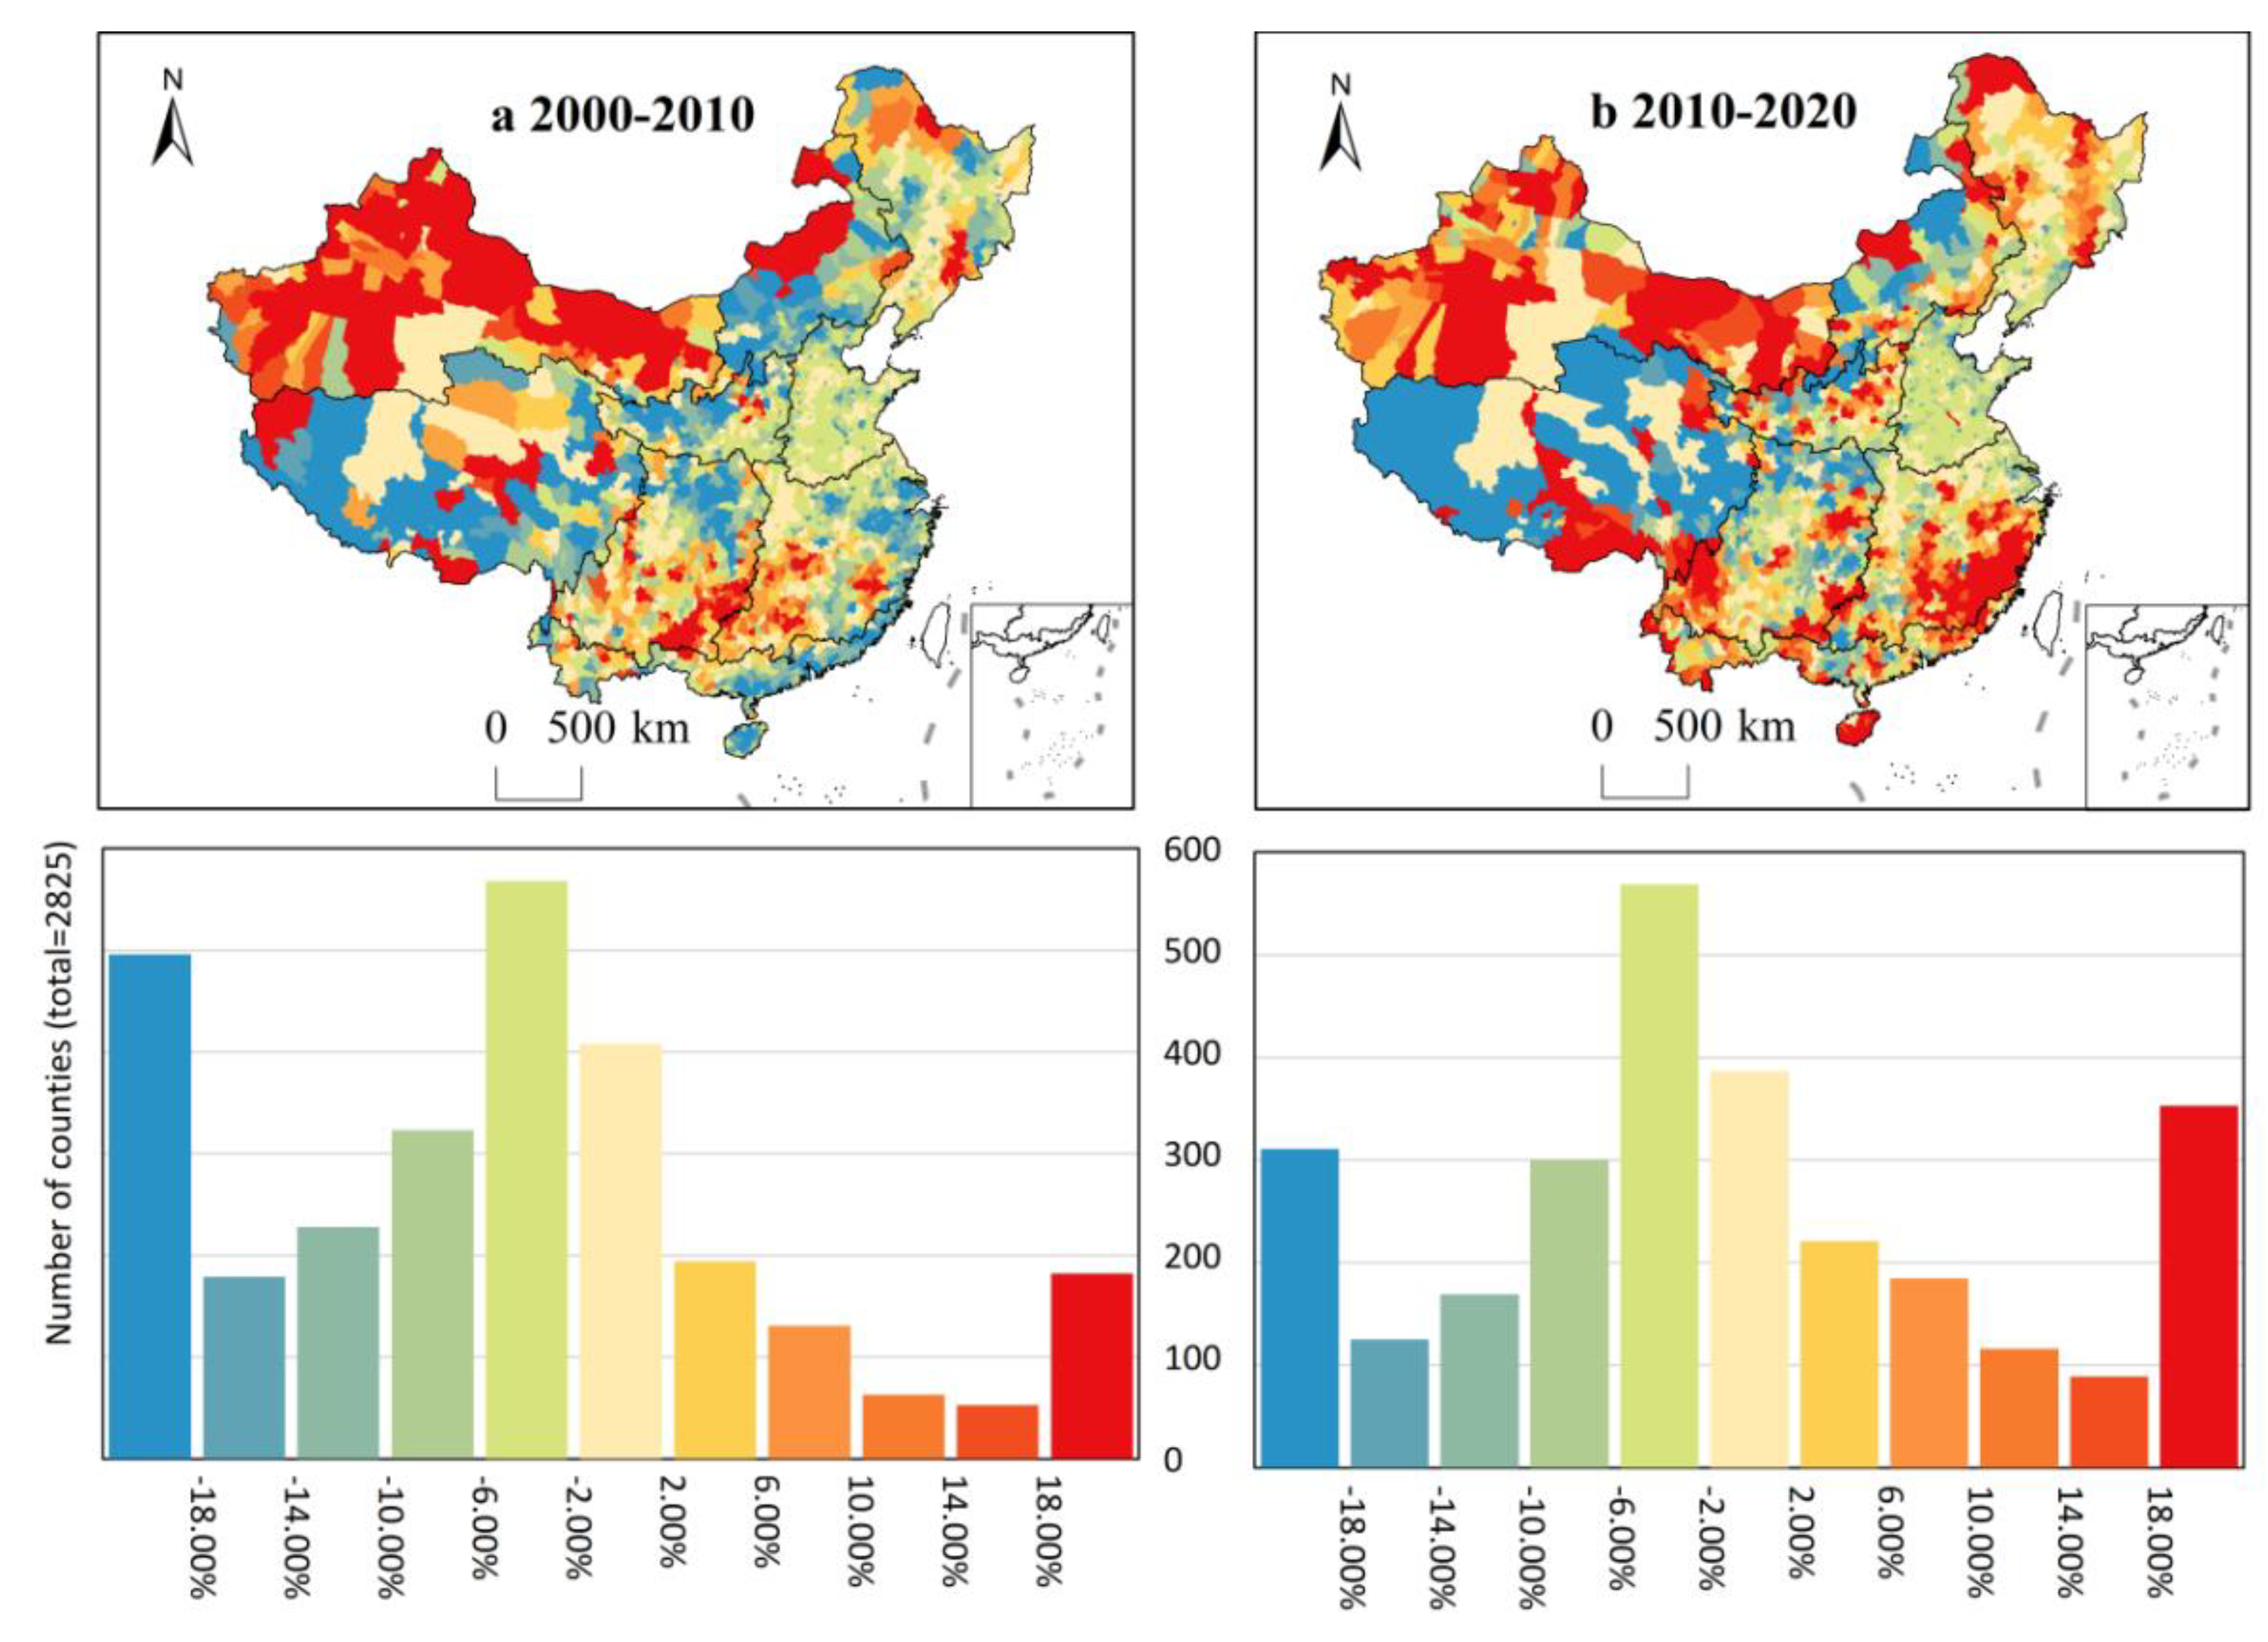
The CA of China decreased from 2000 to 2020, but the rate of reduction decreased from 2.91% in 2000–2010 to 0.41% in 2010–2020. Specifically, from 2000–2010, only 10.55% (298/2825) of the counties had a large increase rate in CA (≥10%), mainly in the GXR, northern NER, southern SWR and western YRR; however, from 2010–2020, this proportion increased to 19.75% (558/2825) and the relevant counties were more widely distributed. Additional areas were concentrated in the NER, southeastern part of the YRR, central and eastern parts of the LPR, southern part of the TPR and western part of the SER (Figure 4). The number of counties with a large decrease rate in CA (<−10%) was larger than that of the counties with a large increase rate in both periods. From 2000 to 2020, the proportion of counties with a large decrease rate in CA reached 31.96% (903/2825), mainly in the NER, IMR, TPR, western LPR, northern SWR, eastern YRR and SER, while from 2010 to 2020, the proportion of counties with a large CA reduction decreased to 21.42% (605/2825) and contracted spatially, mainly in the IMR and the northern parts of the LPR, TPR and SWR (Figure 4).
The CLFI of China continued to increase from 2000 to 2020, but the rate of increase decreased from 4.06% in 2000–2010 to 0.51% in 2010–2020. The proportion of counties in the large increase groups (with a large CLFI increase rate ≥12.5%) decreased from 21.95% (620/2825) in 2000–2010 to 16.53% (467/2825) in 2010–2020. In both periods, the proportion of counties in the large-decrease groups (with a large decrease in CLFI rate <−12.5%) was smaller than that of counties in the large-increase groups, with values of 17.84% and 14.44%, respectively (Figure 5). Compared with the spatial distribution of CA changes, the spatial characteristics of counties with large CLFI changes were roughly inversely distributed. Specifically, from 2000 to 2010, the spatial layout of counties with a large decrease in the CLFI rate (<−12.5%) was roughly consistent with the layout of counties with a large increase in CA (≥10%), which were distributed in the GXR, northern NER, southern SWR, western YRR, LPR and TPR, while the counties with a large increase in the CLFI (≥12.5%) were mainly distributed in the HHH, central NER, northern SWR, eastern SER and YRR, with most of them showing a decreasing trend in CA (Figure 5a). From 2010–2020, the counties with a large CLFI increase rate shrank in the eastern YRR and the overall distribution was more dispersed; additionally, the counties with a large decrease rate were more concentrated in the three regions of IMR, LPR and TPR. This inverse difference between the spatial distribution of the CLFI change and CA change was not as pronounced in 2010–2020 as it was for 2000–2010 and was retained only in the HHH, northeastern YRR, central NER and western SWR (Figure 5b).
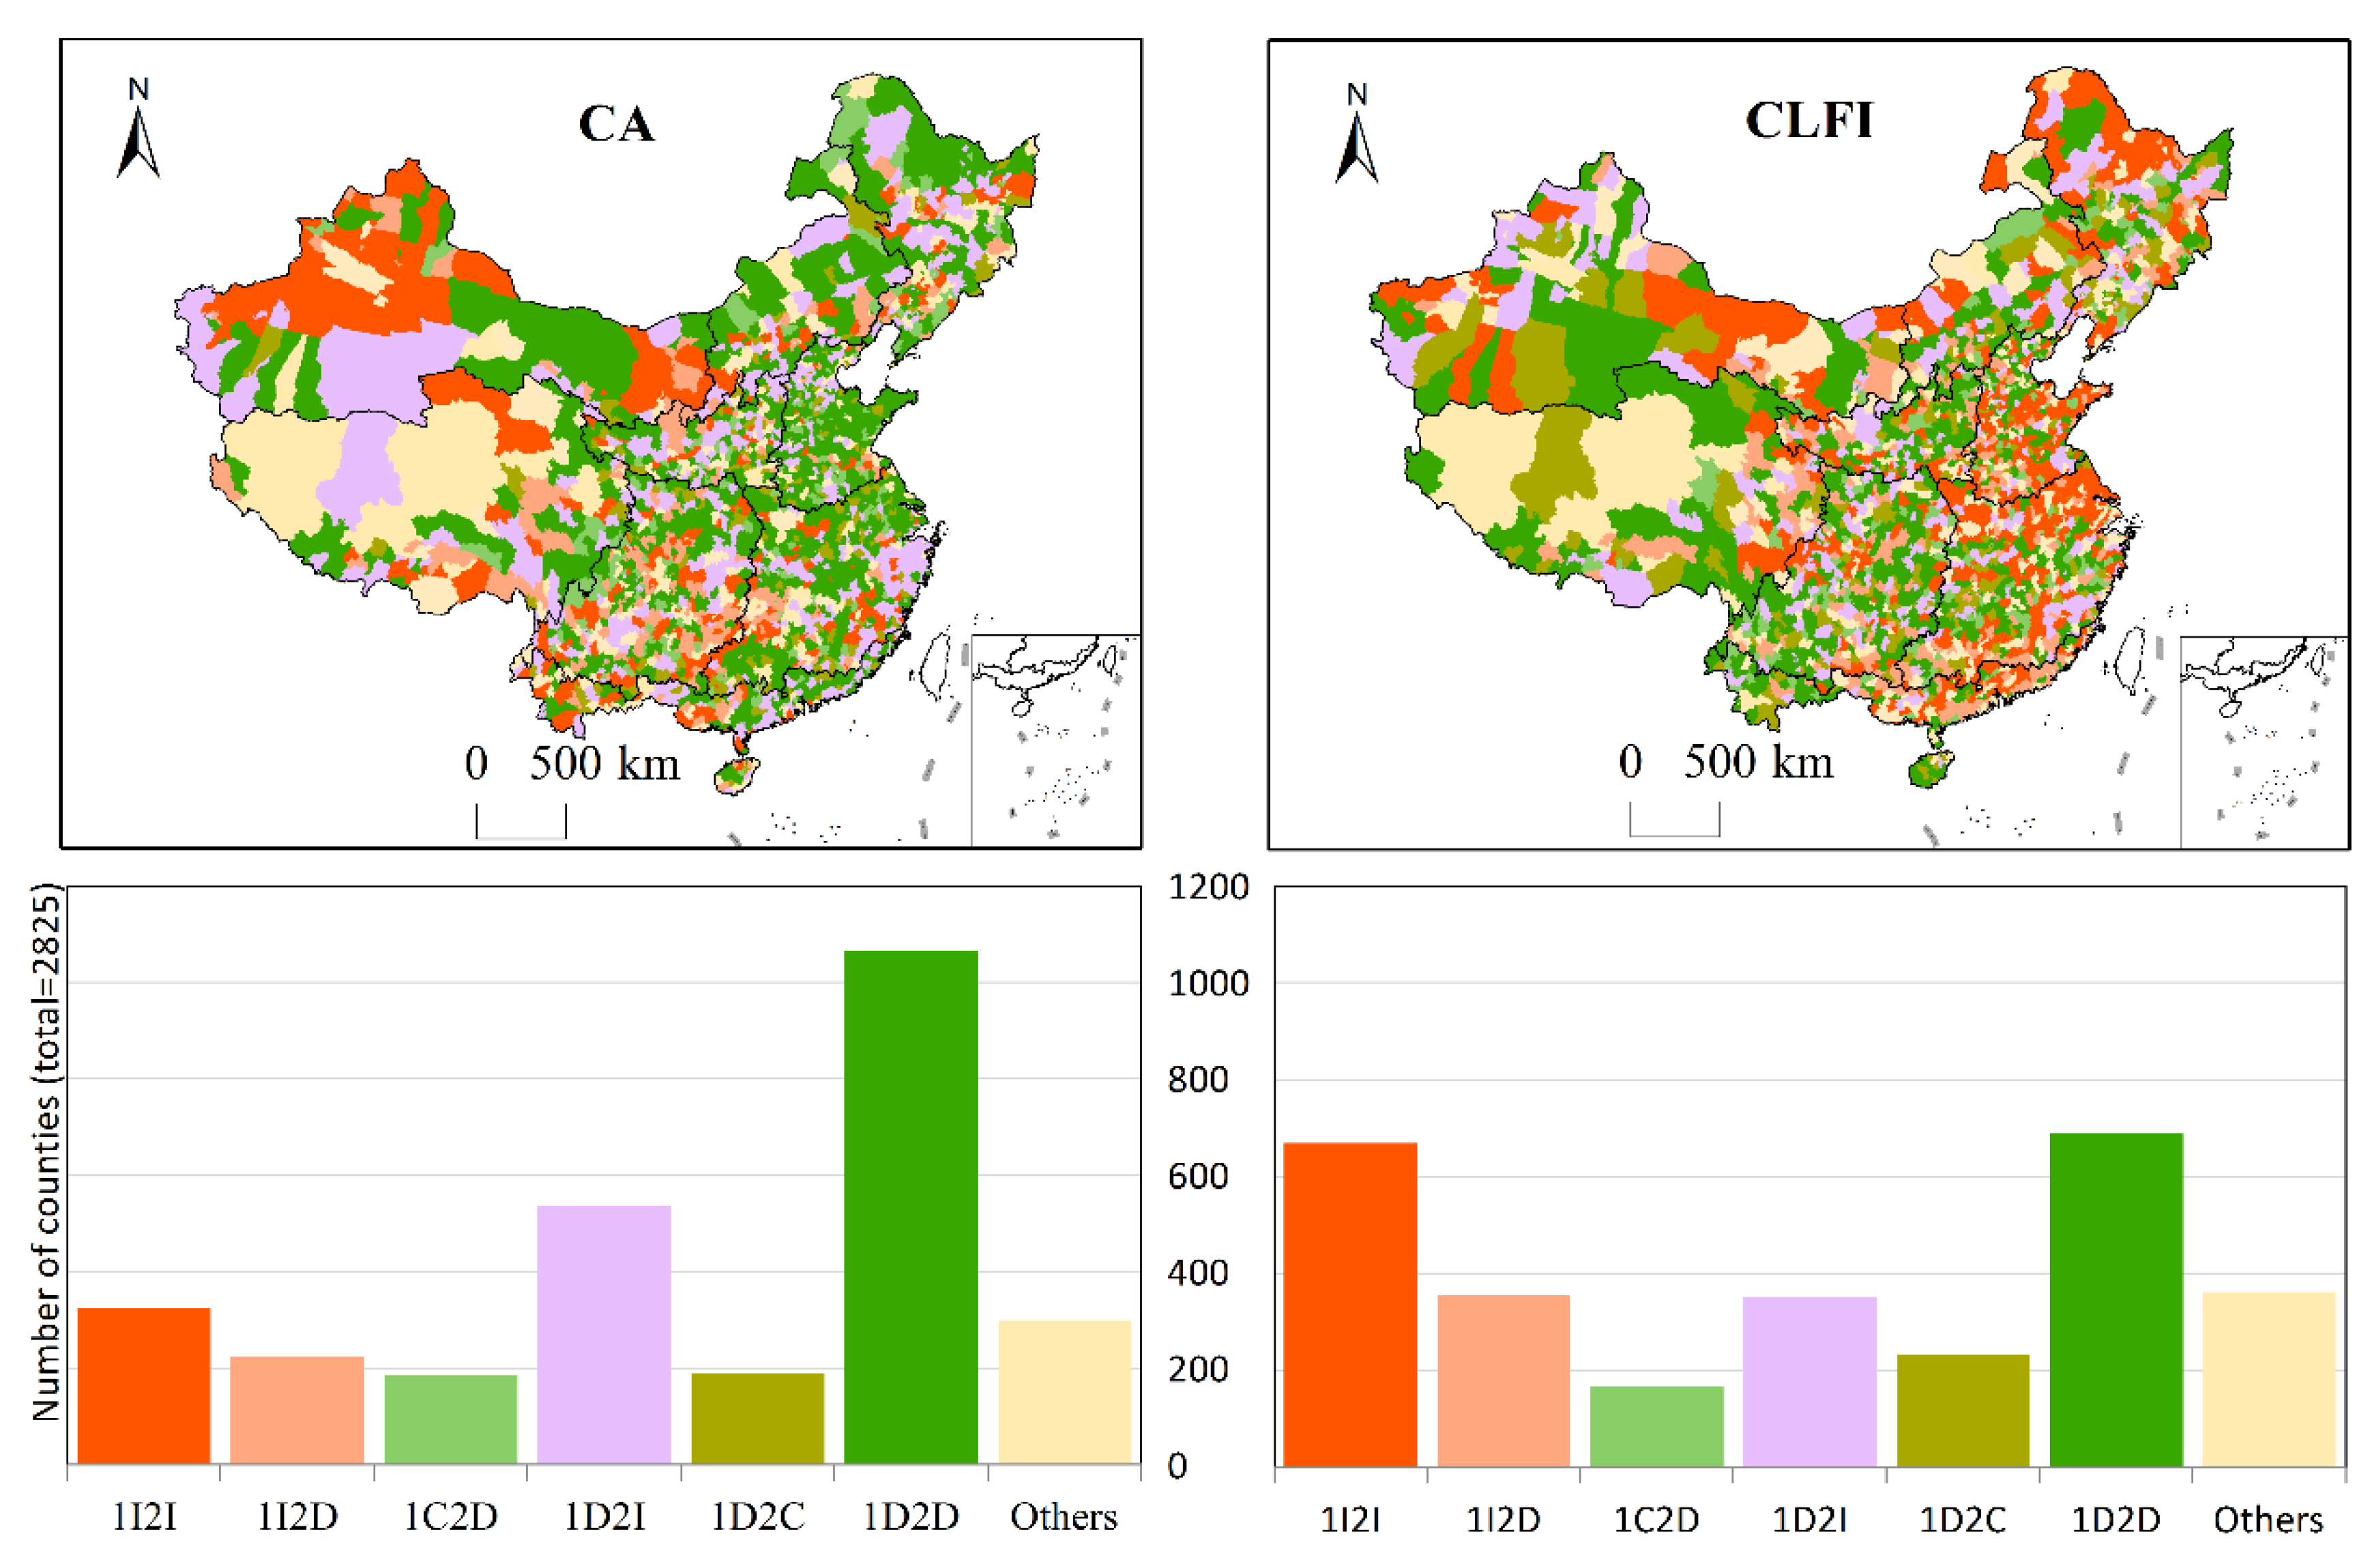
The spatial distribution of the counties in each group based on the CA change and the counties in each group based on the CLFI change showed roughly inverse distribution patterns (Figure 6). Specifically, for the CA changes, the largest proportion of 1D2D-type counties was concentrated in the HHH, YRR, northern NER and southern SER (and scattered in the other districts), while for the CLFI changes, 1I2I-type counties had the second largest proportion and the distribution pattern was roughly consistent with the counties showing 1D2D-type CA changes. Regarding the CLFI changes, the largest proportions of 1D2D-type counties were mainly scattered in the SWR, YRR, western GXR and SER, which was consistent with the spatial distribution of counties experiencing 1I2I regarding the CA. Compared with the abovementioned county groups, the spatial distribution of counties in the other groups was more discrete and the inverse distribution relationship between them was less obvious.
3.3. Major Causes of Changes in Cultivated Land Area and Fragmentation in China
From 2000 to 2020, the change trends of the CA and CLFI in different agricultural regions were not the same, and the causes were also different.
(1) In the HHH, each county had a relatively small CA and low CLFI, but from 2000 to 2020, the CA continued to decrease, while the CLFI continued to increase; additionally, urban expansion occupied cultivated land, which was the main cause for the decrease in CA and increase in CLFI (Figure 7).
(2) In the SWR, the CA of counties was relatively small and the CLFI was relatively high. From 2000 to 2020, the three types of changes in CA were mainly 1D2D, 1I2D and 1I2I, while the proportion of counties with a continuously decreasing CLFI (1D2D) was the highest. According to Figure 7, the transfer-in and transfer-out areas between cultivated land and forest accounted for a relatively high proportion of the total change area. Therefore, the conversion of cultivated land to forest was the main cause for the decrease in CA, while land development and consolidation may have been the main reasons for the increase in CA. During the abovementioned changes, the decreasing cultivated land plots were mainly those with a higher CLFI, while the increase was mainly for the large-scale and more regular plots [48,51,52]; thus, the overall CLFI decreased.
(3) The YRR and SER counties had a smaller CA but a relatively higher CLFI. From 2000 to 2020, the CA of each county was dominated by two types of changes, namely, 1D2D and 1D2I, while the CLFI in each county was dominated by 1I2I, 1D2D and 1D2I. The occupation of cultivated land by urban expansion should be the main cause for the continuous decrease in CA and the continuous increase in the CLFI, while engineering measures, such as returning cultivated land to forest and land consolidation, may have been the main reasons for the increase in CA and the decrease in the CLFI, especially in the southeastern counties of YRR and SER from 2010 to 2020 [53,54].
(4) The counties of GXR and NER had relatively large CAs and low CLFIs. From 2000 to 2020, the CA in the GXR counties continued to increase, while the CLFI in each county generally first decreased and then increased or continued to decrease. In the NER counties, the CA mainly decreased first and then increased or continued to decrease, while the CLFI first increased and then decreased or continued to decrease. The expansion of cultivated land to grassland was the main cause for the increase in the CA of the GXR, but the newly added land may have also had a high degree of fragmentation, which was most obvious in the central region [55,56]. In the NER, the occupation of cultivated land by urban expansion and the conversion of cultivated land to forest led to the reduction in CA and the increase in the CLFI [57]. However, from 2010 to 2020, land development was dominated by large-scale land reclamation, which led to the expansion of cultivated land into forest and grassland [56,58]. As a result, the CA increased and the CLFI decreased mainly in the central counties of the NER (Figure 7).
(5) In the LPR and IMR, the counties had a smaller CA and a relatively higher CLFI. From 2000 to 2020, the CA in the LPR and IMR counties continued to decrease or first decreased and then increased, while the CLFI continued to decrease. According to Figure 7, the project of returning farmland to forest and grassland, as well as farmland abandonment, were the main reasons for the reduction in the CA in each county [59,60,61]. The decrease in the CA caused by the above reasons mainly occurred in relatively fragmented plots; therefore, the CLFI continued to decrease. However, from 2010 to 2020, land development and consolidation projects turned a large number of forests and grasslands into cultivated land; therefore, the CA increased and the CLFI continued to decline.
4. Discussion
4.1. Policy Implications
In the past 20 years, China’s total CA has continued to decrease and the CLFI of cultivated land has been increasing. Therefore, a more stringent cultivated land protection system should continue to be implemented in the future and land transfer should be vigorously promoted to facilitate the large-scale use of cultivated land. Considering that there are significant differences in the CA and CLFI, as well as in their change trends in different agricultural regions, the implementation of relevant conservation measures and policies should be tailored to local conditions, and more targeted policies and proposals should be formulated for the actual situation of each region. The specific recommendations for each agricultural zone are listed below.
In the HHH, YRR, SER and NER, the occupation of cultivated land by construction land was the main cause for the decrease in the CA and the increase in the CLFI. This should be the key implementation area for seriously protecting cultivated land, and the non-agricultural occupation of cultivated land should be strictly limited [24,63]. Additionally, land development and consolidation had positive roles in the increase in the CA and the decline in the CLFI in some regions, especially in the southeastern part of the YRR. In the future, attention should be given to the maintenance of relevant project implementation effects and to strengthen remote monitoring in relevant areas to avoid scenarios of newly reclaimed or consolidated cultivated land being abandoned [64].
The GXR and NER were the regions where newly cultivated land was concentrated in China. However, most of the newly added cultivated land in some areas, such as the central part of the GXR and the northern part of the NER, was dominated by fragmented plots. Therefore, more attention should be given to the planning of different land-use types to strengthen the standardization of land development and the construction of supporting facilities in the abovementioned areas to reduce the fragmentation of newly added cultivated land, and to improve the quality and utilization efficiency of cultivated land [65].
The CLFIs in the SWR, LPR and IMR were relatively high, but they decreased overall during the study period due to the implementation of ecological protection projects, such as the Sloping Land Conversion Project (SLCP). In addition, the active abandonment of households may have been one of the major causes for the decrease in the CA and the increase in the CLFI in the abovementioned regions [61,66]. Therefore, in the future, we should focus on strengthening the monitoring and maintenance of ecological protection results; furthermore, we should promote the cultivation of land markets and new farmers, as well as promote land transfer to reduce the fragmentation of cultivated land, effectively reduce the abandonment rate and realize the rational use of abandoned land [67,68].
The ecological environment of the TPR is highly fragile and the risk of degradation of newly reclaimed farmland is therefore high. Therefore, it is necessary to protect cultivated land according to local conditions, strengthen the construction of windbreak and sand fixation projects on cultivated land and surrounding grasslands, and avoid the excessive utilization of cultivated land [69].
4.2. Uncertainty and Limitations
In this study, considering the spatial and temporal resolutions, the data accessibility and the reliability of the data, the 30 m annual land-cover dataset of China produced by Yang and Huang [35] was selected, and two indicators, namely, CA and CLFI, were applied to analyze the area and fragmentation of China’s cultivated land cover and their changes, respectively. The results from 2000 to 2010 showed that the area of China’s cultivated land decreased while the degree of fragmentation increased, which was consistent with the changes in cultivated land in China during the same period obtained by Yu er al. [28] using GLC30 data. This result indicated that the results of this study had a high degree of confidence. However, it should be noted that although the 30 m resolution was the highest spatial resolution among the available long time series of Chinese land-use data, there may be a risk of underestimating the degree of fragmentation due to the high degree of overall fragmentation of Chinese cultivated land, and this underestimation may be more pronounced in mountainous areas. Therefore, in future studies related to the landscape fragmentation of cultivated land in China, it is recommended that land-use data that are obtained from higher-resolution remote sensing images, such as Sentinel images, are used to more accurately identify the degree of landscape fragmentation of cultivated land and its changes [70,71].
The main limitation of this study was in relation to the causes of CA and CLFI changes across China. Considering that the focus of this study was to describe the distribution and changes in cultivated land area and fragmentation in China, only the land transfer situation was considered to analyze the direct causes for the changes in the CA and CLFI, and policy recommendations were put forward accordingly. Other factors, such as natural resource characteristics and policies [44,46], were not included in the scope of this study. Therefore, the proposed policy recommendations may be incomplete. Furthermore, better use of ecosystem services, such as the wide terraces built in mountainous areas to reduce soil erosion, can also mitigate land fragmentation, but these measures were not adequately considered in this study. In the future, on the basis of this research, we will consider all possible factors of CA change and CLFI change and put forward improved cultivated land protection and large-scale utilization suggestions, including not only policy measures but also engineering measures, such as better use of ecosystem services.
5. Conclusions
By identifying the change patterns of cultivated land area and fragmentation across the country, the results can provide a data basis and scientific support for policy formulation related to cultivated land protection and large-scale utilization in China, where this information is crucial for ensuring food security. Combining the 30 m annual land-cover dataset of China and the coupled analysis method, we constructed a coupling landscape fragmentation index (i.e., the CLFI) and analyzed the spatial distribution patterns of cultivated land area (CA) and the CLFI at the county level in China. Additionally, we characterized the changes in the CA and CLFI from 2000 to 2020. The results showed that the total CA in China’s counties roughly showed a pattern of being large in the north and small in the south, while the areas with high CLFI values were mainly concentrated in the strip area along the northwest of the NER—east of the IMR—the LPR—the SWR—west of the SER, as well as in the southeast. From 2000 to 2020, the total CA of China decreased, but the reduction rate decreased from 2.91% in 2000–2010 to 0.41% in 2010–2020; in contrast, the overall CLFI of China showed an increasing trend, but the increase rate also decreased, from 4.06% in 2000–2010 to 0.51% in 2010–2020. Spatially, the changes in the CA and CLFI at the county level showed roughly inverse distribution patterns, and they were more significant during 2000–2010. Specifically, from 2000 to 2010, the concentrated areas of counties with a large increase rate in CA (≥10%) and those with a large decrease rate in the CLFI (<−12.5%) were more consistent in space and mainly distributed in the GXR, northern NER, southern SWR and western YRR; additionally, both counties with a large decrease rate in CA (<−10%) and those with a large increase rate in the CLFI (≥12.5%) were mainly distributed in the HHH, NER, northern SWR, eastern SER and YRR. From 2010 to 2020, this reverse distribution pattern became less obvious; specifically, the spatial extent of counties with a large increase rate in CA expanded toward the LPR and southeastern YRR, while counties with a large increase rate in the CLFI contracted significantly in the eastern YRR and NER.
Urban expansion, ecological protection policies, such as the SLCP, and land development and consolidation programs were the major causes of changes in the CA and CLFI across China. However, there was some heterogeneity in the dominant causes in different agricultural regions. Therefore, appropriate policies related to the protection, fragmentation reduction and large-scale utilization of cultivated land should be formulated according to regional realities. In the future, a more comprehensive analysis of the drivers affecting changes in cultivated land area and fragmentation is still needed to put forward more reasonable suggestions for cultivated land protection and large-scale utilization.
Overall, this study not only provides relevant policy recommendations for national cultivated land conservation, sustainable use and food security but also provides methodological references for other related studies. It should be noted that studies on changes in cultivated land area and landscape fragmentation based on medium- and high-resolution land-use data are more applicable in countries or regions with a high proportion of plains.
Funding
This research was funded by the National Natural Science Foundation of China, grant numbers 42171264 and 41930757.
Institutional Review Board Statement
Not applicable.
Informed Consent Statement
Not applicable.
Data Availability Statement
Not applicable.
Conflicts of Interest
The authors declare no conflict of interest.
References
- Vallejo, M.; Ramírez, M.I.; Reyes-González, A.; López-Sánchez, J.; Casas, A. Agroforestry Systems of the Tehuacán-Cuicatlán Valley: Land Use for Biocultural Diversity Conservation. Land 2019, 8, 24. [Google Scholar] [CrossRef] [Green Version]
- Folberth, C.; Khabarov, N.; Balkovič, J.; Skalský, R.; Visconti, P.; Ciais, P.; Janssens, I.A.; Peñuelas, J.; Obersteiner, M. The global cropland-sparing potential of high-yield farming. Nat. Sustain. 2020, 3, 281–289. [Google Scholar] [CrossRef]
- Gomes, E.; Inácio, M.; Bogdzevič, K.; Kalinauskas, M.; Karnauskaitė, D.; Pereira, P. Future land use changes and its impacts on terrestrial Ecosystem services: A review. Sci. Total Environ. 2021, 781, 146716. [Google Scholar] [CrossRef] [PubMed]
- Wei, L.; Luo, Y.; Wang, M.; Su, S.; Pi, J.; Li, G. Essential fragmentation metrics for agricultural policies: Linking landscape pattern, ecosystem service and land use management in urbanizing China. Agric. Syst. 2020, 182, 102833. [Google Scholar] [CrossRef]
- Sasaki, K.; Hotes, S.; Ichinose, T.; Doko, T.; Wolters, V. Hotspots of Agricultural Ecosystem Services and Farmland Biodiversity Overlap with Areas at Risk of Land Abandonment in Japan. Land 2021, 10, 1031. [Google Scholar] [CrossRef]
- Firbank, L.; Bradbury, R.B.; McCracken, D.I.; Stoate, C. Delivering multiple ecosystem services from Enclosed Farmland in the UK. Agric. Ecosyst. Environ. 2013, 166, 65–75. [Google Scholar] [CrossRef]
- Zeng, Z.; Estes, L.; Ziegler, A.D.; Chen, A.; Searchinger, T.; Hua, F.; Guan, K.; Jintrawet, A.F.; Wood, E. Highland cropland expansion and forest loss in Southeast Asia in the twenty-first century. Nat. Geosci. 2018, 11, 556–562. [Google Scholar] [CrossRef]
- Bratley, K.; Ghoneim, E. Modeling Urban Encroachment on the Agricultural Land of the Eastern Nile Delta Using Remote Sensing and a GIS-Based Markov Chain Model. Land 2018, 7, 114. [Google Scholar] [CrossRef] [Green Version]
- Liu, X.; Huang, Y.; Xu, X.; Li, X.; Li, X.; Ciais, P.; Lin, P.; Gong, K.; Ziegler, A.D.; Chen, A.; et al. High-spatiotemporal-resolution mapping of global urban change from 1985 to 2015. Nat. Sustain. 2020, 3, 564–570. [Google Scholar] [CrossRef]
- Pandey, B.; Zhang, Q.; Seto, K.C. Time series analysis of satellite data to characterize multiple land use transitions: A case study of urban growth and agricultural land loss in India. J. Land Use Sci. 2018, 13, 221–237. [Google Scholar] [CrossRef]
- Nguyen, Q.; Kim, D.-C. Reconsidering rural land use and livelihood transition under the pressure of urbanization in Vietnam: A case study of Hanoi. Land Use Policy 2020, 99, 104896. [Google Scholar] [CrossRef]
- Ricciardi, V.; Mehrabi, Z.; Wittman, H.; James, D.; Ramankutty, N. Higher yields and more biodiversity on smaller farms. Nat. Sustain. 2021, 4, 651–657. [Google Scholar] [CrossRef]
- Muchová, Z.; Jusková, K. Stakeholders’ perception of defragmentation of new plots in a land consolidation project: Given the surprisingly different Slovak and Czech approaches. Land Use Policy 2017, 66, 356–363. [Google Scholar] [CrossRef]
- Tran, T.Q.; Vu, H.V. Land fragmentation and household income: First evidence from rural Vietnam. Land Use Policy 2019, 89, 104247. [Google Scholar] [CrossRef]
- McDonald, R.I.; Güneralp, B.; Huang, C.-W.; Seto, K.C.; You, M. Conservation priorities to protect vertebrate endemics from global urban expansion. Biol. Conserv. 2018, 224, 290–299. [Google Scholar] [CrossRef]
- Osumanu, I.K.; Ayamdoo, E.A. Has the growth of cities in Ghana anything to do with reduction in farm size and food production in peri-urban areas? A study of Bolgatanga Municipality. Land Use Policy 2022, 112, 105843. [Google Scholar] [CrossRef]
- Tran, T.Q.; Vu, H. The impact of land fragmentation on food security in the North Central Coast, Vietnam. Asia Pac. Policy Stud. 2021, 8, 327–345. [Google Scholar] [CrossRef]
- Teshome, A.; de Graaff, J.; Ritsema, C.; Kassie, M. Farmers’ Perceptions about the Influence of Land Quality, Land Fragmentation and Tenure Systems on Sustainable Land Management in the North Western Ethiopian Highlands. Land Degrad. Dev. 2016, 27, 884–898. [Google Scholar] [CrossRef]
- Cui, Z.; Zhang, H.; Chen, X.; Zhang, C.; Ma, W.; Huang, C.; Zhang, W.; Mi, G.; Miao, Y.; Li, X.; et al. Pursuing sustainable productivity with millions of smallholder farmers. Nature 2018, 555, 363–366. [Google Scholar] [CrossRef]
- Zuo, L.; Zhang, Z.; Carlson, K.M.; MacDonald, G.K.; Brauman, K.A.; Liu, Y.; Zhang, W.; Zhang, H.; Wu, W.; Zhao, X.; et al. Progress towards sustainable intensification in China challenged by land-use change. Nat. Sustain. 2018, 1, 304–313. [Google Scholar] [CrossRef]
- Liu, J.; Kuang, W.; Zhang, Z.; Xu, X. Spatiotemporal characteristics, patterns and causes of land use changes in China since the late 1980s. Acta Geogr. Sin. 2014, 69, 3–14. (In Chinese) [Google Scholar] [CrossRef]
- Liu, J.; Ning, J.; Kuang, W.; Xu, X.; Zhang, S.; Yan, C.; Li, R.; Wu, S.; Hu, Y.; Du, G.; et al. Spatio-temporal patterns and characteristics of land-use change in China during 2010–2015. Acta Geogr. Sin. 2018, 73, 789–802. (In Chinese) [Google Scholar]
- Kong, X. China must protect high-quality arable land. Nature 2014, 506, 7. [Google Scholar] [CrossRef] [PubMed]
- Zhou, Y.; Li, X.; Liu, Y. Cultivated land protection and rational use in China. Land Use Policy 2021, 106, 105454. [Google Scholar] [CrossRef]
- Duan, J.; Ren, C.; Wang, S.; Zhang, X.; Reis, S.; Xu, J.; Gu, B. Consolidation of agricultural land can contribute to agricultural sustainability in China. Nat. Food 2021, 2, 1014–1022. [Google Scholar] [CrossRef]
- Abera, W.; Assen, M.; Budds, J. Determinants of agricultural land management practices among smallholder farmers in the Wanka watershed, northwestern highlands of EthiopiaI. Land Use Policy 2020, 99, 104841. [Google Scholar] [CrossRef]
- Gautam, M.; Ahmed, M. Too small to be beautiful? The farm size and productivity relationship in Bangladesh. Food Policy 2019, 84, 165–175. [Google Scholar] [CrossRef] [Green Version]
- Yu, Q.; Hu, Q.; van Vliet, J.; Verburg, P.H.; Wu, W. GlobeLand30 shows little cropland area loss but greater fragmentation in China. Int. J. Appl. Earth Obs. Geoinf. 2018, 66, 37–45. [Google Scholar] [CrossRef]
- Lu, H.; Xie, H.; He, Y.; Wu, Z.; Zhang, X. Assessing the impacts of land fragmentation and plot size on yields and costs: A translog production model and cost function approach. Agric. Syst. 2018, 161, 81–88. [Google Scholar] [CrossRef]
- Kennedy, C.M.; Hawthorne, P.L.; Miteva, D.A.; Baumgarten, L.; Sochi, K.; Matsumoto, M.; Evans, J.S.; Polasky, S.; Hamel, P.; Vieira, E.M.; et al. Optimizing land use decision-making to sustain Brazilian agricultural profits, biodiversity and ecosystem services. Biol. Conserv. 2016, 204, 221–230. [Google Scholar] [CrossRef] [Green Version]
- Decaens, T.; Martins, M.B.; Feijoo, A.; Oszwald, J.; Doledec, S.; Mathieu, J.; Arnaud de Sartre, X.; Bonilla, D.; Brown, G.G.; Cuellar Criollo, Y.A.; et al. Biodiversity loss along a gradient of deforestation in Amazonian agricultural landscapes. Conserv. Biol. 2018, 32, 1380–1391. [Google Scholar] [CrossRef] [PubMed] [Green Version]
- Xie, H.; Lu, H. Impact of land fragmentation and non-agricultural labor supply on circulation of agricultural land management rights. Land Use Policy 2017, 68, 355–364. [Google Scholar] [CrossRef]
- Song, M.; Wu, Y.; Chen, L. Does the land titling program promote rural housing land transfer in China? Evidence from household surveys in Hubei Province. Land Use Policy 2020, 97, 104701. [Google Scholar] [CrossRef]
- Wu, B.; Yuan, Q.; Yan, C.; Wang, Z.; YU, X.; Li, A.; Ma, R.; Huang, J.; Chen, J.; Chang, C.; et al. Land cover changes of China from 2000 to 2010. Quat. Sci. 2014, 34, 723–731. (In Chinese) [Google Scholar]
- Yang, J.; Huang, X. 30 m annual land cover and its dynamics in China from 1990 to 2019. Earth Syst. Sci. Data 2021, 13, 3907–3925. [Google Scholar] [CrossRef]
- Chen, J.; Chen, J.; Liao, A.; Cao, X.; Chen, L.; Chen, X.; He, C.; Han, G.; Peng, S.; Lu, M.; et al. Global land cover mapping at 30m resolution: A POK-based operational approach. ISPRS J. Photogramm. Remote Sens. 2015, 103, 7–27. [Google Scholar] [CrossRef] [Green Version]
- Yuan, C.; Zhang, D.; Liu, L.; Ye, J. Regional characteristics and spatial-temporal distribution of cultivated land change in China during 2009–2018. Trans. Chin. Soc. Agric. Eng. (Trans. CSAE) 2021, 37, 267–278. (In Chinese) [Google Scholar]
- Du, G.; Gai, Z.; Wang, H. Theoretical explanation and research framework of cultivated-land fragmentation in China. J. Earth Sci. Environ. 2021, 43, 997–1008. [Google Scholar]
- Cao, Y.; Zou, J.; Fang, X.; Wang, J.; Cao, Y.; Li, G. Effect of land tenure fragmentation on the decision-making and scale of agricultural land transfer in China. Land Use Policy 2020, 99, 104996. [Google Scholar] [CrossRef]
- Wang, X.; Li, X. Impacts of Land Fragmentation and Cropping System on the Productivity and Efficiency of Grain Producers in the North China Plain: Taking Cangxian County of Hebei Province as an Example. J. Resour. Ecol. 2020, 11, 580–588. [Google Scholar]
- Wang, Y.; Li, X.; Xin, L.; Tan, M.; Jiang, M. Spatiotemporal changes in Chinese land circulation between 2003 and 2013. J. Geogr. Sci. 2018, 28, 707–724. [Google Scholar] [CrossRef] [Green Version]
- Zhang, B.; Guo, F.; Huang, D.; Wang, H.; Niu, W.; Chen, H.; Kong, X.; Yun, W. Pattern and evaluation of land consolidation model for “One Household One Plot” and “One Village One Plot” to solve land fragmentation in Northern Shaanxi Province, China. Trans. Chin. Soc. Agric. Eng. (Trans. CSAE) 2020, 36, 28–36. (In Chinese) [Google Scholar]
- Liang, J.; Pan, S.; Chen, W.; Li, J.; Zhou, T. Cultivated Land Fragmentation and Its Influencing Factors Detection: A Case Study in Huaihe River Basin, China. Int. J. Environ. Res. Public Health 2021, 19, 138. [Google Scholar] [CrossRef] [PubMed]
- Xu, W.; Jin, X.; Liu, J.; Zhou, Y. Analysis of influencing factors of cultivated land fragmentation based on hierarchical linear model: A case study of Jiangsu Province, China. Land Use Policy 2021, 101, 105119. [Google Scholar] [CrossRef]
- Liu, L.; Duan, Y.; Xu, L.; Yuan, X. Characteristics and influencing factors of cultivated land fragmentation in Loess Hilly Region: A case study of Heshun County in Shanxi Province. Chin. Agric. Sci. Bull. 2021, 37, 90–96. (In Chinese) [Google Scholar]
- Liu, J.; Jin, X.; Xu, W.; Zhou, Y. Evolution of cultivated land fragmentation and its driving mechanism in rural development: A case study of Jiangsu Province. J. Rural. Stud. 2022, 91, 58–72. [Google Scholar] [CrossRef]
- Mcpherson, M.F. Land Fragmentation: A Selected Literature Review; Harvard University: Cambridge, MA, USA, 1982; p. 85. [Google Scholar]
- Li, S.; Li, X. Global understanding of farmland abandonment: A review and prospects. J. Geogr. Sci. 2017, 27, 1123–1150. [Google Scholar] [CrossRef]
- Su, S.; Hu, Y.n.; Luo, F.; Mai, G.; Wang, Y. Farmland fragmentation due to anthropogenic activity in rapidly developing region. Agric. Syst. 2014, 131, 87–93. [Google Scholar] [CrossRef]
- McGarigal, K.; Marks, B.J. FRAGSTATS: Spatial Pattern Analysis Program for Quantifying Landscape Structure; U.S. Department of Agriculture: Washington, DC, USA, 1995. [CrossRef]
- Yan, J.; Yang, Z.; Li, Z.; Li, X.; Xin, L.; Sun, L. Drivers of cropland abandonment in mountainous areas: A household decision model on farming scale in Southwest China. Land Use Policy 2016, 57, 459–469. [Google Scholar] [CrossRef] [Green Version]
- Shi, T.; Li, X.; Xin, L.; Xu, X. Analysis of farmland abandonment at parcel level: A case study in the mountainous area of China. Sustainability 2016, 8, 988. [Google Scholar] [CrossRef] [Green Version]
- Du, X.; Zhang, X.; Jin, X. Assessing the effectiveness of land consolidation for improving agricultural productivity in China. Land Use Policy 2018, 70, 360–367. [Google Scholar] [CrossRef]
- Zhang, Z.; Zhao, W.; Gu, X. Changes resulting from a land consolidation project (LCP) and its resource–environment effects: A case study in Tianmen City of Hubei Province, China. Land Use Policy 2014, 40, 74–82. [Google Scholar] [CrossRef]
- Chen, H.; Wu, S.; Feng, X. Study on the changes of cultivated land and the driving factors in Xinjiang based on RS and GIS. J. Nat. Resour. 2010, 25, 614–624. (In Chinese) [Google Scholar]
- Wang, X.; Li, X. China’s agricultural land use change and its underlying drivers: A literature review. J. Geogr. Sci. 2021, 31, 1222–1242. [Google Scholar] [CrossRef]
- Chen, L.; Ren, C.; Zhang, B.; Wang, Z.; Liu, M. Quantifying Urban Land Sprawl and its Driving Forces in Northeast China from 1990 to 2015. Sustainability 2018, 10, 188. [Google Scholar] [CrossRef] [Green Version]
- Kuang, W.; Liu, J.; Tian, H.; Shi, H.; Dong, J.; Song, C.; Li, X.; Du, G.; Hou, Y.; Lu, D.; et al. Cropland redistribution to marginal lands undermines environmental sustainability. Natl. Sci. Rev. 2021, 9, nwab091. [Google Scholar] [CrossRef] [PubMed]
- Zhang, Q.; Fu, B.; Chen, L.; Zhao, W.; Yang, Q.; Liu, G.; Gulinck, H. Dynamics and driving factors of agricultural landscape in the semiarid hilly area of the Loess Plateau, China. Agric. Ecosyst. Environ. 2004, 103, 535–543. [Google Scholar] [CrossRef]
- Wang, C.; Zhen, L.; Du, B. Assessment of the impact of China’s sloping land conservation Program on regional development in a typical hilly region of the Loess Plateau: A case study in Guyuan. Environ. Dev. 2017, 21, 66–76. [Google Scholar]
- Li, S.; Li, X.; Xin, L.; Tan, M.; Wang, X.; Wang, R.; Wang, Y.; Jiang, M. Extent and distribution of cropland abandonment in Chinese mountainous areas. Resour. Sci. 2017, 39, 1801–1811. [Google Scholar]
- Liu, Y.; Liu, S.; Sun, Y.; Wang, F.; Li, M. Driving forces of cultivated land evolution in agro-pastoral areas on the Qinghai-Tibet Plateau based on ecological niche theory. J. Clean. Prod. 2021, 313, 127899. [Google Scholar] [CrossRef]
- Song, W.; Pijanowski, B.C.; Tayyebi, A. Urban expansion and its consumption of high-quality farmland in Beijing, China. Ecol. Indic. 2015, 54, 60–70. [Google Scholar] [CrossRef]
- Xin, L.; Li, X. China should not massively reclaim new farmland. Land Use Policy 2018, 72, 12–15. [Google Scholar] [CrossRef]
- Wang, H.; Zhang, C.; Yao, X.; Yun, W.; Ma, J.; Gao, L.; Li, P. Scenario simulation of the tradeoff between ecological land and farmland in black soil region of Northeast China. Land Use Policy 2022, 114, 105991. [Google Scholar] [CrossRef]
- Zhang, X.; Zhao, C.; Dong, J.; Ge, Q. Spatio-temporal pattern of cropland abandonment in China from 1992 to 2017: A Meta-analysis. Acta Geogr. Sin. 2019, 74, 411–420. (In Chinese) [Google Scholar]
- Shao, J.; Zhang, S.; Li, X. Effectiveness of farmland transfer in alleviating farmland abandonment in mountain regions. J. Geogr. Sci. 2015, 26, 203–218. [Google Scholar] [CrossRef]
- Han, Z.; Song, W. Spatiotemporal variations in cropland abandonment in the Guizhou–Guangxi karst mountain area, China. J. Clean. Prod. 2019, 238, 117888. [Google Scholar] [CrossRef]
- Li, Y.; Zhou, T.; Jiang, G.; Li, G.; Zhou, D.; Luo, Y. Spatial pattern and mechanisms of farmland abandonment in Agricultural and Pastoral Areas of Qingzang Plateau. Geogr. Sustain. 2021, 2, 139–150. [Google Scholar] [CrossRef]
- Liu, L.; Xiao, X.; Qin, Y.; Wang, J.; Xu, X.; Hu, Y.; Qiao, Z. Mapping cropping intensity in China using time series Landsat and Sentinel-2 images and Google Earth Engine. Remote Sens. Environ. 2020, 239, 111624. [Google Scholar] [CrossRef]
- Duan, Q.; Tan, M.; Guo, Y.; Wang, X.; Xin, L. Understanding the Spatial Distribution of Urban Forests in China Using Sentinel-2 Images with Google Earth Engine. Forests 2019, 10, 729. [Google Scholar] [CrossRef] [Green Version]
Figure 1.
Spatial distributions of cultivated land area and agricultural regions in China. HHH, SWR, YRR, SER, GXR, LPR, TPR, NER and IMR represent the Huang-Huai-Hai region, the Southwest China region, the middle-lower Yangtze River region, the Southeast China region, the Gansu-Xinjiang region, the Loess Plateau region, the Tibetan Plateau region, the Northeast China region and the Inner Mongolia region, respectively.

Figure 2.
Spatial variation in cultivated land fragmentation indices across China ((a) PD, (b) LSI, (c) CLFI) and between agricultural regions (d).
Figure 2.
Spatial variation in cultivated land fragmentation indices across China ((a) PD, (b) LSI, (c) CLFI) and between agricultural regions (d).

Figure 3.
Scatter plots. Left is the scatter plot of the proportion of cumulative county number and the proportion of cumulative CA (the data are first arranged from small to large according to CA). Right is the scatter plot of the proportion of cumulative county number and CLFI (the data are first arranged from small to large according to CLFI).

Figure 4.
Changes in cultivated land area (CA) in China during 2000–2010 (a) and 2010–2020 (b). The spatial distribution and histogram of the CA change rate during 2000–2010 are displayed in (a) and (lower-left), respectively. The spatial distribution and histogram of the CA change rate during 2010–2020 are displayed in (b) and (lower-right), respectively. Colors in the histograms correspond with the maps and the intervals were set following the Freedman–Diaconis rule.

Figure 5.
Changes in the coupling landscape fragmentation index (CLFI) in China. The spatial distribution and histogram of the CLFI change rate during 2000–2010 are displayed in (a) and (lower-left), respectively. The spatial distribution and histogram of the CLFI change rate during 2010–2020 are displayed in (b) and (lower-right), respectively. Colors in the histograms correspond with the maps and the intervals were set following the Freedman–Diaconis rule.

Figure 6.
Characterization of different groups of counties in China from 2000 to 2020. The spatial distribution and histogram of counties grouped by the CA changes are displayed in the upper-left and lower-left, respectively. The spatial distribution and histogram of counties grouped by the CLFI changes are displayed in the upper-right and lower-right, respectively. Colors in the maps correspond with the histograms. 1I2I, 1I2D, 1C2D, 1D2I, 1D2C, 1D2D and others refer to continuous increase during the two time periods; first increase, then decrease; first stable, then decrease; first decrease, then increase; first decrease, then stable; continuous decrease; and other groups, respectively.

Figure 7.
Ratios of cultivated land area (CA) change to/from other land-use types from 2000–2010 (upper) and 2010–2020 (lower).
Figure 7.
Ratios of cultivated land area (CA) change to/from other land-use types from 2000–2010 (upper) and 2010–2020 (lower).

Publisher’s Note: MDPI stays neutral with regard to jurisdictional claims in published maps and institutional affiliations. |
© 2022 by the author. Licensee MDPI, Basel, Switzerland. This article is an open access article distributed under the terms and conditions of the Creative Commons Attribution (CC BY) license (https://creativecommons.org/licenses/by/4.0/).
Share and Cite
MDPI and ACS Style
Wang, X. Changes in Cultivated Land Loss and Landscape Fragmentation in China from 2000 to 2020. Land 2022, 11, 684. https://doi.org/10.3390/land11050684
AMA Style
Wang X. Changes in Cultivated Land Loss and Landscape Fragmentation in China from 2000 to 2020. Land. 2022; 11(5):684. https://doi.org/10.3390/land11050684
Chicago/Turabian StyleWang, Xue. 2022. "Changes in Cultivated Land Loss and Landscape Fragmentation in China from 2000 to 2020" Land 11, no. 5: 684. https://doi.org/10.3390/land11050684
Note that from the first issue of 2016, this journal uses article numbers instead of page numbers. See further details here.