Article

How Is Construction Land Transition Related to Rural Transformation? Evidence from a Plain County in China Based on the Grey Correlation Model

1
College of Resources and Environment, Shandong Agricultural University, Taian 271018, China
2
Shandong Tiancheng Land Planning and Design Institute Co., Ltd., Jinan 250014, China
*
Author to whom correspondence should be addressed.
These authors contributed equally to this work.
Land 2022, 11(5), 641; https://doi.org/10.3390/land11050641
Submission received: 29 March 2022 / Revised: 25 April 2022 / Accepted: 25 April 2022 / Published: 26 April 2022
(This article belongs to the Special Issue Efficient Land Use and Sustainable Urban Development)

Abstract

:
Under the background of urban-rural integration, the frequent flow of urban and rural elements has promoted the close connection between rural transformation (RT) and construction land transition (CLT). How is CLT related to RT? By taking the plain area Linqing County in China as the study area, basing the study on the RT and CLT coupling framework of relevance theory, building an RT and CLT evaluation index system, using the multi-factor evaluation method for the evaluation of RT and CLT from 2010 to 2018, and using the grey correlation model to measure the RT and CLT coupling relationship, the results showed that the level of RT was from 0.04 to 97.42, and the level of CLT was from 14.89 to 82.47, showing the trends of gradual increase and fluctuating increase, respectively. Taking 2013 and 2016 as the time point, RT could be divided into the initial stage, growth stage I, and growth stage II, corresponding to the initial stage, high growth stage, and stable development stage of CLT. The coupling degree between the two was in the range of 0.6–0.8 and was in the stage of a medium to high coupling degree. The correlation degree between the subsystem of RT and CLT was over 0.65. In the subsystem of CLT, the correlation degrees between quantitative structure transition and RT and efficiency transition and RT were both lower than 0.65, which were relatively low. Controlling the scale of construction land and taking efficiency transition are the effective methods to guide the deep exploration of potential and are the inevitable way to strengthen the relationship between CLT and RT and promote urban-rural integration development.

1. Introduction

In the 1970s, with the neoliberal revolution, the flow of regional capital, labor, land, and other elements accelerated [1], which promoted the process of global urbanization. The rapid development of urbanization has deepened the contradiction of the urban-rural dual structure [2,3], and the imbalance of urban-rural element allocation has led to the decline of rural areas, which are in urgent need of transformative development. Rural transformation (RT) is a process of long-term changes in social life, production methods, and urban–rural relations in rural areas driven by the reorganization of urban and rural elements [4]. In order to promote RT, South Korea launched the “New Village Movement” [5], and Japan implemented the “One Village, One Product” campaign [6]. At the end of the 20th century and the beginning of the 21st century, RT was basically completed in Western Europe, North America, and Israel [7,8,9,10]. Developing countries such as China [11], India [12], the Philippines [13], Ecuador [14], and Egypt [15] have also started RT. As an important production and living factor, construction land is the main carrier of urban and rural development transformation [16], and its scale, structure, and utilization modes have a profound impact on urban and rural transformation in terms of factor concentration, spatial concentration, and output efficiency [17]. Construction land transition (CLT) refers to the transition process of construction land use form driven by the transition of economic and social development [18]. CLT can promote the orderly urbanization, enhance the driving role of cities in rural development, coordinate the people–land relationship, and promote RT [19]. At the same time, urban and rural economic and social development is the main factor influencing the CLT. Therefore, RT affects CLT [20,21], and CLT also accelerates RT [18].
The coupling correlation between RT and CLT is hierarchical. Some scholars adopted the coupling coordination degree model, focusing on highlighting the degree of coupling and coordination based on the respective development of RT and CLT [22]. Although the coupling coordination degree model could more accurately describe the degree of interaction between RT and CLT as a whole, the two systems were essentially still a grey system with complex functions and feedback processes of many elements, and the model could not explain the influences of various internal elements of RT and CLT on the coupling correlation between the two systems in-depth. The grey correlation model can be used to deeply describe the relationships among multiple factors in the system [23], and the model has the advantages of less calculation, high accuracy, and wide application. The grey correlation model can not only satisfy the overall evaluation of the coupling between systems, but it can also quantify and compare the coupling relationship among various elements and is an ensemble analysis method that covers the functions of correlation analysis and the coupling coordination model [24].
Under the influence of the “Global South” upsurge, RT has become a research hotspot [25], which is also the theme of China’s economic development at the present stage [26]. Since the reform and opening up in 1978, China has accelerated the urbanization process, but the urban–rural dual system and the policy of giving priority to urban development have led to the hollowing out of rural areas, economic decline [27], and the imbalance between urban and rural development. Since the 21st century, in response to the main social contradictions of unbalanced urban–rural development and inadequate rural development, China has implemented the strategy of new rural construction and rural revitalization to promote rural transformation and to seek coordinated urban–rural development. Rural hollowing has caused extensive and inefficient construction land in rural areas. Meanwhile, the advancement of urbanization has led to a shortage of urban construction land, and the contradiction between supply and demand of urban and rural construction land has restricted rural transformation. In response, China has launched policies such as “linking the increase and decrease of urban and rural construction land” and “putting collective profit-making construction land into the market” to solve the problems of the unreasonable and inefficient utilization of urban and rural construction land structure, while improving land value and providing the economic foundation for RT through the investment multiplier effect [28]. Therefore, there is a coupling and correlation relationship between the two systems and elements within the system. So how is CLT related to RT exactly? It is urgent to carry out research and in-depth excavations of the relationship between the two systems and to explore their coupling and correlation, as well as their development trends, which are of great significance for the rational allocation of urban and rural construction land resources and the promotion of rural transformation development.

2. Literature Review and Theoretical Framework

2.1. Literature Review

RT is a topic of global concern [29], and the socio-economic structure of the countryside has changed significantly as the result of urbanization, industrialization, informatization, and globalization [30]. It is a complicated phenomenon influenced by a number of political, demographic, social, and environmental factors [31,32,33]. Since the 1970s, rural areas in western countries have undergone continuous transformation. Marsden et al. [34] proposed the typical RT theory, and Wilson [35] divided RT into four stages: “pre-productivism—productivism—post-productivism—multi-functional agriculture”. Lowe et al. [36] believed that agriculture was an integral part but not the whole of RT. Holmes [37] proposed the theory of “rural multifunctional development” based on the theory of “post-productive transformation”. Scholars have attached great importance to the evaluation of RT. The local government of England and Wales constructed rurality indexes to measure the RT by selecting indicators such as population, family amenities, occupational structure, commuting pattern, and distance to cities [38]. Subsequently, Halfacr [39], Harrington [40], and Woods [41] made theoretical improvements to the rurality index. Some scholars have built evaluation index systems involving population, land, and industry to measure RT [42,43], while others also have investigated the happiness satisfaction of rural residents by the case investigation method as a measurement of RT [44].
Construction land is one of the basic elements of urban–rural transition, and the theory of CLT originated from Mather’s forest transition hypothesis [45]. After Longhualou introduced the concept of land use transition into China [46], it attracted great attention from academia and government departments. Explicit form, which contains features such as the number and spatial pattern of land use categories, and implicit form, which includes qualities such as land use quality, property rights, inputs, outputs, and functions, are the two types of land use form [47]. Many researchers have expanded the theory of land use transition by applying it to cultivated land use transition [48,49] and homestead use transition [50,51]. Although there have been various studies on land use transition, there have been fewer studies on CLT. Long Hualou [52] pointed out that current land use transition research has focused too much on the study of explicit forms, and research on implicit form transition should be strengthened, as well as measurement methodologies for implicit form transition. Studies on the evaluation of CLT are mostly carried out from the perspective of the explicit form transition of construction land, such as quantitative structure and spatial pattern [53], and the implicit form transition of construction land, such as ownership, input and output [54], and so on. Some scholars have constructed the evaluation index system from the structure, efficiency, and function of construction land [55], but there is still a gap in the evaluation research on the space transition of construction land. By limiting the explicit transition of construction land to the transition of quantitative structure, the bias in interpreting the explicit transition will emerge. Quantitative structure is an important feature of the explicit form of construction land. However, the disorder of landscape spatial pattern often leads to the unsustainable spatial development and conflict of landscape functions. [56]. Simultaneously, most of the efficiency transition evaluations employ the single indicators, such as the GDP of secondary and tertiary industries per land, to evaluate the economic efficiency of construction land [57], indicating a lack of comprehensive indicators to evaluate the efficiency transition, and the evaluation system of CLT needs to be improved and enriched.
Land is one of the basic elements of production and living, and changes in land usage will undoubtedly accompany RT. Many scholars have investigated and analyzed the internal relationship between land use transition and RT in terms of the transition of different land use types such as rural settlement land [58], homestead [50,59], cultivated land [60,61], and construction land [62], as well as the state of rural development. For example, Han Dong et al. [63] studied the spatial reconstruction of the countryside based on explicit and implicit land use transition. The changes of land use form are the spatial projection of RT on the land [64], and RT leads to the structural and functional modification of land [65]. The coupling research of RT and land use transition, on the other hand, is still in its early stages [66]. Construction land influences RT, and there is a strong interaction between construction land and the economy [67]. The flow of the rural population is the primary element driving CLT [68]. The research on the coupling correlation between RT and CLT is still lacking.
Linqing County in Shandong Province is a county-level city in China, located in the plain region, that is currently in the process of urbanization development. At the same time, idle construction land has appeared in rural areas, and the economy is growing slowly. To this end, the policy of linking urban and rural construction land increase and decrease was implemented in 2010 to transform dangerous houses and to establish communities, with obvious results. In addition, the Economic Circle Development Plan for the Provincial Capital City Cluster in Shandong Province proposed to support the development of Linqing County as a regional center city, which poses challenges for CLT and creates opportunities for RT.
In view of this, this research took Linqing County in the plain region as the research object and built the index system of RT, and at the same time the indexes, such as the comprehensive efficiency of land use, and the spatial agglomeration degree were introduced to build the index system of CLT. The temporal characteristics of RT and CLT in Linqing County were quantitatively studied, and the grey correlation model was constructed to measure the coupling correlation between the two systems, so as to promote the rational allocation of urban and rural construction land resources and provide references for the purpose of guiding the development of RT.

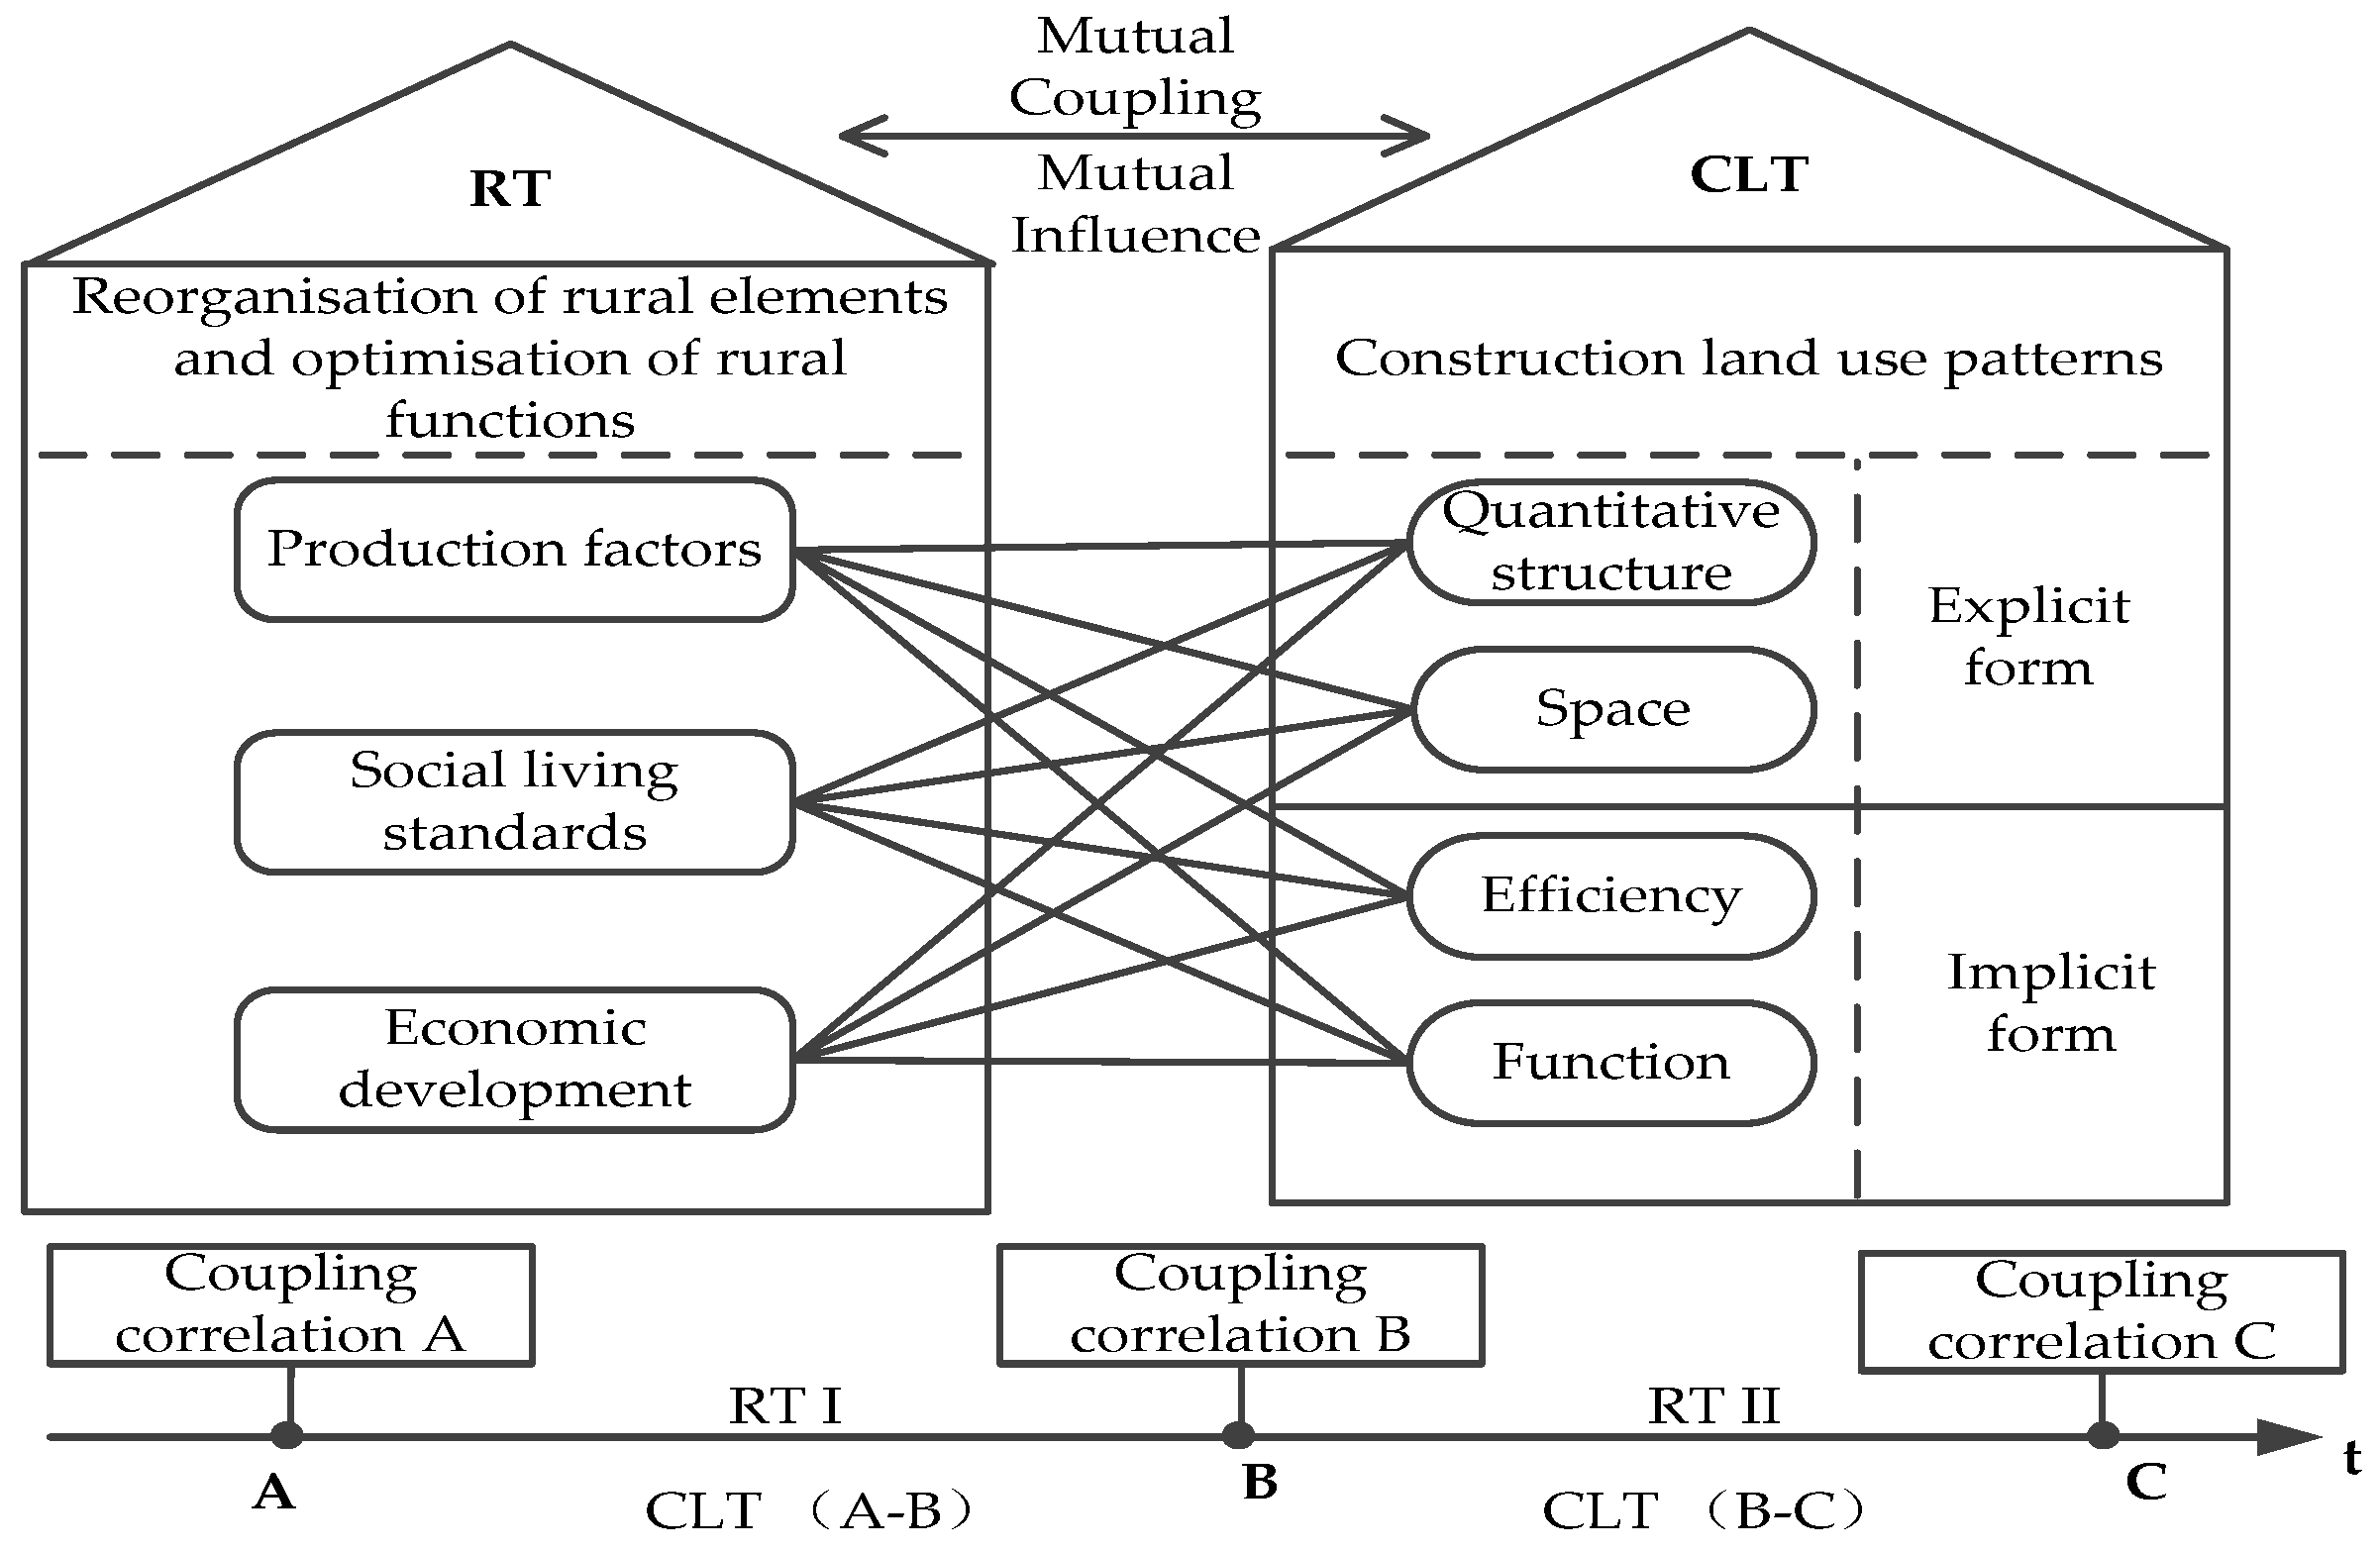
2.2. Theoretical Framework

RT is an important part of contemporary rural development. Zhang Rongtian et al. [69] believed that RT was caused by the coupling of factors such as urban and rural population mobility and industrial restructuring. Liu Yansui et al. [70] pointed out that RT was the transformation process of traditional rural industries, modes of production, consumption structure, and urban–rural relations. Cai Yunlong [71] believed that RT was a comprehensive transformation of farmers’ living consumption level, the urban–rural relationship, the industrial and agricultural relationship, and the agricultural operation mode. This study considered that RT was a process of rural factor reorganization and rural function optimization under the background of rural revitalization and urban–rural integration development, including the transfer of rural production factors to non-agricultural industries, the transformation of industries to high quality and high efficiency, social harmony and stability, and sustained and stable economic growth.
The explicit form of CLT mainly refers to the quantitative structure and spatial pattern of construction land, while the implicit form mainly refers to the quality, ownership, operation mode, input and output, function, and other attributes [57]. This study considered that CLT had no fixed form but was a process of continuous change in the utilization of construction land with economic and social development, including the rationalization of the quantity and structure of construction land, the regularization of the spatial pattern, the intensification and efficiency of land use, and the perfection of the economy–society–ecology function.
Coupling refers to the phenomenon of systems influencing and promoting each other [72], while correlation refers to the interaction between elements of different systems [73], focusing on the internal connection of systems. There is a coupling relationship between RT and CLT, and the internal elements of the two systems are interrelated. Combining the connotation of RT, CLT, and coupling correlation, and referring to the coupling theoretical model of Long Hualou [66], the theoretical framework of coupling correlation between RT and CLT was constructed (Figure 1).
The framework includes the following two parts: RT and CLT in different periods and the coupling relation between them in corresponding periods. First of all, RT was measured from the perspective of the transfer of rural production factors to non-agricultural industries, the transformation of industries to high quality and efficiency, the harmonious and stable society, and the sustainable and stable economic growth; CLT was measured from the perspective of the rationalizations of the quantity and structure of construction land, the regularizations of the spatial pattern, the intensive and efficient land utilization, and the perfection of economic–social–ecological functions. Secondly, using the coupled correlation model, we analyzed the coupling strength between the two systems of RT and CLT and then analyzed the correlation between the factors within the two systems, so as to obtain the interaction strength of each factor.

3. Study Area and Data Sources
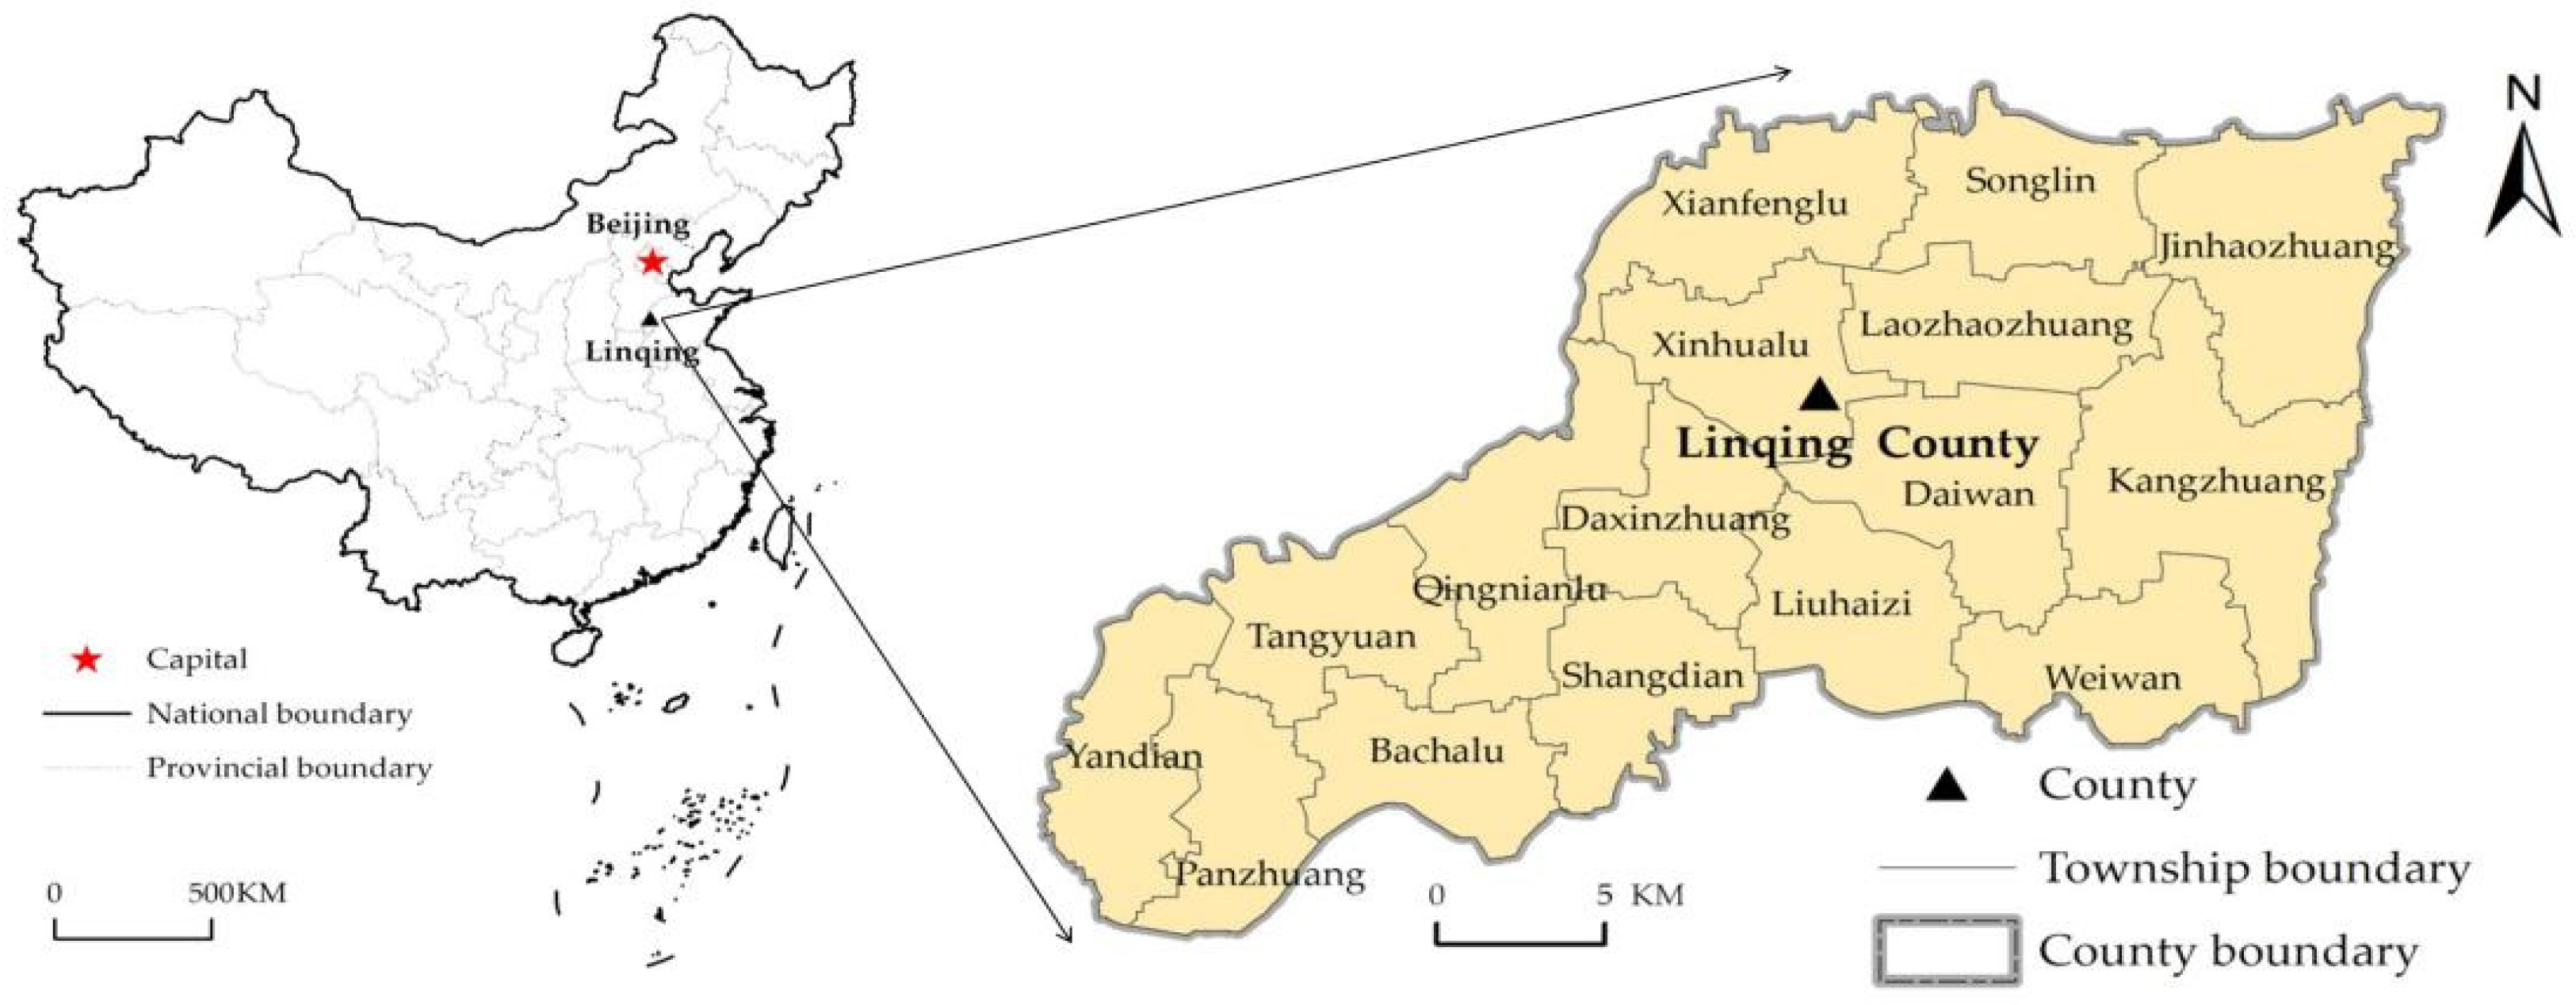
3.1. Study Area

Linqing (115°27′–116°02′ E, 36°39′–36°55′ N) is a county-level city of east China, under the jurisdiction of Shandong Province, administered by Liaocheng City (Figure 2). Linqing County is an alluvial plain in the lower reaches of the Yellow River with flat land. It has a relatively typical continental monsoon climate with mild weather and moderate precipitation, suitable for agricultural production. It is a famous canal county in China and an ancient county of thousands of years. It is also a well-known hometown of Beijing Opera art, calligraphy and painting, martial arts, bearing, and pickles.
In 2018, the county covered an area of 95,078 hectares, with 12 towns and four sub-districts under the jurisdiction. The Economic Development Zone was built in 2012. There were three A-level scenic spots and several industrial parks and logistics parks. The total construction land area of the city was 16,657 hectares, of which the rural construction land area was 11,945 hectares, accounting for 71.71% of the total construction land area. In 2018, the urbanization rate of Linqing County was 60.44%, the per capita income of rural areas was CNY 13,270, the per capita income of urban areas was CNY 26,185, and the urban–rural per capita income ratio was 1.97. In 2018, 9645 urban and rural residents sought help for subsistence allowances, 87.11 percent of whom were from rural areas.
To speed up RT and CLT, Linqing County implemented the “linking the increase and decrease of urban and rural construction land”, “science and technology commissioner” project, and “market of thousands of villages and thousands of townships” project, which have adjusted the structure of construction land and improved the living standard of rural areas. From 2010 to 2018, the permanent population of Linqing County increased from 719,600 to 757,000, the add value of the secondary and tertiary industries increased from CNY 20.649 billion to CNY 42.544 billion, and the rural per capita income increased from CNY 6273 to CNY 13,270. Linqing County has completed five projects linked to the increase and decrease of urban and rural construction land, with a total project size of about 65 hectares.

3.2. Data Sources

We collected demographic and socioeconomic data from Linqing County Statistics Bureau, Linqing County Statistical Yearbook (2011–2018), Liaocheng Statistical Yearbook (2011–2019), and the National Economic and Social Development Statistical Bulletin (2010–2018). We collected land use vector data and land use change data (2010–2018) from Linqing County Municipal Bureau of Natural Resources and Planning. Space transition indicators in CLT were measured using Fragstats 4.2; the economic efficiency of construction land was calculated by DEA. The construction land in the research included urban land and rural settlement land.

4. Methodology

4.1. Methodology and Logic

To investigate how CLT is related to RT, we firstly used the multi-factor comprehensive evaluation method to build the index system for the purpose of evaluating RT and CLT, respectively. The coupling degree and correlation degree between them were then calculated by the grey correlation model to determine the correlation degree of them. The methodology and logic are shown in Figure 3.

4.2. The Multi-Factor Comprehensive Evaluation Method

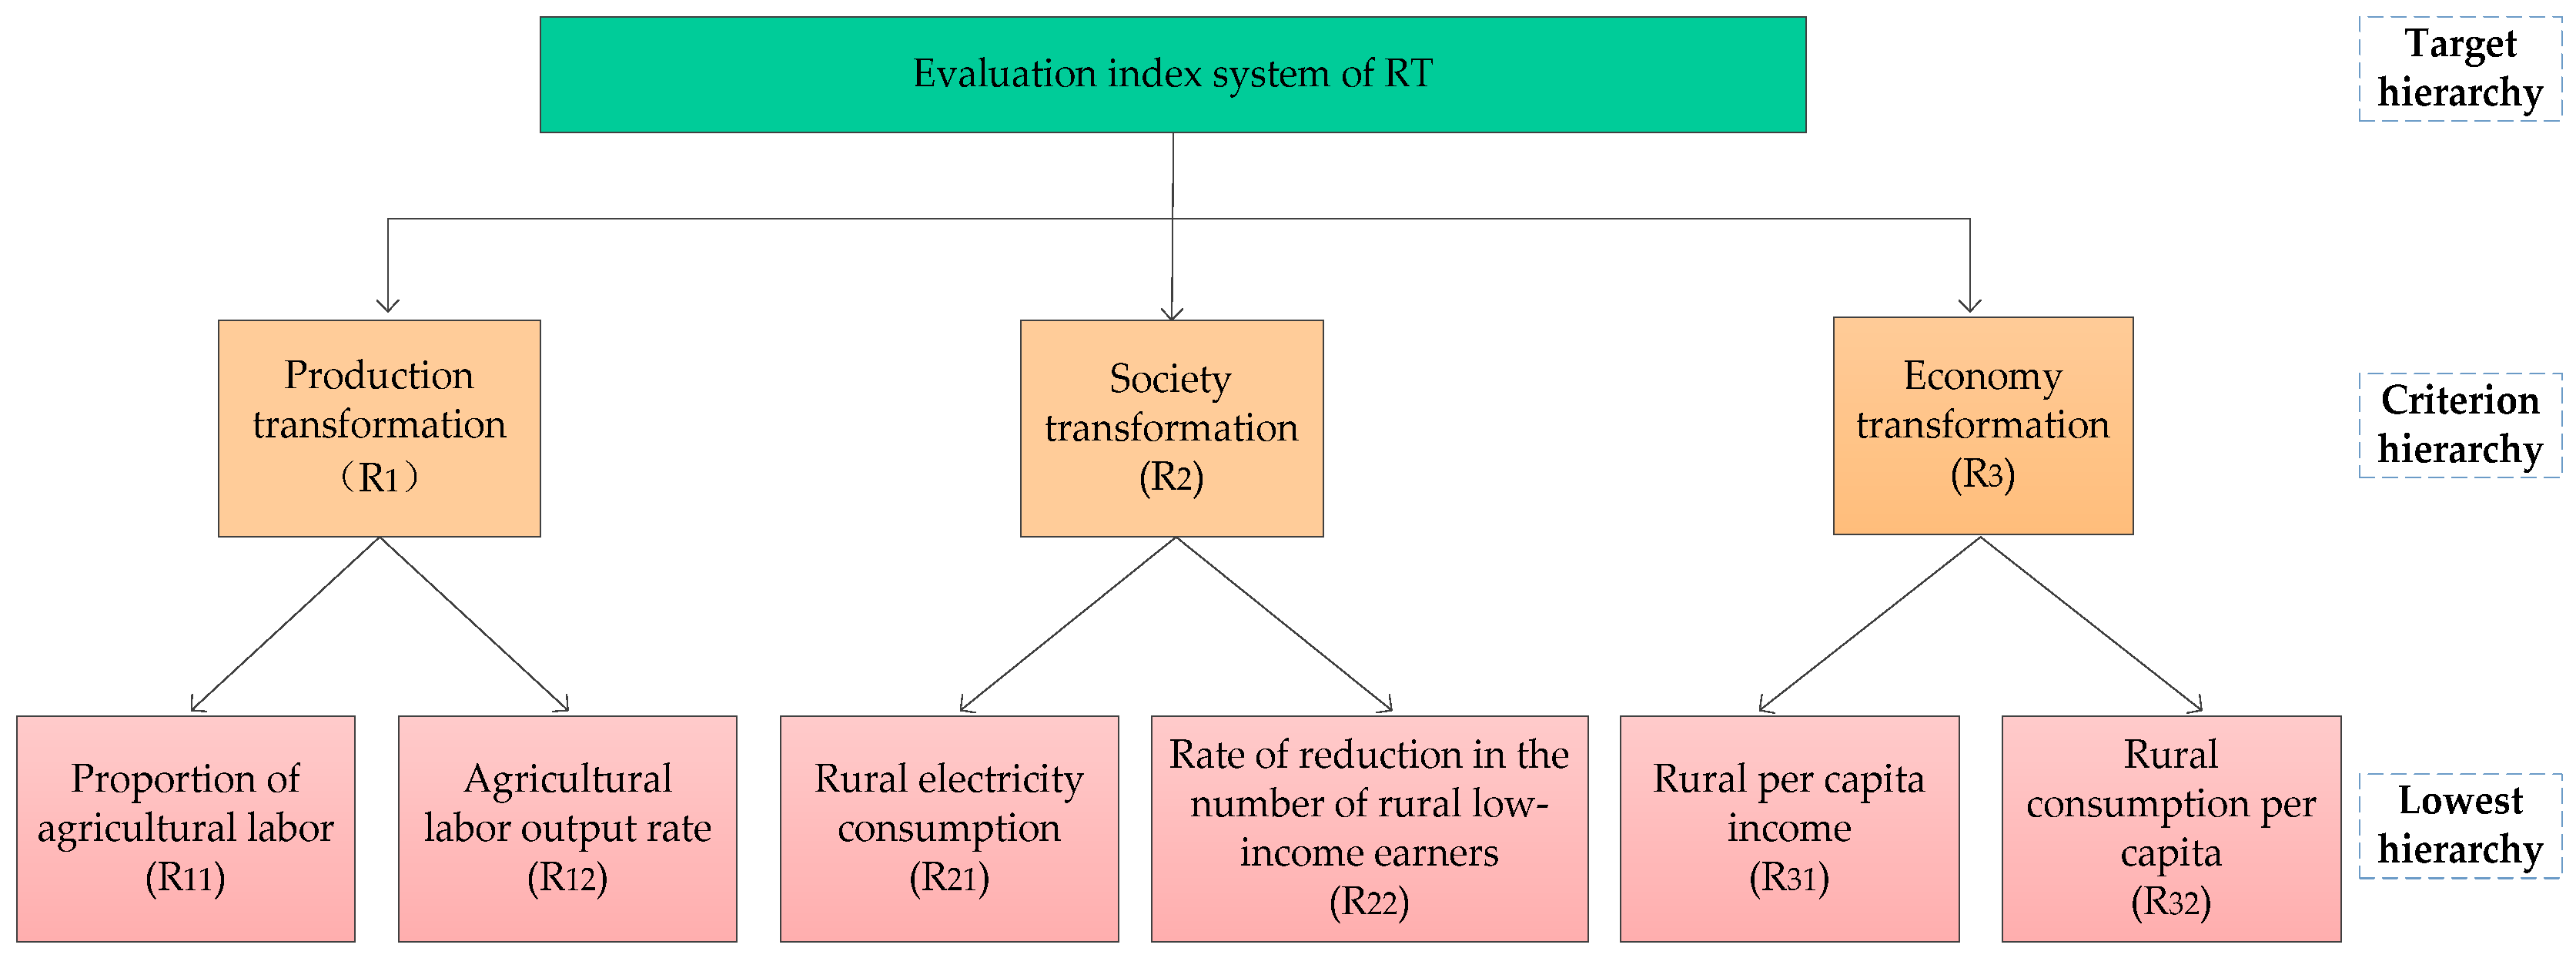
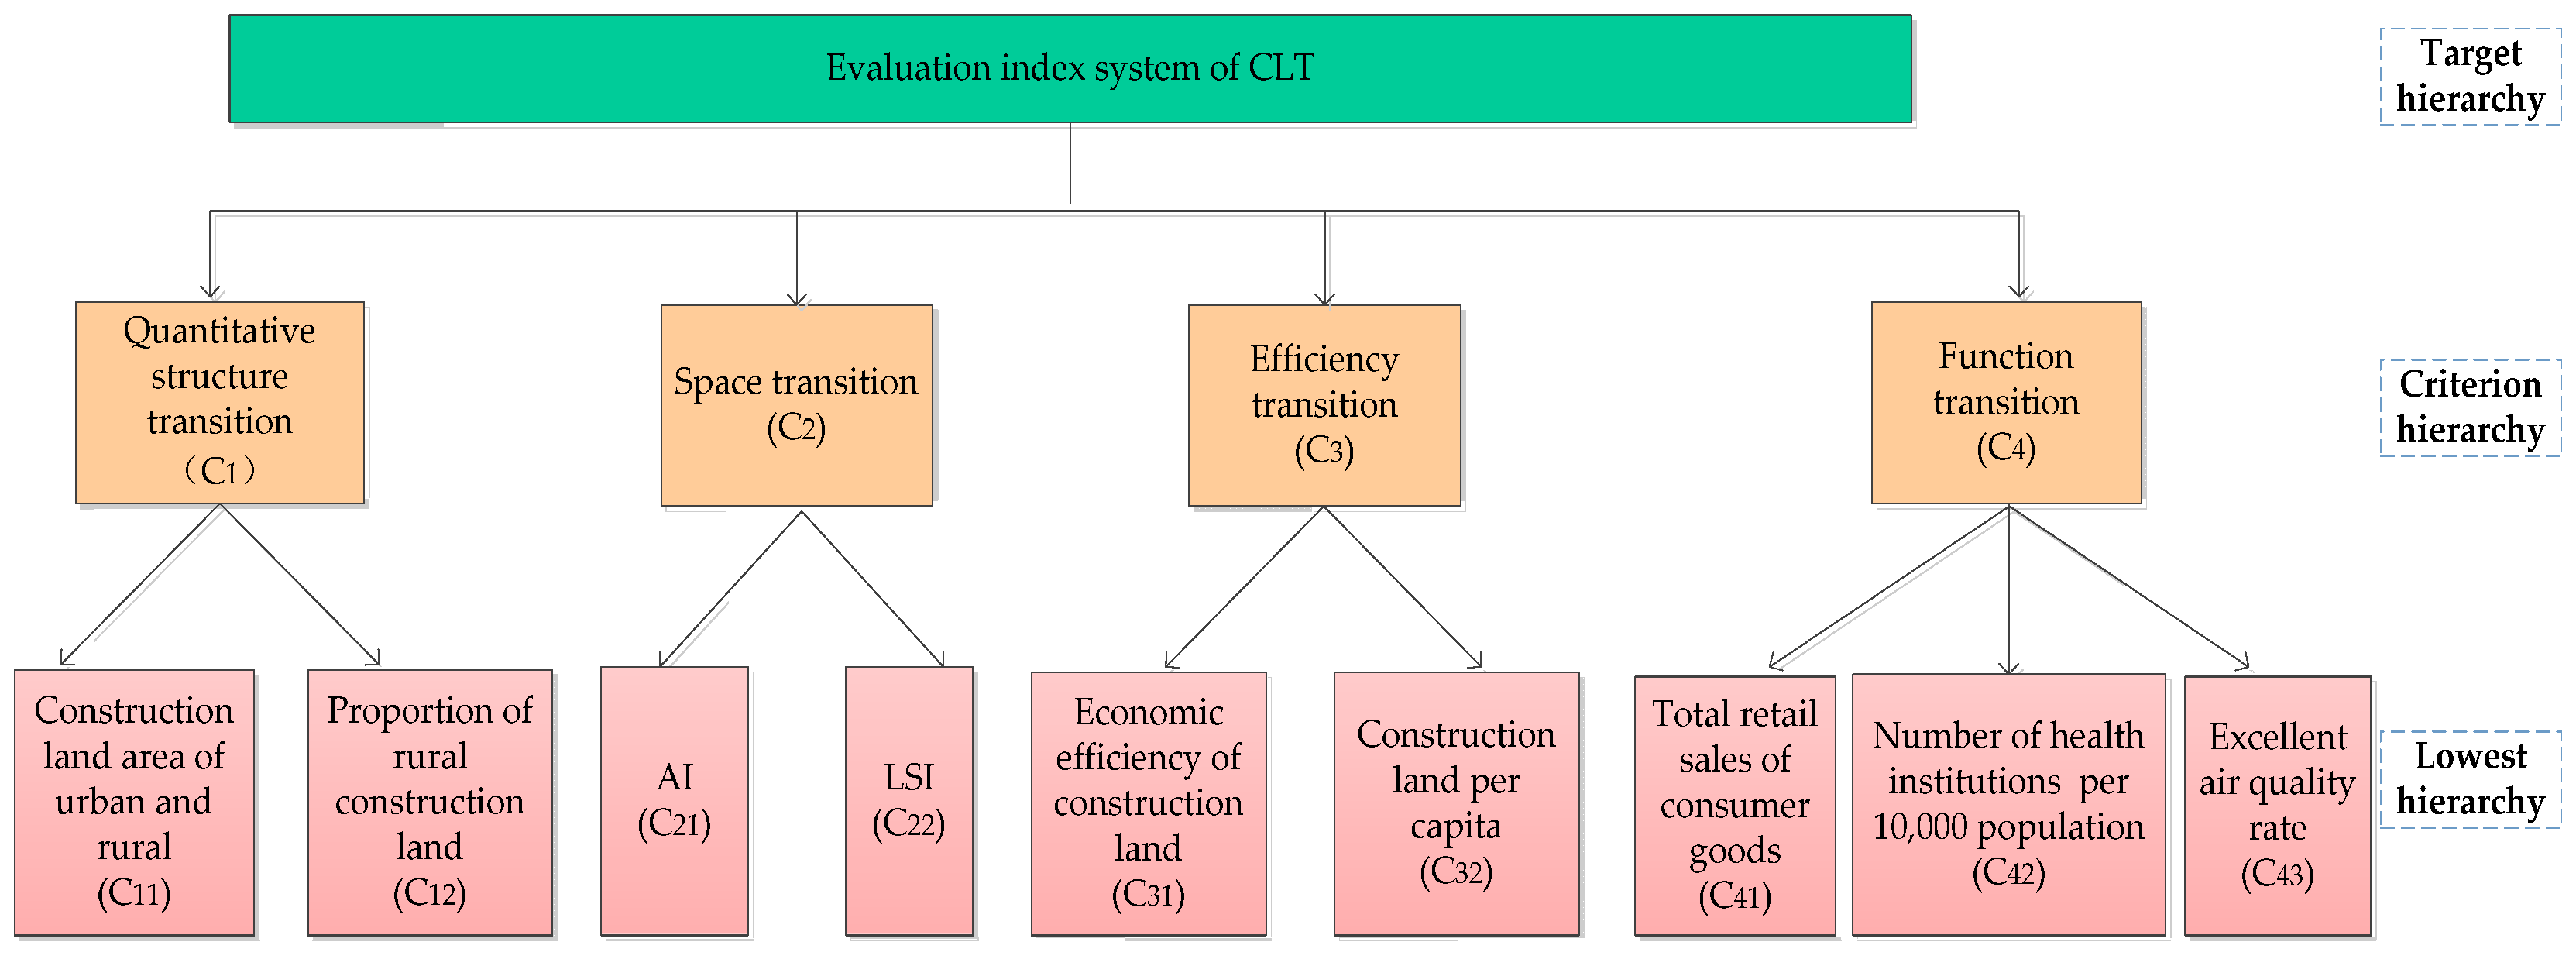
4.2.1. Construction of Evaluation Index System for RT and CLT

The indicator system of RT was constructed from three dimensions of production–society–economy based on its connotation [74,75], from the sorting out of the coupling relationship between RT and CLT, and also from the consideration of the availability of county data (Figure 4). The indicator system of RT consisted of the criterion hierarchy and the lowest hierarchy. The criterion hierarchy consisted of production transformation, society transformation, and economy transformation, reflecting the internal transformation of the system. Production transformation referred to the non-agricultural and industrialization of production factors, and the proportion of agricultural labor and the agricultural labor output rate were adopted to reflect the transformation of production structure and production efficiency, respectively. The society transformation referred to the social modernization and the continuous improvement of living standards, and it was captured by rural electricity consumption and the rate of reduction in the number of rural low-income earners. The level of economy transformation in the countryside was reflected through two indicators: rural per capita income and consumption.
The DEA model and landscape pattern index were presented to develop the indicator system for CLT from four dimensions: quantitative structure, space, efficiency, and function, according to the studies of relevant scholars [54,76] (Figure 5). The indicator system of CLT consisted of the criterion hierarchy and the lowest hierarchy. The criterion hierarchy consisted of quantitative structure transition, space transition, efficiency transition, and function transition, reflecting the internal transition of the system. The explicit form was reflected in quantitative structure and space transition, whereas the invisible form was reflected in efficiency transition and function transition. The space transition reflected the spatial aggregation and regularity with the landscape agglomeration index (AI) and landscape shape index (LSI). Economic carrying efficiency and population carrying efficiency, as measured by economic efficiency and construction land per capita, were the two types of efficiency transition. The economic efficiency adopted the input-oriented BC2 model in the DEA model, which was a representative research paradigm for measuring the efficiency of construction land utilization. According to earlier studies, the added value of secondary and tertiary industries was an output indicator, while the input indicators were total fixed assets, construction land area, and the number of employees in secondary and tertiary businesses [77]. The total retail sales of social consumer goods, the number of health institutions per 10,000 people, and the air quality rate were picked, and function transition referred to the role of construction land in economic development, social security, and ecological services.

4.2.2. Determination of Weights of Evaluation Indicators for RT and CLT

Index weight is one of the important contents of the comprehensive evaluation method. Both the evaluation index weights of RT and CLT were determined by the combination of subjective and objective methods of AHP and Entropy Weight Method (Table 1).

4.2.3. Quantification of Indicators

To reduce the influence of the evaluation indicator data scale, the indicator layer was quantified using the extreme value method, as shown in Equation (1).
Z = { ( A m i n A ) / ( m a x A m i n A ) ( P o s i t i v e ) ( m a x A A ) / ( m a x A m i n A ) ( N e g a t i v e )
Z represents the standardized value of the indicator, and A represents the original data of the indicators at the lowest hierarchy.

4.2.4. Evaluation of the Criterion Hierarchy

The Weighted Linear Model was adopted to evaluate the criterion hierarchy of RT and CLT, as shown in Equation (2).
{ F m ( t ) = i = 1 a W i × Z i ( t ) F n ( t ) = j = 1 b W j × Z j ( t )
Fm(t) and Fn(t) are the evaluation indexes of each criterion hierarchy of RT and CLT of Linqing County in year t, respectively; Zi(t) and Zj(t) are the standardized values of each indicator at the lowest hierarchy of RT and CLT in year t, respectively; Wi and Wj are the weight of the indicators of the lowest hierarchy of each system.

4.2.5. Evaluation of the Target Hierarchy

The Weighted Linear Model was adopted to evaluate the target hierarchy of RT and CLT, as shown in Equation (3).
{ W m ( t ) = m = 1 c W m × F m ( t ) × 100 W n ( t ) = n = 1 d W n × F n ( t ) × 100
Wm(t) and Wn(t) are the comprehensive evaluation indexes of the RT and CLT of Linqing County in year t, respectively; Fm(t) and Fn(t) are the evaluation indexes of each criterion hierarchy of RT and CLT of Linqing County in year t, respectively; Wm and Wn are the weight of each criterion hierarchy of the system.

4.3. The Grey Correlation Model

The grey correlation model can detect the degree of similarity or separation of development trends among various elements of the system [24]. This research used this method to calculate the coupling degree and the correlation degree of internal indicators of RT and CLT. The steps are as follows:
The first step is the dimensionless processing, as shown in Equation (1).
The second step is the calculation of the correlation coefficient:
β i j ( t ) = m i n i m i n j | Z i ( t ) Z j ( t ) | + ρ m a x i m a x j | Z i ( t ) Z j ( t ) | | Z i ( t ) Z j ( t ) | + ρ m a x i m a x j | Z i ( t ) Z j ( t ) |
Zi(t) and Zj(t) are the standardized values of the RT and CLT indicators in the year t, respectively; they are the resolution coefficients, generally 0.5; βij(t) is the correlation coefficient in the year t.
The third step is the calculation of the coupling degree:
G = 1 a × b i = 1 a j = 1 b β i j
G is the coupling degree, and the value range of the coupling degree is 0 < G ≤ 1. Referring to related research [82], the coupling degree values are divided into low coupling (0 < G ≤ 0.35), medium coupling (0.35 < G ≤ 0.65), relatively high coupling (0.65 < G ≤ 0.85), and high coupling (0.85 < G ≤ 1).
The fourth step is the calculation of the correlation degree:
γ i j = 1 k i , j = 1 k β i j ( t )   ( k = 1 ,   2 ,   , r )
yij represents the index correlation degree within the system; k represents the sample size of the indicators of RT or CLT.
According to formula (6), the correlation degree matrix was obtained, and the matrix was averaged by row and column, respectively, and the correlation degree model between systems could be obtained:
θ i = 1 a i = 1 a γ i j ( i = 1 , 2 , , a ;   j = 1 , 2 , , b ) θ j = 1 b j = 1 b γ i j ( i = 1 , 2 , , a ;   j = 1 , 2 , , b )
θi represents the average correlation degree between item i in RT and CLT; θj represents the average correlation degree between item j in RT and CLT; a and b represent the number of indicators of RT and CLT, respectively. The value interval of the correlation degree refers to the value interval of the coupling degree [82].

5. Results

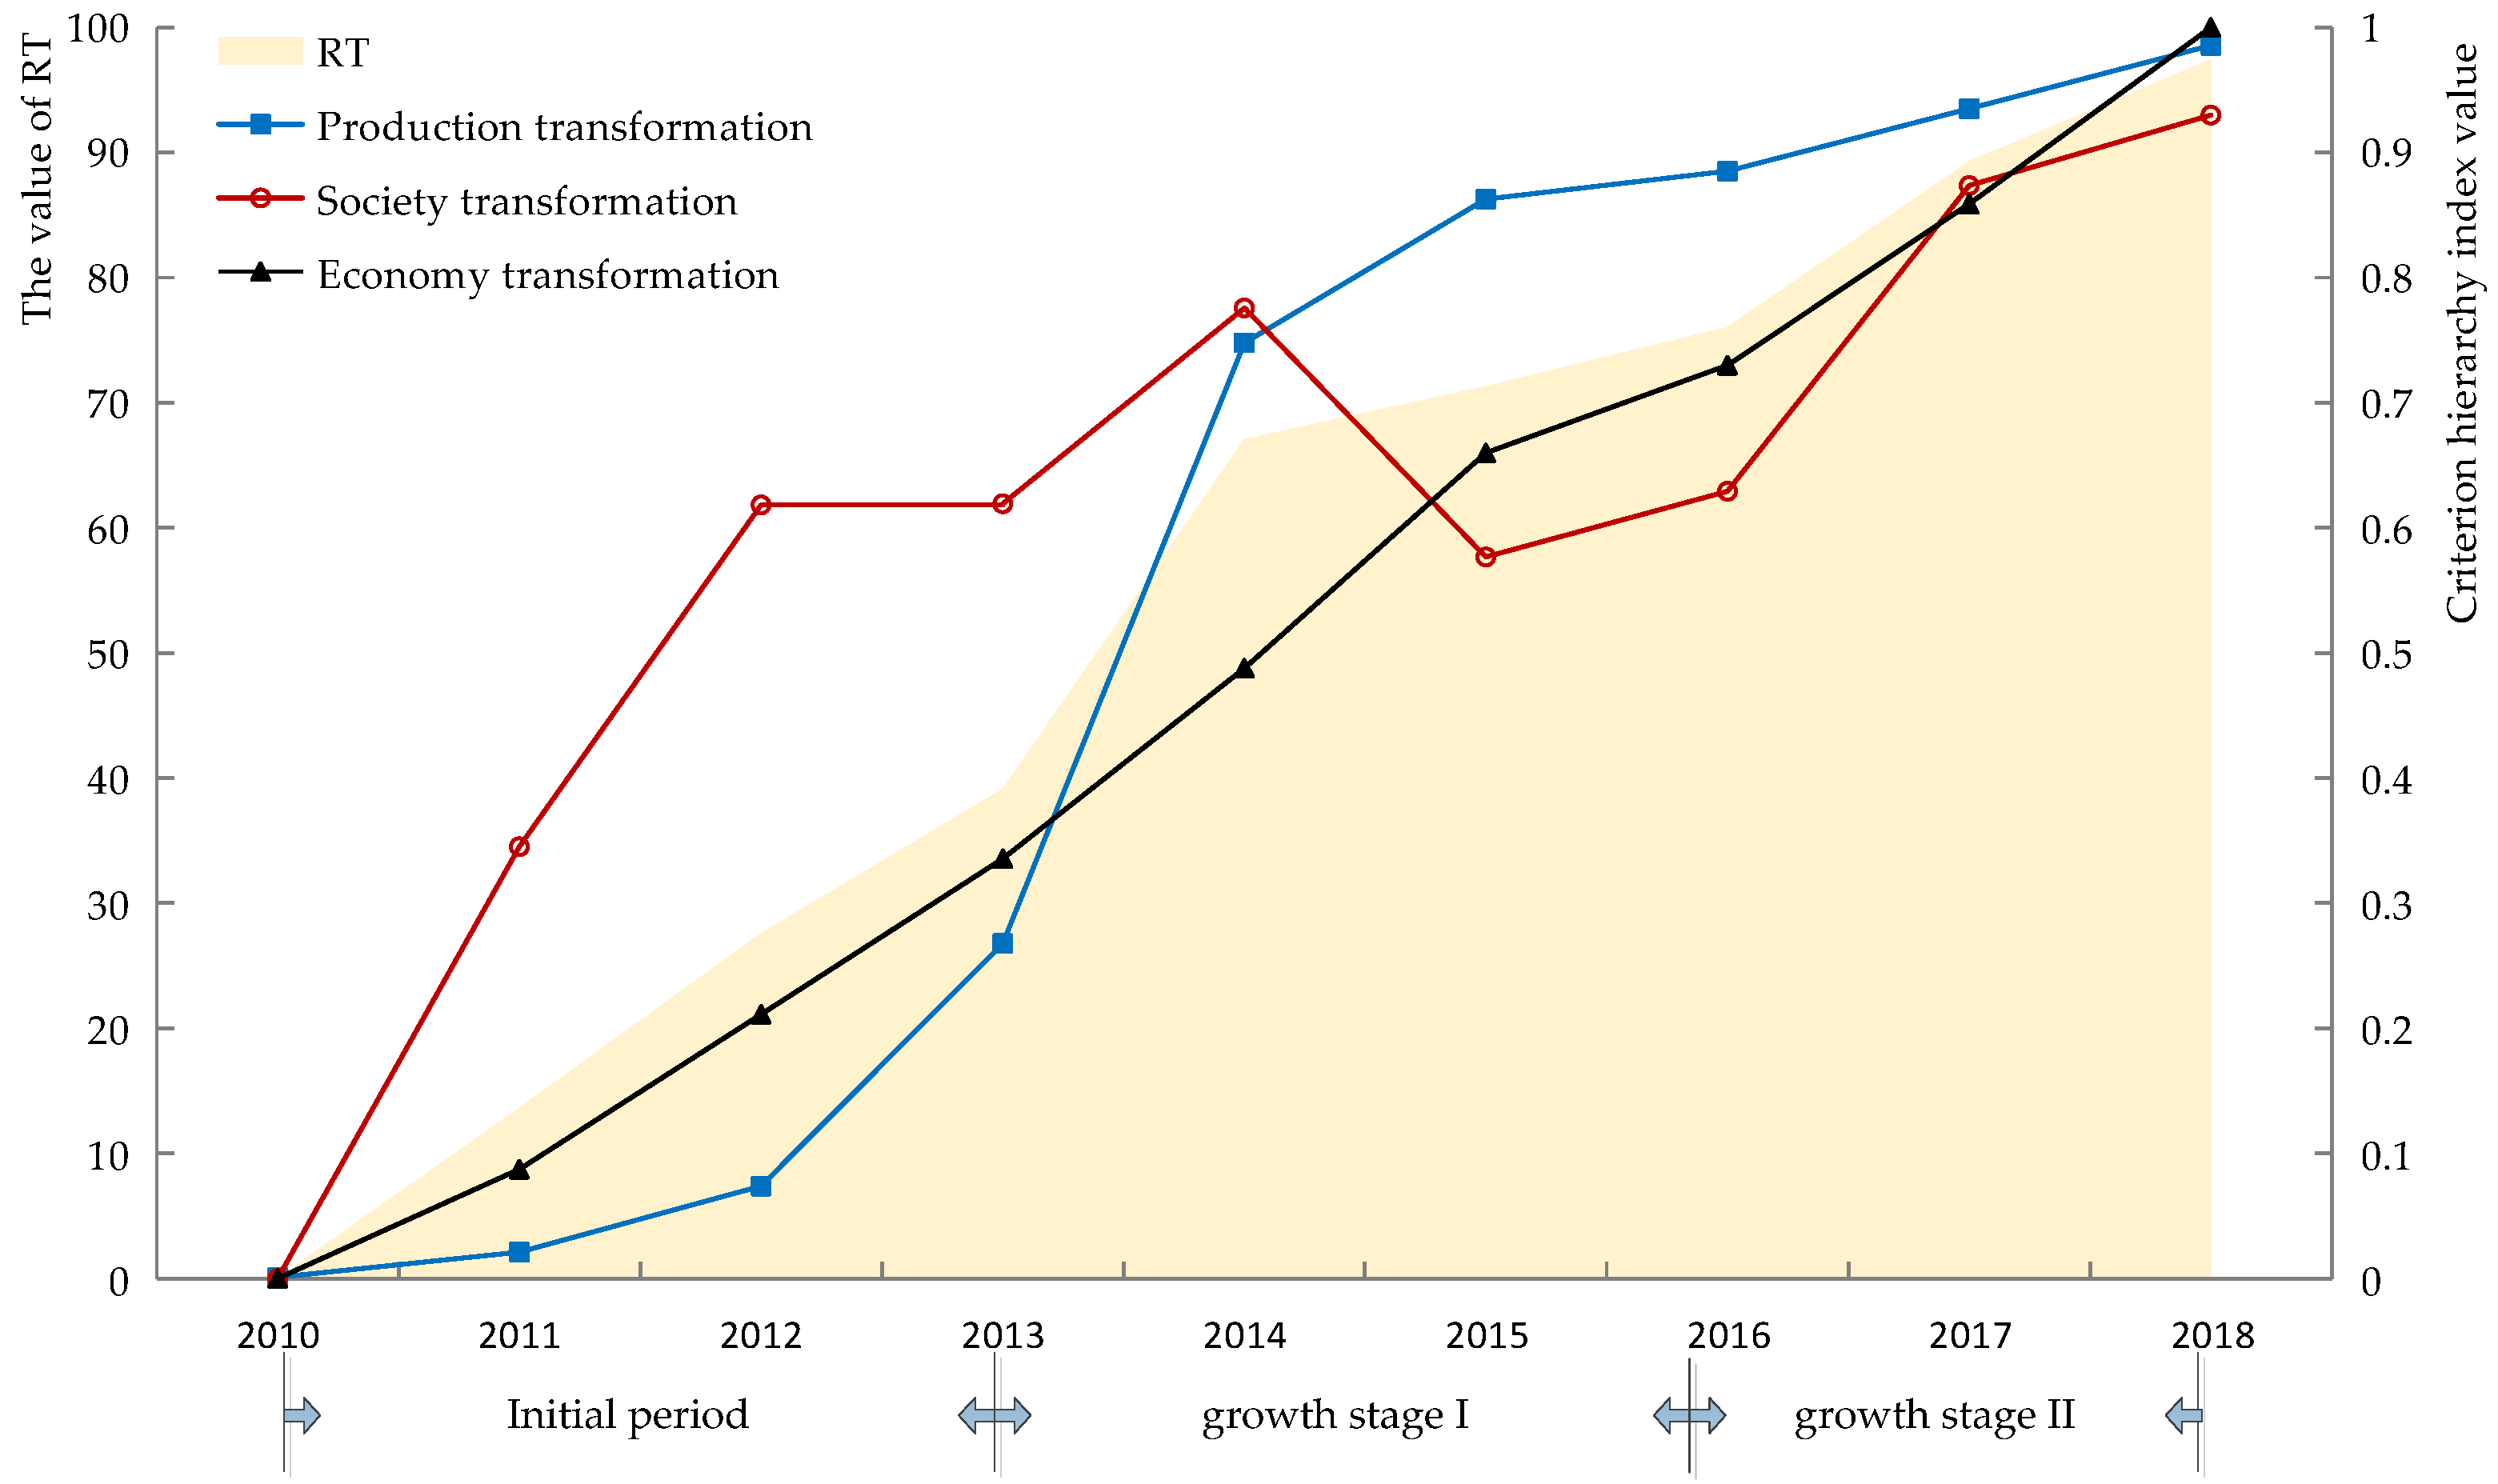
5.1. Analysis of the Time Series Characteristics of RT

Based on the multi-factor comprehensive evaluation model, the values of RT and production transformation, society transformation, and economy transformation in the criterion hierarchy in Linqing County from 2010 to 2018 were calculated, as shown in Figure 6. The value of RT reflected the overall level of RT. The higher the value of RT, the higher the level of RT was reflected, otherwise, the lower it was. The value of production transformation, society transformation, and economy transformation reflected the internal level of RT from the perspectives of production, society, and economy, respectively.
From 2010 to 2018, the overall RT index of Linqing County showed a gradual increasing trend. According to the changing trend of the curve, RT could be divided into three stages: initial period (2010–2013), growth stage I (2013–2016), and growth stage II (2016–2018).
In the initial period, the RT index increased from 0.04 to 39.11, indicating an obvious growth trend of RT. Society, production, and economy transformation increased year by year, and the index value of society transformation was the highest and the growth rate was the largest. At this stage, RT was dominated by society transformation, indicating that the project of “Market of thousands of villages and towns” played a certain role in promoting RT. RT in growth stage I showed a fluctuating growth, and the index increased to 71.31 in 2015. At this stage, production transformation took the lead, with the fastest growth rate of the index, indicating that the “Science and Technology Commissioner” project achieved remarkable achievements and promoted the industrialization of agriculture, while the new economic development zone radiated non-agricultural employment in rural areas. Economy transformation increased year by year, with a large growth range and a good momentum of development. The fluctuation of growth stage II was small and showed a gradual increase trend. Society transformation and economy transformation developed rapidly, and production transformation developed steadily. RT still has great potential.

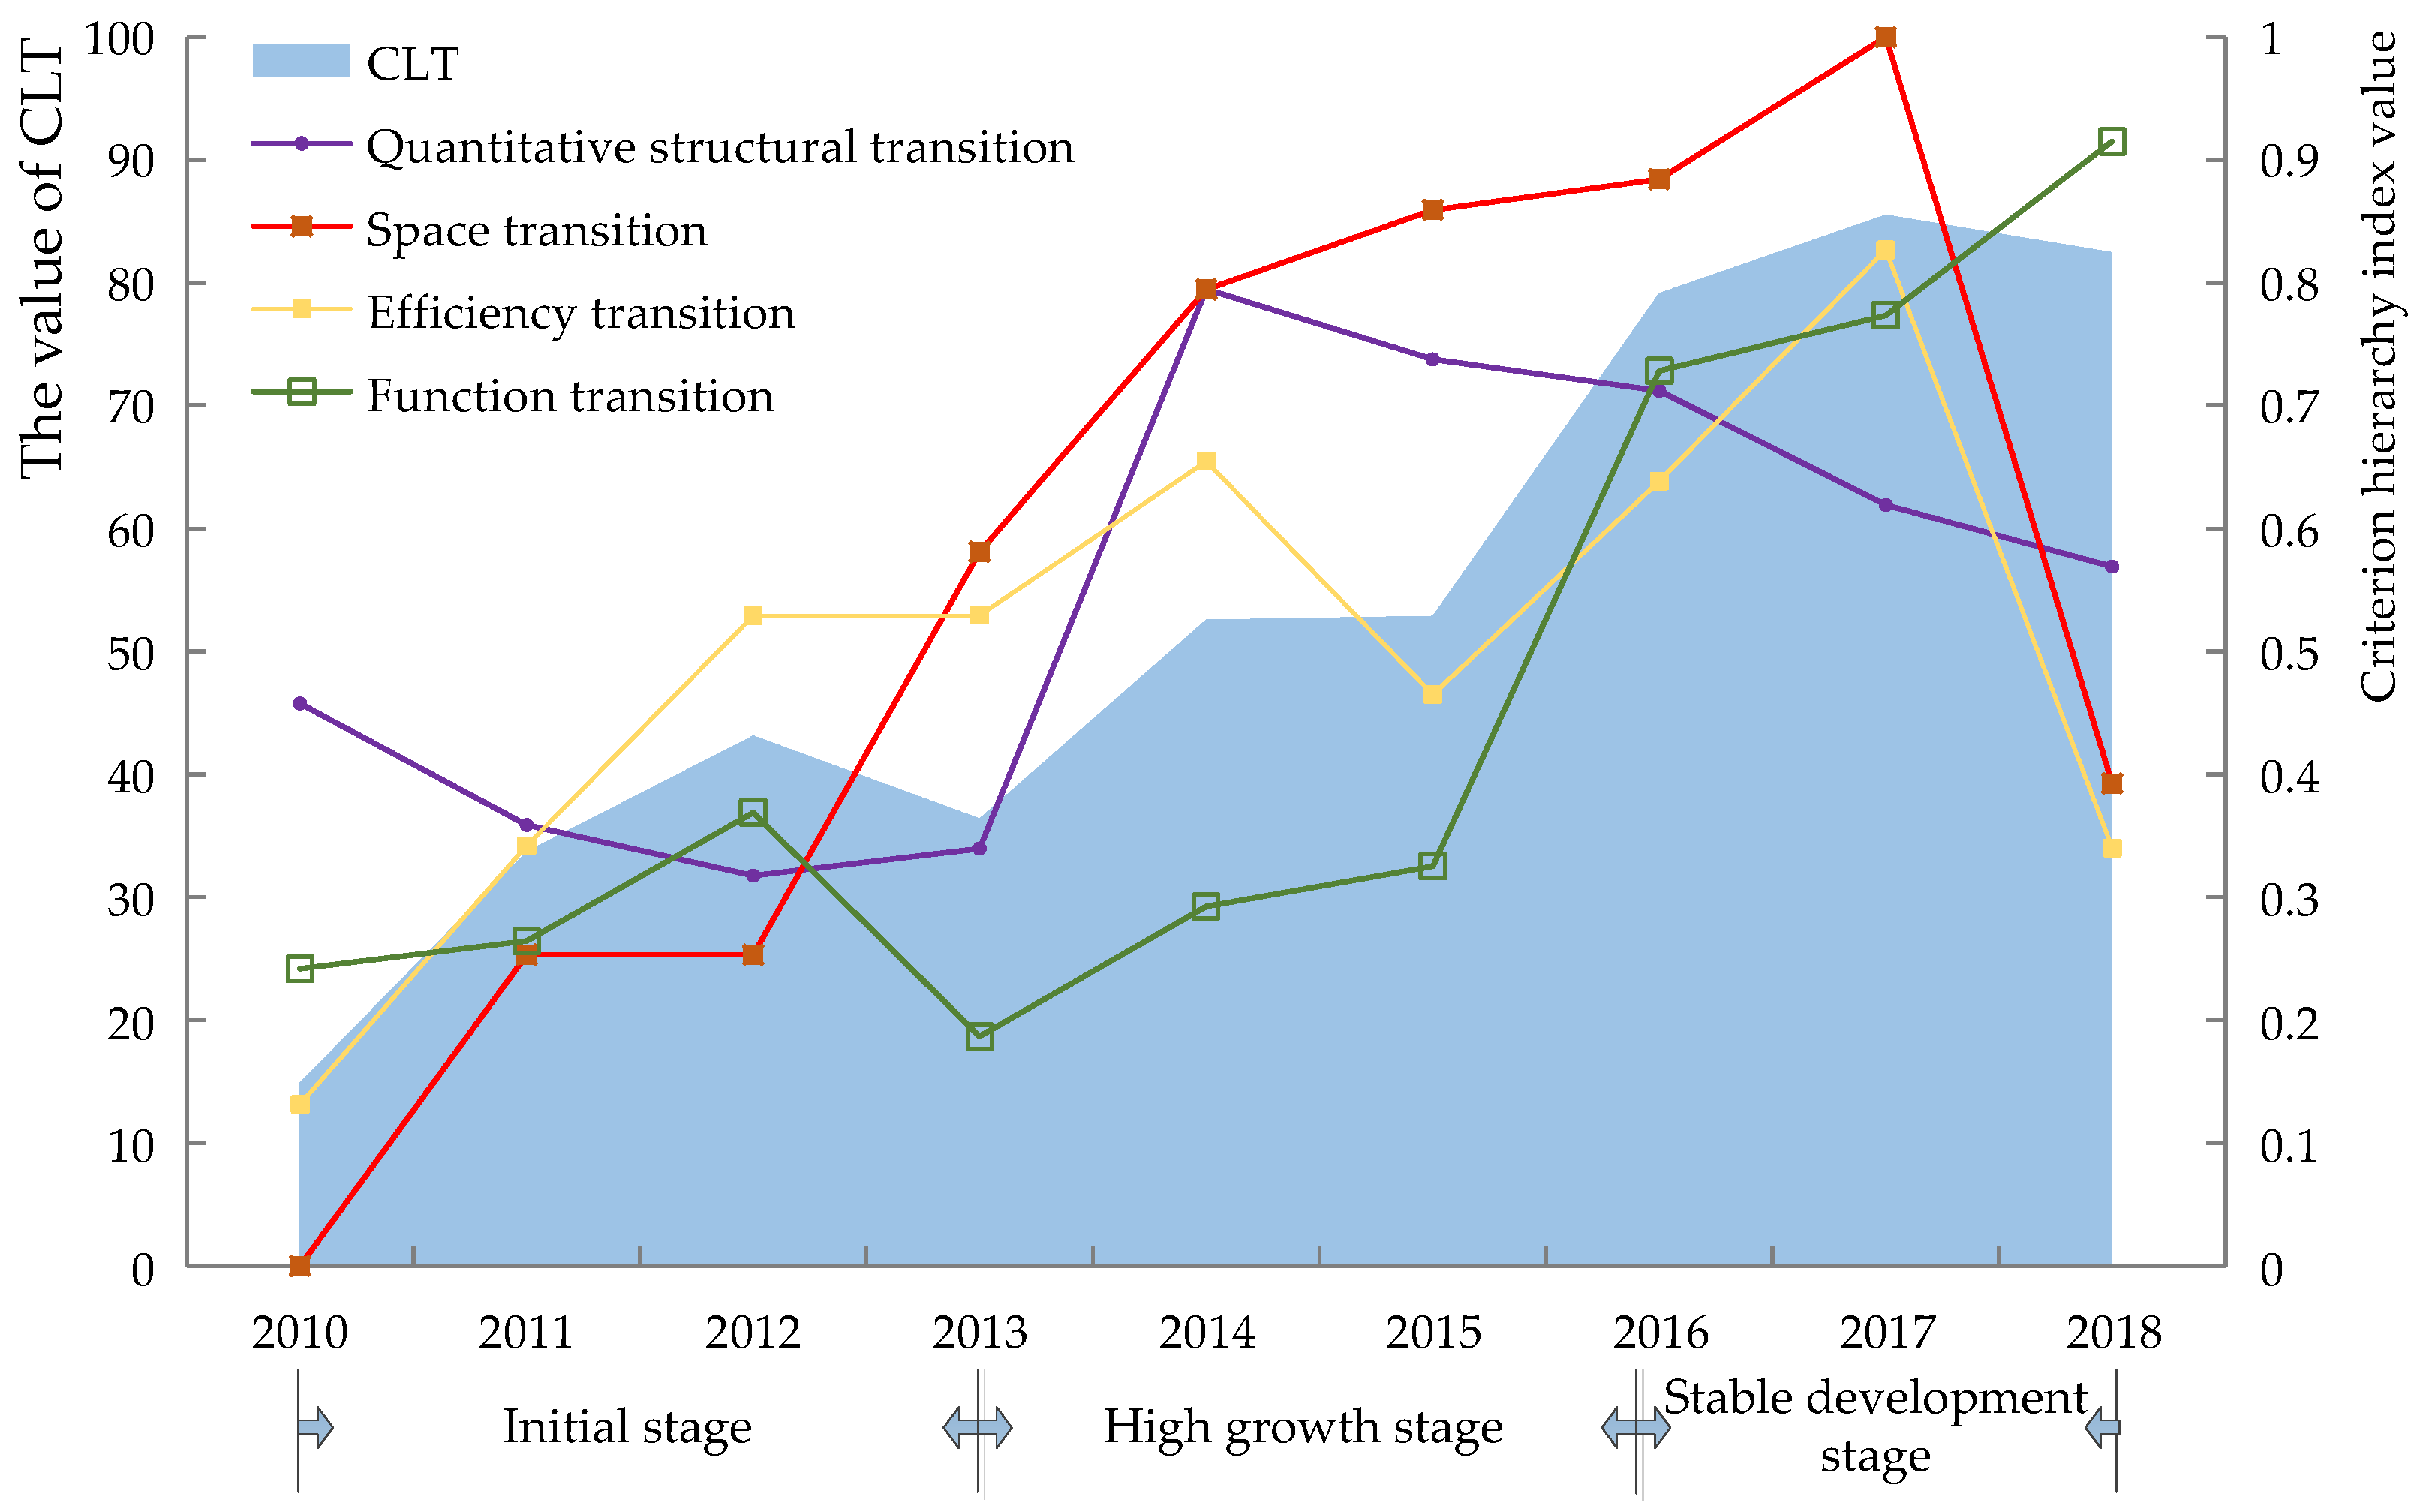
5.2. Analysis of Time Series Characteristics of CLT

Based on the multi-factor comprehensive evaluation model, the value of CLT and quantitative structure transition, space transition, efficiency transition, and function transition in the criterion hierarchy in Linqing County from 2010 to 2018 were calculated, as shown in Figure 7. The value of CLT reflected the overall level of CLT. The higher the value of CLT, the higher the level of CLT was reflected, otherwise, the lower it was. The values of quantitative structure transition, space transition, efficiency transition, and function transition all reflected the internal level of CLT.
From 2010 to 2018, the CLT index of Linqing County showed an overall trend of fluctuation and increase, and the transition trend was fine. According to the changing trend of the curve, CLT could be divided into three stages: initial stage (2010–2013), high growth stage (2013–2016), and stable development stage (2016–2018).
The initial stage of CLT was at a low level of growth. The index value increased from 23.68 to 48.63 in 2010–2012 and dropped to 38.59 in 2013. The transition of space and efficiency showed an increasing trend, while the value of the quantitative structure transition index declined year by year. It was speculated that, at this stage, Linqing County had promoted the link between the increase and decrease of construction land and the replacement of kiln factories, revitalizing idle land and promoting CLT, but the revitalized land was not sufficient to meet the development of Linqing County, which still sought new development by expanding the area of construction land, resulting in the structural transition of quantity being hindered. In 2013, the index value of functional transition dropped sharply. It was speculated that a number of new industrial projects in Linqing County were put into operation in 2013, resulting in high environmental pressure and low excellent air quality rate. The level of transition in the high growth stage had improved, and the index in 2016 increased to 79.13. The space transition index value was the highest; the functional transition index value increased significantly, the quantitative structure transition firstly increased and then decreased, and the efficiency transition showed an N-shaped change. In 2014, Linqing County responded to the evaluation of the economical and intensive utilization of construction land, tapping into the stock of construction land, while deeply promoting the work of increasing and reducing the linkage; the proportion of rural construction land decreased, so the level of internal transition all showed significant growth, but the development of transition was unstable, and internal transition fluctuated greatly. The stable development stage of transition was less volatile and at a higher level of development, indicating that the transition of construction land as a whole entered a new period of stable growth at this stage. It was worth noting that in 2018, except for the functional transition, all other transition levels had declined. In 2018, Linqing County achieved remarkable achievements in attracting investment and started more projects under construction; therefore, the levels of quantitative structural transition, efficiency transition, and space transition decreased.

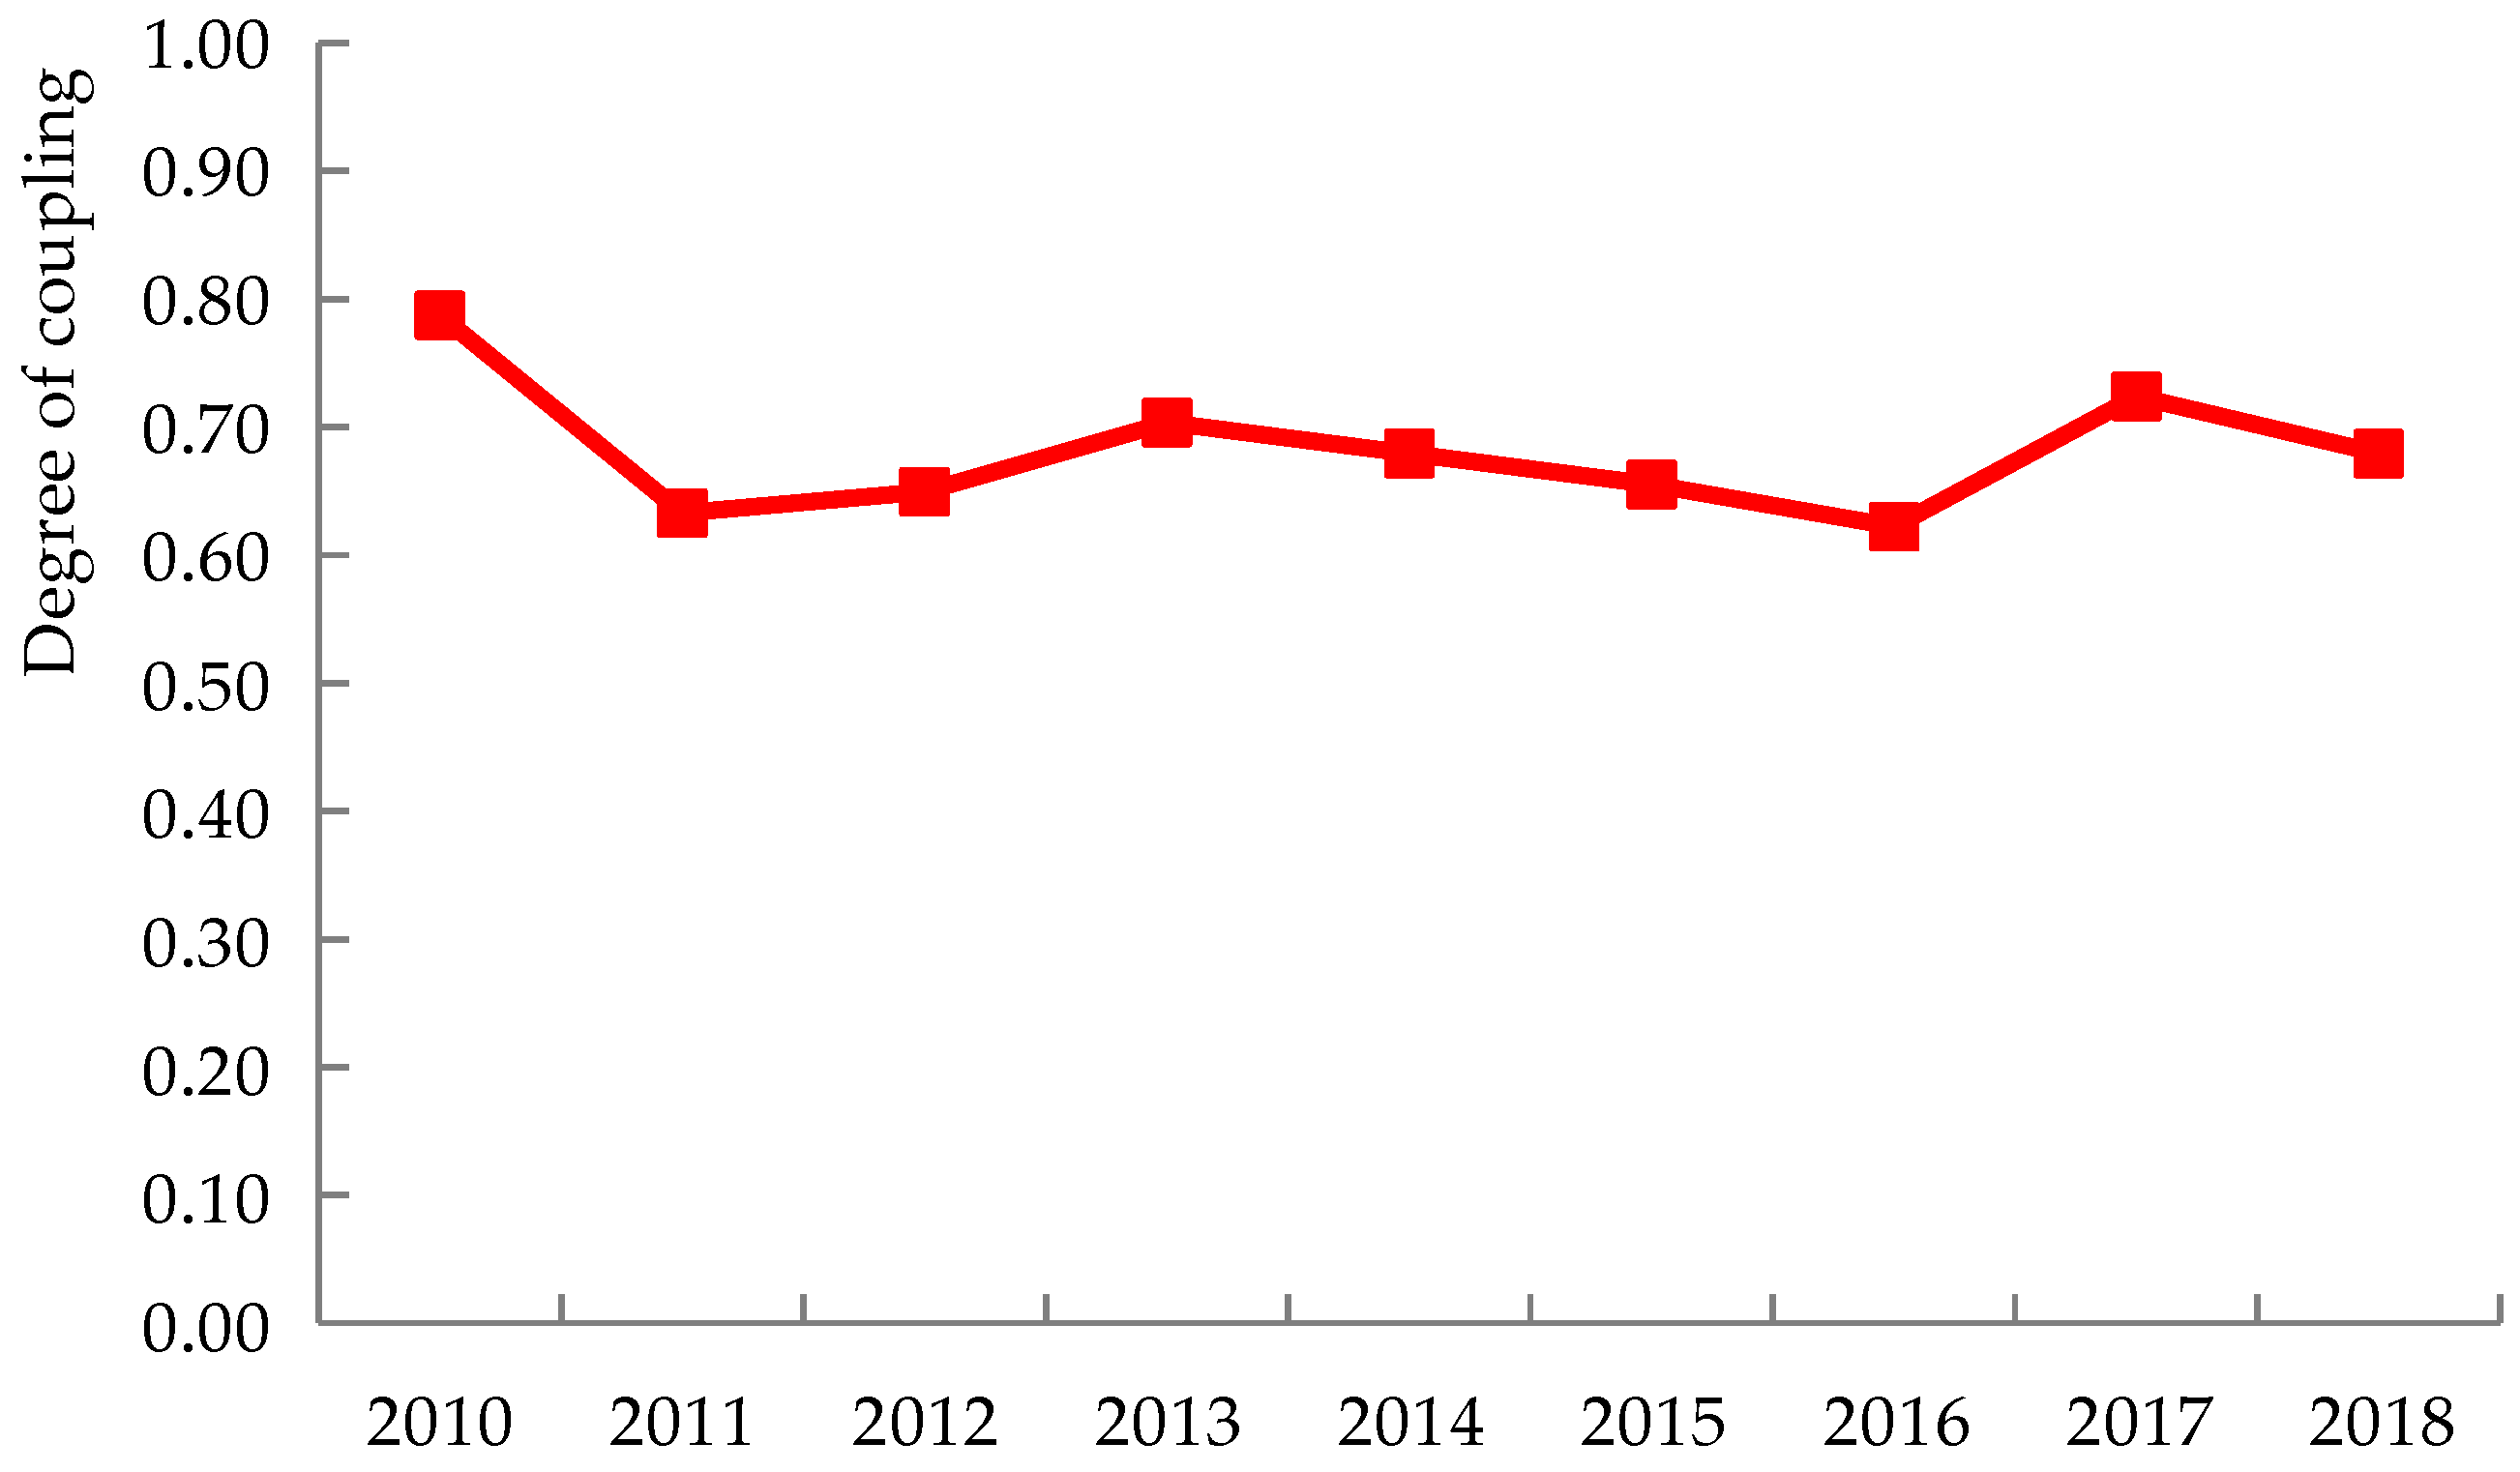
5.3. Analysis of Coupling Degree between RT and CLT

Based on the calculation of the coupling degree in the grey correlation model, the coupling relationship between RT and CLT in Linqing County is shown in Figure 8. Coupling is a phenomenon of mutual influence and mutual promotion [72]. The coupling degree of RT and CLT was calculated based on the grey correlation model, which could reflect the degree of mutual influence between RT and CLT on the whole.
From 2010 to 2018, the change in the coupling degree of RT and CLT was slight, and it was in the transformation stage from medium-to-high coupling level (0.60 < C ≤ 0.85). During the study period, the coupling degree in Linqing County was the largest and strongest in 2010. From 2011 to 2016, the coupling degree remained stable, and its value distribution was in the range of 0.60–0.70; in 2017, the coupling degree rose to 0.72; in 2018, the coupling degree dropped to 0.68, and the systems tended to develop orderly.
The high coupling between the two systems of RT and CLT indicated that the two systems were closely linked. RT promoted CLT, and RT also depended on CLT. In addition, the coupling degree decreased from 0.79 to 0.68 in 2010–2011. Combining Figure 5 and Figure 6, it could be seen that the two systems had developed and changed to different degrees after 2011, and the closeness of the two systems had been relatively weakened, so the coupling degree had decreased, but both were in the medium-to-high coupling level.

5.4. Analysis of the Correlation between RT and CLT

Based on the calculation of the correlation degree in the grey correlation model, the correlation degree of the coupling effect of each index of RT and CLT was calculated, and the matrix shown in Table 2 was obtained. The correlation degree reflected the internal linkage of the system, which is the degree of the interaction relationship between the elements of different systems [73]. Based on the grey correlation model, the correlation degree between RT and CLT reflected the interaction of the internal elements within the systems of RT and CLT.
According to Table 2, the correlation degrees of rural production, society, and economy transformation to CLT subsystems were 0.68, 0.66, and 0.68, respectively, which were relatively high correlation levels. Specifically, the ranking of the correlation among the indicators in RT to CLT was R12 = R22 = R31 = R32 > R11 > R21. The indicators of economy transformation had the highest correlation. It could be seen that the level of rural economy transformation played a leading role in CLT. Rural economic development could narrow the gap between urban and rural areas and reduce the loss of rural population, thereby alleviating the pressure on urban construction land and promoting the intensive utilization of rural construction land. The indicators of production transformation also showed a high correlation, with an increase in the agricultural output rate helping to liberate rural labor, promoting surplus labor to engage in secondary and tertiary industries, and increasing the proportion of non-agricultural labor, thereby improving the utilization efficiency of construction land.
The correlation degrees of space and function transition to RT were 0.73 and 0.70, respectively, which were both high correlations, while the correlation degrees of quantitative structure transition and efficiency transition were 0.63 and 0.62, respectively, which were at the middle and upper level of correlation. Specifically, the relationship between the indicators in CLT and RT was ranked as C41 > C12 = C42 > C21 > C22 > C31 > C32 > C43 > C11. The total retail sales of social consumer goods were an important indicator reflecting the degree of economic prosperity, and changes in the economic environment directly affected RT. The proportion of rural construction land was highly correlated, and the work of linking the increase and decrease of construction land was closely related to RT, providing a financial guarantee for RT. Construction land area, economic utilization efficiency, per capita construction land, and excellent air quality indicators were at a moderate level of correlation with RT. Generally speaking, RT would promote CLT, and construction land would be in a more intensive, efficient, and sustainable direction. However, the moderate correlation level reflected that construction land area, efficiency transition, and excellent air quality rate did not have a strong reaction to RT.

6. Discussions and Conclusions

6.1. Discussion

Under the background of urban–rural integrated development, factors flow between urban and rural areas frequently, but the dual system of urban and rural areas and the policy of giving priority to the development of cities have led to a shortage of urban construction land, hollowing out the countryside and economic decline. In response to problems such as insufficient rural development and the contradiction between the supply and demand of urban and rural construction land, China has implemented policies such as “Rural Revitalization” and “Linking the Increase and Decrease of Urban and Rural Construction Land”. After the implementation of the policies, the effect of RT and CLT and whether the coupling relationship between the two systems has improved need to be discussed. Simultaneously, the No. 1 Central Document in 2021 clearly required “speeding up the institutional channels for the equal exchange and two-way flow of urban and rural elements; standardizing the implementation of linking the increase and decrease of urban and rural construction land, improving the approval and implementation procedures, the transfer of surplus indicators and the mechanism for the distribution of proceeds” [83]. The orderly development of RT and CLT, as well as the coordination and synchronization of the two systems, is the key to rural revitalization [84].
The first contribution of this research was to carry out the coupling correlation study between RT and CLT from the county scale in the plain area. Due to its superior topographic conditions, the plain region has frequent urban-rural factor flows, and the market value of land is gradually becoming more prominent; land transition in the plain region has a significant contribution to RT [85]. Meanwhile, the county is an important entry point for integrated urban–rural development [83]. There are still gaps in the research conducted from the county scale in the plain area. Therefore, this research took Linqing County as the study area and carried out the coupling correlation study of RT and CLT, which was a powerful supplement to the existing coupling correlation research system of RT and CLT, and made up for the existing coupling correlation to a certain extent. This also provided a basis for Linqing County to achieve the aim of integrated urban–rural development.
The second contribution of this research was the introduction of the landscape pattern index to construct an explicit transition index system for construction land and the application of the DEA model to objectively measure the efficiency of construction land utilization and enrich the implicit transition index system. The evaluation of RT and CLT was the premise and basis for studying the coupling relationship between RT and CLT. This research constructed the RT e and the CLT evaluation index system to analyze the temporal characteristics of RT and CLT, respectively. At present, most of the studies on the evaluation of CLT focus only on the evaluation of explicit transition, analyzing the temporal characteristics of explicit transition in terms of quantity and structure, while spatial pattern, as one of the explicit forms of construction land, should also be included in the evaluation. In this research, a landscape pattern index was introduced to measure the space transition, which could reflect the spatial and temporal changes of landscape patterns at different scales [86]. The study found that the landscape pattern index was very sensitive to the identification of spatial pattern changes. In 2018, Linqing County had achieved remarkable achievements in attracting investment, with more projects under construction, and the agglomeration of construction land decreased. The evaluation value of space transition in 2018 had decreased accordingly, and the landscape pattern index could reflect the spatial pattern changes well. The implicit form transition of land use transition is still a part of land use transition to be further explored [87], and this research evaluated the implicit transition from two aspects: efficiency transition and function transition. In order to accurately measure the efficiency of construction land, the DEA model was introduced, and the economic efficiency of construction land was calculated by selecting total fixed assets, construction land area, and the number of employees in secondary and tertiary industries as input indicators. The added values of secondary and tertiary industries were selected as output indicators, from the perspective of three basic factors: people, land and capital. Applying the DEA model to measure the efficiency of the inputs and outputs of construction land has the advantages of being objective and concrete, and it can enrich the evaluation index system of the implicit transition of land utilization.
The third contribution of this research was the application of the grey correlation model to study in depth the correlation between the factors within the two systems of RT and CLT. RT drives CLT, and RT also depends on CLT. In order to further explore “how is CLT related to RT”, it is also necessary to explain in depth the coupling relationship between the factors within RT and CLT on the two systems. The grey correlation is a way to describe the system in depth. The grey correlation can deeply describe the relationship between multiple factors within the system, and it can evaluate the coupling relationship between the two systems as a whole, as well as measure the coupling relationship between the factors within the two systems, and it has the advantages of less calculation and high precision. The grey correlation model is widely used, and scholars have applied it to study the coordination relationship between tourism and regional development [88], the coupling relationship between land use efficiency and urbanization [89], and other fields. Some scholars have applied the coupled coordination model to study the coupling degree between RT and land use transformation [90], but the coupled coordination model cannot deeply analyze the coupling association of factors within the two systems, and this study innovatively introduced the grey correlation model to make up for the disadvantages that the coupled coordination model cannot analyze the correlation relationship between the internal elements, and it enriches RT and CLT. This study had introduced the grey correlation model to compensate for the disadvantages of the coupled coordination model in analyzing the correlation between the internal elements, and it enriched the research methods of coupling correlation between RT and CLT.
This research found that RT and CLT in Linqing County experienced profound changes from 2010 to 2018, and the level of RT and CLT had been continuously improved. These findings were very similar to the existing research by Wang Jin [22], but they differed from the results of Taigu District, where the stages of CLT and RT were highly coincident. The somewhat fluctuating internal CLT in Linqing County compared to the internal CLT is due to the inflexible quantitative structure transition, reflecting the inconsistency between the increase in urban construction land and the decrease in rural residential land [19]. Therefore, Linqing County should continue to give priority to excavating the construction land, to take the opportunity of the Third National Land Survey to find out the utilization, output, and ownership of construction land, and to promote CLT in a planned manner. The level of coupling between RT and CLT in Linqing County from 2010 to 2018 was high, and the association between the two systems was strong. This result was consistent with the findings of Xu Fengjiao [55]. The economy transformation of RT played a dominant role in the CLT. In order to improve the coupling level between the two systems, Linqing County should rely on the advantages of rural resources, accelerate industrial revitalization, actively promote the development of clusters of various types of agricultural-friendly industrial chains, provide a large number of jobs, and attract talents back to the countryside, thus promoting economy transformation. Quantitative structure transition and efficiency transition had not strongly acted on RT. The relationship between human and land for construction land in Linqing County still needs further adjustments, with efficiency transition as a grip to guide construction land to dig deeper, control the scale of construction land, improve the efficiency of construction land, and strengthen the correlation between CLT and RT.
This research examined the time series characteristics and coupling relationship between RT and CLT from the county scale. In the future, the spatial characteristics of RT and CLT should be explored, and the coupling relationship between RT and CLT can be revealed at the microscopic scale of villages and farm households to enrich the study of the coupling relationship between RT and CLT. It was found that the landscape pattern index can well reflect the spatial pattern changes. The landscape pattern index reflecting the spatial agglomeration was selected to measure the space transition of construction land in the plain area in the study, and when the landscape pattern index is applied to study the space transition of land use in other areas, different landscape pattern indices can be selected according to the geographical characteristics of the study area. The grey correlation model has the advantages of high precision, less computation, and wide application, and it can be directly applied to the study of coupled correlation between RT and CLT in other regions.

6.2. Conclusions

With the acceleration of the urbanization process in China, the contradiction between urban and rural construction land supply and demand has emerged, and the hollowing out of the countryside and economic decline have made RT and CLT unstoppable. Under the background of urban–rural integration development, there are coupled and interrelated relationships between the two systems and elements within the system of RT and CLT. The research took Linqing County in the plain region of China as the research area, and took 2010–2018 as the research period, constructed RT and CLT index system to evaluate the transformation level of the two systems, and used the grey correlation model to measure the coupling degree and correlation degree of the two systems and explore their coupling and correlation relationships. The results and discussion of this research were as follows:
(1)
In general, RT and CLT were divided into three stages, with 2013 and 2016 as time points. RT and CLT in Linqing County had undergone profound changes, and the level of both RT and CLT had been continuously improved, but the internal transition of CLT fluctuated greatly.
(2)
RT and CLT had been in the middle to upper level of coupling, and the connection between the two systems was relatively closely linked; promoting RT effectively promoted CLT, while RT relied largely on CLT, and the system tended to develop in an orderly manner.
(3)
The RT subsystem and CLT had a high degree of correlation, with the economy transformation having the highest degree of correlation. Quantitative structure transition and efficiency transition in the CLT subsystem were relatively low in relation to RT. Linqing County still needs to adjust the relationship between humans and land, take the efficiency transition as the grasp, guide the construction land to dig deeper, and strengthen the correlation between RT and CLT.

Author Contributions

Conceptualization, A.W.; methodology, B.S.; software, B.S.; investigation, J.L. and Y.L.; resources, H.W.; writing—original draft preparation, B.S. and A.W.; writing—review and editing, B.S., J.L. and A.W.; visualization, B.S.; funding acquisition, A.W. All authors have read and agreed to the published version of the manuscript.

Funding

This research was funded by the National Social Science Fund of China, grant number (20&ZD090); Shandong Natural Science Foundation, grant number (ZR2019MD014); and Shandong Natural Science Foundation, grant number (ZR2013DM006).

Institutional Review Board Statement

Not applicable.

Informed Consent Statement

Not applicable.

Data Availability Statement

The data used to support the findings of this study are available from the corresponding author upon request.

Acknowledgments

The authors would like to thank the editors and reviewers for their helpful comments.

Conflicts of Interest

The authors declare no conflict of interest.

References

  1. Jiang, C.J.; Li, J.T.; Liu, J.L. Does urbanization affect the gap between urban and rural areas? Evidence from China. Socio-Econ. Plan. Sci. 2022, 101271. [Google Scholar] [CrossRef]
  2. Diao, X.S.; Eduardo, M.; Jed, S. Cities and rural transformation: A spatial analysis of rural livelihoods in Ghana. World Dev. 2019, 121, 141–157. [Google Scholar] [CrossRef]
  3. Zhang, L.; Wang, B. ROK’s new village movement and its enlightenment to our country’s strategy of rural revitalization. Collect. Pap. Korean Stud. 2021, 1, 179–191. [Google Scholar]
  4. Gideon, K.; Khondoker, A.M.; Kindie, T.; Subir, B.; Richard, R.; Diagne, M.; Aymen, F.; Sika, G.; Arega, A.; Steve, P. Rural transformation and the future of cereal-based agri-food systems. Glob. Food Sec. 2020, 26, 100441. [Google Scholar] [CrossRef]
  5. Jin, K.S. Inclusive growth through Saemaul Undong in Korea. Area Dev. Policy 2019, 4, 399–415. [Google Scholar] [CrossRef]
  6. Noble, V. Mobilities of the one-product policy from Japan to Thailand: A critical policy study of OVOP and OTOP. Territ. Polit. Gov. 2019, 7, 455–473. [Google Scholar] [CrossRef]
  7. Capo, E. Transformation and development in Italian rural society. Sociol. Ruralis. 1995, 35, 297–308. [Google Scholar] [CrossRef]
  8. Mahon, M.; Fahy, F.; Cinnéide, M.O. The significance of quality of life and sustainability at the urban-rural fringe in the making of place-based community. GeoJournal 2012, 77, 265–278. [Google Scholar] [CrossRef]
  9. Nelson, P.B. Rural restructuring in the American west: Land use, family and class discourses. J. Rural Stud. 2001, 17, 395–407. [Google Scholar] [CrossRef]
  10. Sofer, M.; Applebaum, L. The rural space in Israel in search of renewed identity: The case of the moshav. J. Rural Stud. 2006, 22, 323–336. [Google Scholar] [CrossRef]
  11. Su, S.L.; Jiang, Z.L.; Zhang, Q.; Zhang, Y. Transformation of agricultural landscapes under rapid urbanization: A threat to sustainability in Hang-Jia-Hu region, China. Appl. Geogr. 2011, 31, 439–449. [Google Scholar] [CrossRef]
  12. Dandekar, M.N. Transformation in agriculture and rural development. J. Rural Dev. 1988, 7, 541–559. [Google Scholar]
  13. Gibson, K.; Cahill, A.; Mckay, D. Rethinking the dynamics of rural transformation: Performing different development pathways in a Philippine municipality. Trans. Inst. Br. Geogr. 2010, 35, 237–255. [Google Scholar] [CrossRef]
  14. López, S.; Sierra, R. Agricultural change in the Pastaza River basin: A spatially explicit model of native Amazonian cultivation. Appl. Geogr. 2010, 30, 355–369. [Google Scholar] [CrossRef]
  15. Mahmoud, M.; Vogt, J. Socio-economic transformation in rural areas: From agriculture to limestone in a coptic village in middle Egypt. Extract. Ind. Soc. 2021, 8, 100946. [Google Scholar] [CrossRef]
  16. Jenerette, G.D.; Potere, D. Global analysis and simulation of land-use change associated with urbanization. Lands. Ecol. 2010, 25, 657–670. [Google Scholar] [CrossRef]
  17. Zhou, T.; Jiang, G.H.; Zhang, R.J.; Zheng, Q.Y.; Ma, W.Q.; Zhao, Q.L.; Li, Y.L. Addressing the rural in situ urbanization (RISU) in the Beijing–Tianjin–Hebei region: Spatio-temporal pattern and driving mechanism. Cities 2018, 75, 59–71. [Google Scholar] [CrossRef]
  18. Lv, X.; Huang, X.J.; Zhang, Q.J. A literature review on urban-rural construction land transition. City Plan. Rev. 2015, 39, 105–112. [Google Scholar] [CrossRef]
  19. Qu, Y.B.; Jiang, G.H.; Tian, Y.Y.; Shan, R.; Wei, S.W.; Li, Y.L. Urban-rural construction land transition (urclt) in Shandong Province of China: Features measurement and mechanism exploration. Habitat Int. 2019, 86, 101–115. [Google Scholar] [CrossRef]
  20. Du, W.X.; Zhao, Z.Z.; Lv, X.; Lu, J.Y.; Wang, C.; Qian, D.Y. A review on urban-rural land use transition in China. Chin. J. Soil Sci. 2021, 52, 493–504. [Google Scholar] [CrossRef]
  21. Li, T.T.; Long, H.L. Rural development from viewpoints of transformation and coordination: A case in Shandong Province. Prog. Geogr. 2014, 33, 531–541. [Google Scholar] [CrossRef]
  22. Wang, J.; Zhao, C.; Han, M. Evaluation of Coordinated Development between Urban-Rural Construction Land Transition and Rural Transformation and Diagnosis of Obstacle Factors. Chin. J. Agric. Resour. Reg. Plan. 2021, 1–14. Available online: http://kns.cnki.net/kcms/detail/11.3513.S.20210901.1109.015.html (accessed on 21 March 2022).
  23. Wang, Y.; Liu, H.; Chen, X.H.; Song, Y.T. Evolution characteristics and division of regional types of correlation coupling of urban-rural systems: A case study of the three provinces of Northeast China. Sci. Geogr. Sin. 2020, 40, 1150–1159. [Google Scholar] [CrossRef]
  24. Tan, X.R.; Deng, J.L. A new method of grey correlation analysis for multivariate statistical analysis. Stat. Res. 1995, 03, 46–48. [Google Scholar] [CrossRef]
  25. Belton, B.; Filipski, M. Rural transformation in central Myanmar: By how much, and for whom? J. Rural Stud. 2019, 67, 166–176. [Google Scholar] [CrossRef]
  26. Wang, F.; Ye, C.S. Coupling relationship between rural transformation and land use change in ecological economic zone of Poyang Lake. Res. Soil Water Conserv. 2018, 25, 284–291. [Google Scholar] [CrossRef]
  27. Liu, Y.S.; Yang, R. The spatial characteristics and formation mechanism of the county urbanization in China. Acta Geogr. Sin. 2012, 67, 1101–1110. [Google Scholar]
  28. Chen, K.Q.; Long, H.L.; Liao, L.W.; Tu, S.S.; Li, T.T. Land use transitions and urban-rural integrated development: Theoretical framework and China’s evidence. Land Use Policy 2020, 92, 104465. [Google Scholar] [CrossRef]
  29. Prato, B. Opportunities and challenges for ‘rural transformation’ in the 2030 Agenda. Development 2015, 58, 187–195. [Google Scholar] [CrossRef]
  30. Elshof, H.; Haartsen, T.; Van Wissen, L.J.G.; Mulder, C.H. The influence of village attractiveness on flows of movers in a declining rural region. J. Rural Stud. 2017, 56, 39–52. [Google Scholar] [CrossRef] [Green Version]
  31. Petrescu-Mag, R.M.; Petrescu, D.C.; Azadi, H. From scythe to smartphone: Rural transformation in Romania evidenced by the perception of rural land and population. Land Use Policy 2022, 113, 105851. [Google Scholar] [CrossRef]
  32. Carletto, C.; Corral, P.; Guelfi, A. Agricultural commercialization and nutrition revisited: Empirical evidence from three African countries. Food Policy 2017, 67, 106–118. [Google Scholar] [CrossRef] [PubMed] [Green Version]
  33. Long, H.L.; Zou, J.; Pykett, J.; Li, Y.R. Analysis of rural transformation development in China since the turn of the new millennium. Appl. Geogr. 2011, 31, 1094–1105. [Google Scholar] [CrossRef]
  34. Marsden, T.K.; Whatmore, J.S.; Munton, J.C.R. Uneven development and the restructuring process in British agriculture: A preliminary exploration. J. Rural Stud. 1987, 3, 297–308. [Google Scholar] [CrossRef]
  35. Wilson, G.A. From productivism to post-productivism … and back again? Exploring the (un)changed natural and mental landscapes of European agriculture. Trans. Inst. Br. Geogr. 2001, 26, 77–102. [Google Scholar] [CrossRef]
  36. Lowe, P.; Buller, H.; Ward, N. Setting the next agenda? British and French approaches to the second pillar of the Common Agricultural Policy. J. Rural Stud. 2002, 18, 1–17. [Google Scholar] [CrossRef]
  37. Holmes, J. Impulses towards a multifunctional transition in rural Australia: Gaps in the research agenda. J. Rural Stud. 2006, 22, 142–160. [Google Scholar] [CrossRef]
  38. Cloke, P. An index of rurality for England and Wales. Reg. Stud. 1977, 11, 31–46. [Google Scholar] [CrossRef]
  39. Halfacree, K.H. Locality and social representation: Space, discourse and alternative definitions of the rural. J. Rural Stud. 1993, 9, 23–37. [Google Scholar] [CrossRef]
  40. Harrington, V.; O’donoghue, D. Rurality in England and Wales 1991: A replication and extension of the 1981 rurality index. Sociol. Ruralis. 1998, 38, 178–203. [Google Scholar] [CrossRef]
  41. Woods, M. Performing rurality and practicing rural geography. Prog. Hum. Geog. 2010, 34, 835–846. [Google Scholar] [CrossRef]
  42. He, Y.H.; Fan, S.G.; Zhou, G.H.; Tang, C.L.; Peng, P. Evaluation of rural transformation development in Hunan Province based on major function-oriented zoning. Prog. Geogr. 2018, 37, 667–676. [Google Scholar] [CrossRef] [Green Version]
  43. Zhou, F.L.; Liao, H.P.; Zhang, Q.Q. Coupling and coordination of rural “People, land and industry” transformation the perspective of economic gradient. J. Southwest Univ. Nat. Sci. Ed. 2021, 43, 129–141. [Google Scholar] [CrossRef]
  44. Fahmi, F.Z.; Sari, I.D. Rural transformation, digitalization and subjective wellbeing: A case study from Indonesia. Habitat Int. 2020, 98, 102150. [Google Scholar] [CrossRef]
  45. Mather, A.; Needle, C. The forest transition: A theoretical basis. Area 1998, 30, 117–124. [Google Scholar] [CrossRef]
  46. Long, H.L.; Qu, Y. Land use transitions and land management: A mutual feedback perspective. Land Use Policy 2018, 74, 111–120. [Google Scholar] [CrossRef]
  47. Long, H. Land Use Transitions and Rural Restructuring in China; Springer Nature: Singapore, 2020; pp. 31–160. [Google Scholar]
  48. Ge, D.; Long, H.; Zhang, Y.; Ma, L.; Li, T. Farmland transition and its influences on grain production in China. Land Use Policy 2018, 70, 94–105. [Google Scholar] [CrossRef]
  49. Zhou, X.P.; Li, X.T.; Song, W.; Kong, X.B.; Lu, X. Farmland transitions in China: An advocacy coalition approach. Land 2021, 10, 122. [Google Scholar] [CrossRef]
  50. Jiang, G.H.; He, X.; Qu, Y.; Zhang, R.; Meng, Y. Functional evolution of rural housing land: A comparative analysis across four typical areas representing different stages of industrialization in China. Land Use Policy 2016, 57, 645–654. [Google Scholar] [CrossRef]
  51. Qu, Y.; Dong, X.; Zhan, L.; Si, H.; Ping, Z.; Zhu, W. Scale transition and structure–function synergy differentiation of rural residential land: A dimensionality reduction transmission process from macro to micro scale. Land 2021, 10, 647. [Google Scholar] [CrossRef]
  52. Long, H.; Zhang, Y.; Ma, L.; Tu, S. Land use transitions under rapid urbanization: A perspective from developing China. Land 2021, 10, 935. [Google Scholar] [CrossRef]
  53. Zhu, C.M.; Zhang, X.L.; Wang, K.; Yuan, S.F.; Yang, L.X.; Skitmore, M. Urban–rural construction land transition and its coupling relationship with population flow in China’s urban agglomeration region. Cities 2020, 101, 102701. [Google Scholar] [CrossRef]
  54. Zhao, C.; Wang, J.; Liu, H.F.; Guo, Y.L.; Han, Y. Characteristics and impact of urban-rural construction land transformation in Taigu District, Shanxi Province. Jiangsu Agric. Sci. 2021, 49, 204–212. [Google Scholar] [CrossRef]
  55. Xu, F.J.; Lv, X.; Chen, C.L. Spatial-temporal pattern of urban-rural construction land transition in Shandong Province. J. Nat. Resour. 2017, 32, 1554–1567. [Google Scholar] [CrossRef]
  56. Yang, Y.; Bao, W.; Li, Y.; Wang, Y.; Chen, Z. Land use transition and its eco-environmental effects in the Beijing–Tianjin–Hebei urban agglomeration—A production–living–ecological perspective. Land 2020, 9, 285. [Google Scholar] [CrossRef]
  57. Chen, C.L.; Zhang, Q.J.; Zhu, P.X. Spatial-temporal evolution characteristics of urban-rural construction land in developed areas: A case study of Tongzhou in Jiangsu Province. Chin. J. Soil Sci. 2018, 49, 537–545. [Google Scholar] [CrossRef]
  58. Li, Z.J.; Ma, X.D.; Sun, S.S. Coupling analysis of rural transformation and land use change in Northern Jiangsu: A case study of Peixian County. J. Jiangsu Norm. Univ. Nat. Sci. Ed. 2015, 33, 36–39. [Google Scholar] [CrossRef]
  59. Long, X.Y.; Guo, Y.K. Research on the function evolution and driving mechanism of rural homestead in Luxian County under the “Rural Revitalization”. Procedia Comput. Sci. 2022, 199, 969–976. [Google Scholar] [CrossRef]
  60. Liao, L.W.; Long, H.L.; Ma, E. Rural labor change and farmland use transition. Econ. Geogr. 2021, 41, 148–155. [Google Scholar] [CrossRef]
  61. Ge, D.Z.; Wang, Z.H.; Tu, S.S.; Long, H.L.; Yan, H.L.; Sun, D.Q.; Qiao, W.F. Coupling analysis of greenhouse-led farmland transition and rural transformation development in China’s traditional farming area: A case of Qingzhou City. Land Use Policy 2019, 86, 113–125. [Google Scholar] [CrossRef]
  62. Qu, S.J.; Hu, S.G.; Li, Q.F. Stages and spatial patterns of urban built-up land transition in China. Acta Geogr. Sin. 2020, 75, 1539–1553. [Google Scholar] [CrossRef]
  63. Han, D.; Qiao, J.; Zhu, Q. Rural-spatial restructuring promoted by land-use transitions: A case study of Zhulin Town in central China. Land 2021, 10, 234. [Google Scholar] [CrossRef]
  64. Rudel, T.K.; Coomes, O.T.; Moran, E.F.; Achard, F.; Angelsen, A.; Xu, J.; Lambin, E.F. Forest transitions: Towards a global understanding of land use change. Proc. Natl. Acad. Sci. USA 2005, 15, 23–31. [Google Scholar] [CrossRef]
  65. Guo, Y.Z.; Liu, Y.S. Poverty alleviation through land assetization and its implications for rural revitalization in China. Land Use Policy 2021, 105, 105418. [Google Scholar] [CrossRef]
  66. Liu, Y.L.; Luo, T.; Liu, Z.Q.; Kong, X.S.; Li, J.W.; Tan, R.H. A comparative analysis of urban and rural construction land use change and driving forces: Implications for urban-rural coordination development in Wuhan, Central China. Habitat Int. 2015, 47, 113–125. [Google Scholar] [CrossRef]
  67. Li, T.; Liao, H.; Yang, W.; Zhang, W.; Shi, J. Urbanization quality over time and space as well as coupling coordination of land, population and industrialization in Chongqing. Econ. Geogr. 2015, 35, 65–71. [Google Scholar] [CrossRef]
  68. Long, H.L.; Ge, D.Z.; Wang, J.Y. Progress and prospects of the coupling research on land use transitions and rural transformation development. Acta Geogr. Sin. 2019, 74, 2547–2559. [Google Scholar] [CrossRef]
  69. Zhang, R.T.; Zhang, X.L.; Lu, J.F.; Li, C.W. Rural transformation development pattern and mechanism in China. Hum. Geogr. 2021, 36, 138–147. [Google Scholar] [CrossRef]
  70. Liu, Y.S.; Yang, R. The spatial pattern measure of urban-rural development transformation in the Bohai Rim region in China. Acta Geogr. Sin. 2015, 70, 248–256. [Google Scholar] [CrossRef]
  71. Cai, Y.L. The mechanisms of cropland conservation in Chinese rural transformation. Sci. Geogr. Sin. 2001, 21, 1–6. [Google Scholar]
  72. Gao, N.; Ma, Y.F.; Li, T.S.; Zhao, D.P.; Lin, Z.H. Study on spatio-temporal differences in coupling relationship between Chinese inbound tourism and import trade during 1993 to 2010. Econ. Geogr. 2012, 32, 143–148, 161. [Google Scholar] [CrossRef]
  73. Men, K.P.; Guan, L.L.; Yin, X.Z. Prediction of China’s population based on two new grey models. Econ. Geogr. 2007, 6, 942–945. [Google Scholar] [CrossRef]
  74. Ma, X.D.; Li, X.; Gu, X.B.; Hu, R. The characteristics and path of urban-rural transition in Huaihai Economic Zone from the perspective of urban-rural integration. J. Nat. Resour. 2020, 35, 1853–1866. [Google Scholar] [CrossRef]
  75. Lu, D.M.; Yang, X.J.; Shi, Y.Z.; Wang, Z.Q. Rural regime shifts and transformation development on the Loess Plateau. Acta Geogr. Sin. 2020, 75, 348–364. [Google Scholar] [CrossRef]
  76. Yao, Y.; Li, J.F.; Yang, Y.Y. Study on social economic function transformation and coordination evaluation of urban construction land use in middle reaches of Yangtze River. Areal Res. Dev. 2018, 37, 128–133. [Google Scholar] [CrossRef]
  77. Zhang, L.X.; Zhu, D.L.; Du, T. Spatiotemporal pattern evolvement and driving factors of urban construction land use efficiency using data envelopment analysis. Resour. Sci. 2017, 39, 418–429. [Google Scholar]
  78. Hong, S.H.; Barry, E.D.Z.; David, J.M. An aggregation index (AI) to quantify spatial patterns of landscapes. Lands. Ecol. 2000, 15, 591–601. [Google Scholar] [CrossRef]
  79. Tong, Y.; Niu, H.P.; Fan, L.X. Spatial pattern evolution of rural settlements and the influencing factors under different urbanization process. J. Henan Agric. Univ. 2019, 53, 152–160. [Google Scholar] [CrossRef]
  80. Xu, H.X.; Liu, Y.J. Spatiotemporal differentiation and influencing mechanism of construction land use efficiency of shrinking cities: A case study of Yichun City of Heilongjiang Province. Prog. Geogr. 2021, 40, 937–947. [Google Scholar] [CrossRef]
  81. Wang, C.Y. Analysis on the utilization efficiency of urban construction land in Yunnan Province based on the three-stage DEA model. Anhui Agric. Sci. Bull. 2020, 26, 109–113. [Google Scholar] [CrossRef]
  82. Liu, Y.B.; Li, R.D.; Song, X.F. Grey associative analysis of regional urbanization and eco-environment coupling in China. Acta Geogr. Sin. 2005, 60, 237–247. [Google Scholar] [CrossRef]
  83. China to Fully Advance Rural Vitalization, Facilitate Modernization of Agriculture, Rural Areas. Available online: http://www.gov.cn/xinwen/2021-02/21/content_5588098.htm (accessed on 10 March 2022). (In Chinese)
  84. Long, H.L.; Tu, S.S. Land use transition and rural vitalization. China Land Sci. 2018, 32, 1–6. [Google Scholar] [CrossRef]
  85. Zhu, J.G.; Hou, Z.X.; Li, X.J.; Xu, J.W. The effect and mechanism of urbanization on rural revitalization in China. Econ. Geogr. 2022, 42, 200–209. [Google Scholar] [CrossRef]
  86. Fu, F.; Deng, S.M.; Wu, D.; Liu, W.W.; Bai, Z.H. Research on the spatiotemporal evolution of land use landscape pattern in a county area based on CA-Markov model. Sustain. Cities Soc. 2022, 80, 103760. [Google Scholar] [CrossRef]
  87. Long, H.; Zhang, Y.; Ma, L.; Tu, S. Land use transitions: Progress, challenges and prospects. Land 2021, 10, 903. [Google Scholar] [CrossRef]
  88. Zhu, L.Q.; Li, Q.Y.; Liu, J.S. Coordination relationship between tourism development and regional development with improvement of people’s livelihood in China. Sci. Geogr. Sin. 2020, 40, 1328–1335. [Google Scholar] [CrossRef]
  89. Zhang, Z.Y.; Zhu, J.W.; Xie, J.C.; Zhang, Y.J.; Ma, Z.H. Coupling coordination between land use benefits and urbanization in Xi’an City. Res. Soil Water Conserv. 2020, 27, 308–316. [Google Scholar] [CrossRef]
  90. Zhang, Y.; Ge, J.F. On coordination evaluation of rural transitional development and land use transformation in Anhui Province. Sci. Technol. Manag. Land Resour. 2018, 35, 69–82. [Google Scholar] [CrossRef]
Figure 1. Theoretical framework of RT and CLT.
Land 11 00641 g001
Figure 2. Location of the study area.
Land 11 00641 g002
Figure 3. Methodology and logic.
Land 11 00641 g003
Figure 4. Evaluation index system of RT.
Land 11 00641 g004
Figure 5. Evaluation index system of CLT.
Land 11 00641 g005
Figure 6. Level of RT in Linqing County from 2010 to 2018.
Land 11 00641 g006
Figure 7. Level of CLT in Linqing County from 2010 to 2018.
Land 11 00641 g007
Figure 8. Coupling degree of RT and CLT in Linqing County from 2010 to 2018.
Land 11 00641 g008
Table 1. Weight value of the evaluation index for RT and CLT.
Target HierarchyCriterion HierarchyWeightLowest HierarchyWeightCalculationUnitProperties
RTR10.39R110.59(Agricultural workforce/total workforce) × 100%Negative
R120.41Agricultural output value/agricultural employeesRMB/personPositive
R20.29R210.52Actual valueMillion KWhPositive
R220.48((Number of rural low-income earners-last year’s rural low-income earners)/last year’s low-income earners) × 100%Positive
R30.32R310.38Actual valueRMB/personPositive
R320.62Actual valueRMB/personPositive
CLTC10.23C110.39Actual valueHectaresNegative
C120.61(Area of rural settlements/area of construction land) × 100%Negative
C20.13C210.46Actual value, note ① [78]NonePositive
C220.54Actual value, note ② [79]NoneNegative
C30.22C310.59Calculated from DEA, note ③ [80,81]NonePositive
C320.41Total building land area/total resident populationHectares/personNegative
C40.42C410.32Actual valueMillionPositive
C420.44Number of health institutions/resident populationIndividualPositive
C430.24Actual value%Positive
Note: ① A I = [ g i m a x g i ] ( g i is the number of public edges of adjacent grids of the ith patch of construction land; m a x g i is the maximum possible number of common edges among grids); ② L S I = 0.25 e h (e is the patch length of construction land; h is the patch area of construction land); ③ m i n { ω ϵ ( e ^ T S + e ^ T S + ) } ; s . t . { t = 1 n X t μ t + S = ϑ X 0 t = 1 n Y t μ t S + = Y 0   μ t 0 , S , S + 0 ( ω is the comprehensive efficiency in the tth year; T is the unit space variable; S is the relaxation variable; S+ is the residual variable; μ t is the weight variable; ɛ is the non-Archimedean infinitesimal; s . t . stands for restrictive conditions; X 0 and Y 0 are the inputs and outputs of construction land. X t represents the total input in the t year; Y t stands for the total output in the t year. The closer the value of ω is to 1, the higher the comprehensive efficiency of construction land is).
Table 2. Correlation matrix between RT and CLT.
IndexCorrelation CoefficientCorrelation
C11C12C21C22C31C32C41C42C43Lowest HierarchyCriterion Hierarchy
Correlation coefficientR110.420.910.770.780.700.500.760.800.430.670.68
R120.500.770.710.720.590.590.910.820.500.68
R210.500.680.700.730.650.650.680.580.520.630.66
R220.530.710.730.690.630.630.830.790.570.68
R310.520.700.740.700.610.610.940.770.520.680.68
R320.510.750.740.720.600.600.940.800.490.68
CorrelationLowest hierarchy0.490.760.730.720.630.600.850.760.50NoneNone
Criterion hierarchy0.630.730.620.70NoneNone
Publisher’s Note: MDPI stays neutral with regard to jurisdictional claims in published maps and institutional affiliations.

