Article

From World Factory to Global City-Region: The Dynamics of Manufacturing in the Pearl River Delta and Its Spatial Pattern in the 21st Century

School of Geography and Planning, Sun Yat-Sen University, Guangzhou 510275, China
*
Author to whom correspondence should be addressed.
Land 2022, 11(5), 625; https://doi.org/10.3390/land11050625
Submission received: 24 March 2022 / Revised: 17 April 2022 / Accepted: 22 April 2022 / Published: 24 April 2022
(This article belongs to the Section Urban Contexts and Urban-Rural Interactions)

Abstract

:
Since the 21st century, the PRD has gradually been transforming from a world factory to a global city-region. Based on the manufacturing and urban economic data, this paper uses the upgrade (UPG) index of industrial structure, comparative advantage and economies of scale to evaluate the development level of manufacturing in the PRD from 2000 to 2019. Through geographically and temporally weighted regression (GTWR), this paper measures the impact of four types of components (R & D, service economy, production capability and foreign investment) on the development of manufacturing in different periods. The results show the disharmony between the scale, structure and quality of the manufacturing in different cities. The impact on the manufacturing from R & D has spatiotemporal differences; the impact of foreign investment on the west coast cities of PRD is stronger than that of the east coast cities with varied impact mechanisms. The impact of the service economy is strong in sub-core cities. The impact of production capability has a transmission effect from core cities to the sub-core cities, indicating the manufacturing subdivision of function within the region. By 2019, The PRD has gradually transformed into a dual-core structure and the two cores have differentiated development paths.

1. Introduction

Allen Scott and Peter Hall put forward the concepts of a global city-region and mega-city region, highlighting how these territorial entities increasingly perform as the engine of the global economy [1,2]. Existing studies on global city-regions have mainly focused on advanced producer services (APS), knowledge-intensive business services (KIBS) and headquarters economy, which are deemed as key agents initiating ‘space of flows’ as well as coordinating the regional and global economy [3,4,5,6,7,8]. Due to the de-industrialization process consistently progressing in Western countries under the New International Division of Labor (NIDL), the majority of extant literature on global city-regions from English academia lacks attention to the manufacturing sector. However, manufacturing activities still play an indispensable role in the regional development of global city-regions in developing countries such as China and developed countries such as Germany and the US, particularly after the release of the reindustrialization strategy [9,10]. In recent years, under the development of industrial digitalization, automation and the injection of artificial intelligence, manufacturing activities are becoming more knowledge-intensive and innovation-oriented, and are seen as a supportive part of the global city-regions in a knowledge economy era [11,12,13,14].
With the process of reform and opening-up, China, especially the Pearl River Delta (PRD), received foreign industries due to the New International Division of Labor (NIDL)—mainly foreign-funded processing and manufacturing activities in the form of PMACT (processing with supplied materials, manufacturing with supplied drawings and samples, assembling with supplied parts and compensation trade) [15,16,17,18]. Supported by demographic dividend and proximity to Hong Kong and Macau, the PRD developed a business model called the “Front Shop, Back Factory” [19]. At the beginning of the 21st century, the PRD became noticeable as the “world factory” because of its tremendous production capacity and rich types of products [20,21,22]. However, the manufacturing activities in PRD have been gradually transformed by the complex dynamics behind the spotlighted label of world factory. Firstly, the dynamics of foreign investment have changed structurally, especially after the global financial crisis in 2008 [21]. Manufacturing firms in the region reoriented themselves from OEM production for the international market towards a dual-track mode—producing for both international and domestic markets [23]. Secondly, rising labor cost and tighter environmental regulation have prompted firms in PRD to either relocate or pay more attention to their R & D capabilities and other competitiveness [24,25]. The region has not confronted the dramatic decline in manufacturing as in Western countries due to the complete supply chain, domestic market and the new technological trend. New technologies such as automation and digitalization brought on by the 4th industrial revolution can enhance the production capability of manufacturing to offset the rising cost [26,27].
As a result, the industrial structure and spatial pattern of the manufacturing activities in the PRD have changed significantly over the last two decades. Using satellite image data and Manual Visual Interpretation, Ding and Wang (2018) identified the industrial production space of PRD in 1990, 2000, 2007 and 2014, and found that Guangzhou, Shenzhen and Foshan were the cores of PRD’s manufacturing agglomerations [28]. Combining remote sensing data and manufacturing POI data, Liu et al. (2019) improved the accuracy of identifying manufacturing production space and further depicted the manufacturing production space in the PRD [29]. Although the evolving manufacturing space in the PRD has been portrayed repeatedly, interpretations based on remote sensing data can hardly identify the economic features of these manufacturing activities such as added value and technology intensity. In recent years, studies using the EG index examined the agglomerations of various manufacturing industries in PRD and uncovered that labor-intensive manufacturing industries shifted to the peripheral cities of the region and high-tech industries emerged and expanded in the core/sub-core cities such as Shenzhen, Guangzhou, Dongguan and Foshan [30,31,32,33]. Studies also revealed that the sub-core cities such as Dongguan and Zhongshan have played more important roles in the PRD, hosting a larger number of manufacturing firms than even the core cities such as Shenzhen in recent years, which mirrors a new wave of industrial spatial restructuring in the present-day PRD [34].
Existing studies also pay attention to the dynamics explaining the above spatial process. Studies in the field of economic transition have regarded marketization, globalization and decentralization as the most important framework affecting the transition of China’s regional manufacturing. However, factors affecting manufacturing in the PRD have both similarities and their own characteristics from the above frame [35,36,37]. First, as one of the leading global city-regions in China deeply embedded in the global production networks over the last four decades or so, the PRD’s manufacturing activities can by no means be isolated from foreign investments [26,38]. Second, R & D intensity plays an increasingly substantial role in empowering manufacturing activities in the PRD when it faces intense competition for product innovation and quality across the globe [39,40]. Third, the service economy, particularly the producer services, plays as external knowledge and information suppliers in underpinning the competitiveness of manufacturing activities [3,41]. Fourth, production capability comes to the fore in manufacturing competitiveness in the PRD; the PRD in particular is exposed to the advent of the 4th industrial revolution [42,43].
Current research progress characterizes the industrial transition, spatial pattern and impact factors of the manufacturing activities in the PRD, but a bunch of research gaps nevertheless stand out. First, while existing studies predominantly focused on the spatial evolution of manufacturing activities in the PRD, little scholarly effort has been made to distinguish the types of manufacturing (e.g., high-tech or labor-intensive industries). Meanwhile, the research on the development performance of manufacturing activities tended to narrow their focus on the analyses of data, with few discussions on the underlying spatial relationships. Therefore, we highlight a necessity to combine the analyses of spatial distribution and performance evaluation in order to provide a more profound understanding of manufacturing activities. Second, existing analysis only probes into a single dimension of impact factors but unsatisfactorily unveils the comprehensive image influencing manufacturing dynamics in the PRD. Using partial indicators may adequately explain manufacturing dynamics in the PRD in certain historical phases, but cannot sufficiently illustrate the situation at present, when the manufacturing dynamics have become dramatically complex under the China-US trade war, ‘double circulation’ national strategy and the COVID-19 pandemic. Therefore, we try to synthesize the above four dimensions of dynamics to form a more comprehensive framework to understand the development of the manufacturing activities in the PRD. Third, existing discussions about the manufacturing of PRD have either seen the region as a whole or selected some cities such as Dongguan and Shunde to represent the characteristics of the region [26,44]; spatial variations and interconnections in manufacturing dynamics across cities in the PRD receives limited concern. Cities in the PRD have become increasingly diversified in manufacturing development and dynamics; studies covering all the cities and striving for city-sensitive interpretations and temporal imbalance merit deeper investigation.
Drawing on the above-mentioned research progress and debate, this paper aims to fill in the research gaps by evaluating the development of manufacturing sectors in all the cities in the PRD from 2000 to 2019 in two dimensions—structure and scale—based on city-level data of different manufacturing sectors in the PRD. Furthermore, this paper attempts to build up a comprehensive framework to examine the impacts of R & D, service economy, production capability and foreign investment on the spatial changes of manufacturing sectors in the PRD during different time-periods by using the geographically and temporally weighted regression model (GTWR). With the emphasis on long-term spatial characterization and extensive dynamics explanation on manufacturing activities in the PRD, this paper intends to enrich manufacturing studies in the intellectual sphere of global city-regions.
In the next section, we firstly introduce the location of the PRD and our data source. After that, we construct our index system to evaluate the development of manufacturing by the entropy method. Then, we introduce what kind of factors and model we choose to explain the development of manufacture. Section 3 firstly shows the historical evolution of manufacturing in four periods and their basic features. Next, we reveal the spatial-temporal difference of the dynamics which impact the pattern of the manufacturing. In Section 4, we compare our results with other studies and point out the limitation. In Section 5, we conclude on our research question and give some political implications.

2. Materials and Methods

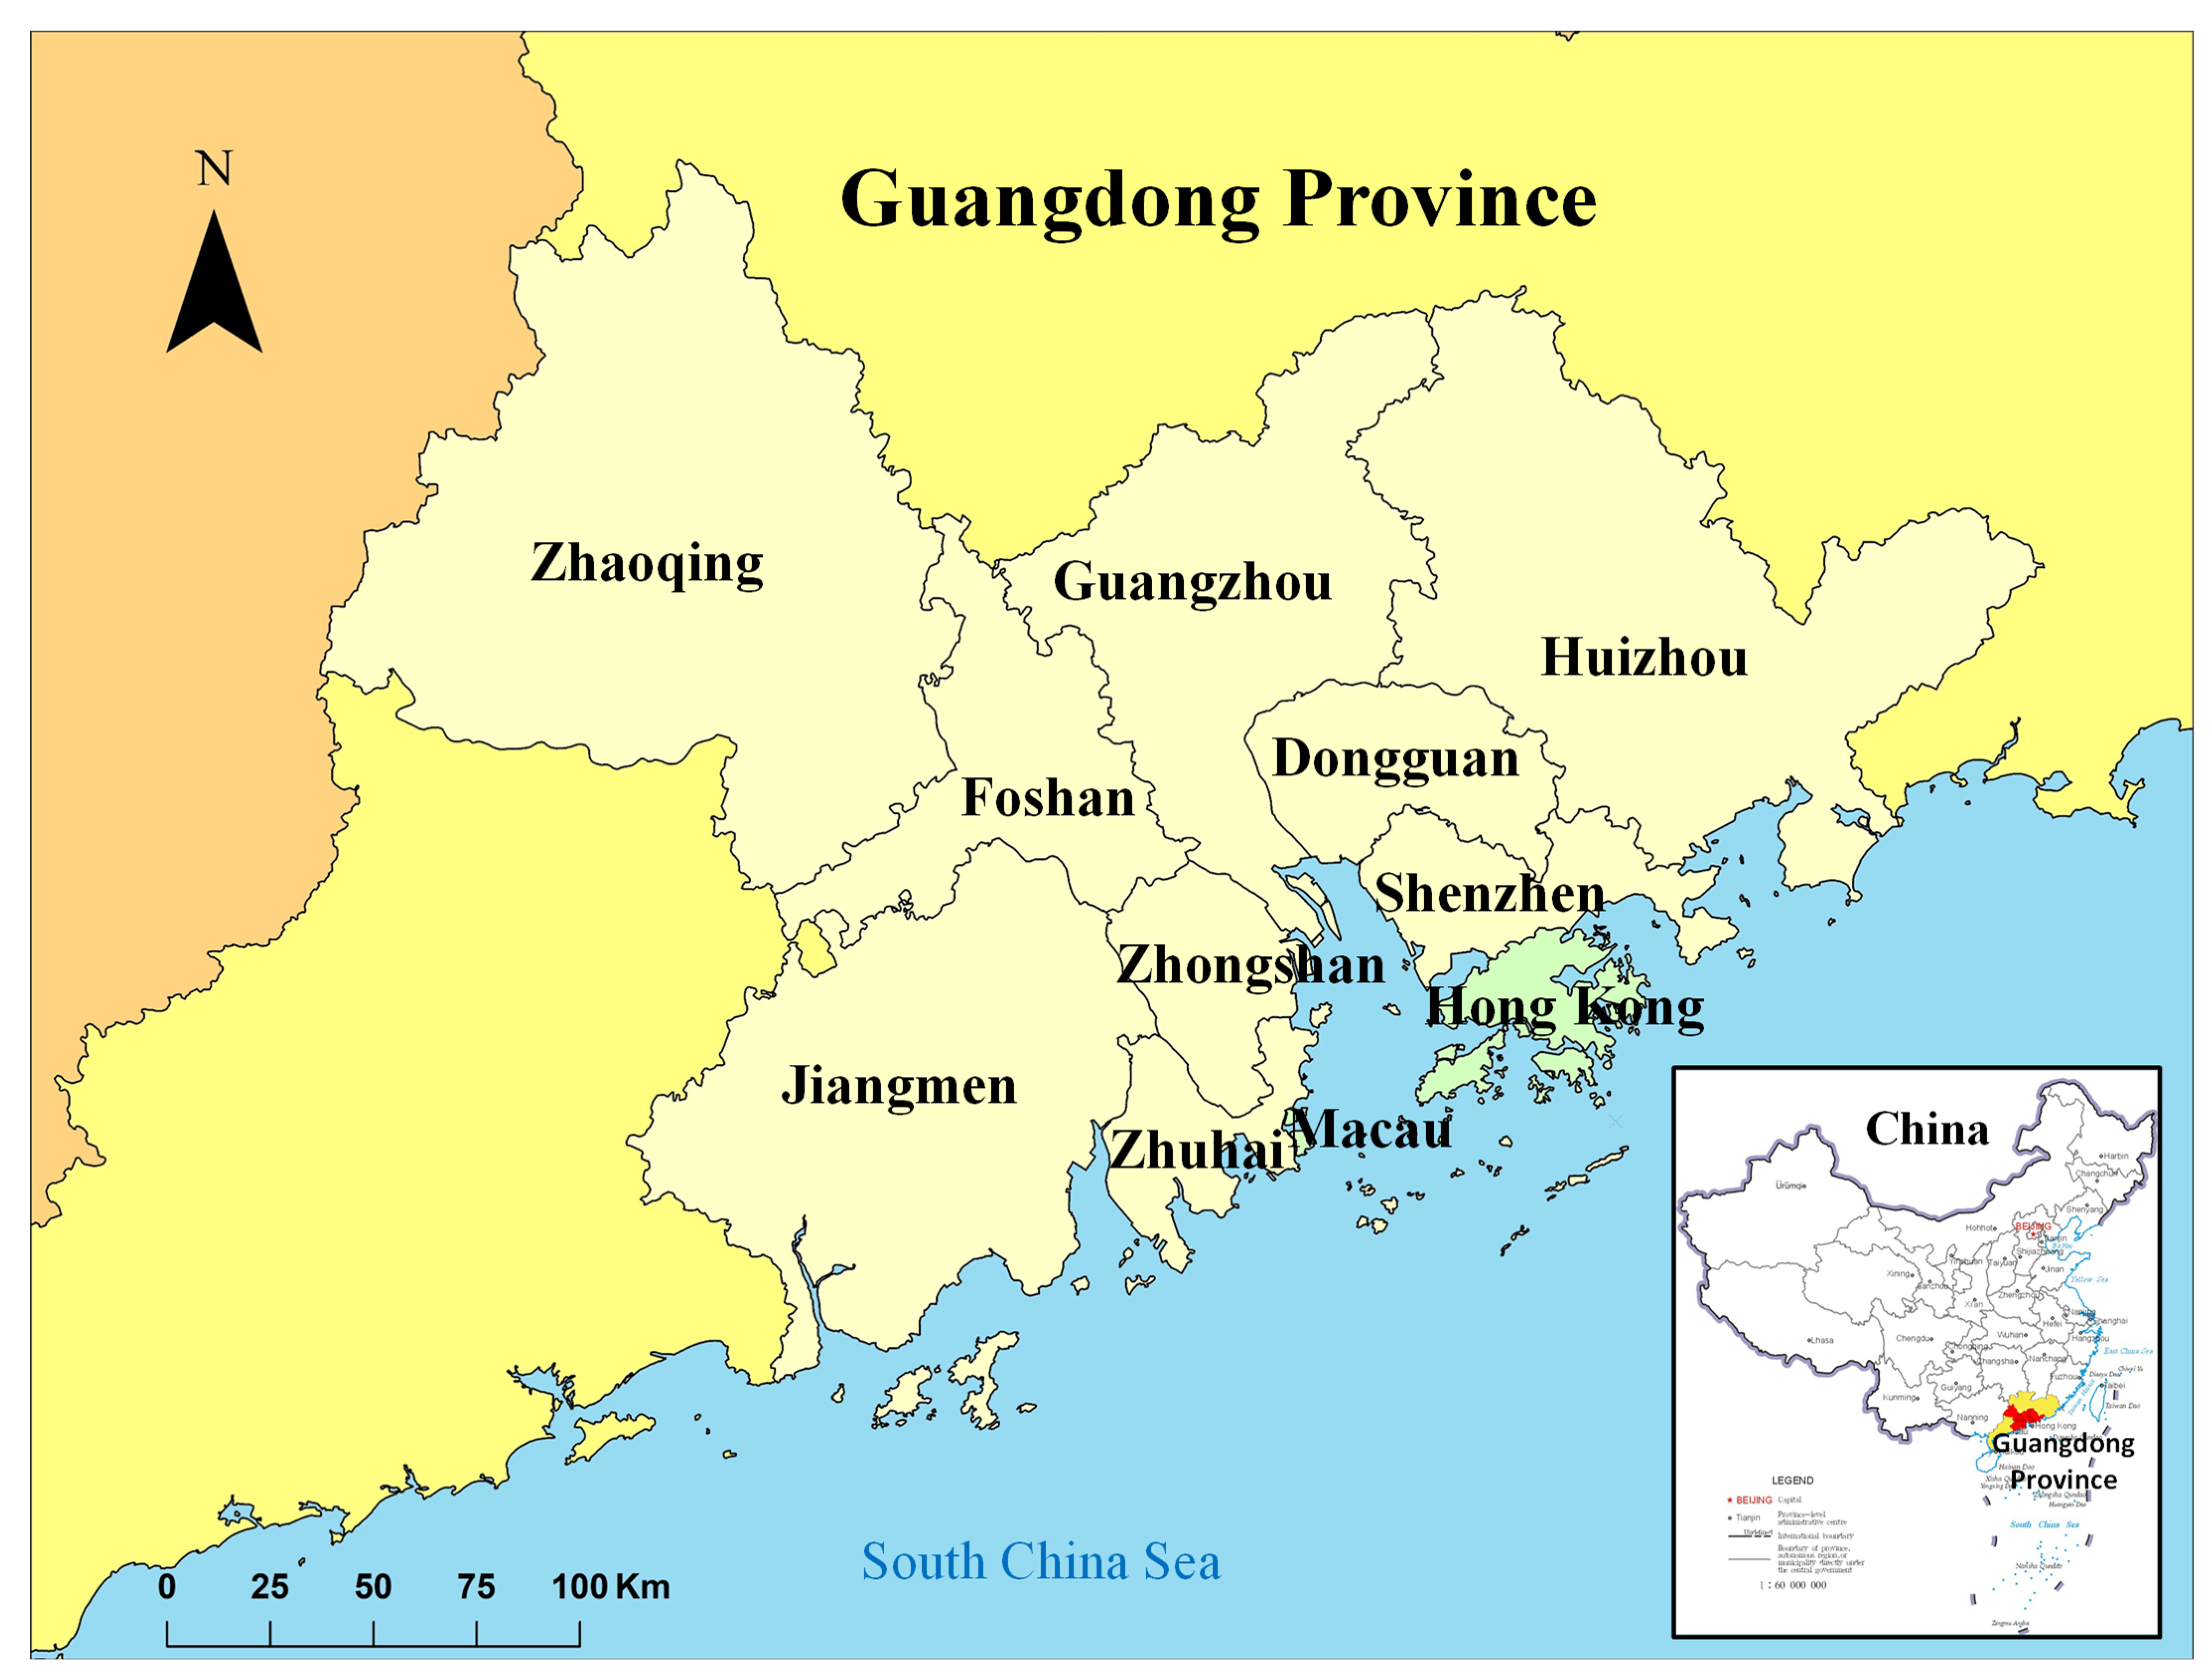
2.1. Study Area and Data

The Pearl River Delta is located in Guangdong Province in China, comprising nine cities: Guangzhou, Shenzhen, Zhuhai, Foshan, Dongguan, Zhongshan, Zhaoqing, Huizhou and Jiangmen (Figure 1). In 2019, Guangdong ranked first among the country’s 31 provinces in terms of GDP, with the Pearl River Delta accounting for 80 percent of the province’s total. The GDP of the Pearl River delta is even higher than that of Mexico and the Netherlands. Since China’s reform and opening-up in 1978, the PRD has benefitted from the new international division of labor and has been known as the world factory. The output value of the secondary sector of the PRD is CNY 3.59 trillion, accounting for 41% of GDP.
The data in this paper is from the Statistical Yearbook of Guangdong Province (2001–2020), the statistical yearbooks of 9 PRD cities (Guangzhou, Shenzhen, Zhuhai, Foshan, Dongguan, Zhongshan, Zhaoqing, Huizhou and Jiangmen) from 2001 to 2020, the Statistical Communique of the People’s Republic of China on National Economic and Social Development, Guangdong Statistical Yearbook on science and technology, and China City Statistical Yearbook.

2.2. The Index System of the Development of Manufacturing

This paper evaluates the development of manufacturing in each city in two dimensions—structure and scale. Firstly, the structure dimension focuses on the industrial structure upgrade of manufacturing, of which the main characteristic is the structure of the manufacturing sector being transformed from low-tech industries to medium-high-tech industries during the process of urban development. Therefore, an upgrade index is constructed to represent this process to show the city’s advantage in its own industrial structure. Secondly, since the evaluation is carried out within the PRD, the comparative advantage of medium-tech and high-tech industries of the city means the city can gain the Matthew’s effect from other cities in the region. Therefore, a revealed comparative advantage index is built to show the city’s advantage in the regional industrial structure. Thirdly, because of the returns of scale, the scale of the manufacturing cannot be ignored. On the one hand, it can reduce the industrial costs. On the other hand, some advanced technology, such as the automatic production line, can only be used when the scale reaches a certain level. Besides, medium-high-tech industries can provide more added value to promote the development of the manufacture than low-tech industries. So, we choose the output value of medium-high-tech industries of each city to indicate the size of its manufacturing sector. The level of industrial development in these cities is evaluated by calculating the UPG of industrial structure, the revealed comparative advantage index (RCA) and the total output value of medium-high-tech industries with the entropy weight method.
The Organization for Economic Co-operation and Development (OECD) divides manufacturing into four categories based on industrial technology level: low-tech, medium-low-tech, medium-high-tech and high-tech. Additionally, some scholars have combined medium-high-tech and high-tech industries into high-tech industries. According to studies from Li Jianxin, there are 29 industries in the manufacturing sector that fall into low-tech industries, medium-tech industries and high-tech industries (Appendix A) [45]. The upgrading of manufacturing is a process of low-tech manufacturing shifting to medium-high-tech manufacturing. Based on the evaluation method for industrial upgrading introduced by Fu Linghui [46], this paper defines the industrial structure upgrade as:
First, the proportion of total output value of three kinds of industries (low, medium and high) serves as a component of the space vector, thereby forming a set of three-dimensional vectors of city m:   X i , m = ( x 1 , m , x 2 , m , x 3 , m ) . Next, calculate the angles θ 1 ,     θ 2 ,     θ 3 of vector X i , m   and the industrial vectors (1,0,0), (0,1,0), (0,0,1), respectively, which are arranged from low level to high level:
θ i , m = arccos { x i , m ( i   =   1 3 ( x i , m 2 ) 1 / 2 · }
thus, UPG is calculated as follows:
UPG = k   =   1 3 i   =   1 k θ i , m
higher UPG means a higher level of industrial structure upgrade.
Revealed Comparative Advantage Index (RCA) is defined as the ratio of two shares—the output value of medium-high-tech manufacturing and the total output value of cities in PRD. That is,
RCA i = ( O m h i O i ) / ( O m h t O t )
where RCA i is the the RCA of city i ; O m h i is the output value of medium-high-tech manufacturing of city i ; O i is the output value of the manufacturing in city i ; O m h t is the output value of medium-high-tech manufacturing of PRD; O t is the total output value of PRD. When RCA is greater than 1, it is inferred that the medium-high-tech manufacturing in the city have comparative advantages in PRD. Additionally, the larger the index, the stronger the comparative advantages.
These three indicators of 20 years in the 9 cities of PRD are standardized by min-max normalization. So, each indicator has 180 observations. Then, we used the entropy method to gain the weights of UPG, RCA and the output value of medium-high-tech. The entropy of indicator i is H i :
H i : = 1 ln n j   =   1 n r i , j j   =   1 n r i , j ln r i , j j   =   1 n r i , j   ( n = 180 )
where r i , j is value of the indicator i .
w i : = 1 H i m i   =   1 m H i
The weights of UPG, RCA and the output value of medium-high-tech are labeled, respectively, as w 1 ,   w 2 and w 3 ; thus, the level of manufacturing of city i in the year t is MCL i , t :
MCL i , t = UPG i , t * w 1 + RCA i , t * w 2 + M H i , t * w 3
where M H i , t is output value of medium-high-tech industries of the city i in the year t .

2.3. The Analytical Framework of Impact Factor

Based on the value chain and the export-oriented feature of the manufacturing sector in PRD, this paper considers that factors impacting the industrial structure upgrade of the PRD are R & D, production capability, service economy and foreign investment. The development of manufacturing is inseparable from R & D, and in some spaces, the integration of R & D into manufacturing has become very noticeable [11,47]. In existing research, scholars have noticed the impact of R & D led by government on manufacturing structure upgrading [45]. However, in the process of industrial development, the R & D expenditures of firms, as one of the main entities in the market, are more important. This paper uses the R & D expenditures (RDI) and the number of granted patents (PGI) of the industrial firms as indicators of their R & D input and output.
The manufacturing process is mainly affected by the production capability of labor and production facilities, so this paper uses the labor productivity of the industrial firms (LPI) and the amount of capital invested in the fixed assets of manufacturing (CFM) to represent the two factors.
The development of manufacturing is not independent from the economic system; the city’s capabilities of coordinating trade and freight transport also affect the development of manufacturing in the city. This paper selects total sales of goods in wholesale and retail trade (SWR), total purchases in wholesale and retail trade (PWR) and turnover of goods (TOG) as indicators. In addition, APS, especially the financial industry, has a significant impact on the development of manufacturing, so this paper uses local and foreign currency loans from Chinese and foreign financial institutions (LLF) as indicators [41,48,49].
After China’s reform and opening-up, the development of the manufacturing sector in PRD has taken a development path with Chinese characteristics under the influence of globalization. The process of its manufacturing upgrading has the characteristics of export-oriented economies, so this paper uses the amount of foreign capital actually utilized (FCU) and the amount of foreign capital actually utilized by manufacture (FCUM) as indicators [18,50].

2.3.1. Principal Component Analysis and Data Preprocessing

Based on the above theoretical models, 10 variables as initial independent variables are selected and log transformed. In order to prevent the problem of multicollinearity between independent variables from affecting the model effect, this paper first analyzes the correlation between independent variables and finds that there is a significant correlation between multiple independent variables. Therefore, all variables are analyzed by principal components, and the variables are orthogonally transformed to achieve the purpose of dimension reduction, and four types of principal components are extracted to represent the dynamics of service economy, R & D, production capability and foreign investment (Table 1). Based on the score coefficient matrix of principal component analysis, this paper uses a regression method to correspond each index to the score coefficient matrix and calculate the comprehensive value of each principal component.

2.3.2. Geographically and Temporally Weighted Regression Model

Geographically and temporally weighted regression (GTWR) is a spatial analysis technique which incorporates temporal effects into the geographically weighted regression (GWR) model. That is
Y i = α 0 ( u i , v i , t i ) + k β 0 ( u i , v i , t i ) X I , K + ε i
where Y i is the development level of the urban manufacturing; u i and v i are the latitude and longitude of the city; t i is the year of the development; and the three parameters are the spatial-temporal coordinates of the corresponding year of the city, β 0 ( u i , v i , t i ) is the coefficient of dependent variable K, and ε i is the residual.
Similar to GWR, the estimated value of β ^ ( u i , v i , t i ) at observation point i is obtained by local weighted Ordinary Least Squares based on appropriate bandwidth and spatiotemporal weight matrix. That is
β ^ ( u i , v i , t i ) = [ X T W ( u i , v i , t i ) X ] 1 X T W ( u i , v i , t i ) Y
where Y is the dependent variable matrix of the development level of each city’s manufacturing, X is the independent variable matrix of the factors that affect the manufacturing development of PRD, t X T is the transpose matrix, W ( u i , v i , t i ) is the spatiotemporal weight matrix. In this paper, bi-square space weight function is selected to determine the space-time weight matrix [51]. The spatiotemporal weight matrix is calculated as follows:
W i j = { [ 1 ( d i j S T b ) 2 ] 2 , d i j S T b i 0 , d i j S T > b i
where d i j S T is the spatial-temporal distance between observation points i and j . That is
d i j S T = δ [ ( u i u i ) 2 + ( v i v i ) 2 ] + γ ( t i t i ) 2
where b is the appropriate bandwidth under the guideline of AICc.

3. Results and Analysis

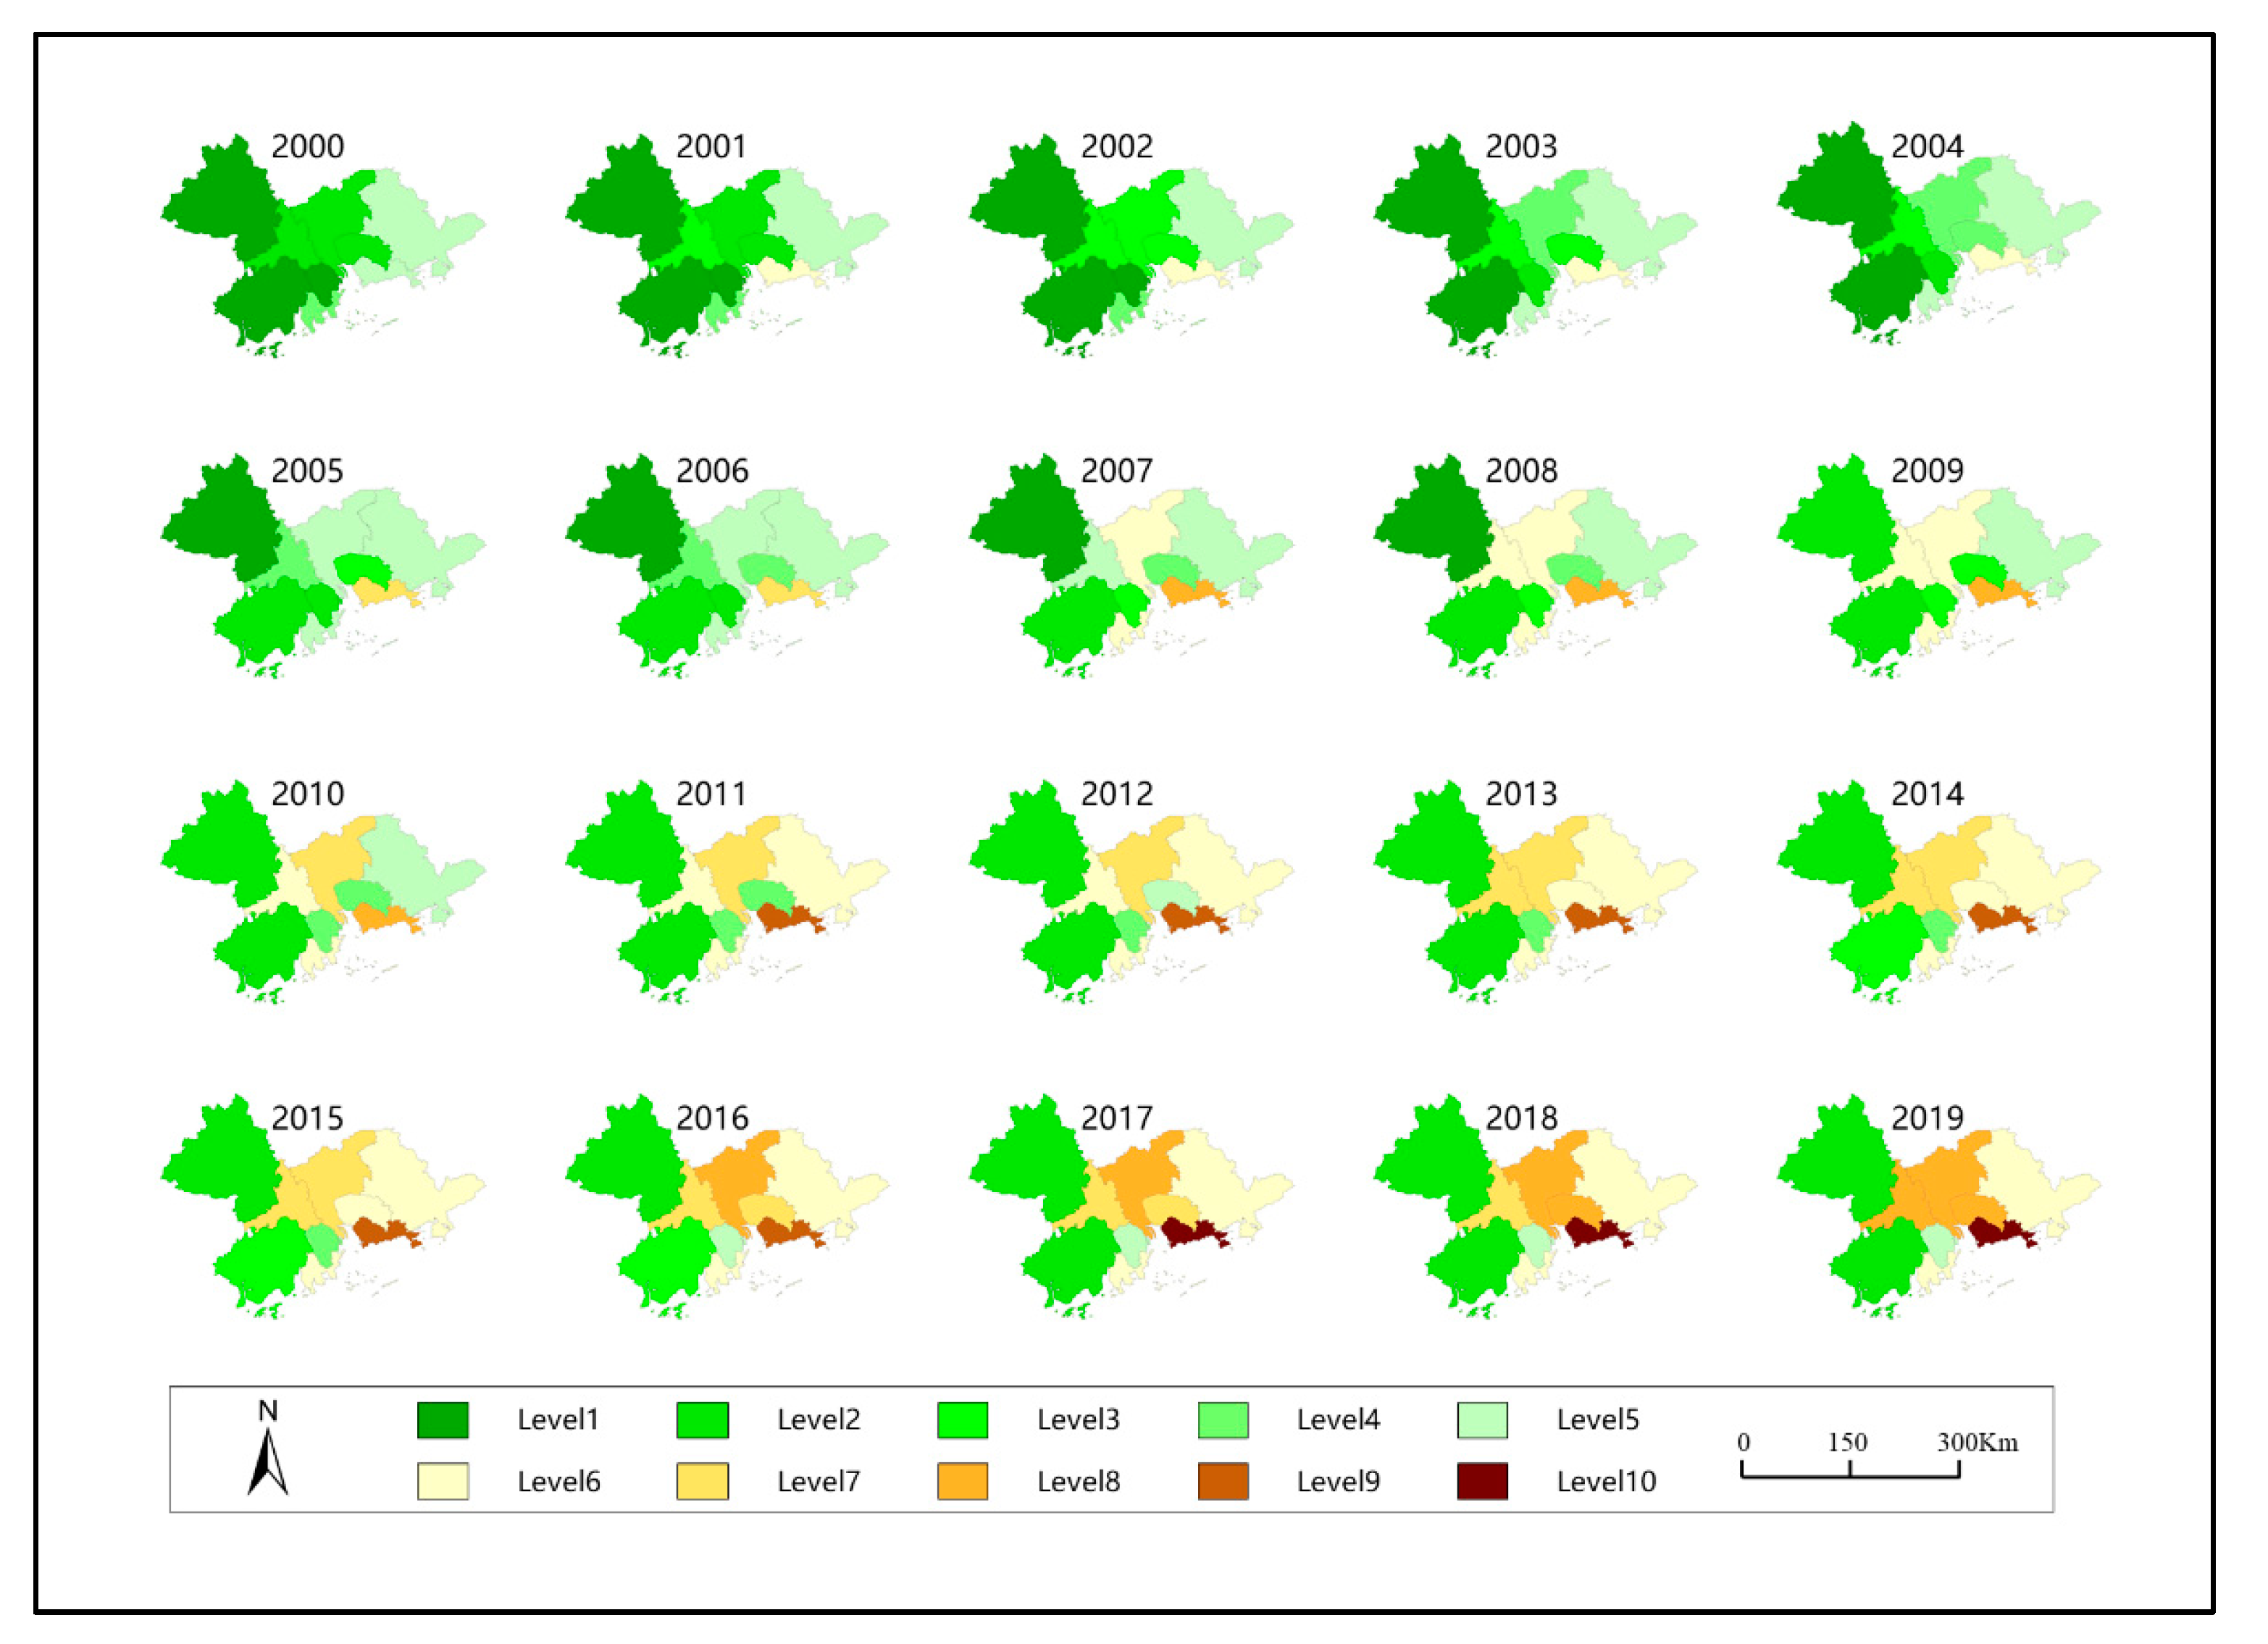
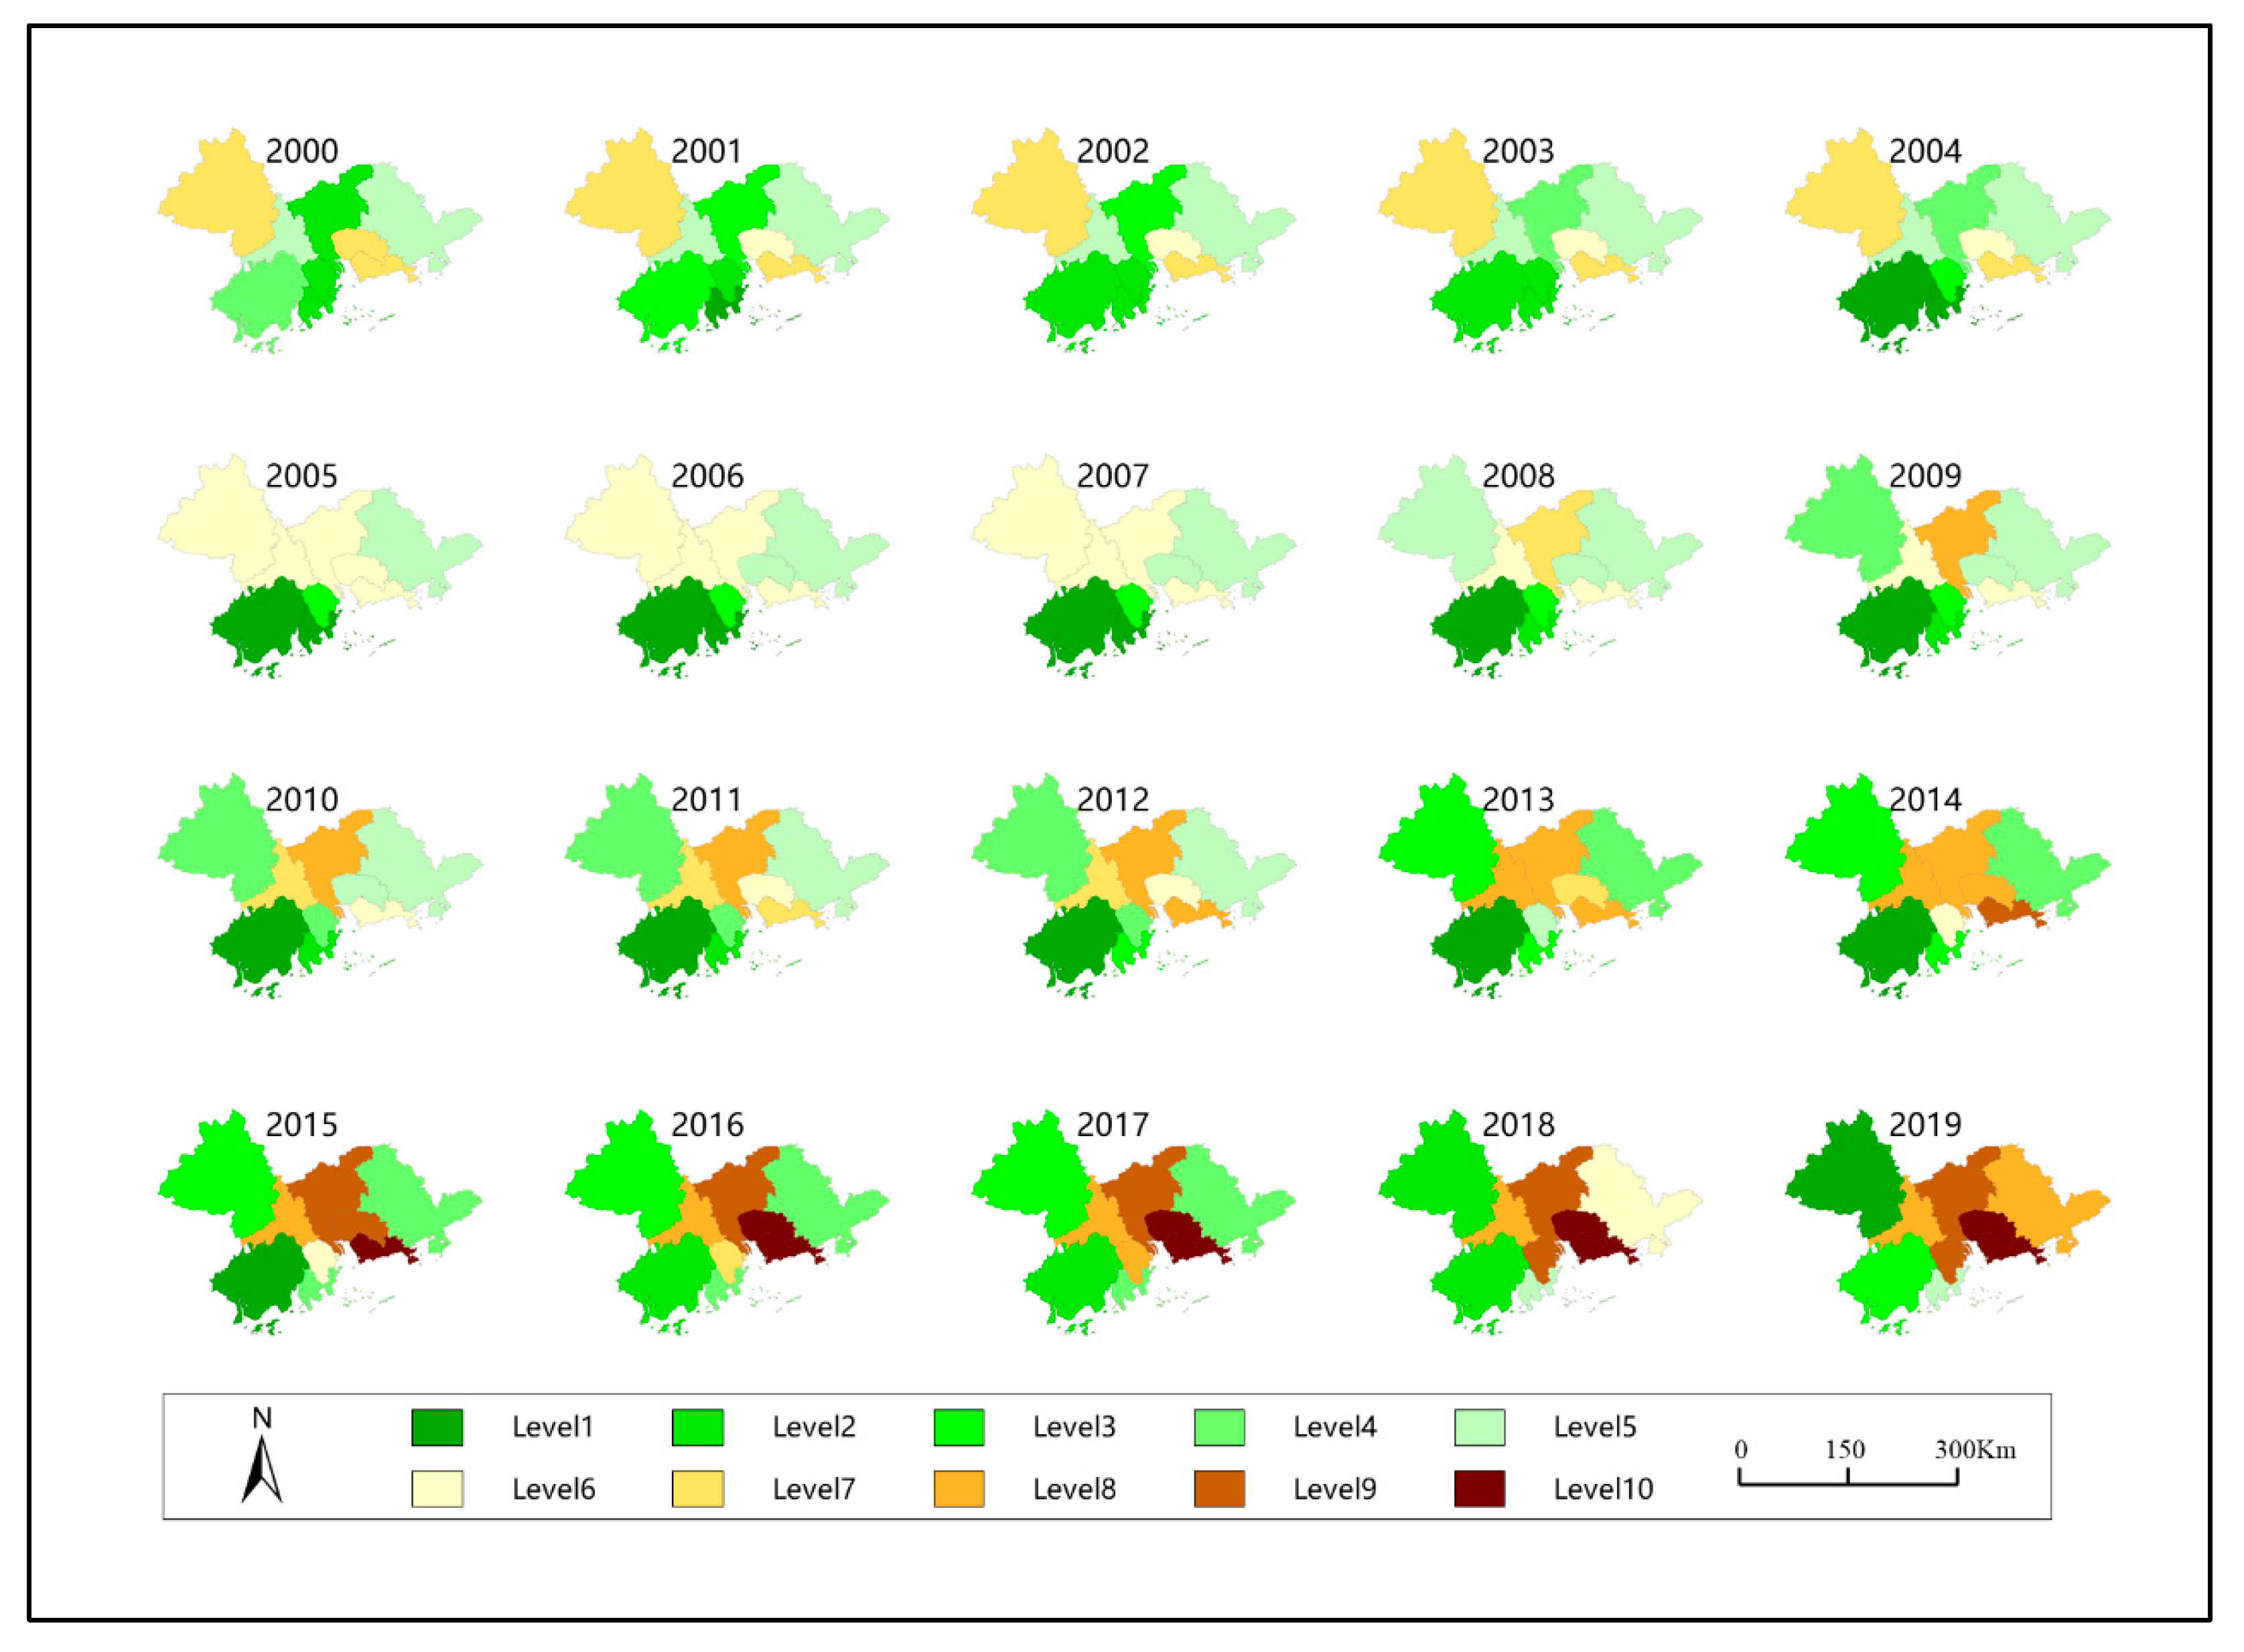
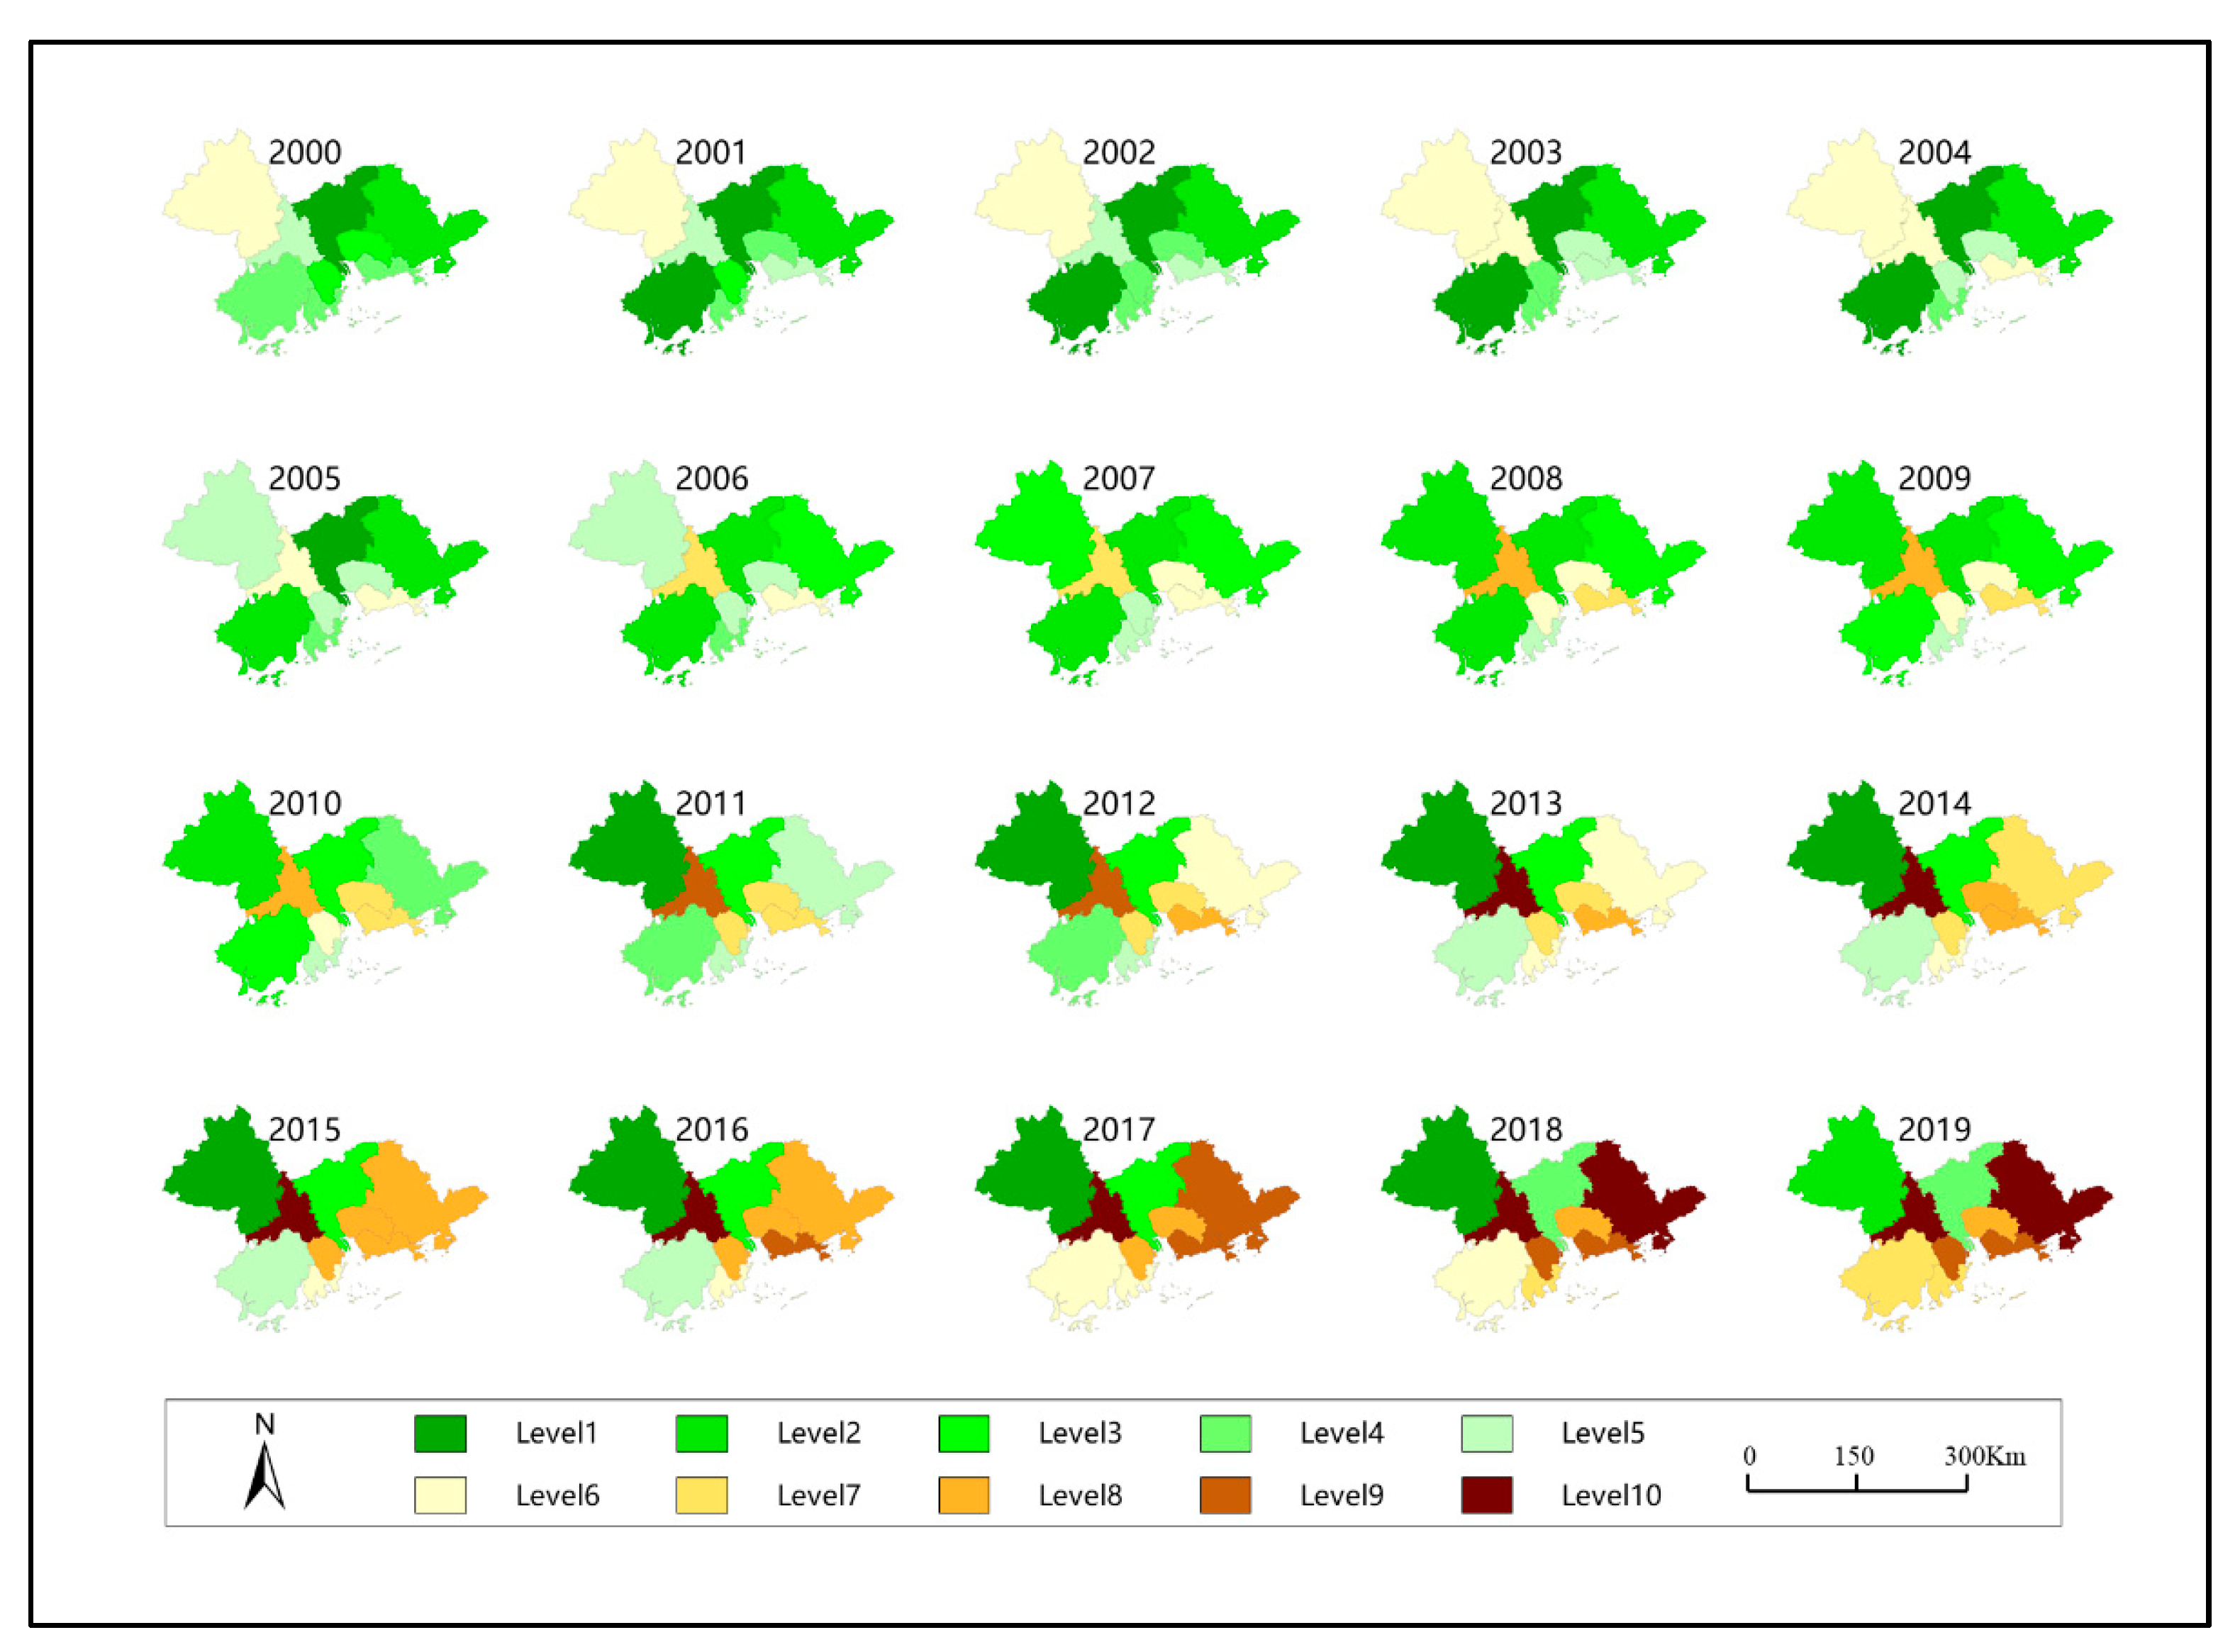
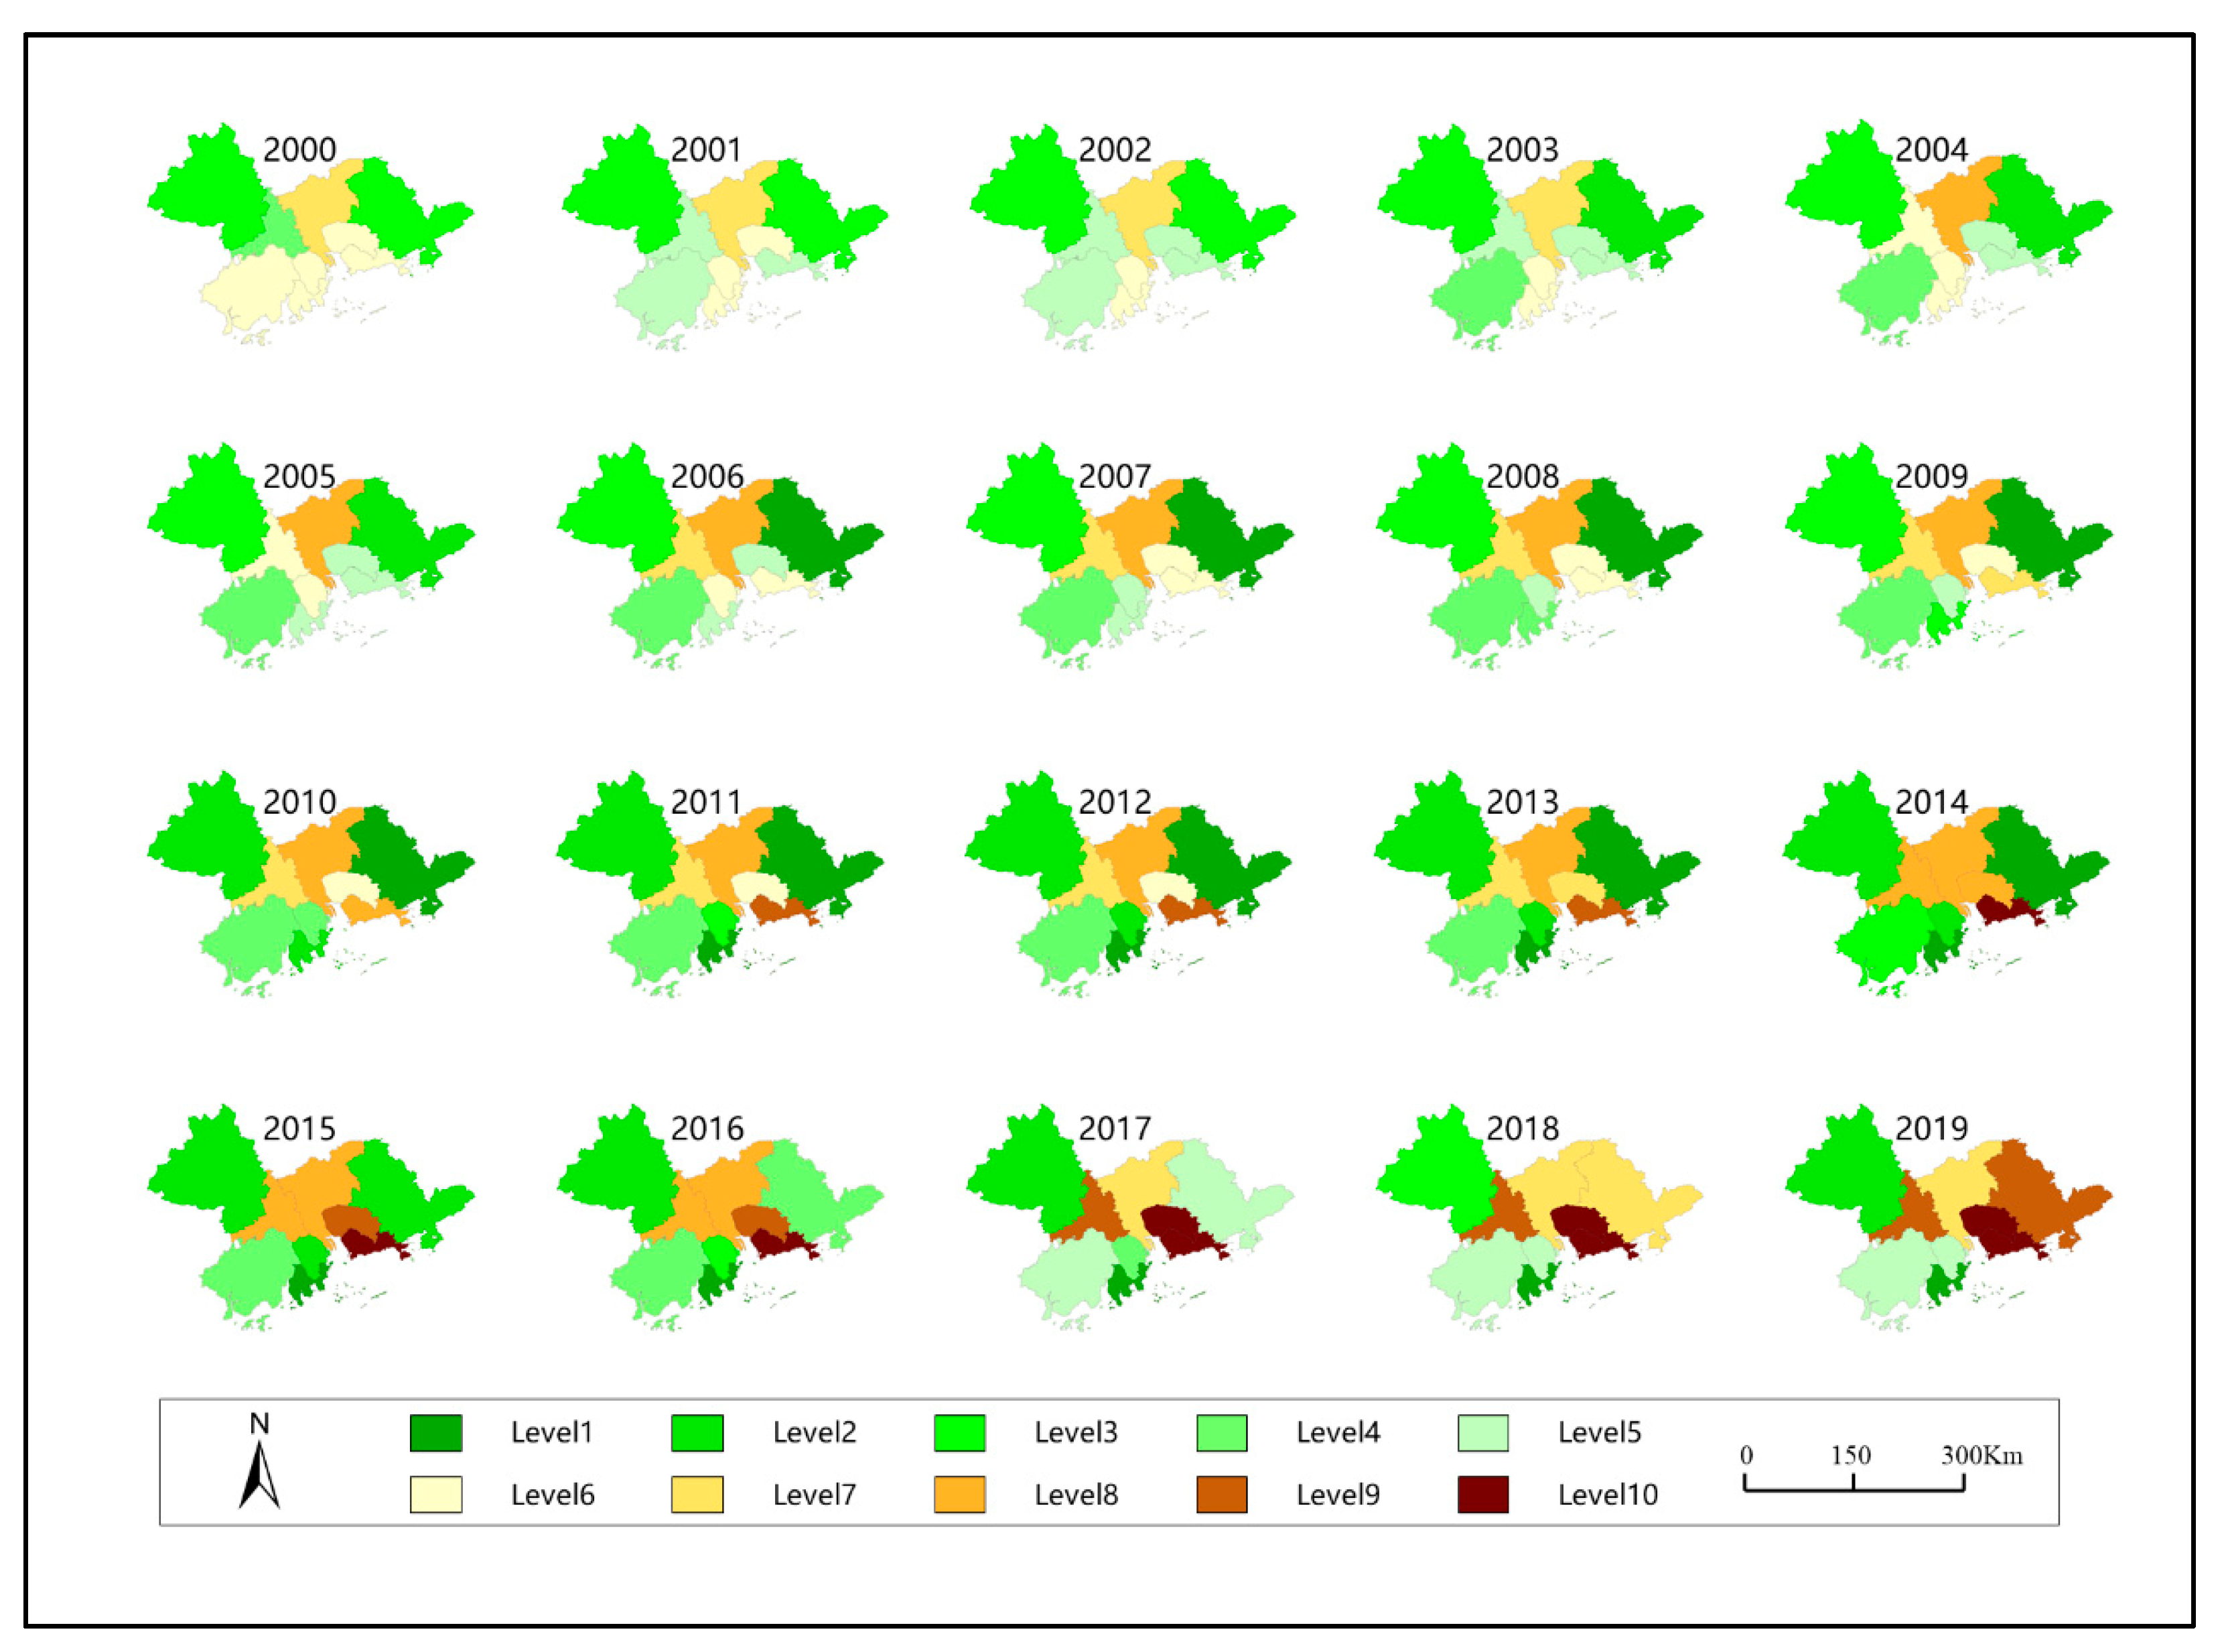
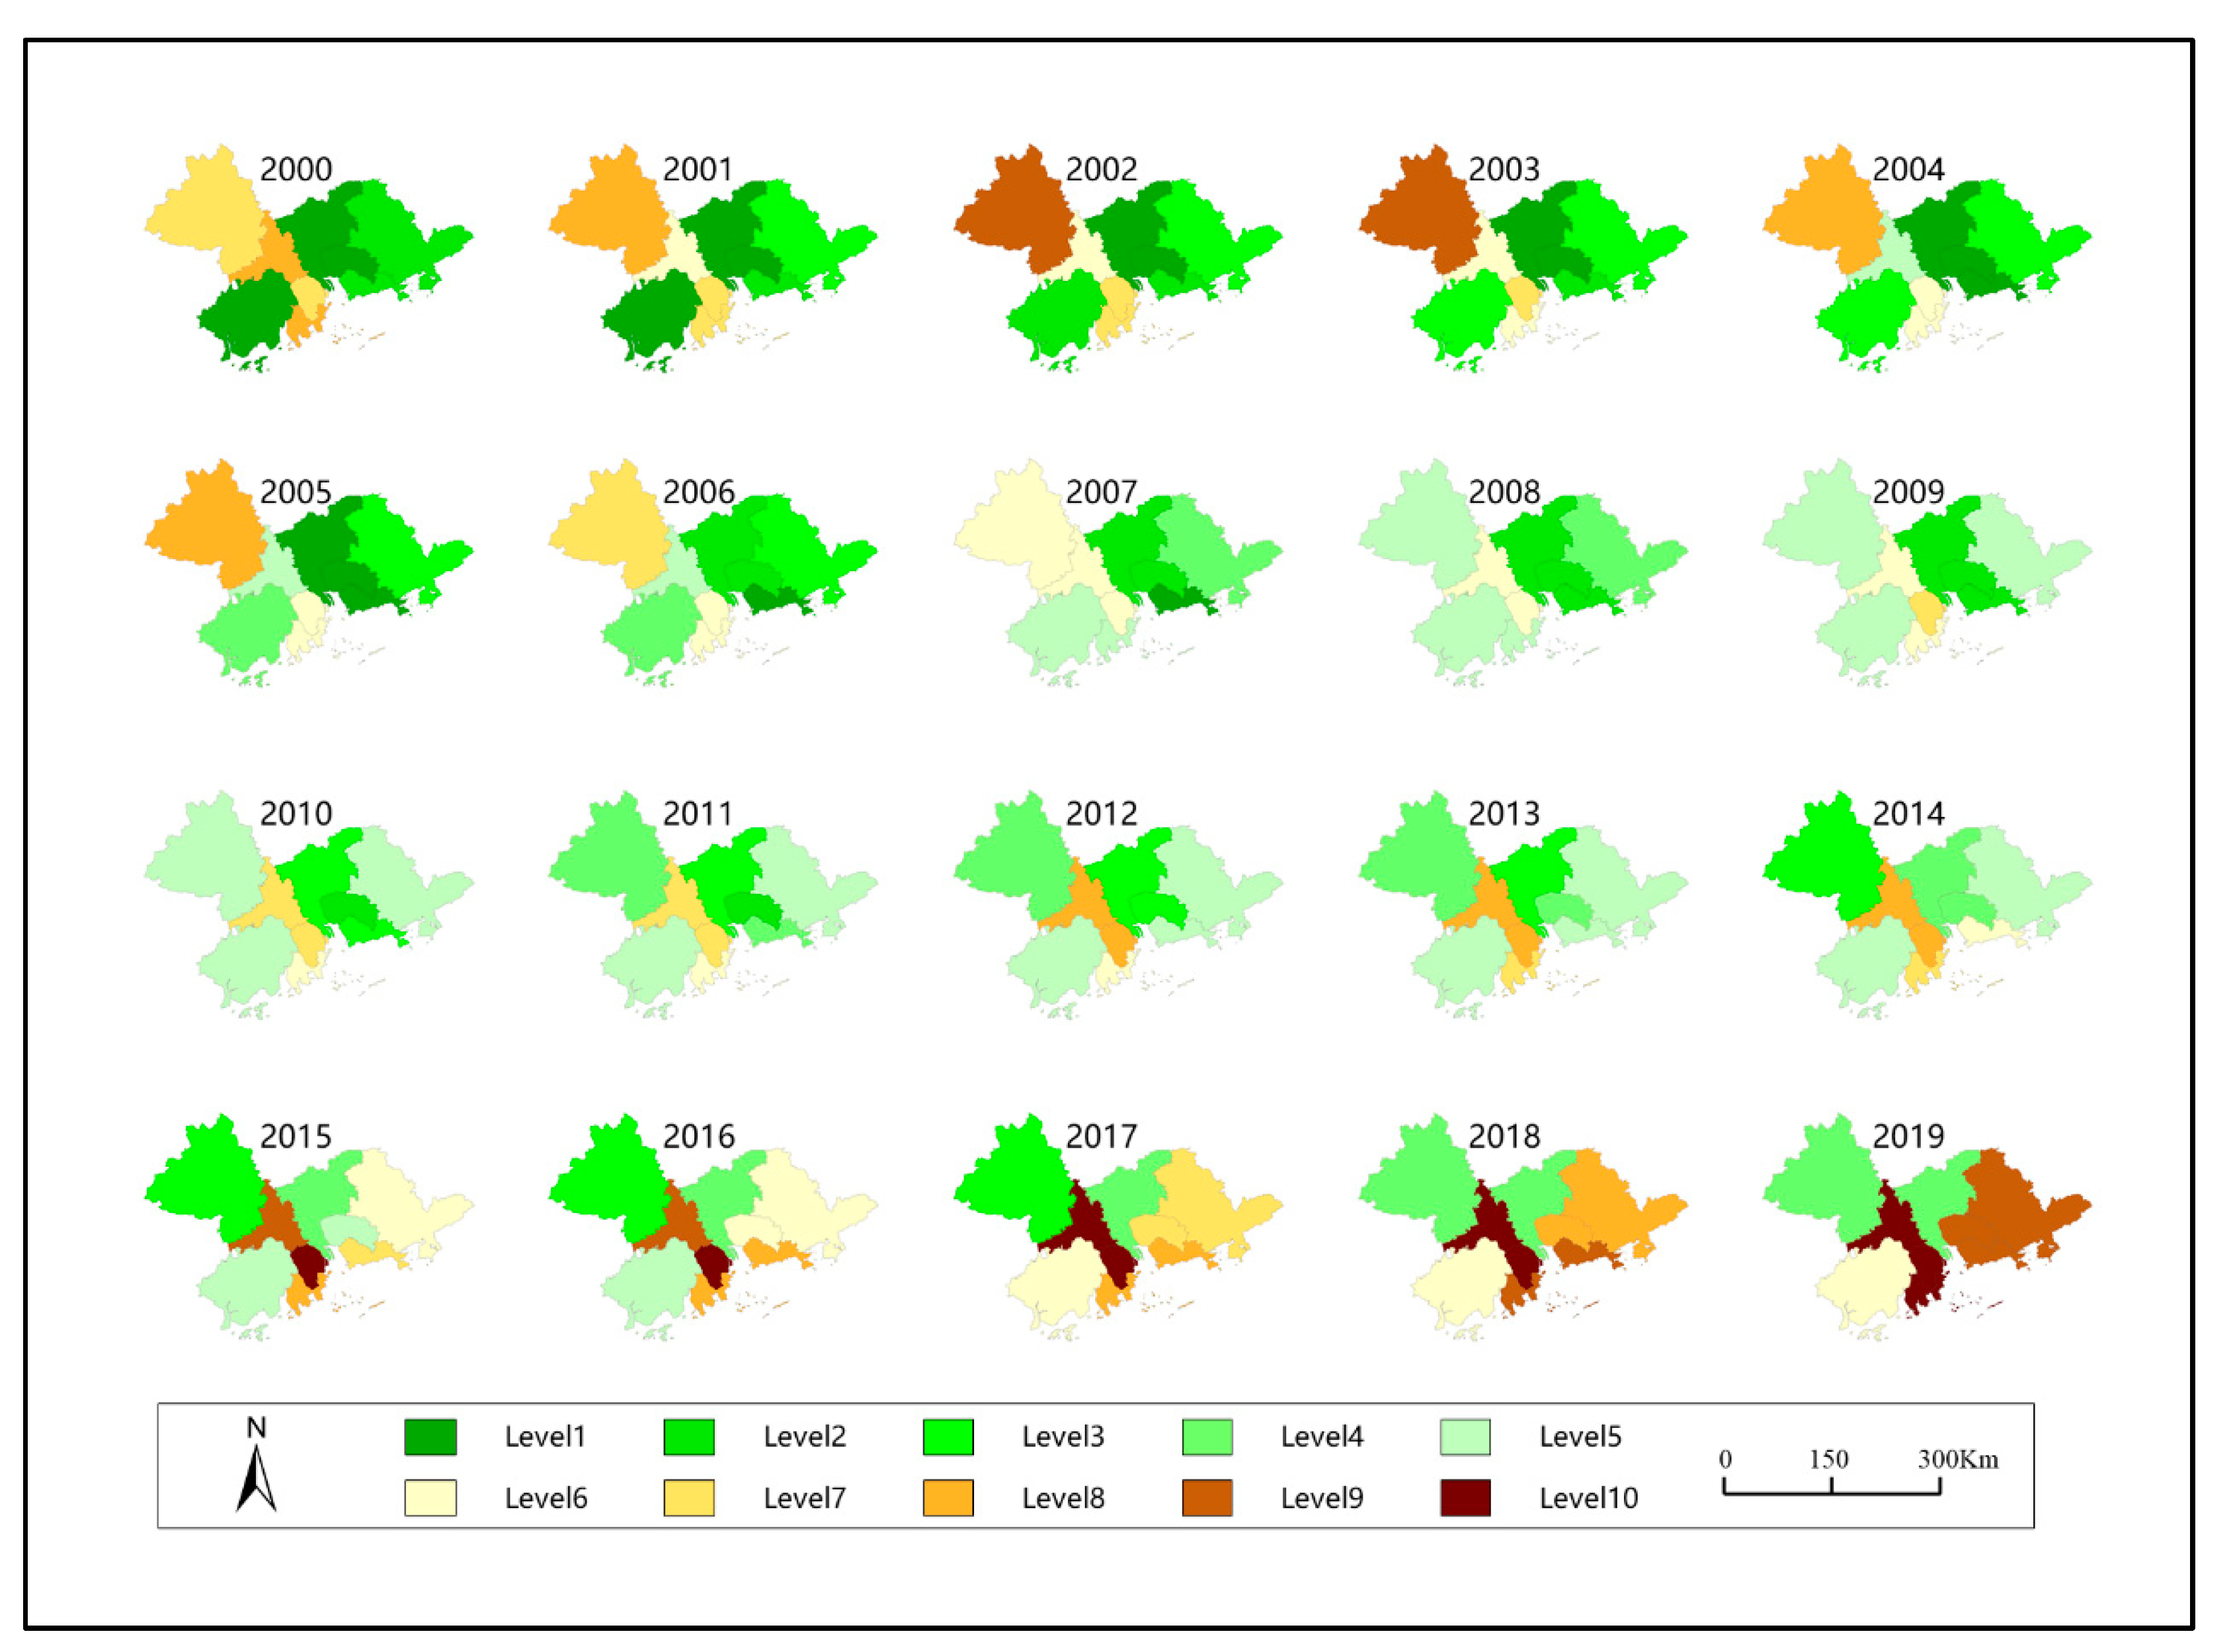
3.1. The Spatio-Temporal Pattern of the Manufacturing in the Global City Region of PRD

Through the entropy method, the calculated weights of the industrial structure upgrade, the comparative advantage of medium-high-tech industries and the total output value of medium-high-tech industries are 0.1828, 0.1098 and 0.7074; the level of development of the manufacturing sector of the cities is calculated and divided into 10 levels; the higher the level, the higher the level of development (Figure 2).
Manufacturing in PRD has grown rapidly since the 21st century, increasing 12-fold since 2000. However, the core logic that underpins the development of manufacturing in PRD has also changed, with the share of low-tech industries falling from 28% in 2000 to 15.4% in 2019, and high-tech industries growing from 53% to 67.4%. After 2011, in particular, the average growth rate of high-tech industries was twice that of low-tech industries. The PRD has gradually transformed from a labor-intensive world factory to a global city-region driven by technological innovation and capital intensity.

3.1.1. 2000–2007: The Rapid Development of the Guangzhou-Foshan Metropolitan Area

In 2000, the development of manufacturing in Shenzhen, Huizhou and Zhuhai were in the front rank, which were higher than level 4; Guangzhou, Foshan and Dongguan were in the inner circle, which were at level 2; Zhaoqing and Jiangmen were at level 1. In terms of manufacturing output value, the top three were Guangzhou, Shenzhen and Foshan. However, as Guangzhou and Foshan had a large number of low- and medium-tech manufacturing, the levels of their UPG indexes of industrial structure and the comparative advantages of their medium-high-tech industries were low, making their overall rankings in middling positions. As the electronics and communication equipment manufacturing in Shenzhen developed rapidly, related assembling and components manufacturing had been gradually shifted to Huizhou. Additionally, the manufacturing of electronics and communication equipment was the 2nd largest, after Shenzhen. In Zhuhai, the high-tech manufacturing was small in size but had developed more evenly with fewer low-tech industries.
Since 2000, the overall industrial structure in PRD has been optimized continuously. The overall UPG index of the industrial structure increased from 6.43 in 2000 to 6.90 in 2006. At this stage, the vigorous development of capital-intensive industries such as metal smelting and equipment manufacturing promoted the quality of the regional industries. By 2007, except for Zhaoqing and Huizhou, the levels of manufacturing in all cities had been improved; and the level of manufacturing in Guangzhou had improved most significantly, from level 2 to level 6. Guangzhou was in the leading position in PRD in the fields of high-tech industries such as chemical manufacturing, equipment manufacturing and metal smelting. Additionally, Foshan, which is adjacent to Guangzhou, ranked first in the field of medium-tech industries such as metal smelting and metal products manufacturing. The industrial chains of capital-intensive transportation equipment manufacturing, high-end equipment manufacturing and machinery manufacturing started to take shape in Guangzhou and Foshan. As a typical region of PMACT from China’s reform and opening-up, Dongguan still had a large number of low-end manufacturing, ranking first in many low-tech industries such as textiles and clothing. However, due to the industrial transfer and trickle-down effect of Shenzhen, Dongguan ranked second in PRD in terms of electronics and communications equipment manufacturing.

3.1.2. 2008–2014: Regional Industrial Transformation Brought by Economic Crisis

The global economic crisis had hit the export-oriented economy of PRD sharply, which was reflected spatially as the industrial development on the west coast of PRD grew faster than that of the east coast. In 2010, Guangzhou, Foshan, Zhongshan and Zhaoqing had all moved up by one grade, while the other cities remained unchanged. Under the impact of the economic crisis, the medium-high-tech industries, especially high-tech industries, developed slowly, and the UPG index of industrial structure decreased slightly and fluctuated around 6.82. In response to the economic crisis, the Chinese government vigorously promoted domestic demand and consumption, leading to the rapid development of low- and medium-tech manufacturing, such as metal smelting. In the wake of the economic crisis, Dongguan and Shenzhen gradually reduced their shares of low-tech manufacturing. Dongguan was affected by both Guangzhou and Shenzhen and entered a tough phase of transformation and upgrading; its high-tech manufacturing (transportation equipment manufacturing and general equipment manufacturing) improved significantly; its communication and electronic equipment manufacturing became the pillar industry of the city and kept growing. The petrochemical industry in Huizhou rose to the first in PRD with the project from the firm ChinaPetro arriving at Daya Bay. With the redistributions of manufacturing among Shenzhen, Dongguan and Huizhou, and the rise Dongguan, the once well-developed industries of communication and electronics manufacturing and transport equipment manufacturing declined. For the west coast of PRD, the essential issue of development was still the size of its industrial sector.
After going through the impact of the economic crisis, the cities quickly recovered from the recession and took advantage of the market changes brought about by the economic crisis to improve their industrial structure, promoting the transformation and upgrading of the manufacturing under innovation and technology. In the five years from 2010 to 2014, the most outstanding city in the development of manufacturing was Dongguan; with an overall growth rate of 59%, its level of manufacturing development jumped to the fourth, three times of the growth rate of the second-place city. Although Dongguan did not have leading high-tech industries, but their high-tech industries were fast growing. Low-tech industries did not shift to the outer cities of PRD until 2014 and were still concentrated in the traditional low-tech manufacturing space of Guangzhou, Foshan and Dongguan; the main change was the specialization of low-tech industrial functions.

3.1.3. 2015–2019: The Formation of Guangzhou-Shenzhen Innovation Corridor

Under the background of the New Normal economy, the UPG index of industrial structure of PRD increased steadily from 6.91 to 7.04 in the period of 2015–2019. In fact, it was a full response to the 18th National Congress, which brought up the innovative development strategy to meet the challenges of the transformation and upgrading of manufacturing. The growth rate of the high-tech and medium-tech industries in PRD was significantly higher than that of the low-tech industries; among the high-tech industries, the fastest growth is in the manufacturing of special equipment related to the fourth industrial revolution. In 2019, the city with the highest level of manufacturing development was Shenzhen, which was at level 10. Dongguan eventually took the second place in PRD after overtaking Foshan in 2017 and Guangzhou in 2018. Foshan also overtook Guangzhou in 2019 and ranked third in PRD.
The structure of low-tech manufacturing had not changed much. Dongguan’s advantage in textile and garment manufacturing had been further strengthened. Apart from its rubber and plastic industries being overtaken by Shenzhen and Dongguan, Foshan retained its advantageous position in medium-tech industries. In terms of high-tech industries, Shenzhen ranked first in the pharmaceutical manufacturing, surpassing Guangzhou. As for automobile manufacturing, Guangzhou and Foshan had formed a complete industrial chain, and Shenzhen and Dongguan had made progress in the alternative fuel vehicle industry. Relatedly, Foshan was competitive in the general equipment manufacturing and electrical machinery and equipment manufacturing, ranking first. However, Shenzhen and Dongguan kept improving, ranking second and third, respectively. In special equipment manufacturing, Shenzhen had widened its gap with Foshan, and the adjacent cities of Huizhou and Dongguan also developed rapidly. In computer, communication and other electronic equipment manufacturing, Shenzhen, Dongguan and Huizhou had built up a systematic production network that was globally competitive. Overall, Shenzhen’s manufacturing sector still has a significant ahead of other cities in PRD in all aspects. The output value of its high-tech industries reached RMB 2.98 trillion in 2019, which was more than twice of the second-ranked city Dongguan. Although Dongguan was not ranked first in any high-tech industries, all of its technical industries developed vigorously; the output value of its low-, medium- and high-tech industries increased by 31.5%, 101.3% and 83.1%, respectively, ranking first in PRD.

3.2. The Development Dynamics of Manufacturing in the Global City Region of PRD

3.2.1. Parameters of Analyzing Model

In this paper, the levels of manufacturing evaluated from the two aspects—structure and size—are used as the dependent variable, the scores of the four principal component as independent variables, the longitude and latitude of the gravity center of the nine cities in PRD as the X and Y coordinates of the urban space, and the year as the time coordinate. The analysis is performed using ArcGIS’s spatiotemporal geographic weighted regression model plugin which is provided by Bo Huang in his ResearchGate [52] The GTWR model bandwidth uses the automatic optimization option, the spatiotemporal distance parameter ratio is 1, and the fixed effects model is used [53]. The parameters of the model are shown in Table 2. The R 2 and the Adjusted R 2 in the model are both greater than 0.99, which means that the spatial-temporal geographic weighted regression model can well simulate the impact of the four types of factors on the manufacturing in each city. In this paper, the coefficients of each independent variable are divided into 10 levels according to the data characteristics. The higher the grade, the greater the impact on the development of urban manufacturing, which is visualized through mapping using ArcGIS, and the darker the red color, the stronger the impact.

3.2.2. The Impact of R & D on the Development of Manufacturing

Since the 21st century, the impact of R & D on manufacturing in PRD had been positive with noticeable time stages (Figure 3). The average impact coefficient of the nine cities in PRD remained basically stable before 2009, with an annual growth rate of less than 2%. However, after 2013, the average influence coefficient maintained an increase of 10%, and the increase in 2016 even exceeded 17%. This was due to the shrinking of foreign markets brought about by the economic crisis, prompting the decline and migration of low-tech industries in the region and forcing many firms to focus on R & D investment and technological competitiveness. Accordingly, after the 18th National Congress, the Chinese central government put forward the innovation-driven development strategies and the corresponding supporting policies, which also promoted the dynamic transformation of manufacturing enterprises in PRD. Spatially, the dynamics of R & D had a great impact on the cities on the west coast of PRD before 2010. After 2010, the innovation-driven model was highly noticeable in the cities on the west coast of PRD.
The core industries of Guangzhou and Foshan were mainly industries with long technology renewal cycle, such as metal smelting and processing and transportation equipment. The impact of R & D on these industries were positive, but the growth rates were relatively slow. With the rapid development of information and communication technology and internet industries, electronic industries had entered a period of high-speed development. As a result, the manufacturing in Dongguan and Shenzhen was significantly driven by R & D after 2010. As the Huawei R & D Shenzhen quarter and the mega scientific equipment for China spallation neutron source moved to Dongguan Songshan Lake area, the impact of R & D on Dongguan became more significant, and its impact coefficient surpassed Shenzhen, ranking first in PRD. Because of the division of functions within the chain, the electronics manufacturing in Huizhou were concentrated in the low end of the value chain; while R & D had relatively low impact on the petrochemical processing industry, Huizhou were less affected by the input on R & D compared to that of Shenzhen and Dongguan.

3.2.3. The Impact of Service Economy on the Development of Manufacturing

The service economy had an enhancing effect on the comprehensive development of manufacturing, and the effect increased over time. the average impact coefficient of PRD retained between 5% and 7% without significant changes. Therefore, it showed that the service economy had a continuous impact on the levels of regional manufacturing without significant temporal difference.
From a spatial perspective, the service economy had most significantly impacted on the sub-core cities such as Foshan, Huizhou and Zhongshan (Figure 4). Guangzhou was the most significant city in trading activities and had held world-class trade fairs such as the Canton Fair. However, Guangzhou’s trade capacity and transportation infrastructure provided services to PRD and even the whole country, and its service economy did not play an important role in promoting local manufacturing. Foshan’s trade capacity, transportation and logistics capacity mainly provided services for the local economic development, capable of promoting efficient interactions between the local manufacturing firms and the market. As a core area of capital-intensive industries, Foshan was greatly benefited from the impact of financial capital on its manufacturing. With the first phase of China Petroleum & Chemical Corporation’s refinery and petrochemical project being put into production, Daya bay had gradually formed an industrial chain for petrochemicals deep-processing chain. As the industries of electronics, smart equipment production and biomedicine required considerable capital input, the impact of the service economy on Shenzhen became more intense after 2010.

3.2.4. The Impact of Production Capability on the Development of Manufacturing

According to the average influence coefficient, the impact of production capability in PRD were positive on the regional manufacturing with noticeable time stages. Before the 2008 crisis, the impact was largely consistent. After the crisis, the impact of production capability reduced slightly, reflecting the impact of the economic crisis on the labor market. Around 2013, the impact of production capability on the development of manufacturing returned to the pre-crisis levels and increased sharply afterwards. The manufacturing in PRD readjusted its market and structure after going through the economic crisis, improved its labor efficiency and enhanced its physical environment for production capability, which rapidly affected the overall development of the regional manufacturing.
From a spatial perspective, the dynamics of production capability before 2008 had significant differences between the inner circle and the outer circle, with a stronger impact on the inner circle than the outer circle (Figure 5). After 2008, the dynamics of production capability evolved into four types. Shenzhen and Dongguan were the cities that had been most significantly impacted on. Additionally, the impact to some extent presented a transmission effect from Shenzhen to Dongguan. In the metropolitan area of Guangzhou and Foshan, the impact of production capability basically remained unchanged—the impact declined slightly in Guangzhou and increased slightly in Foshan. For Zhongshan and Huizhou, the impact of production capability declined at first and then increased, and the decline processes of the two cities were intensified by the economic crisis. In the period from 2008 to 2013, the impact of production capability on the development of Huizhou’s manufacturing was even negative. However, with the development of electronics industry, the production capability in Huizhou returned to a comparatively high level. The impact of production capability on the west coast cities of PRD were relatively small, and for Zhuhai, the impact was in constant decline.

3.2.5. The Impact of Foreign Investment on the Development of Manufacturing

From the average impact coefficient, the impact of foreign investment on the development of manufacturing were positive with noticeable time stages. Until 2010, the impact of foreign investment was low and stable. After 2010, the impact of foreign investment increased significantly, and the impact coefficient increased by 15% each year until 2015. After 2015, the impact coefficient decreased by 2% each year, and eventually retained at 8%. The impact of foreign investment on the manufacturing in PRD had substantially changed the structure. Before the economic crisis, foreign-funded manufacturing in PRD mainly used the low cost of PRD to serve the global market. However, with the outbreak of the economic crisis, foreign-funded industries began to focus on both the Chinese and the global market, which had impact on the medium-high-tech industries in the cities.
Reflected in the space, the impact of foreign investment on the development of manufacturing in different cities had significant temporospatial difference (Figure 6). Before the economic crisis, the impact of foreign investment was most significant in the west coast cities in PRD such as Zhaoqing, Zhongshan and Zhuhai. After the crisis, the impact was found most significantly in two areas—Foshan-Zhongshan-Zhuhai and Shenzhen-Dongguan-Huizhou. For Shenzhen, Dongguan and Huizhou, the impact of foreign investment had a diffusion effect from the core city Shenzhen to the marginal cities of Dongguan and Huizhou, and there were both cooperation and functional division of labor among the three cities. However, the impact of foreign investment was mainly on the midstream and downstream of the industrial chain, such as the supporting firms of the electronics industry in Huizhou. In Foshan, the impact of foreign investment was mainly found on capital intense industries such as FAW-Volkswagen. The impact of foreign investment on Zhuhai’s industries were mainly concentrated in the petrochemical and electronics industries. The impact of foreign investment on Zhongshan’s industries was concentrated in the industries of equipment manufacturing, household chemicals, electronics and information. As Guangzhou was greatly affected by foreign investment in low-tech industries, the impact of foreign investment was not obvious.

4. Discussion

PRD is an emerging global city-region and a new spatial entity under the combined influence of globalization and urban regionalization [54]. However, existing research on PRD have paid too much attention to the development of the core world cities in the region, and considered that APS, especially the knowledge-intensive services, were the fundamental driving force for regional development [55,56,57]. However, unlike in the west, there has been no significant deindustrialization of urban areas in China, and manufacturing is an essential driver for the development of the global city-regions like PRD [29,35,58]. The United States and other Western countries have recognized the importance of manufacturing after the economic crisis and proposed a series of policy measures to revitalize their domestic manufacturing [59]. Although signs of manufacturing returning to developed countries has been emphasized by scholars in recent years, some scholars have pointed out that the return was not significant [59,60,61,62,63]. During the two major waves of NIDL, PRD has always stepped into the core of the waves with Hong Kong and the core cities in the coastal area of PRD undertaking the two global industrial transfers [64]. Previous studies on the development of manufacturing in PRD mainly focused on the development of specific cities, specific industries or flagship firms and lacked comprehensive views of the urban manufacturing at the city scale [42,44,58]. Even the descriptions of the pattern of manufacturing in PRD was limited to the material space or the total capacity and lacked the consideration of the internal structural characteristics of manufacturing. The comprehensive index of this paper takes into account not only the size and structure of urban manufacturing, but also the comparative advantage of urban manufacturing in the region.
In the early days of China’s reform and opening-up, PRD, with its proximity to Hong Kong, received a large number of industries through PMACT, which were regarded as export-oriented and low-end industries [16,65]. However, in practice, the manufacturing sector in PRD gradually transformed and upgraded, and the region turned to a new stage of innovation-driven development [26,42]. Since the industrial base, spatial location, infrastructure, service economy, financial strength and human resources of cities are all not the same, the development of manufacturing was varied. While existing research paid little attention to the varied development dynamic of manufacturing in different cities and the interactions between cities, this paper uses the method of spatio-temporal weighted regression model and selected four dimensions to depict the dynamic differences of nine cities at different stages. For other emerging city-regions in China or other developing countries, our index system evaluating the development of manufacturing and four-dimension analytical framework of dynamics can be used but needs to be justified according to their regional technological foundation and social-economic background. Our finding about the transmission effect between core and semi-peripheral cities may not be applicable for some city-regions because the filtering effect also exists in some city-regions [66]. However, our research emphasizes that the city-regions need to attach importance to this interconnection and figure out the mechanism. Additionally, this can help the city-region to get the regional coordination and technological cohesion.
In consideration of our findings, it is important that we spell out the limitations. Firstly, because of the context of China’s reform and opening-up and the “One Country, Two Systems” institutional system, the path of the PRD is too unique to be replicated. Secondly, due to the limitations of data, this paper does not take the more subdivided industry categories into account and the division of high-, medium- and low-tech industries is relatively rough. In addition, our study is devised from the corporate perspective. However, the development of regional manufacturing is not only affected by the firms themselves but also by the government, universities and research institutes, industrial associations and other non-economic actors. Therefore, future research needs to open the black box about each kind of actor and figure out the mechanism through which different actors interplay with each other and impel the regional development. Furthermore, according to our findings we need to conduct more in-depth case studies in different locations of the PRD to understand the implementation mechanism of manufacturing upgrading.

5. Conclusions

Using the urban manufacturing data of the PRD from 2000 to 2019, this paper measures the levels of manufacturing in nine cities in the PRD and its spatio-temporal change process, and constructs an analytical framework with the GTWR model to identify the driving forces of the development of manufacturing in various cities in the region, and the core conclusions are as follows:
The development of manufacturing in the PRD is quite different in the spatial-temporal perspective, which is transformed into the dynamic differences and the differences of the internal division of function in the manufacturing of the east and west coast of the PRD, and it alters the existing understanding of inner and outer layers. The region has also gradually transformed into a dual-core structure of the Shenzhen-Dongguan innovation corridor and the Guangzhou-Foshan integrated region; and the two cores had differentiated development paths. The west coast cities of the PRD have not developed any noticeably advantageous industries and star firms, and its development of manufacturing is lagging in the region. The three cities, Shenzhen, Dongguan and Huizhou, have fully integrated and developed a complete cooperation system of manufacturing with electronic equipment and electrical machinery as the core. After 2010, with the fourth industrial revolution, which is represented by ICT technology and artificial intelligence technology, Dongguan has gradually transformed from the typical representative of the world factory to a model of intelligent manufacturing. However, on the west coast of the PRD, there are three circles with vast differences in development. Guangzhou and Foshan are becoming more and more integrated and have advantages in the capital-intensive industries. Zhongshan and Zhuhai are well-founded in medium-high-tech industries, but the structure of these industries is not in coordination with their sizes. Zhaoqing and Jiangmen, separated from the core region, are at the bottom end of PRD’s development of manufacturing.
The financial crisis of 2008, on the one hand, promoted a shift of firms focusing on the market, and on the other hand, it required that firms should further build up technical barriers to keep their competitiveness in manufacturing. The spatial differences in R & D are related to the characteristics of the industries; the leading industries in the Guangzhou-Foshan metropolitan area are capital-intensive and of long-term technology update cycles, such as automobile manufacturing, mega equipment machinery manufacturing and petrochemical industry; in Shenzhen and Dongguan, the development of the electronics industry and equipment manufacturing are related to the trend of Industry 4.0, and the impact of the service economy was most significant in the sub-core cities such Foshan, Huizhou and Zhongshan. However, the case with Guangzhou is an exception as its trade capacity and transportation infrastructure provide services to the PRD and even the whole country. The impact of the service economy on the development of manufacturing in Guangzhou is reduced. After the economic crisis, the impact of production capability decreased slightly, reflecting its impact on the labor market; spatially, the impact presented a transmission effect from core cities, such as Guangzhou and Shenzhen, to sub-core cities, such as Foshan, Dongguan and Huizhou, indicating the division of manufacturing functions in the smaller regions. The impact of foreign investment is also different during different time periods, but there are two types. After 2010, the impact of foreign investment increased significantly. Because more foreign firms targeted the Chinese market after the crisis, the impact of foreign investment promoted the development of manufacturing in the non-core cities such as Foshan, Zhongshan and Zhuhai. On the other hand, China’s continuous opening-up policy has allowed foreign investment to enter China’s medium-high-tech industries, which has impacted most significantly on Dongguan and Shenzhen.
As for policy, cities such as Zhuhai and Huizhou which have an advanced industrial structure but only reach a relatively low scale should give more attention to the relationship between the structure and scale of the manufacturing. When the scale of industry reaches a certain level, the investment in R & D and other aspects will be more effective. Due to the complex interconnection and transmission effect between cities, when local governments are formulating urban planning and attracting investment, they should not only analyze the city’s own technological foundation but also consider the socio-economic background and industrial foundation of adjacent cities. The government need to make use of the spillover effect from the supply chain foundation, R & D capacity and service economy of surrounding cities to form an industrial path with regional technological cohesion. Furthermore, considering the 4th industrial revolution and the servitization of manufacturing, local authorities should balance the manufacture and service economy from a firm perspective. Industry 4.0 technology causes the boundary between manufacture and service to be porous. Therefore, policies should be targeted to attract and support the firms and institutions concerning industry 4.0 technology and encourage the incumbent firms to absorb the new technology to promote productivity.

Author Contributions

Conceptualization, X.L. and D.X.; methodology, X.L. and Y.T.; software, X.L.; formal analysis, X.L.; resources, X.L., Y.T. and D.X.; data curation, X.L.; writing—original draft preparation, X.L.; writing—review and editing, Y.T. and D.X.; visualization, X.L. and Y.T.; funding acquisition, D.X. All authors have read and agreed to the published version of the manuscript.

Funding

This research was funded by the National Natural Science Foundation of China, grant number: 41930646.

Institutional Review Board Statement

Not applicable.

Informed Consent Statement

Not applicable.

Data Availability Statement

Not applicable.

Conflicts of Interest

The authors declare no conflict of interest.

Appendix A

Table A1. Specific industries covered by different categories.
TypeTwo-Digit Level of Industrial Classification in Manufacturing
Low-tech
industries
13 Agricultural and sideline food processing industry
14 Food Manufacturing
15 Wine, Beverage and Refined Tea Manufacturing
16 Tobacco Industry
17 Textile Industry
18 Textile and Apparel and Apparel Industry
19 Leather, fur, feathers and their products and footwear
20 Wood processing and wood, bamboo, rattan, palm and grass products industry
21 Furniture manufacturing
22 Paper and Paper Products Industry
23 Printing and Recording Media Copying Industry
24 Culture, Education, Industry, Sports and Entertainment Products Manufacturing
41 Other manufacturing
Medium-tech
industries
25 Oil, coal and other fuel processing industries
28 Chemical Fiber Manufacturing
29 Rubber and plastic products industry
30 Non-metallic mineral products industry
31 Ferrous metal smelting and rolling processing industry
32 Non-ferrous metal smelting and rolling processing industry
33 Metal Products Industry
High-tech
industries
26 Chemical raw materials and chemical manufacturing
27 Pharmaceutical Manufacturing
34 General Equipment Manufacturing
35 Special Equipment Manufacturing
36 Automotive Manufacturing
37 Railway, shipbuilding, aerospace and other transportation equipment manufacturing
38 Electrical Machinery and Equipment Manufacturing
39 Computer, communications and other electronic equipment manufacturing
40 Instrumentation Manufacturing

References

  1. Scott, A. Global City-Regions: Trends, Theory, Policy, 1st ed.; Oxford University Press: New York, NY, USA, 2002; pp. 11–32. [Google Scholar]
  2. Hall, P.G.; Pain, K. The Polycentric Metropolis: Learning from Mega-City Regions in Europe, 1st ed.; Routledge: London, UK, 2006; pp. 3–16. [Google Scholar]
  3. Zhang, X. Multiple creators of knowledge-intensive service networks: A case study of the Pearl River Delta city-region. Urban Stud. 2018, 55, 2000–2019. [Google Scholar] [CrossRef]
  4. Bel, G.; Fageda, X. Getting there fast: Globalization, intercontinental flights and location of headquarters. J. Econ. Geogr. 2007, 8, 471–495. [Google Scholar] [CrossRef]
  5. Hanssens, H.; Derudder, B.; Van Aelst, S.; Witlox, F. Assessing the Functional Polycentricity of the Mega-City-Region of Central Belgium Based on Advanced Producer Service Transaction Links. Reg. Stud. 2014, 48, 1939–1953. [Google Scholar] [CrossRef]
  6. Lambregts, B. Geographies of Knowledge Formation in Mega-City Regions: Some Evidence from the Dutch Randstad. Reg. Stud. 2008, 42, 1173–1186. [Google Scholar] [CrossRef] [Green Version]
  7. Castells, M. The Rise of the Network Society; Blackwell Publishers: Oxford, UK, 1996. [Google Scholar]
  8. Hoyler, M.; Freytag, T.; Mager, C. Connecting Rhine-Main: The production of multi-scalar polycentricities through knowledge-intensive business services. Reg. Stud. 2008, 42, 1095–1111. [Google Scholar] [CrossRef] [Green Version]
  9. Wu, J.; Wei, Y.D.; Li, Q.; Yuan, F. Economic Transition and Changing Location of Manufacturing Industry in China: A Study of the Yangtze River Delta. Sustainability 2018, 10, 2624. [Google Scholar] [CrossRef] [Green Version]
  10. Lüthi, S.; Thierstein, A.; Bentlage, M. The Relational Geography of the Knowledge Economy in Germany: On Functional Urban Hierarchies and Localised Value Chain Systems. Urban Stud. 2013, 50, 276–293. [Google Scholar] [CrossRef]
  11. Szalavetz, A. Industry 4.0 and capability development in manufacturing subsidiaries. Technol. Forecast. Soc. Change 2019, 145, 384–395. [Google Scholar] [CrossRef]
  12. Götz, M.; Jankowska, B. Clusters and Industry 4.0—Do they fit together? Eur. Plan. Stud. 2017, 25, 1633–1653. [Google Scholar] [CrossRef]
  13. Dengler, K.; Matthes, B. The impacts of digital transformation on the labour market: Substitution potentials of occupations in Germany. Technol. Forecast. Soc. Change 2018, 137, 304–316. [Google Scholar] [CrossRef]
  14. Camina, E.; Diaz-Chao, A.; Torrent-Sellens, J. Automation technologies: Long-term effects for Spanish industrial firms. Technol. Forecast. Soc. Change 2020, 151, 119828. [Google Scholar] [CrossRef]
  15. Dicken, P. Global Shift: Mapping the Changing Contours of the World Economy, 7th ed.; Guilford Press: New York, NY, USA, 2015; pp. 41–78. [Google Scholar]
  16. Xu, X.; Huang, D.; Zhang, R. On features of town development in the Zhujiang River Delta since 1978. Chin. Geogr. Sci. 1992, 2, 114–125. [Google Scholar] [CrossRef]
  17. Yang, C. Restructuring the export-oriented industrialization in the Pearl River Delta, China: Institutional evolution and emerging tension. Appl. Geogr. 2012, 32, 143–157. [Google Scholar] [CrossRef]
  18. Lin, G.C. Red Capitalism in South China: Growth and Development of the Pearl River Delta, 1st ed.; University of British Columbia Press: Vancouver, BC, Canada, 1997; pp. 77–124. [Google Scholar]
  19. Zhao, S.X.B.; Zhang, L. Foreign Direct Investment and the Formation of Global City-Regions in China. Reg. Stud. 2007, 41, 979–994. [Google Scholar] [CrossRef]
  20. Zhang, K.H. Globalization and regional industrial performance: Evidence from China. Pap. Reg. Sci. 2014, 93, 269–280. [Google Scholar] [CrossRef]
  21. Yang, C.; He, C. Transformation of China’s ‘World Factory’: Production Relocation and Export Evolution of the Electronics Firms. Tijdschr. Voor Econ. Soc. Geogr. 2017, 108, 571–591. [Google Scholar] [CrossRef]
  22. Zhang, X.; Kloosterman, R.C. Connecting the ‘Workshop of the World’: Intra- and Extra-Service Networks of the Pearl River Delta City-Region. Reg. Stud. 2016, 50, 1069–1081. [Google Scholar] [CrossRef]
  23. Yang, C. Market rebalancing of global production networks in the Post-Washington Consensus globalizing era: Transformation of export-oriented development in China. Rev. Int. Political Econ. 2014, 21, 130–156. [Google Scholar] [CrossRef]
  24. Liu, Y. The dynamics of local upgrading in globalizing latecomer regions: A geographical analysis. Reg. Stud. 2017, 51, 880–893. [Google Scholar] [CrossRef]
  25. Zhu, S.; Lan, T. New economic geographies of manufacturing in China. Geogr. Compass 2016, 10, 470–481. [Google Scholar] [CrossRef]
  26. Yang, C. The transformation of foreign investment-induced ‘exo(genous)-urbanisation’ amidst industrial restructuring in the Pearl River Delta, China. Urban Stud. 2020, 57, 618–635. [Google Scholar] [CrossRef]
  27. Zhao, X.; Qiang, W.; Wong, W.; Xian, S. Theoretical framework and development strategy of the Guangdong-Hong Kong-Macao Greater Bay Area. Prog. Geogr. 2018, 37, 1597–1608. (In Chinese) [Google Scholar]
  28. Ding, J.; Wang, K. Spatio-temporal evolution of industrial production space and its driving mechanisms in Pearl River Delta urban agglomeration. Geogr. Res. 2018, 37, 53–66. (In Chinese) [Google Scholar]
  29. Liu, B.; Xue, D.; Tan, Y. Deciphering the Manufacturing Production Space in Global City-Regions of Developing Countries—A Case of Pearl River Delta, China. Sustainability 2019, 11, 6850. [Google Scholar] [CrossRef] [Green Version]
  30. Li, Y.; He, C. Characteristics and mechanism of manufacturing industry shift in the Pearl River Delta during 1998–2009. Prog. Geogr. 2013, 32, 777–787. (In Chinese) [Google Scholar]
  31. Jin, L.; Li, X.; Zeng, X.T. The new round of manufacture spatial restructuring and mechanism study in Guangdong province. Econ. Geogr. 2015, 35, 101–109. (In Chinese) [Google Scholar]
  32. Cao, Z.; Zhu, Q. Manufacturing agglomeration and transfer in Guangdong province from 2006 to 2015: Path differences and influencing factors. Econ. Geogr. 2017, 37, 111–117. (In Chinese) [Google Scholar]
  33. Liu, H.; Fan, J.; Zhang, H.; Wang, F. Dynamics of manufacturing industry and change of its spatial pattern in the Pearl River Delta urban agglomeration. Prog. Geogr. 2020, 39, 195–206. (In Chinese) [Google Scholar] [CrossRef]
  34. Li, H.; Yuan, W.; Ma, M.; Yuan, W. Manufacturing industry agglomeration characteristics in the Pearl River Delta and evolution based on growth data. Prog. Geogr. 2018, 37, 1291–1302. (In Chinese) [Google Scholar]
  35. He, C.; Yan, Y.; Rigby, D. Regional industrial evolution in China. Pap. Reg. Sci. 2018, 97, 173–198. [Google Scholar] [CrossRef]
  36. He, C.; Pan, F.; Chen, T. Research progress of industrial geography in China. J. Geogr. Sci. 2016, 26, 1057–1066. [Google Scholar] [CrossRef]
  37. He, C.; Pan, F.; Sun, L. Geographical concentration of manufacturing industries in China. Acta Geogr. Sin. 2007, 62, 1253–1264. (In Chinese) [Google Scholar]
  38. Ye, Y.; Wu, K.; Xie, Y.; Huang, G.; Wang, C.; Chen, J. How firm heterogeneity affects foreign direct investment location choice: Micro-evidence from new foreign manufacturing firms in the Pearl River Delta. Appl. Geogr. 2019, 106, 11–21. [Google Scholar] [CrossRef]
  39. Yeh, A.G.; Chen, Z. From cities to super mega city regions in China in a new wave of urbanisation and economic transition: Issues and challenges. Urban Stud. 2020, 57, 636–654. [Google Scholar] [CrossRef]
  40. Liu, Y. Local Dynamics of Industrial Upgrading: The Case of the Pearl River Delta in China; Springer Nature: Berlin, Germany, 2020. [Google Scholar]
  41. Yang, F.F.; Yeh, A.G.O.; Wang, J. Regional effects of producer services on manufacturing productivity in China. Appl. Geogr. 2018, 97, 263–274. [Google Scholar] [CrossRef]
  42. Li, X.; Hui, E.C.; Lang, W.; Zheng, S.; Qin, X. Transition from factor-driven to innovation-driven urbanization in China: A study of manufacturing industry automation in Dongguan City. China Econ. Rev. 2020, 59, 101382. [Google Scholar] [CrossRef]
  43. Sharif, N.; Huang, Y. Industrial Automation in China’s “Workshop of the World”. China J. 2019, 81, 1–22. [Google Scholar] [CrossRef]
  44. Fu, T.; Yang, C.; Li, L. Market imperative and cluster evolution in China: Evidence from Shunde. Reg. Stud. 2020, 54, 244–255. [Google Scholar] [CrossRef]
  45. Li, J.; Yang, Y.; Jiang, X.; Wang, B.; Zhang, W. Spatial-temporal patterns and coordination of manufacturing scale and structure in China during 1998–2013. Sci. Geogr. Sin. 2018, 38, 2014–2023. (In Chinese) [Google Scholar]
  46. Fu, L. An empirical research on industry structure and economic growth. Stat. Res. 2010, 27, 79–81. (In Chinese) [Google Scholar]
  47. Di Mauro, C.; Fratocchi, L.; Orzes, G.; Sartor, M. Offshoring and backshoring: A multiple case study analysis. J. Purch. Supply Manag. 2018, 24, 108–134. [Google Scholar] [CrossRef]
  48. Yeung, H.W.; Coe, N.M. Toward a Dynamic Theory of Global Production Networks. Econ. Geogr. 2015, 91, 29–58. [Google Scholar] [CrossRef] [Green Version]
  49. Coe, N.M.; Yeung, H.W. Global production networks: Mapping recent conceptual developments. J. Econ. Geogr. 2019, 19, 775–801. [Google Scholar] [CrossRef]
  50. Sit, V.F.S.; Yang, C. Foreign-investment-induced Exo-urbanisation in the Pearl River Delta, China. Urban Stud. 1997, 34, 647–677. [Google Scholar] [CrossRef]
  51. Fotheringham, A.S.; Charlton, M.E.; Brunsdon, C. Geographically Weighted Regression: A Natural Evolution of the Expansion Method for Spatial Data Analysis. Environ. Plan. A 1998, 30, 1905–1927. [Google Scholar] [CrossRef]
  52. Huang, B.; Wu, B.; Barry, M. Geographically and temporally weighted regression for modeling spatio-temporal variation in house prices. Int. J. Geogr. Inf. Sci. IJGIS 2010, 24, 383–401. [Google Scholar] [CrossRef]
  53. Wang, H.; Zhang, B.; Liu, Y.; Liu, Y.; Xu, S.; Deng, Y.; Zhao, Y.; Chen, Y.; Hong, S. Multi-dimensional analysis of urban expansion patterns and their driving forces based on the center of gravity-GTWR model: A case study of the Beijing-Tianjin-Hebei urban agglomeration. Acta Geogr. Sin. 2018, 73, 1076–1092. (In Chinese) [Google Scholar]
  54. Bie, J.; Jong, M.D.; Derudder, B. Greater Pearl River Delta: Historical Evolution towards a Global City-Region. J. Urban Technol. 2015, 22, 103–123. [Google Scholar] [CrossRef]
  55. Thierstein, A.; Lüthi, S.; Kruse, C.; Gabi, S.; Glanzmann, L. Changing Value Chain of the Swiss Knowledge Economy: Spatial Impact of Intra-firm and Inter-firm Networks within the Emerging Mega-City Region of Northern Switzerland. Reg. Stud. 2008, 42, 1113–1131. [Google Scholar] [CrossRef]
  56. Yeh, A.G.; Yang, F.F.; Wang, J. Producer service linkages and city connectivity in the mega-city region of China: A case study of the Pearl River Delta. Urban Stud. 2015, 52, 2458–2482. [Google Scholar] [CrossRef]
  57. Wang, J.; Zhang, X.; Yeh, A.G.O. Spatial proximity and location dynamics of knowledge-intensive business service in the Pearl River Delta, China. Habitat Int. 2016, 53, 390–402. [Google Scholar] [CrossRef]
  58. Li, W.; Xue, D.; Huang, X. The Role of Manufacturing in Sustainable Economic Development: A Case of Guangzhou, China. Sustainability 2018, 10, 3039. [Google Scholar] [CrossRef] [Green Version]
  59. Fratocchi, L.; Ancarani, A.; Barbieri, P.; Di Mauro, C.; Nassimbeni, G.; Sartor, M.; Vignoli, M.; Zanoni, A. Motivations of manufacturing reshoring: An interpretative framework. Int. J. Phys. Distrib. Logist. Manag. 2016, 46, 98–127. [Google Scholar] [CrossRef]
  60. Bailey, D.; De Propris, L. Manufacturing reshoring and its limits: The UK automotive case. Camb. J. Reg. Econ. Soc. 2014, 7, 379–395. [Google Scholar] [CrossRef] [Green Version]
  61. Lund, H.B.; Steen, M. Make at home or abroad? Manufacturing reshoring through a GPN lens: A Norwegian case study. Geoforum 2020, 113, 154–164. [Google Scholar] [CrossRef]
  62. Ellram, L.M.; Tate, W.L.; Petersen, K.J. Offshoring and Reshoring: An Update on the Manufacturing Location Decision. J. Supply Chain. Manag. 2013, 49, 14–22. [Google Scholar] [CrossRef]
  63. Kinkel, S. Trends in production relocation and backshoring activities. Int. J. Oper. Prod. Manag. 2012, 32, 696–720. [Google Scholar] [CrossRef]
  64. Dicken, P. Global Shift: Reshaping the Global Economic Map in the 21st Century, 4th ed.; Guilford Press: New York, NY, USA, 2003; pp. 28–70. [Google Scholar]
  65. Shen, J.F. Hong Kong under Chinese sovereignty: Economic relations with Mainland China, 1978–2007. Eurasian Geogr. Econ. 2008, 49, 326–340. [Google Scholar] [CrossRef]
  66. Breul, M.; Diez, J.R.; Sambodo, M.T. Filtering strategic coupling: Territorial intermediaries in oil and gas global production networks in Southeast Asia. J. Econ. Geogr. 2019, 19, 829–851. [Google Scholar] [CrossRef] [Green Version]
Figure 1. Location of the Pearl River Delta in China.
Land 11 00625 g001
Figure 2. Level of development of the manufacturing of the cities in different years.
Land 11 00625 g002
Figure 3. Level of the GTWR coefficient of R & D on the development of manufacturing in different years.
Land 11 00625 g003
Figure 4. Level of the GTWR coefficient of service economy on the development of manufacturing in different years.
Land 11 00625 g004
Figure 5. Level of the GTWR coefficient of production capability on the development of manufacturing in different years.
Land 11 00625 g005
Figure 6. Level of the GTWR coefficient of foreign investment on the development of manufacturing in different years.
Land 11 00625 g006
Table 1. The dominant factors of principal components of driving factors.
Principal ComponentIndicators MeasurementCore Meaning
X 1 TOGTurnover of goodsService economy
SWRTotal sales of good in wholesale and retail trade in each city
PWRTotal purchases of goods in wholesale and retail trade in each city
LLFLoans in local and foreign currencies from Chinese and foreign financial institutions
X 2 RDIR & D expenditures of the industrial firmsR & D
PGINumbers of patents granted of the industrial firms
X 3 LPIlabor productivity of the industrial firmsProduction capability
CFMthe amount of capital invested in the fixed assets of manufacturing
X 4 FCUthe amount of foreign capital actually utilizedForeign investment
FCUMthe amount of foreign capital actually utilized by manufacture
Table 2. Relevant parameters of GTWR.
No.ParameterValue
1Bandwidth0.118859
2Residual sum of squares0.044256
3Residual estimate standard deviation0.01568
4AICc−824.315
5 R 2 0.991926
6 A d j u s t e d   R 2 0.991742
7The spatiotemporal distance ratio0.496778
Publisher’s Note: MDPI stays neutral with regard to jurisdictional claims in published maps and institutional affiliations.

