Article

Spatial Features of Urban Expansion in Vietnam Based on Long-Term Nighttime Lights Data

1
School of Geography and Planning, Sun Yat-sen University, Guangzhou 510275, China
2
Shenzhen School of Northeast Normal University Affiliated High School, Shenzhen 518118, China
3
China Regional Coordinated Development and Rural Construction Institute, Sun Yat-sen University, Guangzhou 510275, China
4
Southern Marine Science and Engineering Guangdong Laboratory (Zhuhai), Zhuhai 510980, China
5
The Bartlett Centre for Advanced Spatial Analysis (CASA), University College London (UCL), London WC1E 6BT, UK
*
Author to whom correspondence should be addressed.
Land 2022, 11(5), 601; https://doi.org/10.3390/land11050601
Submission received: 2 March 2022 / Revised: 12 April 2022 / Accepted: 16 April 2022 / Published: 20 April 2022

Abstract

:
As a developing country, Vietnam has experienced rapid economic development since the 21st century. It is therefore becoming increasingly important to understand its spatial pattern of urban expansion. However, the key challenge in this endeavor lies in the lack of national accounting data for the sub-administrative divisions of Vietnam at the national level, especially longitudinal data over a long time series. The nighttime lights (NTL) data can objectively reflect the scope and intensity of human development and construction in urban built-up areas, which can effectively support the empirical analysis of the urban expansion process in Vietnam. This paper uses the intercalibration model to correct and fit the long time series of DMSP/OLS and VIIRS/NPP NTL data. Based on this, the data for the urban built areas of Vietnam from 2000 to 2018 are further extracted. The results are as follows. (1) The main urban expansion in Vietnam is concentrated in the southern Mekong Delta and the northern Red River Delta, represented by Ho Chi Minh City and Hanoi City, respectively. (2) Vietnam’s urban NTL has significant high–high clustering characteristics in the north-south delta regions. The main urban expansion hotspots were concentrated around Ho Chi Minh City before 2012, the northern region represented by Hanoi City was gradually transformed into a critical area that gathering urban expansion hotspots after 2012. (3) The cities with significant influence and high coupling degree of industrialization and globalization on the urbanization of Vietnam are concentrated in Ho Chi Minh City, Hanoi, and some northern delta provinces, showing that the impact of industrialization and globalization on urbanization in Vietnam is still limited to some regions. In addition, the results show that the size of the population and the level of industrialization are the main drivers of urban expansion in Vietnam, while the level of foreign investment shows little significance. The results are helpful for promoting the application of long time series NTL data in urban expansion and for further analyzing the urban pattern changes in Vietnam and the influencing factors behind them.

1. Introduction

Since the Vietnamese government implemented a series of economic reforms in 1986, the annual GDP growth rate has been maintained at 6.5% to 7% [1], making it one of the fastest-growing economies globally. Between 1990 and 2017, with the rapid growth of the urbanization economy, the number of towns increased from 500 to 780, and the overall urbanization level increased from 19% to more than 34% [2]. As a fast-developing country, Vietnam’s rapid urbanization is closely related to its industrialization and the growth of foreign direct investment (FDI). Research on urbanization in Vietnam mainly focuses on the relationship between urbanization and land-use change [3] or environmental and social changes in some cities. As previous studies have shown, urbanization or urban expansion, usually characterized by the conversion of non-urban lands to urban lands, is driven by socioeconomic factors, such as urban population growth and economy [4,5]. In addition to socioeconomic factors, physical factors, such as elevation, slope, river, and mountain, also influence urban expansion [6]. Relevant studies have pointed out that Vietnam’s rapid urbanization is driven by population agglomeration, accelerated industrialization, and housing improvements [1]. Nevertheless, only a few analyses focus on the long-term urban expansion spatial pattern in Vietnam, due to the lack of spatially disaggregated national accounts data—in particular, the lack of GDP data for cities.
As an alternative solution, nighttime lights (NTL) remote sensing imagery has gradually become an important data source that has been widely used in urbanization research [7,8,9,10]. The most commonly applied NTL data are from the Operational Linescan System (OLS) carried by the US defense meteorological satellite program (DMSP) and the Suomi National Polar-Orbiting Partnership satellite’s Visible Infrared Imaging Radiometer Suite (Suomi NPP/VIIRS). NTL RS images can capture weak near-infrared radiation on the earth’s surface at night, including lights, traffic flow, and other persistent light sources in cities and small residential areas [11,12]. NTL data can objectively reflect the scope and intensity of human activities and proxy urban built-up areas by using this characteristic. In 1978, Croft first proposed to extract data on urban built-up areas based on DMSP/OLS NTL images [13]. Since then, more and more scholars have begun to use NTL data to conduct dynamic monitoring research on the spatial expansion of urban built-up areas [14,15,16]. NTL data are also widely used in population and energy estimation [17,18], regional economic activity [19,20,21], light pollution [22], war research [23,24], energy consumption [25], etc. Henderson’s [26] research shows that “NTL growth provides a very useful indicator for long-term GDP growth, and also tracks short-term growth fluctuations”, and explains how to use NTL data to improve the measurement of regional economic growth in the absence of GDP data. At the same time, Storeygard [27] used NTL data as “a new data source and a representative of urban revenue” to study the impact of transportation and trade costs on the spatial growth pattern of sub-Saharan African cities. Zhou [28] extracted the city-wide NTL data of South Asia from 2001 to 2013 based on the threshold method, and analyzed the spatial pattern and driving factors of urban NTL growth in South Asia.
Although some new NTL data with higher resolution are currently being released, including ISS [29], Luojia-1, JL1, Eros-B, etc., there remains a lack of continuous long-term data, such as DMSP/OLS and NPP/VIIRS. In addition, the DMSP/OLS data ceased producing annual composites after 2013. The successor product is the Suomi NPP/VIIRS day-and-night band (DNB) monthly composite, which has been systematically produced for the period starting in April 2012. Combining DMSP/OLS and NPP/VIIRS annual composites with an intercalibration model is necessary. Some scholars have tried to build an intercalibration model between these two kinds of NTL data, introducing an important research method into the satellite data application field. Shao et al. [30] calibrated single-day DMSP/OLS images with VIIRS images using Dome C in the Antarctic as the calibration site. Li et al. [31] evaluated the Syrian Civil War from March 2011 to January 2017 by combining DMSP/OLS and Suomi NPP/VIIRS DNB monthly composites with an intercalibration model.
This paper takes Vietnam as the research area and uses the threshold method to extract the urban built-up area NTL images by building an intercalibration model between DMSP/OLS and NPP/VIIRS data from 2000 to 2018. This research sets three main objectives: (1) using the NTL data of urban built-up areas to reflect the intensity of urban economic activity, and analyzing the detailed spatial pattern of urban economic growth in Vietnam from 2000 to 2018 to understand the dynamic change characteristics of the spatial pattern of urban expansion in Vietnam; (2) combining the FDI data and industrial GDP data of Vietnam’s provincial administrative divisions, which represent the globalization and industrialization levels of each province in Vietnam, to further unravel the spatial pattern differences at the globalization, industrialization and urbanization levels in the different provinces of Vietnam; (3) synthesizing provincial-level socioeconomic data to analyze the driving factors in the expansion of Vietnam’s urban area from 2000 to 2018, focusing on population, the level of industrialization, and the amount of foreign investment. The study is helpful for promoting the application of long time series NTL data in urban expansion, and for further analyzing the urban pattern changes in Vietnam and the influencing factors behind them.

2. Research Area and Data Processing

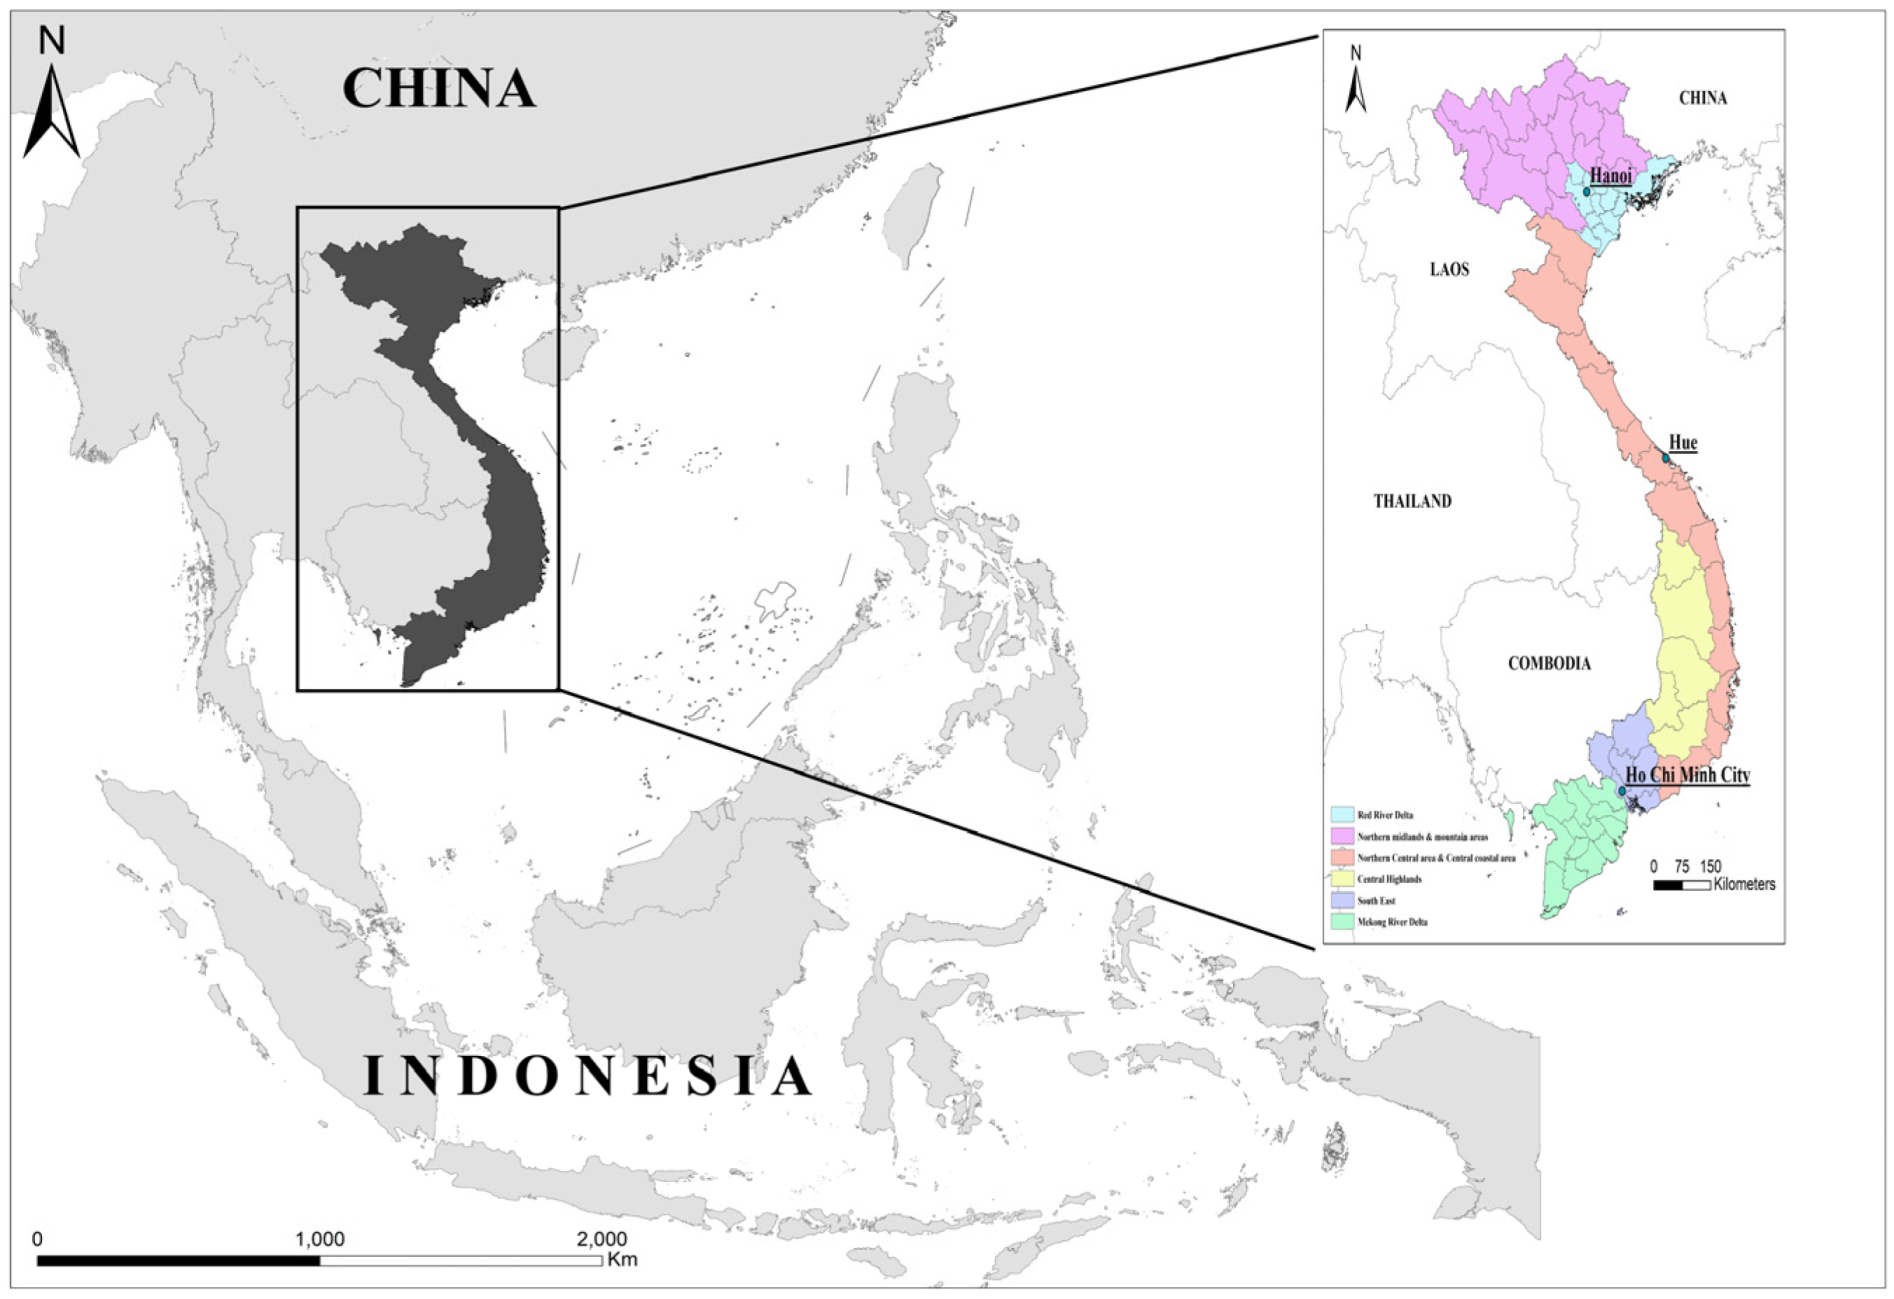
2.1. Research Area and Data

Vietnam is located in the east of the Indochina Peninsula in Southeast Asia, with China, Laos, and Cambodia as its neighboring countries (Seen Figure 1). Vietnam comprises 58 provinces and five municipalities directly under the Central Government, with a population of 96 million in 2020. Hanoi is the capital and Ho Chi Minh City is the economic center of Vietnam. This study takes 2000–2018 as the research time series, and makes use of three types of data: administrative borders, NTL images, and population-economic data. The corresponding NTL data required include DMSP/OLS annual composites and Suomi NPP/VIIRS DNB monthly composites. In the remainder of this article, we use the abbreviations “DMSP/OLS images” and “NPP/VIIRS images” to represent these two data sets. The two kinds of images are panchromatic remote sensing images with a wavelength of 0.5 to 0.9 μm, downloaded from the NOAA/NGDC website (https://ngdc.noaa.gov/eog (accessed on 1 April 2022). The DMSP/OLS images with a spatial resolution of 0.008333° contain long-lasting light sources, such as cities and towns, and remove the influence of random noise, such as moonlight clouds, fire, oil, and gas combustion. The data include an annual average grayscale (DN) value of the cloud-free frame stable light, ranging from 0 to 63. NPP/VIIRS images with a spatial resolution of 0.004167° filter out the effects of stray light, lightning, moonlight, and cloud coverage while retaining auroras, fires, boats, and other temporary lights. The population-distribution data come from the WorldPop website (https://www.worldpop.org/geodata (accessed on 1 April 2022), and the economic statistics data come from the official website of the Vietnam Statistics Bureau (https://www.gso.gov.vn (accessed on 1 April 2022).

2.2. Data Processing

Because NGDC produced annual composites of DMSP/OLS images for 1992–2013 only, we use NPP/VIIRS monthly images as material to cover the study period from 2000 to 2018. A series of preliminary data processes was conducted. First, basic geoprocessing operations were applied, such as clipping with administrative borders, projection intercalibration, and most importantly, resampling the spatial resolution of images to 0.008333°. Secondly, the NPP/VIIRS monthly images were synthesized into annual NTL images, and the two types of data were intercalibrated separately according to the year [32]. Then, the sensor intercalibration (Equation (1)) and inter-year intercalibration (Equation (2)) were processed for the DMSP/OLS image, and the 2013 DMSP/OLS images were used as a mask with which to perform interannual intercalibration on NPP/VIIRS images. Finally, a model calibration of the two types of images was implemented and is further detailed here. (1) We extracted the pixel value matrix of the two kinds of data in the same year in 2013; (2) performed the intercalibrating equation to fit the intercalibration model (Equation (3)) for conversion; and (3) derived the DMSP/OLS images for the 2014–2018 NPP/VIIRS images based on the calibrated model. The converted results show the change in Vietnam’s total DN (digital number) value from 2000 to 2018, and Figure 2 maps the superimposed DN value from 2000 to 2018.
By equation-fitting the NTL data of Vietnam from 2000 to 2018 with the GDP data, it was found that there was a significant linear regression relationship, which also indicated that the trend in NTL change in Vietnam was consistent with the trend in GDP growth, which could then be used in the study to represent urban economic activities.
D N ( n , i ) = { 0 D N ( n , i ) a = 0   o r   D N ( n , i ) b = 0 ( D N ( n , i ) a + D N ( n , i ) b ) / 2 o t h e r s
In Equation (1), D N ( n , i ) a , D N ( n , i ) b are respectively the DN values of DMSP/OLS images obtained by two different sensors after mutual correction in the nth year, n = 2000, 2001, 2002…, 2013; D N ( n , i ) is the DN value of I pixel in the image of year n after intercalibration.
D N ( n , i ) = { 0 D N ( n , i ) = 0 D N ( n 1 , i ) D N ( n + 1 , i ) > 0   &   D N ( n 1 , i ) > D N ( n , i ) D N ( n , i ) o t h e r s
In Equation (2), D N ( n 1 , i ) ,   D N ( n , i ) ,   D N ( n + 1 , i ) are the DN values of i pixel in the image of year n − 1, year n and year n + 1 after intercalibration by Formula (2), respectively.
DNDMSP = 45.48 × e^(DNNPP × 0.001082) − 45.36 × e^(XNPP × −0.5727)
We refer to previous studies and use the logarithmic transformation method to establish the calibrated model between the two kinds of NTL data [32,33,34,35]. In Equation (3), DNNPP represents the DN value of NPP/VIIRS images from 2014 to 2018, and DNDMSP represents the DN value of DMSP/OLS images after intercalibration from 2014 to 2018.
Based on the above converted remote sensing images of NTL from 2000 to 2018, a threshold method was used to extract the urban built-up areas in Vietnam. Most studies use empirical and statistical methods to determine the urban scope to find the most suitable threshold for DN value. For example, Storeygard [27] uses all DN values (1–63) as urban built-up areas in Africa, while Small et al. [36] conclude that “dark areas with DN values less than 12 almost always contain signs of man-made land cover (such as agriculture)”, and propose that DN values of 13 or higher are closely related to urban built-up areas. This can be used as a threshold to distinguish between urban and rural areas (note that rural areas may also have night lighting, although DN values tend to be lower). After comparing MODIS data, Zhou et al. [28] also used DN > 13 as the threshold to determine the urban areas in South Asia. In light of relevant studies, this paper takes DN > 13 as the threshold for determining the urban area of Vietnam, and any pixel value greater than or equal to 13 is regarded as urban light, as shown in Figure 2.

3. Results

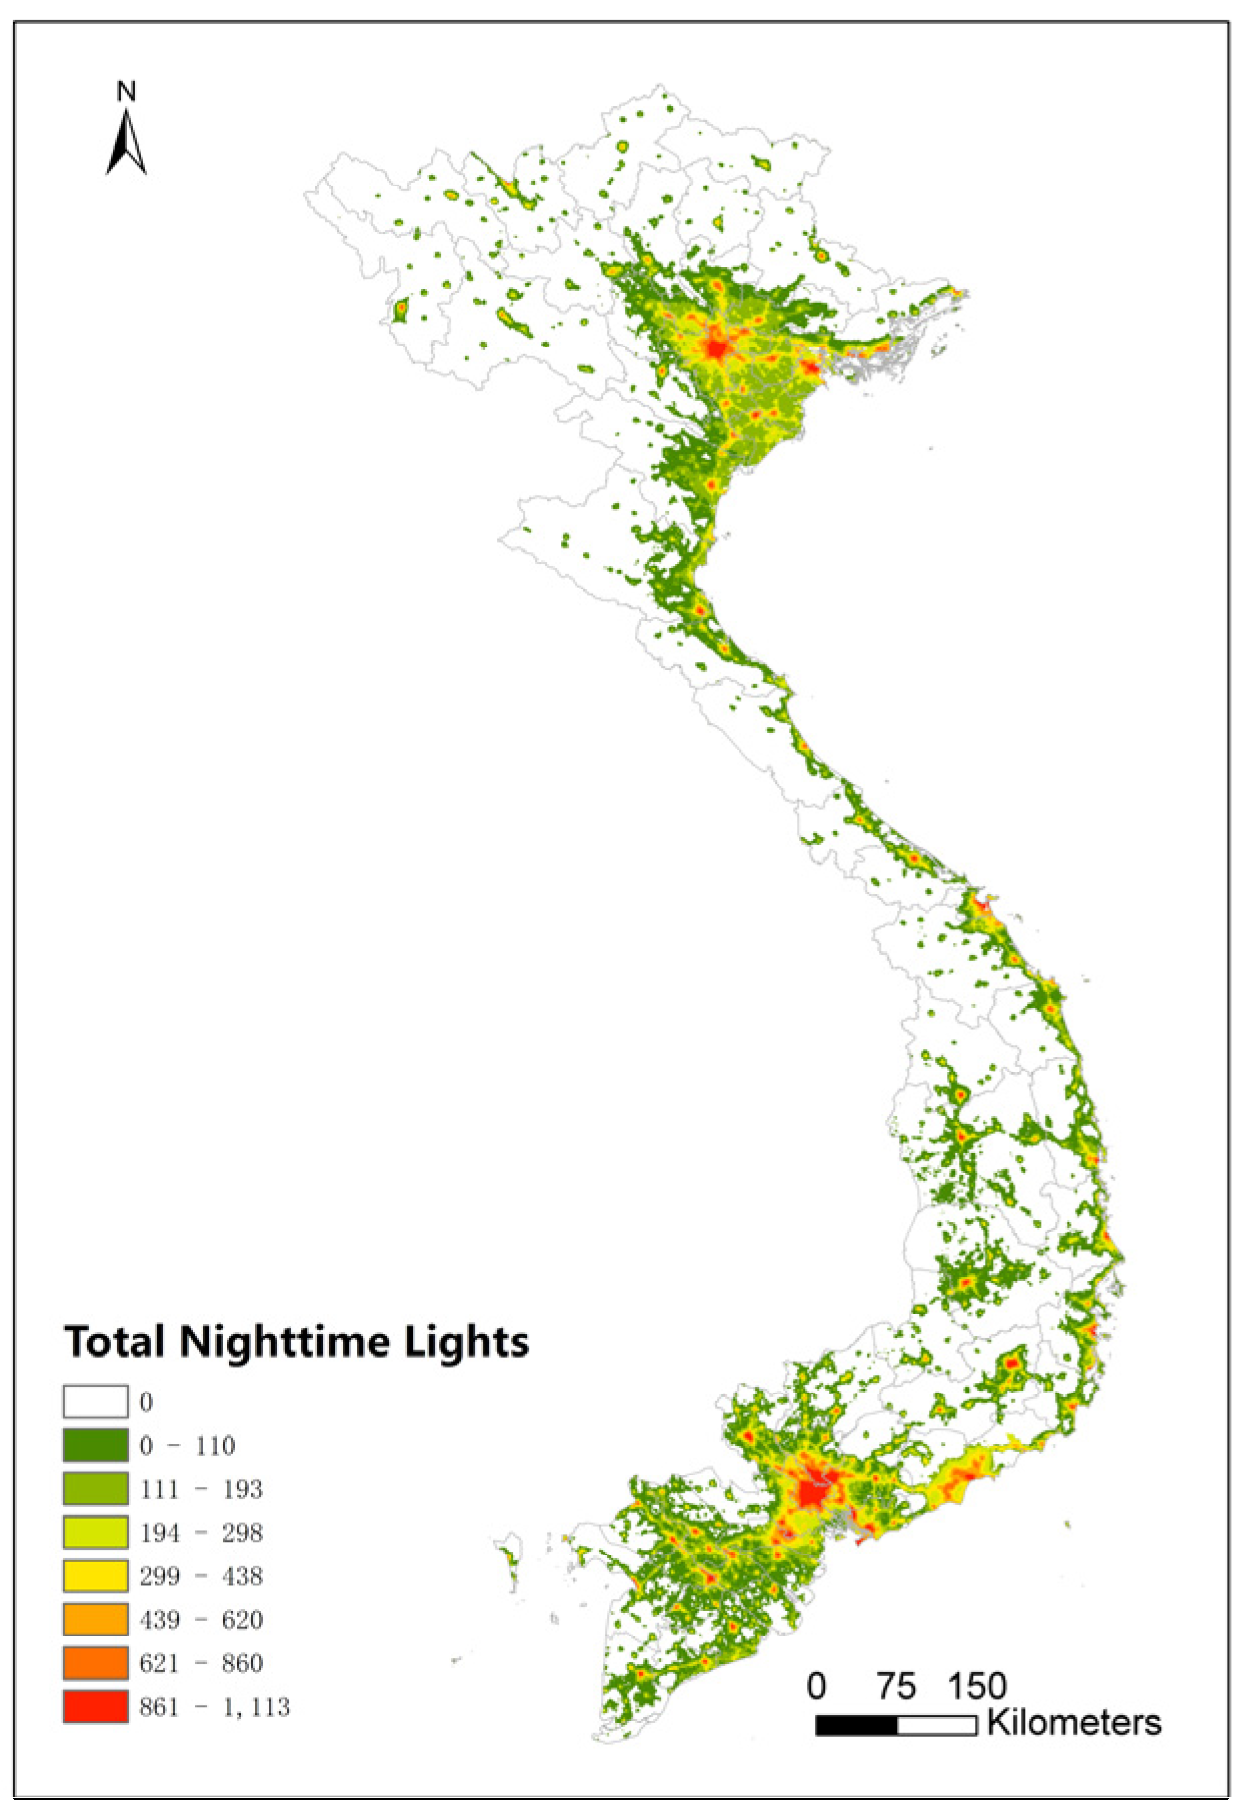
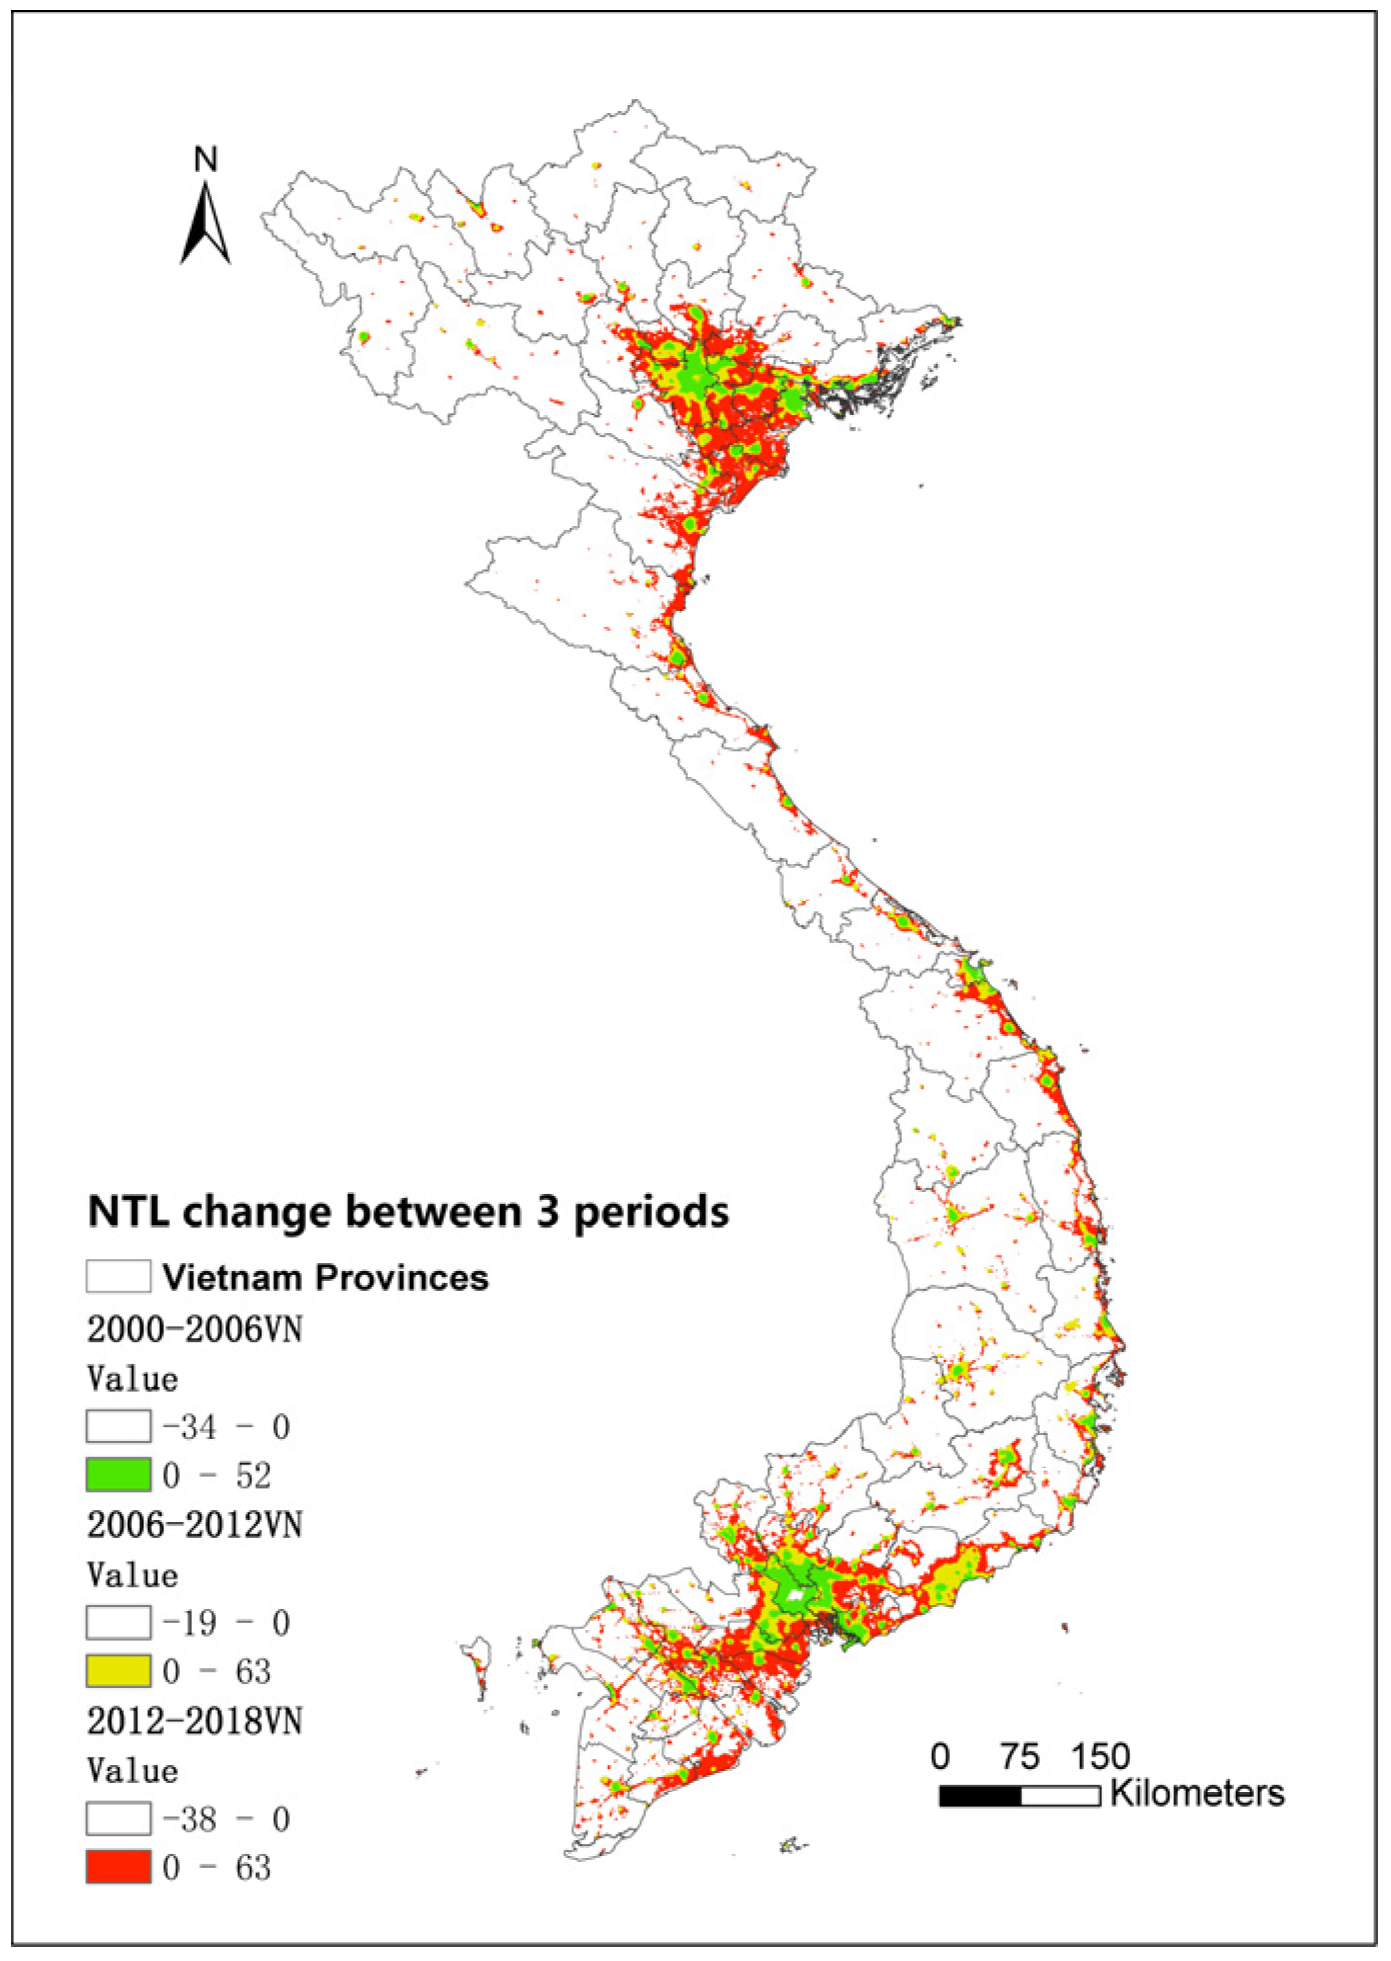
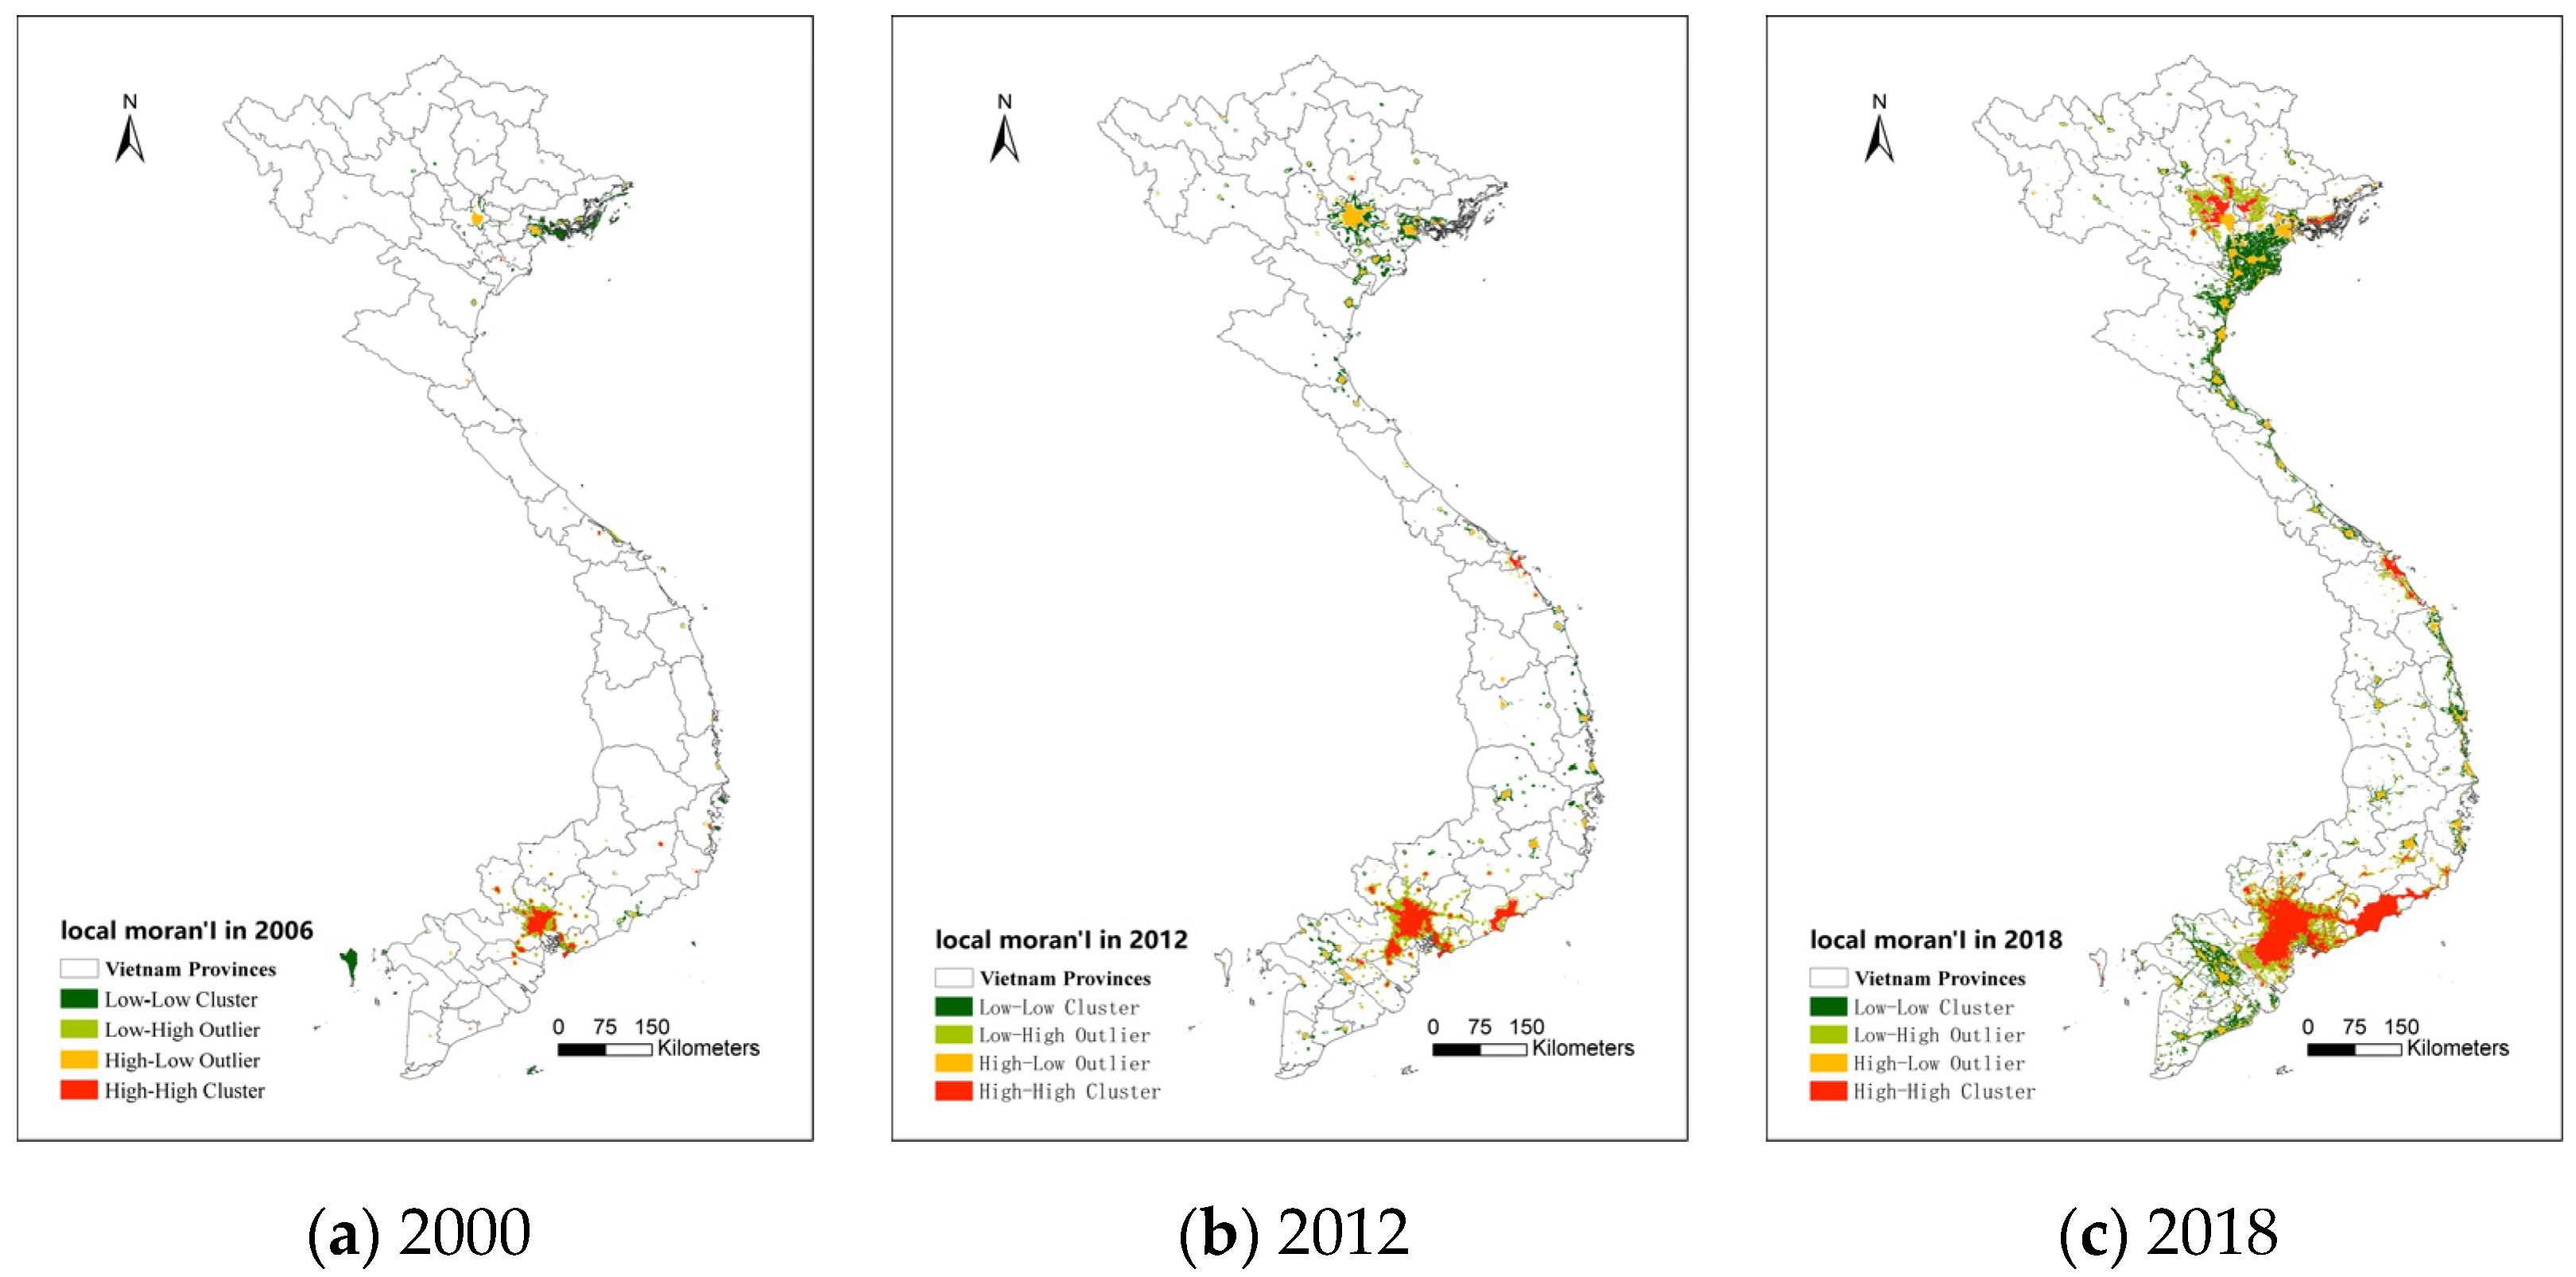
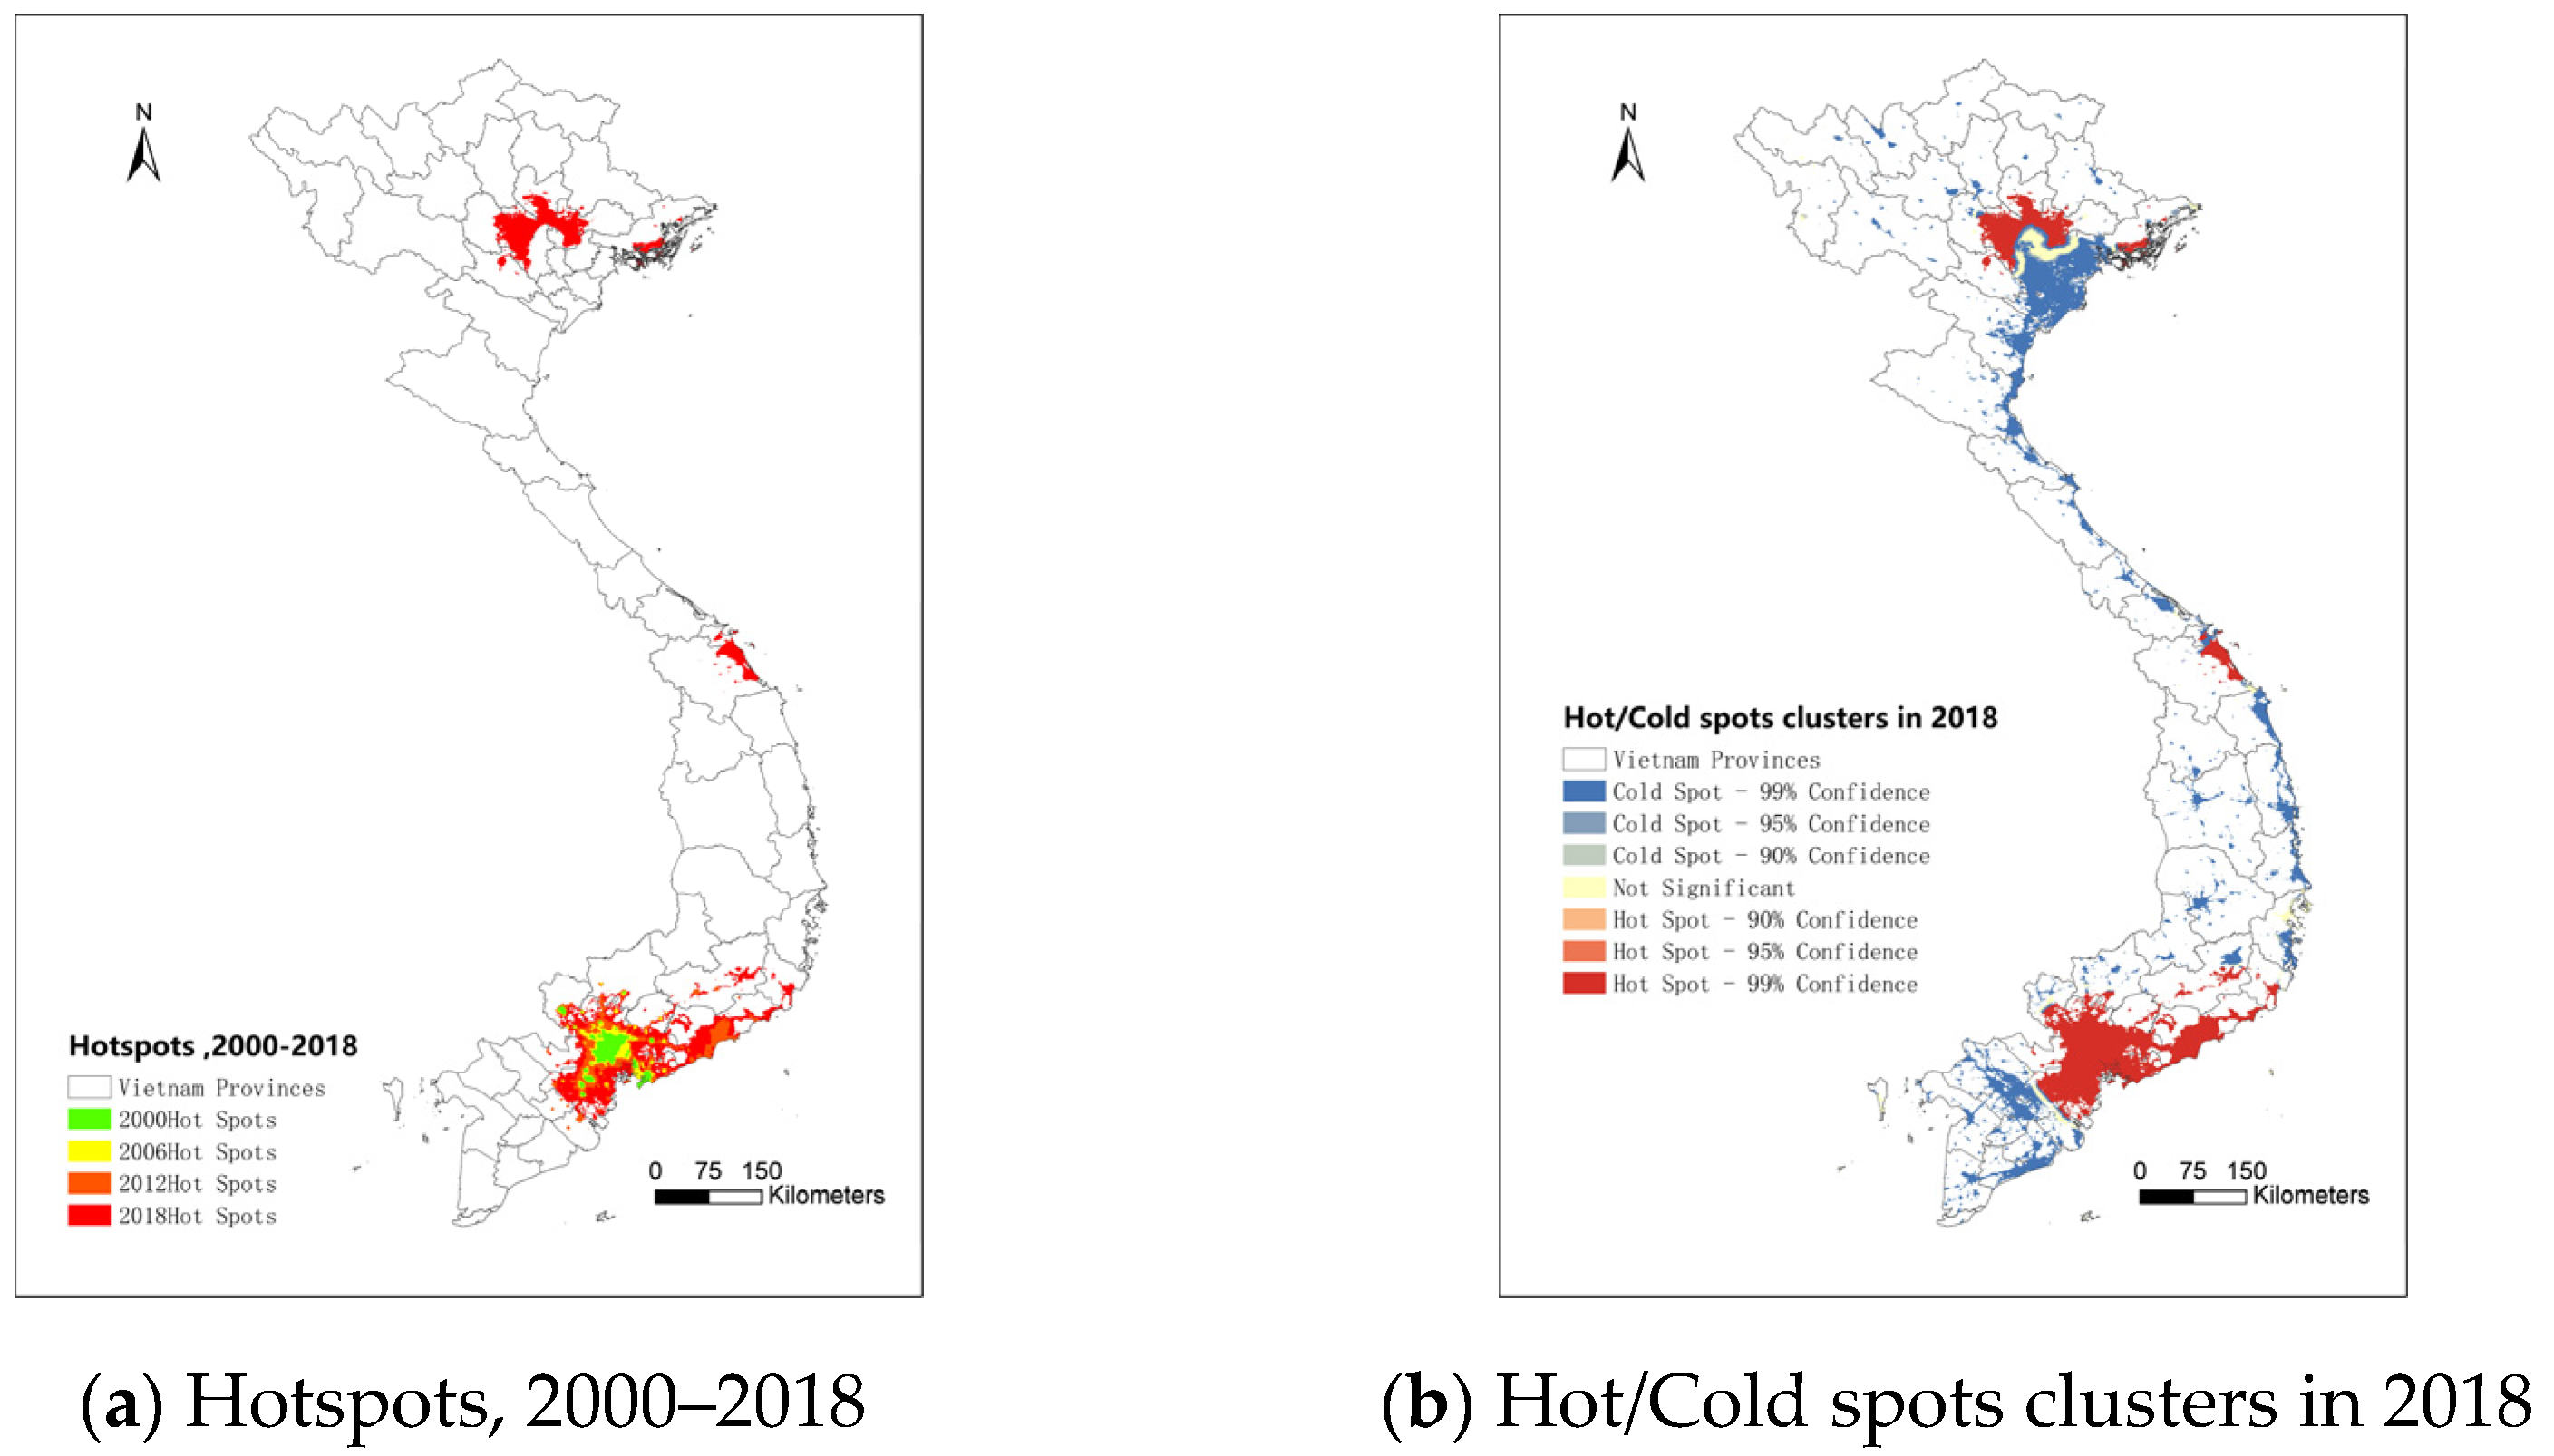
3.1. Spatial Pattern Analysis of Urban Expansion in Vietnam

This paper takes NTL as a proxy of urban economic activity (i.e., GDP), and analyzes the changes in spatial pattern during urban expansion in Vietnam from 2000 to 2018. As shown in Figure 3, Vietnam’s urban NTL is concentrated in the northern Red River Delta, the southern Mekong River Delta, and the eastern coastal areas, with Hanoi and Ho Chi Minh City having the highest NTL values and other important cities being Hai Phong, Binh Thuan, and Da Nang. From the trend of increasing DN values, we can conclude a continuous urban expansion. There are signs of recession in 2008–2009, rapid rebound growth after 2010, and a high growth rate until 2018.
The dynamic changes in the urban spatial pattern in Vietnam can be divided into three periods. From 2000 to 2006, the economically developed cities in Vietnam, such as Hanoi, along with the urban area were still at the stage of slow expansion. From 2006 to 2012, while the original economically developed cities continued to expand, there were also rapidly expanding cities in other regions, such as the Binh Thuan area in the south, and there was also significant urban lighting growth in Vietnam’s northern border areas and eastern coastal areas compared with the first stage. From 2012 to 2018, the expansion of urban areas in the eastern coastal areas and the northern Red River Delta region accelerated, and the Red River Delta region exhibited the characteristics of significant urban regional sprawl.

3.2. Spatial and Temporal Growth of NTL in Vietnam

Figure 4 provides the NTL difference between 2000 and 2018, where the absolute difference in the respective DN values for 2000 and 2018 is calculated at the same pixel positions. The most aggressive NTL growth is in the north–south delta region of Vietnam. During these 18 years, except for the decline in NTLs in the downtown areas of the earlier-developed cities, such as Ho Chi Minh city and Hanoi city, almost all the major cities in the country experienced positive NTL growth, and the growth was concentrated in the surrounding areas of major cities as well as areas along highways and other transportation arteries. By comparing the difference in the respective DN values for 2000 and 2018, it can be found that the cities with the highest NTL growth in Vietnam are Binh Thuan, Dong Nai, Hanoi, Longan, Tien Giang, and Thanh Hoa in Binh Duong, followed by Ho Chi Minh, Quang Ninh, and Quang Nam. In order to determine whether there will be similar NTL growth in closer cities, the global Moran’s I was calculated, and the results (I = 0.143243, z-score = 3.836784, p-value = 0.000125) indicated that the growth in urban NTL in Vietnam is spatially clustered.
In order to analyze whether the similar NTLs are clustered in space, we calculated the local Moran’s I, which can identify any hot spots, cold spots, and spatial anomalies with statistical significance. The detailed results are shown in Figure 4a–c. Generally, NTL hot spots exist in similar places where high NTL values gather. The hot spots (HH cluster) in 2000 mainly appeared in the areas surrounding Ho Chi Minh City in the south, but there were almost no hot spots in other areas. Compared with 2000, the hot spots in the southern area showed a significant expansion outward from the center of Ho Chi Minh City in 2012, while in the northern region, HL clusters with Hanoi and Haiphong City as the center expanded outwards, but HH clusters had not yet appeared. In 2018, the scope of HH and HL clusters of Vietnam urban NTL had significantly expanded. The transformation of the surrounding area from the original HL cluster into the HH cluster indicates the expansion of cities and the concentration of high-value urban NTL during 2012–2018 accelerated significantly, with Hanoi and its surrounding areas having the most significant changes. In addition, there were many LL clusters around the big cities in the northern Red River Delta, that were probably due to the NTL growth in the suburbs caused by the acceleration of industrialization in the areas surrounding big cities.
The GetisOrd G algorithm was used to analyze the hot/cold spots of urban NTL in Vietnam [37]. Figure 5a shows NTL hotspots in urban areas (at 90% confidence level) composed of annual hotspots during 2000–2018. Most of the hotspots started to appear after 2012. Figure 5b shows the cold/hot spot clustering characteristics of Vietnam in 2018. During 2000–2006, hotspots were mainly concentrated in Ho Chi Minh City and its surrounding areas in the south; during 2006–2012, Binh Shun province in the southern delta area became an emerging hotspot area; from 2012 to 2018, urban hotspot areas throughout the country began to grow significantly, and hotspots gathered and showed rapid growth trends in Hanoi City, its surrounding areas in the north, Quang Ninh province, and the coastal areas of Da Nang City. This shows that the urbanization hot spots in Vietnam were concentrated in southern Ho Chi Minh City in the early stages. After 2012, the urbanization processes of the Red River Delta in the north and Da Nang in the middle of the country gradually accelerated and the areas grew into large urbanization hot spots.
The geometric gravity center of the urban built-up area in stages from 2000 to 2018 was calculated based on the vector boundary map of the built area using the geometric calculation function of ArcGIS software. The analysis results show that Vietnam’s urban center of gravity had a clear northward shift. The period from 2012 to 2018 saw the most significant northward shift of the gravity center, which may explain the significantly accelerated urbanization process in northern Vietnam at this stage. The conclusion is consistent with previous research results.

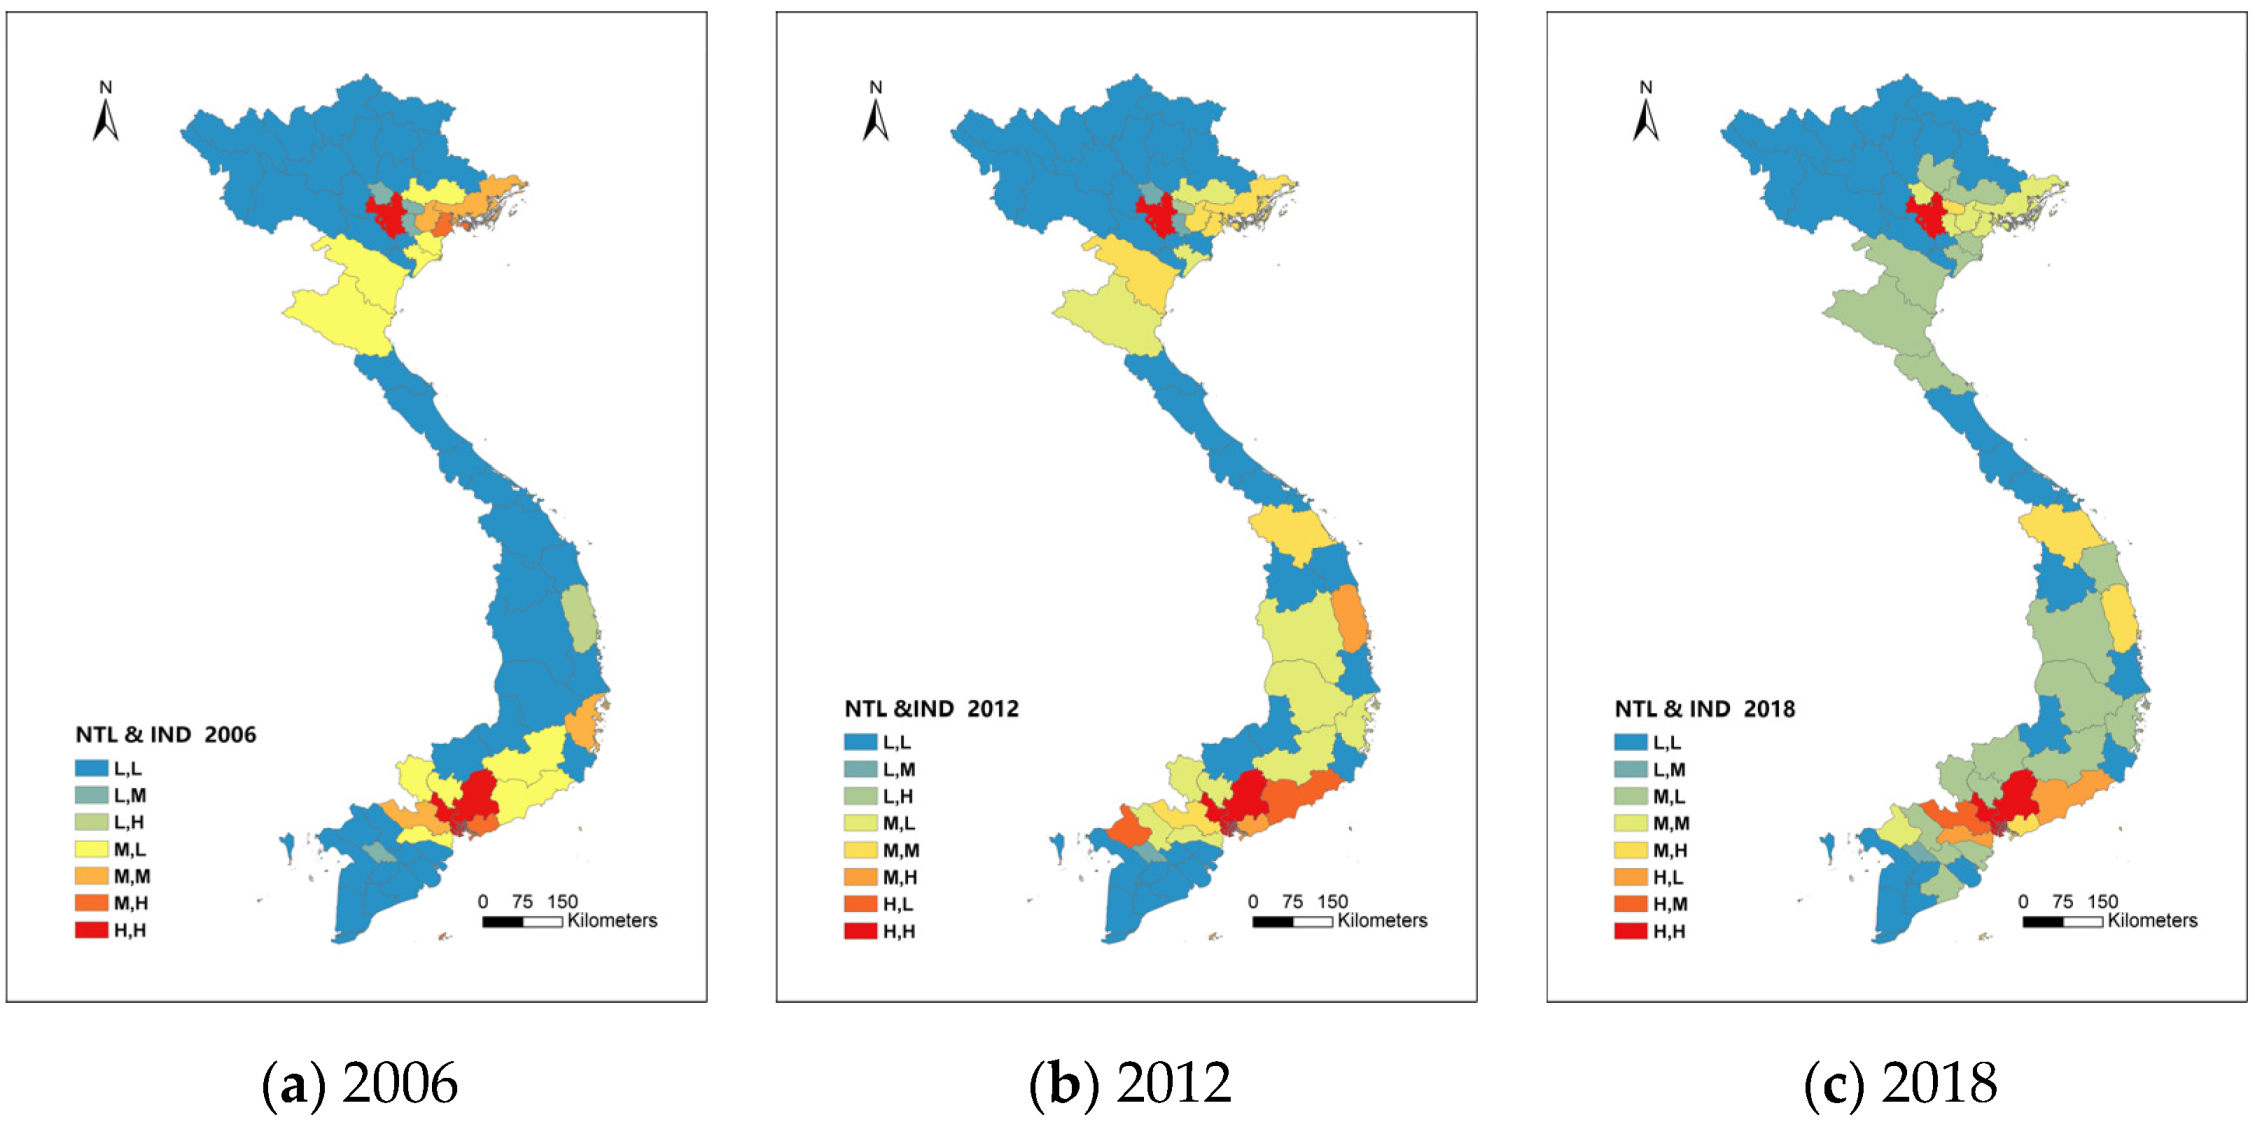
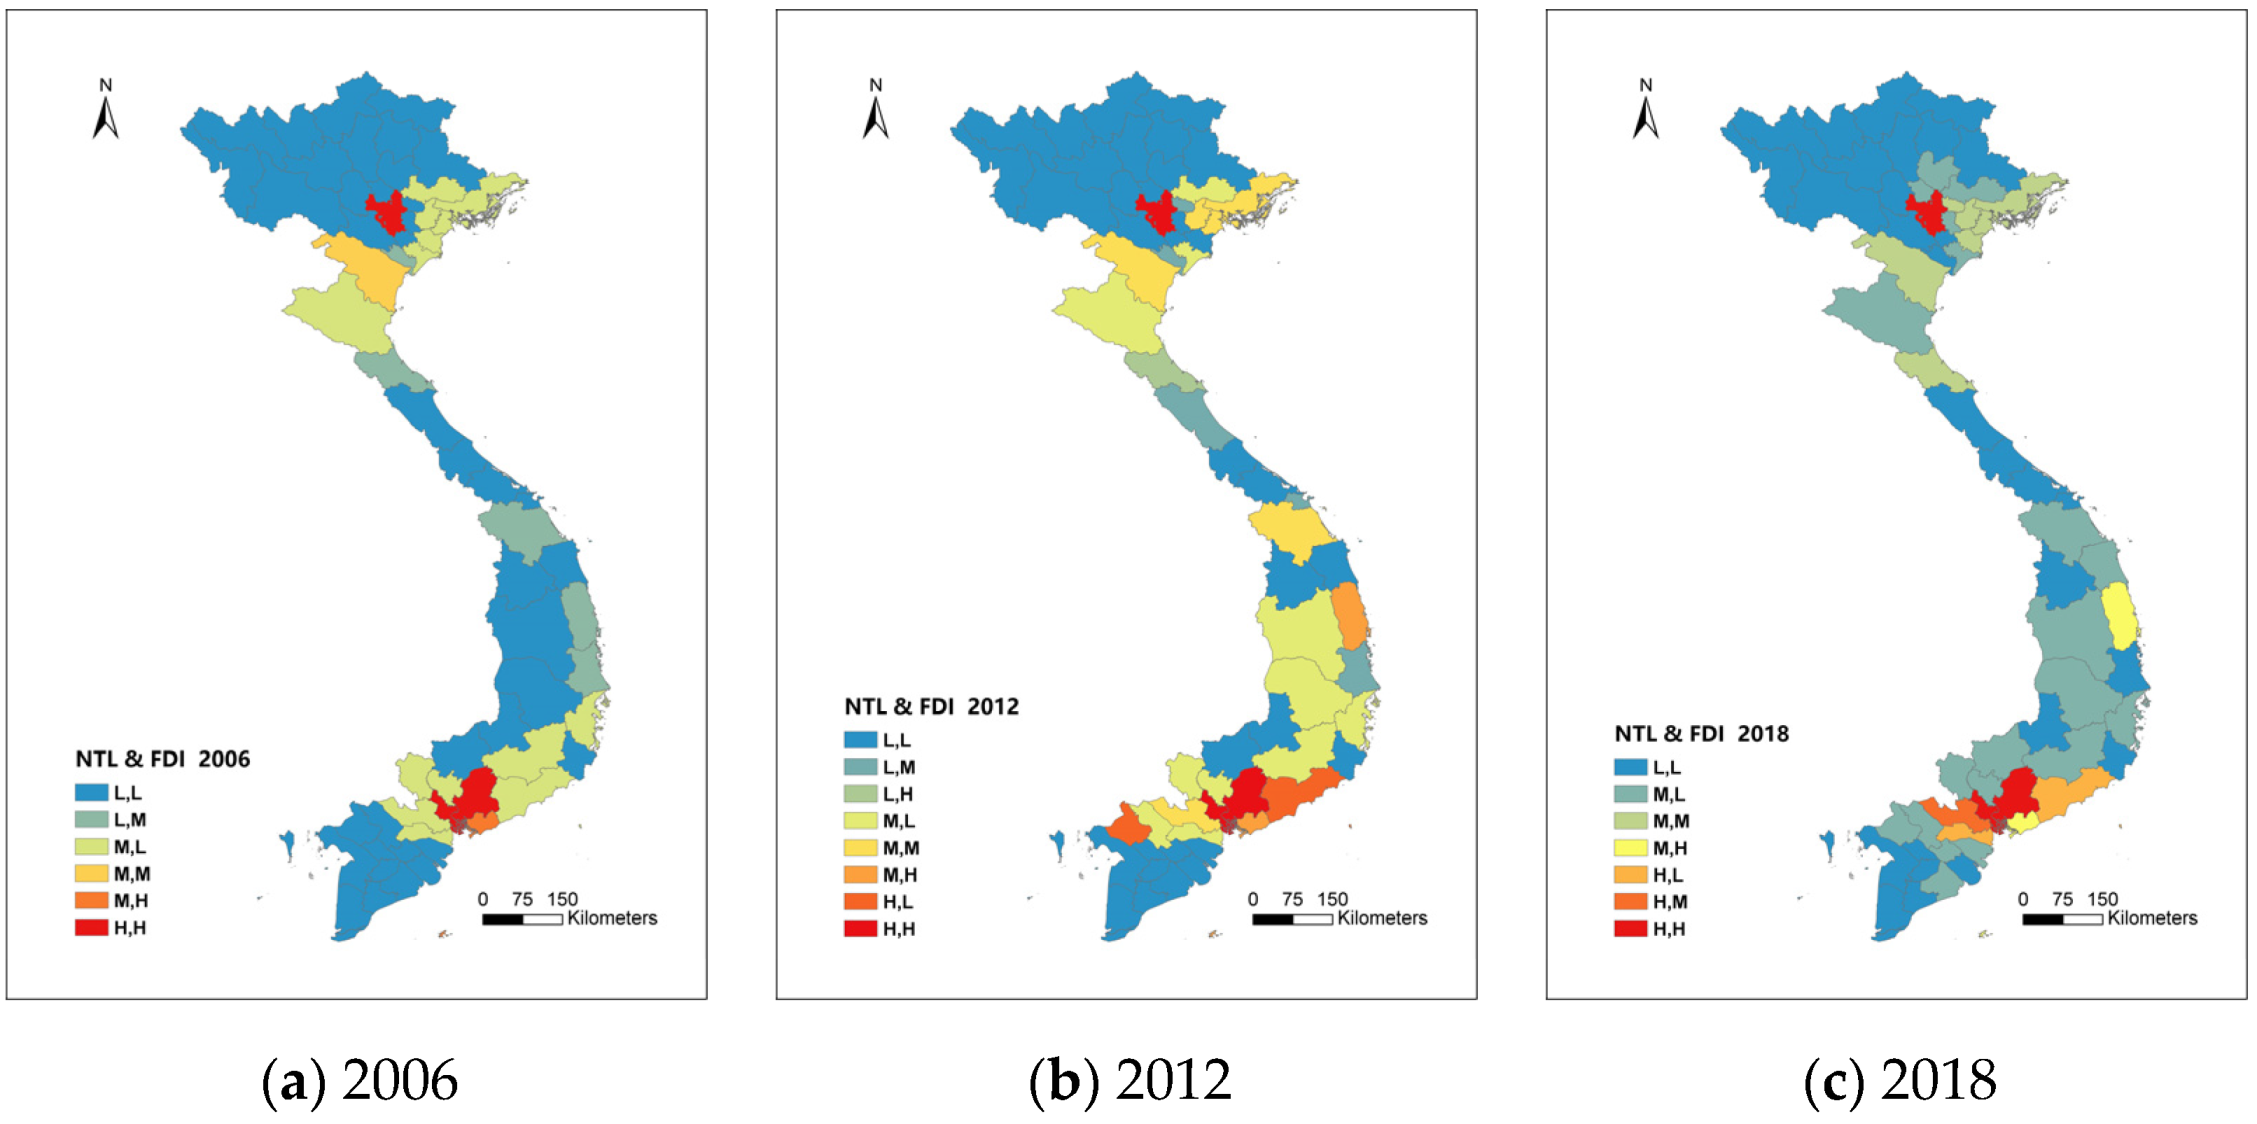
3.3. Coupling Relationships between Urbanization, Industrialization, and Globalization in Vietnam

Through the collection and collation of population–economic statistical data of provincial administrative regionalization in Vietnam in 2006, 2012, and 2018, the city NTL value (NTL) was used to represent the urbanization level, the industrial production value (IND) represented the industrialization level, and the foreign direct investment value (FDI)) stood for globalization level. After completing the normalization of data, the natural breakpoint method was used to divide the “low, medium, and high” types of standards (Table 1), and a “coupling” method was introduced to analyze the relationship between the three categories. Different coupling classifications can be used to analyze the differences in urbanization affected by industrialization and globalization in different provinces of Vietnam. For example, the high–high (HH) coupling between urbanization and industrialization indicates that the level of urbanization and industrialization of this city are at the forefront of Vietnam. The relationships above medium coupling can be regarded as coupling relationships with significant mutual influence, such as MM, MH, HM, and HH coupling relationships.
As shown in Figure 6, Vietnam’s industrialization process and its impact on urbanization are significant. From 2006 to 2018, Hanoi City in the north and Ho Chi Minh City and Dong Nai province in the south were consistently in a high urbanization–high industrialization coupling relationship, which shows that these three provinces and cities maintained high urbanization and high industrialization. In 2018, Bec Ninh province in the north and the central Quang Nam and Binh Dinh provinces moved from a low-coupling relationship to a medium urbanization–high industrialization coupling relationship, while the Hoang An and Vinh Phuc provinces in the north moved from a low-coupling relationship in 2006 to a medium urbanization–medium industrialization coupling relationship. This shows that in the past years, Vietnam’s industrialization process has had the most significant effect on the urbanization level of these provinces.
As shown in Figure 7, there were significant differences in spatial pattern and substantial dynamic changes among Vietnamese provinces affected by globalization (foreign direct investment). As with their urbanization–industrialization relationship, Hanoi and Ho Chi Minh City remained in a consistent state of high–high coupling. Compared with the situation in 2006, when the provinces significantly affected by globalization were only concentrated in Hanoi and Ho Chi Minh City, the number of provinces significantly affected by globalization had increased in 2018 as Vietnam accelerated its efforts to attract foreign investment. In particular, most provinces in the northern Red River Delta region had moved into a coupling state of medium urbanization–medium globalization in 2018. This indicates that globalization played a significant role in the urbanization of the northern delta region. On the other hand, Binh Dinh province and Ba Ria Vung Tau province attained the coupling state of medium urbanization—high globalization due to the increase in foreign investment.
As a developing country in rapid development, Vietnam’s urbanization process will continue to maintain a close relationship with the processes of industrialization and globalization. In order to discover the driving factors of urbanization in Vietnam, this study combined the data from 2008, 2012 and 2018 and used the following characteristics as independent variables (x1–x5): whether a city was an urbanization hot spot, whether it was a coastal city, its population, its industrial product, and its total FDI. The NTL value was used as the dependent variable (y) and multiple linear regression analysis was performed to determine the main driving factors. Since the dimensions of the independent variables were not uniform, the logarithm for regression analysis was employed. According to Table 2, it can be concluded that the impact of population and industrial product on urbanization is significantly positive, indicating that industrialization has had a significant positive impact on urbanization in Vietnam, significantly driving the growth of urban NTL. Although the impact of globalization (foreign investment) is positive, it has not had a significant positive impact in the statistical sense. It may take some time for the impact of foreign investment on Vietnam’s urbanization to show a strong effect.

4. Conclusions and Discussion

Considering the lack of socioeconomic data at the city level in developing countries such as Vietnam, this paper introduces the method of using DMSP-OLS and NPP/VIIRS night lighting data as a proxy to analyze the characteristics of urban spatial patterns in Vietnam from 2000 to 2018. The results show that: (1) The main urban expansion in Vietnam were concentrated in the southern Mekong Delta and the northern Red River Delta, represented by Ho Chi Minh City and Hanoi City, respectively. (2) Vietnam’s urban NTL had significant high–high clustering characteristics in the north–south delta regions. The main urban expansion hotspots were concentrated around Ho Chi Minh City before 2012, and the northern region represented by Hanoi City gradually transformed into an important area, gathering urban expansion hotspots after 2012. (3) The areas with great influence and high degrees of relationship between industrialization and globalization and urbanization were concentrated in Ho Chi Minh City, Hanoi and some provinces in the northern delta, which shows that the impact of industrialization and globalization on urbanization in Vietnam is still limited in some regions. In addition, the results show that size of population and level of industrialization are the main drivers of urban expansion in Vietnam, while the level of foreign investment shows little significance.
There are three significant points for discussion in this paper. Firstly, determining the DN value is crucial to identifying the urban area. This paper takes DN > 13 to represent an urban area, as this value is supported by most studies [30,31] as the threshold for determining urban areas in Vietnam, with any pixel value greater than or equal to 13 regarded as urban light. The results of this study validates this method of determination. It is suggested that this DN value should be applied to other Southeast-Asian countries. Secondly, this study proves the feasibility of using NTL data to represent urban expansion and urban economic growth. Hence, this method could be applied to other areas to analyze the relationships between the processes involved urban expansion. Finally, the disadvantage of this paper is that the number of key variables that can be selected in the analysis process was limited, as they could only include the hotspot status, the population at the provincial level, proximity to the coast, industrial product, FDI amount.
We made some interesting findings and implications. Firstly, Vietnam’s urbanization hotspots are characterized by their concentration in the northern and southern regions, with the northern region represented by Hanoi realizing a more rapid urban regional expansion after 2012. Secondly, analyzing the impacts of industrialization and globalization on urbanization from the provincial administrative division level in Vietnam from 2006 to 2018, Hanoi and Ho Chi Minh City have consistently showed coupling relationships of high industrialization–high globalization–high urbanization. Thirdly, in the analysis of the driving factors of urbanization in Vietnam, this paper attempts to understand the influence of foreign investment and industrialization on the development of urbanization. In conclusion, this study will help us to understand urban expansion in rapidly developing areas under the influence of globalization, industrialization, and urbanization, and could form an objective scientific basis for Southeast-Asian government policies promoting sustainable development.

Author Contributions

Conceptualization Y.L. and K.Z.; methodology, K.Z.; software, K.Z.; validation, Z.Z., J.Z. and C.Z.; formal analysis, K.Z.; resources, K.Z.; data curation, K.Z.; writing—original draft preparation, K.Z.; writing—review and editing, K.Z., Z.Z. and Y.L.; visualization, K.Z.; funding acquisition, Y.L. All authors have read and agreed to the published version of the manuscript.

Funding

This research was funded by National Natural Science Foundation of China (No. 41871114); European Research Council (ERC) under the European Union’s Horizon 2020 research and innovation programme (grant agreement No. 949670).

Institutional Review Board Statement

Not applicable.

Informed Consent Statement

Not applicable.

Data Availability Statement

The datasets used and/or analyzed during the current study are available from the corresponding author on reasonable request.

Conflicts of Interest

The authors declare no conflict of interest.

References

  1. Fan, P.; Ouyang, Z.; Nguyen, D.D.; Nguyen, T.T.H.; Park, H.; Chen, J. Urbanization, economic development, environmental and social changes in transitional economies: Vietnam after Doimoi. Landsc. Urban Plan. 2018, 187, 145–155. [Google Scholar] [CrossRef]
  2. Vien, H.C.; Hieu, N.N. Urbanization and Challenges to Sustainable Urban Land Development in the Ho Chi Minh city megapologis. In Proceedings of the the 14th Asian Urbanization Conference, Bangkok, Thailand, 20–21 August 2018; p. 25. [Google Scholar]
  3. Goldblatt, R.; Deininger, K.; Hanson, G. Utilizing publicly available satellite data for urban research: Mapping built-up land cover and land use in Ho Chi Minh City, Vietnam. Dev. Eng. 2018, 3, 83–99. [Google Scholar] [CrossRef]
  4. Al Rifat, S.A.; Liu, W. Quantifying Spatiotemporal Patterns and Major Explanatory Factors of Urban Expansion in Miami Metropolitan Area during 1992–2016. Remote Sens. 2019, 11, 2493. [Google Scholar] [CrossRef] [Green Version]
  5. Chen, J.; Chang, K.-T.; Karacsonyi, D.; Zhang, X. Comparing urban land expansion and its driving factors in Shenzhen and Dongguan, China. Habitat Int. 2014, 43, 61–71. [Google Scholar] [CrossRef]
  6. Li, X.; Zhou, W.; Ouyang, Z. Forty years of urban expansion in Beijing: What is the relative importance of physical, socioeconomic, and neighborhood factors? Appl. Geogr. 2013, 38, 1–10. [Google Scholar] [CrossRef]
  7. Wen, Q.; Zhang, Z.; Shi, L.; Zhao, X.; Liu, F.; Xu, J.; Yi, L.; Liu, B.; Wang, X.; Zuo, L.; et al. Extraction of basic trends of urban expansion in China over past 40 years from satellite images. Chin. Geogr. Sci. 2016, 26, 129–142. [Google Scholar] [CrossRef] [Green Version]
  8. Zhang, Q.; Seto, K.C. Mapping urbanization dynamics at regional and global scales using multi-temporal DMSP/OLS nighttime light data. Remote Sens. Environ. 2011, 115, 2320–2329. [Google Scholar] [CrossRef]
  9. Liu, Z.; He, C.; Zhang, Q.; Huang, Q.; Yang, Y. Extracting the dynamics of urban expansion in China using DMSP-OLS nighttime light data from 1992 to 2008. Landsc. Urban Plan. 2012, 106, 62–72. [Google Scholar] [CrossRef]
  10. Pandey, B.; Joshi, P.; Seto, K.C. Monitoring urbanization dynamics in India using DMSP/OLS night time lights and SPOT-VGT data. Int. J. Appl. Earth Obs. Geoinf. 2013, 23, 49–61. [Google Scholar] [CrossRef]
  11. Elvidge, C.D.; Baugh, K.E.; Kihn, E.A.; Kroehl, H.W.; Davi, E.R. Mapping city lights with nighttime data from the DMSP Operational Linescan System. Photogramm. Eng. Remote Sens. 1997, 63, 727–734. [Google Scholar]
  12. Yu, B.; Shu, S.; Liu, H.; Song, W.; Wu, J.; Wang, L.; Chen, Z. Object-based spatial cluster analysis of urban landscape pattern using nighttime light satellite images: A case study of China. Int. J. Geogr. Inf. Sci. 2014, 28, 2328–2355. [Google Scholar] [CrossRef]
  13. Croft, T.A. Nighttime Images of the Earth from Space. Sci. Am. 1978, 239, 86–98. [Google Scholar] [CrossRef]
  14. Wu, J.; Ma, L.; Li, W.; Peng, J.; Liu, H. Dynamics of Urban Density in China: Estimations Based on DMSP/OLS Nighttime Light Data. IEEE J. Sel. Top. Appl. Earth Obs. Remote Sens. 2014, 7, 4266–4275. [Google Scholar] [CrossRef]
  15. Zhou, Y.; Smith, S.J.; Zhao, K.; Imhoff, M.L.; Thomson, A.M.; Bond-Lamberty, B.; Asrar, G.R.; Zhang, X.; He, C.; Elvidge, C.D. A global map of urban extent from nightlights. Environ. Res. Lett. 2015, 10, 0554011. [Google Scholar] [CrossRef]
  16. Zhou, Y.; Smith, S.; Elvidge, C.D.; Zhao, K.; Thomson, A.; Imhoff, M. A cluster-based method to map urban area from DMSP/OLS nightlights. Remote Sens. Environ. 2014, 147, 173–185. [Google Scholar] [CrossRef]
  17. Elvidge, C.D.; Baugh, K.E.; Kihn, E.A.; Kroehl, H.W.; Davis, E.R.; Davis, C.W. Relation between satellite observed visible-near infrared emissions, population, economic activity and electric power consumption. Int. J. Remote Sens. 1997, 18, 1373–1379. [Google Scholar] [CrossRef]
  18. Elvidge, C.D.; Zhizhin, M.; Baugh, K.; Hsu, F.-C.; Ghosh, T. Methods for Global Survey of Natural Gas Flaring from Visible Infrared Imaging Radiometer Suite Data. Energies 2015, 9, 14. [Google Scholar] [CrossRef]
  19. Sutton, P.C.; Costanza, R. Global estimates of market and non-market values derived from nighttime satellite imagery, land cover, and ecosystem service valuation. Ecol. Econ. 2002, 41, 509–527. [Google Scholar] [CrossRef]
  20. Doll, C.N.; Muller, J.-P.; Morley, J.G. Mapping regional economic activity from night-time light satellite imagery. Ecol. Econ. 2006, 57, 75–92. [Google Scholar] [CrossRef]
  21. Liang, Y.; Zhou, K.; Li, X.; Zhou, Z.; Sun, W.; Zeng, J. Effectiveness of high-speed railway on regional economic growth for less developed areas. J. Transp. Geogr. 2019, 82, 102621. [Google Scholar] [CrossRef]
  22. Jiang, W.; He, G.; Long, T.; Wang, C.; Ni, Y.; Ma, R. Assessing Light Pollution in China Based on Nighttime Light Imagery. Remote Sens. 2017, 9, 135. [Google Scholar] [CrossRef] [Green Version]
  23. Corbane, C.; Kemper, T.; Freire, S.; Louvrier, C.; Pesaresi, M. Monitoring the Syrian Humanitarian Crisis with the JRC’s Global Human Settlement Layer and Night-Time Satellite Data; Publications Office of the European Union: Luxembourg, 2016; pp. 1–14. [Google Scholar]
  24. Li, X.; Zhang, R.; Huang, C.; Li, D. Detecting 2014 Northern Iraq Insurgency using night-time light imagery. Int. J. Remote Sens. 2015, 36, 3446–3458. [Google Scholar] [CrossRef]
  25. Sutton, P.C.; Elvidge, C.D.; Ghosh, T. Estimation of gross domestic product at sub-national scales using nighttime satellite imagery. Int. J. Ecol. Econ. Stat. 2007, 8, 5–21. [Google Scholar]
  26. Henderson, J.; Storeygard, V.A.; Weil, D.N. Measuring Economic Growth from Outer Space. Am. Econ. Rev. 2012, 102, 994–1028. [Google Scholar] [CrossRef] [PubMed] [Green Version]
  27. Storeygard, A. Farther on down the Road: Transport Costs, Trade and Urban Growth in Sub-Saharan Africa. Rev. Econ. Stud. 2016, 83, 1263–1295. [Google Scholar] [CrossRef] [PubMed] [Green Version]
  28. Zhou, N.; Hubacek, K.; Roberts, M. Analysis of spatial patterns of urban growth across South Asia using DMSP-OLS nighttime lights data. Appl. Geogr. 2015, 63, 292–303. [Google Scholar] [CrossRef]
  29. Wicht, M.; Kuffer, M. The continuous built-up area extracted from ISS night-time lights to compare the amount of urban green areas across European cities. Eur. J. Remote Sens. 2019, 52 (Suppl. 2), 58–73. [Google Scholar] [CrossRef]
  30. Shao, X.; Cao, C.; Zhang, B.; Qiu, S.; Elvidge, C.; Von Hendy, M. Radiometric calibration of DMSP-OLS sensor using VIIRS day/night band. Int. Soc. Opt. Photonics 2014, 9264, 92640A. [Google Scholar]
  31. Li, X.; Li, D.; Xu, H.; Wu, C. Intercalibration between DMSP/OLS and VIIRS night-time light images to evaluate city light dynamics of Syria’s major human settlement during Syrian Civil War. Int. J. Remote Sens. 2017, 38, 5934–5951. [Google Scholar] [CrossRef]
  32. Román, M.O.; Wang, Z.; Sun, Q.; Kalb, V.; Miller, S.D.; Molthan, A.; Schultz, L.; Bell, J.; Stokes, E.C.; Pandey, B.; et al. NASA’s Black Marble nighttime lights product suite. Remote Sens. Environ. 2018, 210, 113–143. [Google Scholar] [CrossRef]
  33. Yu, B.; Tang, M.; Wu, Q.; Yang, C.; Deng, S.; Shi, K.; Peng, C.; Wu, J.; Chen, Z. Urban built-up area extraction from log-transformed NPP-VIIRS nighttime light composite data. IEEE Geosci. Remote Sens. Lett. 2018, 15, 1279–1283. [Google Scholar] [CrossRef]
  34. Zhao, M.; Zhou, Y.Y.; Li, X.C.; Zhou, C.; Cheng, W.; Li, M.; Huang, K. Building a series of consistent night-time light data (1992–2018) in Southeast Asia by integrating DMSP-OLS and NPP-VIIRS. IEEE Trans. Geosci. Remote Sens. 2020, 58, 1843–1856. [Google Scholar] [CrossRef]
  35. Shi, K.; Yu, B.; Huang, Y.; Hu, Y.; Yin, B.; Chen, Z.; Wu, J. Evaluating the ability of NPP-VIIRS nighttime light data to estimate the gross domestic product and the electric power consumption of China at multiple scales: A comparison with DMSP-OLS data. Remote Sens. 2014, 6, 1705–1724. [Google Scholar] [CrossRef] [Green Version]
  36. Small, C.; Elvidge, C.D.; Balk, D.; Montgomery, M. Spatial scaling of stable night lights. Remote Sens. Environ. 2011, 115, 269–280. [Google Scholar] [CrossRef]
  37. Wang, L.W.; Feng, C.C. Spatial expansion pattern and its driving dynamics of BeijingTianjin-Hebei metropolitan region: Based on lighttime light data. Acta Geogr. Sin. 2016, 71, 2155–2169. [Google Scholar]
Figure 1. The location of Vietnam.
Land 11 00601 g001
Figure 2. Image of night lights in Vietnam from 2000 to 2018.
Land 11 00601 g002
Figure 3. NTL value changes in three periods in Vietnam from 2000 to 2018.
Land 11 00601 g003
Figure 4. Features of NTL spatial agglomeration.
Land 11 00601 g004
Figure 5. Hotspot clustering and coldspot/hotspot clustering characteristics from 2000 to 2018.
Land 11 00601 g005
Figure 6. Changes in coupling relationship between NTL-IND from 2006 to 2018.
Land 11 00601 g006
Figure 7. Changes in the coupling relationship between NTL-FDI from 2006 to 2018.
Land 11 00601 g007
Table 1. Classification criteria of urbanization, industrialization, and globalization after normalization (based on the natural breakpoint method).
NTL ValueIND ValueFDI Value
LowMediumHighLowMediumHighLowMediumHigh
20060.1869760.47538410.0531910.14434010.1590590.4982851
20120.2130610.59917910.0624610.20477310.0826180.2849801
20180.1504040.40366210.0696510.26969110.1378490.3910071
Table 2. Analysis of driving factors of urbanization in Vietnam.
CoefficientsStandard Errort Statp-Value
Intercept−247,61135,331.7−7.008184.54 × 10−11
Whether it is an urbanization hot spot city10,206.023103.763.2882760.00121
Whether it is a coastal city−291.2482790.391−0.104380.916987
Population16,627.092850.2025.8336522.43 × 10−8
Industrial product3209.9221413.7872.2704430.024353
FDI amount173.17931081.590.1601150.872968
Publisher’s Note: MDPI stays neutral with regard to jurisdictional claims in published maps and institutional affiliations.

