Article

Spatio-Temporal Evolution of Urban Innovation Networks: A Case Study of the Urban Agglomeration in the Middle Reaches of the Yangtze River, China

1
School of Geography and Environment, Jiangxi Normal University, Nanchang 330022, China
2
School of Information Engineering, Jiangxi University of Technology, Nanchang 330098, China
3
Key Laboratory of Poyang Lake Wetland and Watershed Research, Ministry of Education, Jiangxi Normal University, Nanchang 330022, China
*
Author to whom correspondence should be addressed.
These authors contributed equally to this work.
Land 2022, 11(5), 597; https://doi.org/10.3390/land11050597
Submission received: 5 April 2022 / Revised: 14 April 2022 / Accepted: 16 April 2022 / Published: 19 April 2022

Abstract

:
Understanding the evolutionary characteristics of innovation network structure can improve urban innovation and regional construction. Urban innovative development is affected by various factors, which can be analyzed via models of innovation networks. We establish a multi-criteria evaluation system of innovation capability and use an improved gravity model to construct an innovation network for 2015–2018, employing social network methods to analyze structural characteristics and spatial patterns. Results show that: (1) The innovation of cities in the urban agglomeration in the middle reaches of the Yangtze River has gradually increased, with an accompanying increase in the complexity of innovation networks. The cities of Wuhan, Changsha, and Nanchang are located at the absolute core of this network, which exhibits a Matthew effect, and has a triangle integration mode of growth. (2) The attraction of innovative resources and the promotion of individual innovation are increasing every year within the cities. The aggregation pattern of innovation shows a multi-core state in the urban agglomeration in the middle reaches of the Yangtze River, but the innovation radiation pattern has changed from a single center to a double center. (3) Multiple spatial innovation axes are seen in the network, with a location and direction consistent with the urban agglomeration’s development axis in the Yangtze River’s middle reaches and a triangle integration growth mode. Policy implications are proposed for regional innovation and development, and our results can provide future policy guidance and direction for governmental entities and other stakeholders.

1. Introduction

Innovation is a necessity for city competition in a fast-changing world and is a driving force for city development [1,2]. Cities that possess world-class innovation can attract global talents and allow strategic initiatives for international competition [3]. The current driving force of urban development in China has shifted from factor-driven to innovation-driven [4].
Spatial dependence or autocorrelation is a common feature of spatial data [5]. Innovation also has spatial correlation because of its spatial diffusion and knowledge spillover characteristics [6]. Freeman [7] put forward the concept of an innovation network and defined innovation networks as a new form of cooperation formed by innovation subjects to adapt to systematic innovation. The construction of innovation connection networks can help the flow and integration of innovation resources among network nodes to promote the development of regional innovation [8]. The social network method was first applied to innovation system research in 1996 [9]. Since then, research on the structural characteristics of innovative networks based on social network analysis has been extensive.
Innovation networks are mainly considered from two perspectives. In the first approach, the construction of innovation networks is based on data generated by cooperative innovation [10,11,12,13,14,15]. For example, Li et al. analyzed published papers and applied patents to construct an innovation network in China [13]. Yu et al. considered corporations and used the data of collaborative patents to reveal the temporal and spatial evolution of the Zhongguancun IUR cooperative innovation network [14]. Kong et al. used 53 high-end equipment manufacturing enterprises in Shanghai to explore knowledge cooperation’s influence on enterprise innovation performance in innovation networks [15]. However, A few factors cannot fully reflect the innovation link between cities, which is affected by multiple factors [16]. The second approach considers the role of multiple factors when constructing innovation networks [17,18,19,20]. For example, Zhu et al. constructed the index system from the foundation of innovation, innovation input, and innovation output. They used the gravity model method to measure the basic spatial pattern of innovation connections between the cities [19]. Sun considered the influence of innovation input, innovation output, and innovation environment when constructing an innovation network in the Yangtze River Delta region [20]. The formation of innovation networks is affected by multifaceted factors. However, a few studies consider the impact of economy, culture, education, and technology in the construction of an innovation network.
The gravity model has been widely used in urban studies, but some critiques remain due to the linear distance fuzziness [21]. In the traditional gravity model, the innovative connections between two regions increase with innovation capacity and decrease with distance [22]. Communication technology and transportation facilities have progressed greatly, narrowing the distances between cities in both space and time [23], and diversifying linkages. The constraint of geospatial space on innovation networks is obviously reduced with ongoing improvements to high-speed rail and other fast transportation networks [24]. Therefore, the traditional gravity model cannot accurately represent the actual innovative connection strength. In order to calculate the innovation connection strength between cities more reasonably, we apply three significant improvements to the gravity model.
The research perspectives of innovation networks are diversified. In the network structure analysis perspective, network density, centrality, openness, cohesion, average path, hub, and other characteristics of innovation connection networks and employed [25,26,27]. The spatial analysis perspective considers the characteristics and situation of cyberspace innovation at different regional levels [10,28,29] to explain its dynamic mechanisms of evolution [30]. However, there is a lack of analysis of the spatiotemporal characteristics of innovation networks.
The scope of innovation network research typically focuses on the country [31], urban belts [24], and urban agglomerations [32]. An urban agglomeration is a vital innovation space and carrier in the new knowledge economy. In China, most research on the innovation networks of urban agglomerations is mainly concentrated on the Yangtze River Delta, the Pearl River Delta, the Yangtze River economic belt, and the Beijing Tianjin Hebei Urban Agglomeration [33,34,35]. The urban agglomeration in the middle reaches of the Yangtze River is a core of new urbanization in China and a new growth center of the national economy. However, regional development strategies of gradual reform have marginalized and weakened regional economic ties. According to the Development Report on Changjiang Middle Reaches Megalopolis (2018) [36], the overall innovation level of urban agglomeration in the middle reaches of the Yangtze River lags behind eastern China. The optimization of its structure has a critical influence on the sustainable development of regional innovation [29]. Therefore, it is necessary to closely analyze the innovation networks of the urban agglomeration in the middle reaches of the Yangtze River.
We here construct an innovation network of the urban agglomeration in the middle reaches of the Yangtze River by calculating the urban innovation capability indicators using an integration of multiple indicators, and determining the innovation connection between cities by improving the gravity model. The innovation network is then centrally analyzed and divided into cohesive subgroups to discuss the characteristics and evolution of the innovation network and provide suggestions for the development of regional innovation in the middle reaches of the Yangtze River. Our objectives herein are:
(1)
Compare the innovation capability of various cities in the urban agglomeration in the middle reaches of the Yangtze River.
(2)
Evaluate the radiation ability, attraction ability, and intermediary role of urban innovation in the urban agglomeration in the middle reaches of the Yangtze River and analyze the small regional groups of innovation.
(3)
Identify the evolution of innovation patterns in the urban agglomeration in the middle reaches of the Yangtze River and put forward policy suggestions for cultivating innovation growth poles and expanding innovation axes.

2. Materials and Methods

2.1. Study Area

The urban agglomeration in the middle reaches of the Yangtze River (UAMRYR) is located in the center of China, within a latitude range of 26°07′–32°10′ N and a longitude range of 110°15′–118°29′ E (Figure 1). The UAMRYR is one of seven national-level urban agglomerations approved by the State Council, which has a vast economic reach and a solid foundation for exchanges. The UAMRYR is composed of the Wuhan Metropolitan Area (WMA), the Ring of Changsha-Zhuzhou-Xiangtan Urban Agglomeration (RCZXUA), and the Urban Agglomeration around Poyang Lake (UAAPL). In 2019, a research report on promoting innovation cooperation of urban agglomerations in the middle reaches of the Yangtze River detailed multiple issues impacting the development of innovation cooperation in the UAMRYR [37], such as insufficient coordination of innovation policies, low quality of innovation input and output, weak linkage of industrial innovation, and insufficient exchanges and cooperation among innovation subjects. In this context, studying the innovation network of the UAMRYR is necessary to provide new development insight for the innovative construction of this urban agglomeration.

2.2. Materials

We consider the years 2015–2018 as our study period, with relevant data were collected from the China Urban Statistical Yearbook (2015–2018), the Hubei statistical yearbook (2015–2018), the Hunan statistical yearbook (2015–2018), and the Jiangxi statistical yearbook (2015–2018) (https://data.cnki.net/yearbook, accessed on 1 April 2022). The map resources are taken from National Catalogue Service for Geographic Information(www.webmap.cn, accessed on 1 April 2022). The railway traffic data (2015–2018) comes from the SMSKB app, and road network data (2015–2018) comes from OpenStreetMap (www.openstreetmap.org, accessed on 1 April 2022). The data on the highway and railway passenger volume are from the statistical bulletin on the development of the transportation industry.

2.3. Methods

2.3.1. Research Framework

In order to measure the spatial pattern and reveal the structural characteristics of the innovation network, we design a research framework, as shown in Figure 2. First, we use the entropy, a commonly used weighting method, to evaluate the innovation capability of each city. The gravity model was used to investigate the correlations between two cities. However, the traditional gravity model cannot well measure the innovative connection of cities. Second, we improve three aspects of the traditional spatial gravity model—city quality, the gravitation coefficient, and city distance. This improved gravity model is then applied to calculate the intensity of innovation linkages between cities, and the innovation network of urban agglomeration is constructed. Third, we analyze the influence of cities, divide them into subgroups, and investigate the density matrix of different subgroups. Finally, we identify urban agglomerations’ innovative spatial structure patterns in different periods and put forward relevant suggestions for regional innovation and development.

2.3.2. Entropy Method

The innovation level of a city is affected by many factors [17,18,19,38]. Selecting an appropriate indicator is the fundamental requirement for assessing urban innovation capability. We establish an evaluation index system of urban innovation capability (Table 1).
The entropy method is a commonly used weighting method that measures value dispersion in decision-making [41,57,58], which is more objective than the analytic hierarchy process [59]. In order to solve the problem of information overlap between multiple variables and the assumption of the subjective weight assignment method [60], we use the entropy method to calculate the weight of each innovation indicator. The derivation of city innovation capability is detailed below:
(1) Data matrix construction. The original indicator matrix can be expressed as:
X = ( x λ i j ) t × n × p           ( 1 λ t , 1 i n , 1 j p )
where x λ i j represents the value of indicator j of city i in year λ . Here, t is 4, n is 31, and p is 15.
(2) Data standardization. A range standard method is used for the dimensionless treatment of various indicators in this research, according to:
Z λ i j = ( x λ i j x m i n )   /   ( x m a x x m i n )
where x m a x   is the maximum value of innovation indicator j , x m i n   is the minimum value of innovation indicator j , x λ i j is the value of indicator j before nondimensionalization, and Z λ i j is the value of indicator j after nondimensionalization.
(3) Indicator normalization. The proportion of indicator j for city i in the year of λ is calculated according to:
R λ i j = Z λ i j /   λ = 1 t i = 1 n Z λ i j
where R λ i j is the normalized matrix, and Z λ i j is the value of indicator j after nondimensionalization. Other parameters are the same as (2).
(4) Indicator entropy value calculation:
E j = k × λ = 1 t i = 1 n R λ i j   l n R λ i j
k = 1 /   ln ( t × p )
where E j is the entropy value of indicator j , and R λ i j is the normalized matrix.
(5) Indicator redundancy calculation:
D j = 1 E j
where D j is the redundancy of indicator j , and E j is the entropy value of indicator j .
(6) Indicator weight calculation:
W j = D j / j p D j
where W j is the weight of indicator j , D j is the redundancy of indicator j , and p is the number of indicators. The weight of each indicator is shown in Table 1.
(7) City innovation capability calculation:
C λ i = j = 1 p R λ i j × W j
where C λ j is the innovation capability of city i in year λ , R λ i j is the normalized matrix, and W j is the weight of indicator j .

2.3.3. Improved Gravity Model

In 1946, a gravity model based on Newton’s universal law of gravitation was applied to study urban spatial interaction [61]. The calculation of the gravity model is given by:
F i j = k M i M j D i j β
where F i j is the connection degree between city i and city j , k is the gravitational coefficient, M i and M j are the quality of city i and city j , D i j β is the distance between city i and city j , and β   is the distance friction coefficient, with a value of 1.5 [21]. We apply three significant improvements to the gravity model.
First, the city quality parameters are improved, using city innovation capability to replace urban quality (Equation (8)).
Second, the city distance parameter is improved. Path distance cannot accurately describe the cost of connection and exchange between the two places. The level of inter-city traffic also affects the strength of inter-city links. Thus, we use traffic convenience to characterize the distance between cities. Since road and railway are the main modes of transportation in China, only these two modes of transportation are considered in the calculation of the distance parameters, according to:
T i j = w 1 T 1 × w 2 T 2
T 1 = j = 1 , i = 1 , i j n m i n ( l i j ) / V i j
T 2 = 1 / ( A i j + 5 6 B i j + 2 5 C i j + 0.05 )        
Here, T i j represents the traffic convenience between city i and city j ; the larger the value, the lower the traffic convenience between cities. T 1 represents the convenience of the highway, T 2 represents the convenience of the railway, w 1 represents the convenience coefficient of the highway, and w 2 represents the convenience coefficient of the highway. Values are determined by the proportion of national highway and railway passenger traffic each year. m i n ( l i j ) represents the shortest path distance from city i to city j , V i j represents the highway travel speed from city i to city j , A i j represents the daily number of high-speed rail trains from city i to city j , B i j represents the daily number of bullet trains from city i to city j , and C i j represents the daily number of express trains from city i to city j . Indirect connections (e.g., transfers) have little impact on the final measurement result of railway convenience, so accessibility values add a value of 0.05 to account for this.
Third, the gravitational coefficient is improved. The innovation acting intensity of city i to city j is different from that of city j to city i . Hence, the proportion of urban innovation capability to the sum of innovation capability of the two associated cities is used to amend the empirical constant k as:
k i j = M i M i + M j
where M i and M j are the innovation capability of city i and city j .

2.3.4. Social Network Analysis

We use social network analysis on the innovation network structure to describe the interactive structural relationship and its development between individuals. This approach can reveal the overall structural characteristics of the network and reflect the importance of individuals in the network structure [62]. We analyze the node relationship and overall structural characteristics of the innovation network of the UAMRYR from the aspects of centrality analysis and cohesive subgroups.
Centrality analysis of the innovation network structure utilizes four relevant metrics: in-degree centrality, out-degree centrality, degree centrality, and betweenness centrality. The calculation formula of each index is shown in Table 2.
The cohesive subgroup is a clustering method, which can be measured from the reciprocity, proximity or accessibility, frequency, and closeness of the relationship among the members of the subgroup [63]. The CONCOR (Convergent Correlations) iteration was adopted when implementing the innovation subgroup analysis. CONCOR is an iterative correlation convergence method that can directly analyze multivalued matrix and multivariate relationship matrix and use Pearson’s product distance coefficient to measure the number of small groups in the matrix [64].

3. Results

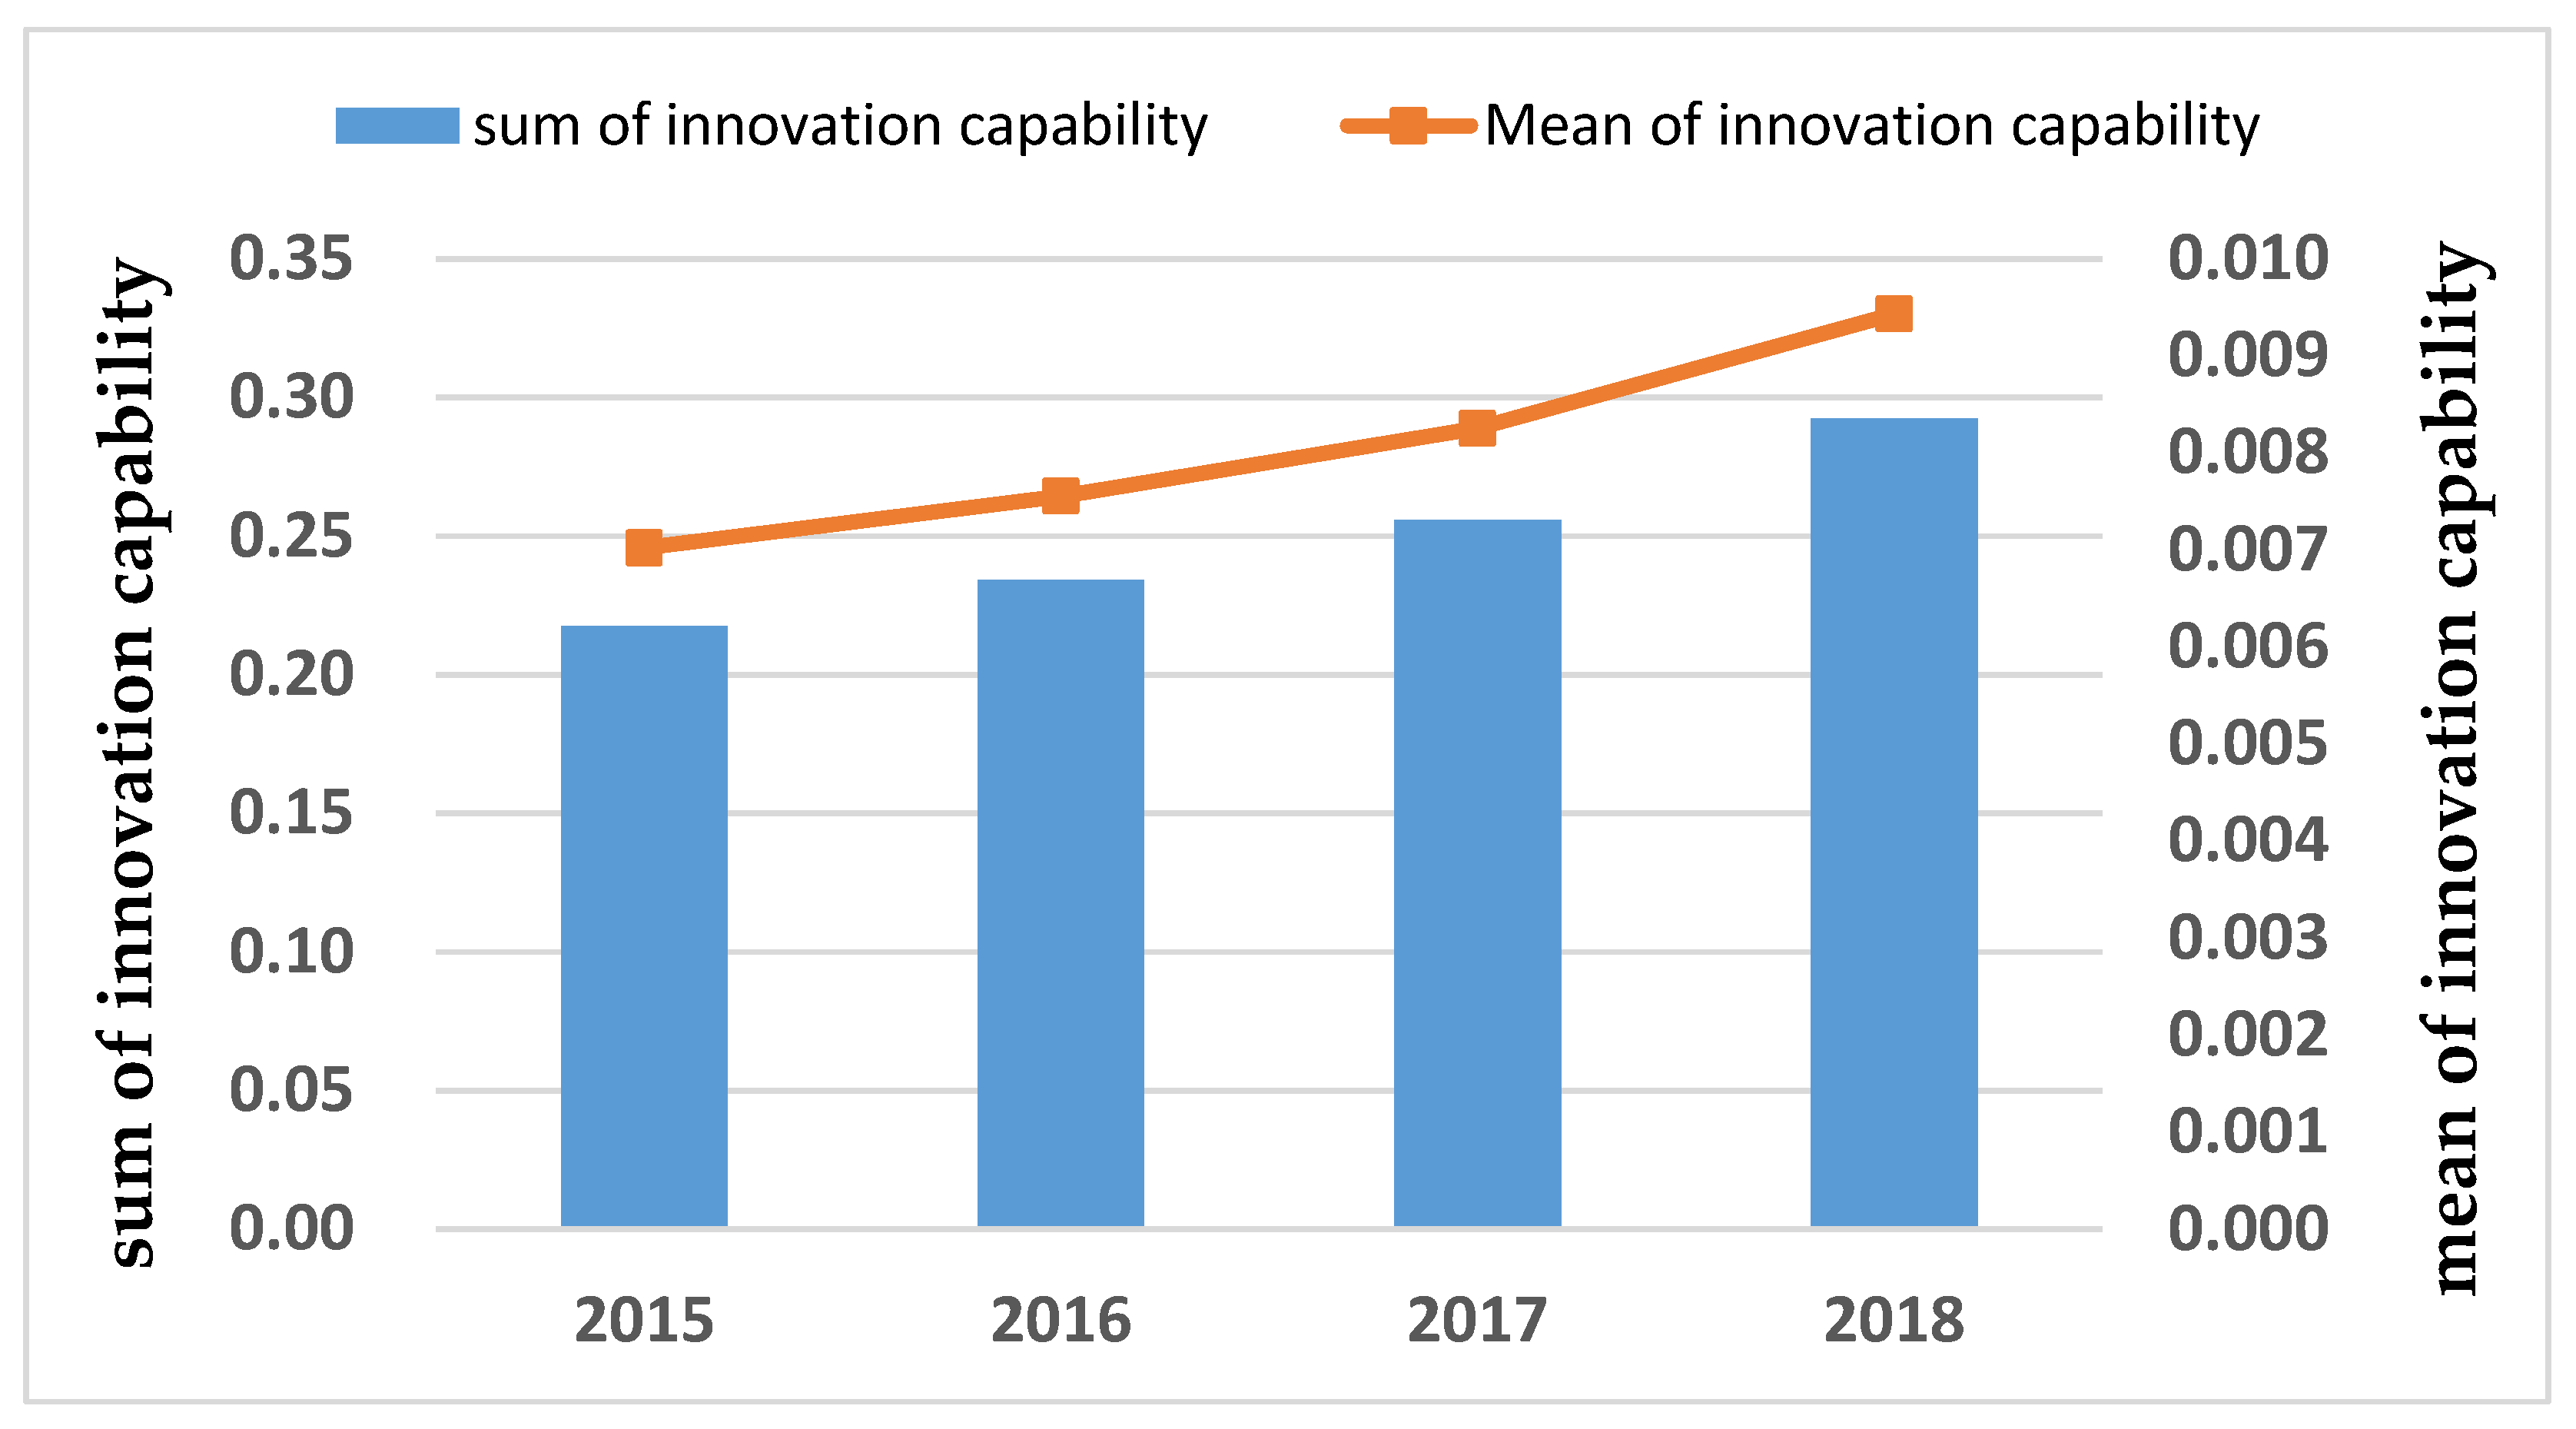
3.1. Innovation Capacity of the Urban Agglomeration in the Middle Reaches of the Yangtze River

The ranking of the innovation capability index of different cities from 2015 to 2018 has volatility, with the top three cities being Wuhan, Changsha, and Nanchang (Table 3). This shows that these three cities are leading the innovative development of the UAMRYR. By comparing the cities with the strongest and weakest innovation ability in 2015–2018, we find that the innovation index gap is still significant, and the “Matthew effect” [65] has appeared. For example, the innovation index of Wuhan was 68 times that of Tianmen in 2018. This demonstrates that the development of regional innovation is unbalanced. For overall innovation development, the regional innovation capacity of UAMRYR increased year by year from 2015 to 2018 (Figure 3). The innovation index increased from 0.218 to 0.292, the average innovation index increased from 0.0050 to 0.0066, and the growth rates of the innovation index were 0.08, 0.09, and 0.14, respectively. Although the innovation growth rate of UAMRYR is low, it is also developing continuously to become a core growth pole of China.

3.2. Spatial Network Structure of the Urban Agglomeration in the Middle Reaches of the Yangtze River

The innovation network of UAMRYR shows a “stratification” (Figure 4). Overall, the innovation network density and connection strength of the UAMRYR have increased. The innovation link network formed between Wuhan, Changsha, and Nanchang constitutes a stable “triangle,” and the urban innovation links are highly concentrated on the links among the three. The innovation links at the fifth level have decreased year by year, while the links at other levels have increased. The urban innovation network structure is thus becoming more stable. The innovation links within UAMRYR were relatively sparse, and the intensity of innovation links between cities varied greatly in 2015. Wuhan, Changsha, and Nanchang have become leading cities of innovation within the urban agglomeration. The innovation connection intensity between most cities located on the edge of the region is less than 1, and the “core periphery” feature is significant. In 2017, the intensity of innovation links among the three provincial capitals became closer, and the first “triangle” appeared in the urban agglomeration. While strengthening the innovation links with other cities in their respective provinces, Wuhan and Changsha broke the inter-provincial barriers in the cluster. They strengthened the links with cities outside the province. Meanwhile, the innovation linkage level in Nanchang mainly occurs in Jiangxi Province. The network formed by pairs of cities with innovation connection strength greater than 10 shows that many small “triangles” have expanded outward with Wuhan, Changsha, and Nanchang as a core during 2018. This reveals that the development of surrounding urban clusters driven by the development of core urban clusters is important to developing the innovation network structure of urban clusters in the middle reaches of the Yangtze River.

3.3. Centrality Analysis of Innovation Networks in the Urban Agglomeration in the Middle Reaches of the Yangtze River

Centrality analysis can effectively measure the status and influence of cities in the innovation network(Figure 5). The in-degree value of a city in UAMRYR increases year by year (Figure 5a), meaning that cities are becoming more attractive to innovative resources. Although there have been small dynamic changes in rank, the top five cities of the UAMRYR, according to their in-degree centrality, always include Changsha, Zhuzhou, Wuhan, Zhuzhou, and Xiangtan. This shows that the innovative development of the provincial capital cities is affected by the surrounding cities. Meanwhile, Changsha, Zhuzhou, and Xiangtan have seen better conditions for innovative development.
The out-degree value of cities in the UAMRYR increased from 2015 to 2018 (Figure 5b), which illustrates that the innovation radiation ability of these cities is enhanced. There is a large gap in the innovation radiation capacity between different cities, particularly in the Wuhan urban circle. In 2018, the out-degree value of Wuhan, Changsha, and Nanchang was greater than 100, while the value of Xiantao, Qianjiang, Tianmen, and Jingdezhen was less than 5. Wuhan and Changsha have strong innovation radiation ability and occupy a core position in the process of innovation spillover. Although the innovation power of Nanchang is weaker than that of Wuhan and Changsha, it has played an important role in driving the surrounding cities. Comparisons of the inflow and outflow of each city show that the innovation inflow of most cities is greater than the outflow, showing that each city is improving its attraction of innovation resources and promoting individual innovation development.
The degree centrality is calculated by combining in-degree centrality and out-degree centrality to measure the city’s position in the innovation network (Figure 5c). From 2015 to 2018, the number of edge nodes and general nodes in the innovation network gradually decreased, and each node city played an important role in the innovation network. In 2018, Wuhan and Changsha were core nodes in the innovation network, Nanchang was a sub-core node, and most cities were only important nodes. The distribution location of network nodes at each level shows that important nodes, sub-core nodes, and core nodes form a clear spatial axis, which is roughly consistent with the development axis of urban agglomeration in the middle reaches of the Yangtze River.
The betweenness centrality of cities is shown in Figure 5d. From 2015 to 2018, the betweenness centrality of the innovation network decreased from 333 to 188, indicating that the degree of resource control of cities in the urban agglomeration is weakening, and the innovation connection is gradually becoming more balanced. Wuhan, Changsha, and Nanchang have high betweenness centrality, which plays an important intermediary role in the connection of other cities. Although the total external innovation of Shangrao and Huangshi is not significant, their intermediary role in the innovation network has increased, which has helped promote the innovation connection of surrounding cities. Tianmen, Xiantao, Qianjiang, Ezhou, and Jingdezhen are on the edge of the innovation grid.

3.4. Analysis of Cohesive-Subgroups in the Urban Agglomeration in the Middle Reaches of the Yangtze River

The emergence of clustering subgroups is an important manifestation of the maturity of urban agglomeration innovation systems. An accurate analysis of subgroups is helpful to understand the overall structure and organization of urban networks. The clustering subgroup division results of the innovation network of the UAMRYR are shown in Figure 6. From 2015 to 2018, the innovation connection network of the UAMRYR can be divided into four sub-cluster systems at the secondary level, and the innovation sub-community structure is relatively stable as a whole. Yichun and Pingxiang are divided into subgroups dominated by cities under the jurisdiction of Hunan Province. Changsha has a strong innovation radiation ability, but the overall innovation radiation ability in Jiangxi Province is weak, and the innovation attraction among cities in Jiangxi Province is weak. On the basis of the division at the second level, the subgroups are further divided at a third level, yielding seven total subgroups from 2015 to 2018.
These seven subgroups’ internal and external correlation density is then counted (Figure 7). The network density of subgroup VI was largest from 2015 to 2018. However, the subgroup with the second largest network density has changed from subgroup IV to subgroup III. This is because the position of the subgroup of the small group with Changsha as its core has changed. The inflow and outflow directions of each subgroup in 2015 show that the largest inflow direction of most subgroups is subgroup VI, with Wuhan as its core. The maximum inflow direction of subgroup III and subgroup VI comes from subgroup IV, which means that subgroup VI has become an innovation radiation center subgroup. Subgroup IV has become a sub-central subgroup of innovation radiation in the UAMRYR. Meanwhile, the maximum outflow direction of subgroup I and subgroup III are subgroup II, the maximum outflow direction of subgroup II and subgroup IV are subgroup III, and the maximum outflow direction of subgroup V and subgroup VII are subgroup VI. This suggests that there are multiple innovation aggregation center subgroups in UAMRYR. The connection density between subgroups also changed from 2016 to 2018, along with the change of cities included in subgroup III and subgroup IV. However, the internal density of subgroups and the density between subgroups increased year by year. During this period, the maximum inflow directions of subgroup II, subgroup IV, subgroup VI, and subgroup III came from subgroup III. The maximum inflow directions of subgroup I, subgroup III, subgroup V, and subgroup VII came from subgroup VI. This shows that the innovation radiation ability of subgroup III with Changsha as its core is enhanced, and the innovation radiation pattern in the middle reaches of the UAMRYR has changed from a single center to a double center. The members of the subgroup of innovation aggregation center have changed from subgroup II, subgroup III, and subgroup VII to subgroup III, subgroup IV, and subgroup VII. The overall innovation aggregation pattern in the UAMRYR still maintains a multi-core state.

4. Discussion

4.1. Overview of Findings

The positive impact of innovation networks on the optimal allocation of innovation resources has been previously demonstrated [66,67]. Understanding the evolution characteristics of innovation network structures can help improve urban innovation ability and promote regional collaborative innovation development [68]. Our study established the innovation connection network of the urban agglomeration in the middle reaches of the Yangtze River. It analyzed the structural system of the innovation network combined with a complex network analysis method.
The innovation ability of cities in the UAMRYR strengthened from 2015 to 2018. Wuhan, Changsha, and Nanchang have strong innovation ability and have played a leading role in the innovation and development of the greater urban agglomeration, which is the main driver for robust economic growth [69]. The innovation gap between cities in the urban agglomeration is significant, and the polarization of innovation ability between provincial capital cities and ordinary cities is significant. The provincial capital cities have accumulated innovation ability and experience over a long period. In response to motives of profit, the talents and resources of the surrounding cities are constantly transferred to the provincial capital cities, which further exacerbates the innovation gap between cities [70]. Therefore, to improve the region’s overall innovation level, the government must accelerate the innovative development of ordinary cities.
The biggest effect of network innovation lies in integrating innovation resources [71]. A reasonable innovation network structure can significantly improve the quality of regional innovation development [72]. However, the innovation network of the UAMRYR is still developing, and there are differences in innovation links among cities with significant core edge characteristics. In addition to the relatively stable innovation network formed between Wuhan, Changsha, and Nanchang, the links between other cities are weak, and there is still much room for improvement (Figure 8). This indicates the positive relationship between the innovation agglomeration and the position of a city in the urban hierarchy [73]. In order to improve the efficiency of innovation and the integration of the region, the government should establish long-term cooperation mechanisms driven by the core cities to promote the development of peripheral cities, rationally distribute innovative resources, and maintain stable cooperative relations [33]. Wuhan and Changsha have broken inter-provincial barriers in the urban agglomeration. They have gradually established strong ties with other cities in the urban agglomeration, while Nanchang has improved innovative ties with other cities in Jiangxi Province. Breaking down the barriers among provinces facilitates information transfer, and the creation of an external environment conducive to the flow of innovative elements will improve overall regional innovation performance [74,75]. In the future, Nanchang should break administrative barriers, increase the sharing and absorption of innovation resources, strive to keep up with the development process of Wuhan and Changsha, and become a core city of the innovation network.
The status and influence of different cities in the innovation network are different. Although the ranking of innovation resource attractiveness of cities fluctuates, Changsha, Zhuzhou, Wuhan, Zhuzhou, and Xiangtan have always ranked in the top five. This result is closely related to the support of national policies. For example, to promote innovation-driven development, China established the Wuhan East Lake National Independent Innovation Demonstration Zone in 2009 and the Chang Zhu Tan National Independent Innovation Demonstration Zone in 2015 [76]. Wuhan, Changsha, and Nanchang all have strong innovation radiation ability. Similarly, Wuhan, Changsha, and Nanchang also have strong communication connectivity in the information flow network of the UAMRYR [77]. These results verify the ability of information exchange has a tangible influence on urban innovation [78]. Tianmen, Xiantao, Qianjiang, Ezhou, and Jingdezhen have always been located at the edge of the innovation network. The lack of innovative resources and traffic [79] restrictions may be the reason for this observation. The innovation aggregation pattern within the urban agglomeration has maintained a multi-core state, but the innovation radiation pattern has changed from a single-center to a double-center. This development model can be more conducive to regionally coordinated development and is also reflected in the economic development network of the Yangtze River Delta [80].
The connection of important nodes, sub-core nodes, and core nodes leads to the spatial formation of multiple innovation axes (Figure 8). The location and direction of the axis are consistent with the development axis and plan of the urban agglomeration in the middle reaches of the Yangtze River. A previous study also found that improving transport efficiency can bring a more significant positive spillover effect to the surrounding areas of innovation [81]. Therefore, there is a clear link between innovation and transportation. The Beijing-Guangzhou development axis, the Beijing-Kowloon development axis, and the Erlianhot-Guangzhou development axis in the north-south direction have been extensively developed, but the east-west direction has not been fully formed. Further strengthening the innovation and development of cities on these two axes should be an important future focus of the urban agglomeration in the middle reaches of the Yangtze River.
The formation of growth triangles links three areas with different factor endowments and different comparative advantages to form a larger region with greater potential for economic growth [82]. This theory is also a useful model in the innovative development of the UAMRYR. The growth triangle integration mode is clear in our chosen study period. The innovation connection axis among Wuhan, Changsha, and Nanchang constituted a stable “triangle” in 2015 (Figure 8). Since 2015, the “growth triangle” integration model has received more response in the urban agglomeration, and the outward expansion area centered in the middle of the urban agglomeration began to develop. By 2018, there were 10 “triangles” in the central, southwest, and western regions of the urban agglomeration in the middle reaches of the Yangtze River. The existence of this development model urges the core node cities to drive the important node cities and form a high-level industrial structure [83,84]. Therefore, this development model efficiently promotes the overall innovative development of the urban agglomeration in the middle reaches of the Yangtze River.

4.2. Policy Implications

The innovative development of cities and the cultivation of new innovative growth poles should be a primary future policy focus. Improving the innovation ability of individual cities is the key to the innovative development of urban agglomerations. The development process of the innovation network in the UAMRYR shows a clear “Matthew Effect.” In order to narrow the innovation gap, cities with weak innovation capability should improve their innovation ability. This can be accomplished by improving regional economics, optimizing industrial structure, and strengthening cultural construction [33]. In addition, the government should formulate regional innovation policies, increase innovation investment, and strengthen the optimal allocation of innovation resources. Wuhan, Changsha, and Nanchang should create more spillover effects and radiation effects, advantageous for the spatial integration and coordinated development of innovation in the UAMRYR. However, Nanchang’s innovation ability and radiation ability are weaker than Wuhan and Changsha’s. Therefore, more innovative resources should be directed to Nanchang, which should also strengthen all construction aspects to promote its innovation development and adjust its innovation structure.
A secondary policy focus should be on expanding the innovation axis and optimizing the innovation network structure of the urban agglomeration. The urban agglomeration’s innovation network in the Yangtze River’s middle reaches is fragile, and the connection between cities is limited by provincial administrative divisions. The area should break the limits of administrative barriers, improve the layout of transportation facilities and strengthen inter-city “industry-university-research” cooperation, thereby promoting the stability of the spatial network structure of innovation and attaining holistic innovation development of the urban agglomeration. In particular, Wuhan, Changsha, and Nanchang, as the core node of the innovation network, should prevent and overcome regional protectionism, increase the open sharing of information resources of scientific research institutions in colleges, hasten the flow of innovation technologies, leading to the common development of surrounding cities. Moreover, to promote the coordinated development of regional innovation, the government should further strengthen the construction of the innovation axis along the Yangtze River and the axis of Shanghai-Kunming in the east-west direction.

4.3. Limitations and Future Research Directions

An improved evaluation index system of regional innovation ability could be developed in the future to further expand the concepts presented here. Urban innovation connection is a complex connection between the collection of materials and information flow. Here, we were limited by the difficulty of collecting dynamic relationship data. Thus, future research should consider more factors which include co-authored papers [13], tourism [85], social media [86], and other factors. To get more reasonable weights of indicators, we will combine the subjective weighting method and the objective weighting method to calculate the weights of indicators in future research. A longer study period may also give more insights, as we here only employed a four-year period, which may not fully reflect the temporal and spatial evolution characteristics of the innovation network of the UAMRYR. The resilience of the innovation network structure was also not assessed in the present work. A detailed analysis of the resilience of urban network structure could likely lead to an improved understanding of the resilience of cities to different impact factors [87]; this is another promising direction for future research.

5. Conclusions

This paper proposed a research framework for measuring the spatial pattern and revealing structural characteristics of the innovation network. We created a multi-criteria indicator system for the UAMRYR innovation network based on innovation connectivity. We indirectly measured the basic spatial pattern of innovation connections between cities using an improved gravity model. We also employed methods of social networks to reveal structural characteristics and spatial patterns of the innovation network in the UAMRYR. Our main conclusions are as follows:
First, the innovation ability of cities in UAMRYR increased from 2015 to 2018, and the innovation gap between cities gradually decreased. The deficiency and imbalance in the allocation of innovation resources are one of the reasons for the large gap in innovation development between cities. At present, UAMRYR is in the state of core city-driven development; the innovation resources of core cities are better than marginal cities, which leads to a large innovation gap between cities. However, the gap will gradually decrease with the development of urban agglomeration and the rational allocation of innovation resources.
Second, the structure of the innovation network in the UAMRYR is significantly hierarchical and increasingly complex. The complexity of the network structure shows that the connection between cities has been strengthened, and the region is in the integrated development stage of coordinated innovation. Wuhan, Changsha, and Nanchang comprise the absolute core of the network and have a strong influence on the innovation development of the surrounding cities. The stable “triangle,” composed of Wuhan, Changsha, and Nanchang, is important for supporting the innovative network of the UAMRYR. However, the innovation connection between most cities on the edge of the UAMRYR is weak. A strengthening of the innovative connection between cities has enabled many small “triangles” to expand outward from Wuhan, Changsha, and Nanchang. The growth triangle integration mode is thus an adequate representation of the period from 2015 to 2018.
Third, the status and influence of cities in the innovation network are different. The ability of cities to attract innovative resources and radiate innovation has continuously increased from 2015 to 2018. The innovation inflow of most cities is greater than the outflow, which suggests that these cities are strongly attracting innovation resources and promoting individual innovation development. Wuhan and Changsha are core nodes in the innovation network, and Nanchang is a sub-core node, with most cities being important nodes. There are multiple spatial innovation axes composed of important nodes, sub-core nodes, and core nodes. In addition, the location and direction of the axis are consistent with the development axis and plan of the urban agglomeration in the middle reaches of the Yangtze River. The innovation links between regional cities are more direct and close. In addition to the important intermediary roles of Wuhan, Changsha, and Nanchang in urban innovation linkages, the intermediary roles of Shangrao and Huangshi also increased from 2015 to 2018. The innovation aggregation pattern maintains a multi-core state in the UAMRYR, but the innovation radiation pattern has changed from a single-center to a double-center.
Finally, our study suggests policy guidelines to cultivate innovation growth poles and expand innovation axes by the structural characteristics and development status of the innovation network of UAMRYR. This study applied the proposed research framework to a case study, UAMRYR, to explore the spatial patterns of innovation networks from 2015 to 2018. As the main form of new urbanization development, the urban agglomeration has become an important growth point for future regional spatial development [88]. The formation of an innovation network helps the flow of innovation resources and promotes the complementarity of innovation advantages in urban agglomerations. In summary, the framework is highly feasible, and the case study can be used as a reference for other urban agglomerations.

Author Contributions

Conceptualization, J.L. and L.L.; methodology, X.X.; data curation, L.L.; formal analysis, L.L.; investigation, J.L. and L.L.; resources, H.L. and J.L.; writing—original draft preparation, L.L. and J.L.; writing—review and editing, L.L., J.L., X.X., B.H., S.Q., and X.Z.; visualization, L.L. and X.X.; project administration, J.L.; funding acquisition, J.L. All authors have read and agreed to the published version of the manuscript.

Funding

This research was funded by the National Natural Science Foundation of China (grant numbers 41461083, 41867012, and 42061075).

Institutional Review Board Statement

Not applicable.

Informed Consent Statement

Not applicable.

Data Availability Statement

Not applicable.

Acknowledgments

Thanks to Adam Thomas Devlin (Jiangxi Normal University) for helping improve the paper. The authors would like to acknowledge all of the reviewers and editors.

Conflicts of Interest

The authors declare no conflict of interest.

References

  1. Miao, C.; Fang, D.; Sun, L.; Luo, Q. Natural resources utilization efficiency under the influence of green technological innovation. Resour. Conserv. Recycl. 2017, 126, 153–161. [Google Scholar] [CrossRef]
  2. Angelidou, M.; Psaltoglou, A. An empirical investigation of social innovation initiatives for sustainable urban development. Sustain. Cities Soc. 2017, 33, 113–125. [Google Scholar] [CrossRef]
  3. Duan, D.; Du, D.; Liu, C.; Grimes, S. Spatio-temporal evolution of urban innovation structure based on zip code geodatabase: An empirical study from Shanghai and Beijing. J. Geogr. Sci. 2016, 26, 1707–1724. [Google Scholar] [CrossRef] [Green Version]
  4. Xiao, W.; Pan, J.-D.; Liu, L.-Y. China’s industrial structure upgrade in the “New Normal”: Empirical test and determinants. Singap. Econ. Rev. 2018, 63, 1037–1058. [Google Scholar] [CrossRef] [Green Version]
  5. Anselin, L. Spatial Econometrics: Methods and Models; Springer Science & Business Media: Berlin/Heidelberg, Germany, 1988; Volume 4. [Google Scholar]
  6. Maggioni, M.A.; Nosvelli, M.; Uberti, T.E. Space versus networks in the geography of innovation: A European analysis. Pap. Reg. Sci. 2007, 86, 471–493. [Google Scholar] [CrossRef]
  7. Freeman, C.J.R.p. Networks of innovators: A synthesis of research issues. Res. Policy 1991, 20, 499–514. [Google Scholar] [CrossRef]
  8. Huggins, R.; Prokop, D. Network structure and regional innovation: A study of university–industry ties. Urban Stud. 2017, 54, 931–952. [Google Scholar] [CrossRef]
  9. Leoncini, R.; Maggioni, M.A.; Montresor, S. Intersectoral innovation flows and national technological systems: Network analysis for comparing Italy and Germany. Res. Policy 1996, 25, 415–430. [Google Scholar] [CrossRef]
  10. Hu, S.S.; Kim, H.-H. Spatial structure and dynamic evolution of urban cooperative innovation network in Guangdong-Hong Kong-Macao greater bay area, China: An analysis based on cooperative invention patents. J. Asian Financ. Econ. Bus. 2021, 8, 113–119. [Google Scholar]
  11. Pan, X.; Pan, X.; Ai, B.; Guo, S. Structural heterogeneity and proximity mechanism of China’s inter-regional innovation cooperation network. Technol. Anal. Strateg. Manag. 2020, 32, 1066–1081. [Google Scholar] [CrossRef]
  12. Capone, F.; Lazzeretti, L.; Innocenti, N. Innovation and diversity: The role of knowledge networks in the inventive capacity of cities. Small Bus. Econ. 2021, 56, 773–788. [Google Scholar] [CrossRef]
  13. Li, D.; Wei, Y.D.; Wang, T. Spatial and temporal evolution of urban innovation network in China. Habitat Int. 2015, 49, 484–496. [Google Scholar] [CrossRef]
  14. Lyu, L.; Wu, W.; Hu, H.; Huang, R. An evolving regional innovation network: Collaboration among industry, university, and research institution in China’s first technology hub. J. Technol. Transf. 2019, 44, 659–680. [Google Scholar] [CrossRef]
  15. Kong, X.-d.; Zhang, D. The Influence of knowledge cooperation on enterprise innovation performance in innovation network—The moderating effect of network characteristics. In Proceedings of the 2018 International Conference on Management Science and Engineering (ICMSE), Frankfurt, Germany, 17–20 August 2018; pp. 31–39. [Google Scholar]
  16. Han, M.; Sun, B.; Su, X. Can a region’s network location characteristics affect its innovation capability? Empirical evidence from China. Chin. Manag. Stud. 2020, 15, 328–349. [Google Scholar] [CrossRef]
  17. Pan, X.; Chu, J.; Pan, X.; Wang, M. A comparative analysis of changes in urban innovation spatial correlation effect in China and its driving factors. Asian J. Technol. Innov. 2021, 29, 1–15. [Google Scholar] [CrossRef]
  18. Kunze, K. Empirical analysis of innovation and trade in Europe: A gravity model approach. Int. J. Trade Glob. Mark. 2016, 9, 197–211. [Google Scholar] [CrossRef]
  19. Zhu, W.; Yue, Z.; He, N.; Luan, K.; Ye, L.; Qian, C. Analysis of China’s Urban Innovation Connection Network Evolution: A Case Study of Henan Province. Sustainability 2022, 14, 1089. [Google Scholar] [CrossRef]
  20. Sun, X. Research on the innovation radiation of Shanghai science and technology innovation center to the Yangtze River delta. J. Phys. Conf. Ser. 2021, 1802, 042046. [Google Scholar] [CrossRef]
  21. Ewing, G. Gravity and linear regression models of spatial interaction: A cautionary note. Econ. Geogr. 1974, 50, 83–88. [Google Scholar] [CrossRef]
  22. Picci, L. The internationalization of inventive activity: A gravity model using patent data. Res. Policy 2010, 39, 1070–1081. [Google Scholar] [CrossRef] [Green Version]
  23. Wang, F.; Wei, X.; Liu, J.; He, L.; Gao, M. Impact of high-speed rail on population mobility and urbanisation: A case study on Yangtze River Delta urban agglomeration, China. Transp. Res. Part A Policy Pract. 2019, 127, 99–114. [Google Scholar] [CrossRef]
  24. Zhang, R.; Tai, H.; Cheng, K.-T.; Cao, Z.; Dong, H.; Hou, J. Analysis on evolution characteristics and dynamic mechanism of urban green innovation network: A case study of Yangtze River economic belt. Sustainability 2022, 14, 297. [Google Scholar] [CrossRef]
  25. Krätke, S. Regional knowledge networks: A network analysis approach to the interlinking of knowledge resources. Eur. Urban Reg. Stud. 2010, 17, 83–97. [Google Scholar] [CrossRef]
  26. Fu, N.J.C. Innovation Efficiency and the Spatial Correlation Network Characteristics of Intelligent-Manufacturing Enterprises. Complexity 2021, 2021, 4299045. [Google Scholar] [CrossRef]
  27. Tseng, C.-Y.; Lin, S.-C.; Pai, D.-C.; Tung, C.-W. The relationship between innovation network and innovation capability: A social network perspective. Technol. Anal. Strateg. Manag. 2016, 28, 1029–1040. [Google Scholar] [CrossRef]
  28. Li, M.; Zhang, M.; Agyeman, F.O.; Ud Din Khan, H.S. Research on the influence of industry-university-research cooperation innovation network characteristics on subject innovation performance. Math. Probl. Eng. 2021, 2021, 477113. [Google Scholar] [CrossRef]
  29. Peng, F.; Zhang, Q.; Han, Z.; Ding, Y.; Fu, N. Evolution characteristics of government-industry-university cooperative innovation network of electronic information industry in Liaoning Province, China. Chin. Geogr. Sci. 2019, 29, 528–540. [Google Scholar] [CrossRef] [Green Version]
  30. Kong, X.; Xu, Q.; Zhu, T.J.S. Dynamic evolution of knowledge sharing behavior among enterprises in the cluster innovation network based on evolutionary game theory. Sustainability 2020, 12, 75. [Google Scholar] [CrossRef] [Green Version]
  31. Can, Z.; Gang, Z.; Xianzhong, C. Chinese inter-city innovation networks structure and city innovation capability. Geogr. Res. 2017, 36, 1297–1308. [Google Scholar]
  32. Zhou, F.; Zhang, B. Detecting and Visualizing the Communities of Innovation in Beijing-Tianjin-Hebei Urban Agglomeration Based on the Patent Cooperation Network. Complexity 2021, 2021, 5354170. [Google Scholar] [CrossRef]
  33. Li, Y.; Luo, W. Influencing Factors of Knowledge Cooperation in Urban Agglomeration on Yangtze River Delta from the Perspective of Innovation Network. J. Phys. Conf. Ser. 2020, 1852, 042041. [Google Scholar] [CrossRef]
  34. Peipei, X.; Ladi, W. Research on the Structural Evolution and Driving Mechanism of Regional Collaborative Innovation Network: Evidence from the Beijing-Tianjin-Hebei Urban Agglomeration. In Proceedings of the 6th International Conference on Humanities and Social Science Research (ICHSSR 2020), Hangzhou, China, 10–12 April 2020; pp. 502–506. [Google Scholar]
  35. Liu, C.; Niu, C.; Han, J.J.S. Spatial dynamics of intercity technology transfer networks in China’s three urban agglomerations: A patent transaction perspective. Sustainability 2019, 11, 1647. [Google Scholar] [CrossRef] [Green Version]
  36. Qin, Z.; Peng, Z.; Zhang, J. Development Report on Changjiang Middle Reaches Megalopoli (2018); Social Science Academic Press: Beijing, China, 2018; pp. 120–141. [Google Scholar]
  37. Zhang, J. Research on Promoting Innovative Cooperation of Urban Agglomeration in the Middle Reaches of the Yangtze River. Available online: https://zys.hubei.gov.cn/bmdt/yjcg/zlcg/201910/t20191025_11219.shtml (accessed on 1 April 2022).
  38. Wang, H.; Yang, G.; Qin, J. City Centrality, Migrants and Green Inovation Efficiency: Evidence from 106 Cities in the Yangtze River Economic Belt of China. Int. J. Environ. Res. Public Health 2020, 17, 652. [Google Scholar] [CrossRef] [Green Version]
  39. Lu, L.; Huang, R. Urban hierarchy of innovation capability and inter-city linkages of knowledge in post-reform China. Chin. Geogr. Sci. 2012, 22, 602–616. [Google Scholar] [CrossRef]
  40. Lo, M.F.; Tian, F. Enhancing competitive advantage in Hong Kong higher education: Linking knowledge sharing, absorptive capacity and innovation capability. High. Educ. Q. 2020, 74, 426–441. [Google Scholar] [CrossRef]
  41. Xue-dong, L.; Jin-guang, Z.; Zhi, X. Evaluation of regional technology innovation capability based on R clustering and entropy methods. In Proceedings of the 2013 International Conference on Management Science and Engineering 20th Annual Conference Proceedings, Harbin, China, 17–19 July 2013; pp. 1937–1943. [Google Scholar]
  42. Shan, D. Research of the construction of regional innovation capability evaluation system: Based on indicator analysis of hangzhou and ningbo. Procedia Eng. 2017, 174, 1244–1251. [Google Scholar] [CrossRef]
  43. Fu, Y.; Supriyadi, A.; Wang, T.; Wang, L.; Cirella, G.T. Effects of regional innovation capability on the green technology efficiency of China’s manufacturing industry: Evidence from listed companies. Energies 2020, 13, 5467. [Google Scholar] [CrossRef]
  44. He, S.; Du, D.; Jiao, M.; Lin, Y. Spatial-temporal characteristics of urban innovation capability and impact factors analysis in China. Sci. Geogr. Sin 2017, 37, 1014–1022. [Google Scholar]
  45. Pei, J.; Zhong, K.; Li, J.; Xu, J.; Wang, X. ECNN: Evaluating a cluster-neural network model for city innovation capability. Neural Comput. Appl. 2021, 2021, 1–13. [Google Scholar] [CrossRef]
  46. Zhang, D.; Gao, Y.; Peng, Z. Independent innovation capability evaluation and analysis on wanjiang city-zone. In Proceedings of the 2011 International Conference on Computer Science and Service System (CSSS), Nanjing, China, 27–29 June 2011; pp. 2286–2289. [Google Scholar]
  47. Sheng, K.; Liu, S. On evaluation system for regional scientific and technical innovation ability and a positive study of 5 cities in south of Jiangsu. J. Grey Syst. 2015, 27, 92–104. [Google Scholar]
  48. Tianying, J.; Minghao, H. Research on regional innovation spatial linkage of Yangtze River Delta. Forum Sci. Technol. China 2014, 10, 126–131. [Google Scholar] [CrossRef]
  49. Chen, Y.; Li, W.; Yi, P. Evaluation of city innovation capability using the TOPSIS-based order relation method: The case of Liaoning province, China. Technol. Soc. 2020, 63, 101330. [Google Scholar] [CrossRef]
  50. Zhaoyang, W. Analysis of actual value of foreign investment and Wuhan Regional Technical Innovation Ability. In Proceedings of the 2011 International Conference on Product Innovation Management (ICPIM 2011), Wuhan, China, 16–17 July 2011; pp. 293–296. [Google Scholar]
  51. Ming, M.; Guo-Hao, Z. The Impact of Transportation Infrastructure on Regional Innovation Capability: A Dynamic Durbin Panel Data Approach. DEStech Trans. Econ. Bus. Manag. 2017. [Google Scholar] [CrossRef]
  52. Niu, X.; Chen, X.-D. Innovation connection between cities and spatial structure of innovation network. Chin. J. Manag. 2013, 10, 575–582. [Google Scholar]
  53. Zhang, B.; Qi, R. Transportation infrastructure, innovation capability, and urban economic development. Transform. Bus. Econ. 2021, 20, 526–545. [Google Scholar]
  54. Garcia-Ochoa Mayor, M.; Blázquez de la Hera, M.L.; de Diego Ruiz, E. Empirical study of national technological innovation capability in Africa. South Afr. J. Econ. Manag. Sci. 2012, 15, 440–463. [Google Scholar] [CrossRef] [Green Version]
  55. Penglin, L.; Dong, J.; Chen, C. Research on the evaluation of urban science and technology innovation ability in Shaanxi province based on bp neural network. In Proceedings of the 2017 2nd International Conference on Modern Management, Education Technology, and Social Science (MMETSS 2017), Singapore, 28–30 July 2017; pp. 222–232. [Google Scholar]
  56. Heng, T. Analysis of evaluation about regional capacity of science and technology. In International Conference on Advances in Education and Management; Springer: Berlin/Heidelberg, Germany, 2011; pp. 307–315. [Google Scholar]
  57. He, L.; Liu, Y. Based on entropy method regional innovation capability evaluation in gansu province. In Proceedings of the Ninth International Conference on Management Science and Engineering Management; Springer: Midtown Manhattan, NY, USA, 2015; pp. 893–901. [Google Scholar]
  58. Zhu, Y.; Tian, D.; Yan, F. Effectiveness of entropy weight method in decision-making. Math. Probl. Eng. 2020, 2020, 3564835. [Google Scholar] [CrossRef]
  59. Li, L.; Liu, F.; Li, C. Customer satisfaction evaluation method for customized product development using Entropy weight and Analytic Hierarchy Process. Comput. Ind. Eng. 2014, 77, 80–87. [Google Scholar] [CrossRef]
  60. Ma, J.; Fan, Z.P.; Huang, L.H. A subjective and objective integrated approach to determine attribute weights. Eur. J. Oper. Res. 1999, 112, 397–404. [Google Scholar] [CrossRef]
  61. Zipf, G.K. Human Behavior and the Principle of Least Effort: An Introduction to Human Ecology; Ravenio Books, 2016. [Google Scholar]
  62. Knoke, D.; Yang, S. Social Network Analysis; SAGE Publications: Thousand Oaks, CA, USA, 2019. [Google Scholar]
  63. Jialing, Z.; Weidong, L. Trade network of China and countries along ‘Belt and Road Initiative’areas from 2001 to 2013. Sci. Geogr. Sin. 2016, 36, 1629–1636. [Google Scholar]
  64. Duan, X.; Meng, Q.; Fei, X.; Lin, M.; Xiao, R. The impacts of farmland loss on regional food self-sufficiency in Yangtze river delta urban agglomeration over last two decades. Remote Sens. 2021, 13, 3514. [Google Scholar] [CrossRef]
  65. Sun, F.; Wang, D.; Yu, N. Competition patterns of high-speed rail versus highways and aviation. Geogr. Res. 2017, 36, 171–187. [Google Scholar]
  66. Yuan, Y.; Han, Z.; Yang, W. A co-innovation network in Northeast China oriented to high-quality development. Technol. Anal. Strateg. Manag. 2021, 1–18. [Google Scholar] [CrossRef]
  67. Tang, J.; Li, N.; Pan, P. Research on innovation network structure and driving factors of the Yangtze River Delta Urban Agglomeration. Shanghai Econ. Res. 2018, 11, 63–76. [Google Scholar]
  68. Li, Y.; Ye, M. Evolution and development strategy of collaborative innovation network among cities in the Yangtze River delta-based on urban innovation index data. Afr. Asian Stud. 2021, 20, 291–323. [Google Scholar] [CrossRef]
  69. Law, S.H.; Sarmidi, T.; Goh, L.T. Impact of innovation on economic growth: Evidence from Malaysia. Malays. Econ. Assoc. 2020, 57, 113–132. [Google Scholar] [CrossRef]
  70. Wang, X.; Wan, T.; Yang, Q.; Zhang, M.; Sun, Y. Research on innovation non-equilibrium of Chinese urban agglomeration based on SOM neural network. Sustainability 2021, 13, 9506. [Google Scholar] [CrossRef]
  71. Doz, Y.L. Technology partnerships between larger and smaller firms: Some critical issues. Int. Stud. Manag. Organ. 1987, 17, 31–57. [Google Scholar] [CrossRef]
  72. Braczyk, H.-J.; Heidenreich, M. Regional governance structures in a globalized world. Reg. Innov. Syst. 1998, 414, 440. [Google Scholar]
  73. Fan, F.; Dai, S.; Zhang, K.; Ke, H. Innovation agglomeration and urban hierarchy: Evidence from Chinese cities. Appl. Econ. 2021, 53, 6300–6318. [Google Scholar] [CrossRef]
  74. Wang, X.; Fang, H.; Zhang, F.; Fang, S. The spatial analysis of regional innovation performance and industry-university-research institution collaborative innovation—An empirical study of Chinese provincial data. Sustainability 2018, 10, 1243. [Google Scholar] [CrossRef] [Green Version]
  75. Zhang, L. The knowledge spillover effects of FDI on the productivity and efficiency of research activities in China. China Econ. Rev. 2017, 42, 1–14. [Google Scholar] [CrossRef]
  76. Shuai, Z.; Kefan, X. Radiation effect of independent innovation demonstration area: A case study of east lake demonstration area. In Proceedings of the 13th International Conference on Innovation & Management, Wuhan, China, 28–30 November 2016; pp. 242–246. [Google Scholar]
  77. Zheng, W.; Du, N.; Zhang, Q.; Wang, X. Using Geodetector to explore the factors affecting evolution of the spatial structure of information flow in the middle reaches of the Yangtze River urban agglomeration. GeoJournal 2021, 1–19. [Google Scholar] [CrossRef]
  78. Zhou, R.; Zhang, Y.; Gao, X. The spatial interaction effect of environmental regulation on urban innovation capacity: Empirical evidence from China. Int. J. Environ. Res. Public Health 2021, 18, 4470. [Google Scholar] [CrossRef]
  79. Wang, J.; Cai, S. The construction of high-speed railway and urban innovation capacity: Based on the perspective of knowledge Spillover. China Econ. Rev. 2020, 63, 101539. [Google Scholar] [CrossRef]
  80. Zhang, Y.; Wang, T.; Supriyadi, A.; Zhang, K.; Tang, Z. Evolution and Optimization of Urban Network Spatial Structure: A Case Study of Financial Enterprise Network in Yangtze River Delta, China. ISPRS Int. J. Geo-Inf. 2020, 9, 611. [Google Scholar] [CrossRef]
  81. Zou, S.; Li, M.; Chen, J.; Chen, Y. Does the construction of an integrated transport network promote urban innovation? A perspective based on the theory of flow space. PLoS ONE 2021, 16, e0259974. [Google Scholar] [CrossRef]
  82. Wang, S.; Gao, Q.; Wang, D. A New Urban Integration Pattern—Adjacent Urban Integration. Sci. Geogr. Sinica. 2001, 06, 558–563. [Google Scholar]
  83. Liu, T.; Li, Y. Green development of China’s Pan-Pearl river delta mega-urban agglomeration. Sci. Rep. 2021, 11, 15717. [Google Scholar] [CrossRef]
  84. Fang, C. The basic law of the formation and expansion in urban agglomerations. J. Geogr. Sci. 2019, 29, 1699–1712. [Google Scholar] [CrossRef] [Green Version]
  85. Xiao, X.; Fang, C.; Lin, H. Characterizing Tourism Destination Image Using Photos’ Visual Content. ISPRS Int. J. Geo-Inf. 2020, 9, 730. [Google Scholar] [CrossRef]
  86. Xiao, X.; Fang, C.; Lin, H.; Liu, L.; Tian, Y.; He, Q. Exploring spatiotemporal changes in the multi-granularity emotions of people in the city: A case study of Nanchang, China. Comput. Urban Sci. 2022, 2, 1. [Google Scholar] [CrossRef]
  87. Jabareen, Y. Planning the resilient city: Concepts and strategies for coping with climate change and environmental risk. Cities 2013, 31, 220–229. [Google Scholar] [CrossRef]
  88. Fang, C.; Song, J.; Zhang, Q.e.a.; Li, M. The formation, development and spatial heterogeneity patterns for the structures system of urban agglomerations in China. Acta Geogr. Sin.-Chin. Ed. 2005, 60, 827. [Google Scholar]
Figure 1. Study area: (a) Location of Jiangxi Province, Hunan Province, and Hubei Province in China. (b) Location of UAMRYR in three provinces. (c) Cities included in UAMRYR.
Land 11 00597 g001
Figure 2. Research framework: (a) Calculating the innovation capability (results see Section 3.1). (b) Building the innovation network (results see Section 3.2). (c) Analyzing the structure of the innovation network (results see Section 3.3 and Section 3.4). (d) Discussing the innovative pattern (results see Section 4).
Land 11 00597 g002
Figure 3. Evolution of the innovation capability in UAMRYR.
Land 11 00597 g003
Figure 4. Evolution of the hierarchical structure of innovation networks in the UAMRYR.
Land 11 00597 g004
Figure 5. Centrality analysis results of innovation network in UAMRYR: (a) in-degree centrality; (b) out-degree centrality; (c) degree centrality; (d) betweenness centrality.
Land 11 00597 g005
Figure 6. Evolution of cohesive subgroups in the innovation network of the UAMRYR.
Land 11 00597 g006
Figure 7. Correlation density matrix of different subgroups from 2015 to 2018: I, II, III, IV, V, VI, and VII in the figure indicate subgroup numbers. Subgroup locations are displayed in Figure 6.
Land 11 00597 g007
Figure 8. Evolution of innovation patterns in the UAMRYR from 2015 to 2018 is based on the centrality of cities, the intensity of innovation links between cities, and the division results of cohesive subgroups. The status of cities in the innovation network is divided according to the centrality of cities.
Land 11 00597 g008
Table 1. Innovation ability evaluation index.
IndexWeightThe Description of the Index
Number of persons engaged in education0.048Which is the investment intensity of talent training in a city [39,40,41].
Number of college students0.132
Internal R&D expenditure of industrial enterprises above the designated size0.080Which is the financial support capacity of enterprises and government for innovation activities within a city [39,41,42,43].
Proportion of government science and technology appropriation in fiscal expenditure0.026
Number of domestic patents granted0.095Which is the ability of innovation output within a city [44,45,46].
Number of domestic patents applications0.103
Total profits of industrial enterprises above the designated size0.042Which are the economic benefits of innovation [47,48].
Per capita regional GDP0.038Which shows a city’s economic growth and indirectly indicates the potential for improving innovation capability [42,49].
Actual utilization of foreign capital0.113Which is the support of external finance for urban innovation [46,50].
Passenger transport volume0.036Which represents the support of traffic environment for urban innovation [51,52,53].
Cargo transportation volume0.048
Number of Internet broadband users0.059Which is the level of communication facilities and indicates the diffusion speed of innovation factors [42,54,55,56].
Number of fixed telephone subscribers0.050
Number of mobile phone users0.054
Library collection (C15)0.076Which shows the support of cultural investment for urban innovation [43,56].
Table 2. Calculation formulae of centrality analysis.
NameFormulaDescription
Out-degree centrality C o u t   i = j = 1 n V i j C o u t   i denotes the out-degree centrality of city i , and V i j is the innovation link strength between city i and city j. When the value of C o u t   i increases, it indicates that the innovation radiation capacity of the city i becomes stronger.
In-degree centrality C i n   i = j = 1 n V j i C i n   i denotes the in-degree centrality of city i, and V j i is the innovation link strength between city j and city i. When the value of C i n   i increases, it indicates that city i’s ability to absorb innovative resources has become stronger
Degree centrality C i = C o u t   i + C i n   i C   i denotes the degree centrality of city i, and C o u t   i is the out-degree centrality of city i, C i n   i is the in-degree centrality of city i. When the value of C   i increases, it indicates that the status of city i in the innovation network is higher.
Betweenness centrality C R B i = 2 j n k n b j k ( i ) 3 n 2 3 n + 2 C R B i denotes the betweenness centrality of city i, and b j k ( i ) indicates the ability of the city i to control the communication between city j and city k. When the value of C R B i increases, it indicates that the status of city i plays a greater role as a bridge between other cities.
Table 3. Innovation capability and ranking of cities in the UAMRYR from 2015 to 2018.
CityInnovation CapabilityRank
20152016201720182015201620172018
Wuhan0.04620.04910.05220.06201111
Changsha0.02980.03020.03580.03862222
Nanchang0.01680.01930.02110.02333333
Xiangyang0.00820.00890.01060.01165544
Jiujiang0.00740.00830.00940.01128655
Yichang0.00850.00930.00940.01104466
Zhuzhou0.00820.00820.00860.01016777
Hengyang0.00790.00780.00860.00947888
Shangrao0.00590.00640.00740.0084111299
Yichun0.00570.00650.00710.008313111110
Yueyang0.00640.00670.00720.00791091011
Changde0.00590.00630.00690.007612131212
Ji’an0.00510.00600.00620.007515151413
Xiangtan0.00550.00610.00660.007414141314
Jingzhou0.00650.00660.00570.00649101515
Huanggang0.00490.00550.00560.006216161616
Fuzhou0.00360.00390.00470.005719181817
Xiaogan0.00440.00470.00540.005717171718
Jingmen0.00340.00380.00400.005321202119
Huangshi0.00350.00380.00430.005120211920
Yiyang0.00380.00390.00420.004918192021
Loudi0.00320.00330.00370.004322232222
Xianning0.00320.00330.00340.004123222523
Pingxiang0.00250.00300.00360.004025252324
Xinyu0.00280.00320.00340.003824242425
Yingtan0.00210.00270.00260.003526262726
Jingdezhen0.00200.00230.00260.002827282627
Ezhou0.00180.00240.00220.002328272828
Xiantao0.00090.00100.00130.001529302929
Qianjiang0.00080.00110.00120.001430293030
Tianmen0.00060.00060.00070.000931313131
Publisher’s Note: MDPI stays neutral with regard to jurisdictional claims in published maps and institutional affiliations.

