Article

Exploring the Spatiotemporal Integration Evolution of the Urban Agglomeration through City Networks

1
Department of Land Management, School of Public Affairs, Zhejiang University, Hangzhou 310058, China
2
Land Academy for National Development, Zhejiang University, Hangzhou 310058, China
*
Author to whom correspondence should be addressed.
Land 2022, 11(4), 574; https://doi.org/10.3390/land11040574
Submission received: 28 March 2022 / Revised: 12 April 2022 / Accepted: 12 April 2022 / Published: 14 April 2022
(This article belongs to the Special Issue Regional Sustainable Development of Yangtze River Delta, China)

Abstract

:
Regional integration is a global trend and an integrated region consists of different cities of different sizes and functions, against which researching their organized structure is an important issue when discussing regional coordinated development. So, we construct the city networks, among which cities and their linkages are regarded as nodes and connections, to explore the spatial characteristics of a region and evaluate the integration level. The Yangtze River Delta Urban Agglomeration (YRDUA) is taken as the study area. For city nodes, this paper first evaluates the cities’ qualities comprehensively based on the multidimensional indicators during the rapid cities’ developmental period from 2005 to 2019. For city linkages, the interactions between different cities are then assessed by the improved gravity model. Then, the city networks consisting of city nodes and their linkages are constructed and analyzed by the social network analysis to deeply understand the orientations and relationships of cities in an integrated region. The results show that the developmental pace of different cities is imbalanced. The overall network of the YRDUA is relatively compact of the city-pair linkages forming the overlapping structure from primary to secondary axes, and different cities have specific functions. However, some small cities do not reach a mutual connection with big cities and face the risk of social resource outflow. In conclusion, attention to the existence of latent hierarchy should be paid to avoid the marginalization of small cities, especially under administrative intervention. The findings can enrich research on cities′ relationship and integration level of the YRDUA, and the specific characteristics of spatial organization paralleling with the leading development of the YRDUA can provide the reference to other regions under the strategy of national regional coordination.

1. Introduction

The distance shrinks and ties strengthen continuously between cities due to economic globalization, rapid urbanization, transportation facilitation, and so on, under which the urban agglomeration and region emerge. Regional integration was regarded as a developmental law of world cities, the process of increasing density, shortening distance, and reducing segmentation, or one of the most active economic phenomena in the new era [1]. It can be divided into transnational and domestic integration, and the former pursues the common market and mutual development by an economic or political union to eliminate the trade discrimination and other factors hindering economic development, such as the European Union (EU) and Association of Southeast Asian Nations (ASEAN) [2,3]. The latter, which is regional integration, is the hotspot when discussing domestic cities’ development. The integrated region usually is one of the best-developmental areas in a country, with the highest industrialization and urbanization level, which often appears in the form of urban agglomeration [4]. Urban agglomeration has become the driving force to promote national and regional growth [5] and is regarded as the major unit for global competition in the future [6,7], i.e., the high quality of urban agglomeration is crucial to both domestic stability and international status. Especially for China whose urbanization has entered a new stage, shortening the difference and achieving coordinated development of cities through regional integration are vital to the urbanization transition.
These realities draw attention to the spatial structure of urban agglomeration, as it reflects the relationship between cities of different functions and the spontaneous spatial organized characteristics rather than the administrative structure of the urban agglomeration, which plays a considerable role in the stability and prosperity level of the urban agglomeration [8]. Cities among integrated regions keep close and frequent contact. On the one hand, the region enlarges the market scale constantly by resources agglomeration, on the other hand, the multi-subjects can realize coordinated development by specialization and division. Thus, targets of improving resources utilization efficiency, giving different industrial facilities to the ground, satisfying employment demand at different levels, and increasing the city’s capacity for anti-risk will be achieved, and finally, a prosperous win–win situation is presented. Exploring the characteristics of the spatial structure of the urban agglomeration can provide evidence for interaction between cities and the stage of regional integration for optimizing the regional structure and promoting benign development. As the linkage among cities increasingly strengthens, the location space is replaced by flow space [9], and it has gradually formed a spatial network structure of urban agglomeration with cities as nodes and urban links as chains, which reflects the different combinational relationships of points and lines. The spatial network structure, breaking the traditional hierarchical spatial orderings as visible in the administrative organization [10] and extending the central place theory, becomes a new manifestation form of the spatial structure of urban agglomeration [11]. City networks serve as one of the major conduits for the regional integration process through the exchange of people, products, capital, ideas, etc., so that the region becomes more than the sum of its parts [12].
Many scholars started to research the spatial linkage of different aspects of cities’ interaction based on the city networks. This research mostly focused on the transportation network initially, especially premised on the passenger flow and different transportation facilities, such as railways [13,14,15] and airlines [16,17,18], or other infrastructure network structures focusing on physical functions [19]. The subsequent literature pays attention to the spatial network structure in different fields, such as tourism [20], environment [21], business [22], and population migration [23]. Some scholars argue that innovation [24], green agriculture [25], knowledge integration [26], etc., are other relevant aspects of city networks. However, the existing research mainly evaluates from a single dimension, which cannot assess the overall spatial linkage of the city network comprehensively, because it is diverse and integrated and covers aspects of the economy, society, environment, and so on, and has its own organizational and dynamic features [27].
Cities’ interaction and linkage are the major manifestation of the spatial structure of urban agglomeration, against which the gravity model is applied to evaluate the linkage intensity [28]. The traditional gravity model is majorly used in international bilateral trade, like Newton’s universal gravitation law, the trade scale is proportional to the economic scale of a country and inversely proportional to the distance between two countries. The gravity model of trade gradually received the support of theory and became improved [29]. Similarly, scholars believe that the connection among cities can also be explored by it. It is an important tool of city research and is used as the workhorse of empirical research on spatial connection. However, different research has tried to revise it to enhance its applicability in terms of the specific purpose, which has advantages and disadvantages, such as ignoring the direction and asymmetry or using a single indicator to represent the city scale. In addition, those studies usually only focus on the static spatial characteristics of a single year.
Keeping pace with the statistic empirical research, the regional planning and policy have received focus, which jointly promote the development of urban agglomeration. Especially for China whose regional integration has arisen to the height of national strategy, the government always devotes itself to the regional coordinated development. The Yangtze River Delta Urban Agglomeration (YRDUA), one of the biggest urban agglomerations in China, issued the recent planning outline in 2019, before which it actually already had regional planning in 2010 and 2016. Thus, the YRDUA, which has become the basic spatial unit of policy formulation and implementation about the spatial arrangement of infrastructure, industry, public services, etc., is widely used to research regional integration, which is one of the reasons we select it as our study area.
In summary, the long time-series data in the process of regional integration of the YRDUA (2005–2019) was used to evaluate the cities’ comprehensive developmental quality, research the spatial linkage and interaction relationship of cities in the YRDUA, and explore the characteristics of the city network by the social network analysis method. The marginal contribution of this paper is (1) to select the multidimensional indicators and try to be reasonable scientifically, (2) to revise the gravity model to improve its applicability, and (3) to analyze a long period and make the results more all-round, trying to clarify the dynamic feature of spatial linkage, above which we hope to supplement the spatial structure characteristics of the YRDUA precisely and comprehensively, give a reference to regional planning about city orientation, regional cooperation, function zone division, etc., and provide a research framework for other regions.

2. Materials and Methodologies

2.1. Study Area

The YRDUA, located in the east of China and mouth of the Yangtze River, is the most economically active and highly open region in China and one of the six largest urban agglomerations in the world. According to the YRDUA development plan approved by the Chinese government, it consists of 26 prefecture-level cities (Shanghai, 9 cities in Jiangsu Province, 8 cities in Zhejiang Province, and 8 cities in Anhui Province, see Figure 1) and covers an area of 211,700 km2, nearly 2.3% of China, with a contribution of approximately a quarter of the gross domestic product (GDP). Since the opening and reform, the demand for economic market development triggered city cooperation, which kicked off the integration of the YRDUA that is leading the economic growth in China. Simultaneously, the government always emphasizes the process of the YRDUA integration, with the issuing of a series of policies successively, among which is the recent 2019 “Outline of the Yangtze River Delta regional integration development plan”, which expounded the targets and requirements deeply. Among the area, Shanghai is the most developed city, an international megacity, and the engine of the region. Hangzhou, Nanjing, and Hefei are the respective capitals of Zhejiang, Jiangsu, and Anhui Province. As the latest to join the integrated process, Anhui Province shows slower economic development compared to other provinces, indicating the heterogeneity among the inner regions. So, we want to explore the in-depth interaction between different cities, to help promote the further benign development of the region.

2.2. Data Sources

The socio-economic data are from the Statistical Yearbook (2005–2019). The administrative boundaries data are from the Ministry of Natural Resources, China (http://bzdt.ch.mnr.gov.cn/ accessed on 14 December 2021). There are some explanations regarding the data: Chaohu City once was a prefectural city of Anhui Province before 2010, and then was separated into Hefei, Wuhu, and Maanshan City respectively owing to the administrative adjustment. Thus, the data before 2010 was processed in terms of the proportion and added to the above three cities because the collected data in the Statistical Yearbooks before 2010 has Chaohu City separately. Then, the very few missing data were supplemented by department consultation or interpolation method. What is more, we made a distinction between Tai’zhou (in Jiangsu Province) and Taizhou (in Zhejiang Province) to avoid duplication of the name.

2.3. Methods

2.3.1. The Muti-Dimension Evaluation

City networks are multiplex phenomena, and the degree of integration in a certain region often depends on the indicators used to measure it [10]. Moreover, the measurements of regional integration vary with the purpose, area, phase, and background in different literature. Thus, considering the process of regional integration is complex and multi-dimension, and the overall city-linkage characteristics we want to explore, we constructed the multi-dimension integrated evaluation system (Table 1). First, the internal driving force of integration must be social development, including the economy which is also the final pursuit of the whole region undoubtedly, and the vital accelerator knowledge and optimized industry that will boost the economy in the new developmental stage [30]. Factors such as flow capacity reveal the essence of regional integration of the social elements flowing freely and resources utilizing mutually [31]. Public service is one of the important social assurances a city provides [32], and also a vital indicator of the urban comprehensive strength [33]. The environment importance is the brand-new position of urban and regional development against the background of ecology civilization [34].
In summary, four dimensions are constructed to measure the linkage of city networks by reviewing the current literature and shedding light on the rich connotation or essential performance of regional integration. Actually, the “Outline of Regional Integration Development Plan in the Yangtze River Delta” orients that the Yangtze River Delta achieves essential development and make integration progress in the field of science and innovation industry, infrastructure, ecological environment, and public services by 2025 [35], which give the aforementioned evaluation dimensions.

2.3.2. The Improved Gravity Model

The gravity model was used to research city networks because it can simplify the complicated cities’ interactions in reality and is easy to operate, and we use the multi-dimension evaluation results to replace traditional single indicators representing the city scale such as GDP or population [15]. What is more, the traditional spatial distance of the city center cannot represent the real “distance” by anthropic influence. The per capita GDP gap was used by attempting to revise [25]; however, the occasion of similar per capita GDP may lead to the error of infinite gravity in the data process. To a large extent, the city interaction was appearing in the industry resources exchange such as labor flow, trans-city trade, company cooperation, and the head-branch-built enterprises across cities. Given this consideration, to enhance its suitability, the similarity index of industrial structure, which was proposed by the United Nations Industrial Development Organization in 1979 and then improved by Krugman [36] and broadly applied subsequently [37,38], was used to revise the gravity model. Additionally, cities that have similar industrial layouts have frequent flow of factors, i.e., close contacts and tight linkage.
Y m n = G S m × S n D m n
S = S 1 + S 2 + S 3 + S 4 4
K m n = 1 1 2 j n | I n d u s t r y m j I n d u s t r y n j |
Here, Y m n represents the mutual gravity value, i.e., the linkage between city m and n . G is the gravitational coefficient, D m n is the spatial distance between city m and n traditionally, which is replaced by the reciprocal similarity index of the industrial structure index K m n between cities. S is the comprehensive evaluation result from the aforementioned four dimensions, and the weight of each index is calculated by the entropy weight method.
R I m = T m 1 N T m
Referring to the literature [39], R I m is relative linkage, namely the interconnectivity to the whole region (0–1), R I = 1 means all the interactions are concentrated on one city code. R I = 0 means code m has no linkage to others and is isolated in the region. A network does not have a hierarchical structure when every node has an equal value of R I . T m is the total linkage of city m to other cities, i.e., the sum of Y m 1 , Y m 2 , …, Y m n . N is the total number of cities in a region.
To indicate the asymmetry linkage, the proportion of a city’s comprehensive score in the cities pair was used as the gravitational coefficient:
Y m n = S m S m + S n × S m × S n D m n

2.3.3. Social Network Analysis

The spatial relationship and organization feature of members in a network can be analyzed by the social network analysis (SNA) method that has already been applied in many research fields. SNA has a series of systematic spatial structure evaluation indicators [36,40], such as the whole network characteristics index including network density, network efficiency, network hierarchy, etc.; the individual network characteristics index including degree, closeness centrality, and betweenness centrality of nodes, etc., and structure analysis such as core-periphery division [41].

3. Results

3.1. The Evolution and Connection of Cities

The comprehensive score results are shown in Figure 2 after standardizing the indicators and adding up different dimensions by Formula (2). To quite a large extent, the score can stand for the city’s overall quality, and generally speaking, the higher the quality of the city, the stronger the ability to attract regional resources. From the perspective of a single dimension, a high score means that the city has a leading economic development, optimized industrial structure, a strong capacity for science and technology, and is bursting with innovation vitality, which can attract and accommodate the labor and enterprise through the good infrastructure and superior public services. Meanwhile, it can generate a positive space radiation effect and play the role of a regional accelerator, which indicates its important position in the urban agglomeration. Each line in Figure 2 represents the score of each city in the past 15 years, with 26 cities in total. Looking horizontally, the gap between the cities is quite big. Shanghai, as the biggest and most developed city in China, is ahead of any other city each year, with Hangzhou, Suzhou, Nanjing, Ningbo, Hefei, Wuxi, and other developed cities in the YRDUA following behind. The third gradient has Changzhou, Nantong, Yancheng, Yangzhou, Zhenjiang, Tai’zhou, Jiaxing, Huzhou, Shaoxing, Jinhua, Taizhou, and as for the final gradient, except for Zhoushan, others are all from Anhui Province. Vertically, the dynamic change of cities in the same gradient has similar trends. First of all, Shanghai has the maximum increase, showing nearly exponential growth in city quality in the past 15 years and becoming the growth pole of the YRDUA and the whole of China. Although the growth rate of the overall development level of several developed cities is lower than that of Shanghai, it is also large. Most cities show a fluctuating and rising state in the time series. The overall developmental speed of cities with the third gradient is lower than that of the above cities. From 2005 to 2019, their comprehensive scores increased relatively uniformly, and the overall urban status changed little. The increase of the tailed cities is very gentle, with the starting point almost consistent with the ending. These cities are probably in a weak position in the YRDUA, whose social resources may outflow and are attracted by other cities at the same time while enjoying the benefits of coordinated development of urban agglomerations because of the relatively poor ability to provide premium infrastructure and public service and retain population.
The preliminary clarification of different cities’ developmental patterns and dynamic growth in the YRDUA cannot reflect the interaction relationship between cities, so the linkage based on the gravity model was calculated by Formulas (1)–(3). Normally, the city pairs with higher qualities and more similar industry structures have a more frequent transfer of population, enterprise, labor, products, etc. And the gravity value will be larger, indicating closer connection and communication. Figure 3 shows the existing spatial pattern of city linkage in the YRDUA, with the following characteristics. (1) The overall city-linkage network of the YRDUA is compact and systematic, with the line of Shanghai–Hangzhou, Shanghai–Suzhou, and Shanghai–Nanjing as the primary axes, through which multiple linkage lines run. The social resources and factors of the node cities are flowing along the axes, and then the great externalities and spatial spillover effect were generated based on the point-axis theory. (2) The secondary close linkage was formed taking Nanjing, Hefei, Hangzhou, Ningbo, and Suzhou as the sub-centers, which are important node cities in the YRDUA. They can accept the radiation effect of Shanghai, and meanwhile play the space radiation function through the encrypted axes, which drive the development of surrounding small and medium-sized cities. (3) Generally, there exists a phenomenon of density in the east and sparsity in the west of the city linkage in the YRDUA, while cities in the west are mostly from Anhui Province. It seems that except for the capital city Hefei, other cities in Anhui Province are isolated in the network, with extremely weak linkage to others. Even the radiation range of the leading city of Shanghai is limited and difficult to cover those little cities which are ranking last in GDP and comprehensive strength in the region.
After the analysis of city-pair linkage, the node city linked to the whole regions was obtained by Formula (4), representing the connection to all the other cities in the YRDUA and the status in the regional integration (Figure 4). The connectivity of Shanghai is worthy of the highest ranking, owing to the intensive attraction of elements (human, products, capital, information flow, etc.) from the region. The next ranks are Suzhou and Hangzhou, and compared with the quality score, the interconnectivity of Suzhou is larger than Hangzhou, meaning the key position of the conduction function of Suzhou in the network. Tracing the cause, the geographical intermediation of Suzhou made it become an important hub. Moreover, Suzhou, as a large and famous industry city, has a well-developed industry chain, industry clusters, government support, etc., and thus has more interaction with middle-sized and small cities whose manufacturing industry entering Suzhou to enjoy the industrial resources and welfare of labor and skills afterward. In addition, the manufacturing industry heavily relies on transportation convenience. Hence, the centrality of geographical location and developed secondary industry complementarily make Suzhou a core and intermediary node of the YRDUA, which can connect both with Shanghai megacity and small cities below. As for Hangzhou, which is the second city in comprehensive quality, its linkage with Shanghai (0.52) is the highest value (and the lowest pair is Chizhou–Tongling 0.004) in the panel data. This is because the core industry of Hangzhou is a digital economy, and it connects closer with big cities (see Hangzhou–Shanghai 0.52 > Suzhou–Shanghai 0.43 and Hangzhou–Nanjing 0.23 > Suzhou–Nanjing 0.21), while Suzhou is closer with small cities (see Suzhou–Chuzhou 0.055 > Hangzhou–Chuzhou 0.047, Suzhou–Maanshan 0.050 > Hangzhou–Maanshan 0.044). What is more, the interconnectivity of Hefei City, whose city quality ranks the secondary gradient, however, is a bit lower than others. Shown by the gray block in Figure 4, the interconnectivity of the lowest 0–0.1 among the YRDUA and showing nearly no change in the time series, are most of Anhui Province’s cities, which keeps line with the results aforementioned and raises concerns about the risk of future development under the siphon effect during the regional integration.

3.2. The Structure of City Networks

Then, the city networks are constructed based on the linkage value by the SNA method, trying to give an in-depth and scientific explanation of city connections. In the research of network relationships, the setting of the threshold is key to the properties [42]. Referring to relevant studies [25,43], the linkage is lower than the average of the matrix (Ymn) and is regarded as quite weak and invalid, and others are valid. The network density was obtained as shown in Figure 5 (b), and the whole density is not high with the highest one being 0.308. It may be because eight cities in Anhui Province pull down the overall density by bringing invalid connections with most cities while enlarging the network scale greatly. Then the density is largely increased by the attempt of excluding Anhui Province (seeing Figure 5 (c)) as a new network, which confirms our conjecture.
The asymmetry of city linkage is ubiquitous, and the size and direction of factors flow are unequal between cities [44,45]. In this regard, the gravity coefficient is used to revise and characterize the asymmetry, seeing Formula (5). The network density and valid association giving the directional consideration are recalculated and seen in Figure 5 (a), Figure 5 (d). There are changes compared to Figure 5 (b), and the highest density and association are 0.292 and 190, respectively. From the time series, the directional network density and association appear the changes of increase, decrease, and fluctuating rise, with the overall improvement over a long period. During the past process of regional integration, also the rapid phase of urbanization of China, each city constantly adjusted its development orientation and optimized industrial structure, the relative relationship of city pairs was changing subtly against the alternation of competition and cooperation and the final pursuit of coordinated development. Additionally, there is a reduction considering the asymmetry compared to non-directionality, revealing that some linkages between cities are one-way streets, especially between big and small cities. The social resources are flowing to big cities, and the small cities cannot accept or further utilize the factors like population, technology, products, information, capital, etc., from big cities.
Taking the network relationship in 2019 as an example, the directional network structure is drawn and relevant evaluation indicators of nodes are calculated by UCINET as in Figure 6 and Table 2. The pointing of arrows represents the flow direction of factors, and it can be found that Shanghai, Suzhou, and Hangzhou accept the most associations (with the biggest indegree being 25, i.e., attracting from all cities), followed by Ningbo, Nanjing, Wuxi, and Hefei (range of 17–22). Jinhua, Shaoxing, Nantong, Tai’zhou, Changzhou, and Jiaxing can also accept some flows. The results of closeness centrality in the table give similar explanations of those nodes’ status, which expresses the more direct and efficient connection between cities with the smaller value. From the betweenness centrality that reflects the degree of one node controlling the connection with the other nodes, Suzhou is the top, which contacts both big and small cities, signifying its important conduction and control function in the region as analyzed above, playing the vital role in the spatial connection of the YRDUA. Several big cities have achieved bidirectional connections and exchange of resources, with advantageous elements complementing and close connections. However, cities of the outermost circle (with 0 indegree and betweenness) can be accepted by core cities but cannot accept resources from them, meaning no mutual communication has been realized. Those cities have relatively low comprehensive quality scores and are probably the fringe of the YRDUA.

3.3. Dynamic Simulation and Consistence with the Reality

This paper attempts to explore the dynamic spatial linkage characteristics in the sample time series, which can not only clarify the characteristics and questions of the YRDUA integration process further but also test the consistency with the real situation of Chinese urbanization under our research framework.
As shown in Figure 7, the spatial linkage was first established with the megacity Shanghai, which keeps in line with the real situation. Since the improvement of the market mechanism in China, local cities communicate, imitate, and exchange resources with the most open megacity, Shanghai, showing the economic rationality of profit-seeking. In addition, the Chinese government is devoted to gathering resources for the world-class city of Shanghai in time to enlarge the market and raise scale effects in order to develop the Chinese economy and improve its international influence. Developing the big city is one of the major features of Chinese urbanization [45], and caused many practical issues rooted in history, such as uneven city development and rural issues.
Nowadays the national competition platform has gradually become an urban agglomeration against the background of a global trend of regional integration, which the governments are aware of. So, the regional integration process is participated in by the Chinese government heavily, and the local government has played a vital role in promoting regional integration, such as promoting cross-administrative trade, building cross-provincial economic zones, and encouraging enterprises to open up cross-regional markets by increasing investment subsidies and decreasing tax rates [31,46], which greatly help formulate the current regional pattern. This can also be seen from a dynamic view in Figure 7, the early spatial linkage was built comparatively slow and the network is loose, while the connection increased rapidly later and then shows a gentle rise after a relatively complete network was established, which is close to the reality that the coordinated development and integration process of the YRDUA has made big progress since the government started to realize the necessity of cities cooperation and a series of regional planning was implemented.
Big cities gradually became the core nodes in the YRDUA and built spatial linkage after their strength grew enough. The spatial influence scope constantly expanded through the radiation with the core cities as nodes and drove the development of surrounding small cities. The overall network density increased and spatial linkage constantly became close to the dynamic evolution mechanism of connection of Shanghai to big cities, big cities to big cities, and big cities to small cities, thus shaping the firm network structure and improving the capacity of resisting the risk of the whole region and dynamically verifying the regional point-axis theory.
In addition, the spatial linkage spread from east to the west, but the western network is still sparser and shows a slow density increase over time. In reality, the western cities of Anhui Province are late to join the YRDUA from the national top-level planning, which is the dominant force to accommodate the factors of population and industry. In the future, those cities shall improve their own city quality, such as providing good public services by demolishing empty houses to increase the aesthetics and attraction and avoid marginalization [47].

4. Discussion

Much research has tried to evaluate the integration degree of urban agglomeration to assess its socio-economic effects yet it has not reached a consensus because the connotation of regional integration is considerably rich and evolving continuously. Whereas some attempts from the single dimension were made, for example, the relative price variance of products [48,49], the labor wage gap in the market [50], regional economic disparities [51], and the existence of qualitative policy implementation [52,53] have made progress because of its specialized and easy application. In particular, the relative price variance method is used quite frequently, about which scholars nearly have no dispute. However, it only measures the market integration whereas the regional integration involves the whole society and many dimensions, of which economic integration is an important part but not an equal sign. The characteristics of regional integration can be depicted by researching the cities’ relationships from a spatial organized structure that can date back to the traditional central place theory, which studied the hierarchy, the relationship between functions, and the regularity of the spatial structure of the urban system in a given region [54]. However, economic geography in an era of global competition poses a paradox [55]. The physical space is displayed by the flow space [9,56], these flows can be labor [57], knowledge [11], pollution emission [58], etc. This paper concentrates on the city itself, integrating these flows from multiple dimensions, which are also recognized as cities’ interaction aspects by the planning documents. The new city networks replace the traditional spatial structure, which consists of city nodes, with different developmental cities; city linkages, different city connections, and network space, with the respective orientations of cities in an integrated region. Under this framework (Figure 8), the integration characteristics and questions of the YRDUA were explored in the results, which respond to the situation of regional integration and call for the relevant reality needs.
What is more, except for the inner balance of the YRDUA, the middle and western urban agglomeration in China which are under the incubation stage should get enough attention, too. Additionally, the experience can be drawn upon from the YRDUA with the strategy suit for the local conditions at the same time. The vision of tomorrow is that the medium- and small-sized cities find the reasonable orientation through a characteristic development path, the big cities continue to play the role of radiation, and finally, shape the linkage from city–city to region–region and cooperation of cross-region, and that integrated regions grow synergistically and become the important and powerful tools and space units to participate in international competition. Combined with the urbanization history in China, it shall be considered from the total environment, such as the rural questions, the sustainable urban development issues, the imbalance of city development dilemma, etc.
As analyzed above, the research framework this paper poses is considerably consistent with the reality of the Chinese urbanization process and strategy, and the results can be explained from both theory and real situations. Compared to other assessments focusing on the single dimension (mainly market integration), we consider the multiple aspects of city interactions. Furthermore, the gravity model was modified, in which the previous research just used the physical distance or the error-prone GDP. We believe the framework can also be used to examine the integration characteristic of other regions, and the experiences of the YRDUA can be referenced by others to avoid some unnecessary development issues as they are in the startup stage in China.
However, this paper still has room to improve. The industrial structural index used to evaluate the distance in the gravity model, despite its enhanced applicability, does not express the city interaction always in one way in different phases of regional integration, some scholars argue that industrial isomorphism will cause a waste of resources, influence the efficiency of economic growth, and hinder the integration in the later stage [59]. In addition, the city networks do not totally fit the reality because it is hard to ignore the strong administrative force of Chinese governments, against which the factors flow tends to be frequent among the same province. For the former one, clarifying the resistance of the resource flows between cities in different integration stages can be a solvable avenue, and for the latter, strengthening city cooperation and cross-administrative governance are still strongly advised to advance regional development. In addition, although we consider the city interaction dimension comprehensively, we hope to distinguish the single dimension to further clarify the center of different functions in the region and rich the spatial structural characteristics of the YRDUA in the future. We look forward to deeply researching further macro and micro impacts on urban growth under regional integration.

5. Conclusions

The final pursuit of the regional integration is supposed to be all city members developing synergistically and achieving the Pareto optimality as the region gradually becomes the basic unit of policymaking and implementation due to its status as an accelerator for promoting domestic economic growth and platform of international competition. Exploring the spatial structure can help understand interaction relationships between cities and their orientations in a region. The city network, as a new and recognized paradigm of the spatial structure, was researched widely. Thus, city networks are constructed based on the improved gravity model and analyze the spatial structural characteristics deeply by the SNA method and dynamic study combined with specific time features of the regional integration process. The comprehensive dimensions of city interactions are evaluated from a literature review and real considerations. The YRDUA is selected as the sample area because of the consensus that it is a highly integrated city region. In addition, it indeed updates the regional plan in 2019, indicating the emphasis by governments. The results are:
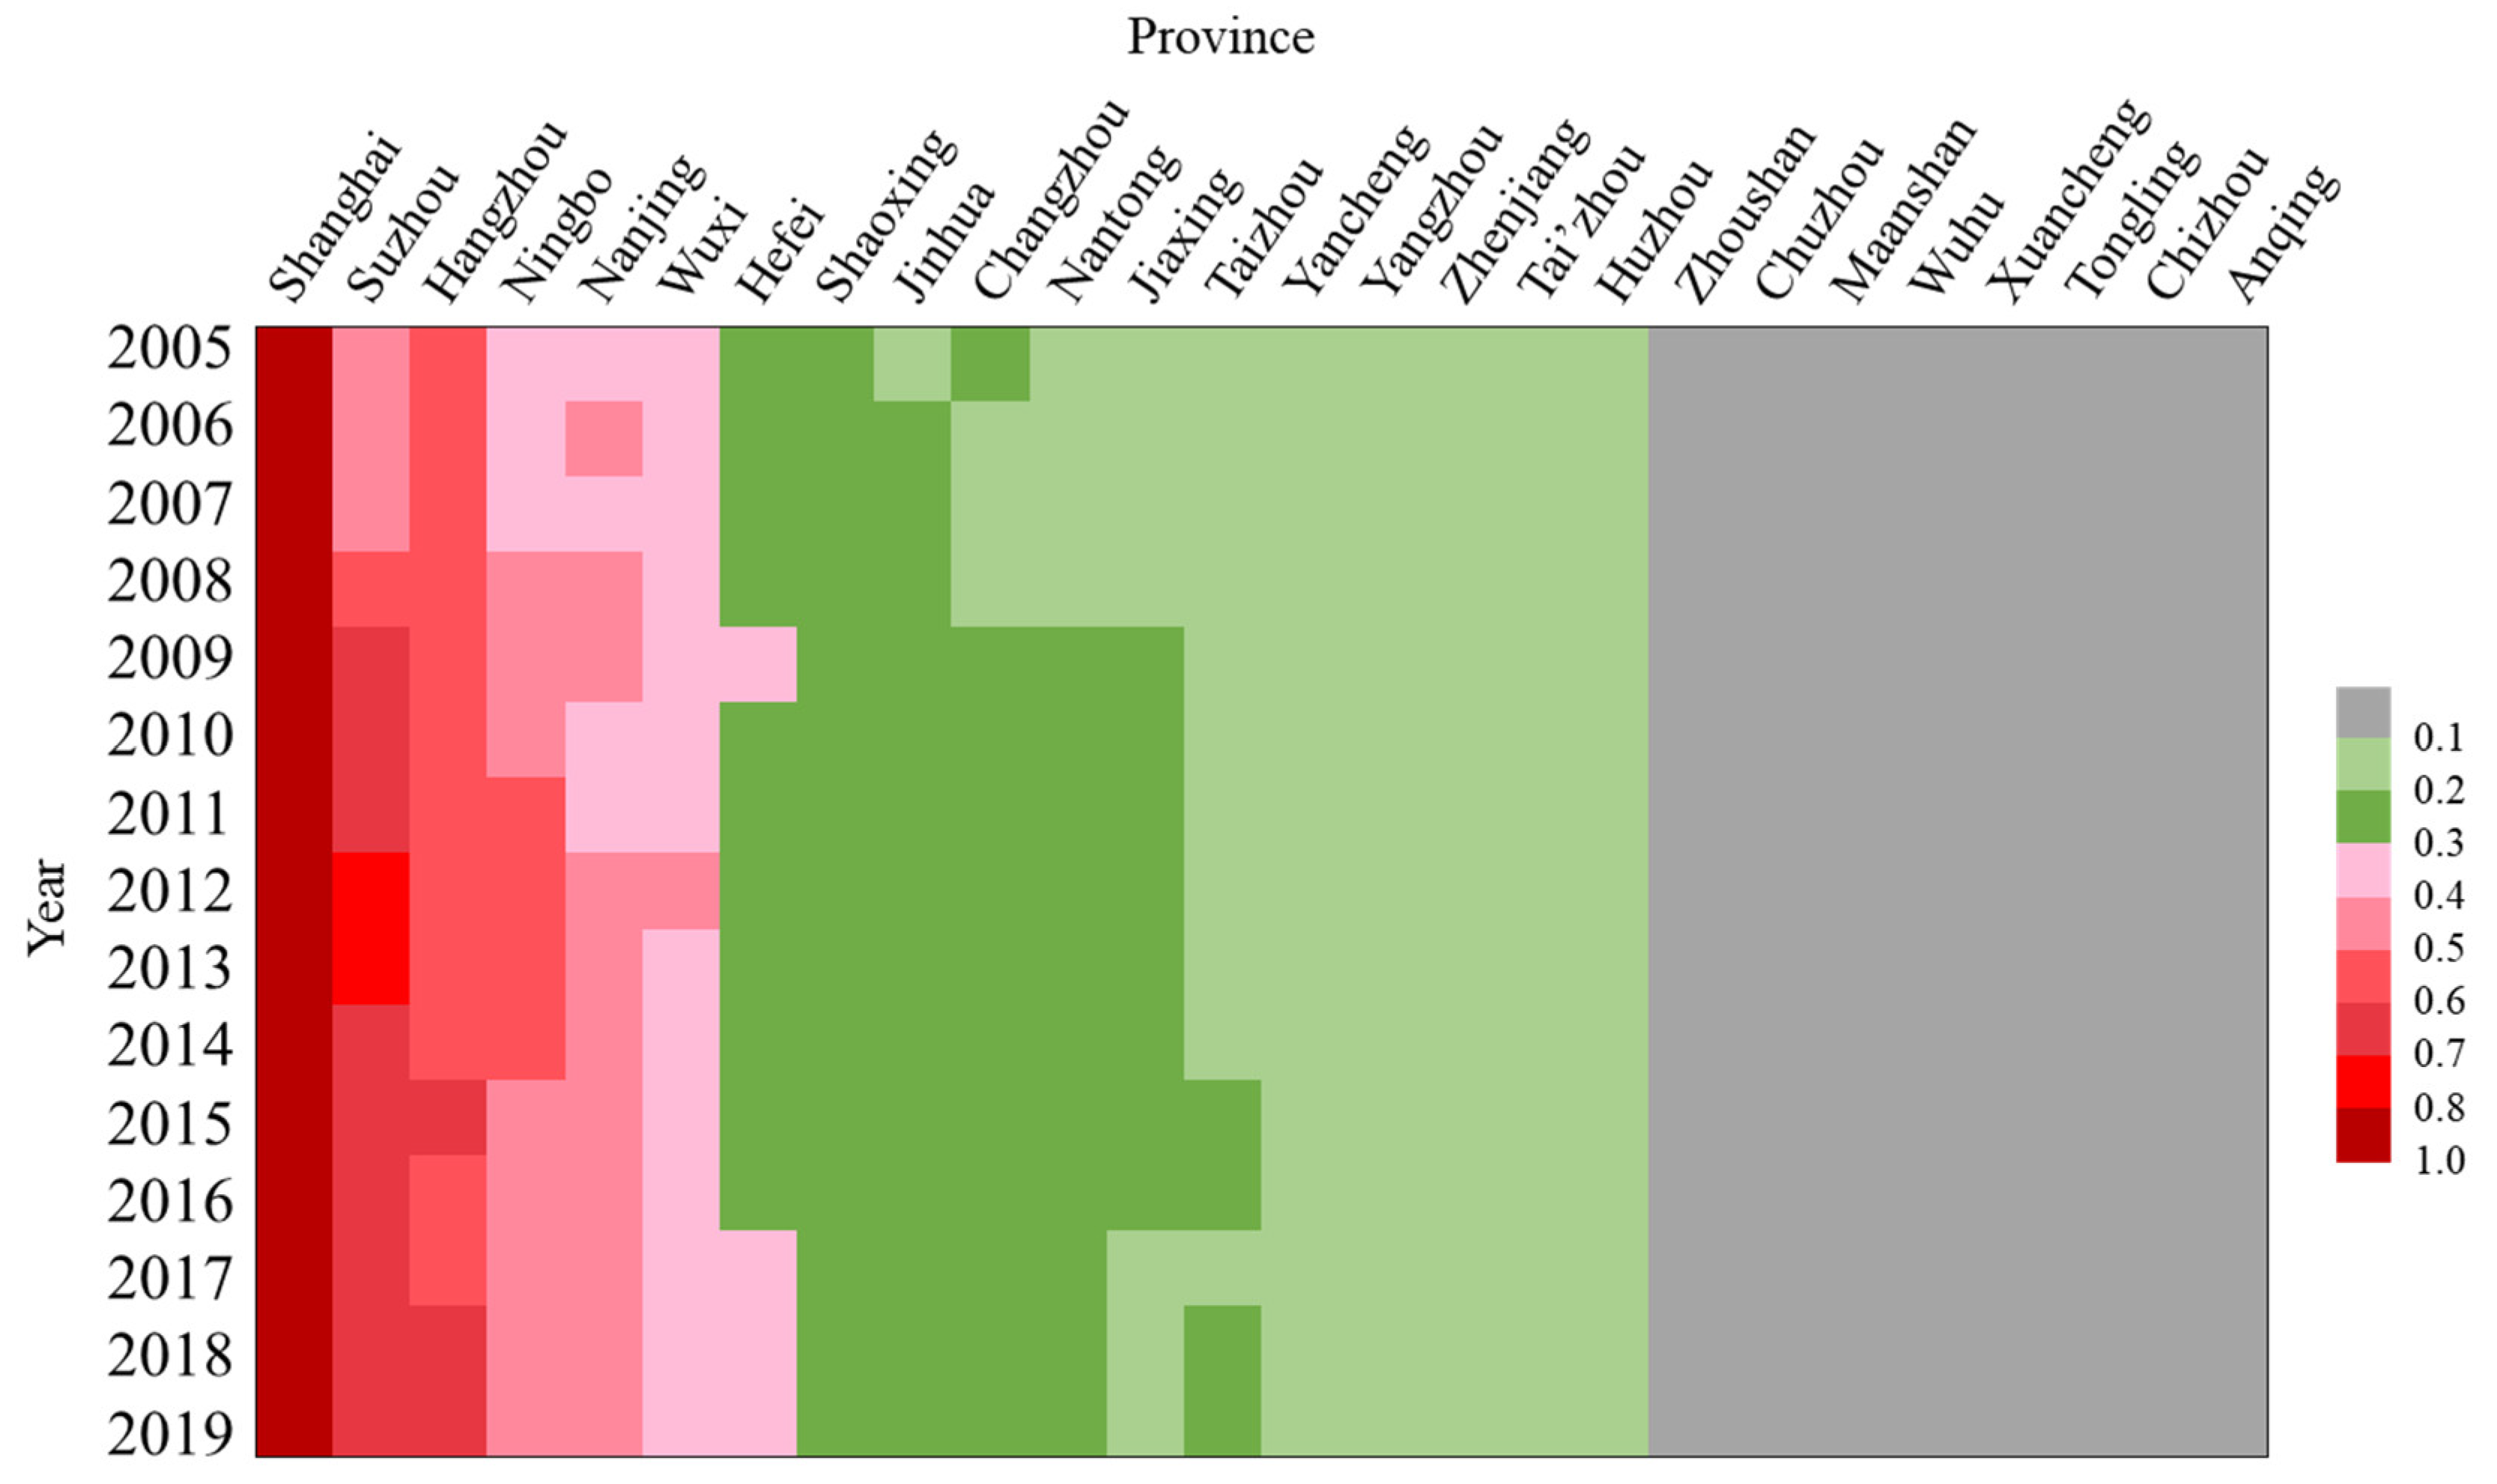
  • The characteristic of an imbalanced and uncoordinated developmental pace was shown in the process of synergetic development of cities in the YRDUA. Shanghai as a megacity and is far ahead of others, followed by Hangzhou and Suzhou. The more developed cities have a faster developmental speed whereas the weaker the city’s strength, the slower the growth of a city. Moreover, cities in the final gradient which rank last and increase slowest among the regions are mostly from Anhui Province, which is the last province to join the regional integration by national planning.
  • For city-pair linkage, the biggest is Shanghai–Hangzhou, then was the cross-connections between several big cities—Hangzhou, Suzhou, Nanjing, Ningbo, and Wuxi. For total interconnectivity to the whole region, Suzhou seems to locate in the core intermediary position and plays the important role of the hub node to connect cities of different levels and perform a conduction function in the YRDUA. The welfare of integration is generated by the transfer of a single center to a multicenter [60]. However, some small cities still do not show a good connection to the region.
  • The city-network density increases after the attempt of excluding Anhui Province, implying the latent hierarchy structure. Meanwhile, the density decreases after considering the directionality of factor flows. Mutual linkages are established to exchange and complement advantageous resources whereas some connections between big and small cities are one way, namely the outflow of social resources from the weak cities, which may easily get into the dilemma of attraction decrease and developmental bottleneck in the follow-up integration process unless there is a brand-new and reasonable orientation.
  • Combining Chinese specific urbanization background, administrative power is the important promotion of the current regional patterns. Although the overall level of the YRDUA is good, the imbalanced characteristic shows the network in the west is sparse and rising slowly, which is owing to the behavior of sparing no effort to gather resources and expand big cities by governments.
Hence, in the future, the small- and medium-sized cities should find reasonable orientation through a characteristic development path, especially under the reality that the hierarchical impact of the administrative organization imposed by the spatial organization of the Chinese state is still evident. Moreover, the attention of the central and west regions in China shall be paid to promoting cross-region growth and cooperation. Thus, there is a necessity for the improvement of the mechanism of regional integration from macro and micro aspects against the game of the central and local governments in the top-down administrative system.

Author Contributions

Conceptualization, D.S. and Y.C.; Data curation, D.S., X.F. and Q.W.; Formal analysis, D.S.; Methodology, D.S. and Q.W.; Software, D.S.; Supervision, Y.C.; Writing—original draft, D.S.; Writing—review & editing, D.S., X.F. and Y.C. All authors have read and agreed to the published version of the manuscript.

Funding

This research was funded by the National Social Science Fund of China (No. 20AGL025).

Data Availability Statement

The data used to support the findings of this study are available from the corresponding author upon request.

Conflicts of Interest

The authors declare no conflict of interest.

References

  1. The World Bank. World Development Report 2009: Reshaping Economic Geography; The World Bank: Washington DC, USA, 2009. [Google Scholar]
  2. Haas, E.B. Beyond the Nation-State: Functionalism and International Organization; Stanford University Press: Stanford, CA, USA, 1964. [Google Scholar]
  3. Wang, H. Comparative Regionalization: EU Model and East Asia’s Practice for Regional Integration. J. Glob. Policy Gov. 2013, 2, 245–253. [Google Scholar] [CrossRef] [Green Version]
  4. Herrmann-Pillath, C.; Libman, A.; Yu, X. Economic Integration in China: Politics and Culture. J. Comp. Econ. 2014, 42, 470–492. [Google Scholar] [CrossRef]
  5. Gottmann, J. Megalopolis: Or the urbanization of the northeastern seaboard. Econ. Geogr. 1957, 33, 189–200. [Google Scholar] [CrossRef]
  6. Brenner, N. New State Spaces: Urban Governance and the Rescaling of Statehood; Oxford University Press: Oxford, UK, 2004. [Google Scholar]
  7. He, J.H.; Li, C.; Yu, Y.; Liu, Y.L.; Huang, J.L. Measuring urban spatial interaction in Wuhan urban agglomeration, central China: A spatially explicit approach. Sustain. Cities Soc. 2017, 32, 569–583. [Google Scholar] [CrossRef]
  8. Cao, S.S.; Hu, D.Y.; Hu, Z.W.; Zhao, W.J.; Chen, S.S.; Yu, C. Comparison of spatial structures of urban agglomerations between the Beijing-Tianjin-Hebei and Boswash based on the subpixel-level impervious surface coverage product. J. Geogr. Sci. 2018, 28, 306–322. [Google Scholar] [CrossRef] [Green Version]
  9. Castells, M. The Rise of the Network Society; Social Science Literature Press: Beijing, China, 2001. [Google Scholar]
  10. Burger, M.J.; van der Knaap, B.; Wall, R.S. Polycentricity and the Multiplexity of Urban Networks. Eur. Plan. Stud. 2013, 22, 816–840. [Google Scholar] [CrossRef]
  11. Cao, Z.; Derudder, B.; Peng, Z.W. Comparing the physical, functional and knowledge integration of the Yangtze River Delta city-region through the lens of inter-city networks. Cities 2018, 82, 119–126. [Google Scholar] [CrossRef]
  12. Meijers, E.J. Polycentric urban regions and the quest for synergy: Ls a network of cities more than the sum of the parts? Urban Stud. 2005, 42, 765–781. [Google Scholar] [CrossRef]
  13. Dai, T.Q.; Jin, F.J.; Wang, J.E. Spatial Interaction and Network Structure Evolvement of Cities in Term of China’s Railway Passenger Flow in 1990s. Prog. Geogr. 2005, 24, 80–89. [Google Scholar]
  14. Yang, H.R.; Dobruszkes, F.; Wang, J.E.; Dijst, M.; Witte, P. Comparing China’s urban systems in high-speed railway and airline networks. J. Transp. Geogr. 2018, 68, 233–244. [Google Scholar] [CrossRef]
  15. Fang, D.C.; Sun, M.Y.; Business, S.O. The Reconstruction of the Spatial Structure of the Yangtze River Delta City Group in the High-speed Rail Era—Based on the Social Network Analysis. Econ. Geogr. 2015, 35, 50–56. [Google Scholar]
  16. Derudder, B.; Witlox, F. An appraisal of the use of airline data in assessing the world city network: A research note on data. Urban Stud. 2005, 42, 2371–2388. [Google Scholar] [CrossRef]
  17. Burns, M.C.; Cladera, J.R.; Bergadà, M.M. The spatial implications of the functional proximity deriving from air passenger flows between European metropolitan urban regions. GeoJournal 2008, 71, 37–52. [Google Scholar] [CrossRef] [Green Version]
  18. Lee, H.S. The networkability of cities in the international air passenger flows 1992–2004. J. Transp. Geogr. 2009, 17, 166–175. [Google Scholar] [CrossRef]
  19. Dunn, S.; Wilkinson, S.; Ford, A. Spatial structure and evolution of infrastructure networks. Sustain. Cities Soc. 2016, 27, 23–31. [Google Scholar] [CrossRef] [Green Version]
  20. Gan, C.; Voda, M.; Wang, K.; Chen, L.J.; Ye, J. Spatial network structure of the tourism economy in urban agglomeration: A social network analysis. J. Hosp. Tour. Manag. 2021, 47, 124–133. [Google Scholar] [CrossRef]
  21. Li, X.; Feng, D.; Li, J.; Zhang, Z. Research on the Spatial Network Characteristics and Synergetic Abatement Effect of the Carbon Emissions in Beijing–Tianjin–Hebei Urban Agglomeration. Sustainability 2019, 11, 1444. [Google Scholar] [CrossRef] [Green Version]
  22. Yin, J.; Zhen, F.; Wang, C.H. China’s city network pattern: An empirical analysis based on financial enterprises layout. Econ. Geogr. 2011, 31, 754–759. [Google Scholar]
  23. Manzoor, W.; Safdar, N.; Mahmood, H.Z. A gravity model analysis of international migration from BRIC to OECD countries using Poisson Pseudo-maximum likelihood Approach. Heliyon 2021, 7, e07357. [Google Scholar] [CrossRef]
  24. Zhang, Y.; Wu, Z. Research on the spatial association network structure for innovation efficiency of China’s new energy vehicle industry and its influencing factors. PLoS ONE 2021, 16, e0255516. [Google Scholar] [CrossRef]
  25. Chen, Z.; Sarkar, A.; Rahman, A.; Li, X.J.; Xia, X.L. Exploring the drivers of green agricultural development (GAD) in China: A spatial association network structure approaches. Land Use Policy 2022, 112, 105827. [Google Scholar] [CrossRef]
  26. Kratke, S.; Brandt, A. Knowledge networks as a regional development resource: A network analysis of the interlinks between scientific institutions and regional firms in the metropolitan region of Hanover, Germany. Eur. Plan. Stud. 2009, 17, 43–63. [Google Scholar] [CrossRef]
  27. Pflieger, G.; Rozenblat, C. Introduction. Urban Networks and Network Theory: The City as the Connector of Multiple Networks. Urban Stud. 2010, 47, 2723–2735. [Google Scholar] [CrossRef] [Green Version]
  28. Dejean, S. The role of distance and social networks in the geography of crowdfunding: Evidence from France. Reg. Stud. 2020, 54, 329–339. [Google Scholar] [CrossRef]
  29. Poyhonen, P. A Tentative Model for the Flows of Trade between Countries. Weltwirtschatftliches Arch. 1963, 90, 93–99. [Google Scholar]
  30. Doreian, P.; Conti, N. Social context, spatial structure and social network structure. Soc. Netw. 2012, 34, 32–46. [Google Scholar] [CrossRef]
  31. Zhejiang Daily. Integration, the Free Flow of Factors Is the Key. Available online: https://zj.zjol.com.cn/news.html?id=1343432 (accessed on 10 December 2019).
  32. Hou, X.H.; Liu, J.M.; Zhang, D.J.; Zhao, M.J.; Xia, C.Y. Impact of urbanization on the eco-efficiency of cultivated land utilization: A case study on the Yangtze River Economic Belt, China. J. Clean. Prod. 2019, 238, 117916. [Google Scholar] [CrossRef]
  33. Zhang, X.J. The Integration of Basic Public Services in the Yangtze River Delta: Logic, Goal and Promotion Path. Reform Econ. Syst. 2021, 01, 56–62. [Google Scholar]
  34. Zhou, Y.K.; Xi, Y.P. Civilization of New Citizen in the Process of Urbanization in China. Humanit. Soc. Sci. 2014, 1, 112–117. [Google Scholar]
  35. China Central Committee and the State Council. Outline of Regional Integration Development Plan in the Yangtze River Delta. Available online: http://www.gov.cn/zhengce/2019-12/01/content_5457442.htm (accessed on 1 December 2019).
  36. Krugman, P. Geography and Trade; MIT Press: Cambridge, MA, USA, 1991. [Google Scholar]
  37. Wang, Z.H.; Chen, C. Methods Measuring to the Same Structure of Manufacturing in Delta Area of Changjiang River—Analyzing Based on Time Serial Datum. Ind. Econ. Res. 2006, 4, 35–41. [Google Scholar]
  38. Fan, F.Z. An Improved Method of Measuring Industrial Structure Similarity Degree between Areas. J. Quant. Tech. Econ. 2013, 30, 98–115. [Google Scholar]
  39. Limtanakool, N.; Schwanen, T.; Dijst, M. Developments in the Dutch Urban System on the Basis of Flows. Reg. Stud. 2009, 43, 179–196. [Google Scholar] [CrossRef]
  40. de Paulo, A.F.; Porto, G.S. Solar energy technologies and open innovation: A study based on bibliometric and social network analysis. Energ Policy 2017, 108, 228–238. [Google Scholar] [CrossRef]
  41. Benítez-Andrades, J.A.; García-Rodríguez, I.; Benavides, C.; Alaiz-Moretón, H.; Gayo, J.E.L. An ontology-based multi-domain model in social network analysis: Experimental validation and case study. Inf. Sci. 2020, 540, 390–413. [Google Scholar] [CrossRef]
  42. Baggio, R. Weighted networks: The issue of dichotomization. Int. J. Tour. Sci. 2019, 19, 56–64. [Google Scholar] [CrossRef]
  43. Wang, Z.F.; Liu, Q.F.; Xu, J.H.; Fujiki, Y. Evolution characteristics of the spatial network structure of tourism efficiency in China: A province-level analysis. J. Destin. Mark. Manag. 2020, 18, 100509. [Google Scholar] [CrossRef]
  44. Ma, Y.; Xue, F.; Sun, W.; Li, M.Y. Analysis of urban network structure of the economic zone on the West Coast of the Taiwan Strait: A study through the lens of functional networks and innovation cooperation networks. Geogr. Res. 2019, 38, 3010–3024. [Google Scholar]
  45. Chen, M.; Xiang, K.H.; Chan, Z. Urbanization and urban system adjustment in China: A literature review. J. World Econ. 2011, 34, 3–25. [Google Scholar]
  46. Lu, M.; Li, P.F.; Zhong, H.Y. The New Era of Development and Balance: Spatial Political Economics of New China’s Regional Economy for 70 Years. Manag. World 2019, 35, 11–23. [Google Scholar]
  47. Glaeser, E. Triumph of The City; Shanghai Academy of Social Sciences Press: Shanghai, China, 2012. [Google Scholar]
  48. Zhang, K.; Shao, S.; Fan, S.Y. Market integration and environmental quality: Evidence from the Yangtze river delta region of China. J. Environ. Manag. 2020, 261, 110208. [Google Scholar] [CrossRef]
  49. Zhao, J.M.; Zhu, D.L.; Cheng, J.; Jiang, X.; Lun, F.; Zhang, Q. Does regional economic integration promote urban land use efficiency? Evidence from the Yangtze River Delta, China. Habitat Int. 2021, 116, 102404. [Google Scholar] [CrossRef]
  50. Chen, H.X.; Xi, Q.M. Study on Measurement and Determinants of Urban Labor Market Integration in Beijing Tianjin-Hebei Area. China Soft Sci. 2016, 02, 81–88. [Google Scholar]
  51. Shankar, R.; Shah, A. Bridging the Economic Divide Within Countries: A Scorecard on the Performance of Regional Policies in Reducing Regional Income Disparities. World Dev. 2003, 31, 1421–1441. [Google Scholar] [CrossRef]
  52. Li, H.; Lu, J. Can regional integration control transboundary water pollution? A test from the Yangtze River economic belt. Environ. Sci. Pollut. Res. 2020, 27, 28288–28305. [Google Scholar] [CrossRef]
  53. Li, L.; Ma, S.J.; Zheng, Y.L.; Xiao, X.Y. Integrated regional development: Comparison of urban agglomeration policies in China. Land Use Policy 2022, 114, 105939. [Google Scholar] [CrossRef]
  54. Christaller, W. Central Places in Southern Germany (Translated by Carlisle W. Baskin); Prentice Hall: Englewood Cliffs, NJ, USA, 1966. [Google Scholar]
  55. Porter, M.E. Clusters and the new economics of competition. Harv. Bus. Rev. 1998, 76, 77–90. [Google Scholar]
  56. Schwanen, T.; Dijst, M.; Kwan, M.P. Introduction—The Internet, Changing Mobilities, and Urban Dynamics. Urban Geogr. 2006, 27, 585–589. [Google Scholar] [CrossRef]
  57. Czaika, M.; Parsons, C.R. The Gravity of High-Skilled Migration Policies. Demography 2017, 54, 603–630. [Google Scholar] [CrossRef]
  58. Bai, C.Q.; Zhou, L.; Xia, M.L.; Feng, C. Analysis of the spatial association network structure of China’s transportation carbon emissions and its driving factors. J. Environ. Manag. 2020, 253, 109765. [Google Scholar] [CrossRef]
  59. Li, X.S.; Zhang, Y.D.; Sun, B.W. Does regional integration promote the efficiency of economic growth? an empirical analysis of the Yangtze River Economic Belt. China Popul. Resour. Environ. 2017, 27, 10–19. [Google Scholar]
  60. Meijers, E.; Hoogerbrugge, M.; Cardoso, R. Beyond polycentricity: Does stronger integration between cities in polycentric urban regions improve performance? Tijdschr. Voor Econo-Mische En Soc. Geogr. 2017, 109, 1–21. [Google Scholar] [CrossRef] [Green Version]
Figure 1. Location and cities of the YRDUA.
Land 11 00574 g001
Figure 2. Evaluation of cities’ comprehensive quality from 2005 to 2019 in the YRDUA.
Land 11 00574 g002
Figure 3. Cities’ spatial linkages in the YRDUA in 2019.
Land 11 00574 g003
Figure 4. The interconnectivity of cities in the YRDUA.
Land 11 00574 g004
Figure 5. The associations and densities of city networks in the YRDUA.
Land 11 00574 g005
Figure 6. The directional network structure of the YRDUA.
Land 11 00574 g006
Figure 7. The dynamic linkage of cities in the YRDUA.
Land 11 00574 g007
Figure 8. A simplified summarization map of this study.
Land 11 00574 g008
Table 1. Index system to construct city networks.
DimensionSub-DimensionIndicator
Social developmentEconomyPer capita GDP
IndustryThe proportion of the tertiary industry
KnowledgeNumber of patents authorized
Physical infrastructureFactor flow capacity of peoplePassenger transport by railway and airline
Factor flow capacity of goodsExpressway mileage
Public servicesHealth careThe number of hospital beds
Education careEducation expenditure
Social security careBasic endowment insurance for urban employees
Environmental importanceEnvironment careSewage treatment rate
Table 2. Individual index of city nodes in the YRDUA network.
CityOutdegreeIndegreeOutclosenessInclosenessBetweennessNO.
1125522523.963
Nanjing1122522815.965
Wuxi111852329.766
Changzhou7656440.008
Suzhou1225512536.961
Nantong7656440.008
Yancheng7055750.008
Yangzhou7055750.008
Zhenjiang7055750.008
Tai′zhou7055750.008
Hangzhou1125522523.963
Ningbo1222512825.962
Jiaxing7256480.008
Huzhou7055750.008
Shaoxing7656440.008
Jinhua7756430.008
Zhoushan4058750.008
Taizhou7656440.008
Hefei71756331.437
Chuzhou5057750.008
Maanshan5057750.008
Wuhu6056750.008
Xuancheng4058750.008
Tongling3059750.008
Chizhou3059750.008
Anqing5057750.008
Publisher’s Note: MDPI stays neutral with regard to jurisdictional claims in published maps and institutional affiliations.

