1. Introduction
The restoration of the natural environment and ecosystem in the reconstruction of earthquake areas is a long-term process. As the external manifestation of the natural environment and ecosystem, surface vegetation is the most important “indicator” [
1,
2,
3,
4]. The study of vegetation damage and restoration in the earthquake area is of great scientific significance for the restoration and reconstruction of the natural ecosystem in the disaster area, the construction of human settlements and the sustainable development of social economy. In this process, the remote sensing data show significant advantages due to its spatio-temporal continuity and regional coverage, which can effectively reveal the changes in vegetation restoration in the area [
5,
6] and has become the most effective data source for monitoring and analysis of vegetation coverage restoration [
7,
8,
9].
Scholars in China and abroad have conducted a great deal of research on the damage and restoration of vegetation after the earthquake using remote sensing data. Based on the remote sensing image data, Tian Yu et al. studied the damage to vegetation in the upper Minjiang River during the earthquake and the recovery of vegetation after the disaster [
10]; Li Jingzhong et al. used MODIS image data to determine the starting point of the Landsat data used in the evaluation of vegetation restoration after the disaster in the earthquake area, and they analyzed the dynamic restoration characteristics of the vegetation in the Longxi River after the disaster by incorporating the topographic factors of the Longxi River and the distances between related water system [
11]. Using a linear spectral hybrid model, Xu Jiceng et al. monitored the vegetation in the riparian zone of the Minjiang River valley after the Wenchuan earthquake, meanwhile solving the problem of image pixel mixing in images [
12]. Guo Changbao et al. mentioned in the study of the disaster distribution in western Sichuan that disaster occurrence and development were the main factors of vegetation destruction, and the vegetation coverage changed accordingly with the change in disaster density [
13]. Zhang Xiang et al. analyzed the characteristics of natural vegetation restoration in the core area of the Wenchuan epicenter and found that vegetation restoration was the core of post-earthquake soil and water conservation and ecological restoration and reconstruction in Wenchuan [
14]. Nan Ying et al. used remote sensing data technology to compare the abnormal changes in the normalized difference vegetation index (NDVI) value of the Landsat images before and after the Changbai Mountain wind disaster. They extracted the scope of the wind-damaged area and evaluated the degree of recovery of the wind-damaged area, and then analyzed the digital elevation model, soil map, hydrographic map and road map of the study area with the mean value of vegetation restoration in the wind-damaged area [
15]. For evaluating the restoration of farmland and forest vegetation in the disaster area within the research time frame, Zhao Dan et al. combined annual airborne high-resolution remote sensing image data, spaceborne remote sensing data and corresponding ground survey data to dynamically study and monitor the restoration of agricultural and forestry vegetation in the disaster area [
16]. In order to study the dynamic restoration status of vegetation in the three counties under the impact of the Wenchuan earthquake, i.e., Maoxian, Wenchuan and Dujiangyan, Hong Yan et al. used the corresponding remote sensing data to calculate the vegetation coverage of the three counties, and then further explored the temporal and spatial characteristics of vegetation restoration in this area by combining the topography and geomorphology, geological structure and other related influencing factors [
17]. The above-mentioned research has made useful explorations and important contributions in the monitoring and analysis of vegetation restoration after the earthquake. However, only few studies have analyzed vegetation damage and determined the starting point of vegetation restoration through time series data.
The “5.12” Wenchuan earthquake in 2008 was the most devastating and wide-ranging earthquake since the founding of the People’s Republic of China, which imposed a huge impact on towns and villages. The earthquake-induced secondary geological disasters such as mountain collapse, landslides and mudslides caused trees to break, fall and be buried in the disaster area, resulting in severe damage to the surface vegetation, a serious imbalance of the natural environment and ecosystem in the area and a large number of casualties and economic losses [
18,
19,
20,
21]. On account of this, the dynamic monitoring of vegetation damage caused by earthquakes and vegetation restoration in the following years requires a rigorous and scientific evaluation. Since there are certain rules for the succession and recovery of vegetation ecosystems, people can predict the future recovery trend of vegetation as long as they grasp these rules, and then provide reasonable suggestions for the recovery of ecosystems and natural vegetation in the disaster area after the earthquake [
22]. Therefore, using multi-temporal remote sensing data as an entry point to study the spatial and temporal processes and characteristics of post-disaster vegetation recovery in the earthquake area for nearly a decade has significant advantages.
2. Materials and Methods
2.1. Studied Cases
This paper selected the counties which were most severely affected by the Wenchuan earthquake as the research objects, including Wenchuan, Beichuan, Mianzhu, Shifang, Qingchuan, Maoxian, Anxian, Dujiangyan, Pingwu and Pengzhou. The ten counties in the Wenchuan earthquake’s core area are located in the transition zone between the northwestern part of the Sichuan Basin and the eastern part of the Hengduan Mountains. They are located at 102°49′–105°38′ east longitude and 30°45′–33°03′ north latitude, with a total area of 26,410 hectares (
Figure 1). It shows a 45°strip distribution from Qingchuan County in the northeast to Dujiangyan City in the southwest, with the longest distance being about 350 km between the two ends. The study area has a large elevation span, with the elevation gradually transitioning from 446 m in hilly ridges to 5273 m in alpine plateau. The area has a large elevation span and topography, and the landform types are rich and diverse, mainly mountainous, belonging to the Minshan and Qionglai mountain series. The climate is a typical subtropical humid monsoon climate, influenced by mountains and hills, showing a regular vertical distribution with altitude changes.
The rocks in the Wenchuan earthquake zone are mainly shallow metamorphic rocks, including clastic rocks, kilometer rocks and slates. The lithology of these rocks is fragile, and it is one of the main materials for landslides and debris flows [
23]. During the earthquake, some areas suffered from heavy rainfall, such as Mianyang, Mianzhu and Dujiangyan, causing large-scale landslides and mudslides, mainly in areas such as the Yingxiu-Beichuan Fracture Zone and Houshan Fracture Zone, which were distributed in bands and lines. The earthquake caused serious damage to the local ecosystem. According to the survey statistics, the damage to vegetation caused by mudslides and landslides reached 1152.49 km
2, accounting for 4.36% of the total area of the extremely hard-hit areas [
24].
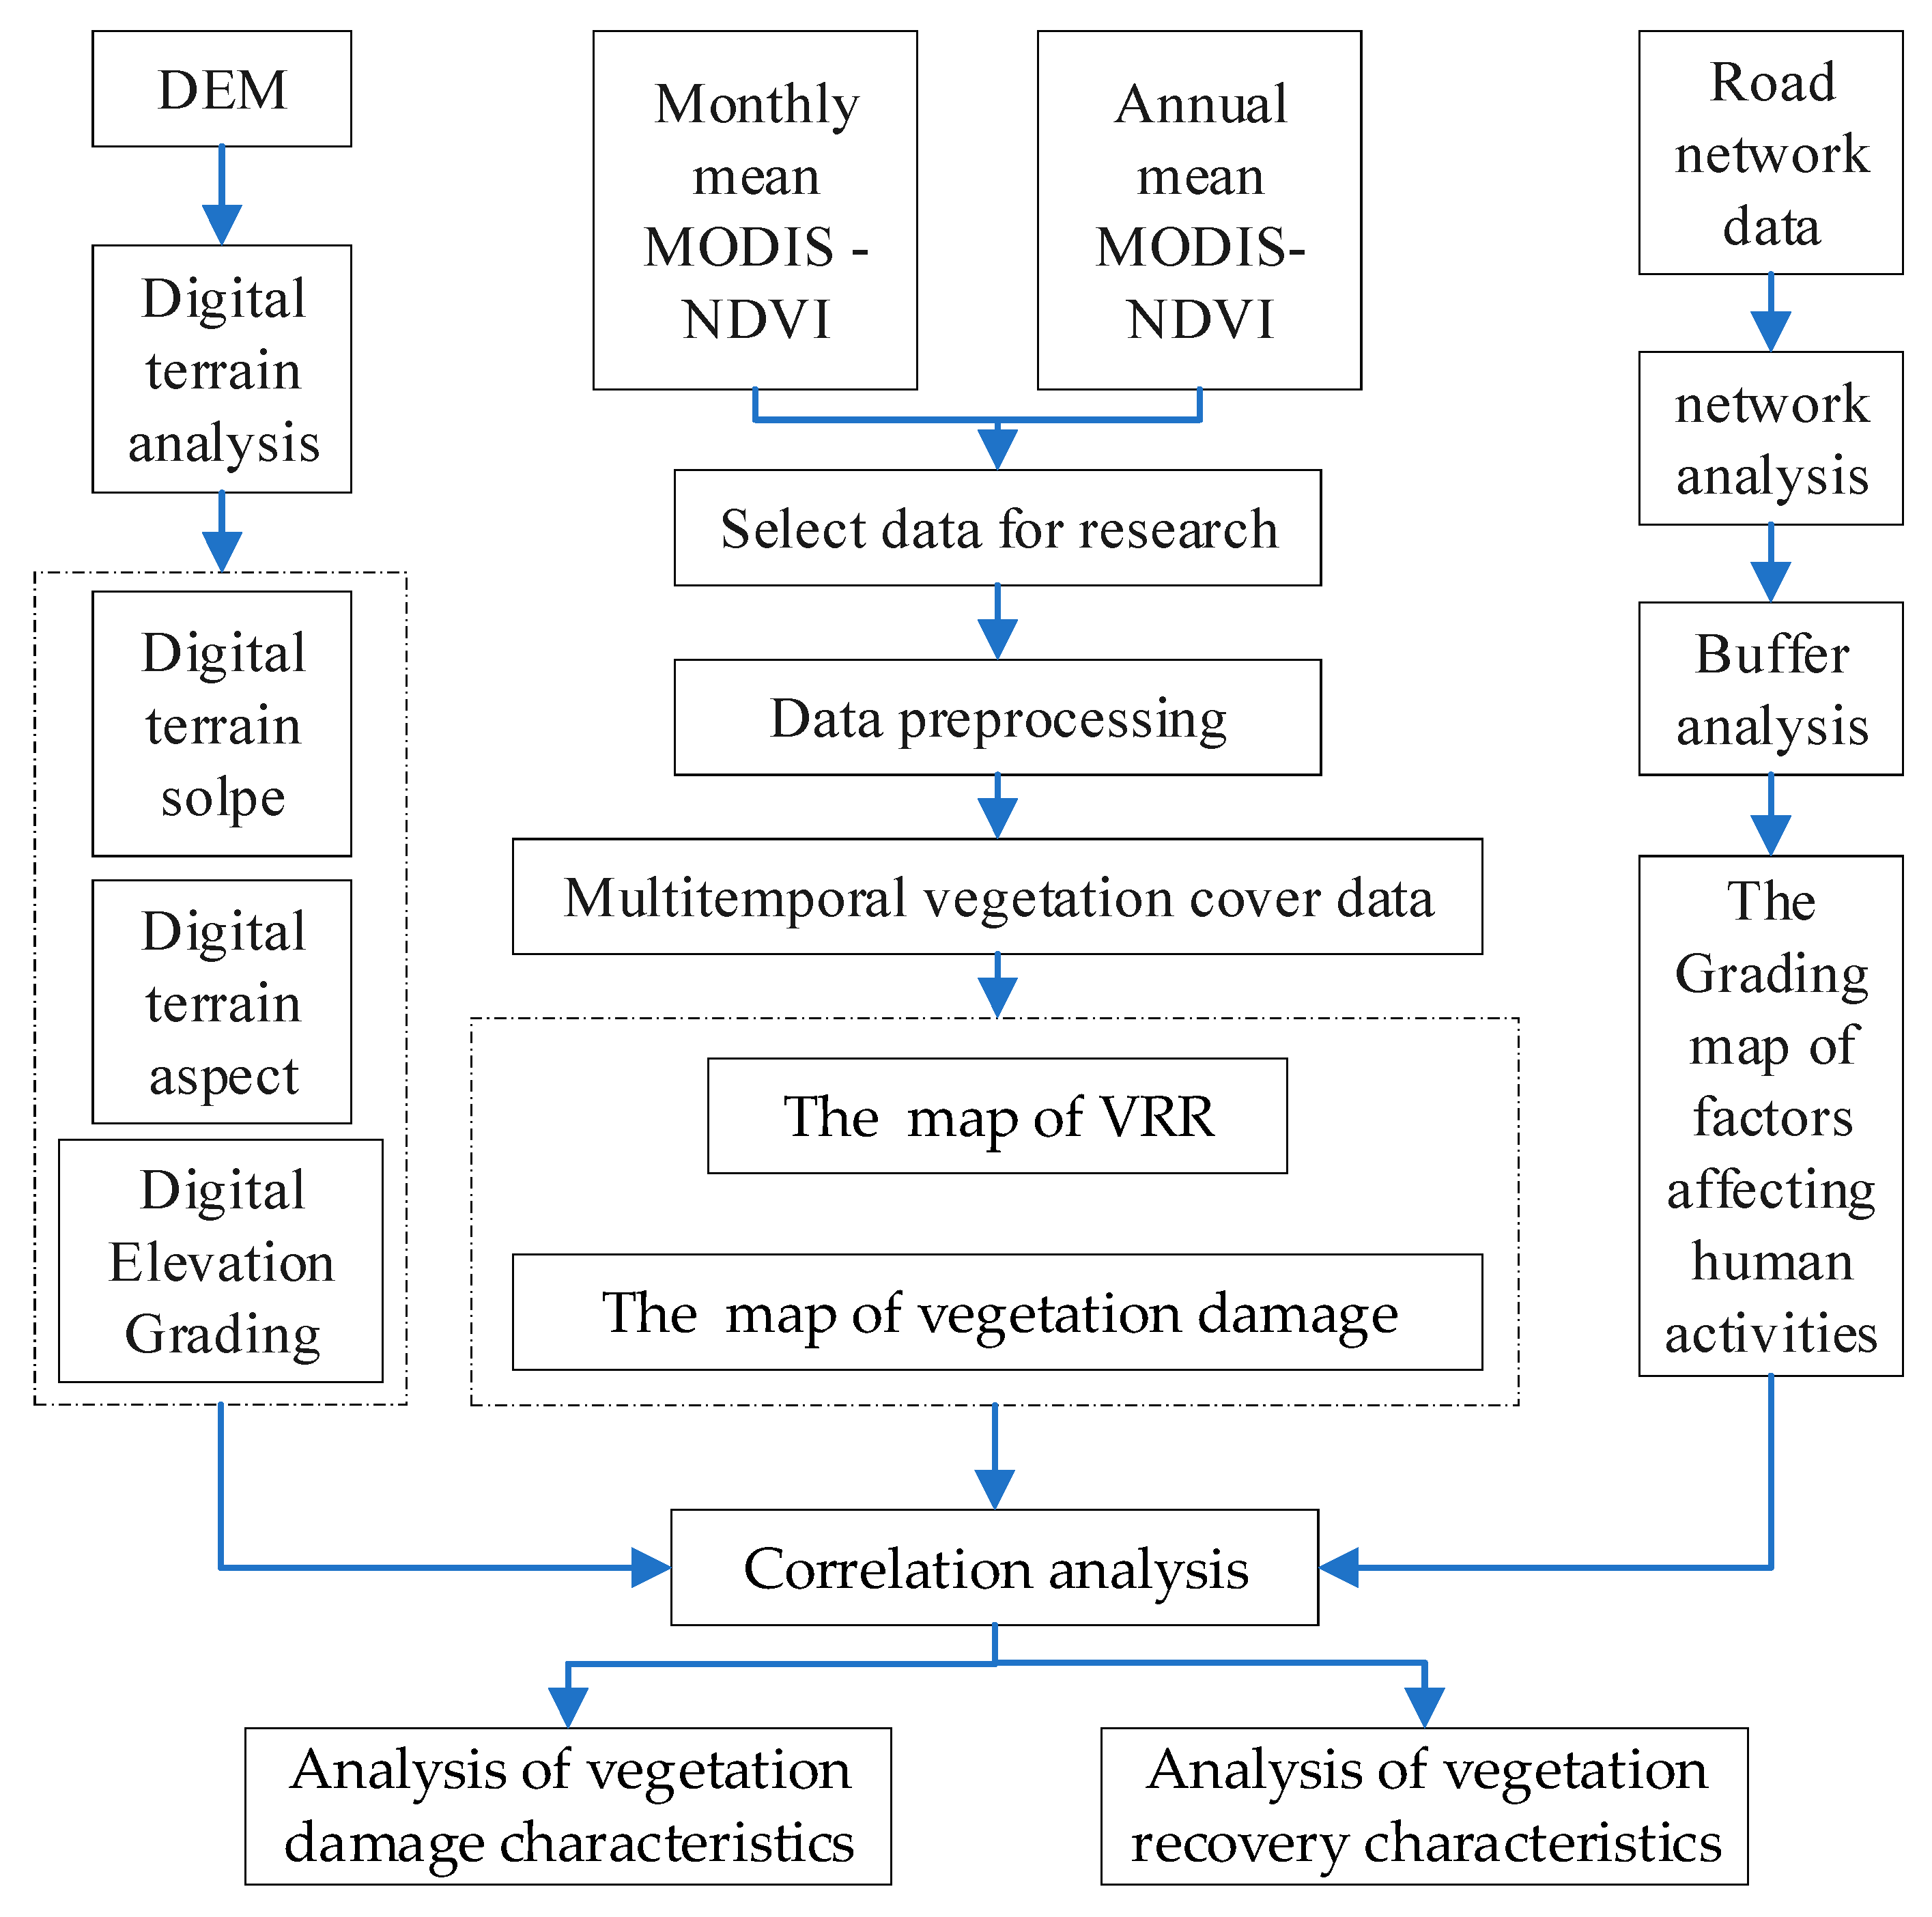
2.2. The Flowchart of Research
The software tools including ERDAS, ENVI, ArcGIS, etc., were used to process and analyze MODIS remote sensing image data. We deeply analyzed and discussed the damage and restoration characteristics of vegetation in the study area from 2007 to 2018, aiming to provide a theoretical basis for the restoration of ecological vegetation and the construction of human settlements in the disaster area. The flowchart is shown in
Figure 2.
2.3. Data Sources and Processing
The data in the article are: (1) MODIS data. This data was used to calculate vegetation damage and restoration (
Figure 3). To avoid the influence of clouds, the 16-day average data from 2007 to 2018 were selected. The data source is the National Aeronautics and Space Administration (
https://lads-web.modaps.eosdis.nasa.gov, 20 March 2020). (2) Digital elevation model data (DEM), used to analyze topographic factors in GIS. To ensure accuracy, the DEM data of Sichuan Province were aligned and cropped with reference to the political map of Sichuan Province. The data source is the geospatial data cloud platform (
http://www.gscloud.cn, 20 March 2020). (3) Supporting data includes the topographic factor analysis data of the study area and the distance map of the towns in the study area. The urban residential areas are the land-use data of 2005 from the Resource and Environment Science and Data Center (
www.resdc.cn, 20 March 2020), which was partially revised in combination with Landsat in 2008; the road data is the digitization of the traffic map of Sichuan Province in 2008.
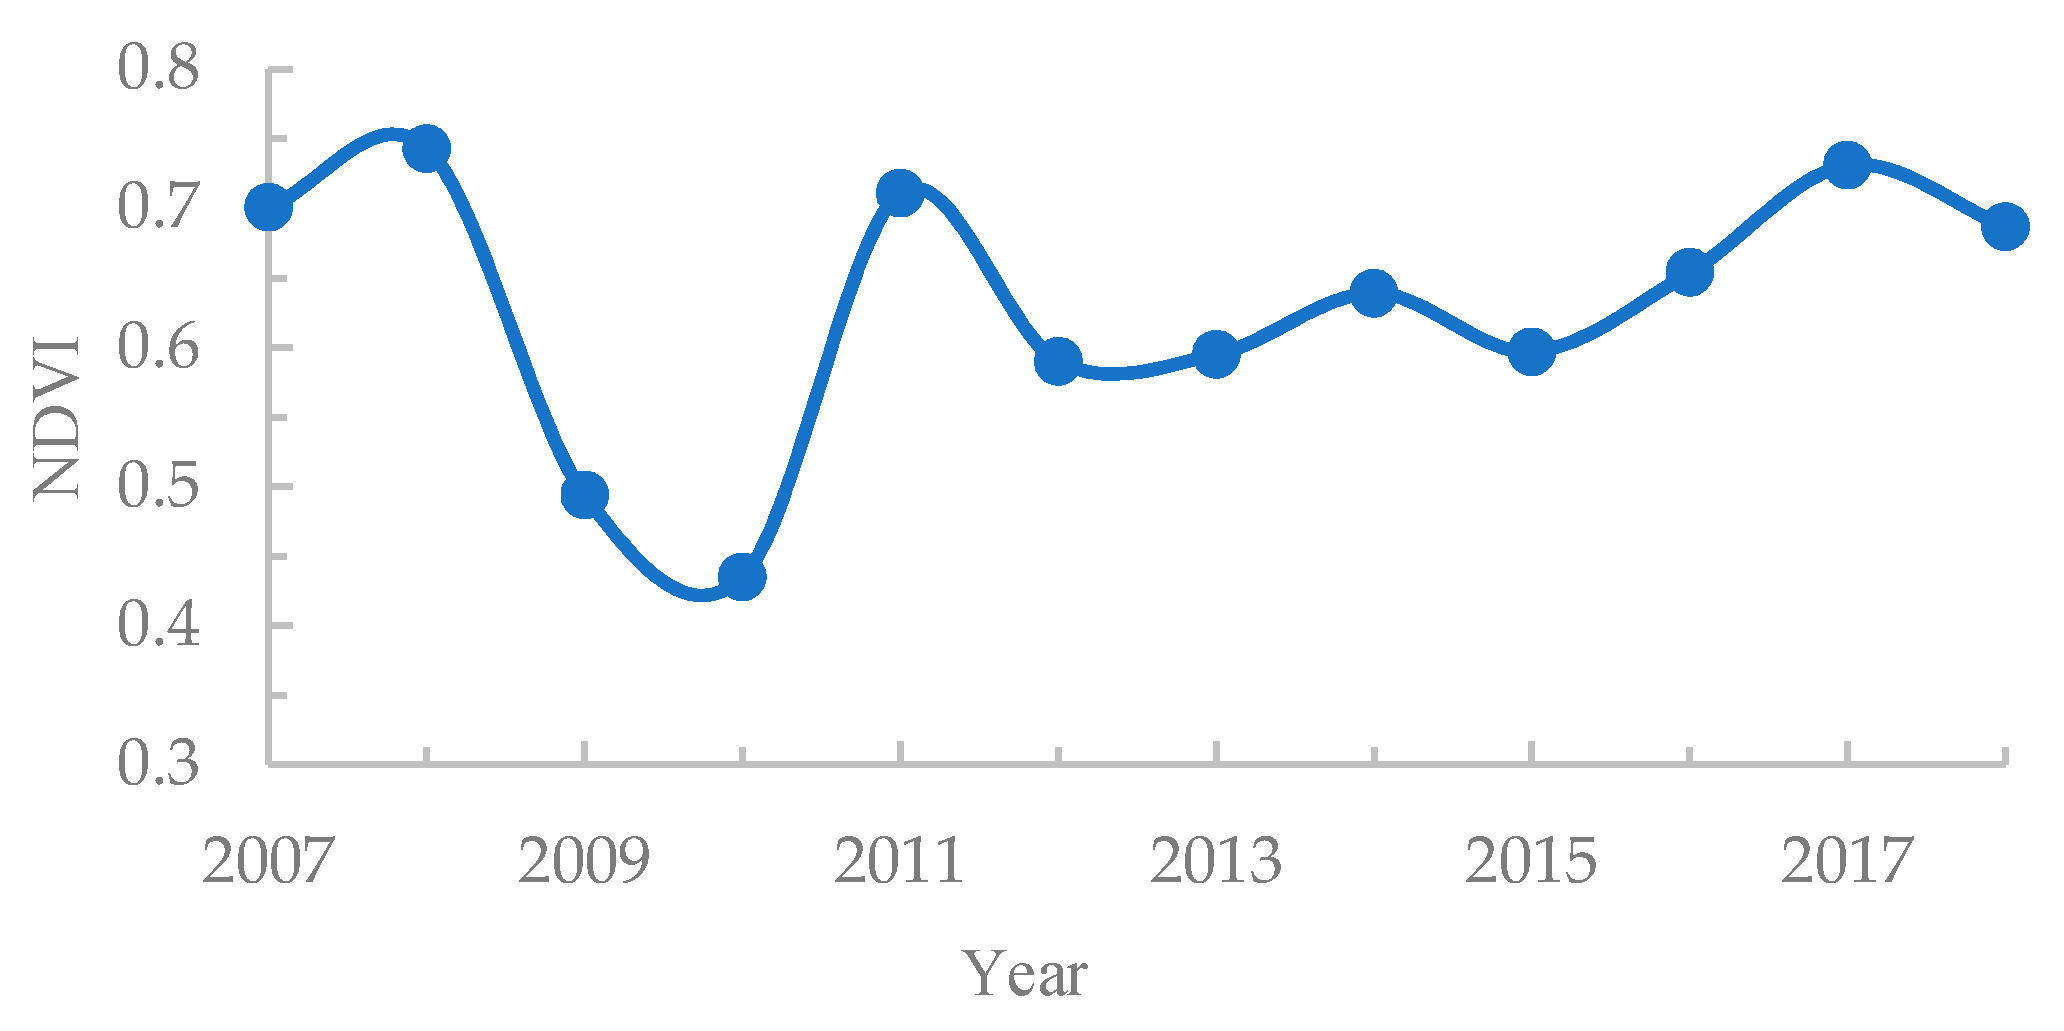
ENVI software was used to project the time series data image of MOD13Q1.h26v05 (WGS_1984_World_Mercator), calculate the mean value of NDVI interannual change, and conduct qualitative and quantitative statistical analysis. Since the MODIS data downloaded from NASA according to the rank number h26v05 contained the required NDVI data for the research, it was necessary to subset the data according to the boundary based on the terrain factor analysis. The required data were drawn into a map in ArcGIS, and then a line map was obtained based on the NDVI value from 2007 to 2018 (
Figure 4). The results show that after the earthquake, the greatest damage to the vegetation in the core area of the earthquake was not observed in 2008 but was delayed until 2010. Therefore, the phenomenon of lagged vegetation response needs to be considered in the evaluation analysis.
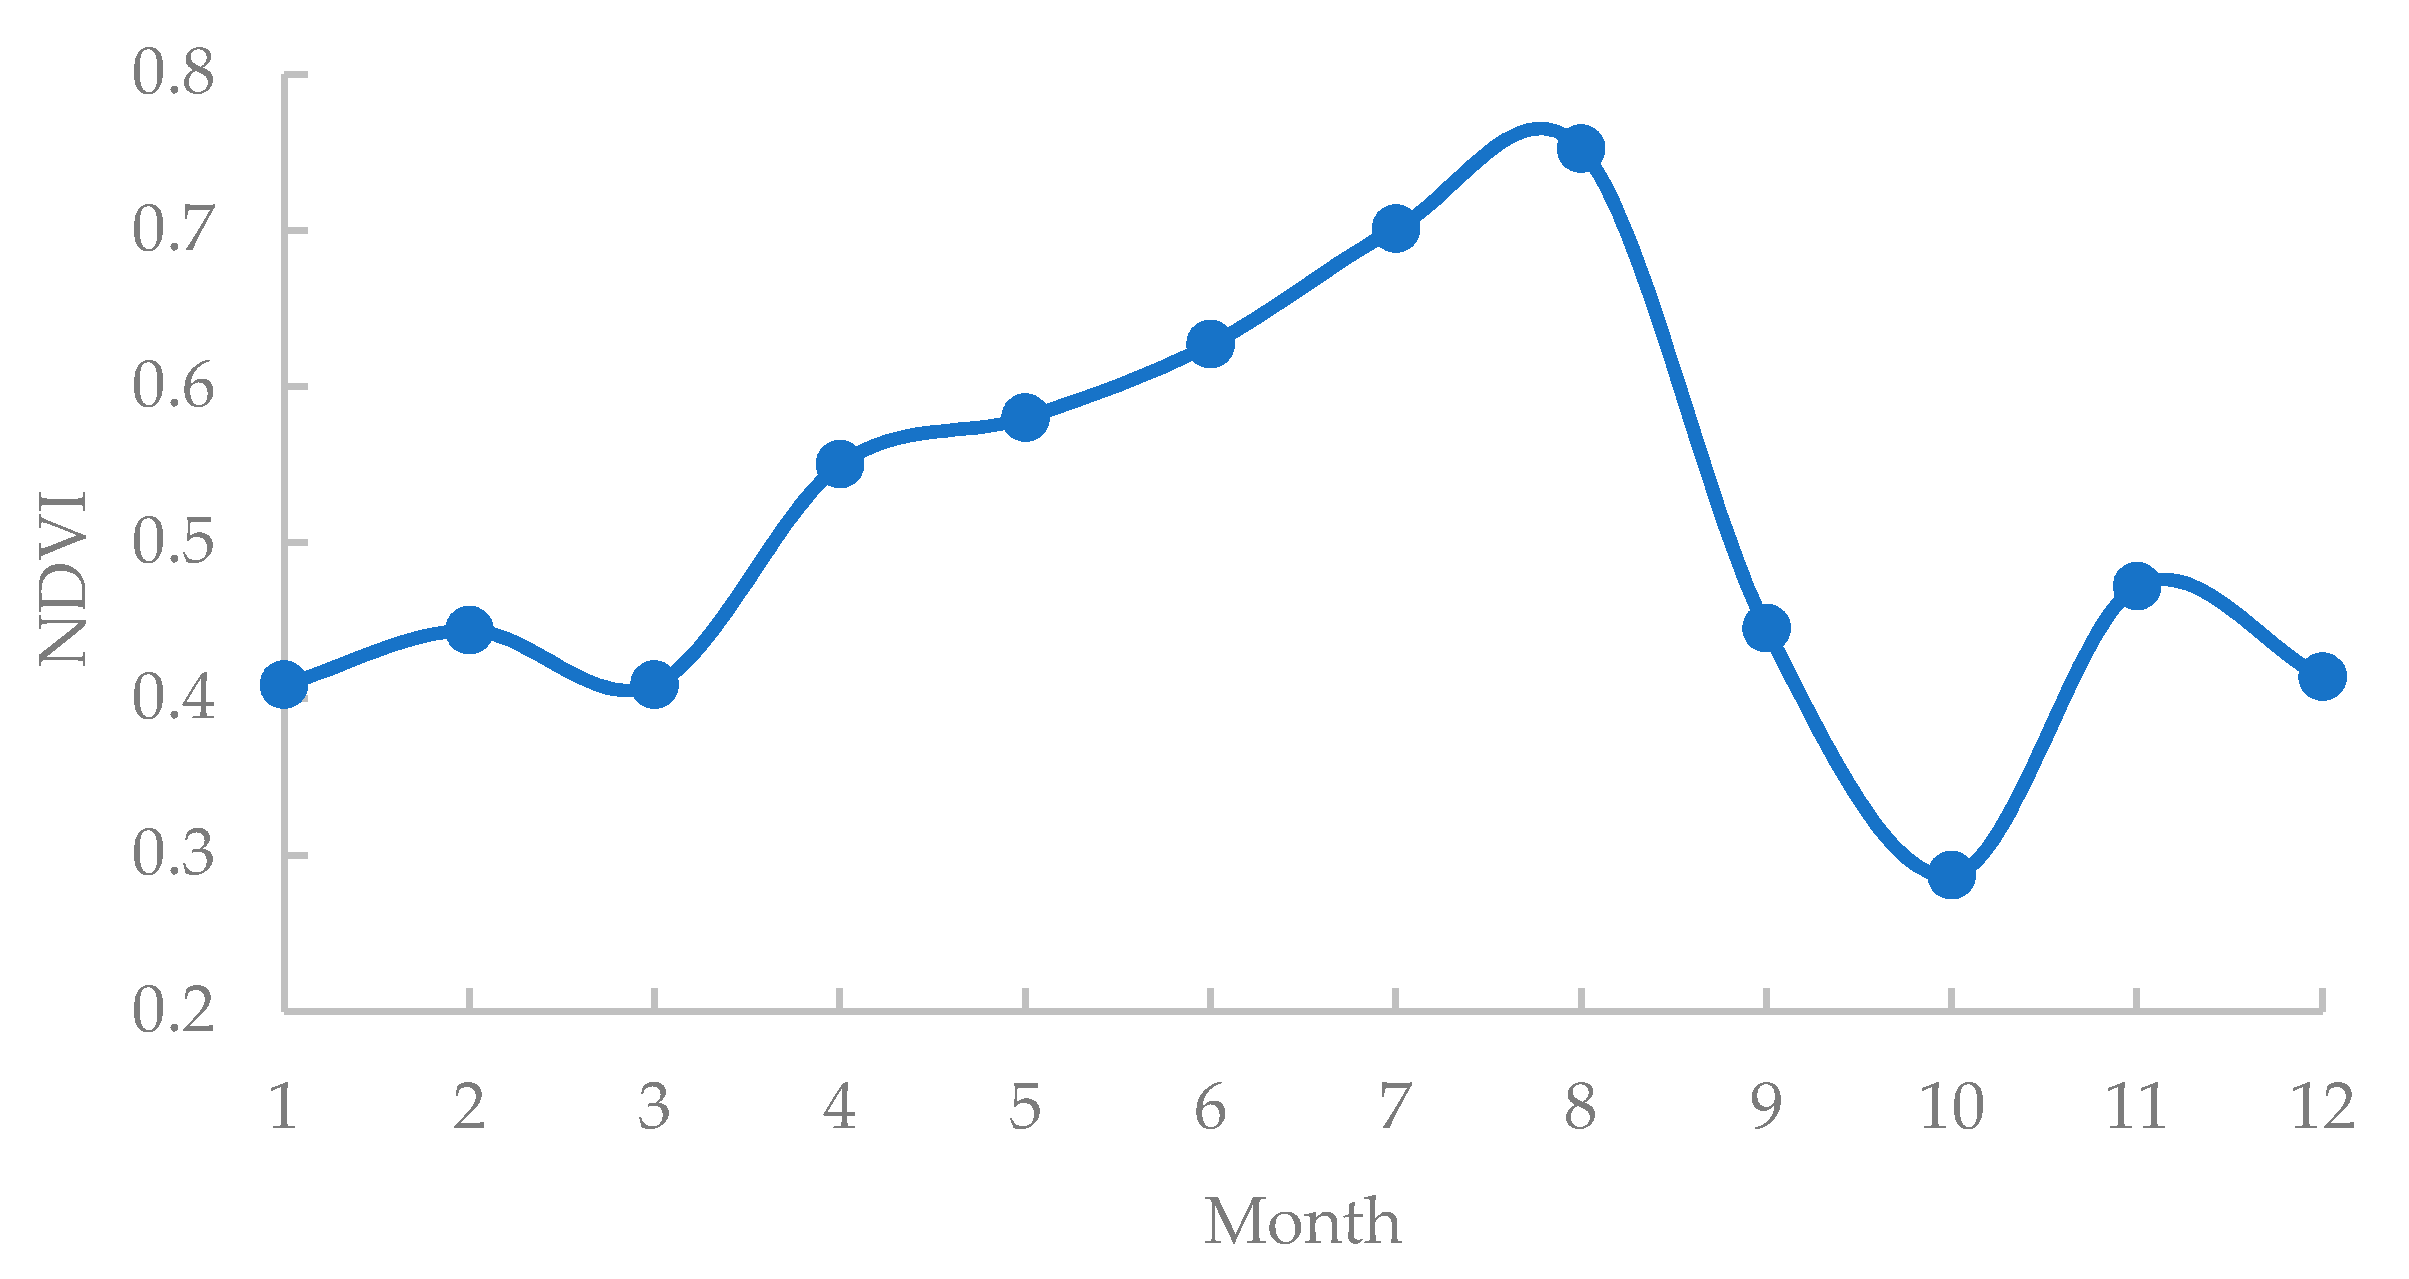
MODIS data of the study area for the whole year of 2007 were selected. After boundary cropping, projection and calculation of monthly average NDVI values, the distribution of monthly average NDVI values in the study area (
Figure 5) and the curve of monthly average changes (
Figure 6) were obtained. From
Figure 6, the monthly average value of NDVI in the study area showed an upward trend from January to August and reached the maximum in August; then, it gradually decreased starting from September, reaching the lowest in October; subsequently, it began to increase again slowly. Therefore, the NDVI value in the study area is the largest during August, which is the most luxuriant stage of vegetation green features and is a better time to extract vegetation features from remote sensing data.
According to the annual average value of MODIS-NDVI and a monthly average value of MODIS-NDVI in the study area, as well as the cloud cover of the study area’s images, we determined to use the MOD13Q1.h26v05 data products on 5 August 2007, 21 August 2007, 5 August 2010, 21 August 2010, 5 August 2018 and 21 August 2018 as the basis for research on vegetation coverage and analysis of vegetation recovery rate. Besides, ENVI was used to preprocess the required data products.
2.4. Methodology
2.4.1. Extraction and Estimation Method of Vegetation Cover
This article mainly studied the damage of forest vegetation in the core area of the epicenter and the dynamic monitoring of vegetation restoration after the disaster. The damaged vegetation mainly resulted from geological disasters and some secondary disasters caused by earthquakes. First, the MODIS13Q1 image data products before and after the earthquakes in 2007 and 2008 were, respectively, extracted and processed in a processing software, and then through band calculation and spatial overlay analysis, the damaged vegetation information in the study area was obtained [
25]. The vegetation index used in this study was the normalized difference vegetation index (NDVI), which is an effective parameter for evaluating vegetation coverage and vegetation status, and an effective indicator for monitoring global vegetation and ecological environment transformation [
6,
26]. NDVI is calculated by the reflectance of the near-infrared light band and the red-light band, and the range value is between −1 and 1. ρ refers to the reflectance [
27]; the calculation equation of NDVI is as follows:
Fractional vegetation coverage (FVC) is a dynamic variable reflecting the ecological functions of vegetation, and it is used to monitor environmental degradation and vegetation restoration. Moreover, vegetation coverage is also an important parameter to describe vegetation quality and reflect changes in the ecological environment. Meanwhile, vegetation coverage is also an important characterization factor for remote sensing monitoring, plant photosynthesis, ground evaporation and heat dissipation. Vegetation coverage has been widely used in human settlement evaluation, ecological effect evaluation and land use [
28,
29,
30,
31]. The extraction of vegetation coverage based on NDVI is based on the pixel binary model, and the calculation formula is as follows:
where NDVI
soil refers to the vegetation index of the bare soil area without vegetation coverage, which can usually be considered as the minimum value of the vegetation index (not equal to 0); NDVI
veg refers to the vegetation index of the area completely covered by vegetation, which can usually be considered as the maximum value of the vegetation index. The vegetation coverage is in the range of 0 to 1. Generally, NDVI
soil and NDVI
veg do not change much between different regions. NDVI
soil and NDVI
veg are determined according to the remote sensing images, and then the confidence interval was taken to select the relevant values of bare soil vegetation index and complete the vegetation index. In this study, the cumulative percentages of 5% and 95% of NDVI were used as bare soil pure pixels and vegetation pure pixels to calculate vegetation coverage, respectively.
2.4.2. Information Extraction of Damaged Vegetation
According to related research, the secondary disasters induced by the earthquake have caused significant damage to the vegetation. The quantitative expression for the degree of vegetation damage is described by a model based on the difference in NDVI before and after the earthquake. The calculation equation is as follows:
where NDVI
2007 is the NDVI value of the vegetation damaged area before the earthquake, NDVI
2008 is the NDVI value of the vegetation damaged area after the earthquake and NDVI
damage is the vegetation damage degree of the vegetation damaged area before and after the earthquake. The higher the value, the more serious the damage [
32]. We selected the NDVI images before and after the Wenchuan earthquake in 2007 and 12 May 2008 in the disaster area to conduct pixel-by-pixel band calculation according to Equation (3). Then, we obtained the image map of vegetation damage in the Wenchuan earthquake’s core area.
3. Results
3.1. Analysis of Vegetation Damage Characteristics
Based on the image map of vegetation damage in the Wenchuan earthquake’s core area (
Figure 7), the degree of vegetation damage and spatial distribution characteristics were obtained. After the Wenchuan earthquake, the degree of vegetation damage in disaster-stricken areas such as Wenchuan, Maoxian, Pingwu and Beichuan was relatively high, with the highest degree of vegetation damage reaching 0.96. The degree of vegetation damage in other areas was relatively low. In the following parts, the characteristics of vegetation damage in terms of elevation, slope, aspect and human activities impactis analyzed.
3.1.1. Elevation Characteristics of Vegetation Damage
According to the topographic features, combined with related factors such as climate, precipitation and temperature in the core area of the Wenchuan earthquake, the unified analysis was conducted. The elevation of the study area was classified according to 100-m intervals, the average value of NDVI of vegetation damaged within 100 m intervals was calculated and then the relationship between the average value of damaged NDVI of vegetation and the elevation was obtained (
Figure 8). According to the statistical results, there was an excellent quadratic polynomial relationship between vegetation damage and elevation (R
2 = 0.86), and the correlation expression equation is as follows:
The statistical results show that vegetation damage characteristics had a strong correlation with elevation changes. It showed parabolic characteristics in the range of 400–5300 m, with the maximum value in the elevation range of 3200 m. In the elevation range of 400–3200 m, as the elevation increased, vegetation damage gradually increased, showing a positive linear correlation with the elevation, and the value of R2 reached 0.96. At the interval of 3200–5300 m, the vegetation damage gradually decreased with the increase in the elevation, showing a negative linear correlation with the elevation, and the value of R2 reached 0.97.
3.1.2. Slope Characteristics of Vegetation Damage
Based on the slope map extracted from DEM data in the study area, combined with the actual situation, the slope was graded at intervals of 3° and overlaid with vegetation damage images for statistical analysis. From the results of slope classification and grading, the relationship between vegetation damage and slope (
Figure 9) was obtained. We found there was a quadratic polynomial relationship between slope and vegetation damage (R
2 = 0.83). The correlation expression is as follows:
According to the statistical results in
Figure 8, vegetation damage strongly correlates with slope changes, showing a parabolic characteristic overall, with the maximum value at a slope of about 42°. In the slope ranges of 0–15° and 54–78°, the NDVI value of vegetation damage was less than 0.1. The terrain of the area with a slope of less than 15° was relatively flat, and the impact of the earthquake on the vegetation damage was relatively low. In the slope range of 54–78°, the terrain was steep, and the soil moisture fertility could easily cause soil erosion, so the vegetation in this area was sparsely distributed. The damage to the vegetation in the area was relatively low. Especially in the areas with slopes greater than 63°, the earthquake had almost no impact on vegetation damage. In the slope range of 15–54°, as the slope increased, the damaged vegetation first increased and then decreased, reaching the maximum value at around 42°, and the NDVI values were distributed in the interval of 0.10–0.15. In this slope range, the terrain changes were involved, but the temperature and precipitation in this area were suitable for the growth of vegetation, and the vegetation was denser. The landslides and mudslides caused by the earthquake resulted in severe damage to the vegetation in the area. Thus, in this area, the earthquake had the most significant impact on vegetation.
3.1.3. Aspect Characteristics of Vegetation Damage
Considering the influence of sunlight on vegetation distribution, the aspect was divided into eight grades with an interval of 45°, and then the aspect was superimposed with the vegetation damage data to obtain the statistical results of vegetation damage (
Figure 10). In general, there was little difference in vegetation damage in each aspect, and the NDVI value was in the range of 0.1–0.12. In shady slope areas (0–45° and 315–360°), the NDVI value of damaged vegetation was relatively large, above 0.115. In semi-shady slope areas (45–90° and 270–315°), the NDVI value of damaged vegetation was lower than that of shady slope areas but higher than that of semi-sunny areas, and the NDVI value was in the range of 0.112–0.113. In the sunny slope and semi-sunny slope area (90–270°), the NDVI value of vegetation damage was relatively small, and its value was in the range of 0.111–0.112. In general, there was little difference in vegetation damage caused by earthquakes in different aspects. The vegetation damage in the shady and semi-shady slope areas was slightly greater than that in the sunny and semi-sunny slope areas.
3.1.4. Characteristics of Vegetation Damage in Areas with Intensive Human Activities
Human activities are mainly concentrated in urban residential areas and road areas, where the vegetation is greatly affected by the interference of human activities, and the vegetation is less distributed and relatively fragile. In the urban residential areas and road areas in the study area, multi-level buffer analysis was carried out according to the separation distance of 1 km, and the vegetation damage map was superimposed for statistical analysis. Then, the statistical data of vegetation damage at different distances from areas with intense human activities were obtained. We found there was a good negative correlation (R
2 = 0.92) between the vegetation damage and the distance from areas with intense human activities, and the equation is as follows:
The statistical results show that vegetation in areas with intense human activities was easily affected by natural disasters such as earthquakes. With the diminishing impact of human activities, the degree of damage to vegetation gradually decreased. In general, in the areas close to strong human activities, the vegetation is more disturbed by human activities, less stable and vulnerable to direct damage in natural disasters such as earthquakes.
3.2. Analysis of Vegetation Recovery Characteristics
NDVI is widely used to extract vegetation coverage features in a certain area [
32,
33,
34,
35,
36,
37]. Based on NDVI, vegetation recovery rate (VRR) was used to quantitatively analyze vegetation damage [
38]. VRR can be calculated as follows:
where NDVI
0 refers to the image before the earthquake, NDVI
1 refers to the image shortly after the earthquake and NDVI
2 refers to the remote sensing image during the vegetation recovery period. VRR < 0 means that the vegetation coverage during the monitoring period is worse than the vegetation coverage when the earthquake happened, that is, the vegetation continues to degenerate after the earthquake damage; if VRR is between 0 and 1, the vegetation coverage during the monitoring period gradually recovers but does not reach the level before the earthquake. VRR > 1 indicates that the vegetation coverage during the monitoring period has exceeded the level of vegetation coverage before the earthquake [
32].
In this paper, NDVI
0, NDVI
1 and NDVI
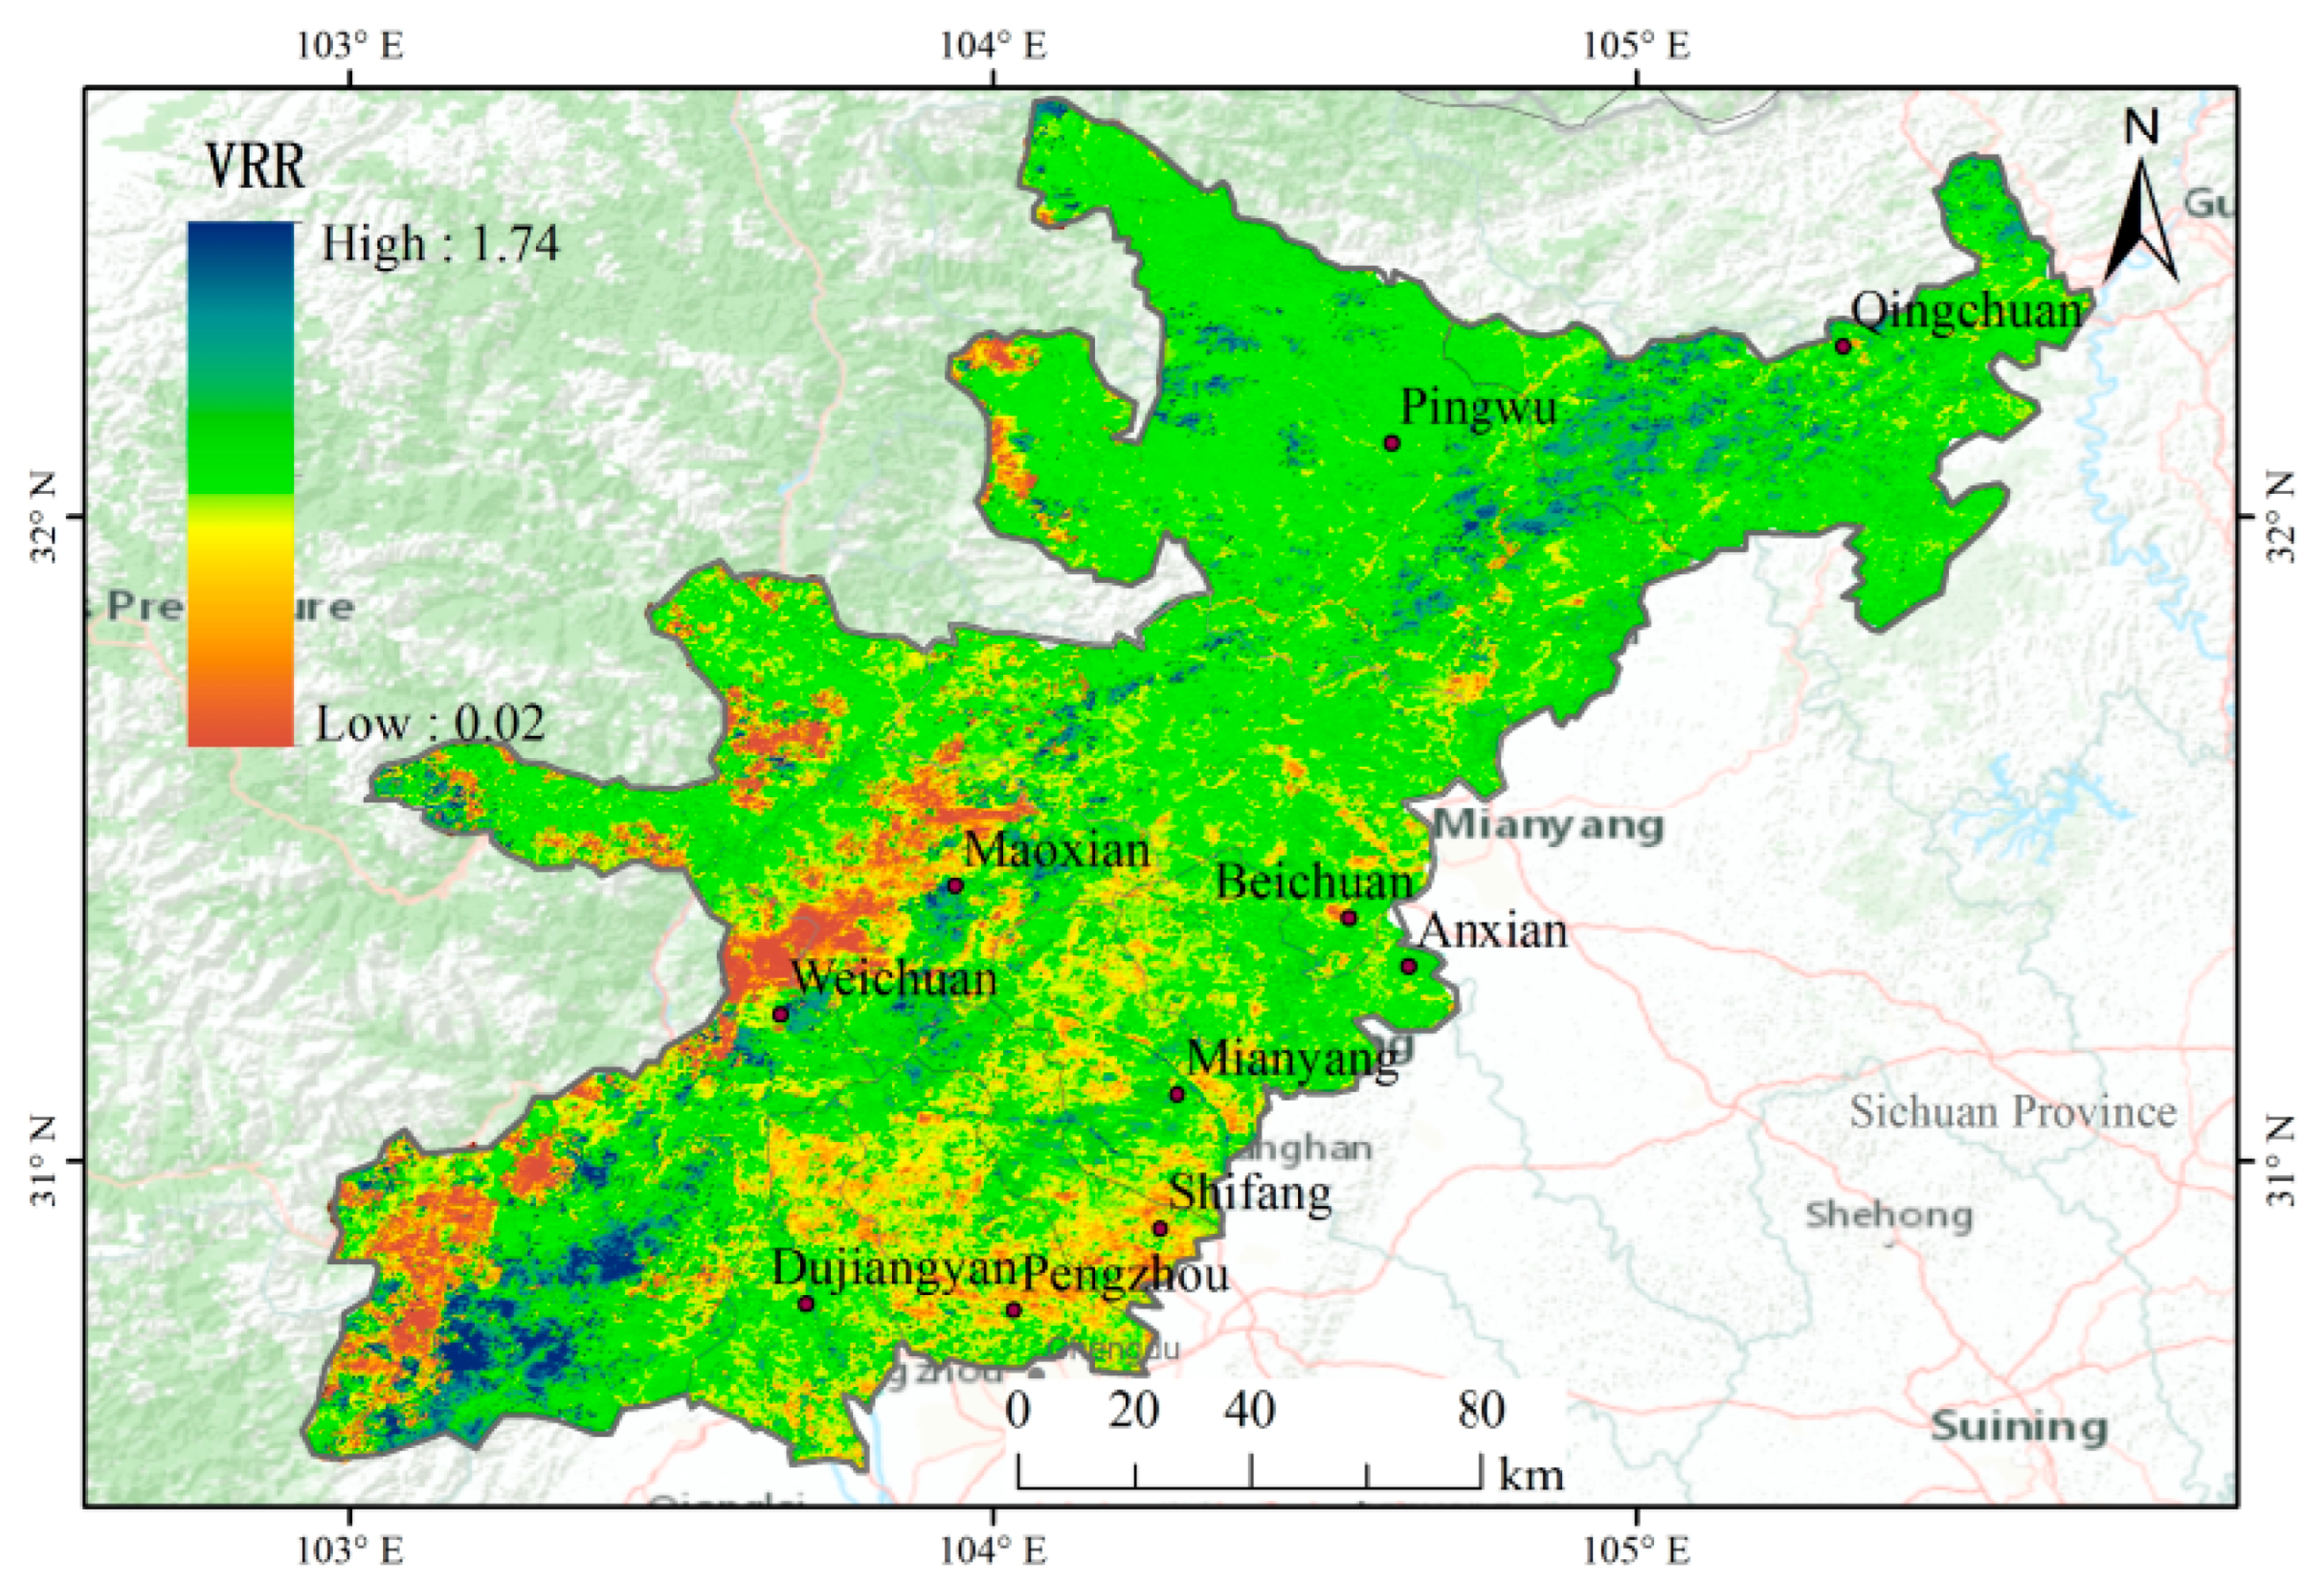
2 were the vegetation index data in 2007, 2010 and 2018, respectively, and on that basis, the distribution map of vegetation restoration in the core area of the Wenchuan earthquake was obtained (
Figure 11). From
Figure 10, after 10 years of restoration, the vegetation recovery rate in the areas directly affected by the Wenchuan earthquake such as Wenchuan, Maoxian, Pengzhou and Beichuan urban area was lower, while the vegetation recovery rate in other regions was higher than 1. The vegetation recovery situation in some regions was especially good, and the maximum vegetation recovery rate reached 1.74, which far exceeded the vegetation coverage before the earthquake. In the following paragraphs, the vegetation restoration characteristics are analyzed from the aspects of elevation, slope, aspect and human influence factors.
3.2.1. Elevation Characteristics of Vegetation Recovery
According to the influence factors such as topography, precipitation and sunshine in the study area, the elevation of the study area was classified with the interval of 100 m, the characteristics of the average VRR in different elevation intervals were calculated and then the trend of the average VRR in the study area with the elevation was obtained (
Figure 12). From
Figure 11, there is a good quadratic polynomial relationship between the VRR average value of the study area and the elevation of the area (R
2 = 0.80), and the correlation expression is as follows:
According to the statistical results, as of 2018, the vegetation recovery after the Wenchuan earthquake was generally good, and the average VRR in the core area of the earthquake was above 0.91. The areas with high vegetation recovery rates were mainly concentrated in the elevation range of 600–2500 m, where the VRR value was above 1.0, and the vegetation recovery was in good condition. In the areas with an elevation below 600 m, VRR was about 0.99, mainly due to the frequent human activities in low-altitude areas, as well as the great disturbance to the restoration of vegetation in social development and production activities such as urban construction and resource mining. In the areas above 2500 m, as the elevation increased, VRR gradually decreased, mainly because the heat, water and soil fertility in high-altitude areas cannot meet the needs of vegetation growth. Thus, VRR in areas above 2500 m was significantly lower than that in the middle and lower altitudes.
3.2.2. Slope Characteristics of Vegetation Recovery
According to the slope map obtained from the DEM data of the study area, combined with the actual local situation, the slope was classified at an interval of 3° and overlaid with the VRR data for statistical analysis. We found that there was a good quadratic polynomial relationship between the average VRR and the slope (R
2 = 0.92), and the correlation expression is as follows:
From the statistical calculation results of the districts (
Figure 13), the average VRR in the areas with a slope of less than 3° was around 0.97. In the areas with the slope range of 3–39°, as the slope value increased, the average VRR stabilized at 0.90 or above. When the slope reached 42°, VRR gradually decreased. In addition, as the terrain slope increased, VRR gradually decreased. When the slope reached 69°, the VRR value became 0. Overall, vegetation recovery had a strong correlation with slope. In particular, a slope of 39° was the critical point of vegetation recovery characteristics. In the areas with a slope lower than 39°, the vegetation recovery was good, and VRR did not have a significant change with slope changes. However, in the areas above 39°, VRR was greatly affected by slope changes. There was a significant negative correlation between VRR and slope. With the increase in slope, the vegetation recovery gradually became worse, and in the area with a slope above 69°, there existed areas with basically no vegetation recovery.
3.2.3. Aspect Characteristics of Vegetation Recovery
According to the influence of sunlight on vegetation distribution, combined with the classification basis of shady, sunny, semi-shady and semi-sunny slope, the topographic aspect of the study area is divided into eight grades according to the interval of 45°, and the average VRR in different aspects are counted (
Figure 14). From
Figure 13, the average value of VRR in the sunny slope (135–180°) area is the largest, and its average value is above 0.98; the VRR in the semi-shady slope (270–315°) area is the smallest, and its average value is 0.96. The average value of VRR in other aspects is about 0.97. Taken together, after about 10 years of restoration, the vegetation recovery in each aspect is good, and the average value of VRR is within the interval of 0.96–0.98. Overall, the aspect has little difference in the effect of vegetation restoration.
3.2.4. Vegetation Recovery and Distance Analysis
There are many factors affecting vegetation restoration, among which the impact of human activities is more significant. Especially, in urban residential areas where the population is densely distributed and road areas where human activities are more frequent, the impact of human activities on vegetation growth is more obvious [
39,
40,
41]. According to the urban residential areas and road areas in the study area, multi-level buffer analysis was conducted with an interval distance of 1 km. In addition, the buffer analysis and the VRR map were superimposed to obtain the statistical data of VRR with the distance from the areas with intense human activities. The results reveal that VRR gradually increased with the distance from areas with intense human activities. VRR and the distance had a highly linear correlation, and the R
2 value was 0.86. The correlation expression is as follows:
According to the statistical results, as the distance from the intensive human activity area increased, VRR gradually increased, indicating that human activities directly impacted vegetation restoration. Especially, in the areas near urban residential areas and close to traffic roads, VRR was generally low; in the areas with fewer human activities, the average VRR was above 1.0, and the vegetation restoration was good. Precipitation also has an important impact on vegetation restoration. Through the statistical analysis of the average annual precipitation in the study area from 2009 to 2018, it was found that the average annual precipitation(A-P) has gradually increased since 2009, which is in line with the gradual restoration of vegetation (
Figure 15). The synergistic phenomenon of the study area indicated that the abundant precipitation in the study area further promoted the restoration of vegetation.
4. Discussion
Although more than ten years have passed since the Wenchuan earthquake, the damage to the economy and society still exists [
42,
43]. Moreover, the secondary disasters after the earthquake have caused huge damage to the vegetation in the region. Therefore, high-precision assessment of vegetation destruction and recovery is of great practical significance to accelerate people’s return to normal life in this area. In this study, remote sensing and NDVI data were used to evaluate vegetation damage and restoration after an earthquake. Some studies used remote sensing data to analyze the degree of vegetation damage [
2,
4,
5], and time series analysis methods have also been used to monitor changes in vegetation [
5,
7]. However, in our study, we determined the time of the remote sensing images by monthly time series, which provided suitable data for vegetation restoration assessment in earthquake disasters. In addition, we used an annual time series analysis method and found that the earthquake disaster had an obvious lag effect on vegetation damage. The above methods are unique in research on post-earthquake vegetation restoration.
Many studies have used natural factors in the evaluation of vegetation restoration in earthquake disasters, such as elevation, slope and slope aspect [
4,
5]; some studies have paid attention to the impact of roads [
6], and qualitative evaluation is widely used in the analysis of influencing factors [
4]. This study takes advantage of the current research and utilizes both qualitative and quantitative evaluation methods. We analyze from two aspects of natural factors and human factors and conduct hierarchical statistics on elevation, slope, slope aspect and distance from urban areas and roads, using mathematical models to quantitatively express the quantitative relationship of vegetation restoration among different influencing factors. These studies have good guiding significance for the planning and design of artificial measures to promote vegetation restoration, and in the planning and design of disaster reconstruction. These methods are the innovation points and key contents of our research in the article, which has not been reported yet.
The study found that after ten years of recovery, the damaged vegetation in the area has been well restored due to favorable factors such as fertile soil and sufficient water and heat conditions, which is basically consistent with the findings of other scholars [
4,
8,
9,
14]. Compared with previous studies on vegetation recovery after the earthquake by scholars in China and abroad, some scholars have conducted multi-dimensional research on the dynamics of vegetation recovery after the Wenchuan earthquake. However, due to the limits in data and other natural factors, the research area was limited to a partial area in the core area of the earthquake [
10], only focusing on the dynamic vegetation recovery status in the Maoxian, Wenchuan and Dujiangyan counties [
12,
17]. Studies on post-earthquake vegetation damage and recovery assessment in 10 counties of the core area of the Wenchuan earthquake have rarely been reported. In particular, no study has been reported on the use of remote sensing image data of time series to determine post-earthquake vegetation damage, to assess the damage by combining town distance and topographic factors and to further determine the starting point of vegetation recovery. This is also what this study intends to address.
The following aspects should be deepened and expanded in the follow-up research: (1) First of all, in terms of data accuracy, this article uses MODIS13Q1 remote sensing image data with a resolution of 250 m. Using the higher-precision data and improving the accuracy of the data can improve the accuracy of vegetation identification and extraction. (2) In terms of data noise, cloud cover is the main noise that affects the extraction of spectral values. Although we tried to select remote sensing images with few clouds (<10%), it still cannot completely restore the spectral values. Therefore, on the one hand, the image data with low cloud content should be selected from the satellites’ data. On the other hand, the reduction in the noise caused by clouds is also a research content worth continuing to advance. (3) Finally, in terms of data indicators, this paper selects topographic factors and urban distances to study vegetation damage and vegetation recovery; however, in fact, vegetation damage and recovery are affected by many factors. For example, there are differences in vegetation restoration in different land-use types, and it is also worth studying the vegetation restoration conditions under different land-use types. In the future, further detailed research on the above three aspects is needed to provide more detailed plans for the recovery and reconstruction of vegetation in the disaster areas.
5. Conclusions
In this paper, the core area of the Wenchuan earthquake was used as the study area, time series data of MODIS-NDVI were used to quantitatively analyze the characteristics of vegetation damage and recovery processes in the study area and factors such as topographic factors and town distances were selected to quantitatively analyze their correlations with vegetation damage and vegetation recovery rates in the affected areas. The main conclusions are as follows:
Vegetation in the core area of the Wenchuan earthquake was seriously damaged by the earthquake. The degree of vegetation damage had a strong correlation with elevation, slope and human activities, but the influence of aspect was not obvious. With the change in elevation, vegetation damage showed strong parabolic characteristics. At an elevation of about 3200 m, the degree of vegetation damage was the greatest; in the elevation range of 400–3200 m, the vegetation damage gradually increased with the increase in elevation and in the elevation range of 3200–5300 m, the vegetation damage gradually decreased with the increase in elevation. The slope change can significantly affect the vegetation damage, and it showed an overall parabolic correlation between the slope and the vegetation damage. The maximum vegetation damage was observed near a slope of 42°. In the flat (0–15°) or particularly steep (54–78°) areas, the impact of earthquakes on vegetation damage was relatively low; in the slope range of 15–54°, the impact of earthquakes on vegetation was the most obvious. Especially, the geological secondary disasters caused by earthquakes had the most direct damage to vegetation, leading to a great change (in the range of 0.10–0.15) in the NDVI value. Vegetation in the areas with strong human activities was relatively fragile and earthquakes had a greater impact on its damage. The vegetation damage gradually decreased with the distance from areas with human activities.
After about ten years of recovery, except for the Wenchuan, Maoxian, Pengzhou and Beichuan urban areas, which were directly affected by the earthquake and had low vegetation recovery rate, the overall situation of vegetation recovery in other areas was better, and some areas even had far more vegetation cover than before the earthquake. From the whole region, the vegetation recovery was closely related to the influence of elevation, slope and human activities, and the influence of aspect was not obvious. Vegetation recovery showed a parabolic characteristic with the change in elevation. In the areas with an elevation of less than 600 m, vegetation recovery was greatly affected by human activities, and the vegetation recovery rate is about 0.99. In the elevation range of 600–2500 m, human activity interference was reduced, and water and heat were sufficient, which were conducive to vegetation recovery. The vegetation recovery rate was above 1.0, and the vegetation recovery was better. In the elevation range above 2500 m, the elevation change had the most direct impact on vegetation recovery, and the vegetation recovery rate gradually decreased with the increase in elevation. The vegetation recovery rate varied at different slopes. A slope of 39° was the demarcation point of vegetation recovery. In the areas with a slope below 39°, vegetation recovery was better, but did not have obvious dependence on slope. In the areas with a slope above 39°, vegetation recovery had an obvious negative correlation with slope changes. As slope increased, vegetation recovery gradually became worse. When a slope was above 69°, the vegetation recovery rate was 0 and unrecovered areas appeared, which is the key area requiring enhanced vegetation recovery measures. The impact of human activities on vegetation recovery was more significant, and the vegetation recovery rate gradually increased with the weakening of the impact of human activities. Especially, in the areas far away from human settlements or roads, the average vegetation recovery rate was above 1.0.
Author Contributions
Conceptualization, J.L. and B.X.; methodology, X.X. (Xiao Xiao); data curation, X.X. (Xiao Xiao) and B.Z. methodology, X.X. (Xiao Xiao), B.Z. and J.L.; formal analysis, X.X. (Xiao Xiao) and X.X. (Xiao Xiao); writing—original draft preparation, J.L. and X.X. (Xiao Xie); writing—review and editing, X.X. (Xiao Xie); visualization, X.X. (Xiao Xiao) and B.Z.; supervision, B.X.; project administration, B.X.; funding acquisition, B.X. All authors have read and agreed to the published version of the manuscript.
Funding
This work was funded by the Taishan Scholars, People’s Government of Shandong Provincial (tsqn202103159), the National Natural Science Foundation of China (41971166), Humanities and Social Sciences Research Projects in Universities in Henan Province (2021-ZZJH-351), Natural Science Foundation of Liaoning Province (2019-MS-342), the Science and Technology Plan Project of Shenyang City (No. 20-206-4-12), the Weifang Science and Technology Project (2021ZJ1134), the Shenyang Young and Middle-aged Scientific and Technological Talents Program (RC210502).
Institutional Review Board Statement
Not applicable.
Informed Consent Statement
Not applicable.
Data Availability Statement
Not applicable.
Acknowledgments
We express our sincere appreciation to the anonymous reviewer for their constructive comments.
Conflicts of Interest
The authors declare no conflict of interest.
References
- Carlson, T.N.; Ripley, D.A. On the relation between NDVI, fractional vegetation cover, and leaf area index. Remote Sens. Environ. 1997, 62, 241–252. [Google Scholar] [CrossRef]
- Derakhshan, S.; Cutter, S.L.; Wang, C. Remote Sensing Derived Indices for Tracking Urban Land Surface Change in Case of Earthquake Recovery. Remote Sens. 2020, 12, 895. [Google Scholar] [CrossRef] [Green Version]
- Cui, X.; Gibbes, C.; Southworth, J.; Waylen, P. Using Remote Sensing to Quantify Vegetation Change and Ecological Resilience in a Semi-Arid System. Land 2013, 2, 108–130. [Google Scholar] [CrossRef] [Green Version]
- Zhong, C.; Li, C.; Gao, P.; Li, H. Discovering Vegetation Recovery and Landslide Activities in the Wenchuan Earthquake Area with Landsat Imagery. Sensors 2021, 21, 5243. [Google Scholar] [CrossRef] [PubMed]
- Ni, Z.; Yang, Z.; Li, W.; Zhao, Y.; He, Z. Decreasing Trend of Geohazards Induced by the 2008 Wenchuan Earthquake Inferred from Time Series NDVI Data. Remote Sens. 2019, 11, 2192. [Google Scholar] [CrossRef] [Green Version]
- Liu, X.; Jiang, W.; Li, J.; Wang, W. Evaluation of the Vegetation Coverage Resilience in Areas Damaged by the Wenchuan Earthquake Based on MODIS-EVI Data. Sensors 2017, 17, 259. [Google Scholar] [CrossRef] [Green Version]
- Wang, M.; Yang, W.T.; Shi, P.J.; Xu, C.; Liu, L.Y. Diagnosis of vegetation recovery in mountainous regions after the Wenchuan earthquake. IEEE J. Stars 2014, 7, 3029–3037. [Google Scholar] [CrossRef]
- Liu, Y.; Liu, R.G.; Ge, Q.S. Evaluating the vegetation destruction and recovery of Wenchuan earthquake using MODIS data. Nat. Hazards 2010, 54, 851–862. [Google Scholar] [CrossRef] [Green Version]
- Yang, W.T.; Qi, W.W.; Wang, M.; Zhang, J.J.; Zhang, Y. Spatial and temporal analyses of post-seismic landslide changes near the epicentre of the Wenchuan earthquake. Geomorphology 2017, 276, 8–15. [Google Scholar] [CrossRef]
- Tian, Y.; Fang, Z.L.; Xie, Q.; Pan, H.L.; Liu, X.L. Damages situstions by wenchuan earthquake and recovery status of vegetations in upper Minjiang River basin. Resour. Environ. Yangtze Basin 2014, 23, 144–149. (In Chinese) [Google Scholar]
- Li, J.Z.; Cao, M.M.; Qiu, H.J.; Xue, B.; Hu, S.; Cui, P. Spatial-temporal process and characteristics of vegetation recovery after Wenchuan Earthquake: A case study in Longxi River basin of Dujiangyan, China. Chin. J. Appl. Ecol. 2016, 27, 3479–3486. (In Chinese) [Google Scholar]
- Xu, J.C.; Tang, B.; Lu, T. Monitoring the riparian vegetation cover after the Wenchuan Earthquake along the Minjiang River valley based on multi-temporal Landsat TM images: A case study of the Yingxiu-Wenchuan section. Acta Ecol. Sin. 2013, 33, 145–153. (In Chinese) [Google Scholar]
- Guo, C.B.; Du, Y.B.; Zhang, Y.S.; Zhang, G.Z.; Yao, X.; Wang, K.; Liu, J. Geohazard effects of the Xianshuihe fault and characteristics of typical landslides in western Sichuan. Geol. Bull. China 2015, 34, 121–134. (In Chinese) [Google Scholar]
- Zhang, X.; Wang, Q.A.; Wang, W.G.; Yang, M.; Yu, H.Y.; Wang, B. Study on regionalization of vegetation restoration in the areas severely affected by the Wenchuan County earthquake. Soil Water Conserv. China 2010, 5, 48–51. (In Chinese) [Google Scholar]
- Nan, Y.; Liu, Z.F.; Zhu, W.H.; Wu, Y.X.; Xue, J.G. Range of typhoon-stricken area and trend of vegetation restoration in Changbai Mountain: RS-based research. J. Nat. Disasters 2011, 20, 133–141. (In Chinese) [Google Scholar]
- Zhao, D.; Zhang, M.; Yu, M.Z.; Zeng, Y.; Wu, B.F. Monitoring agriculture and forestry recovery after the Wenchuan Earthquake. J. Remote Sens. 2014, 18, 228–240. (In Chinese) [Google Scholar]
- Hong, Y.; Zhao, Y.B.; Wang, Y.S.; Xin, C.C.; Zhao, Y. Temporal and spatial variation characteristics of vegetation restoration based on MODIS-NDVI Wenchuan earthquake region in ten years. Sci. Technol. Eng. 2019, 19, 64–71. (In Chinese) [Google Scholar]
- Cui, P.; Lin, Y.-M.; Chen, C. Destruction of vegetation due to geo-hazards and its environmental impacts in the Wenchuan earthquake areas. Ecol. Eng. 2012, 44, 61–69. [Google Scholar] [CrossRef]
- Tang, C.; Zhu, J.; Li, W.L.; Liang, J.T. Rainfall-triggered debris flows following the Wenchuan earthquake. Bull. Eng. Geol. Environ. 2009, 68, 187–194. [Google Scholar] [CrossRef]
- Zhang, Y.S.; Cheng, Y.L.; Yin, Y.P.; Lan, H.X.; Wang, J.; Fu, X.X. High-position debris flow: A long-term active geohazard after the Wenchuan earth-quake. Eng. Geol. 2014, 180, 45–54. [Google Scholar] [CrossRef]
- Lu, T.; Zeng, H.; Luo, Y.; Wang, Q.; Shi, F.; Sun, G.; Wu, Y.; Wu, N. Monitoring vegetation recovery after China’s May 2008 Wenchuan earthquake using landsat tm time-series data: A case study in Mao County. Ecol. Res. 2012, 27, 955–966. [Google Scholar] [CrossRef]
- Yang, C.; Ren, X.; Huang, H. The vegetation damage assessment of the Wenchuan earthquake of May 2008 using remote sensing and GIS. Nat. Hazards 2011, 62, 45–55. [Google Scholar] [CrossRef]
- Zhao, D.; Arshad, M.; Li, N.; Triantafilis, J. Predicting soil physical and chemical properties using vis-NIR in Australian cotton areas. Catena 2021, 196, 104938. [Google Scholar] [CrossRef]
- Yu, Z.L.; Yuan, L.; Liu, J.; Liu, P.H.; Wu, H.H. Study on Distribution and Activity Characteristics of Giant Debris Flow in Wenchuan Earthquake Zone. Subgrade Eng. 2018, 1, 209–215. (In Chinese) [Google Scholar]
- Jiao, Q.J.; Zhang, B.; Liu, L.Y.; Li, Z.W.; Yue, Y.M.; Hu, Y. Assessment of spatio-temporal variations in vegetation recovery after theWenchuan earthquake using Landsat data. Nat. Hazards 2014, 70, 1309–1326. [Google Scholar] [CrossRef]
- Yang, J.; Yang, Y.X.; Sun, D.Q.; Jin, C.; Xiao, X.M. Influence of urban morphological characteristics on thermal environment. Sustain. Cities Soc. 2021, 72, 103045. [Google Scholar] [CrossRef]
- Sashikkumar, M.C.; Selvam, S.; Karthikeyan, N.; Ramanamurthy, J.; Venkatramanan, S.; Singaraja, C. Remote sensing for recognition and monitoring of vegetation affected by soil properties. J. Geol. Soc. India 2017, 90, 609–615. [Google Scholar] [CrossRef]
- Yang, J.; Wang, Y.C.; Xiao, X.M.; Jin, C.; Xia, J.H.; Li, X.M. Spatial differentiation of urban wind and thermal environment in different grid sizes. Urban Clim. 2019, 28, 100458. [Google Scholar] [CrossRef]
- Ding, Y.L.; Zheng, X.M.; Zhao, K.; Xin, X.P.; Liu, H.J. Quantifying the impact of NDVI soil determination methods and NDVI soil variability on the estimation of fractional vegetation cover in Northeast China. Remote Sens. 2016, 8, 29. [Google Scholar] [CrossRef] [Green Version]
- Qi, J.; Marsett, R.C.; Moran, M.S.; Goodrich, D.C.; Heilman, P.; Kerr, Y.H.; Dedieu, G.; Chehbouni, A.; Zhang, X.X. Spatial and temporal dynamics of vegetation in the San Pedro River basin area. Agric. For. Meteorol. 2000, 105, 55–68. [Google Scholar] [CrossRef] [Green Version]
- Zeng, X.B.; Dickinson, R.E.; Walker, A.; Shaikh, M.; DeFries, R.S.; Qi, J.G. Derivation and evaluation of global 1-km fractional vegetation cover data for land modeling. J. Appl. Meteorol. 2000, 39, 826–839. [Google Scholar] [CrossRef]
- Lin, C.Y.; Lo, H.M.; Chou, W.C.; Lin, W.T. Vegetation recovery assessment at the Jou-Jou Mountain landslide area caused by the 921 Earthquake in Central Taiwan. Ecol. Model. 2004, 176, 75–81. [Google Scholar] [CrossRef]
- Myneni, R.B.; Hall, F.G.; Sellers, P.J.; Marshak, A.L. The interpretation of spectral vegetation indexes. IEEE Trans. Geosci. Remote Sens. 1995, 33, 481–486. [Google Scholar] [CrossRef]
- Lucht, W.; Prentice, I.C.; Myneni, R.B.; Sitch, S.; Friedlingstein, P.; Cramer, W.; Bousquet, P.; Buermann, W.; Smith, B. Climatic control of the high-latitude vegetation greening trend and Pinatubo effect. Science 2002, 296, 1687–1689. [Google Scholar] [CrossRef] [PubMed] [Green Version]
- Wang, J.; Meng, J.J.; Cai, Y.L. Assessing vegetation dynamics impacted by climate change in the southwestern karst region of China with AVHRR NDVI and AVHRR NPP time-series. Environ. Geol. 2008, 54, 1185–1195. [Google Scholar] [CrossRef]
- Zhang, Y.; Zhu, Z.; Liu, Z.; Zeng, Z.Z.; Ciais, P.; Huang, M.T.; Liu, Y.W.; Piao, S.L. Seasonal and interannual changes in vegetation activity of tropical forests in Southeast Asia. Agric. For. Meteorol. 2016, 244, 1–10. [Google Scholar] [CrossRef]
- Wang, C.; Chen, J.; Tang, Y.H.; Andrew Black, T.; Zhu, K. A Novel Method for Removing Snow Melting-Induced Fluctuation in GIMMS NDVI3g Data for Vegetation Phenology Monitoring: A Case Study in Deciduous Forests of North America. IEEE J. Sel. Top. Appl. Earth Obs. Remote Sens. 2018, 11, 800–807. [Google Scholar] [CrossRef]
- Lin, W.T.; Chou, W.C.; Lin, C.Y.; Huang, P.H.; Tsai, J.S. Vegetation recovery monitoring and assessment at landslides caused by earthquake in Central Taiwan. For. Ecol. Manag. 2005, 210, 55–66. [Google Scholar] [CrossRef]
- Yang, J.; Yang, R.; Chen, M.H.; Su, C.H.; Zhi, Y.; Xi, J. Effects of rural revitalization on rural tourism. J. Hosp. Tour. Manag. 2021, 47, 35–45. [Google Scholar] [CrossRef]
- Jin, S.; Yang, J.; Wang, E.; Liu, J. The influence of high-speed rail on ice–snow tourism in northeastern China. Tour. Manag. 2020, 78, 104070. [Google Scholar] [CrossRef]
- Zhao, Z.; Sharifi, A.; Dong, X.; Shen, L.; He, B.J. Spatial Variability and Temporal Heterogeneity of Surface Urban Heat Island Patterns and the Suitability of Local Climate Zones for Land Surface Temperature Characterization. Remote Sens. 2021, 13, 4338. [Google Scholar] [CrossRef]
- Wang, J.; Jin, Z.D.; Hilton, R.G.; Zhang, F.; Densmore, A.L.; Li, G.; West, A.J. Controls on fluvial evacuation of sediment from earthquake-triggered landslides. Geology 2015, 43, 115–118. [Google Scholar] [CrossRef] [Green Version]
- Parker, R.N.; Densmore, A.L.; Rosser, N.J.; de Michele, M.; Li, Y.; Huang, R.Q.; Whadcoat, S.; Petley, D.N. Mass wasting triggered by the 2008 Wenchuan earthquake is greater than orogenic growth. Nat. Geosci. 2011, 4, 449–452. [Google Scholar] [CrossRef] [Green Version]
| Publisher’s Note: MDPI stays neutral with regard to jurisdictional claims in published maps and institutional affiliations. |
© 2022 by the authors. Licensee MDPI, Basel, Switzerland. This article is an open access article distributed under the terms and conditions of the Creative Commons Attribution (CC BY) license (https://creativecommons.org/licenses/by/4.0/).


