Article

Forest Management under Climate Change: A Decision Analysis of Thinning Interventions for Water Services and Biomass in a Norway Spruce Stand in South Germany

1
Forestry Economics and Forest Planning, University of Freiburg, Tennenbacherstr. 4, 79106 Freiburg im Breisgau, Germany
2
Institute of Forestry and Conservation, John H. Daniels Faculty of Architecture, Landscape, and Design, University of Toronto, 33 Willcocks Street, Toronto, ON M5S 3B3, Canada
*
Author to whom correspondence should be addressed.
Land 2022, 11(3), 446; https://doi.org/10.3390/land11030446
Submission received: 20 February 2022 / Revised: 12 March 2022 / Accepted: 18 March 2022 / Published: 20 March 2022

Abstract

:
Climate change is producing threats to forests’ capacity of regulating water regimes. Therefore, thinning strategies can be applied to mitigate climate change impacts more efficiently by providing more spaces for trees to utilize resources e.g., water and nutrients. This study examined the effects of different thinning intensities and intervals on water characteristics and biomass growth of a 75-year-old Norway spruce (Picea abies) stand in the Black Forest, Germany. Here we used a water and management sensitive update of the process-based forest growth model 3PG, 3PG-Hydro. We applied light (10%), moderate (30%), and heavy thinning (50% intensity) in the interval of 10, 25, and 50 years of the management period. We simulated growth with climate change scenario RCP 8.5 data from 1995 to 2065. We analyzed the effects of the different thinning regimens on biomass, evapotranspiration as well as water yield. Thinning intensity and interval as well as their interaction have significant influence on production of stand biomass and water yield for all thinning regimes applied (p < 0.05). However, there is no significant difference (p > 0.05) in accumulated biomass (thinned biomass added to the stand biomass) between the applied thinning regimes. Light thinning in a long interval (50 years) produced highest stand biomass among the applied thinning regimes. Furthermore, the prediction showed that accumulated water yield increased with increasing thinning intensity. Our study concludes that repeated moderate thinning at intermediate intervals results in a high water yield without losing biomass production.

1. Introduction

Forests are of paramount importance in regulating rainfall patterns [1]. Their ability to recharge atmospheric moisture through evapotranspiration (ET), enhance infiltration and groundwater recharge, as well as water purification cannot be understated [2]. Forests yield water in high quality and a large volume of it supports humans by fulfilling basic needs, supporting the food system, filling out water bodies, etc. [3]. However, factors such as choice of species [4], management practices like thinning and pruning [5], and tree age [6] govern the water yield from forests [7]. The exacerbating climate change effects are affecting forest-water interaction such as quality, quantity, and stream flow timing in forests [8]. Events like drought, forest fire, bark beetle outbreak, windthrows associated with increased temperature, and altered precipitation at a large scale contributes to the increased runoff and erosion by reducing infiltration and water uptake by trees [1]. Along with the floods, droughts and surface runoff changes, climatic variation might alter groundwater recharge, making it difficult for water management in future [9]. The Black Forest in Germany has been no exception to these changes with prominent effects on valuable species including Norway Spruce (Picea abies) [10]. Moreover, this species is highly vulnerable to storm damage; clearly perceived as an effect of forest management with little relevance to climatic change [11,12].
Thinning involves the removal of trees generally with an aim to improve yield and production efficiency of biomass by opening of growing spaces [13]. Furthermore, a lower stem density opens the room for better use of resources (e.g., water) [14]. Therefore, thinning helps to increase the water supply through decreased sapwood and leaf area leading to reduced stand ET [15,16]. Moreover, thinned stands are more favored to recover after a long drought period [17]. Following thinning, more water reaches the forest soil due to removed intercepting surfaces [18,19] and stand water consumption is decreased though single-tree transpiration may increase [20]. Therefore, thinned stands are more resistant against drought, enabling trees to recover faster from growth depressions than in un-thinned stands [21]. In addition, the removal of forest canopy through thinning contributes to higher streamflow and soil moisture through runoff generation [18].
Climate change is inducing threats on water security through enhanced frequency, intensity, and duration of droughts, affecting the functioning of forest ecosystems [22,23]. Process based models using climate inputs are used to assess those impacts on forest productivity and to estimate available and required resources for forest growth [24]. This approach can serve as a virtual laboratory for prediction under non-stationary climatic conditions [25]. These models aim to tackle the shortcomings through simulation of physiological processes (governed by environment) influencing growth [26]. They are superior to purely statistical models for predicting global change effects, and have a foundation in theoretical understanding of the complex ecological processes with more explicitly constructed assumptions and easier interpretations [27]. Due to this ease, many researchers have applied these models to assess the response of forests to changing climate (e.g., Morin and Thuiller, 2009; Rollinson et al., 2017), climate change risks (e.g., Allen et al., 2010; Cailler et al., 2014) forest productivity (e.g., González-García et al., 2016), or species distribution shift (e.g., Morin et al., 2007; Snell et al., 2014) [28].
Among many models in application, 3PG is widely applied for the study of climatic effects on growth in varying climatic and site conditions for estimating parameters [29] and productivity for many species including Picea, Pinus, Eucalyptus, and Fir (Cunninghamia) [30]. It is a process-based model developed by Landsberg & Waring, 1997 and works in a stand level to predict even-aged, mono-specific stand growth using monthly weather data [31]. It can be run at stand level as the spatial scale and month as the temporal scale with consideration of climatic and site conditions, management ideas, tree physiology, and environmental carbon balance [32]. However, 3PG has deficits in simulating soil water processes. Therefore, we used the newly modified version 3PG-Hydro [33]. 3PG-Hydro operates in daily time steps and consist of a soil water sub-model, thus displaying water processes and realizing true sensitivity to management [33]. 3PG-Hydro simulates forest water interactions only on a one-dimensional (vertical) scale, thus missing the complex multidimensionality, including lateral flows of hydrological processes. Nevertheless, there is a lack in models that couple species specific forest growth simulations with the details of hydrological processes. Thereby, 3PG-Hydro presents a balanced modeling approach to study how water services are affected by thinning strategies.
The input data includes site characteristics, Norway Spruce parameters, thinning regimes, and climate data. We used a RCP 8.5 scenario [34] to simulate future forest growth in order to analyze the effects on growth and water services for a severe climate change.
It is important to understand the thinning effects on water process and forest productivity under changing climatic conditions at the stand level. The knowledge about the effects of different management strategies (e.g., thinning) on growth and water will be crucial in order to mitigate production losses due to droughts and other climate change effects. Therefore, the objectives of this study are: (1) To evaluate the impacts of thinning regimes (thinning intensity and intervals) on forest growth to (2) examine the variation in water services and (3) analyze the biomass increment and water yield over the management period (70 years) with different thinning regimes in a 75-year-old monoculture of Norway spruce stand.

2. Materials and Methods

2.1. Study Area

Our study area is the Conventwald in the east of Freiburg, southwestern Germany. The location is at 700–860 m above sea level in the montane or submontane altitude belt with a mean annual temperature of 7.3 °C and precipitation of 1490 mm. The location is bordered south to Central Black Forest with mean air temperature of 6.6 °C. The soil type is sandy loam [35]. The Conventwald is an unmanaged stand with its main species being Norway spruce in a mature stage (~100 years old). The stand is monitored intensively for research purposes and provides a perfect case study for forest water interactions regarding existing data.

2.2. The 3PG-Hydro Model and Data Input

For this study, we used an upgraded water-process and management sensitive version of 3PG: 3PG-Hydro [33]. This model works in daily timesteps. The simulation by 3PG-Hydro for soil-water processes is more sensitive and thus gives more detailed information about evapotranspiration (ET) processes and partition, soil water content, and soil water distribution, as well as water yield. Therefore, 3PG-Hydro simulates growth and thinning more precisely [33]. The 3PG-Hydro model requires daily climatic data (temperature, precipitation and solar radiation), site fertility and management data (thinning history and regime, stocking remaining per ha in the stand), as well as stand characteristics (foliage, root and stem biomass, number of trees per hectare, soil characteristics) [28] as a basic input (Appendix A). Climate data until 2015 were obtained from the regional forest research institute (FVA-BW) and RCP 8.5 scenario data were used from modified Copernicus Climate Change Service Information (2021) to simulate growth until 2065 [34]. We obtained 3PG parameters for Picea abies from Forrester et al., 2021 [26] as well as Yousefpour & Djahangard, 2021 [33]. We validated the growth processes (stand volume and diameter at breast height (DBH)) with actual data by FVA for a period of 1995–2015. Stand and thinned biomass, water yield (sum of deep percolation and run-off), transpiration, and soil evaporation were predicted as output data by the model.

2.3. Thinning Regimes

Thinning intensities and intervals made the basis of thinning regimes. Light thinning (10% intensity), moderate thinning (30% intensity), and heavy thinning (50% intensity) were applied to the given stand with the first thinning at the age of 85 years. Light thinning is used to check how the stand behaves in terms of water yield and biomass accumulation. Moderate thinning is used to check how the stand behave differently than light and heavy thinning. For the heavy thinning, the number of thinning is reduced in a short interval to avoid a seemingly clear-cut situation. We applied each of the thinning intensities at the interval of 10 years, 25 years, and 50 years. The 10-year interval resulted in six thinning events for 10% and 30% intensity, respectively. For the 50% intensity, only three thinning events were possible because heavy thinning in a short period (10-year interval) led to a situation of almost clear-cut after the third thinning. Thus, we omitted additional thinning in this regime to avoid leaving a very small number of trees. The 25-year interval led to three thinning events and the 50-year interval to two events for all thinning intensities, respectively. In addition, we simulated a non-thinning scenario to have it as a basis for comparison. Table 1 presents an overview of the thinning regimes. Further detailed information is provided in Appendix B.

2.4. Data Analysis

We ran the model 3PG-Hydro for all described thinning regimes and the non-thinning scenario with the output of annual data. The output data comprised total biomass (stem, foliage, and root), transpiration, soil evaporation, total evapotranspiration as well as water yield (deep percolation and runoff). Moreover, we accumulated stand biomass and thinned biomass for the thinning regime simulation to get an overview about the total biomass production of the stand over the time period.
This study incorporates the use of MS Excel and R for the analysis of the predicted results. We used two-way ANOVA to test the statistical significance of individual, as well as the interaction effect of thinning intensity and thinning intervals on the stand and accumulated biomass, water yield, transpiration, ET, and soil evaporation. The major idea to use two-way ANOVA test was to find out whether thinning intensity and thinning interval significantly affects the stand and water characteristics separately and in combination. Furthermore, we produced boxplots for water characteristics to visualize the test results.
To find out the effect of thinning regimes on water services, we summed the water yield of the whole period to obtain the overall water yield throughout the management period. We applied the same process for the stand and accumulated biomass with the major aim to find the better thinning regime among the applied ones for improving water yield without compromising the biomass production.

3. Results

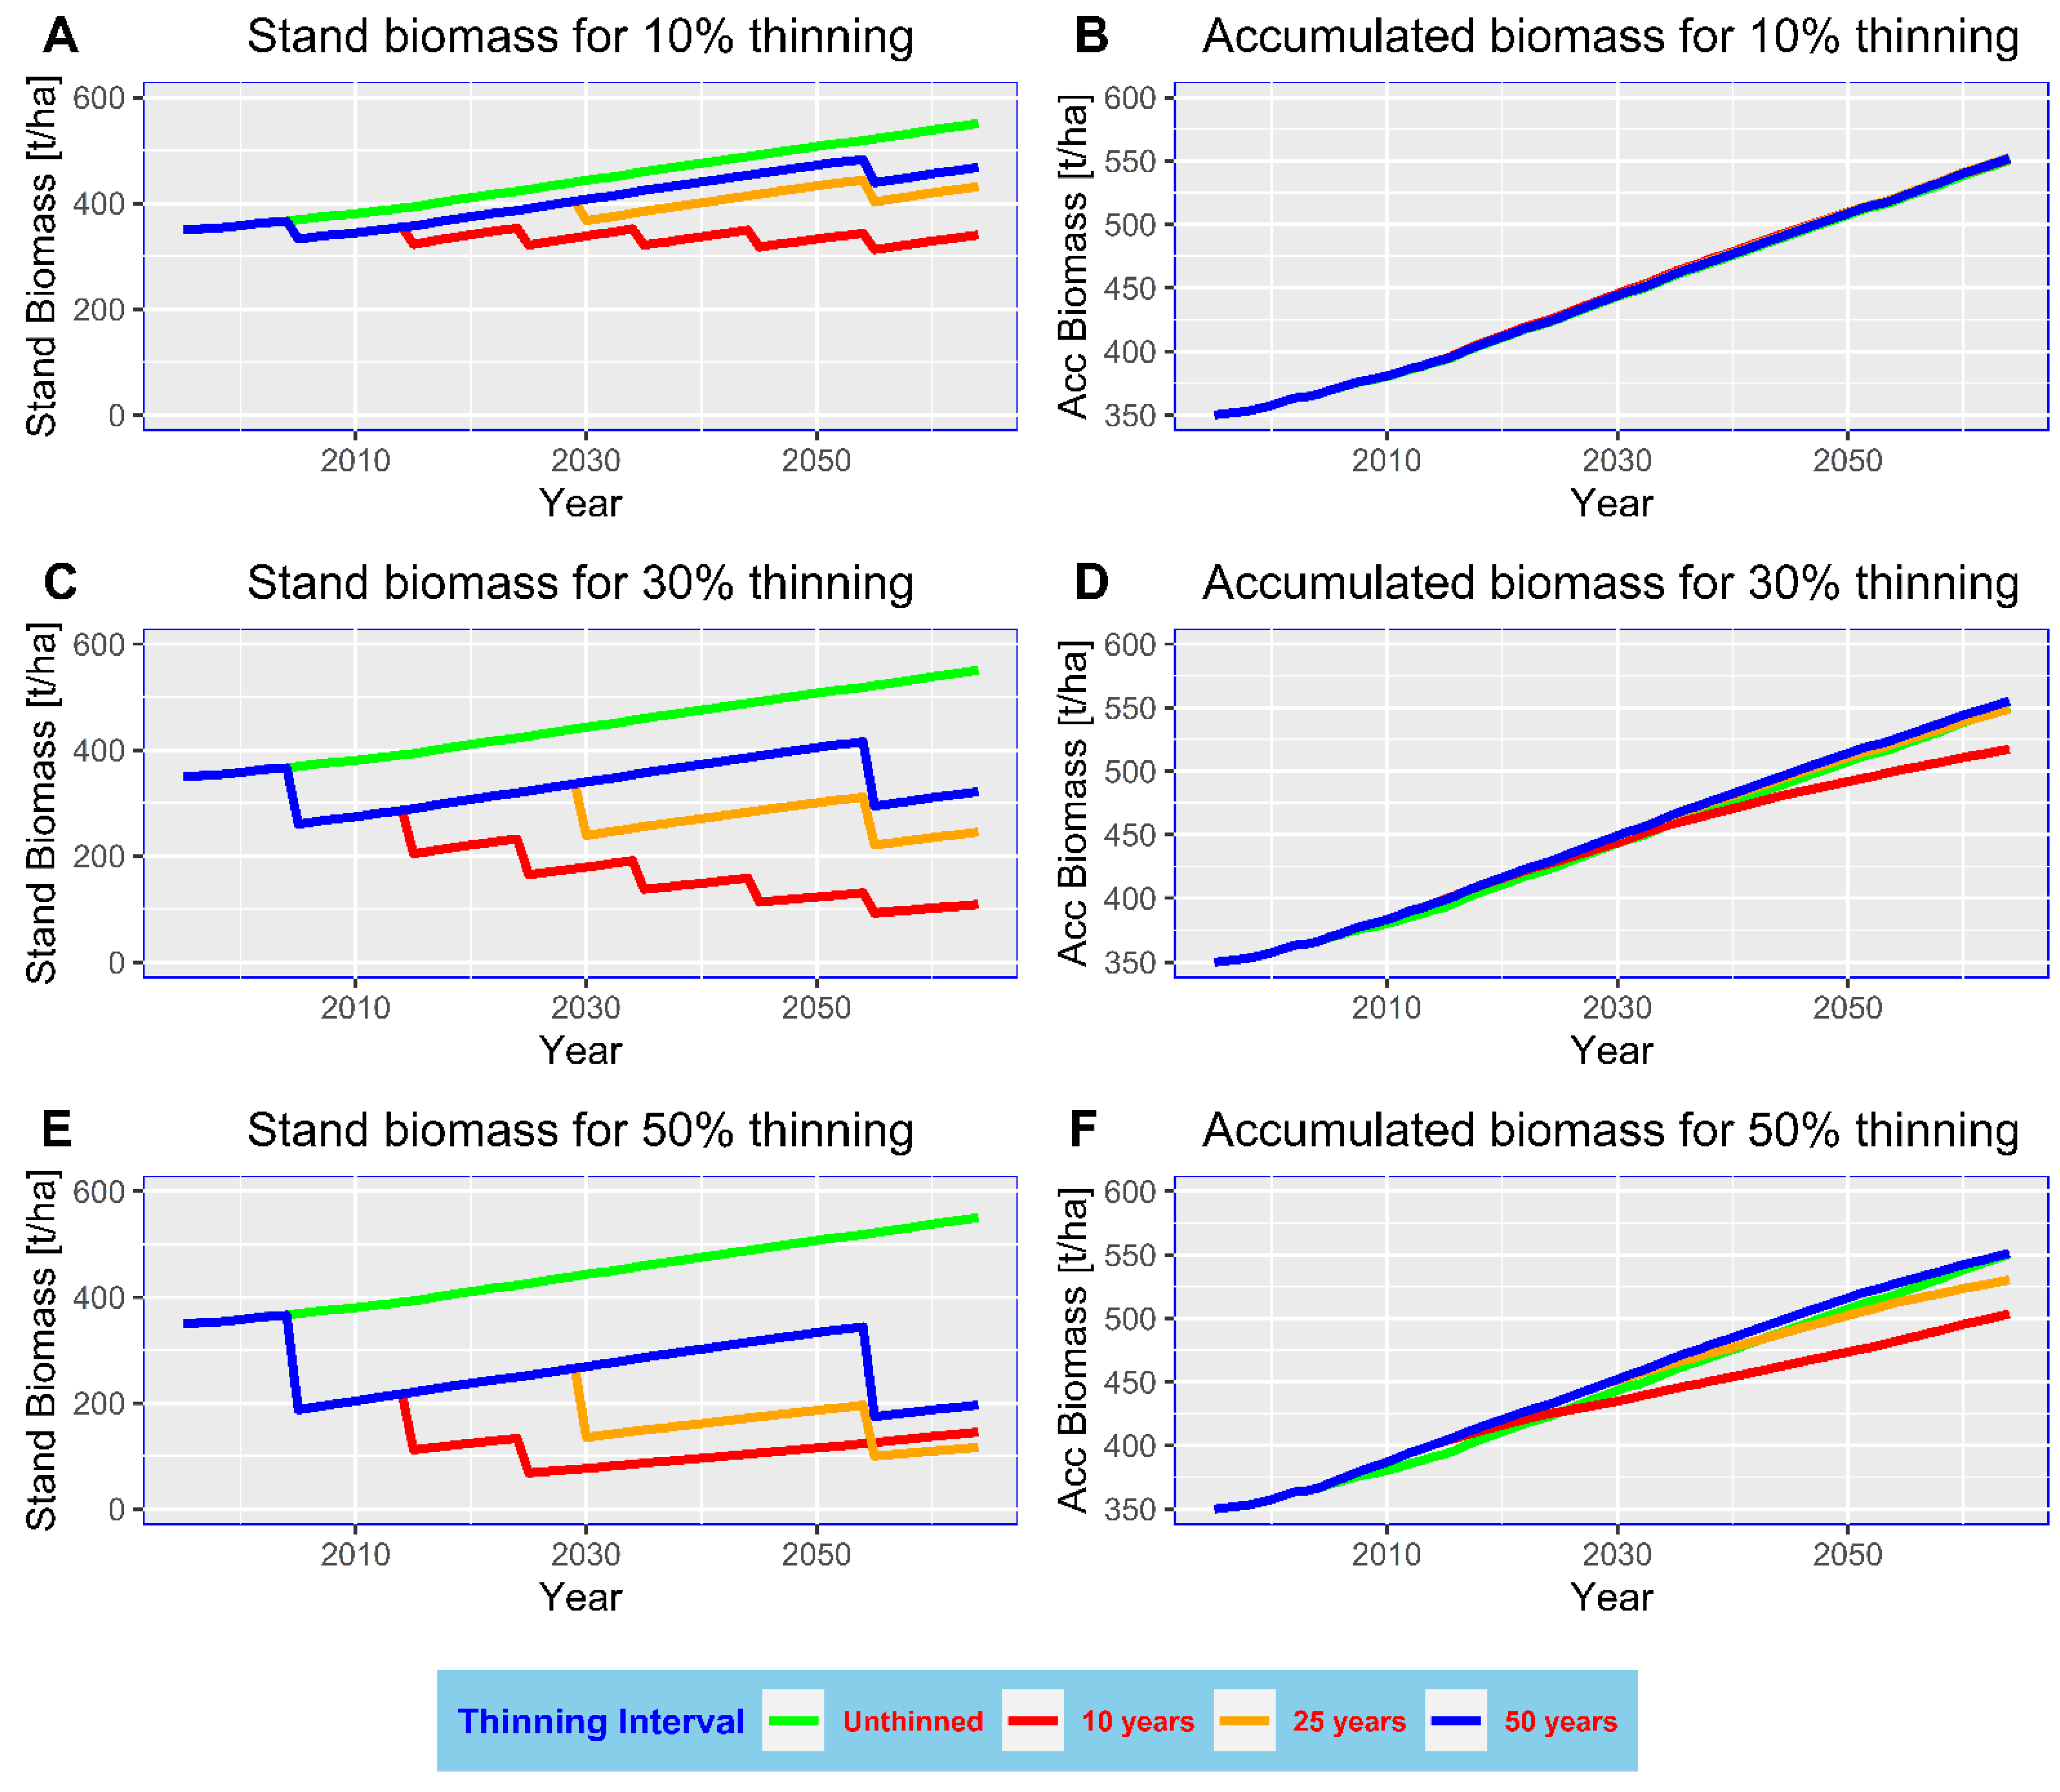
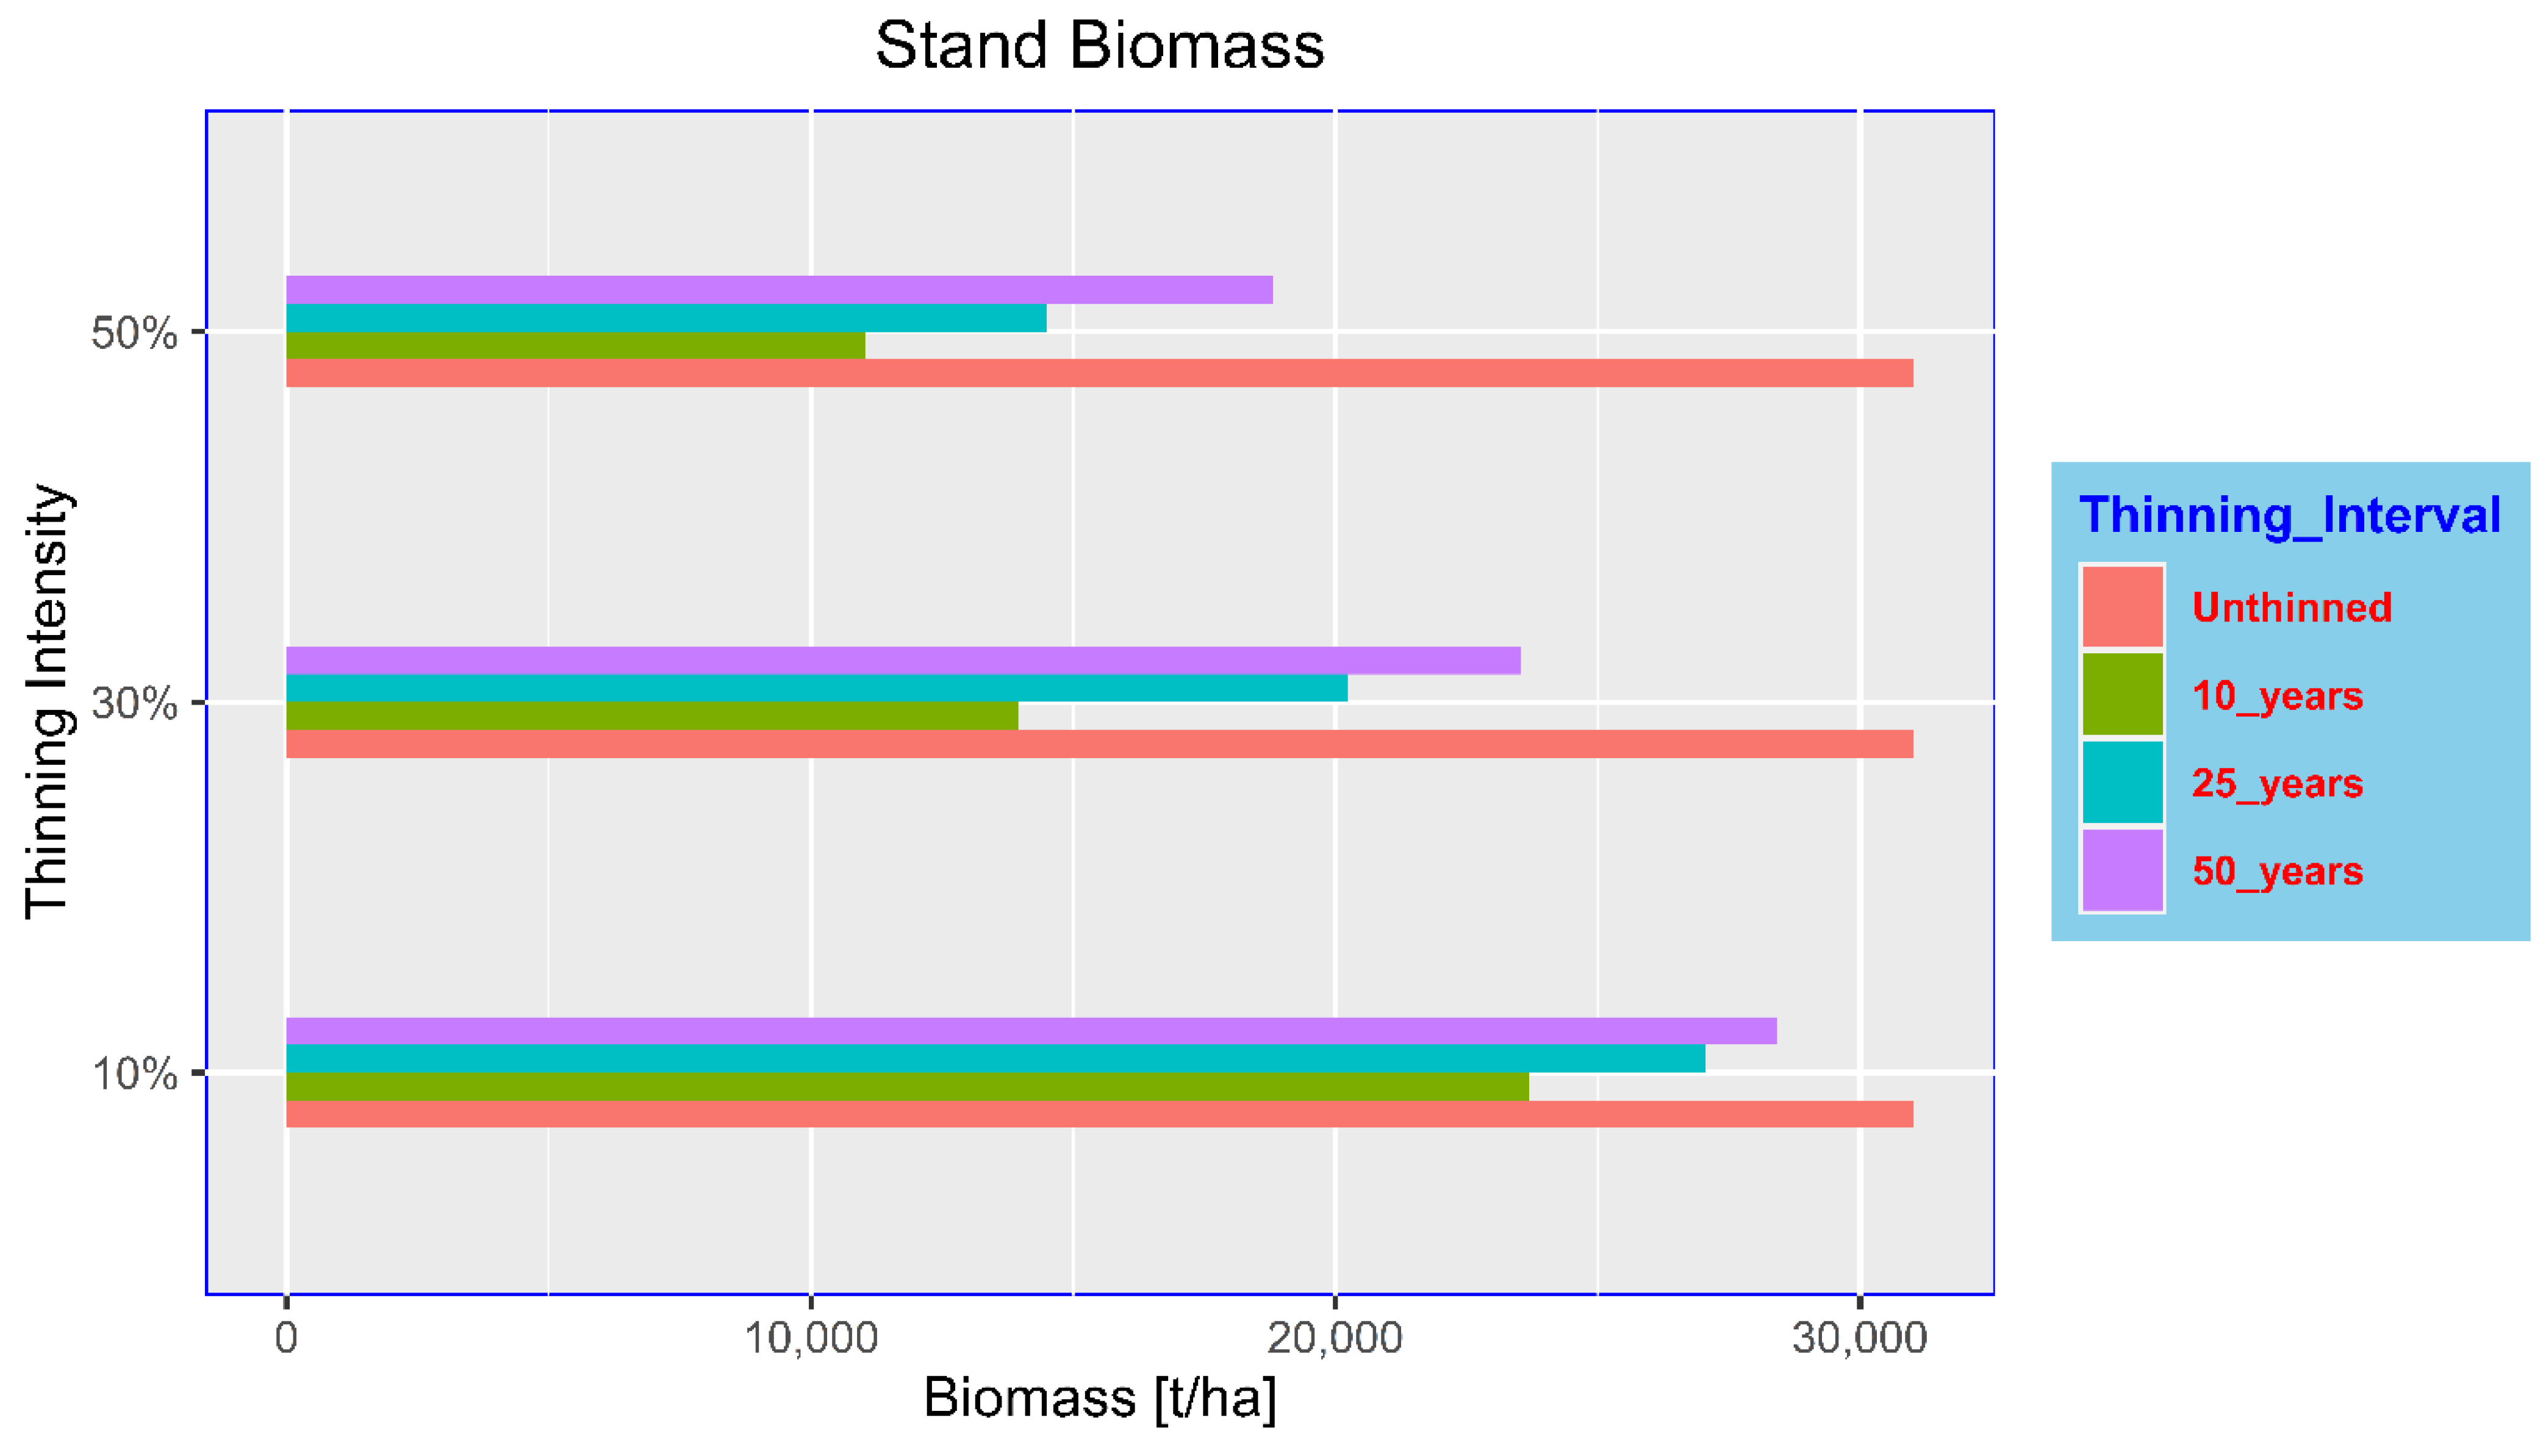
3.1. Effect on Biomass

The stand and accumulated biomass for all thinning regimes (all thinning intensity in each of thinning interval) are lower than in an un-thinned stand. Both stand and accumulated biomass is highest for the 50 year interval for all thinning intensities and are increased with increasing thinning interval (Figure 1).
The two-way ANOVA suggested that both thinning intensity and interval along with their interaction has a significant effect (p-value < 0.05) in stand biomass production. However, the thinning intensity and interval does not have any statistical significance (p-value > 0.05) in accumulated biomass (Table 2). Details of the test are presented in Appendix C.

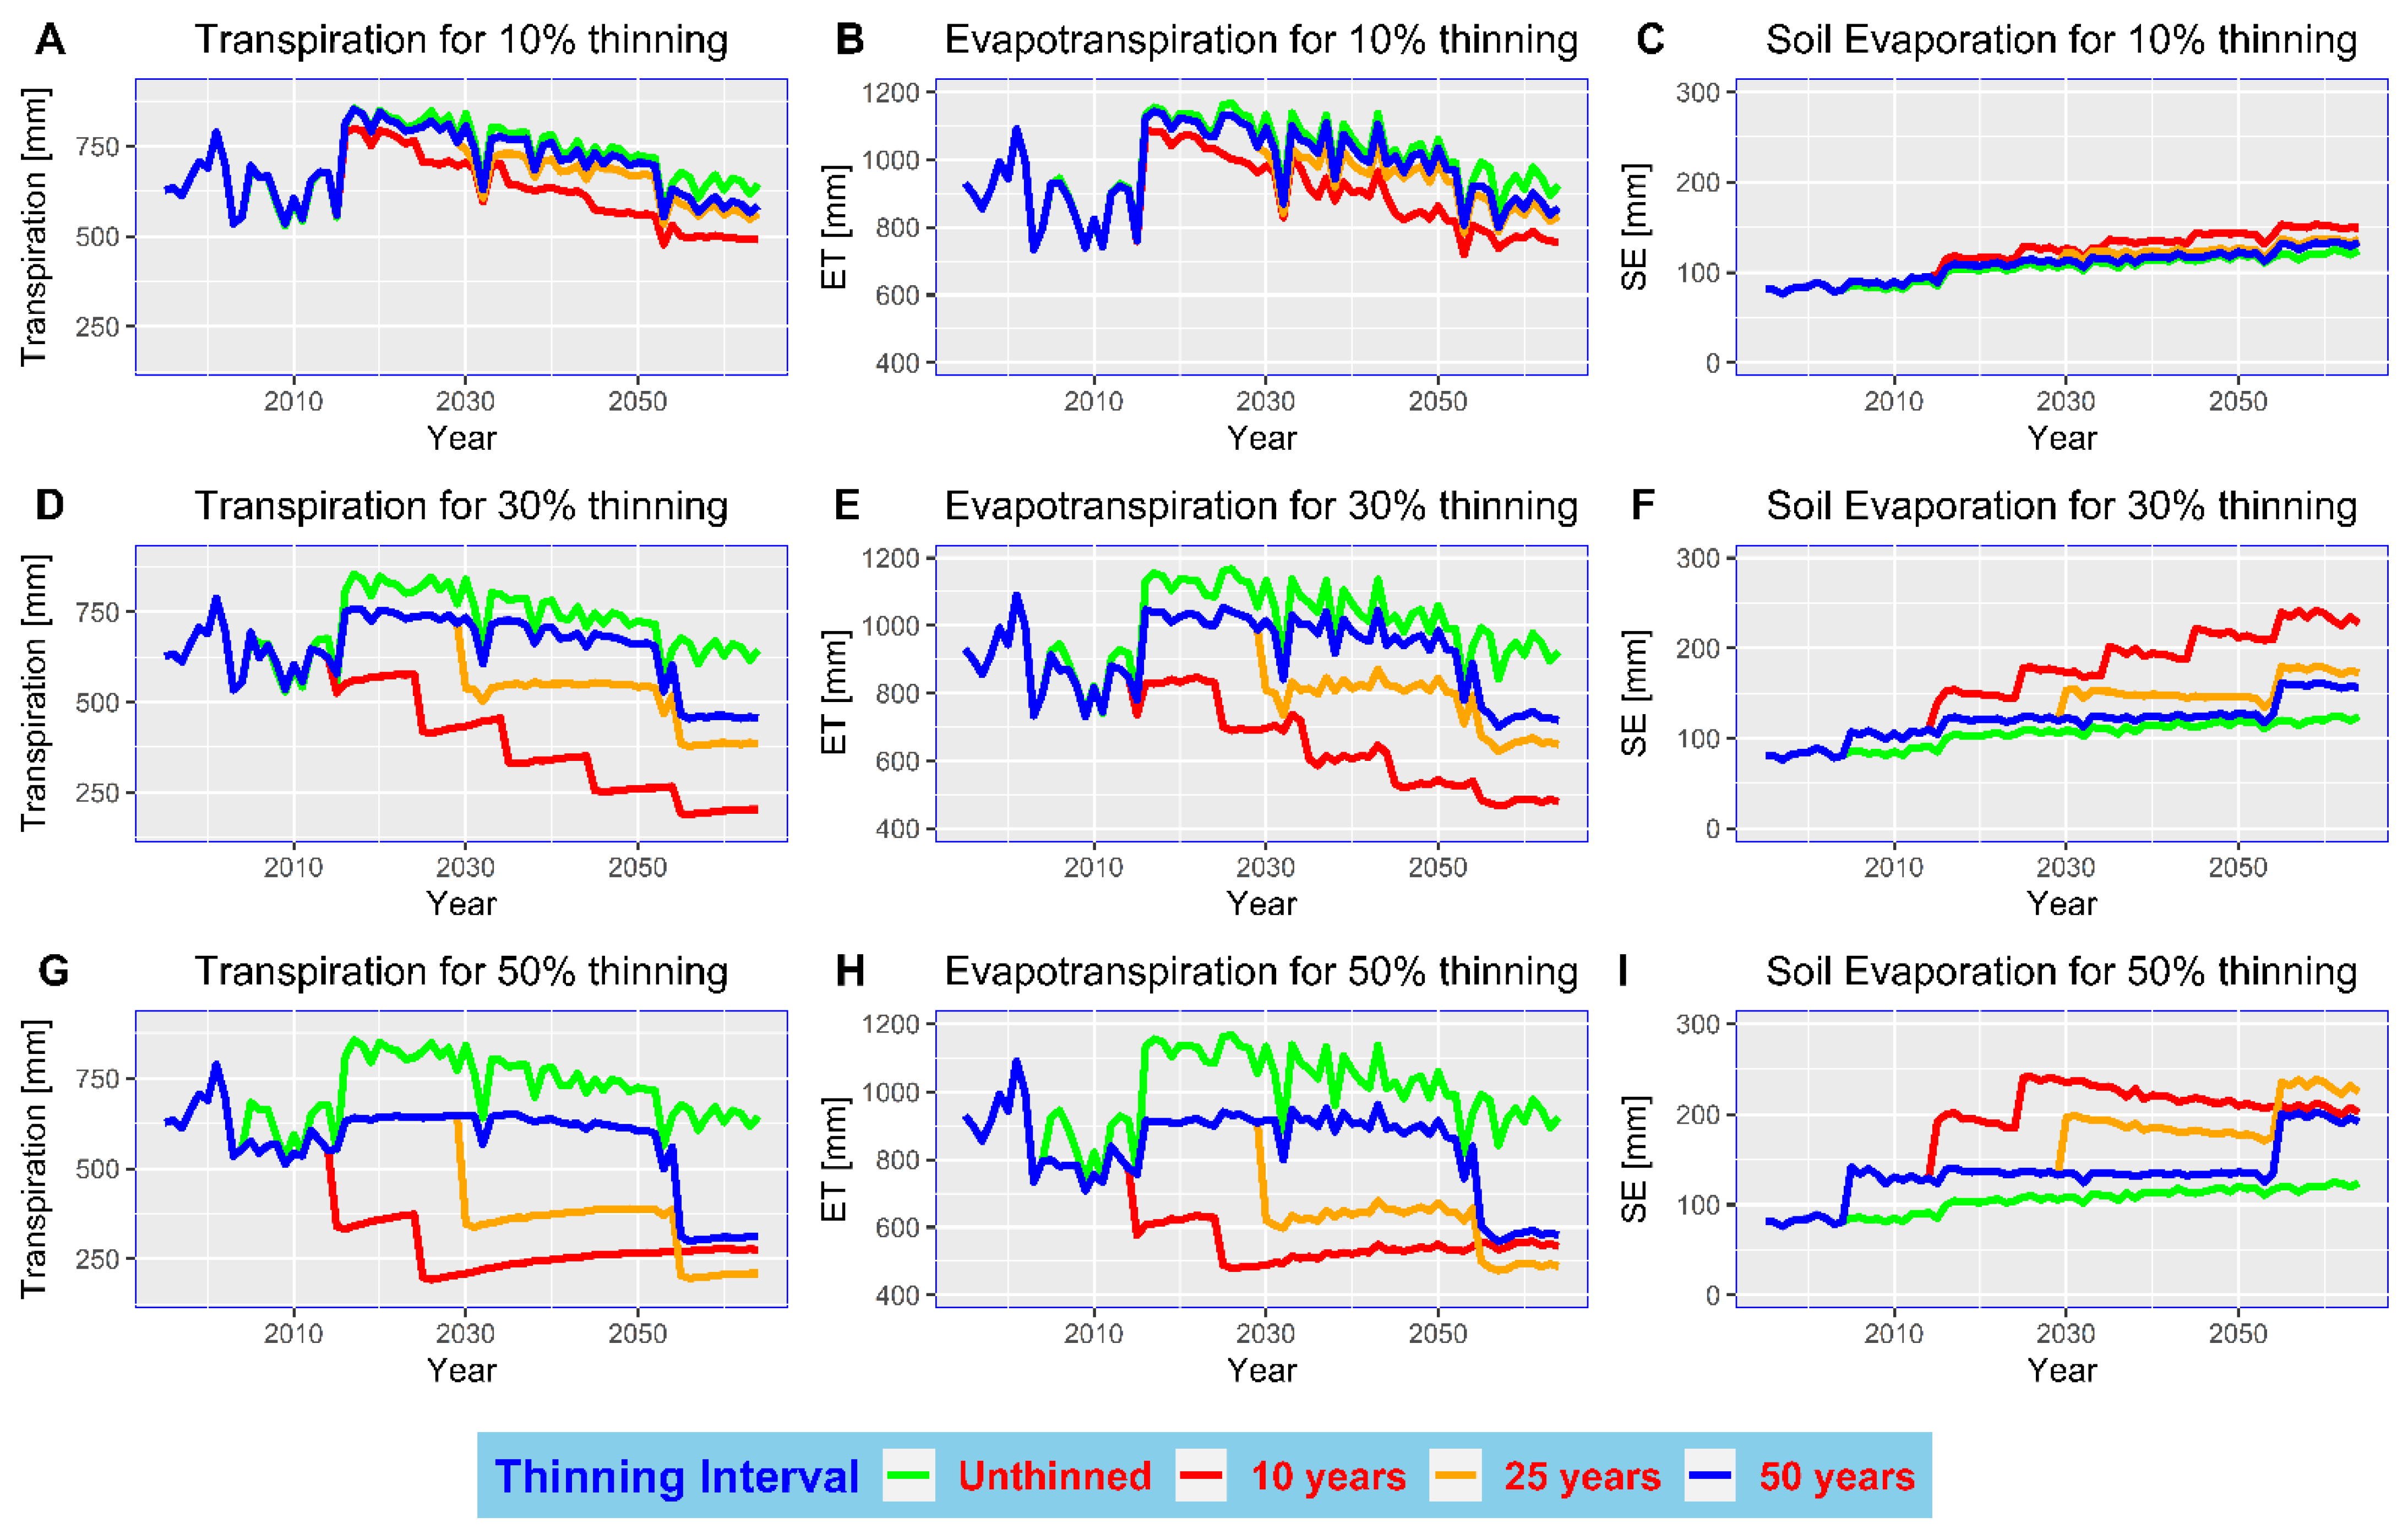
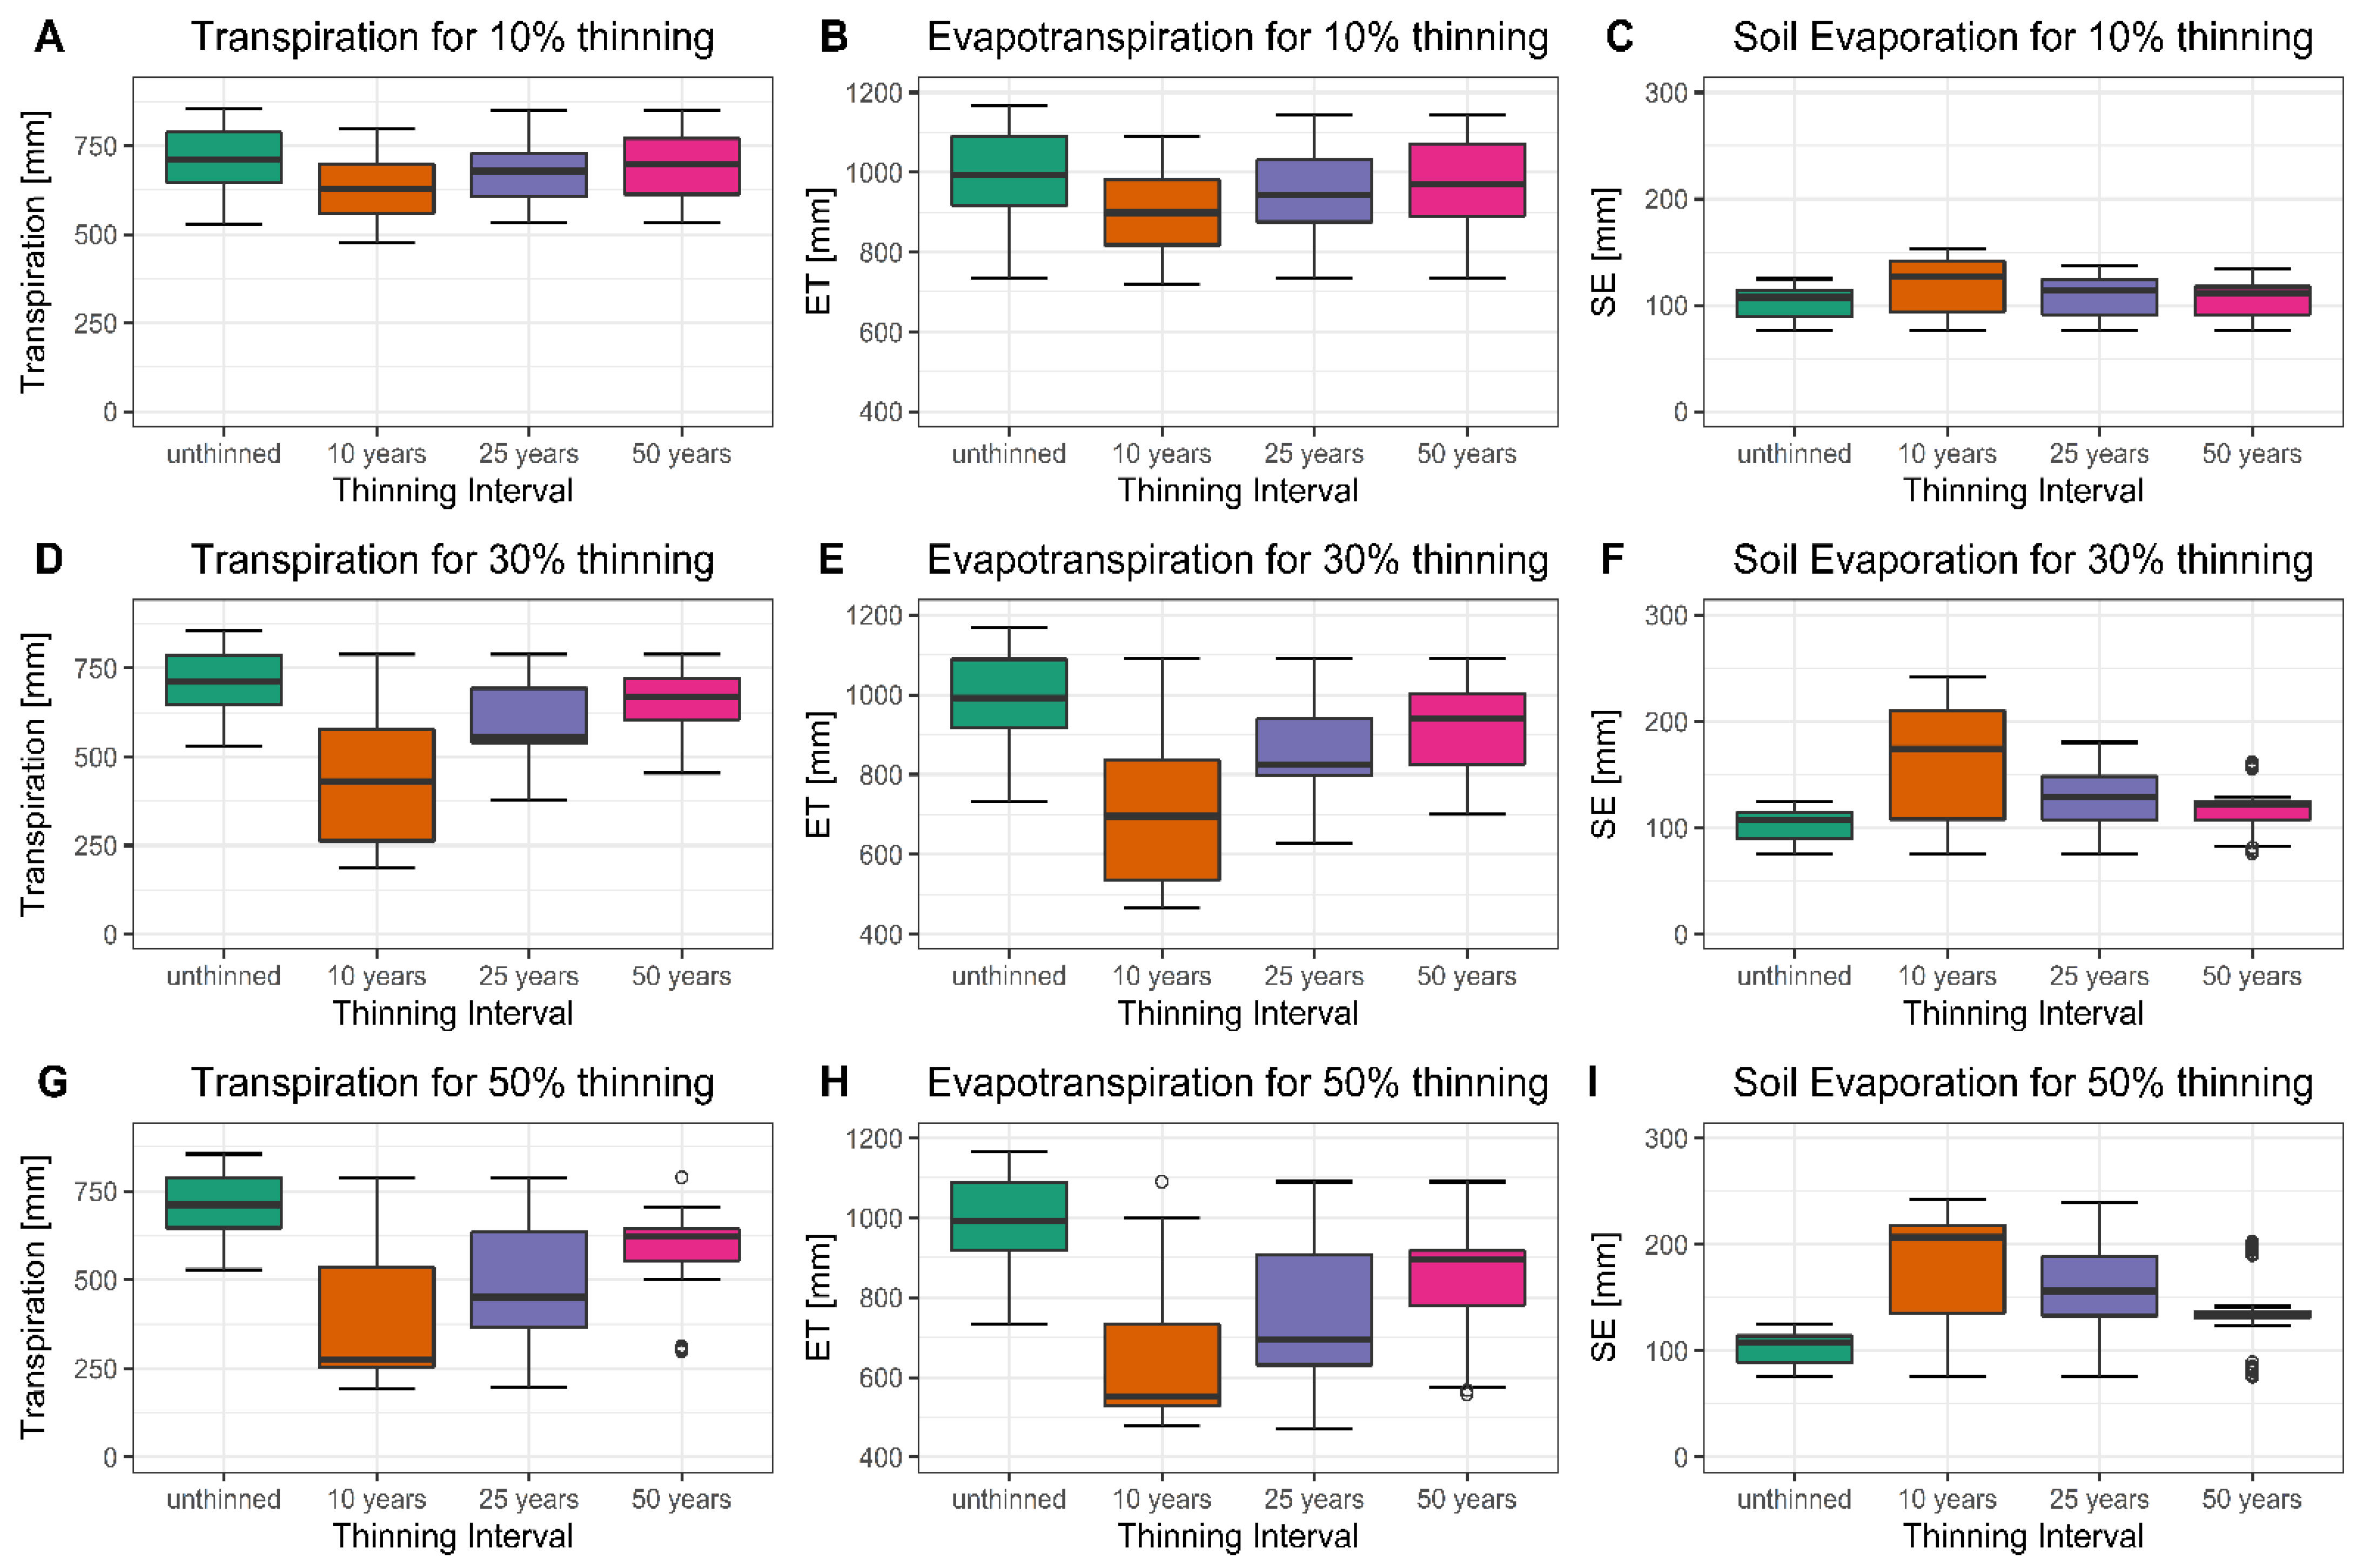
3.2. Effect on Transpiration, Evapotranspiration and Soil Evaporation

Effect of thinning on transpiration, ET and soil evaporation gets prominent with increasing thinning intensity. Figure 2 shows that the transpiration and ET are decreasing whereas soil evaporation is increasing for all thinning regimes. However, transpiration and ET are higher for longer interval whereas soil evaporation is higher in a shorter interval.
The ANOVA test shows that transpiration and evapotranspiration are decreasing significantly (p-value < 0.05) with intensity, interval, and their combination. However, soil evaporation is significantly increasing (p-value < 0.05) with intensity, interval, and their interaction (Table 3).
The boxplot (Figure 3) of transpiration, evapotranspiration, and soil evaporation further supplements the test results (Table 3 and Appendix D). The boxplot shows the mean transpiration and evapotranspiration is lower and soil evaporation becomes higher with increasing thinning intensity. However, transpiration and ET are higher for longer intervals and soil evaporation is higher for short intervals.

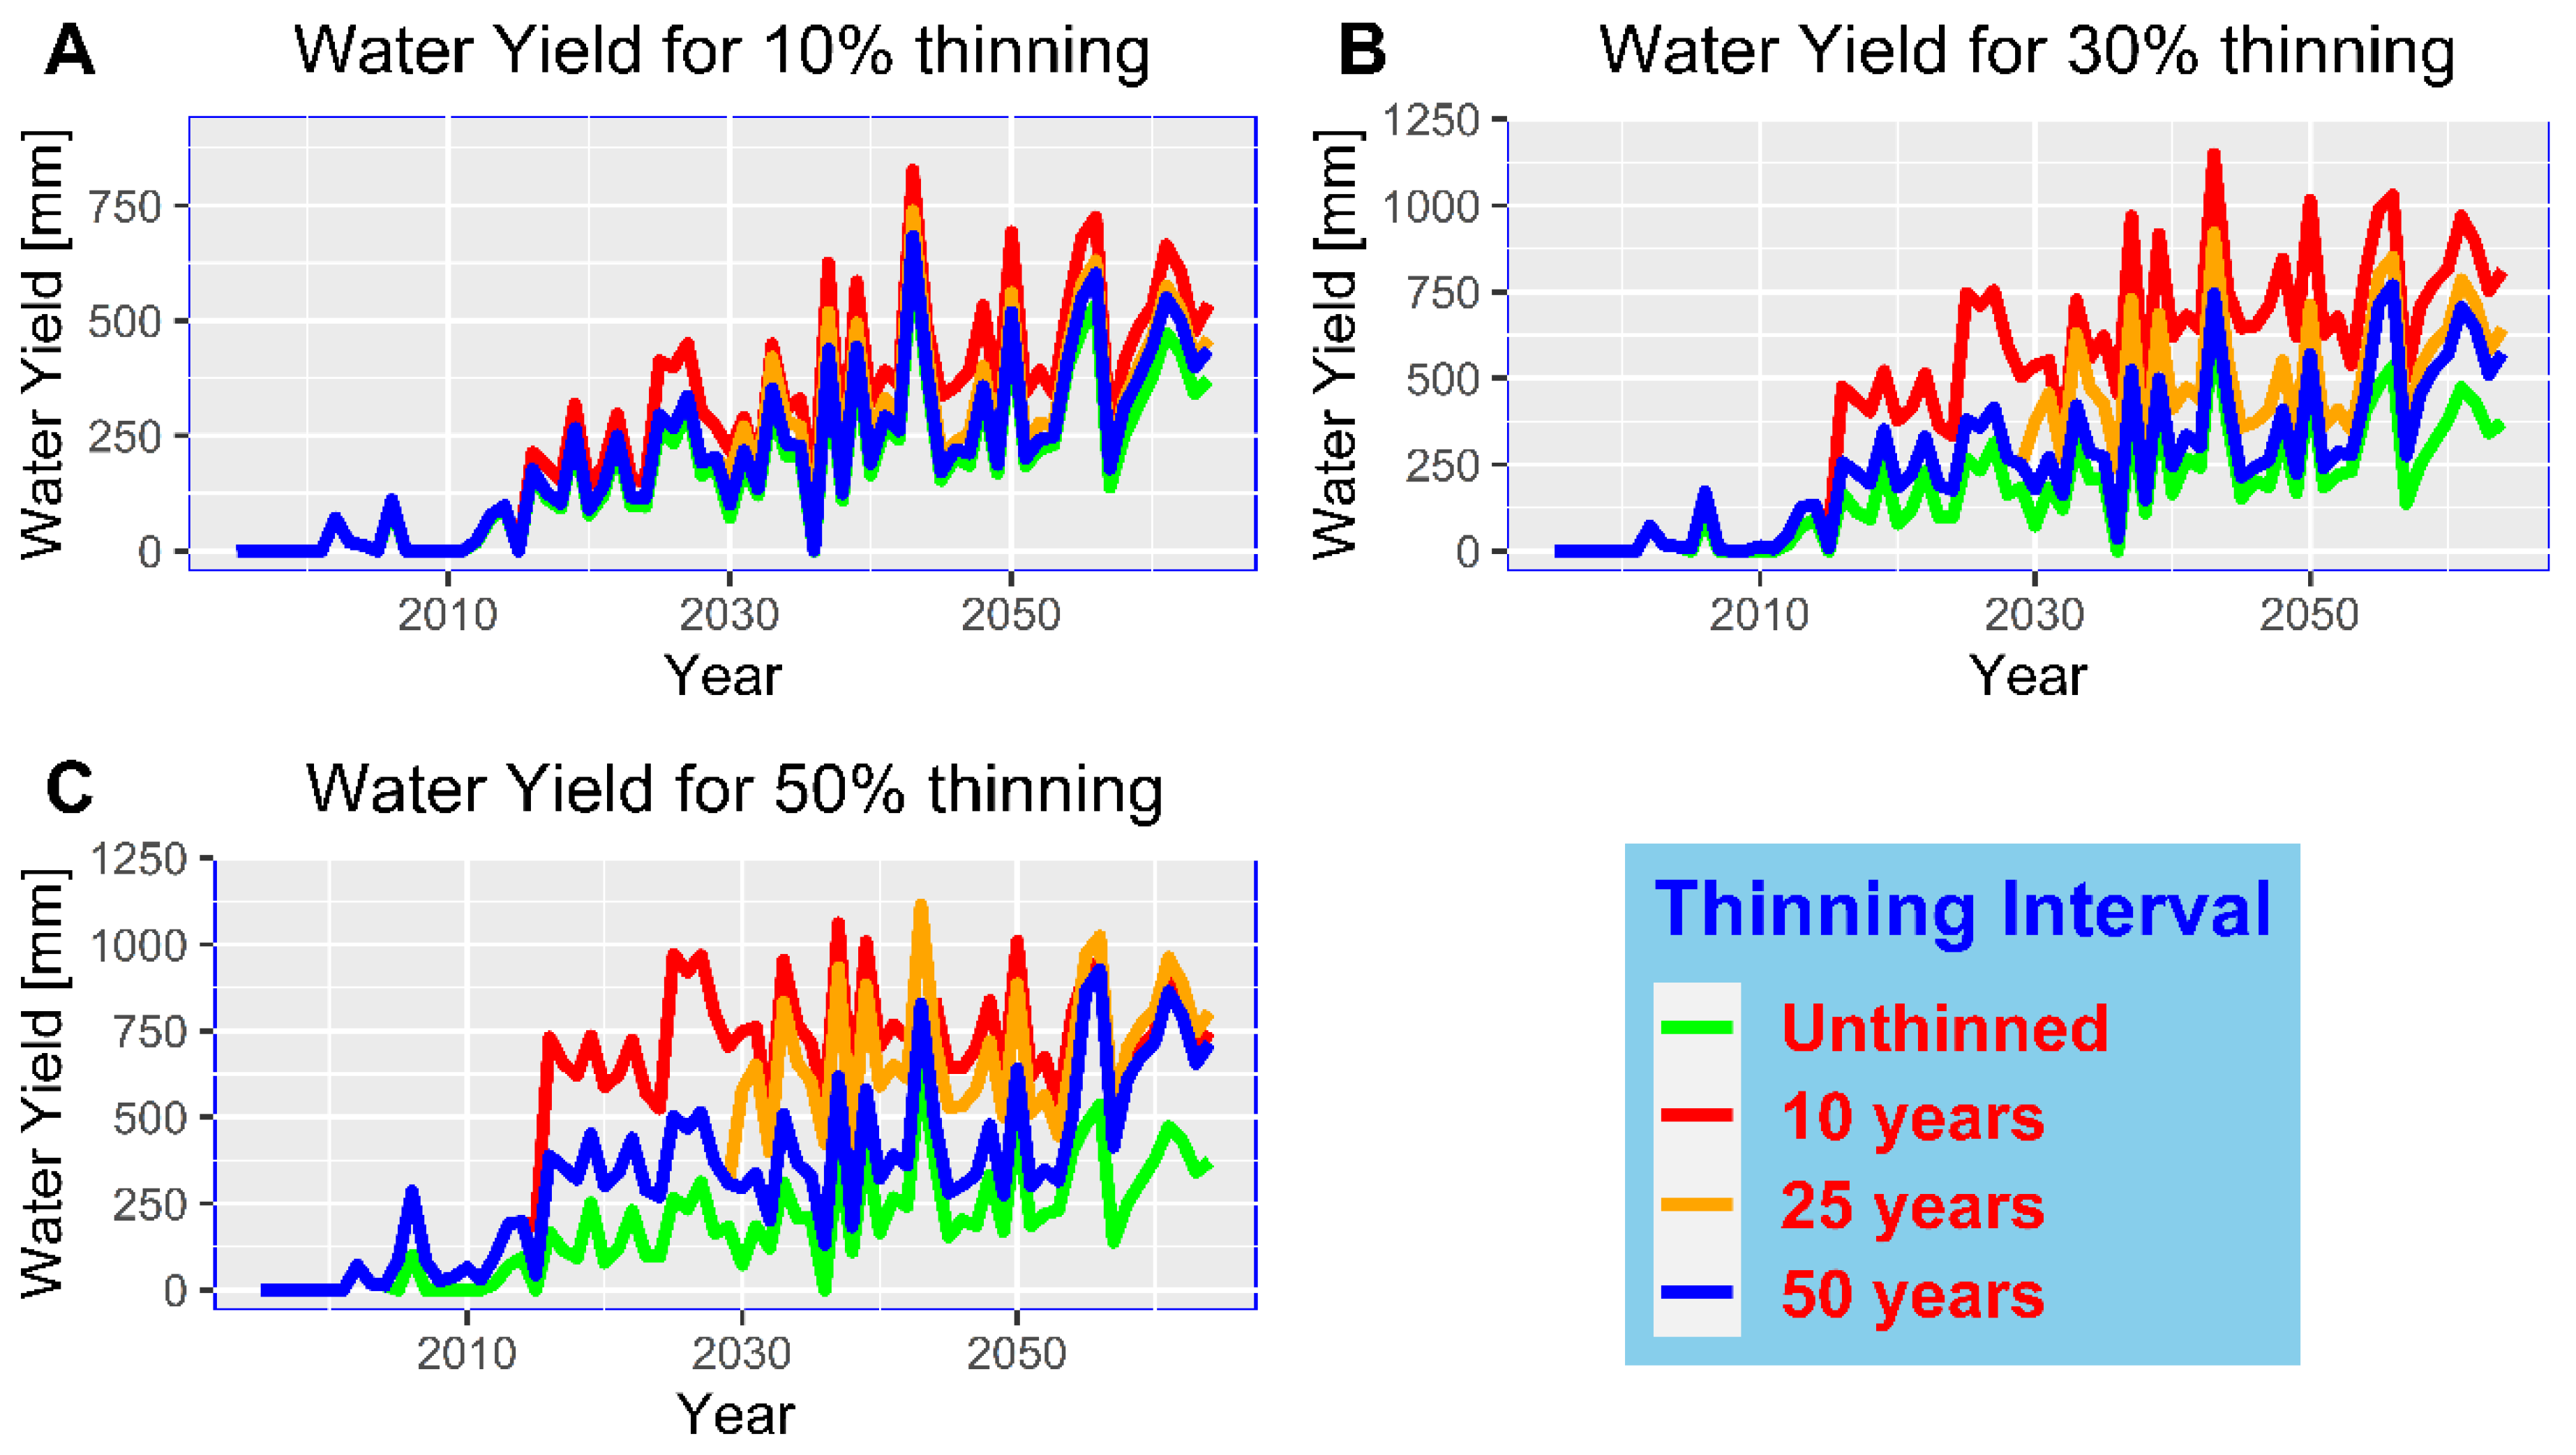
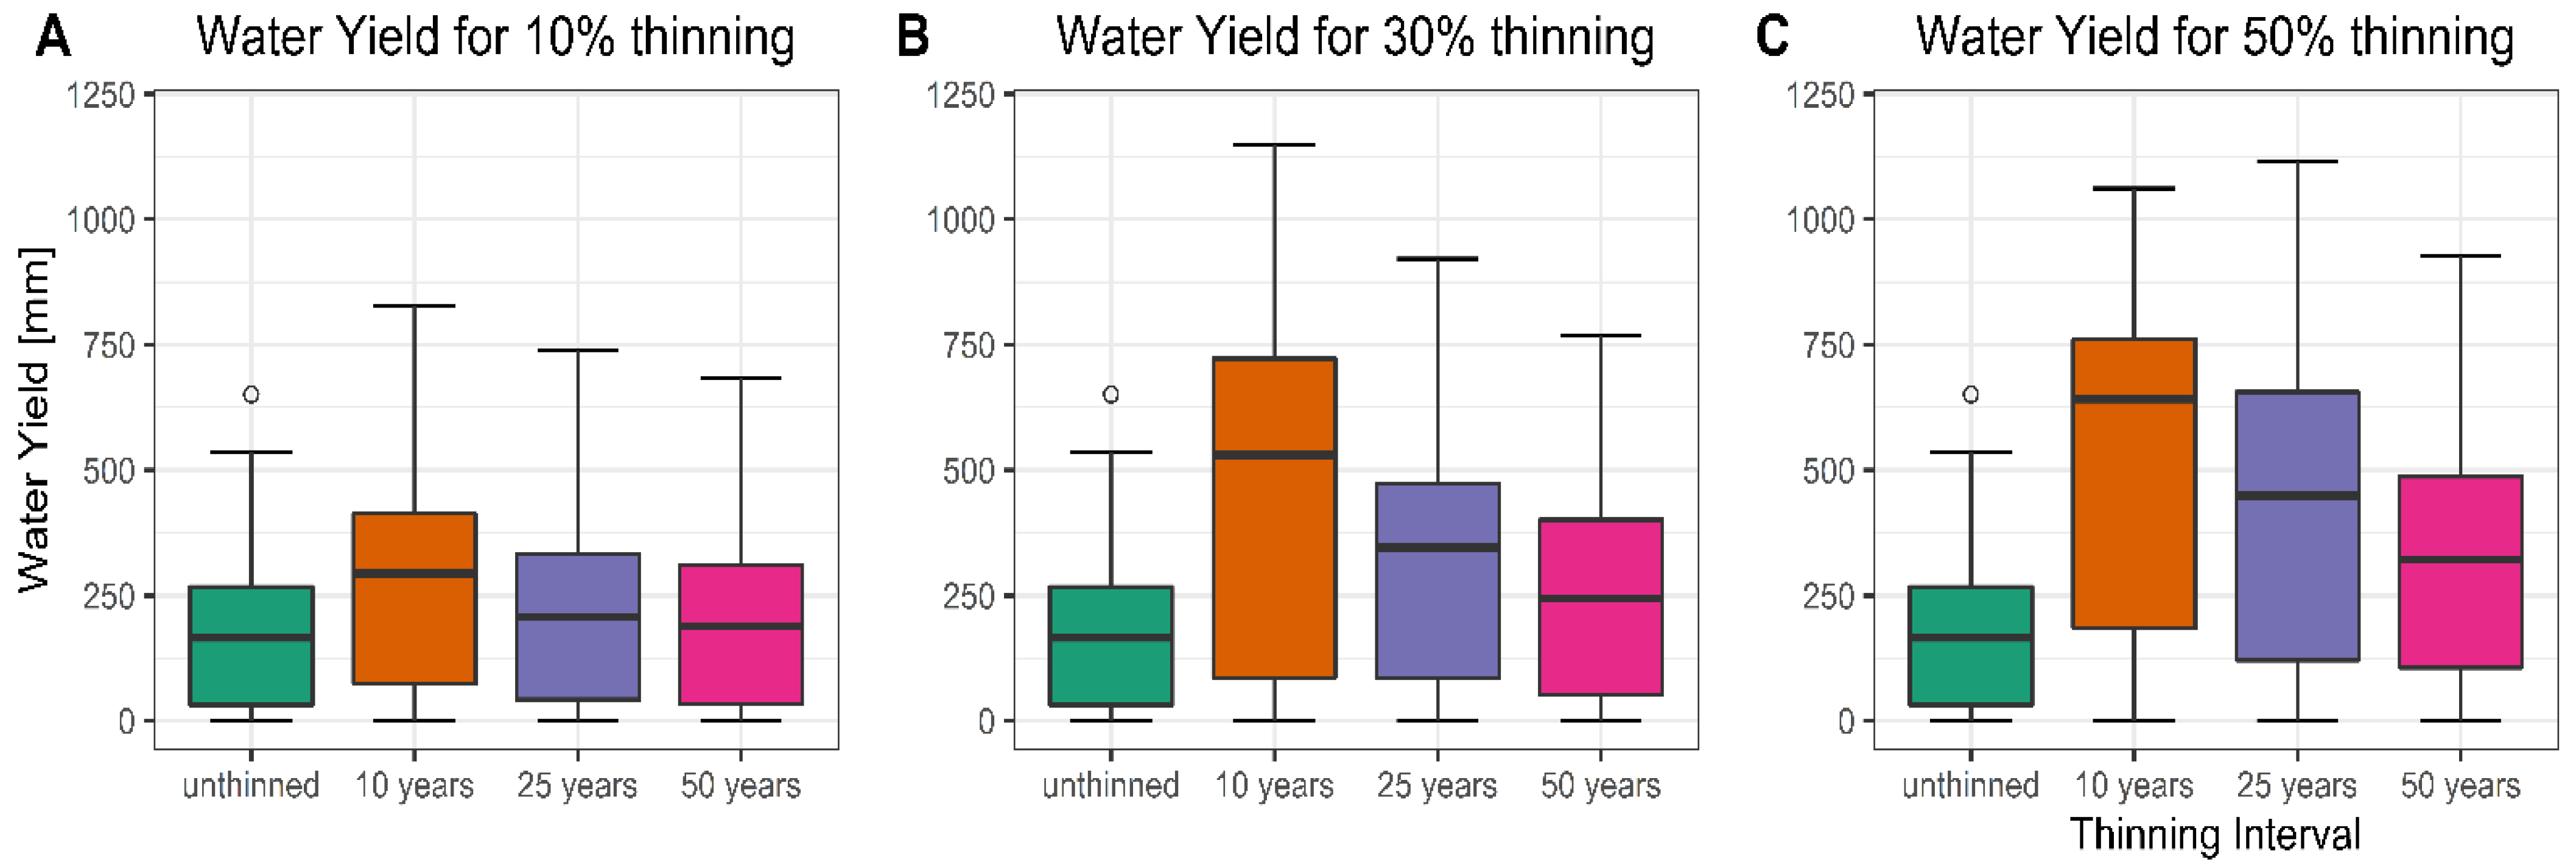
3.3. Effect on Water Yield

The graph for water yield is almost overlapping overlapping for all of the intervals applied in light thinning. For moderate and heavy thinning, water yield seems to be increased with age for all thinning intervals. It is not conclusive only from the graph (Figure 4) whether there is a difference in the mean of these characteristics.
Two-way ANOVA test solved the ambiguity showing that water yield differs significantly (p-value < 0.05) for all thinning regimes used (Table 4).
The boxplot (Figure 5) of water yield further supplements the ANOVA test results (Table 4 and Appendix E). The boxplot shows the mean water yield is highest when thinned at 10 years for all thinning regimes used.

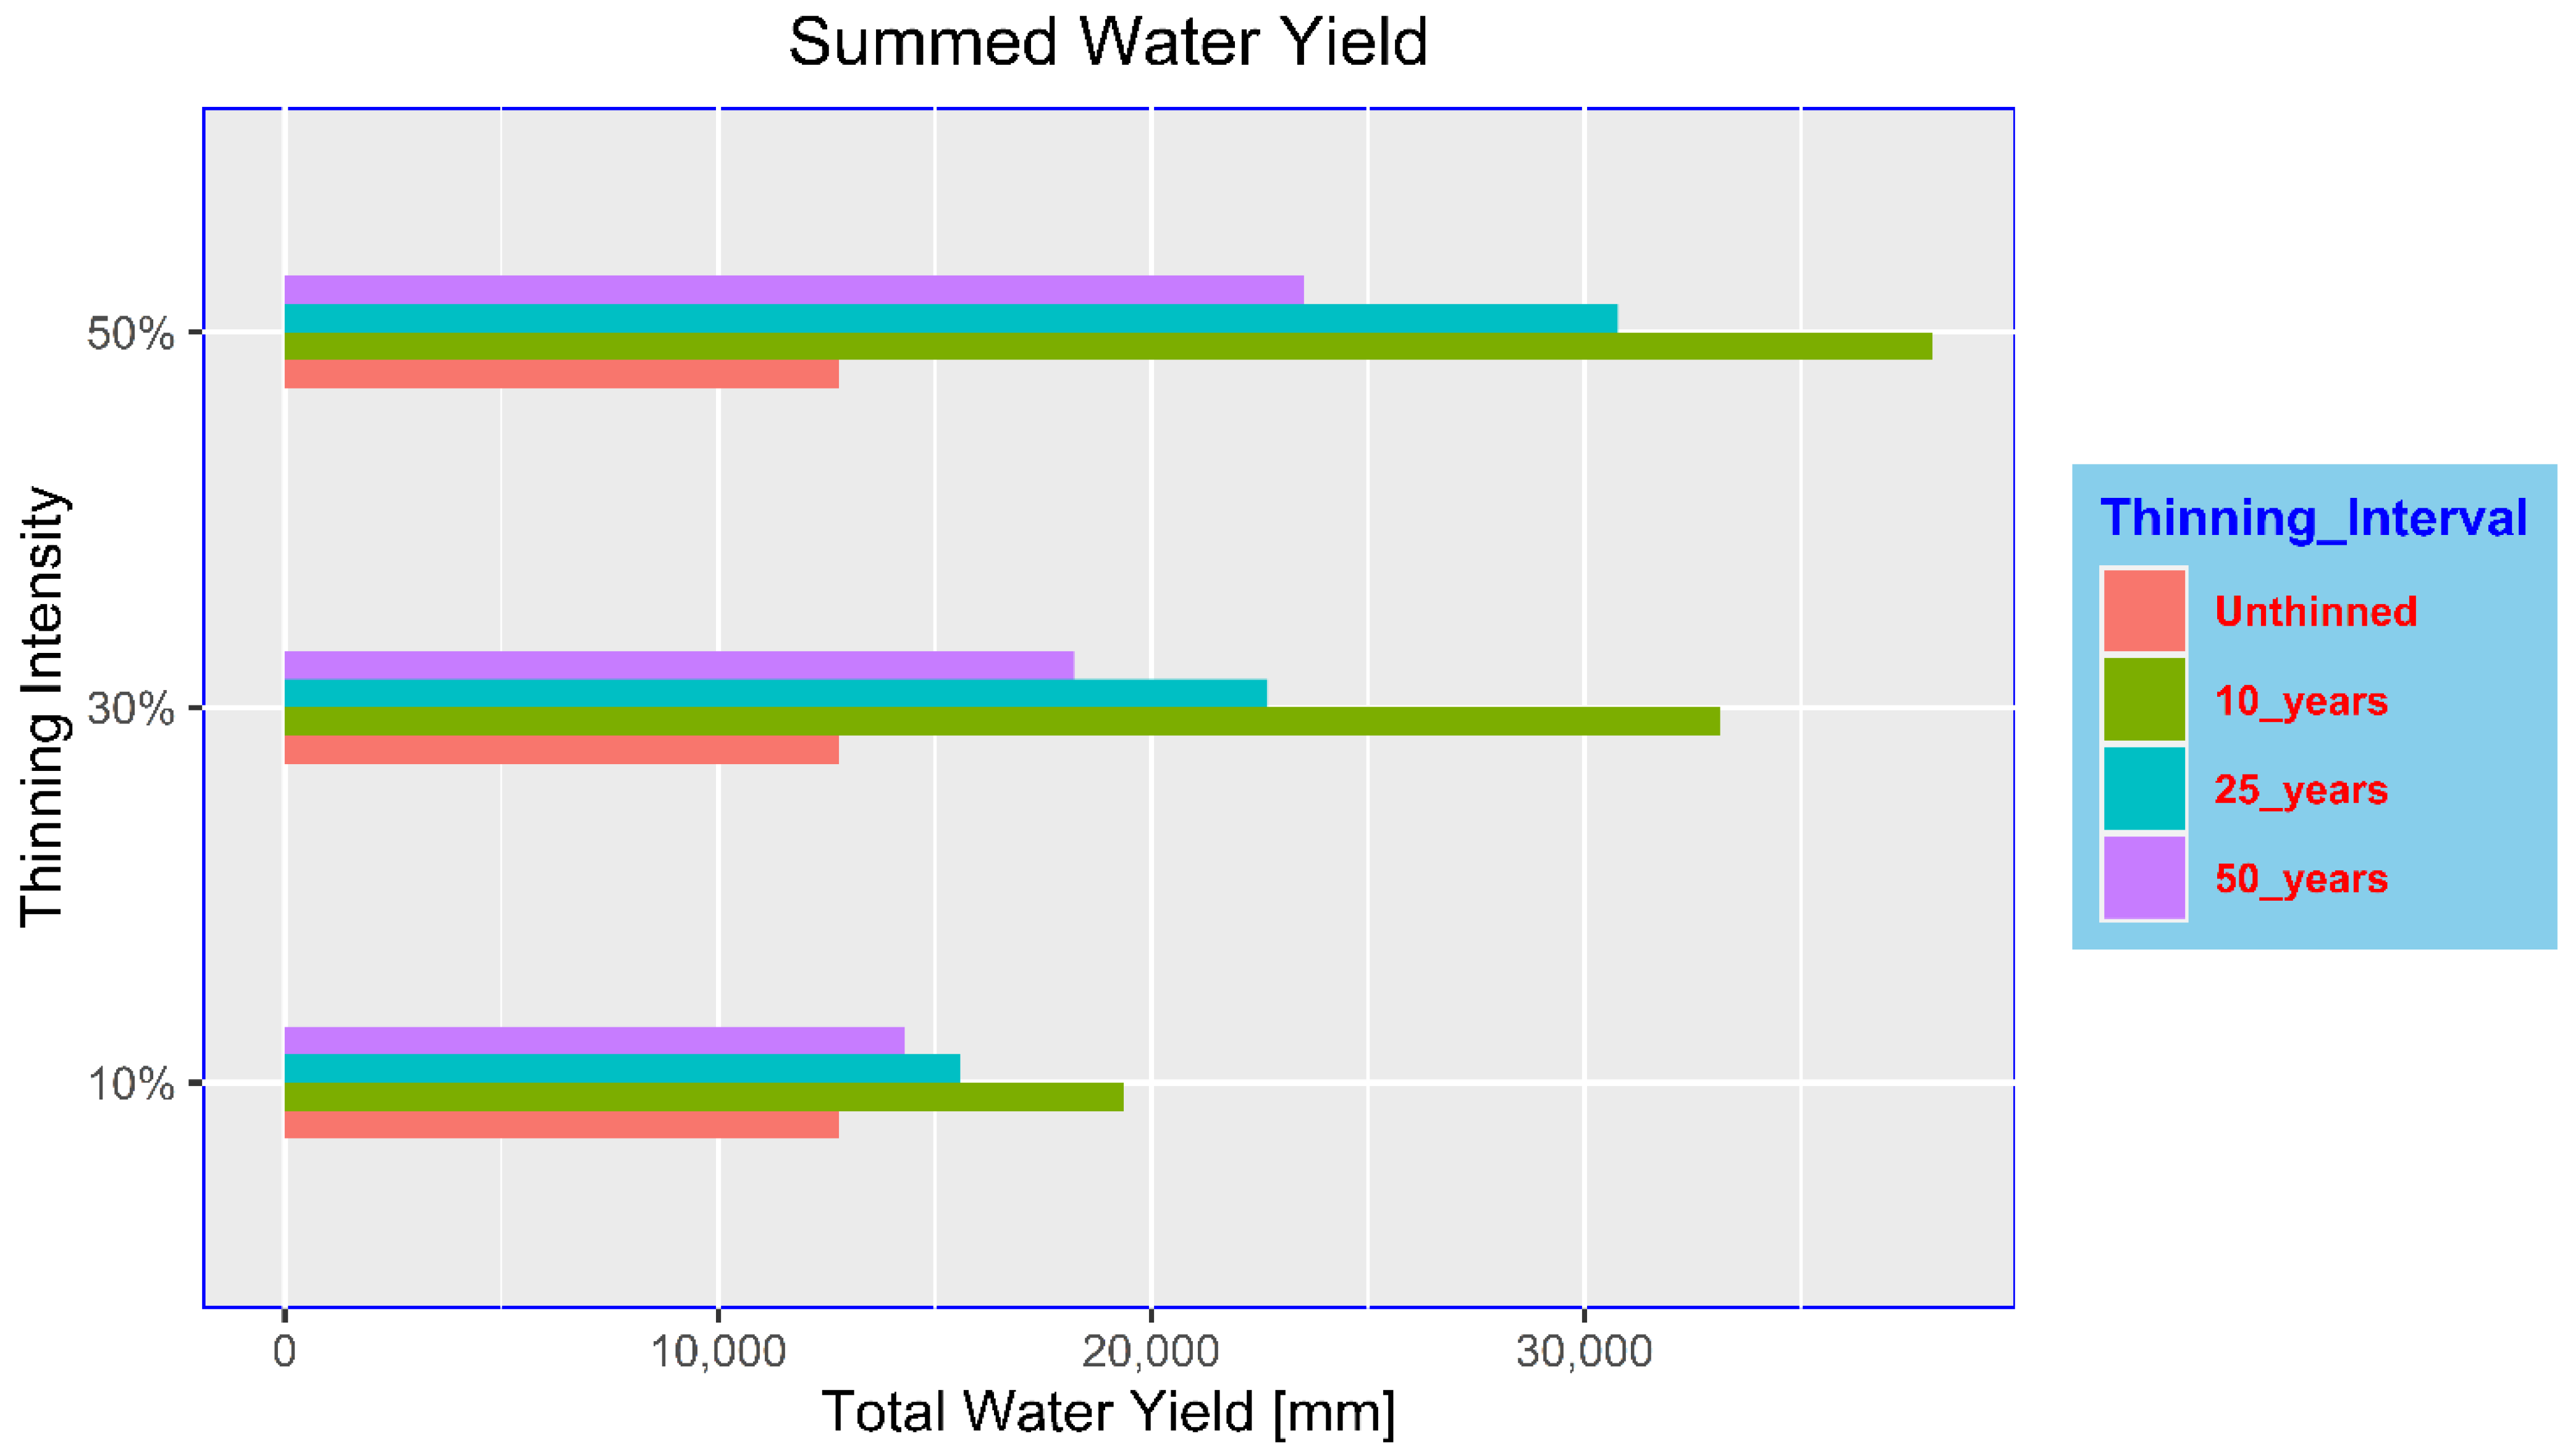
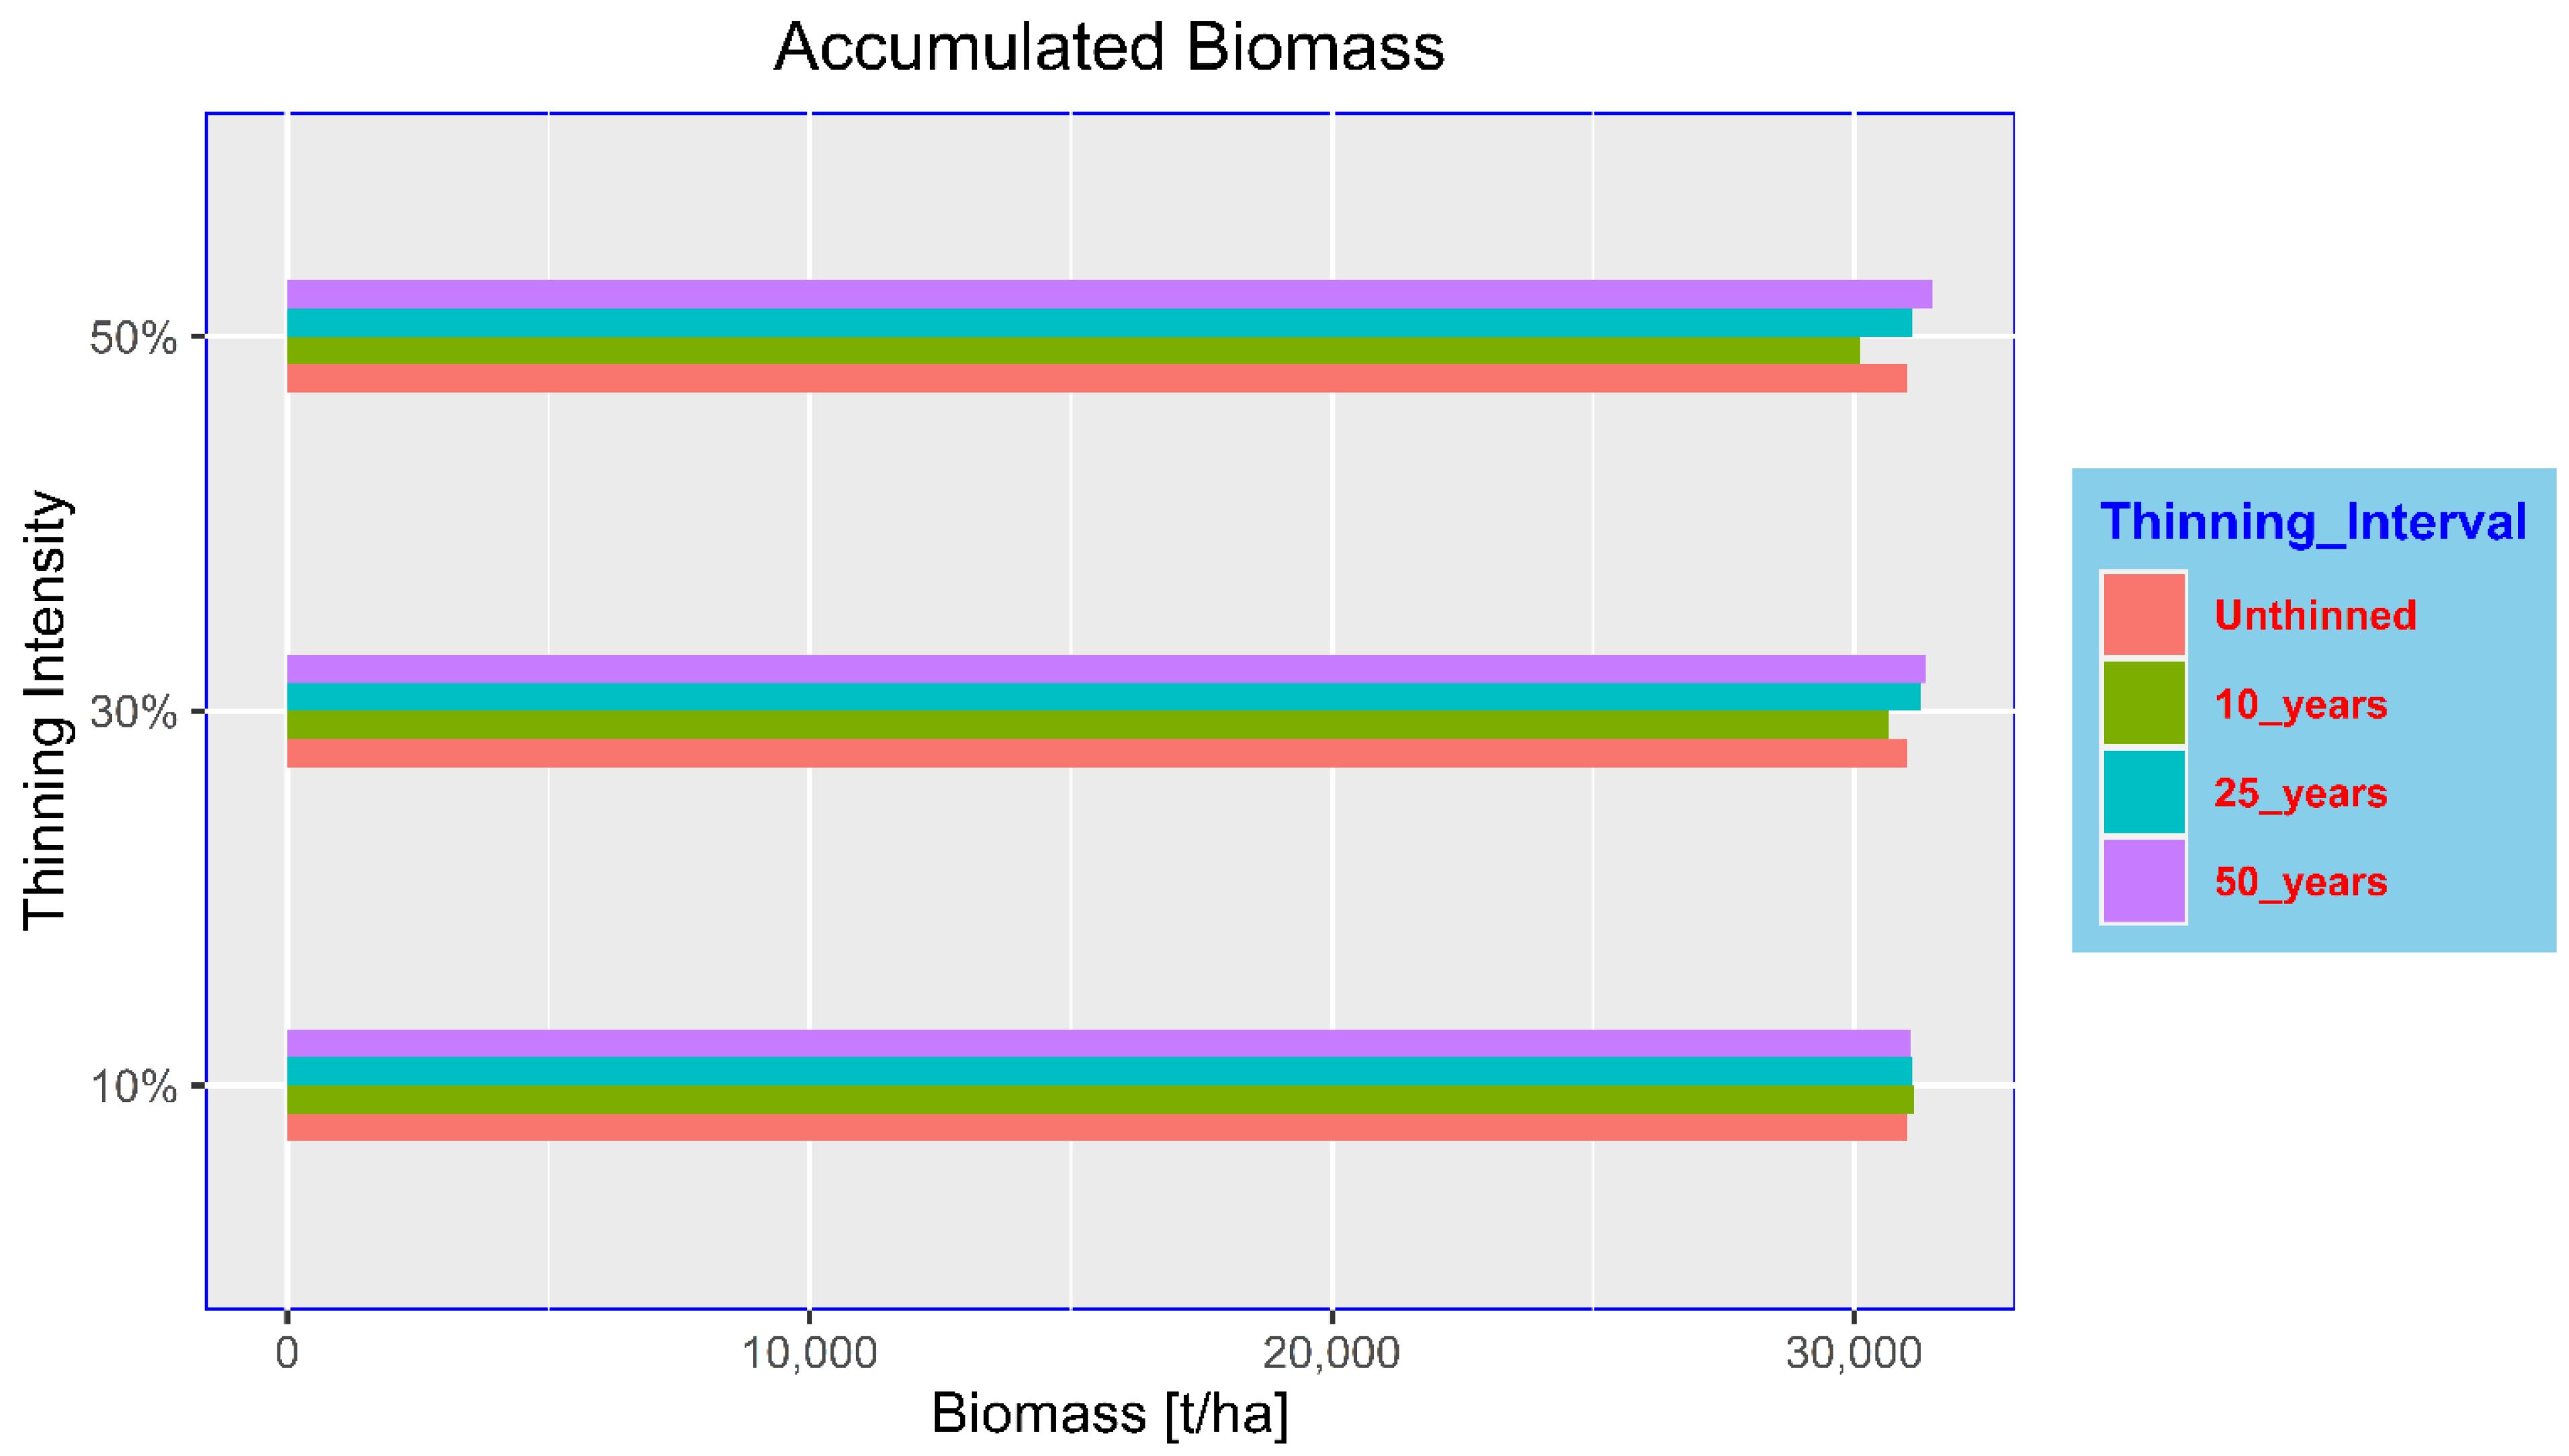
3.4. Accumulated Effect on Biomass and Water Yield

Total number of thinning applied per thinning regime is shown in Table 5.
The graph (Figure 6) shows the total water yield over the period of 70 years (stand age from 75 years to 145 years). Water yield is maximum for 50% thinning at the 10 year interval. The water accumulation is increasing with the thinning intensity but is decreasing with the increasing thinning interval. Light, moderate, and heavy thinning produced 51.34%, 158.98%, and 197.27% more water than in an un-thinned stand for 10 years interval. However, the increment in water yield in comparison to un-thinned stand remained to 11.84%, 42.36%, and 83.82% for light, moderate, and heavy thinning, respectively, in stand thinned at the 50 year interval.
The stand biomass predicted annually by the model were summed over the management period. Light thinning at the 50 year interval produced the highest stand biomass among the thinning regimes without considering the un-thinned stand (Figure 7). Stand biomass decreased with increasing thinning intensity. Light, moderate, and heavy thinning produced 23.68%, 55.01%, and 64.43% less biomass than an un-thinned stand.
For calculation of accumulated biomass, thinned stem, thinned foliage, and thinned root biomass were accumulated and added to the stand biomass predicted by the model. Heavy thinning at longer interval accumulated the highest biomass (1.5% more than in un-thinned stand). Nevertheless, accumulated biomass does not change much in response to the used thinning regimes. (Figure 8).

4. Discussion

4.1. Thinning Effects

In forest decision-making, the provision of ecosystem functions and services has gained priority in the present day. The effect of diverse silvicultural treatments on the provision of ecosystem services, particularly the effect of thinning, must be identified to enable multi-functionality in forest management [36]. Changing climatic conditions demand the change in silvicultural treatments to make differently developing stands more vigorous, resilient, and sustainable [37]. Conventionally, thinning mostly focused on tree and stand growth for the yield of timber [38].
In this study, three different intensities were applied at three different intervals to a 75-year-old Norway spruce stand. This study incorporates thinning, which leaves 90%, 70% and 50% of trees in stand. This aligns with the idea that there should be minimum of 30% forest cover to maintain sustainable water flow regulation [39]. For heavy thinning at 10-year interval, only three thinning events were applied out of six possible to avoid reducing trees to the minimum number, seemingly to a clear-cut condition. This also aligns with the idea of not opening the stand too much and to protect from possible sensitivity to heavy winds as pointed out by Wallentin & Nilsson, 2013 [40]. Furthermore, creating such a condition of almost clear-cut will have an influence on forest soil, litter, and nutrient pools in vegetation of the understory [41]. Besides, it is important to add the knowledge of thinning effect on stand water balance [42], in addition to several studies [43,44,45,46] on the effect of thinning intensities and frequencies on stand growth and wood properties.
The model predicted the highest accumulated water yield for heavy thinning done at a 10-year thinning interval. However, biomass production is minimum for this thinning regime. The reason behind the minimum biomass production is the number of thinning events applied in this regime. The number of thinning is reduced for heavy thinning at 10 years interval to avoid seemingly clear-cut situation caused by heavy thinning. Repeated heavy thinning at short intervals causes a very low stand density thus a high loss of intercepting surfaces. The rainfall interception highly decreases and rainfall directly reaches the ground allowing for an increase in infiltration and deep percolation [47]. On the contrary, light thinning applied at a longer thinning interval accumulated higher biomass but is decreasing the water yield (Table 6).
Our results showed that water yield and soil evaporation increased with higher thinning intensities, decreasing stand density. Due to less rainfall interception, throughfall increases in thinned stands and causes higher water yield. Moreover, light interception by the stand canopy is decreasing, and thus more solar radiation is absorbed by the forest ground causing an increase in soil evaporation. Both processes, rainfall as well as light interception, are simulated by 3PG-Hydro. In line with our results, Bottero et al., 2021 [47] pointed out that light thinning maintains high stand density which allows for higher interception of rainfall, which causes less water availability in the ground. Similar finding is also reported by Sohn et al., 2013 [17] in Norway spruce stands. The results also match with the study on Norway spruce monoculture stands by Gebhardt et al., 2014 [42] in Bavaria, Germany where water yield increased up to 90% following moderate and heavy thinning and increased with increasing thinning intensity. In addition, evapotranspiration reduced by 25% and 50%, respectively, for moderate and heavy thinning. Hawthorne et al., 2013 [15] also reported an increase in water yield following the application of thinning events. The reason behind this is the increased capture rate of resources (easily available after thinning due to increased spaces) [48]. Transpiration and evapotranspiration decreased with increasing thinning intensity as well as with age. The transpiration is lower from 1995–2015 because precipitation was generally lower in this period (the simulated precipitation data of RCP 8.5 is generally higher). In addition, transpiration is decreasing in all thinning regimes because of increasing age of the stand. This decrease with age aligns with the findings by Köstner, 2001 [49] for a Norway spruce stand. Furthermore, the predicted evapotranspiration falls in the acceptable range as provided by Greenwood, 2007 [50].
Regarding the forest growth in terms of biomass, the model predicted less stand biomass for all thinning intensities and intervals than in an un-thinned stand. The finding is also similar to the research studying the effect of thinning over 50 years in moist forest of the Northern Rocky Mountains by Shen et al., 2019 [51]. The stand biomass for all thinning regimes were significantly different than in un-thinned stand. However, the significant differences were not seen among the thinning regimes for the accumulated biomass. This result is aligned with Eriksson, 2006 [52] where it is mentioned that detection of significant differences in accumulated biomass from different thinning regime is difficult in Norway spruce stands. The highest biomass is produced in 50 years interval for all thinning intensities. This might be because a short thinning interval between successive thinning did not allow the remaining trees to spread their foliage to an area made available by thinning [53]. In contrast, thinning with a longer interval in between successive thinning provides more area and scope for production. With these results, we can interpret that for any thinning intensity, the thinning interval should be increased to produce more biomass.
Our results present the findings that there exists an inverse relationship between biomass production and water yield. Even though 3PG-Hydro predicts the highest water yield for heavy thinning (at shorter thinning interval), these thinning regimes cannot be recommended in general forestry practices as they promote ground weeds that may compete with other trees for water and hinder regeneration [42]. Despite light thinning producing greater stand biomass (at longer thinning interval), it is not efficient in accumulation of water yield. Thus, the most efficient thinning regime according to the model in terms of both biomass and water yield is repeated moderate thinning at a 25-year interval. This recommendation matches with Gebhardt et al., 2014 [42] and Sohn et al., 2013 [17] who suggested that repeated moderate thinning can be taken as a feasible measure to mitigate drought risk in Norway spruce stands in the context of climate change. In addition, Magruder et al., 2013 [16] also have similar findings in a red pine stand for improving climatic resilience of the stand.

4.2. 3PG-Hydro Model and Limitation of the Study

The 3PG model has the simplest structure with small data input requirements while comparing to other process-based models such as CABALA and Forest-DNDC. 3PG outweighs CABALA in terms of data requirements as the later demands greater input. Although Forest-DNDC requires moderate data input, 3PG outshines its lower computational demand [54].
The performance of 3PG-Hydro is better than the original 3PG as the balance between low data intensity and relevant decision parameters is obtained making it more efficient in analysis of interaction between forests and water under climate change conditions. This makes the model more efficient in analyzing thinning effects on water, forest growth, and carbon stocks. 3PG-Hydro is effective in determining the effect of thinning on tree growth and soil water during drought and can help to find how thinning increases the water yield for ecological and economic reasons [33].
We performed the model prediction for thinning in a Norway spruce stand of 75 years, unlike other researches unlike other researches such as Son et al., 2013 [17], Kohler et al., 2010 [21], Gebhardt et al., 2014 [42], Sohn et al., 2012 [55], and Wallentin & Nilsson, 2011 [46], who studied the effect of thinning on 27 years and 33 years old, respectively, on monoculture stands of the same species. The climatic data derived from the RCP 8.5 scenario was used for the study. Representative Concentration Pathways (RCPs) are designed to fight climate change, which includes the greenhouse gas concentration and emission pathways [56]. This is the scenario without any specific target for climate change mitigation leading to continuous increase of greenhouse gas emissions [57]. Thus, this study predicted the thinning effect on water and stand properties in a worst-case scenario of climate change. Ref [58] has also used RCP 8.5 in the 3PG model to improve annual increments of volume and revenue through adaptive management regimes with shorter rotation periods in Kronoberg landscape, Sweden. Similarly, Xie et al., 2020 [59] has also used this climatic scenario in 3PG to simulate effects of climate change and thinning on productivity of a Larix olgensis plantation in Northeast China. The predicted results from this study are only valid for RCP 8.5 scenarios in 75 years old monoculture stand of Norway spruce in Conventwald because of limitations and uncertainties in stand, site, and climatic characteristics.
Forrester et al., 2021 [26] pointed out that the errors for calculation of biomass are higher in the 3PG model, as it predicts by using the allometric equations which are unlikely to be as accurate as site specific destructively sampled biomass measurements. Thus, this model does not reflect the actual variability in allocation of biomass. Furthermore, Forrester et al., 2021 [26] found out that the error is highest in foliage mass prediction which directly affects the prediction of water yield from the stand. In addition, this study does not incorporate the self-thinning principle because the stem mass was much lower than the parameter provided by Forrester et al., 2021 [26] from which self-thinning starts to occur. Moreover, the major focus of this study was on the effect of management (thinning) in the stand. Leaf Area Index (LAI) is still the most important regulator of canopy conductance, and thus plays a key role in estimating transpiration. Evapotranspiration is controlled by canopy conductance, stomatal conductance, and effective LAI as previous research has shown [60,61]. The 3PG model uses the LAI and associated values to calculate transpiration as well as rainfall and light interception of the canopy. Hereby, we changed the usually used value for Norway Spruce of the parameter LAI for maximum rainfall interception from 3 to 5 [62]. This parameter change achieved a higher sensitivity of ET and interception processes to thinning regimes causing a better model performance of 3PG-Hydro. Therefore, we recommend the use of this value when investigating the effects of thinning on ET processes. The changed value falls within the acceptable range of LAI for P. abies as found by Goude et al., 2019 [63].
Besides the overall good performance of 3PG-Hydro, its major limitation lies in the one-dimensional vertical flow simulation. Thus, the study did not account for lateral processes or more complex water flows. However, flow processes are simulated on behalf of the soil water content and even though it simulates vertical flow only, this can be seen as a good approximation because vertical flow is the main process in soil water dynamics. Moreover, 3PG-Hydro has limitations in simulating real runoff making runoff a minor process in our study [33]. Yet, runoff can vary highly by changes in stand density due to thinning [64]. Nevertheless, our study has provided an overview of the thinning effects on soil water processes. This can be taken as a starting point to integrate forest water services into the planning of forest management. Moreover, our results can be used further to develop and integrate forest interaction with watershed processes as a relevant scale for landscape water studies.
Future studies of forest water interactions may apply holistic research with variation in thinning approach such as mixing several intensities of thinning at various intervals Furthermore, the outputs of our study may be used for analyzing the economic and environmental benefits and tradeoffs with relevant ecosystem services in forest management plans [59].

5. Conclusions

Our study concludes that thinning improves the water yield in an old Norway spruce stand. However, the longer interval in between thinning does not support the case. Stand biomass decreases with increasing intensity while the case is the opposite for thinning interval. Taking the stand age into account, heavy thinning should be avoided for many silvicultural reasons. We conclude that repeated moderate thinning can obtain an efficient production of water services without compromising biomass production.

Author Contributions

Conceptualization, R.Y.; methodology, software, and validation, R.Y., S.R. and M.D.; formal analysis, S.R.; investigation, R.Y., S.R. and M.D.; resources, R.Y.; data curation, S.R., R.Y. and M.D.; writing—original draft preparation, S.R.; writing—review and editing, S.R., R.Y. and M.D.; visualization, S.R.; supervision, project administration, funding acquisition, R.Y. All authors have read and agreed to the published version of the manuscript.

Funding

This research received no external funding.

Institutional Review Board Statement

Not Applicable.

Informed Consent Statement

Not Applicable.

Data Availability Statement

The data presented in this study are available in Appendix A, Appendix B, Appendix C, Appendix D, Appendix E.

Acknowledgments

We thank Forest research Institute of Baden Württemberg (FVA-BW) and ICP-Forests for providing the forest data and Prashant Paudel for valuable suggestions during the investigation process. The study is supported by the activities and exchanges in project “DecisionES” (Grant agreement ID: 101007950) funded by the European Commission.

Conflicts of Interest

The authors declare no conflict of interest.

Appendix A

Table A1. Stand Initialization and site factor data.
Stand Initialization and Site Factor Data
Year planted =1919Snowmelt Factor =2.5
Month planted =December
Initial age =75y 0 mDepth effective root zone (ER) [m] =0.6
End age =145Depth deep root zones (DR) [m] =5
Initial Weight Foliage [t/ha] =12Initial saturation ER [m3 × m−3] =0.15
Initial Weight Stem [t/ha] =316Initial saturation DR [m3 × m−3] =0.15
Initial Weight Root [t/ha] =22Skeleton ER [%] =0.5
Initial stocking =528Skeleton DR [%] =0.5
Latitude =50
Fertility rating =0.5Vol. saturation water content [m3 × m−3] =0.38
Atmospheric CO2 =380Vol. residual water content [m3 × m−3] =0.149
Soil class =SLVan-Genuchten n [-] =1.817
Van-Genuchten alpha [m−1] =0.663
Hydraulic conductivity saturated [m × day−1] =1.931
Output frequency: monthly/annual

Appendix B

Table A2. Thinning regimes used.
AgeStockingFoliageRootStem
Thinning Intensity of 10%
Every 10 years
85475111
95428111
105385111
115347111
125312111
135281111
Every 25 years
85475111
110428111
135385111
Every 50 years
85475111
135428111
Thinning Intensity of 30%
Every 10 years
85370111
95259111
105181111
115127111
12589111
13562111
Every 25 years
85370111
110259111
135181111
Every 50 years
85370111
135259111
Thinning Intensity of 50%
Every 10 years
85264111
95132111
10566111
Every 25 years
85264111
110132111
13566111
Every 50 years
85264111
135132111

Appendix C

Table A3. Two-way ANOVA test for stand biomass.
Source of VariationSSdfMSFp-ValueF Crit
Thinning Intensity2,203,60521,101,803306.19762.8 × 10−1003.006597
Thinning Interval4,987,35431,662,451462.00532.6 × 10−1762.615656
Intensity × Interval839,720.16139,953.338.893899.65 × 10−422.109512
Within2,979,4248283598.338
Total11,010,103839
Table A4. Two-way ANOVA test for accumulated biomass.
Source of VariationSSdfMSFp-ValueF Crit
Thinning Intensity878.54112439.27050.1211480.8859193.006597
Thinning Interval10,826.3333608.7770.9952770.3943692.615656
Intensity × Interval8274.18161379.030.3803280.8917812.109512
Within3,002,2468283625.901
Total3,022,225839

Appendix D

Table A5. Two-way ANOVA test for transpiration.
Source of VariationSSdfMSFp-ValueF Crit
Thinning Intensity3,080,94421,540,472110.94542.05 × 10−433.006597
Thinning Interval6,097,66332,032,554146.38544.22 × 10−762.615656
Intensity × Interval1,550,2986258,382.918.608852.28 × 10−202.109512
Within11,496,73982813,884.95
Total22,225,644839
Table A6. Two-way ANOVA test for evapotranspiration.
Source of VariationSSdfMSFp-ValueF Crit
Thinning Intensity3,344,93121,672,466103.00531.13 × 10−403.006597
Thinning Interval6,909,53732,303,179141.85033.64 × 10−742.615656
Intensity × Interval1,603,5196267,253.216.459845.61 × 10−182.109512
Within13,443,97782816,236.69
Total25,301,964839
Table A7. Two-way ANOVA test for soil evaporation.
Source of VariationSSdfMSFp-ValueF Crit
Thinning Intensity169,318.9284,659.4586.289489.13 × 10−353.006597
Thinning Interval303,911.23101,303.7103.25438.7 × 10−572.615656
Intensity × Interval88,259.1614,709.8514.993072.48 × 10−162.109512
Within812,358.8828981.1097
Total1,373,848839

Appendix E

Table A8. Two-way ANOVA test for water yield.
Source of VariationSSdfMSFp-ValueF Crit
Thinning Intensity3,339,35321,669,67728.856417.68 × 10−133.006597
Thinning Interval6,896,37932,298,79339.729195.43 × 10−242.615656
Intensity × Interval1,601,5486266,924.74.6131620.0001282.109512
Within47,909,37082857,861.56
Total59,746,651839

References

  1. FAO; UNECE. Forests and Water Valuation and Payments for Forest Ecosystem Services; FAO: Rome, Italy, 2018. [Google Scholar]
  2. Ellison, D.; Morris, C.E.; Locatelli, B.; Sheil, D.; Cohen, J.; Murdiyarso, D.; Gutierrez, V.; van Noordwijk, M.; Creed, I.F.; Pokorny, J.; et al. Trees, forests and water: Cool insights for a hot world. Glob. Environ. Chang. 2017, 43, 51–61. [Google Scholar] [CrossRef]
  3. Furniss, M. Water, Climate Change, and Forests Watershed Stewardship for A Changing Climate ConTents; Diane Publishing: Collingdale, PA, USA, 2010. [Google Scholar]
  4. Hirsch, F.; Clark, D.; Vihervaara, P.; Primmer, E. Payments for Forest—Related Ecosystem Services: What role for a Green Economy? In Proceedings of the Background Paper for the Workshop on Payments for Ecosystem Services, UNECE/FAO Forestry and Timber Section, Geneva, Switzerland, 4–5 July 2011; pp. 1–46. [Google Scholar]
  5. Bayala, J.; Teklehaimanot, Z.; Ouedraogo, S.J. Millet production under pruned tree crowns in a parkland system. Agrofor. Syst. 2002, 54, 203–214. [Google Scholar] [CrossRef]
  6. Delzon, S.; Loustau, D. Age-related decline in stand water use: Sap flow and transpiration in a pine forest chronosequence. Agric. For. Meteorol. 2005, 129, 105–119. [Google Scholar] [CrossRef]
  7. Hakimi, L.; Sadeghi, S.M.M.; Van Stan, J.T.; Pypker, T.G.; Khosropour, E. Management of pomegranate (Punica granatum) orchards alters the supply and pathway of rain water reaching soils in an arid agricultural landscape. Agric. Ecosyst. Environ. 2018, 259, 77–85. [Google Scholar] [CrossRef]
  8. EEA. Exploring the Synergies between Floodplain Restoration, Water Policies and Thematic Policies; EEA Report 1/2016; Publications Office of the European Union: Luxembourg, 2016. [Google Scholar]
  9. Neukum, C.; Azzam, R. Impact of climate change on groundwater recharge in a small catchment in the Black Forest, Germany. Appl. Hydrogeol. 2012, 20, 547–560. [Google Scholar] [CrossRef]
  10. Reyer, C.P.; Bathgate, S.; Blennow, K.; Borges, J.G.; Bugmann, H.; Delzon, S.; Faias, S.P.; Garcia-Gonzalo, J.; Gardiner, B.; Gonzalez-Olabarria, J.R.; et al. Are Forest disturbances amplifying or canceling out climate change-induced productivity changes in European forests? Environ. Res. Lett. 2017, 12, 034027. [Google Scholar] [CrossRef]
  11. Gardiner, B.; Schuck, A.; Schelhaas, M.-J.; Orazio, C.; Blennow, K.; Nicoll, B. Living with Storm Damage to Forests; European Forest Institute: Jonesuu, Finland, 2013. [Google Scholar] [CrossRef]
  12. Seidl, R.; Schelhaas, M.-J.; Lexer, M.J. Unraveling the drivers of intensifying forest disturbance regimes in Europe. Glob. Chang. Biol. 2011, 17, 2842–2852. [Google Scholar] [CrossRef]
  13. Gonçalves, A.C. Thinning: An Overview. In Silviculture; IntechOpen: London, UK, 2020. [Google Scholar] [CrossRef]
  14. Honkaniemi, J.; Rammer, W.; Seidl, R. Norway spruce at the trailing edge: The effect of landscape configuration and composition on climate resilience. Landsc. Ecol. 2020, 35, 591–606. [Google Scholar] [CrossRef] [Green Version]
  15. Hawthorne, S.; Lane, P.N.; Bren, L.J.; Sims, N.C. The long term effects of thinning treatments on vegetation structure and water yield. For. Ecol. Manag. 2013, 310, 983–993. [Google Scholar] [CrossRef]
  16. Magruder, M.; Chhin, S.; Palik, B.; Bradford, J. Thinning increases climatic resilience of red pine. Can. J. For. Res. 2013, 43, 878–889. [Google Scholar] [CrossRef]
  17. Sohn, J.A.; Gebhardt, T.; Ammer, C.; Bauhus, J.; Häberle, K.-H.; Matyssek, R.; Grams, T. Mitigation of drought by thinning: Short-term and long-term effects on growth and physiological performance of Norway spruce (Picea abies). For. Ecol. Manag. 2013, 308, 188–197. [Google Scholar] [CrossRef]
  18. Katzensteiner, K.; Klimo, E.; Szukics, U.; Delaney, C.M. Impact of forest management alternatives on water budgets and runoff processes. In Papers on impacts of forest management on environmental services. EFI Tech. Rep. 2011, 57, 27–55. [Google Scholar]
  19. Sun, X.; Onda, Y.; Chiara, S.; Kato, H.; Gomi, T. The effect of strip thinning on spatial and temporal variability of throughfall in a Japanese cypress plantation. Hydrol. Process. 2015, 29, 5058–5070. [Google Scholar] [CrossRef]
  20. Simonin, K.; Kolb, T.; Montes-Helu, M.; Koch, G. The influence of thinning on components of stand water balance in a ponderosa pine forest stand during and after extreme drought. Agric. For. Meteorol. 2007, 143, 266–276. [Google Scholar] [CrossRef]
  21. Kohler, M.; Sohn, J.; Nägele, G.; Bauhus, J. Can drought tolerance of Norway spruce (Picea abies (L.) Karst.) be increased through thinning? Eur. J. For. Res. 2010, 129, 1109–1118. [Google Scholar]
  22. Xu, P.; Zhou, T.; Yi, C.; Luo, H.; Zhao, X.; Fang, W.; Gao, S.; Liu, X. Impacts of Water Stress on Forest Recovery and Its Interaction with Canopy Height. Int. J. Environ. Res. Public Health 2018, 15, 1257. [Google Scholar] [CrossRef] [Green Version]
  23. Schewe, J.; Heinke, J.; Gerten, D.; Haddeland, I.; Arnell, N.W.; Clark, D.B.; Dankers, R.; Eisner, S.; Fekete, B.M.; Colón-González, F.J.; et al. Multimodel assessment of water scarcity under climate change. Proc. Natl. Acad. Sci. USA. 2014, 111, 3245–3250. [Google Scholar] [CrossRef] [Green Version]
  24. Landsberg, J.J.; Waring, R.H. A generalised model of forest productivity using simplified concepts of radiation-use efficiency, carbon balance and partitioning. For. Ecol. Manag. 1997, 95, 209–228. [Google Scholar] [CrossRef]
  25. Fatichi, S.; Vivoni, E.R.; Ogden, F.L.; Ivanov, V.Y.; Mirus, B.; Gochis, D.; Downer, C.W.; Camporese, M.; Davison, J.H.; Ebel, B.; et al. An overview of current applications, challenges, and future trends in distributed process-based models in hydrology. J. Hydrol. 2016, 537, 45–60. [Google Scholar] [CrossRef] [Green Version]
  26. Forrester, D.I.; Hobi, M.L.; Mathys, A.S.; Stadelmann, G.; Trotsiuk, V. Calibration of the process-based model 3—PG for major central European tree species. Eur. J. For. Res. 2021, 140, 847–868. [Google Scholar] [CrossRef]
  27. Cuddington, K.; Fortin, M.-J.; Gerber, L.R.; Hastings, A.; Liebhold, A.; O’Connor, M.; Ray, C. Process-based models are required to manage ecological systems in a changing world. Ecosphere 2013, 4, 1–12. [Google Scholar] [CrossRef]
  28. Augustynczik, A.L.; Hartig, F.; Minunno, F.; Kahle, H.P.; Diaconu, D.; Hanewinkel, M.; Yousefpour, R. Productivity of Fagus sylvatica under climate change—A Bayesian analysis of risk and uncertainty using the model 3-PG. For. Ecol. Manag. 2017, 401, 192–206. [Google Scholar] [CrossRef]
  29. Bouwman, M.; Forrester, D.; Ouden, J.D.; Nabuurs, G.-J.; Mohren, G. Species interactions under climate change in mixed stands of Scots pine and pedunculate oak. For. Ecol. Manag. 2020, 481, 118615. [Google Scholar] [CrossRef]
  30. Palma, J.H.; Hakamada, R.; Moreira, G.G.; Nobre, S.; Rodriguez, L.C.E. Using 3PG to assess climate change impacts on management plan optimization of Eucalyptus plantations. A case study in Southern Brazil. Sci. Rep. 2021, 11, 2708. [Google Scholar]
  31. Gonzalez-Benecke, C.A.; Teskey, R.O.; Martin, T.A.; Jokela, E.J.; Fox, T.R.; Kane, M.B.; Noormets, A. Regional validation and improved parameterization of the 3-PG model for Pinus taeda stands. For. Ecol. Manag. 2016, 361, 237–256. [Google Scholar] [CrossRef] [Green Version]
  32. Liu, C.; Zheng, X.; Ren, Y. Parameter Optimization of the 3PG Model Based on Sensitivity Analysis and a Bayesian Method. Forests 2020, 11, 1369. [Google Scholar] [CrossRef]
  33. Yousefpour, R.; Djahangard, M. Simulating the Effects of Thinning Events on Forest Growth and Water Services Asks for Daily Analysis of Underlying Processes. Forests 2021, 12, 1729. [Google Scholar] [CrossRef]
  34. Copernicus. Climate and Energy Indicators for Europe from 2005 to 2100 Derived from Climate Projections: Daily Climate Data on NUTS2 Level. Copernicus Climate Change Service (C3S) Climate Data Store (CDS). Available online: https://cds.climate.copernicus.eu/cdsapp#!/dataset/sis-energy-derived-projections?tab=overview (accessed on 26 August 2021).
  35. Puhlmann, H.; von Wilpert, K. Waldbauliche Managementoptionen für die Sicherung der Sickerwasserqualität unter Wäldern—Fallstudie Conventwald. Hydrol. Wasserbewirtsch 2009, 2, 96–109. [Google Scholar]
  36. del Rio, M.; Bravo-Ovoedo, A.; Pretzch, H.; Lof, M.; Ruiz-Peinado, R. A review of thinning effects on Scots pine stands: From growth and yield to new challenges under global change A review of thinning effects on Scots pine stands: From growth and yield to new challenges under global change. For. Syst. 2017, 26, 9. [Google Scholar]
  37. Puettmann, K.J. Silvicultural Challenges and Options in the Context of Global Change: ‘Simple’ Fixes and Opportunities for New Management Approaches. J. For. 2011, 109, 321–331. [Google Scholar]
  38. Pretzsch, H.; Rais, A. Wood quality in complex forests versus even-aged monocultures: Review and perspectives. Wood Sci. Technol. 2016, 50, 845–880. [Google Scholar] [CrossRef]
  39. Tarigan, S.; Wiegand, K.; Slamet, B. Minimum forest cover required for sustainable water flow regulation of a watershed: A case study in Jambi Province, Indonesia. Hydrol. Earth Syst. Sci. 2018, 22, 581–594. [Google Scholar] [CrossRef] [Green Version]
  40. Wallentin, C.; Nilsson, U. Storm and snow damage in a Norway spruce thinning experiment in southern Sweden. For. Int. J. For. Res. 2014, 87, 229–238. [Google Scholar] [CrossRef] [Green Version]
  41. Česonienė, L.; Daubaras, R.; Tamutis, V.; Kaškonienė, V.; Kaškonas, P.; Stakėnas, V.; Zych, M. Effect of clear-cutting on the understory vegetation, soil and diversity of litter beetles in scots pine-dominated forest. J. Sustain. For. 2019, 38, 791–808. [Google Scholar] [CrossRef]
  42. Gebhardt, T.; Häberle, K.H.; Matyssek, R.; Schulz, C.; Ammer, C. The more, the better? Water relations of Norway spruce stands after progressive thinning. Agric. For. Meteorol. 2014, 197, 235–243. [Google Scholar]
  43. Cao, T.; Valsta, L.; Härkönen, S.; Saranpaa, P.; Mäkelä, A. Effects of thinning and fertilization on wood properties and economic returns for Norway spruce. For. Ecol. Manag. 2008, 256, 1280–1289. [Google Scholar] [CrossRef]
  44. Krajnc, L.; Farrelly, N.; Harte, A.M. The effect of thinning on mechanical properties of Douglas fir, Norway spruce, and Sitka spruce. Ann. For. Sci. 2019, 76, 1–2. [Google Scholar] [CrossRef] [Green Version]
  45. Pretzsch, H. Density and growth of forest stands revisited. Effect of the temporal scale of observation, site quality, and thin-ning. For. Ecol. Manag. 2020, 460, 117879. [Google Scholar] [CrossRef]
  46. Wallentin, C.; Nilsson, U. Initial effect of thinning on stand gross stem-volume production in a 33-year-old Norway spruce (picea abies (L.) Karst.) stand in Southern Sweden. Scand. J. For. Res. 2011, 26, 21–35. [Google Scholar] [CrossRef]
  47. Bottero, A.; Forrester, D.I.; Cailleret, M.; Kohnle, U.; Gessler, A.; Michel, D.; Bose, A.K.; Bauhus, J.; Bugmann, H.; Cuntz, M.; et al. Growth resistance and resilience of mixed silver fir and Norway spruce forests in central Europe: Contrasting responses to mild and severe droughts. Glob. Chang. Biol. 2021, 27, 4403–4419. [Google Scholar] [CrossRef]
  48. Binkley, D.; Campoe, O.; Gspaltl, M.; Forrester, D.I. Light absorption and use efficiency in forests: Why patterns differ for trees and stands. For. Ecol. Manag. 2013, 288, 5–13. [Google Scholar] [CrossRef]
  49. Köstner, B. Evaporation and transpiration from forests in Central Europe? relevance of patch-level studies for spatial scaling. Arch. Meteorol. Geophys. Bioclimatol. Ser. B 2001, 76, 69–82. [Google Scholar] [CrossRef]
  50. Greenwood, A. The Application and Limitations of Using Mean Annual Evapotranspiration and Rainfall in The Assessment of The Impacts of Plantation Forestry on Runoff; Technical Note; Government of South Australia, Department of Water, Land and Biodiversity Conservation: Adelaide, Australia, 2007.
  51. Shen, C.; Nelson, A.S.; Jain, T.B.; Foard, M.B.; Graham, R.T. Structural and Compositional Responses to Thinning over 50 Years in Moist Forest of the Northern Rocky Mountains. For. Sci. 2019, 65, 626–636. [Google Scholar] [CrossRef]
  52. Eriksson, E. Thinning operations and their impact on biomass production in stands of Norway spruce and Scots pine. Biomass Bioenergy 2006, 30, 848–854. [Google Scholar] [CrossRef]
  53. McIntosh, A.C.; Gray, A.N.; Garman, S.L. Canopy Structure on Forest Lands in Western Oregon: Differences among Forest Types and Stand Ages; General Technical Report PNW-GTR-794; U.S. Department of Agriculture, Forest Service, Pacific Northwest Research Station: Portland, OR, USA, 2009. [CrossRef] [Green Version]
  54. Miehle, P.; Battaglia, M.; Sands, P.J.; Forrester, D.I.; Feikema, P.M.; Livesley, S.; Morris, J.D.; Arndt, S. A comparison of four process-based models and a statistical regression model to predict growth of Eucalyptus globulus plantations. Ecol. Model. 2009, 220, 734–746. [Google Scholar] [CrossRef]
  55. Sohn, J.A.; Kohler, M.; Gessler, A.; Bauhus, J. Interactions of thinning and stem height on the drought response of radial stem growth and isotopic composition of Norway spruce (Picea abies). Tree Physiol. 2012, 32, 1199–1213. [Google Scholar] [CrossRef] [Green Version]
  56. Van Vuuren, D.P.; Edmonds, J.; Kainuma, M.; Riahi, K.; Thomson, A.; Hibbard, K.; Hurtt, G.C.; Kram, T.; Krey, V.; Lamarque, J.-F.; et al. The representative concentration pathways: An overview. Clim. Change 2011, 109, 5–31. [Google Scholar] [CrossRef]
  57. Riahi, K.; Rao, S.; Krey, V.; Cho, C.; Chirkov, V.; Fischer, G.; Kindermann, G.; Nakicenovic, N.; Rafaj, P. RCP 8.5—A scenario of comparatively high greenhouse gas emissions. Clim. Change 2011, 109, 33–57. [Google Scholar]
  58. Subramanian, N. Impacts of Climate Change on Forest Management and Implications for Swedish Forestry. Ph.D. Thesis, Swedish University of Agricultural Sciences, Uppsala, Sweden, 2016. [Google Scholar]
  59. Xie, Y.; Wang, H.; Lei, X. Simulation of climate change and thinning effects on productivity of Larix olgensis plantations in northeast China using 3-PG mix model. J. Environ. Manage. 2020, 261, 110249. [Google Scholar] [CrossRef]
  60. Alam, M.S.; Lamb, D.W.; Warwick, N.W.M. A Canopy Transpiration Model Based on Scaling Up Stomatal Conductance and Radiation Interception as Affected by Leaf Area Index. Water 2021, 13, 252. [Google Scholar] [CrossRef]
  61. Zhang, B.; Liu, Y.; Xu, D.; Cai, J.; Li, F. Evapotranspiraton estimation based on scaling up from leaf stomatal conductance to canopy conductance. Agric. For. Meteorol. 2011, 151, 1086–1095. [Google Scholar] [CrossRef]
  62. Forrester, D.I.; Tang, X. Analysing the spatial and temporal dynamics of species interactions in mixed-species forests and the effects of stand density using the 3-PG model. Ecol. Model. 2016, 319, 233–254. [Google Scholar] [CrossRef]
  63. Goude, M.; Nilsson, U.; Holmström, E. Comparing direct and indirect leaf area measurements for Scots pine and Norway spruce plantations in Sweden. Forstwiss. Cent. 2019, 138, 1033–1047. [Google Scholar] [CrossRef] [Green Version]
  64. Robles, M.D.; Marshall, R.M.; O’Donnell, F.; Smith, E.B.; Haney, J.A.; Gori, D.F. Effects of climate variability and accelerated forest thinning on watershed-scale runoff in southwestern USA ponderosa pine forests. PLoS ONE 2014, 9, e111092. [Google Scholar] [CrossRef] [Green Version]
Figure 1. Stand biomass (A,C,E) and accumulated biomass (B,D,F) at 10%, 30% and 50% thinning respectively in different thinning intervals.
Land 11 00446 g001
Figure 2. Transpiration (A,D,G), ET (B,E,H) and soil evaporation (C,F,I) for 10%, 30%, and 50% thinning respectively in different thinning intervals.
Land 11 00446 g002
Figure 3. Boxplot for transpiration (A,D,G), ET (B,E,H) and soil evaporation (C,F,I) for 10%, 30%, and 50% thinning, respectively, in different thinning intervals.
Land 11 00446 g003
Figure 4. Water Yield for (A): 10%, (B): 30%, and (C): 50% thinning in different thinning intervals.
Land 11 00446 g004
Figure 5. Boxplot for water yield for (A) 10%, (B) 30%, and (C) 50% thinning, respectively.
Land 11 00446 g005
Figure 6. Total water yield over the management period.
Land 11 00446 g006
Figure 7. Stand biomass over the management period.
Land 11 00446 g007
Figure 8. Accumulated biomass over the management period.
Land 11 00446 g008
Table 1. Summary of thinning regimes.
Thinning IntensityThinning IntervalAges of Stand during Thinning (Years)
10%10 years85, 95, 105, 115, 125, 135
25 years85, 110, 135
50 years85, 135
30%10 years85, 95, 105, 115, 125, 135
25 years85, 110, 135
50 years85, 135
50%10 years85, 95, 105
25 years85, 110, 135
50 years85, 135
Table 2. Summary of two-way ANOVA test for stand and accumulated biomass.
Source of Variationp-Value for Stand Biomassp-Value for Accumulated Biomass
Thinning Intensity2.8 × 10−1000.885919
Thinning Interval2.6 × 10−1760.394369
Intensity × Interval9.65 × 10−420.891781
Table 3. Summary of two-way ANOVA test for transpiration, ET and soil evaporation.
Source of Variationp-Value for Transpirationp-Value for ETp-Value for Soil Evaporation
Thinning Intensity2.05 × 10−431.13 × 10−409.13 × 10⁻³⁵
Thinning Interval4.22 × 10−763.64 × 10−748.7 × 10−57
Intensity × Interval2.28 × 10−205.61 × 10−182.48 × 10⁻¹⁶
Table 4. Summary of two-way ANOVA test for water yield.
Source of Variationp-Value for Water Yield
Thinning Intensity7.68 × 10−13
Thinning Interval5.43 × 10−24
Intensity × Interval0.000128
Table 5. Number of thinning per thinning regime.
10 Years25 Years50 Years
10%632
30%632
50%332
Table 6. Ranking of thinning regimes based on accumulated biomass and water yield.
Stand BiomassWater Yield
10%, 10 years36
10%, 25 years28
10%, 50 years19
30%, 10 years82
30%, 25 years55
30%, 50 years47
50%, 10 years91
50%, 25 years73
50%, 50 years64
Publisher’s Note: MDPI stays neutral with regard to jurisdictional claims in published maps and institutional affiliations.

