Article

Spatio-Temporal Evolution and Driving Mechanism of Urbanization in Small Cities: Case Study from Guangxi

1
Hualan Design & Consulting Group, Nanning 530011, China
2
College of Urban and Environmental Science, Northwest University, Xi’an 710127, China
3
School of Architecture, Southeast University, Nanjing 210096, China
4
College of Landscape and Architectural Engineering, Guangxi Agricultural Vocational University, Nanning 530007, China
*
Author to whom correspondence should be addressed.
Land 2022, 11(3), 415; https://doi.org/10.3390/land11030415
Submission received: 13 February 2022 / Revised: 10 March 2022 / Accepted: 10 March 2022 / Published: 11 March 2022

Abstract

:
Urbanization has an abundant connotation in dimensions such as population, economy, land, and society and is an important sign to measure regional economic development and social progress. The use of Night Light Data from remote sensing satellites as a proxy variable can significantly improve the accuracy and comprehensiveness of the measurement of urbanization development dynamics. Based on the Night Light Data and statistical data from 2015 to 2019, this paper quantitatively analyzes the spatio-temporal evolution pattern of urbanization in Guangxi and its driving mechanism using exploratory time-space data analysis, GeoDetector and Matrix: Boston Consulting Group, providing an important basis for sustainable urban development planning and scientific decision-making by the government. The findings show that (1) there is a high level of spatial heterogeneity and spatial autocorrelation of urbanization in Guangxi, with the Gini index of urban night light index and urban night light expansion vitality index always greater than 0.5, the global Moran’s I greater than 0.17, the spatial differentiation converging but the spatial correlation increasing. (2) The spatial pattern of urbanization in Guangxi has long been solidified, but there is a differentiation in urban development trend, with the coexistence of urban expansion and shrinkage, requiring differentiated policy design for urban governance. (3) The development and evolution of urbanization in Guangxi present a complex intertwined dynamic mechanism of action, with interaction effects of bifactor enhancement and non-linear enhancement among factors. It should be noted that the influence of factors varies greatly, with the added value of the tertiary industry, gross domestic product, total retail sales of social consumer goods having the strongest direct effect on the urban night light index, while the added value of secondary industry, per capita GDP, gross domestic product having the strongest direct effect on the urban night light expansion vitality index. All of them are key factors, followed by some significant influence factors such as government revenue, population urbanization rate, per government revenue, population urbanization rate, per capita disposable income of urban and rural residents that should not be ignored, and the rest that play indirect roles mainly by interaction.

1. Introduction

1.1. Background

Urbanization embodies the process of population transfer from rural areas to cities and towns in a country or region and the gradual evolution of rural areas into urban areas. It is also the transformation process and improvement of people’s lifestyle, productivity level, and quality of life. With multi-dimensional connotations of population, economy, land, and society, urbanization is an important indicator to measure regional economic development and social progress, and a core research area at the intersection of geography, land science, and urban planning, becoming a common focus of scholars and governments. With increasing global urbanization, the Earth is gradually becoming an urban planet [1,2]. About 55% of the global population lives in cities, and global urbanization is expected to reach 68% by 2050 (UN-DESA, United Nations, Department of Economic and Social Affairs, Population Division, 2019). Rapid urbanization constantly produces and aggravates the contradictions between economic and social development, climate change, and ecological environmental problems, posing a direct threat to the sustainable development of cities and villages worldwide [3,4]. How to accurately measure the development level of urbanization as a complex process involving the economy, society, population, land, geography, and space and the dynamic mechanism of its spatio-temporal dynamic change is the first step to formulate scientific and reasonable response strategies, which has theoretical and practical meanings [5,6].
China’s urbanization is developing rapidly on a huge scale, but it also faces complex problems and arduous challenges, quite typical in the world. Data from China’s sixth and seventh censuses show that the population living in cities and towns in China reached 901.99 million in 2020, with a proportion of 63.89%; compared to 2010, the urban population increased by 236.42 million, up by 14.21%. With the in-depth development of China’s new industrialization and the implementation of the policy on the citizenship of the population transferred from rural areas, China experienced an average annual growth of over 1.4% in urbanization from 2010 to 2020, marking a historic achievement in the ten years of steady urbanization. Besides, the rapid urbanization process is accompanied by lagging transformation of rural population into townspeople, extensive and inefficient use of the construction land, insufficient service facilities, serious ecological damage and environmental pollution, ineffective protection of historical and cultural heritage, as well as other problems and challenges, which restrict the sustainable development of Chinese cities and villages [7,8]. Joseph E. Stiglitz, the winner of the Nobel Memorial Prize in Economics and Professor of Economics at Columbia University, USA, asserted that there are two major events that have the greatest impact on the world in the 21st century, one is the development of high-tech industries in the United States, and the other is the urbanization in China. Therefore, China’s urbanization process is complex, globally influential, and representative. This empirical study helps provide useful experience for similar countries and regions worldwide.

1.2. Literature Review

The study of urbanization is a classic topic in many disciplines such as geography, economics, sociology, planning, and land science, and the search for a comprehensive index that can effectively, comprehensively, and intuitively express the level of urbanization and a set of methods to analyze the driving mechanisms of urbanization development and change has been a hot issue that the government, scholars, and the public are constantly interested in [9,10]. With a long-term follow-up time, academic circles have made more fruitful research achievements in urbanization development indicators, causes, coping strategies, and social impacts, and have constantly innovated in research fields and perspectives [11,12]. However, we found that the existing research still has some shortcomings in terms of indicator selection, research scales, and research methodology.

1.2.1. Indicator Selection

The existing urbanization studies are mainly based on a single indicator or a composite indicator system, which is one-sided and limited in reflecting the true level of urbanization development, and there is no comprehensive quantitative indicator that can balance multiple connotations at the same time. Urbanization is a complex spatial phenomenon with multi-level connotations, covering economic, social, land, environmental, cultural, and other dimensions. Sociology, economics, demography, planning, land science, geography, and other related disciplines have all defined urbanization from their own perspectives of understanding. In different disciplines, it is defined with some differences, leading to a plurality of indicators and their methods for measuring the urbanization process. As Balk [13] suggests, urbanization has become a global trend, yet the differences in the definition of urbanization and its measurement criteria in different countries make it difficult to conduct comparative analysis in most cases. Therefore, universal indicators should be created with the help of emerging technologies and methods.
There are two main research methods: one is the single-indicator method, i.e., describing the level of urbanization development and its changing trend based on a single indicator with the strongest significance to urbanization and convenient for statistics. The most common indicator is the urbanization rate of population, that is, the percentage of the urban population in the total. There are many papers based on this method in the existing research, such as the studies of Qin [14], Liu [15,16], Chan [17], Onda [18], Megeri [19], and Ma [20] on China, India, central Asia, and other countries and regions. Castells-Quintana [21] and Iheonu [22] believed that urbanization in sub-Saharan African countries had not brought the expected benefits (as experienced in other parts of the world) and that demographic changes during the rise of large cities have resulted in urbanization without growth and unsustainable development in some regions. Ehrlich [23] evaluated the trend of population urbanization changes from 1975 to 2015 in mountainous areas across the world and believed that urbanization in the mountains is lower than that of lowlands, while the urbanization rate varies significantly across mountain areas.
Studying urbanization from the perspective of land use and cover change is another important approach that has received widespread attention from scholars. Asabere [24] pointed out that the spatial change process caused by urbanization can be better revealed by analyzing the change of regional land use and cover quantity, quality, and structure. Bilozor [25] systematically analyzed the dynamics of recent research on land urbanization, reviewed the tools and methods that can help track and measure the process of land urbanization, and summarized the historical experience of changes in land dynamics during urbanization. Egidi [26] analyzed the Mediterranean land urbanization pattern from an urban sprawl perspective and compared it with typical patterns in the United States and Northern and Western Europe. Egidi and Salvati [27] argued that the link between land-use change and demographic transition in developed countries has become increasingly complex due to the interactions between environmental and socioeconomic domains that influence the sustainability of regional and local development. Ahani [28] reviewed the policies that guide and control urbanization and restrain urban growth. Vogler [29] conducted a case study of the United States and showed that per capita land change could be a new spatial index for measuring urbanization. Seifollahi-Aghmiuni [30] and Lopez-Casado [31] analyzed urbanization processes and paradigms from the perspective of land degradation and illegal land distribution.
In addition, urbanization is also seen as a complex process of economic, political, and landscape change, and many scholars have attempted to measure urbanization in these terms. Adams [32] argued that urbanization in developed economies had undergone a transition from rural to urban economies and from low-income growth to high-income growth. Di Clemente [33] believed that urbanization plays a crucial role in economic development, but there is a complex relationship between the two, and it is closely related to the stage of development, industrial structure, development pattern, and policy environment. Of course, as Gross [34] concluded, there are some scholars believing this is no connection between urbanization and economic growth. Sharp [35] argued that urban informality is a political intervention and haphazard urbanization points to the complex power struggles by a range of actors, both within and beyond the state, through which the formal and informal divide can mark urban life. Minuchin [36] introduced the concept of Prefigurative urbanization (PUC) to analyze the role played by politics in urbanization. Streule [37] introduced the concept of Popular Urbanization to describe a specific urbanization process based on collective action, self-organization, and resident activity. Many scholars analyzed the spatial process of urbanization based on the changes in regional landscapes, for example, Izakovicova [38], Alphan [39], and Bosch [40] conducted empirical studies on Slovakia, Turkey, and Switzerland, respectively. Besides, some scholars such as Azam [41] and Rahman [42] analyzed the causal relationship between urbanization, industrialization, and ecology.
The other is the indicator system method, i.e., building an evaluation indicator system for urbanization development based on a number of specific indicators highly related to the development of urbanization in terms of population, economy, land, social life, ecological environment, culture, and landscape. For example, Zhong [43] quantitatively analyzed the sustainable development of urbanization in China and its spatial differences from five perspectives: economic development, quality of basic public services, ecological and environmental development, urban–rural heterogeneity, and population urbanization. Fan [44] analyzed the dynamics of urbanization development in Vietnam from dimensions, including population, space, economy, environment, and social changes, and Zeng [45] constructed a comparative framework of urbanization development levels between China and India from four dimensions of the urban–rural relationship, industrial development, urban construction, and landscape pattern.
For the current studies, there are many problems in the single-indicator method or index system method in measuring the level and evolution trend of urbanization. For the former, the definitions of cities and urban population vary greatly in different countries and regions. In particular, the definition of the urban population in China is highly variable and is not precise enough in concept, resulting in poor comparability across years and regions [46]. And the single indicator method does not reflect the other nature of urbanization and development in general. For the latter, theoretically, this method overcomes the shortcomings of the single indicator method, which is a little systematic and comprehensive, to better reveal the complexity and multidimensionality of urbanization. However, due to the differences in research focus, scale, and region, most of the current indicator systems are highly disciplinary and regional with a lack of common use, so the indicator system method is mostly limited to geographical space and does not allow for international comparative analysis. In addition, China’s existing urbanization level measurement indicators are based on statistical data, where the lack of data acquisition and the uncertain factors in statistical work make the measurement indicators insufficient in comparability, reliability, and timeliness [47]. Therefore, in the new era of increasing spatio-temporal uncertainty, there is an urgent need to create new tools or develop new indicators for urbanization research by means of new scientific and technological developments [48,49].
The development of satellite nighttime remote sensing technology provides technical possibilities to meet the above needs. In the absence of comprehensive indicators, the night light data can automatically approach the real urbanization level through appropriate methods to reflect the real situation of human space activities [50]. Remote sensing satellite night light data can directly reflect the differences in human activities and comprehensively represent multiple dimensions such as population urbanization, land urbanization, and economic urbanization [51,52]. The areas with greater intensity of (brighter) night lighting show more frequent human production (intensity of economic behavior) and living (concentration of population) activities, and higher quality of urbanization development in general [53,54]. Now the night light data are widely used for the identification of urban built-up areas [55] and urban centers [56,57], the extraction of urban impervious surfaces [58], and the evaluation of urban spatial expansion and growth trend [59,60], land use and cover changes [61,62], Spatial estimation of socio-economic indicators [63], major events [64], ecological environment [65] and other fields [66], which are still in their infancy in the urbanization process research.

1.2.2. Research Scale

At the level of research scale, most findings are related to countries and regions, with less attention paid to the study of cities, especially the empirical study on small cities [67]. Dijkstra [68] analyzed different pictures of global urbanization from the perspective of urban population ratio and found that urbanization complies with Zipf’s Law, and there is a positive and significant correlation between urban population ratio and economic development level. Carlucci [69] made a retrospective analysis of the global urbanization pattern from 1950 to 2030 and found that the growth of metropolises and population in the world is variable to a great extent. Tsendbazar analyzed the complexity of global urbanization from 1975 to 2015 for the first time in terms of population, building structure, and residential coverage [70]. Williams [71], Bunnell [72], and Apostolopoulou [73] believed that the “Belt and Road” initiative has gone beyond geopolitical or economic strategies and that it has been an urbanization situation from the perspective of planetary urbanization theory, closely linked to the socio-spatial and ecological constructs of global capitalism. Taubenbock [74] analyzed the urbanization development trends and patterns of megacities with populations over 10 million from a global scale, Georg [75] identified the corridor space of major cities in the world according to night light data, and Yu [76] analyzed the urbanization process of six major Chinese cities and its impact on the local environment from a multidimensional perspective of land, population, and economy. Zhang evaluated the relationship between the urbanization scale and quality of 285 prefecture-level cities in China for the period of 2005–2014 and concluded that the two showed eight decoupling points [77].
Tumwesigye [78] stated that urbanization in sub-Saharan Africa witnessed rapid urbanization and analyzed the spatial pattern of urbanization in Uganda based on the distribution of registered population size. Chakraborty [79] analyzed the spatio-temporal patterns of urban growth for the Kolkata Urban Agglomeration in eastern India using dynamic spatial territorial extents and compared the results with existing popular hypotheses of urbanization patterns. Gangopadhyay [80] analyzed the development of urbanization in Cambodia and analyzed the primary driving factors of urbanization by autoregressive distributed lag (ARDL) analysis and nonlinear autoregressive distributed lag (NARDL) models, pointing out that foreign direct investment flows have asymmetric effects. Hamnett [81] argued that the pattern of urbanization in China is significantly different from that of Western countries and even many developing countries and that as urbanization in China becomes increasingly important globally, it is necessary to consider whether Chinese urbanization represents a unique new pattern. Mejia [82], Oriol [83], Lo [84], and Checa [85] analyzed urban morphology and urbanization processes in Ecuador, Spain, and Europe based on nighttime satellite images and pointed out that nighttime light data have more advantages in explaining new land-use patterns and help comprehensively assess the breadth and intensity of spatial urbanization.
Small and medium-sized cities occupy a large proportion and an important position in the regional town system and impacted by the scale effect, large–medium–small and prefecture–county–town-level cities are greatly different in spatial heterogeneity and its driving mechanisms. Studying the spatial pattern of urbanization in China on a county basis helps to make a more comprehensive understanding of the spatial differentiation of urbanization development and work out differentiated regional spatial development strategies. There are few studies available on urbanization in small and medium-sized cities at present. Essien [86] analyzed the impact of governance on sustainable urbanization in medium-sized cities based on the case study of Uyo, Nigeria. Hegazy [87] analyzed the sustainable development path of regional coastal urbanization based on the case study of Al-Arish City, Egypt. Due to the lack of research on small and medium-sized cities at county and township levels, especially in underdeveloped areas, the applicability and accuracy of existing research results have encountered certain challenges.

1.2.3. Research Method

Research methods adopted in existing literature mainly include regression models, exploratory spatial analysis, system dynamics, and cellular automata, primarily used to analyze the current urbanization characteristics, trends, influence factors, countermeasures, and proposals [88,89,90]. Rabehi [91] predicted the level of urbanization of the Bay of Algiers, Algeria, by 2030 using a meta-automata model based on luminescence data. Addai [92] and Bosah [93] empirically tested the relationship between regional urbanization, economic growth, and ecological footprint using the Westerlund cointegration test and Dumitrescu–Hurlin causality approaches. Pilehvar [94] discussed the spatial distribution of urbanization and its rapid growth in Iran by the meta-analysis technique and GIS tools. Polinesi [95] conducted a comprehensive assessment of the spatio-temporal distribution of population 1961–2011 in 1000 cities based on a geographically weighted regression method to analyze the changing urbanization trends. Gomez [96] insisted that for urbanization prediction, spatio-temporal uncertainty must be taken into account, and after a comparative analysis of meta-automata and machine learning models, it was concluded that the former predefines policies while the latter is driven by data and the two complement each other well. Sumari [97] analyzed the spatio-temporal changes in population and land use 2000–2016 in the Morogoro of Tanzania and analyzed the land urbanization patterns by random forest. Hackman [98] analyzed the reliability of urbanization decisions based on random forest and support vector machines to characterize the evolution of land use in Ghana. Swapan [99] empirically demonstrated the spatial-temporal change patterns of land use 1987–2020 in two regions of West Bengal, India, with the remote sensing and GIS hotspot analysis tools and explored the regions with the greatest potential. Canaz Sevgen [100] analyzed the change of land urbanization in Turkey based on random forest and Airborne Lidar Data in an attempt to improve the reliability of spatial classification results of complex urban areas. Yakup [101] simulated the land use and cover changes in Istanbul with the metacellular automata model to analyze the damage caused by urbanization.
The urbanization development level varies greatly between provinces in China, representing the spatial differentiation under the comprehensive effect of many factors such as economy, society, politics, and ecology within the region. However, Li [102] conducted an exploratory study on this using GeoDetector based on the night light data. He analyzed the factors affecting urbanization development in Xinjiang and pointed out that the influence of human factors is weakening, while the influence of geographical environment factors is slowly increasing, with fixed assets investment, topography index, per capita water resources, and other indicators making more contributions. In general, there is no quantitative measurement or in-depth analysis of the interaction effects of independent variables in existing papers, and thus it is difficult to reveal the driving mechanisms of urbanization and its changes accurately.

1.3. Aim and Question

To make up for the shortage of research on small cities, this paper attempts to conduct systematic and quantitative analysis of the spatial pattern and change pattern of urbanization of 111 county-level cities in Guangxi, a less-developed western region in China, based on the night light data and by a variety of measurement methods such as GIS spatial analysis and GeoDetector. It tries to propose policy recommendations to promote high-quality urbanization development and provide decision-making references for Guangxi, China, and even other regions in the world with similar conditions. This paper is devoted to analyzing the following questions. (1) What are the regular features of the development trend and spatial patterns of urbanization in small cities, including the study of spatial heterogeneity, convergence, and correlation, and the recognition of urbanization development and dynamic change patterns? (2) What are the driving mechanisms for the dynamic change of urbanization in small cities, including the makeup of influence factors, the direct effect size, and the interaction effect of many factors? (3) How to create an early warning analysis and policy zoning model for small city urbanization and propose targeted response policies?

2. Research Design

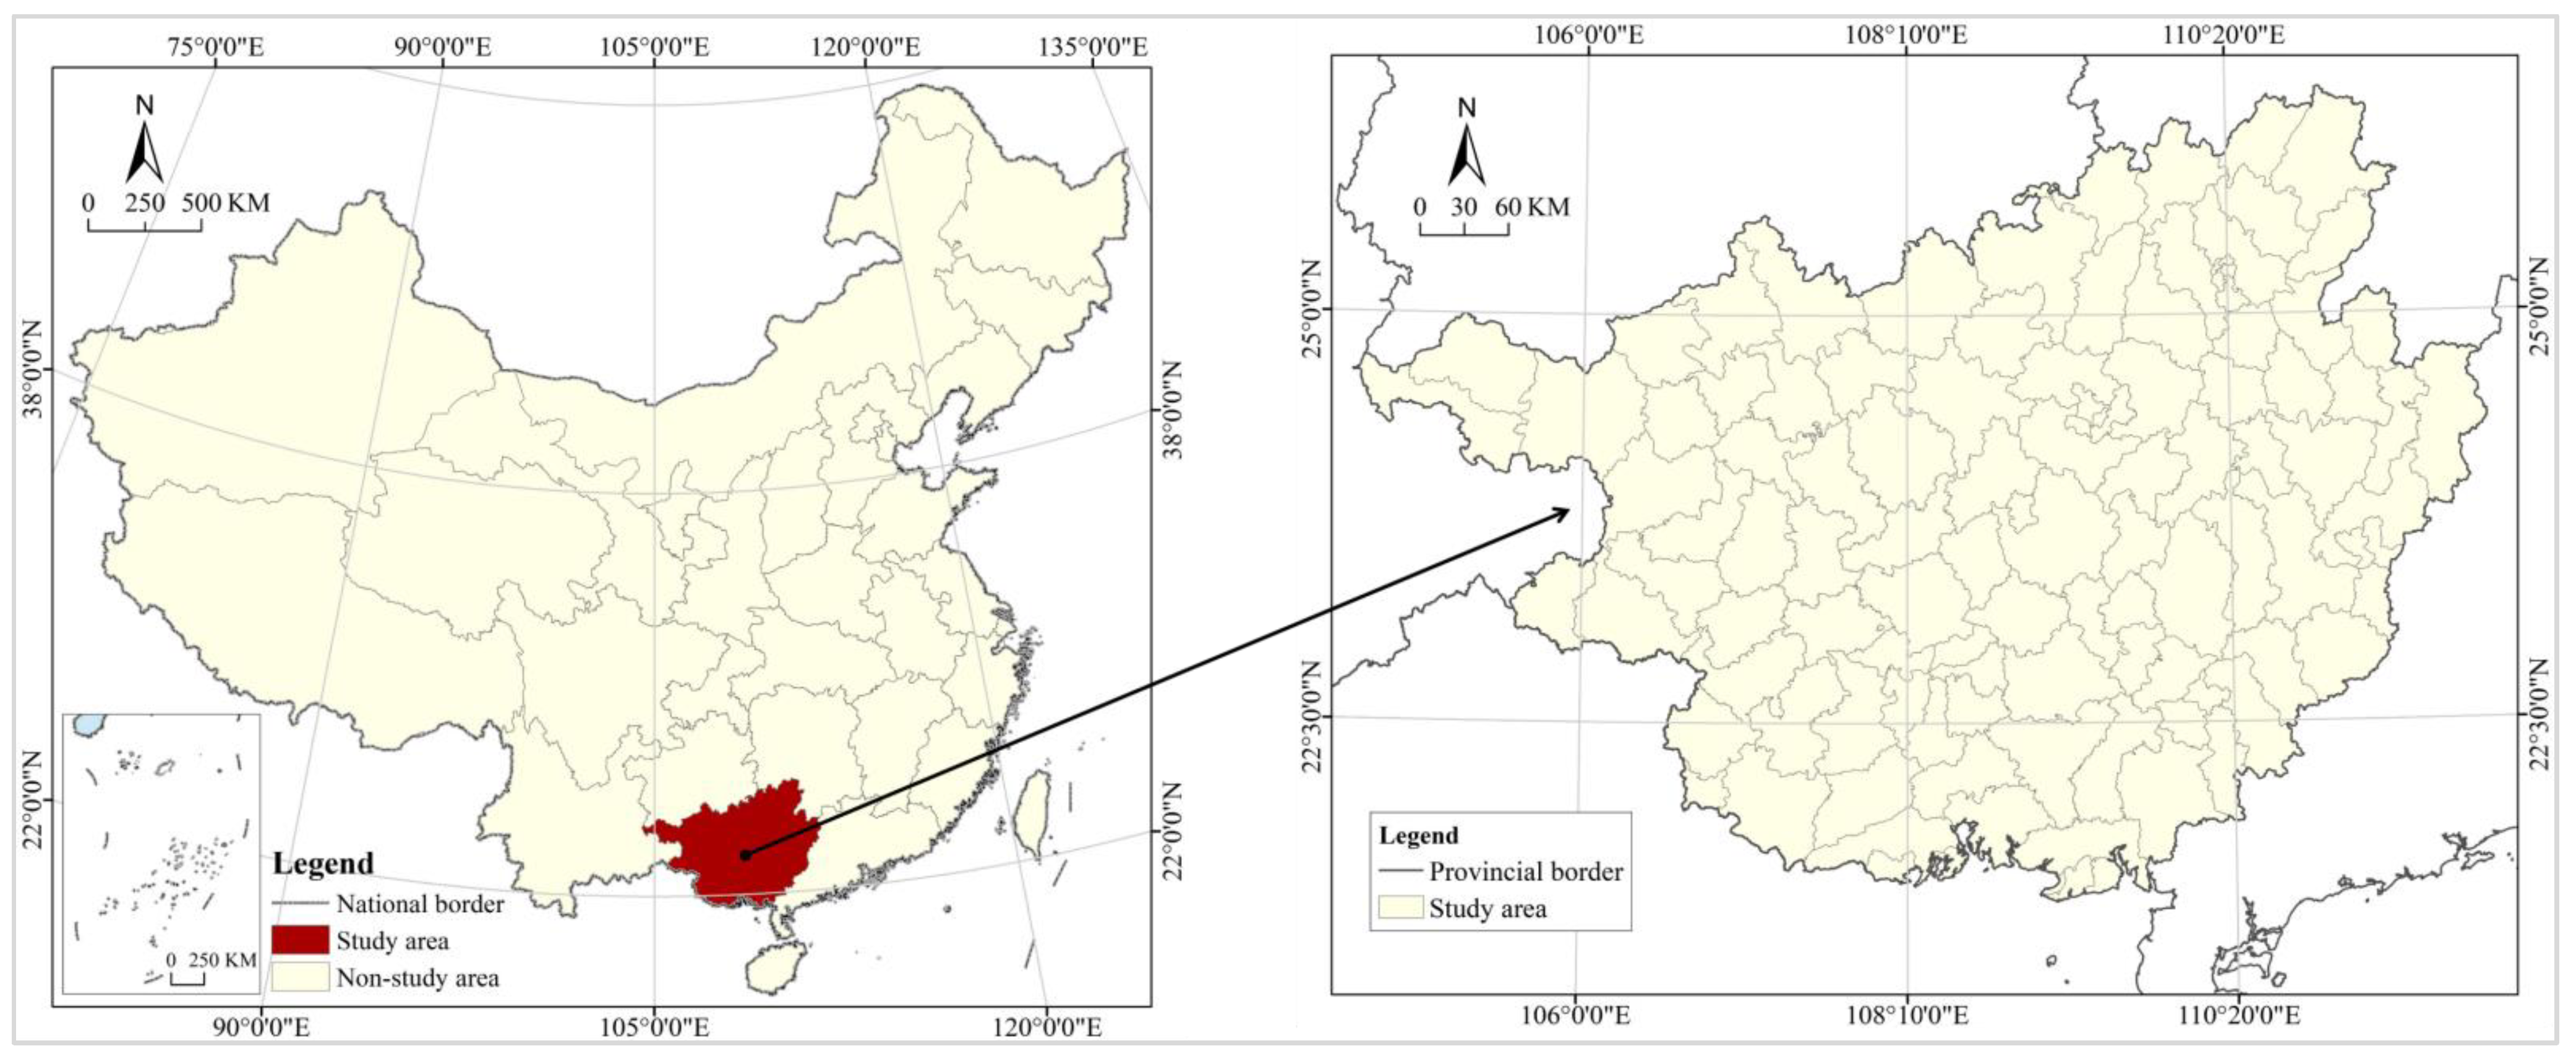
2.1. Study Area: Guangxi

The study area in this paper covers 111 county-level small cities in Guangxi, China, including 41 municipal districts, 9 county-level cities, 49 county towns, and 12 ethnic autonomous counties (Figure 1). Located in the border and coastal areas of southwest China, Guangxi is an autonomous region of ethnic minorities in China, with relatively lagging economic and social development and a relatively low level of urban development, making it a typically underdeveloped province in China. According to the China Statistical Yearbook, the GDP of Guangxi in 2019 was ¥2.1 trillion, lower than the national average (about ¥3.2 trillion) and ranked 19th in the country; its per capita GDP was ¥42,964 for the same period, much lower than the national average (¥69,235) and ranked 4th from the bottom in the country. According to the Guangxi Statistical Yearbook, the maximum resident population in 111 counties and districts of Guangxi was 1,162,700 (Xixiangtang District), and the minimum was only 44,500 (Leye County), with an average of 228,300 in 2019. According to the Notice on Adjusting the Criteria of City Size Classification issued by the State Council of China, there is only one large city (Xixiangtang District) with a population of more than 1 million; 10 medium-sized cities with more than 500,000, including Qingxiu District, Bobai County, and Pingnan County. The rest are all small cities, including 61 with a population of less than 200,000 and 25 with less than 100,000.
The conclusions obtained by measuring the level of urbanization development in Guangxi from different perspectives vary greatly, and it is difficult to grasp the real level of urbanization in Guangxi accurately. From the perspective of population urbanization, the population urbanization rate in Guangxi in 2019 was 51.09%, far lower than the national average (60.85%), ranking 5th from the bottom in China. From the perspective of economic urbanization, the proportion of secondary industry in Guangxi in 2019 was 33.3%, lower than the national average (37.41%), ranking 6th from the bottom in the country; the tertiary industry in 2019 occupied 50.7%, lower than the national average (53.66%), ranking 21st in the country; from the perspective of land urbanization, the urban construction land in Guangxi covered an area of 1542.78 km2 in 2019, lower than the national average (1945.56 km2), ranking 16th in the country. From the perspective of life and social urbanization, the average incomes of urban and rural residents in Guangxi were ¥34,744.87 and ¥13,675.73, respectively, lower than the national average (¥42,358.80 and ¥16,020.67), ranking 22nd in China. The conclusions vary widely by using different indicators, and it is difficult to judge the real level of urbanization development in Guangxi and its position in the country accurately. Similarly, it is difficult to compare the urbanization development level of 111 county-level cities in Guangxi, so it is necessary to find a set of comprehensive indicators that can reflect urbanization in multiple dimensions, such as population, economy, land, and society. Remote sensing satellite night light data can represent the reality of human activities in urban areas, and they can comprehensively reflect the real level of urbanization development when used as a proxy variable. In general, Guangxi is a typical representative of less developed regions in China. The analysis of urbanization differences and their driving mechanisms in Guangxi based on night light data provides a great reference value for solving the unbalanced urbanization development in small cities for China and other regions in the world.

2.2. Research Methods

The coefficient of variation and Gini index are introduced in this paper to measure the spatial inequality degree of urbanization in Guangxi. Exploratory Spatial Data Analysis is used to study the spatial patterns and the GeoDetector method is applied to measure the size of the driving force and its interaction. According to the research by Guan [103], Miyamoto [104], and She [105], Zhang [106], dispersion is classified into weak, medium, and strong levels based on the CV values. That is, a CV value of 0–0.15 shows weak dispersion, reflecting a low degree of spatial inequality of urbanization; a value of 0.16–0.35 shows medium dispersion, reflecting a high degree of spatial inequality of urbanization; a value of 0.36 or more shows strong dispersion, reflecting a very high degree of spatial inequality of urbanization. According to the research of the United Nations Development Program and the protocol of Li [107], a Gini index greater than 0.4 in this paper indicates a large gap, representing a spatial inequality of urbanization development; a Gini index greater than 0.6 indicates a huge gap, representing a very serious spatial inequality of urbanization development.
ESDA is a classic data-driven analysis method in geography, and the commonly used measurement indexes include the global Moran’s I, Moran’s scatter plot, and the Lisa agglomeration distribution graph. This paper uses the global Moran’s I to show whether there is spatial autocorrelation in the overall space and further explains the specific existence of spatial correlation in terms of spatial location through the Lisa agglomeration distribution map to reflect the spatial heterogeneity and instability within the local area. Global Moran’s I have a value in the range of [−1, 1]. At 5% or a more stringent level of significance, the value > 0 represents positive spatial correlation, and a greater value indicates a more significant spatial correlation and agglomeration; the value < 0 represents negative spatial correlation, and a smaller value represents a larger spatial variation; the value =0 represents random spatial distribution. According to Local Moran’s I, spatial correlation patterns can be classified into H-H and L-L of positive spatial correlation and H-L and L-H of negative spatial correlation. This paper conducts the spatial autocorrelation analysis by Arcgis10.2 and GeoDa1.18 at the significance level of 0.05, with the spatial weight matrix based on the adjacent boundaries and all parameters defaulted by the software. There are neighbors with a maximum of 10 and a minimum of 1. The mean is 5.12 and the median is 5.00.
Convergence means that cities with lower levels of development tend to grow faster, and all cities tend to be close to each other in terms of development level. The convergence analysis is conducted to examine the convergence or divergence of urbanization development in different cities, including examinations of α convergence and β convergence as well as club convergence. The α convergence does not take into account the initial level of urbanization or the initial factor structure of each city, and it is mainly determined by observation of the trend of the relevant parameters; the β convergence assumes that different cities have the same initial factor structure, and it is mainly estimated by the ordinary least squares; the club convergence assumes that the cities have a different initial structure and the development results are closely related to it, which is often analyzed by the spatial autocorrelation of GeoDA.
The core idea of GeoDetector lies in the fact that the factor values and the evaluation values with significant impacts should be similar in spatial distribution. GeoDetector is a new application for spatial differentiation and impact factor detection developed by Wang Jinfeng’s team, including differentiation, detection of factors, detection of interactions, detection of risk areas, and detection of ecology [108,109]. In this paper, two functional modules, the detection of factors and detection of interactions, are used to study the factor forces affecting the spatial pattern of urbanization in county-level cities in Guangxi and their interaction effects. In the detection of factors, GeoDetector quantitatively evaluates the association (similarity) between each independent variable and the dependent variable by calculating the q-value of both [110]. In the detection of interactions, GeoDetector calculates and compares the q-value of the two independent variable factors superimposed on the dependent variable to determine whether there is an interaction between the two independent variable factors as well as the strength, direction, linearity, or nonlinearity of the interaction (Table 1) [111,112].
The BCG method is mainly applied to business management and economics. Based on the interaction of two factors of “sales growth” and “market share”, the product or market is classified into four types: stars, questions, cows, and dogs [113]. In this paper, we draw on its basic principles for evaluating urban urbanization development policy zones and classify cities under study into four categories of H-H, H-L, L-H, and L-L depending on the relative dependent variable share and the average growth, to provide a basis for decision making in differentiated policy formulation. The relative share reflects the current scale of urbanization, and the growth rate reflects the changing direction of urbanization. Through the comprehensive application of both of them, it is helpful to discover the development trend of urbanization accurately.

2.3. Index Selection
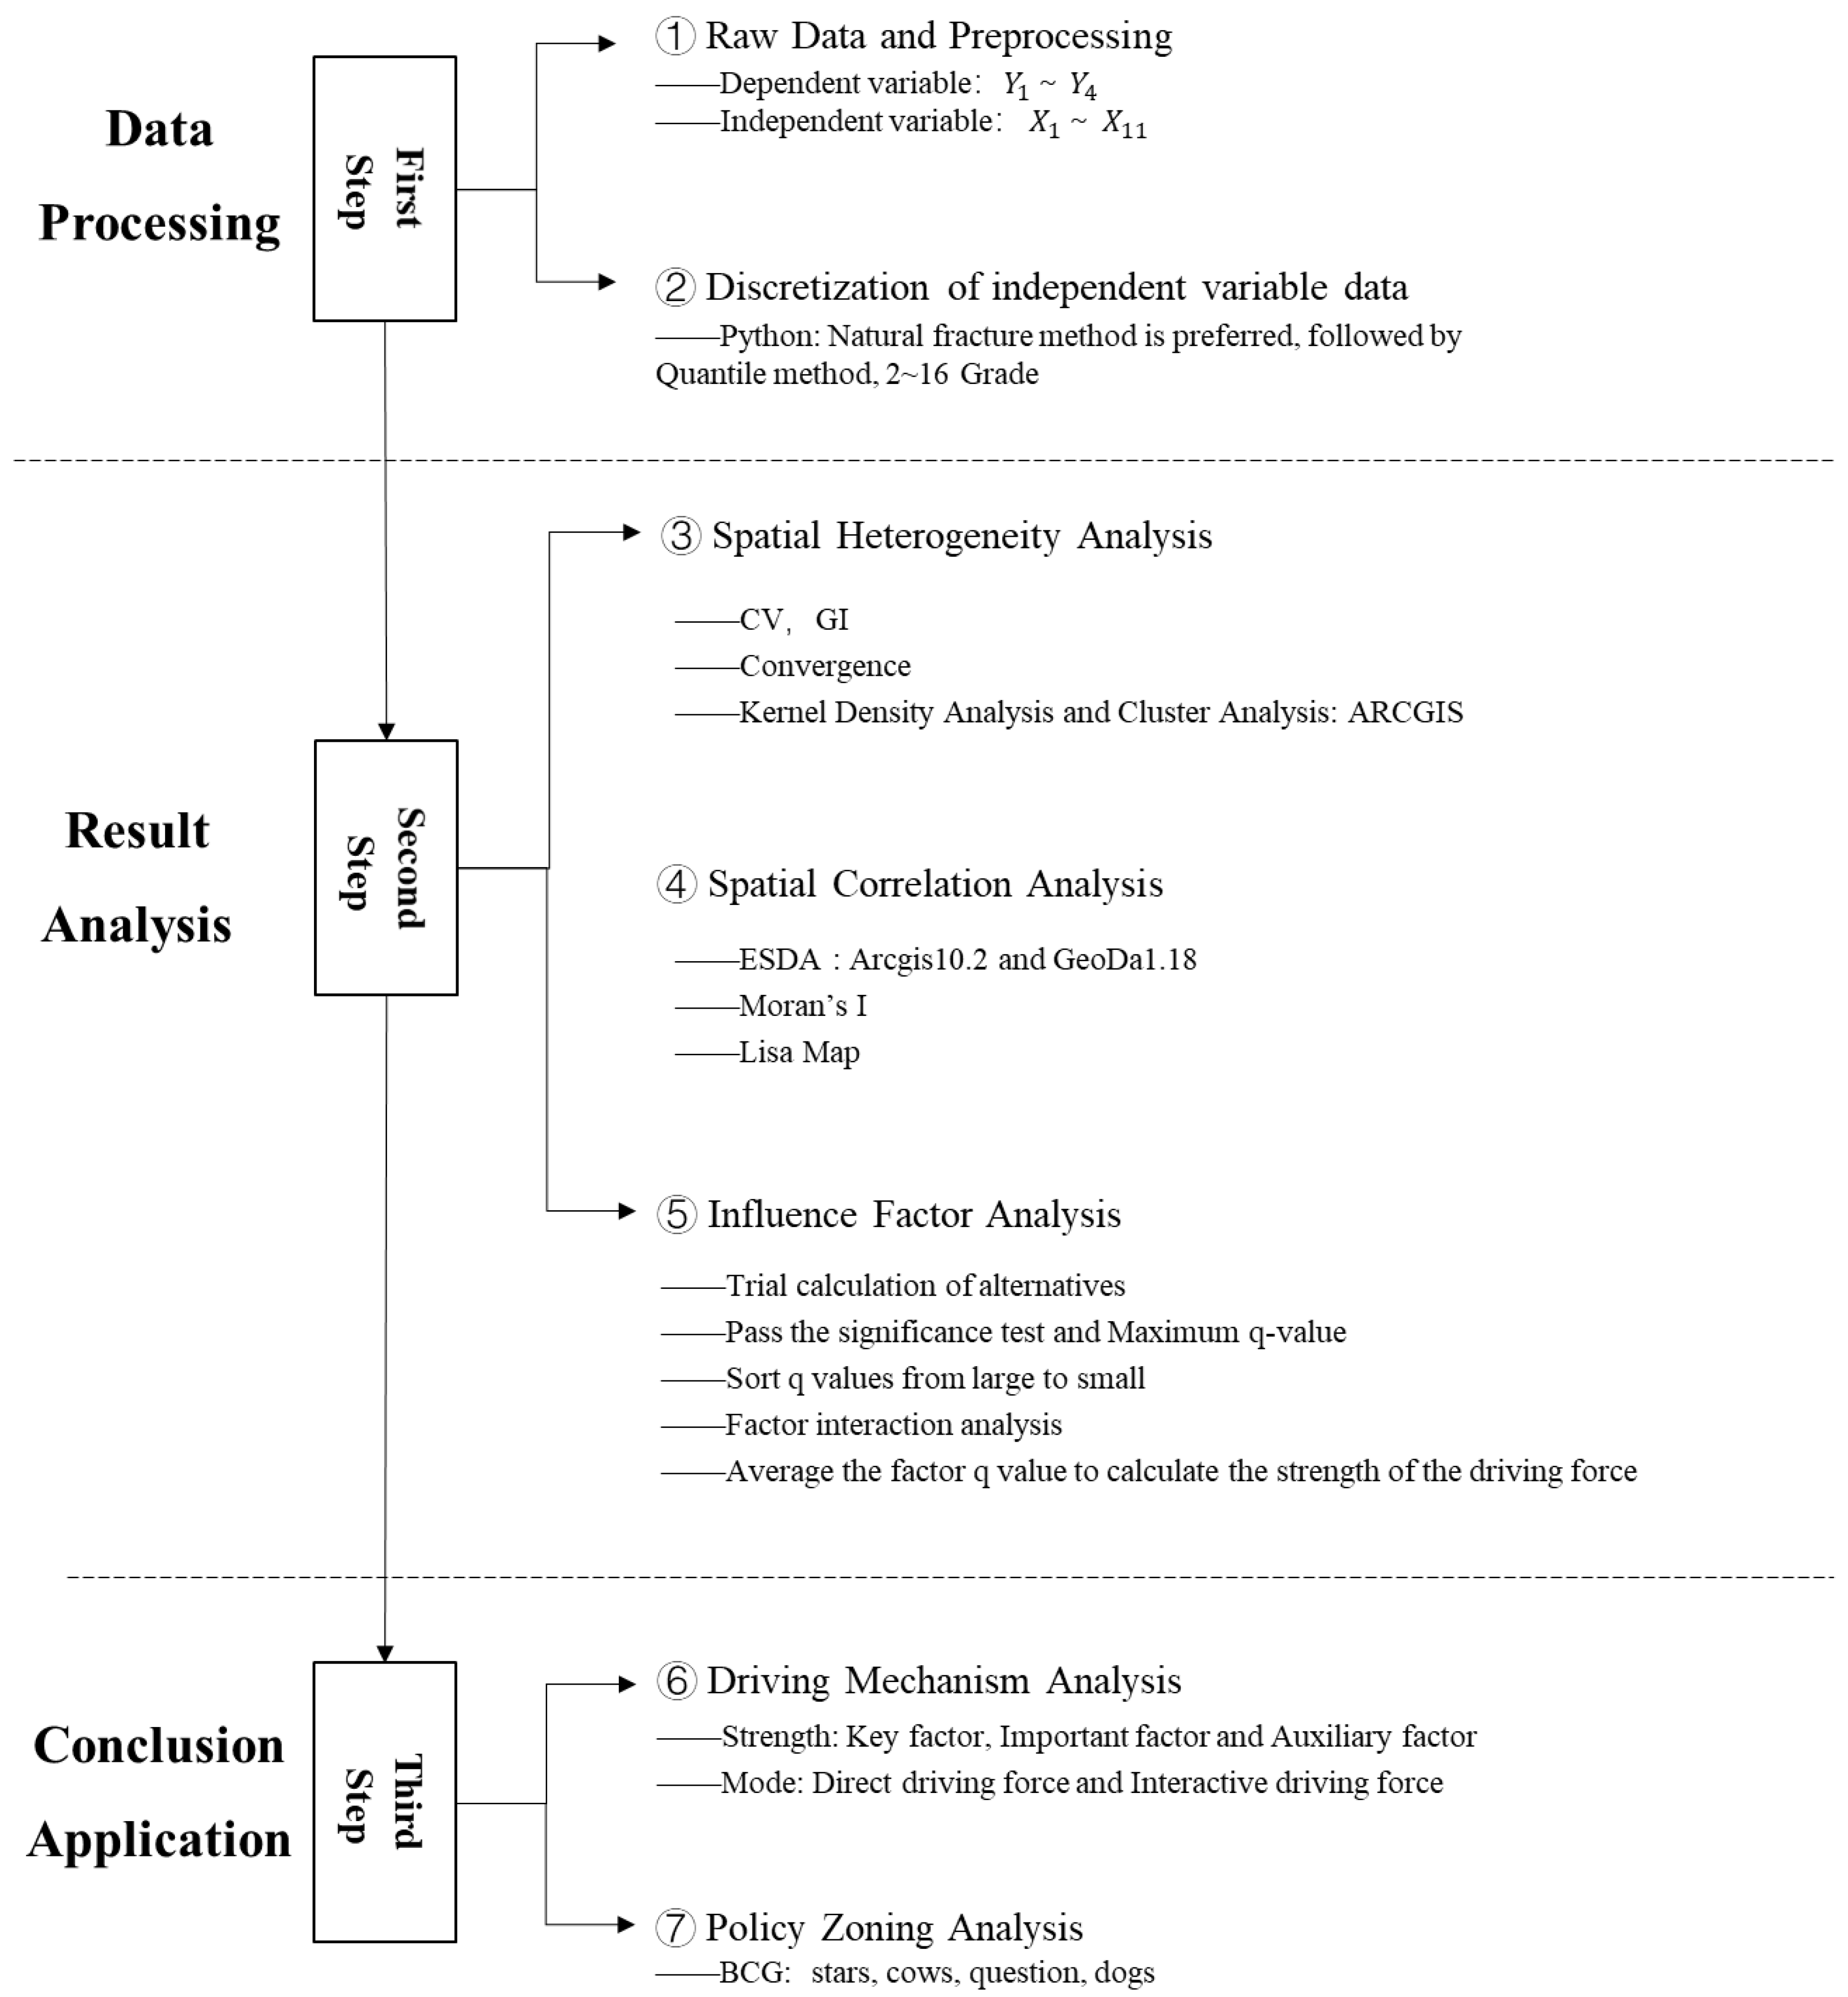
In this section, we will select appropriate dependent and independent variables for GeoDetector analysis. In terms of selecting dependent variables, both urban night lighting index and night light extended vitality index are basic indicators, and the change index can be constructed by calculating their difference between 2015 and 2019. They are the most intuitive indicators for studying the level of urbanization development and its changes and also important indicators for the government to investigate regional economic development and social progress. The urban night lighting index is equal to the sum of pixel values of all-night lighting areas in the region at night, representing the night lighting intensity of the entire region. A larger value indicates a stronger vitality and a higher quality of urbanization development. The urban night light extended vitality index is equal to the total of night lighting pixels in the region at night, with no fluctuation of night lighting brightness taken into account. A larger value represents a more obvious trend of urbanization spatial expansion. All the night light data in this paper come from Chinese cities’ corrected night light data in the Wind database.
The night light data of remote sensing satellites can detect urban lights, which is obviously different from the dark rural background and has been widely proved to be suitable for dynamic monitoring research of the urbanization process. Zhang [114] mapped urbanization dynamics for regions and countries worldwide depending on multi-temporal DMSP/OLS night light data, including India, China, Japan, and the United States. Tang [115] analyzed the spatio-temporal dynamic change of urbanization in countries along the “Belt and Road” using the composite light index, stating that urbanization is generally on the rise with significant spatial autocorrelation, and it is featured by high-high agglomeration in the West Asian region and low-low agglomeration in the Eastern European region, with the spatial pattern greatly influenced by national and regional development policies. Zhao [116] evaluated the spatio-temporal trend of urbanization in Southeast Asia based on the DMSP/OLS night light data time series and said that Southeast Asia enjoyed rapid development of urbanization in many forms during 1992–2013. Pandey [117], Xie [118], and Mauro [119] analyzed urbanization dynamics in India, the United States, and Vietnam using night light data and mapped their land use and cover changes. In terms of empirical studies of urbanization in China using night lighting data, Ma [120] quantitatively assessed the rate of urbanization in China, Xu [121,122], Ju [123], Ma [124], and Gao [125] analyzed the spatio-temporal dynamic change of urbanization in China, and He [126] made a reductive analysis of the urbanization process.
Many factors influence urbanization, and they are in a complex relationship. The existing studies mainly focus on population and economic size, industrialization, industrial structure, fiscal, and residential income, as well as other areas [127], and they are of great enlightening significance for this study. Urbanization and its changes are a systematic issue and based on the principles of comparability, feasibility, representativeness, and accessibility, and borrowing the research ideas of Li [128], Zhao [129], and Yuan [130], this paper selects 11 indicators for a comprehensive analysis of their influence factors (Table 2). It should be noted that Y 3 and Y 4 are not only in connection with the change of X i during 2015–2019, but also with the base value in 2015. Therefore, when using GeoDetector, the independent variables include the base values in 2015 and the change values during the period of 2015–2019, and the calculated result q is averaged as the final driving force intensity value.
The Central Urban Work Conference of China clearly demands the overall planning of urban space, scale, and industrial development and requires cities to clearly identify their leading industries and featured industries based on their resource endowments and location advantages to strengthen industrial collaboration and synergy among large, medium and small cities and towns, and gradually create a pattern of horizontal staggered development with vertical division and cooperation of labor. The area and intensity of night light are in close connection with the economic activities of the urban population, and the gross domestic product is the most important indicator to measure the level of urban economic development. Industrialization is the most important deep force driving urbanization. According to Chenery’s theory of industrialization development stage, per capital GDP and the added value of secondary and tertiary industries are the key indicators to determine the industrialization development stage. For local and city governments, the number of up-scale enterprises is the core carrier to promote industrialization and the key body to implement industrial development and spatial governance policies.
As required by the Central Urbanization Work Conference of China, promoting the transformation of the rural population into townspeople is the core task of China’s urbanization. Because China is a highly mobile society with a large floating population in every city, this paper chooses the resident population, namely the people who have lived in a city for six months or more, instead of the registered population to measure the influence of population factors on night lighting changes. The population urbanization rate is a common indicator for measuring the urbanization level and for the government to formulate policies. Effectively solving the problem of people is the key to promoting new urbanization, and improving the ability of migrant workers to be assimilated into cities and towns is a key indicator for evaluating the performance of governments. Despite the low accuracy of this indicator due to the existence of semi-urbanization, it is still a reference indicator that should not be ignored. Semi-urbanization means the incomplete transformation of the rural population into urban citizens during urbanization in China, mainly manifested by the fact that farmers have left the countryside to live and work in cities, but they do not enjoy the same benefits as urban residents in pay, children’s education, social security, housing, and other areas, and they do not have political rights such as the right to vote or to be elected in cities. They cannot be truly integrated into the urban society.
The Central Urban Work Conference requires balancing government, society, and citizens, raising the enthusiasm, initiative, and creativity of all parties to promote urbanization, and gathering positive energy to promote urban development. China’s urbanization is people-centered rather than material-centered. In other words, the core of urban development in China is not to build high-rise buildings but to better the living environment and improve lifestyles and behavior patterns. It should be noted that the government is the most critical force to push China’s urbanization, as it can rely on direct fiscal revenues and expenditures, bank loans, and policy design for effective macro-control of urbanization development. For the sustainable development of urbanization, it is necessary to encourage the government, society, and citizens to act in concert so that the tangible hand of the government, the invisible hand of the market, and the diligent hand of the citizens can work in the same direction. Aided by per capita disposable income of urban and rural residents and total retail sales of social consumer goods, the government revenue can better reflect the potential of citizens’ participation in urbanization, social consumption vitality, government intervention, and comprehensive governance capacity.

2.4. Research Steps

This study includes three steps and involves seven key points, as follows (Figure 2):
① Raw Data and Pre-Processing. Create a complete table of source data relying on the data published on concerned statistical websites, and calculate the amount of change in the dependent and independent variables based on the difference for the period of 2015–2019.
② Data Discretization. Discretize the continuous data of the independent variables by Python. To eliminate artificial influence and maximize the data differences between categories, this paper gives preference to natural breaks to classify the independent variable data of 111 county-level cities into five categories (2–6). It is important to note that when running GeoDetector, there should be at least two cities in each category in the classification results of the independent variables. However, many of the classification schemes of the natural break method for the amount of change in the independent variables of 2015–2019 fail to satisfy this requirement, so for them, this paper adopts quantile classification.
③ Spatial Heterogeneity Analysis. Calculate the coefficient of variation and Gini index of the dependent variable, determine the convergence of spatial differentiation, and analyze spatial clustering based on Arcgis 10.2.
④ Spatial Correlation Analysis. Perform spatial autocorrelation analysis on the dependent variable by Arcgis10.2 and GeoDa1.18 to calculate the global Moran’s I.
⑤ Influence Factor Analysis. Import the source data of the dependent variables and the discrete data of the independent variables into GeoDetector to conduct factor detection and interaction detection, and perform data review and result selection according to p-value (<0.05, or <0.1 under relaxed conditions) and q-value.
⑥ Driving Mechanism Analysis. Based on the analysis of night light data by GeoDetector, classify the influence factors into key factors, important factors, and auxiliary factors, and propose the mechanism driving the dynamic change of urbanization.
⑦ Policy Zoning Analysis. This paper analyzes the policy space classification of Guangxi’s urbanization development level using the BCG model and proposes adaptive and targeted policy recommendations.

2.5. Data Sources

The dependent variable data in this paper come from the Wind database provided by Shenzhen wind Technology Co., Ltd. (Shenzhen, China), including the urban night lighting index and night light extended vitality index. The former refers to the sum of pixel values of all-night lighting areas in the region at night, representing the night lighting intensity of the entire region and a larger value indicates a stronger vitality of urbanization development; while the latter refers to the total number of night lighting pixels in the region at night, with no fluctuation of night lighting brightness taken into account. As satellite remote sensing imagery needs to use a very complicated computer and programming technology, proofreading, and noise removal technology when it is converted into data, it has brought huge difficulties to the wide application of data. To solve these problems, the Chinese Research Data Services Platform has established a global night light database in conjunction with experts in related fields. It provides annual and monthly night light data at the county, city, and provincial levels in China, including raw and corrected data from 2013 to 2019. It adopts an average value processing method and has been used by many scholars [131,132].
This article uses the county annual data of Guangxi Province from 2015 to 2019. The data of independent variables are mainly from Guangxi Statistical Yearbook, Guangxi Statistical Handbook, and some indicators of independent variables and dependent variables come from China Statistical Yearbook, Guangxi Construction Yearbook, China County Seat Construction Statistical Yearbook, China County Construction Statistical Yearbook, with some missing data collected from statistical handbooks, statistical bulletins and government work reports of each county. It should be noted that the database only has data for Cangwu County for 2014 and 2018, and this paper estimates its data for 2015 and 2019 using trend extrapolation.
The data span the years 2015–2019 for two purposes. The first is to ensure that the data are complete. Because of inconsistent sources of light data prior to 2014, a longer study period would hamper the accuracy of the conclusions. The second is to maintain the relative consistency of the policies in the context that after the central government promulgated the National New-Type Urbanization Plan in 2014, national and local city governments began to attach importance to urbanization and county-level city development, and a series of spatial plans and development policies were promulgated and implemented. The central government promulgated Several Opinions on Deepening the Construction of New-type Urbanization in 2016 and implemented Several Opinions on Innovation-driven Development of Counties in 2017; the local government formulated New-type Urbanization Plan of Guangxi in 2014 and clearly put forward the implementation of the “Big County” strategy, and promulgated Opinions on Implementing the Strategy of Big County to Improve the Level of County Urbanization Development in 2015, followed by the implementation of special policies and implementation programs such as the Decision of Guangxi on Accelerating the Development of County Economy and the Thirteenth Five-Year Plan for the Development of County Economy in Guangxi. Policies are increasingly focused and specialized. Given the lag in the effectiveness of policy implementation, it is more reasonable to take 2015 as the base year for the analysis.

3. Results

3.1. Urban Night Lighting Index Analysis

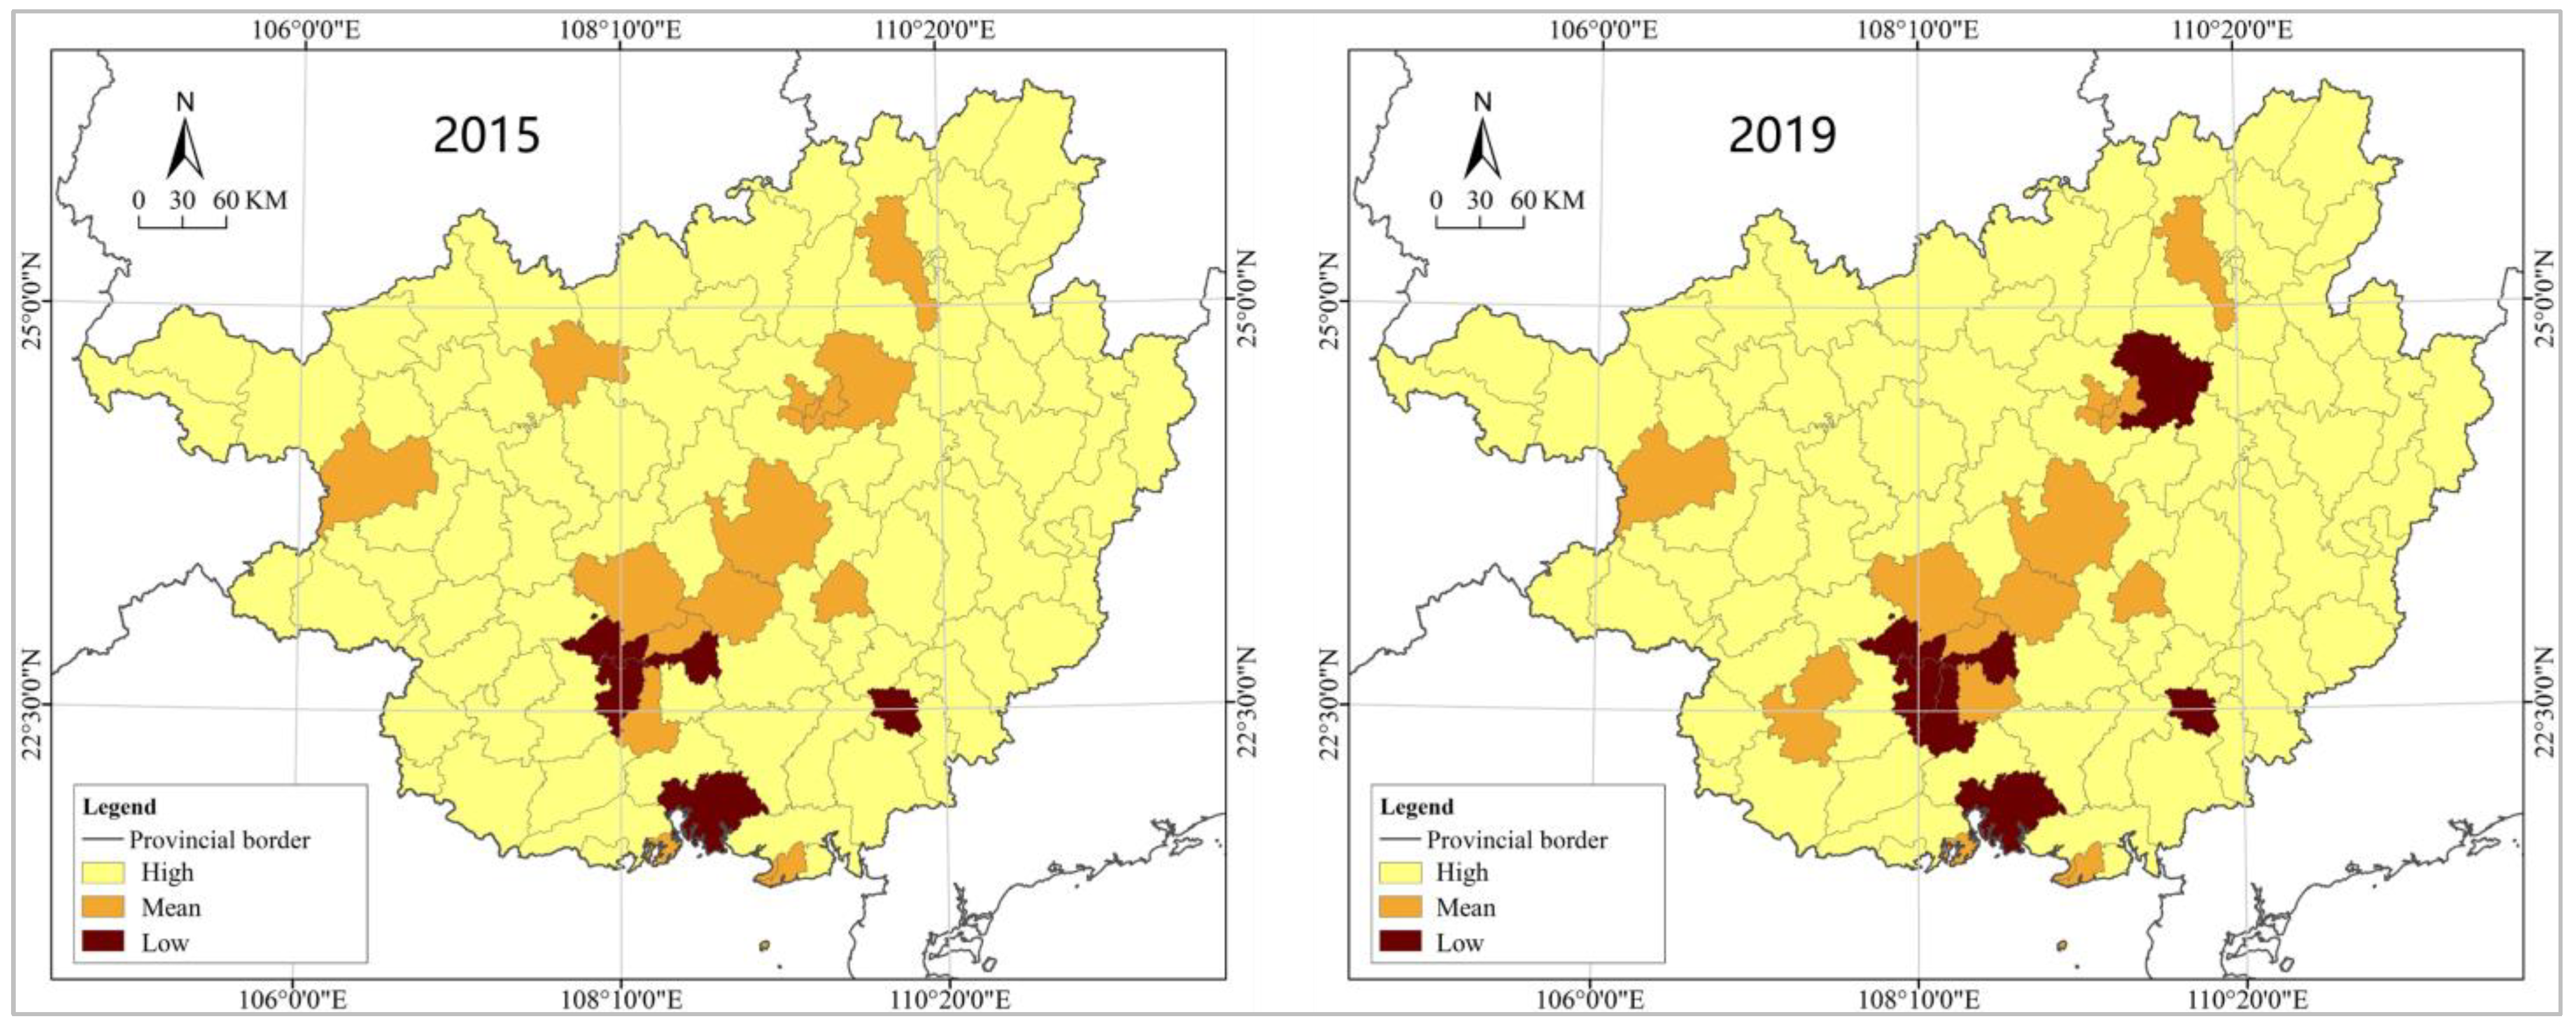
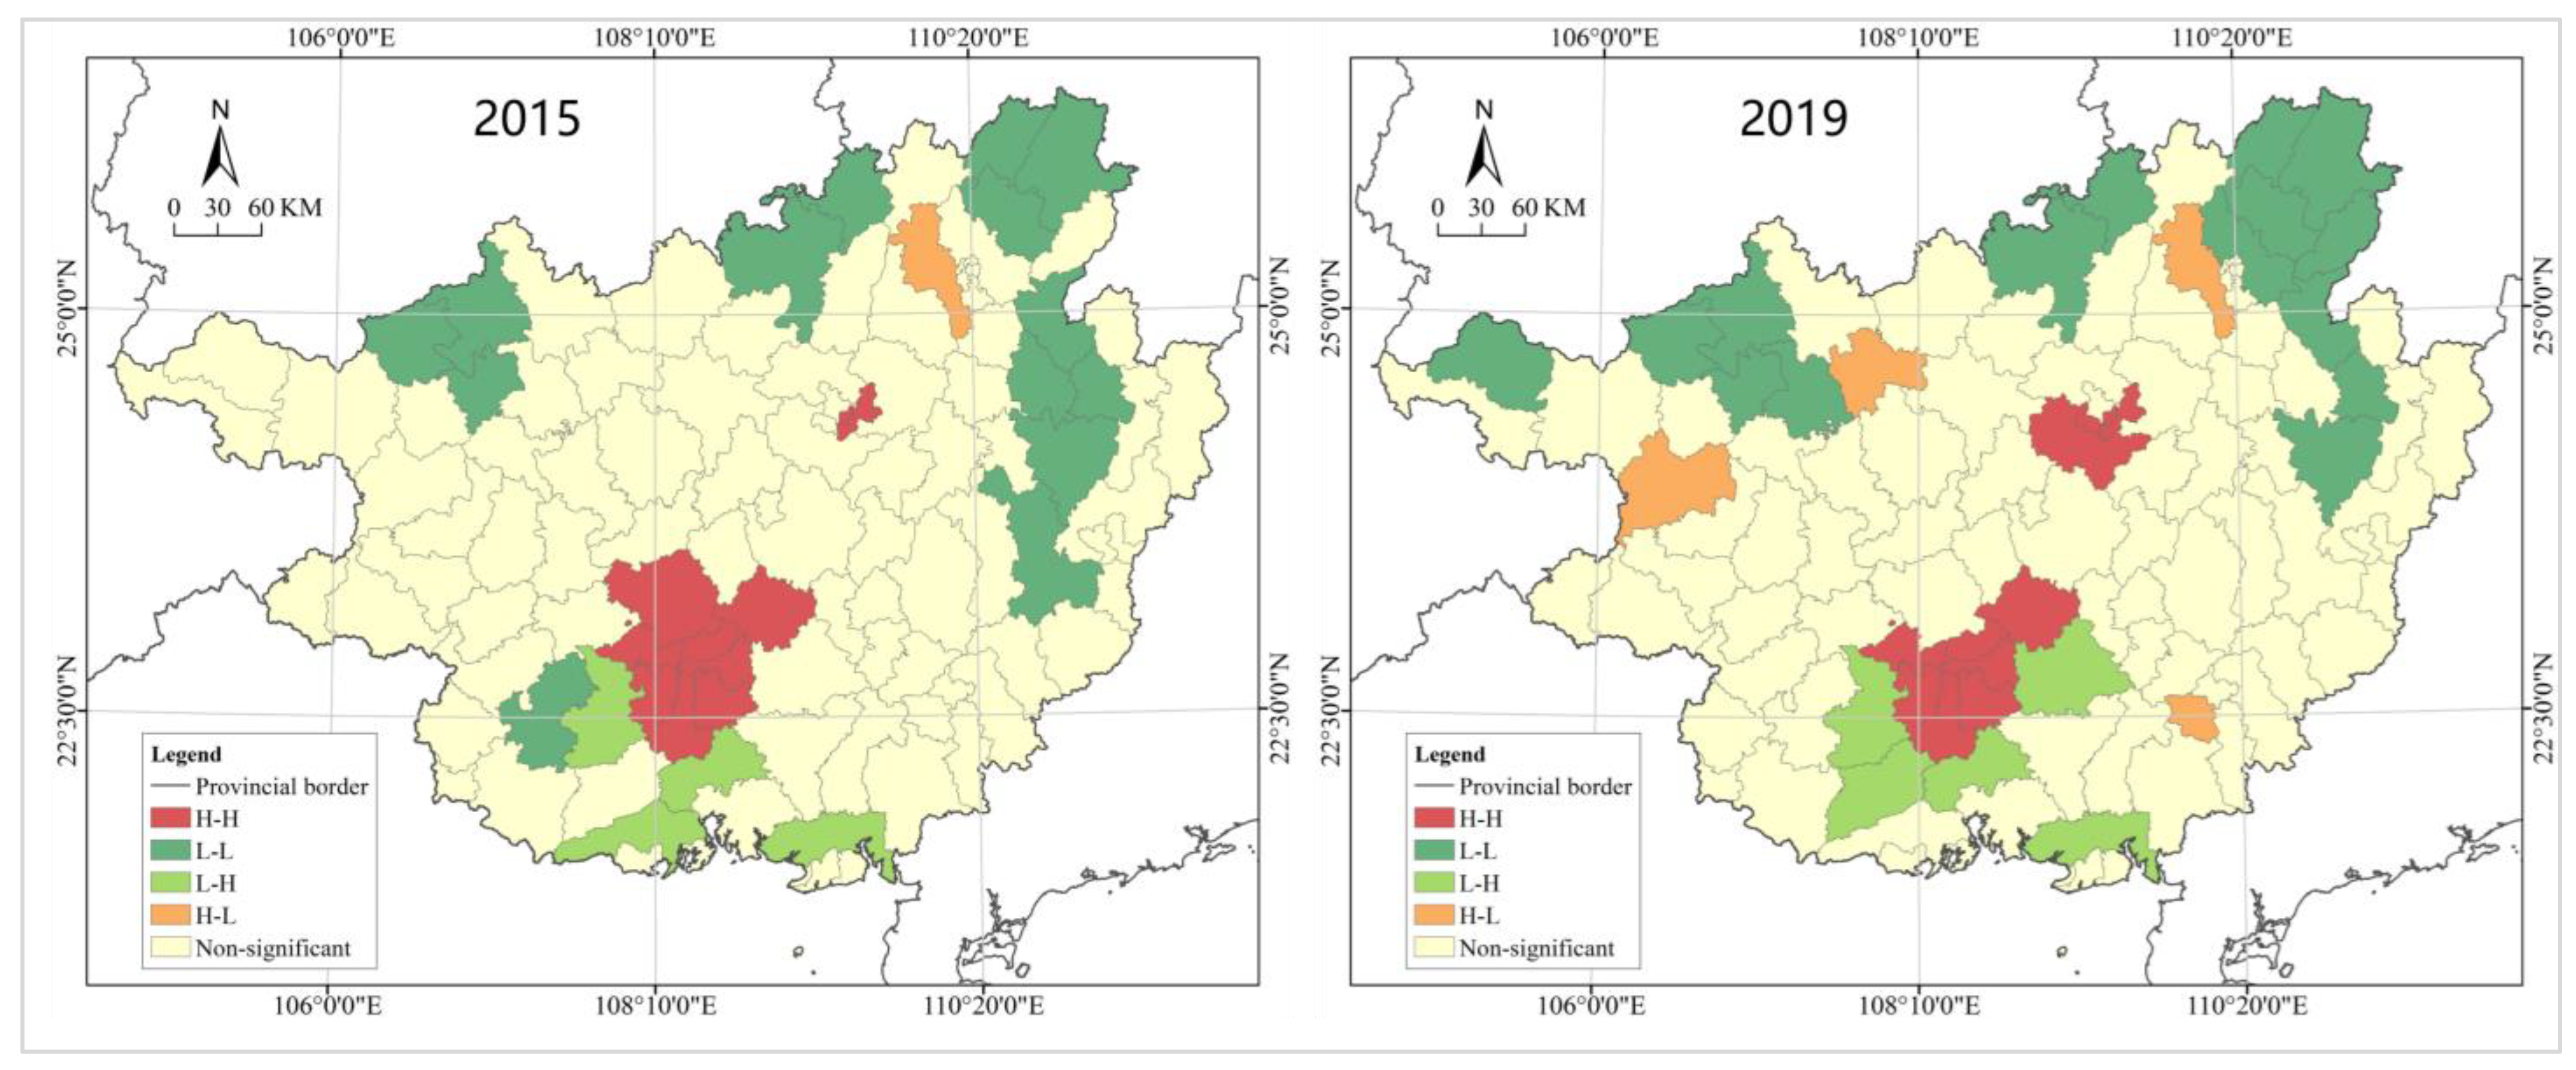
3.1.1. Spatial Pattern

The urban night lighting index in Guangxi shows a large spatial variation, but the degree of heterogeneity declines and conforms to the α convergence. In 2015, the average urban night lighting index in Guangxi was 1440.44, and the coefficient of variation and Gini index were 1.54 and 0.66, respectively, much higher than 0.36 and 0.6, indicating a very serious spatial inequality. The average urban night lighting index in Guangxi increased to 2163.34 in 2019, while the coefficient of variation and Gini index decreased to 1.42 and 0.63, respectively. Compared with 2015, the average urban night lighting index in Guangxi grew by more than 70%, while the coefficient of variation and Gini index decreased, but still higher than 0.36 and 0.6 (Table 3). Based on the regression analysis by ordinary least squares, the β convergence coefficient was calculated to be −0.04, but the goodness of fit was small (R2 = 0.16) with a low confidence level so that the β convergence could be generally excluded. The above data show that urbanization in Guangxi has developed rapidly in recent years, and the gap between cities is decreasing. However, the problem of inequality is very serious and will be a major challenge to achieving sustainable development.
To carry out spatial clustering analysis based on natural breaks of Arcgis, the urban night lighting indexes are classified into high, mean, and low levels (Figure 3). Cities of the high level are mainly located in the provincial capital metropolitan area, Beibu Gulf city cluster, Liuzhou and Yulin metropolitan areas, including Qingxiu District, Xixiangtang District, Jiangnan District, Qinnan District, Liunan District, and Fumian District. Cities of the mean level are mainly distributed along the Hunan and Guangxi railway, and a few are scattered in the coastal areas of Beibu Gulf and Zuo-Youjiang revolutionary base area, including Liunan District, Haicheng District, Yinhai District, Yufeng District, Xingning District, Youjiang District, Wuming District, and Binyang County. There are many cities of the low level, including Pingguo City, Jingxi City, Pingnan City, Lingshan County, Tiandong County, and Luchuan County. It should be noted that the spatial pattern of the urban night lighting index in Guangxi was generally stable in 2015 and 2019, and only changes were found in the category of some cities. For example, Luzhai County and Liangqing District went up from the mean level to the high level, and Yongning District and Jiangzhou District went up from the low level to the mean level. In general, the overall spatial pattern of the urban night lighting index in Guangxi is solidified, and the spatial structure changes from two centers to three centers. The capital city circle of Nanning, the coastal city cluster of Beibu Gulf, and the urban cluster of central Guangxi have become the focus of urbanization development in Guangxi.
According to the spatial correlation analysis by GeoDA, the Global Moran’s I of Guangxi urban night light index (Global Moran’s I) in 2015 and 2019 was 0.29 and 0.35 (confidence level of 0.001), respectively, with large changes, indicating that the scale of urbanization development in Guangxi has a significant positive spatial autocorrelation, with increasing spatial agglomeration and correlation. At the significance level of 0.1, 111 cities are divided into four categories of H-H, H-L, L-L, and L-H by local autocorrelation analysis. In 2015, H-H cities were mainly concentrated in the capital city circle of Nanning except for the Yufeng District and Chengzhong District, indicating that these cities and their surrounding cities had a high level of urbanization with a small spatial variation. L-L cities were concentrated in the border areas of northern Guangxi and eastern Guangxi, including Leye County, Tian’e County, Sanjiang County, Rongshui County, Xing’an County, Quanzhou County, Ziyuan County, Gongcheng County, Zhaoping County, Zhongshan County, Pingle County, and Jiangzhou District, indicating that these cities and their surrounding cities had a low level of urbanization, also with a small spatial variation. Fusui County, Hepu County, Qinbei District, and Fangcheng District are L-H cities, and only Lingui District is an H-L city, which differed significantly from their neighboring cities in the urbanization level. Compared with 2015, in 2019, H-H cities expanded to northern Guangxi, L-L cities shrank in eastern Guangxi and expanded to northeast Guangxi, L-H cities clustered to the periphery of Nanning capital city circle, and L-H cities received new members of Youjiang District, Jinchengjiang District, and Fumian District, further improving spatial autocorrelation and agglomeration (Figure 4).

3.1.2. Influence Factors

According to the analysis by GeoDetector, Resident Population could only pass the significance test of 0.1 in 2019. With the average of factor detection results q in 2015 and 2019 used as the direct driving force intensity of factors, at 5% or a more stringent level of significance, the factor forces are ranked as Added Value of Tertiary Industry > Gross Domestic Product > Total Retail Sales of Social Consumer Goods > Government Revenue > Added Value of Secondary Industry > Population Urbanization Rate > Per capita GDP > Per Capita Disposable Income of Urban Residents > Per Capita Disposable Income of Rural Residents > Number of Up-scale Enterprises > Resident Population. The direct driving forces of most influential factors were enhanced during 2015–2019, especially the Number of Up-scale Enterprises, Per Capita Disposable Income of Urban Residents, and Per capita GDP. It should be noted that the effect of Added Value of Tertiary Industry and Resident Population went down (Table 4).
The relationship between factor pairs is mainly bifactor enhancement, supplemented by nonlinear enhancement, and there is no independent or weakening relationship. In 2015, the maximum factor interaction was 0.74 ( X 3 X 8 ), the minimum was 0.28 ( X 6 X 9 ), with an average of 0.59; there were 15 nonlinearly enhanced factor pairs, and the interactions of X 1 X 7 , X 3 X 8 , X 8 X 10 were more than 0.7. In 2019, the maximum factor interaction was 0.83 ( X 2 X 6 ), the minimum was 0.56 ( X 6 X 11 ), with the average of 0.69, both gaining a large growth; the number of nonlinearly enhanced factor pairs increased to 16, and the interactions of X 2 X 5 , X 2 X 6 , X 3 X 5 , X 3 X 8 , X 3 X 9 , X 5 X 7 , X 5 X 8 were more than 0.7. According to the principle of “1:3:6”, the factor pairs are divided into three levels: high, mean, and low (Figure 5). It should be noted that Gross Domestic Product, Added Value of Tertiary Industry, Per Capita Disposable Income of Urban Residents, and Total Retail Sales of Social Consumer Goods were the most important interaction factors in 2015, which changed to Per capita GDP, Added Value of Secondary Industry, Population Urbanization Rate, and Gross Domestic Product in 2019.

3.2. Night Light Extended Vitality Index Analysis

3.2.1. Spatial Pattern

The spatial differentiation of the urban night light extended vitality index in Guangxi is large but lower than the urban night lighting index, which conforms to the α convergence. In 2015, the average urban night light extended vitality index in Guangxi was 95.42, and the coefficient of variation and Gini index were 1.16 and 0.56, respectively, with the former higher than 0.36 and the latter higher than 0.5 but lower than 0.6, indicating the existence of certain but not very serious spatial inequality. The average urban night light extended vitality index in Guangxi increased to 135.39 in 2019, and the coefficient of variation and Gini index decreased to 1.42 and 0.53, respectively. Compared with 2015, the average urban night lighting index in Guangxi grew by more than 40%, while the coefficient of variation and Gini index decreased, but still higher than 0.36 and 0.5 (Table 5). Based on the regression analysis by ordinary least squares, the β convergence coefficient was calculated to be −0.04, but the goodness of fit was small (R2 = 0.15) with a low confidence level so that the β convergence could be generally excluded. The above data show that in recent years, Guangxi has enjoyed the strong spatial expansion of urbanization with a small reduction in the gap between cities, despite certain spatial inequality, which is still within the controllable range.
To carry out spatial clustering analysis based on natural breaks of Arcgis, the urban night light extended vitality indexes in Guangxi are divided into high, mean, and low levels, and the development quality of each type is much higher than that of the urban night lighting index (Figure 6). Cities of the high level are mainly beaded along the Hunan and Guangxi railway. In 2019, the capital city circle of Nanning was connected with Laibin, Guigang, and other regions in central Guangxi, making the spatial agglomeration more obvious. Cities of the mean level are concentrated in the periphery of the high-level cities and eastern Guangxi and expand along expressways, HSR lines, and other important traffic corridors. Cities of the low level are mainly located in areas with poor traffic conditions in northern Guangxi, southwestern Guangxi, and eastern Guangxi, most of them poor counties or mountainous counties. It should be noted that the capital city circle of Nanning, Beibu Gulf coastal city cluster, and central Guangxi city cluster have developed rapidly, while the city cluster in southeast Guangxi, the city cluster in northern Guangxi, and Youjiang River valley urban belt have developed and taken shape, but the border urban belt and Nanchong urban belt are poorly developed and not in their infancy. In general, the spatial pattern of urban night light extended vitality index in Guangxi is developing well. Based on railroads, highways, waterways, and other major traffic arteries, Guangxi promotes spatial expansion relying on both the corridor mode and the center-periphery mode for its urbanization development, showing increasingly obvious spatial agglomeration and point-axis characteristics.
According to the spatial correlation analysis based on GeoDA, the Global Moran’s I of Guangxi urban night light extended vitality index in 2015 and 2019 was 0.26 and 0.27 (confidence level is 0.001), respectively, with little changes, indicating that the urbanization development quality in Guangxi has a long-term positive spatial autocorrelation and the spatial correlation is stable. At the significance level of 0.1, the results of local autocorrelation analysis are similar to those of urban night light index. In 2015, H-H cities were mainly concentrated in the capital city circle of Nanning, the Beibu Gulf coastal city cluster, and the city cluster in central Guangxi, while L-L cities were concentrated in the northern Guangxi border and northeast Guangxi. There were a small number of L-H and H-L cities, with the former including Fusui County, Qinbei District, and Lingshan County, and the latter including the Jinchengjiang and Lingui Districts. Compared with 2015, in 2019, H-H cities shrank in coastal areas, expanded in the capital city circle, and remained stable in central Guangxi; L-L cities shrank in eastern Guangxi, expanded in northeast Guangxi, and remained stable in northern Guangxi border areas; L-H cities clustered in Nanning-Beihai development corridor area, and L-H cities received a new member of Youjiang District (Figure 7).

3.2.2. Influence Factors

At 5% or a more stringent level of significance, the factor forces are ranked: Gross Domestic Product > Added Value of Tertiary Industry > Total Retail Sales of Social Consumer Goods > Added Value of Secondary Industry > Population Urbanization Rate > Per capita GDP > Government Revenue > Per Capita Disposable Income of Rural Residents > Per Capita Disposable Income of Urban Residents > Number of Up-scale Enterprises > Resident Population. The direct driving forces of all the factors except Added Value of Tertiary Industry gained enhancement during 2015–2019, especially Per capita GDP, Number of Up-scale Enterprises, and Population Urbanization Rate (Table 4).
The relationship between factor pairs is mainly bifactor enhancement, supplemented by nonlinear enhancement, and there is no independent or weakening relationship. In 2015, the maximum factor interaction was 0.72 ( X 4 X 6 ), and the minimum was 0.47 ( X 8 X 11 ), with an average of 0.59; there were 17 nonlinearly enhanced factor pairs, and only the interactions of X 4 X 6 and X 3 X 8 were more than 0.7. In 2019, the maximum factor interaction was 0.78 ( X 2 X 6 ), and the minimum was 0.45 ( X 6 X 9 ), with an average of 0.63; the nonlinearly enhanced factor pairs were reduced to 6, and the interactions of X 2 X 5 , X 2 X 6 and X 6 X 7 were more than 0.7. In general, the interaction between factors was enhanced, but the complexity of the interaction effect was reduced. According to the principle of “1:3:6”, the factor pairs are divided into high, mean, and low levels (Figure 5). It should be noted that Gross Domestic Product, Per capita GDP, Total Retail Sales of Social Consumer Goods, and Government Revenue were the most important interaction factors in 2015, which changed to Gross Domestic Product, Per capita GDP, Added Value of Secondary Industry, and Government Revenue in 2019.

3.3. Changes Analysis of Urban Night Lighting Index

3.3.1. Spatial Pattern

The increase and decrease in the urban night lighting index coexist in Guangxi, and there is a strong spatial heterogeneity and autocorrelation in the amount of change. During 2015–2019, the average change of night lighting index in Guangxi was 722.91, the maximum spatial expansion was 10,220.83 (Jiangnan District), and the minimum spatial shrinkage was −2122.96 (Yinhai District). There are 82 cities spatially expanding with an average change of 751.24, and 29 cities spatially shrinking with an average change of −329.64. With them used as thresholds, the 111 cities are classified into four categories: high expanding cities, expanding cities, shrinking cities, and high shrinking cities. High expanding cities are mainly concentrated in the capital city circle of Nanning and the city cluster in central Guangxi, while shrinking cities are mainly concentrated in the Youjiang town belt and Guizhou–Guangxi town belt. The standard deviation and coefficient of variation of urban night lighting index during 2015–2019 were 1463.22 and 2.02, respectively, reflecting the unbalanced changes in the scale of urbanization. The global Moran’s I for the change amount of urban night lighting index in Guangxi is 0.27 (confidence level of 0.001), indicating that the urbanization development in Guangxi has a positive spatial autocorrelation. At the significance level of 0.1, H-H cities are concentrated in the capital city circle of Nanning and the city cluster in central Guangxi; L-L cities are concentrated in the Guizhou–Guangxi urban belt; L-H cities are concentrated in the periphery of H-H cities; there are a small number of H-L cities, only Tieshangang District and Tiandong County (Figure 8).

3.3.2. Influence Factors

Resident Population can only pass the significance test of 0.1 if the base period amount (value in 2015) is used as an independent variable, and it is true for Government Revenue when the change amount (difference between 2015 and 2019) is taken as an independent variable, while Number of Up-scale Enterprises, Population Urbanization Rate, and Total Retail Sales of Social Consumer Goods cannot pass the significance test. With the average of the factor detection results q of the base period volume and the change amount used as the direct driving force intensity of factors, at 5% or a more stringent level of significance, the factor forces are ranked as Added Value of Secondary Industry > Per capita GDP > Gross Domestic Product > Per Capita Disposable Income of Urban Residents > Per Capita Disposable Income of Rural Residents > Added Value of Tertiary Industry > Government Revenue > Resident Population > Total Retail Sales of Social Consumer Goods > Population Urbanization Rate > Number of Up-scale Enterprises (Table 4).
According to the synergistic relationship between the two, the factors are classified into base-period-driven, change-driven, and compound-driven types. Number of Up-scale Enterprises, Resident Population, Population Urbanization Rate, Per Capita Disposable Income of Urban Residents, Total Retail Sales of Social Consumer Goods, and Government Revenue are base period-driven factors that rely on the inertia of base-period development to drive the dynamic change of urbanization. Added Value of Secondary Industry and Resident Population is a change-driven factor, which mainly relies on its own change to drive the dynamic change of urbanization. Gross Domestic Product, Per capita GDP, and Per Capita Disposable Income of Rural Residents are compound-driven factors, whose base period volume and change amount exert equally strong forces on the dynamic change of urbanization at the same time.
The relationship between factor pairs is a mainly nonlinear enhancement, supplemented by bifactor enhancement, and there is no independent or weakening relationship. From the perspective of the base period volume in 2015, the maximum factor interaction was 0.79 ( X 1 X 8 ), and the minimum was 0.07 ( X 5 X 6 ), with an average of 0.39; there were 38 nonlinearly enhanced factor pairs, and only the interactions of X 1 X 8 and X 2 X 11 were more than 0.7. From the perspective of the change amount during 2015–2019, the maximum factor interaction was 0.67 ( X 9 X 6 ), and the minimum was 0.05 ( X 5 X 7 ), with the average of 0.34; the nonlinearly enhanced factor pairs were reduced to 50. According to the principle of “1:3:6”, the factor pairs are divided into high, mean, and low levels (Figure 9). It should be noted that Gross Domestic Product, Per capita GDP, and Total Retail Sales of Social Consumer Goods are the most important interaction factors.

3.4. Changes Analysis Night Light Extended Vitality Index Pattern Analysis

3.4.1. Spatial Pattern

The increase and decrease in the urban night light extended vitality index coexist in Guangxi, and there is a strong spatial heterogeneity and autocorrelation in the amount of change, but weaker than that of urban night lighting index. The average urban night light extended vitality index in Guangxi was 39.97 during 2015–2019, with the maximum vitality increase of 359.76 (Jiangnan District) and the minimum vitality decrease of −50.00 (Diecai District). There are 96 cities with increasing vitality with an average change of 43.11 and 15 cities with decreasing vitality with an average change of −13.36. With them used as thresholds, the 111 cities are classified into four categories: high expanding cities, expanding cities, shrinking cities, and high shrinking cities. High expanding cities are mainly concentrated in the capital city circle of Nanning, the Beibu Gulf coastal city cluster, the city cluster in central Guangxi, and the city cluster in northern Guangxi; the cities along the Hunan and Guangxi railway, and those scattered in the coastal areas of Beibu Gulf are connected together. Shrinking cities are mainly clustered in northern Guangxi, most of them poor and mountainous counties. The standard deviation and coefficient of variation of urban night light extended vitality index during 2015–2019 were 59.69 and 4.19, respectively, reflecting the unbalanced changes in the quality of urbanization development. The global Moran’s I for the change amount of urban night light extended vitality index in Guangxi is 0.17 (confidence level of 0.004), indicating that the urbanization development in Guangxi has a positive spatial autocorrelation. At the significance level of 0.1, H-H cities are concentrated in the capital city circle of Nanning, the city cluster in central Guangxi, and the city cluster in northern Guangxi; L-L cities are concentrated in Guizhou-Guangxi urban belt; L-H cities are concentrated in the periphery of H-H cities; there are a small number of H-L cities, only Youjiang District, Tieshangang District and Tiandong County (Figure 10).

3.4.2. Influence Factors

From the perspective of base period volume, all factors can pass the significance test of 0.05 or a more stringent level; from the perspective of change amount, Population Urbanization Rate fails the significance test. With the average of the factor detection results q of the base period volume and the change amount used as the direct driving force intensity of factors, at 5% or a more stringent level of significance, the factor forces are ranked as Added Value of Secondary Industry > Gross Domestic Product > Per capita GDP > Per Capita Disposable Income of Rural Residents >Added Value of Tertiary Industry > Government Revenue > Per Capita Disposable Income of Urban Residents > Total Retail Sales of Social Consumer Goods > Number of Up-scale Enterprises > Population Urbanization Rate >Resident Population (Table 4). Population Urbanization Rate, Per Capita Disposable Income of Urban Residents, and Total Retail Sales of Social Consumer Goods are base period-driven factors; Added Value of Secondary Industry and Resident Population is a change-driven factor, and the rest are compound-driven factors.
The relationship between factor pairs is a mainly nonlinear enhancement, supplemented by bifactor enhancement, and there is no independent or weakening relationship. From the perspective of the base period volume in 2015, the maximum factor interaction was 0.74 ( X 1 X 8 ), and the minimum was 0.21 ( X 5 X 6 ), with an average of 0.48; there were 47 nonlinearly enhanced factor pairs, and only the interactions of X 1 X 8 and X 9 X 11 were more than 0.7. From the perspective of the amount of change during 2015–2019, the maximum factor interaction was 0.71 ( X 2 X 4 ), and the minimum was 0.10 ( X 6 X 7 ), with an average of 0.42; the nonlinearly enhanced factor pairs were reduced to 49, and only the interaction of X 2 X 4 was more than 0.7. According to the principle of “1:3:6”, the factor pairs are divided into high, mean, and low levels (Figure 9). It should be noted that Added Value of Secondary Industry, Per Capita Disposable Income of Rural Residents, and Government Revenue are the most important interaction factors.

4. Discussion

4.1. Driving Mechanism

At 5% or a more stringent level of significance, the factor forces (q) of Y 1 and Y 2 , Y 3 and Y 4 are evaluated to represent the driving force intensity of each factor on the spatial pattern and dynamic change of urbanization in Guangxi, respectively. The average value of the former is 0.35, while that of the latter is 0.14. According to the ranking and average of factor forces, and considering the strength of factor interaction effects, the driving factors are classified into “key factors”, “important factors”, and “auxiliary factors” (Figure 11). “Key factors” are dominated by direct action, and the strength of factor force ranks the first three. “Important factors” are the direct and factor interaction forces that act simultaneously and must be greater than the average. “Auxiliary factors” have direct forces and interaction forces, both weak and less than the average, and they exert influence mainly through indirect effects. The development and evolution of urbanization in Guangxi, on the whole, present a complex and intertwined dynamic mechanism. The influence and operation mechanisms of different factors are quite different, and there are interaction effects of double factor enhancement and nonlinear enhancement between factors.
The level of economic development, especially industrialization, is a key factor affecting urbanization. Gross Domestic Product is a key factor affecting the Spatial Pattern and Dynamic Change of urbanization, as well as a super interaction factor; Per capita GDP and Added Value of Secondary Industry are key factors affecting the change of urbanization, as well as an important factor affecting the spatial pattern of urbanization, and also a super interaction factor. Added Value of Tertiary Industry is a key factor influencing the spatial pattern of urbanization, an important factor influencing the change of urbanization, and an important interaction factor. According to Chenery’s theory, Per capita GDP, Added Value of Secondary Industry, and Added Value of Tertiary Industry are the key indicators to determine the development stage of regional industrialization. According to the analysis results, most cities with high night lighting index and night light extended vitality index are industrial cities, and a few are service cities with superior transportation conditions, rich tourism resources, and developed logistics and commerce. The above view also supports the findings of scholars’ empirical studies based on non-night light data. For example, Lin [133,134,135] and Golli [136] argued that industry is the main force driving spatial differences in urbanization in China and that per capita GDP and industrial location coefficients are significantly correlated with urbanization differences. Liang [137] argued that China’s economic growth and urbanization are already in a benign interaction. Murakami [138], Adams [139], and Liddle [140] pointed out that economic structure has a significant impact on inequality in urbanization in Japan and Africa. Through the quantile regression model, Gou [141] found that industrial structure and the degree of marketization are key factors influencing the development of urbanization, with the contribution increasing with the increase of quantile.
The intensity of government investment and the vitality of social consumption are the important factors influencing the level of urbanization development. Government Revenue has become an important common factor influencing spatial patterns and dynamic change of urbanization, and it is an important interaction factor. Although the government does not play a leading role, it is indispensable in the urbanization process. Jetter [142] found that the government is a key driver of town development in both Germany and Colombia. Scholars such as Zhang [143] and You [144] argued that government actions, especially land revenues and expenditures, are key factors driving urbanization development in China in the long run. To better play to the government in creating an institutional environment, preparing development planning, building infrastructure, providing public services, and strengthening social governance, the central and local governments have jointly promulgated and implemented a series of preferential policies to encourage urbanization development in recent years, and actively promoted the adjustment of administrative divisions, reform of household registration system, and innovation of investment and financing mechanisms, which have constituted important driving forces for urbanization development. Besides, Total Retail Sales of Social Consumer Goods has become a key factor influencing the spatial pattern of urbanization, and it is an important interaction factor that should not be ignored. Urbanization is regarded by the central and local governments as a strategic starting point for expanding the domestic consumption demand and promoting consumption transformation and upgrading. The document Several Opinions on Deepening the Construction of New-Type Urbanization issued by the State Council clearly puts forward that new-type urbanization is the only way for China’s modernization and the greatest potential of domestic demand. It requires all regional and city governments to carry out tests, summarize, promote, and apply their experience in success to release the huge potential of domestic demand in urbanization fully.
It should be noted that Per Capita Disposable Income of Urban Residents and Per Capita Disposable Income of Rural Residents are more influential than Resident Population and Population Urbanization Rate. The urbanization development plans and policies promulgated by the central and local governments in recent years have prioritized “transforming the rural population into townspeople” and proposed the development goal of addressing “three 100 million populations” (promoting about 100 million agricultural population to settle in cities and towns, renovating urban shantytowns and urban villages where about 100 million population live, and guiding about 100 million population to be townspeople in central and western regions). In fact, with the gradual completion of the reform of the household registration system and the implementation of preferential policies in rural areas, the agricultural population, especially “migrant workers”, are not willing to settle down in cities. The core that affects the transition from semi-urbanized to urbanized populations lies in improving income level and life quality [145]. Therefore, the government should accelerate the planning revision and policy updates, put the improvement of residents’ income and quality of life as central to the new round of policy design, and place the focus on creating jobs and building livable cities while enhancing the urban tension in urban–rural population mobility. The influence of residents’ income on urbanization has also been observed in other countries and regions. For example, Sulemana [146] pointed out that residents’ income is in a nonlinear relationship with urbanization, and Wang [147] argued that residents’ income had become the core factor controlling the quality of urbanization development in the Beijing–Tianjin–Hebei city cluster in the new period. The effect of population on urbanization is not consistent with the empirical findings in the Pan-Third Pole region, Turkey, and other areas. Luan [148] and Yucer [149] found that population is still an important factor influencing the development of urbanization in these regions. It indicates that the population factor plays a very complex role in urbanization [150], which may be periodic or phased to a certain extent, and future empirical studies based on data with a longer time series are still needed.

4.2. Policy Suggestion

The analysis of night light data shows that the development space of urbanization in Guangxi is seriously imbalanced, the pattern of the town system is solidified, the spatial heterogeneity has the α convergence, and the spatial autocorrelation is increasing. The serious inequality between cities seriously threatens sustainable development and has become a major problem faced by spatial planning and urban governance [151,152]. Therefore, it is necessary to design differentiated policies and prevent a “one-size-fits-all” approach to promote urbanization development. To identify the problem space of urbanization development using the BCG model, the 111 cities in Guangxi are classified into four categories of stars, cows, questions, and dogs, and suggestions for differentiated policy design are made [153]. From the perspective of the urban night lighting index, the average growth during the period of 2015–2019 was 9.82% and the relative share of each city in 2019 was 13.68%. Accordingly, there were 13 star cities, 15 cow cities, 35 question cities, and 48 dog cities. From the perspective of the night light extended vitality index, the average growth during the period of 2015–2019 was 7.97%, and the relative share of each city in 2019 was 19.84%. Accordingly, there were 18 star cities, 17 cow cities, 34 question cities, and 42 dog cities. In general, the two are basically the same except for some cities, such as Tiandong County, Changzhou District, Fangcheng District, Guiping City, and Fusui County (Figure 12).
Star cities include Jiangnan District, Liangqing District, Yongning District, Binyang County, Chengzhong District, Luzhai County, and Beiliu City, which are in their best state with a high level of urbanization and growth, reflecting that the current policies and development plans are reasonable. As the growth poles of regional development, they focus on government investment and the core cities in development planning. For these cities, at the very least, the current policy should be maintained, and it is advisable to adopt an aggressive expansion strategy with the long-term goal of increasing all investments involved in urbanization development in a balanced manner to further strengthen their position and competitiveness in the region.
Cow cities include Xingning District, Qingxiu District, Xixiangtang District, Wuming District, Yufeng District, Liunan District, Yinhai District, Qinnan District, Fumian District, Youjiang District, and Pingguo City. They are characterized by a high level of urbanization but a slow growth rate, indicating that urban development is in a mature stage. For cities in less developed regions, government investment should be reduced due to their limited development resources and capital. For cities in developed regions, targeted strategies should be designed around the factors such as Added Value of Secondary Industry, Added Value of Tertiary Industry, Per Capital Disposable Income of Rural Residents, Per Capital Disposable Income of Urban Residents, and more investment should be made in emerging industries, high-end services, and advanced manufacturing, to promote urban renewal, raise the development speed and push cities into a new development period.
Question cities include Longan County, Mashan County, Rongshui County, Sanjiang County, Yangshuo County, Lingshan County, Yongfu County, Fengshan County, Donglan County, Bama County, Fusui County, and Pingxiang City. They are characterized by fast growth but still a low level of urbanization. These cities are generally located in the peripheral areas of large cities and city clusters, mountainous regions, tourist areas, old revolutionary base areas, and ethnic autonomous zones. They have developed at a high rate in recent years under the influence of the new-type urbanization policy and the policy of poverty alleviation. However, these cities are highly constrained by the development history, basic conditions, topography, and other factors, so selective development strategies should be adopted; that is, we should analyze each city in detail and should formulate appropriate development strategies for cities around the factors such as Gross Domestic Product, Added Value of Tertiary Industry, Added Value of Secondary Industry, Government Revenue, Per capita GDP, and Total Retail Sales of Social Consumer Goods, for the problems and challenges facing development, based on the development advantages and opportunities.
Dog cities include Shanglin County, Quanzhou County, Liucheng County, Rong’an County, Xing’an County, Lipu City, Mengshan County, Shangsi County, Napo County, Longlin County, Tianlin County, Xilin County, Nandan County, Tian’e County, Tiandeng County, and Ningming County. They are characterized by a low level of urbanization and growth. These cities are mainly located at the border between China and Vietnam, the junction areas between Guangxi and Guizhou, Guangdong, Hunan, Yunnan, and the fringe areas of city clusters, which are typically problematic cities in regional development. These cities are subject to more development constraints. With limited development resources, most cities should adopt a retreat strategy, and a small number of cities with strategic positions or special value should adopt an expansion strategy. For Leye County, Tianlin County, Nandan County, Tian’e County, and Jinxiu Country located in mountainous and karst areas to better implement and serve the national poverty alleviation and ecological civilization strategies, they should practice ecological migration, promote the construction of new urban areas in other parts of the county or even off-sites, and organically integrate urbanization development with ecological protection, poverty alleviation, and other efforts. For Napo County, Dongxing City, and Ningming County located in the border areas to better serve the strategies of the national neighborhood diplomacy and the actions to enrich border areas and their residents, more investment should be made in key spaces of such cities, including port opening platforms, road traffic infrastructure, and park development carriers. By enhancing the level of connectivity in border areas and building an open and characteristic industrial system along the border, they can contribute to a belt of towns along the border. For Quanzhou County, Cenxi City, and Babu District located at the junction of the two provinces, they should take advantage of the intermediary effect of the fringe areas, give play to their geopolitical advantages, undertake the industrial transfer from Guangdong, guide industrial agglomeration and further promote the rapid development of urbanization.

5. Conclusions

Urbanization is a complex process involving many elements such as society, population, space, and economic transformation. Based on the remote sensing satellite night light data, we conducted an empirical study on the evolutionary characteristics of urbanization development in Guangxi and its driving mechanism from the perspective of the geospatial pattern by using GIS, a geographic probe, and the BCG model and reached the following conclusions. (1) There is a high level of spatial heterogeneity, correlation, and agglomeration of urbanization and its changes in Guangxi, but the convergence is at a low level. (2) The spatial pattern of urbanization and its changes in Guangxi is solidified, and a spatial structure with the central city as the point, the town belt as the axis, and the town cluster as the plane have been formed initially, while the capital city circle of Nanning, the Beibu Gulf coastal city cluster, and the town cluster in central Guangxi have taken shape, and the development of the town cluster in northern Guangxi, the town cluster in southeast Guangxi, the Youjiang River valley urban belt, and the border town belt still need time. (3) Different factors vary widely in influence, for example, Per capita GDP and Added Value of Secondary Industry, Added Value of Tertiary Industry, and Total Retail Sales of Social Consumer Goods have the most prominent force, followed by Government Revenue, and Per Capita Disposable Income of Urban and Rural Residents with noticeable forces. (4) The influence factors are becoming more diversified, and according to the sequencing and averaging of forces, influence factors are classified into “key factors”, “important factors” and “auxiliary factors”, with “key factors” mainly serving as direct driving forces, “important factors” serving as a combination of direct and interaction forces, and “auxiliary factors” depending on indirect forces. (5) The driving mechanism is becoming increasingly complicated, with a bifactor enhancement effect dominating the urbanization factor pair and a non-linear enhancement effect dominating the urbanization change factor pair. (6) Differentiated policy design suggestions are made based on dividing 111 county-level cities in Guangxi into four categories: stars, cows, question, and dogs. It is recommended that the government carry out adaptive and precise policy design and spatial governance accordingly.
Theoretically, this paper presents a new study framework and methodology for researchers in macroeconomics, human geography, land management, and spatial planning to analyze the spatial patterns of urbanization and its changes and helps to reveal the dynamic spatial change of urbanization and its governance mechanisms. Previous studies have generally analyzed spatio-temporal evolution based on geostatistical methods, tested the force strength of influencing factors with economic and statistical regression models, and put forward empirical suggestions by policy and management methods. Due to the large disparity in urbanization development between different regions and the influence of spatial heterogeneity and association effects, traditional regression models and policy design methods tend to ignore the influence of spatial factors. In addition, the problems of poor cohesion, weak correlation, and lack of standardization in the application of multidisciplinary methods lead to certain limitations in the accuracy of analysis results and the applicability of conclusions. In this paper, we introduced GIS and GeoDetector tools and BCG model to build an integrated research framework and analysis tool of “spatio-temporal pattern—driving mechanism—policy design”, which can better solve the above problems by integrating spatial effects into the analysis process of the three stages. On the one hand, GeoDetector presupposes that if an independent variable significantly influences the dependent variable, the two should be similar in spatial distribution characteristics or patterns. Geospatial distribution similarity is much more difficult than the curve parallelism of mathematical modeling, so its results have stronger potential and stronger causal prompts than general statistics. On the other hand, the BCG model enables the classification of the study area into four types of policy zones, providing differentiated policy design and implementation while also improving the pertinence, precision, and applicability of policies.
Besides, we suggest scholars interested in this issue develop and recreate the research framework constructed in this paper in the following areas in future research. First, in the analysis of the driving mechanism, they can identify the critical direct driving factors and interactive driving factors by GeoDetector and further verify them based on the geographically weighted regression model to measure the influence of critical factors more accurately. In view of the dynamic changing characteristics of spatial relationships between regions in the real world, a Bayesian spatial econometric model can be introduced, which has variable parameter characteristics and complements well with GeoDetector and geographically weighted regression models (constant parameters), thus further improving the accuracy of analysis results. Second, in the policy design, to improve the fineness of the analysis results, the policy zones can be divided into nine types by the general matrix method developed by GE. Besides, the classification standards of grades and types can be established according to the actuality of the study area to develop a grading—or classification—zoning-based differentiated management system.
Practically, it helps both urban policy developers and decision-makers to find scientific and proper countermeasures to improve the quality of urbanization development, lays the foundation for the government to design space management policies, and provides a useful reference for space planners in their planning and designing work. To improve the level of urbanization development in any country or region is the core mission of the government, and to reduce the negative impact of urbanization is also a challenge to the government. In addition, due to their position at the very bottom of the national and regional town system as well as their large number and great role, small cities are crucial hubs and key carriers for achieving integrated urban–rural development. In addition, Guangxi is one of the typical underdeveloped regions in China with a large number of small cities and is in the stage of rapid urbanization and industrialization, where urbanization is regarded by the government as a comprehensive policy tool to boost economic and social transformation and development. In the empirical study of Guangxi, the regular characteristics about the spatio-temporal evolution of small-town urbanization in less developed regions, influencing factors and driving mechanisms, policy design, and intervention measures found from the case will provide useful references and lessons for other regions in similar conditions around the world. The research methods and conclusions reached in this paper provide policy suggestions for promoting urbanization in small cities in less developed regions of China but also provide valuable references for less developed countries and regions to solve urbanization problems, such as India, Vietnam, Myanmar, Laos, and Thailand.
However, there are also some deficiencies in our research, which may affect the accuracy and applicability of some conclusions in this paper to a certain extent. For example, Guangxi has complex topographic conditions, and its geographic conditions (such as karst landforms, mountainous hills, and stony desertification) have a great impact on urbanization development, but they are not included in the index system of this paper because of the difficulty in data acquisition. Besides, many national development special policies enjoyed by Guangxi make the development planning and policy guidance (such as Beibu Gulf Economic Zone, Zuo-Youjiang revolutionary base area, Pearl River Economic Zone, Pilot Free Trade Zone, and Border Development and Opening Zone) have a great impact on the development of urbanization, but they are also not included in the index system of this paper due to the difficulty of data quantification. In applying the conclusions of this paper, it is necessary to add more data for a more comprehensive analysis.

Author Contributions

Conceptualization, L.L. and W.L.; methodology, L.L., K.Z. and W.L.; software, K.Z., X.W. and S.Z.; validation, W.L. and L.L.; formal analysis, L.L. and W.L.; investigation, W.L. and K.Z.; resources, W.L. and L.L.; data curation, W.L., X.W. and L.L.; writing—original draft preparation, L.L., W.L. and K.Z.; writing—review and editing, X.L. and S.Z.; visualization, K.Z. and X.W.; supervision, X.L. and W.L.; project administration, X.L. and L.L.; funding acquisition, L.L. and W.L. All authors have read and agreed to the published version of the manuscript.

Funding

This paper and the related research are financially supported by the Nanning Youth Science and Technology Innovation and Entrepreneurship Talent Cultivation Project (Project Number: RC20180110).

Institutional Review Board Statement

Not applicable.

Informed Consent Statement

Not applicable.

Data Availability Statement

Data Availability Statement: The data used in this paper mainly come from the Guangxi Statistical Yearbook, Guangxi Construction Yearbook, China County Construction Statistical Yearbook and China Statistical Yearbook. Most of the data can be obtained by visiting the following links: http://tjj.gxzf.gov.cn//tjsj/tjnj/material/tjnj20200415/2020/zk/indexch.htm, http://www.gxcic.net/zj/, http://www.stats.gov.cn/tjsj/ndsj/ (accessed on 20 May 2021).

Conflicts of Interest

The authors declare no conflict of interest.

References

  1. Katz, C. Splanetary Urbanization. Int. J. Urban Reg. Res 2021, 45, 597–611. [Google Scholar] [CrossRef]
  2. Ruddick, S.; Peake, L.; Tanyildiz, G.S.; Patrick, D. Planetary urbanization: An urban theory for our time? Environ. Plan. D-Soc. Space 2018, 36, 387–404. [Google Scholar] [CrossRef]
  3. Mignamissi, D.; Djeufack, A. Urbanization and CO2 emissions intensity in Africa. J. Environ. Plan. Manag. 2021. [Google Scholar] [CrossRef]
  4. Solarin, S.A.; Lean, H.H. Natural gas consumption, income, urbanization, and CO2 emissions in China and India. Environ. Sci. Pollut. Res 2016, 23, 18753–18765. [Google Scholar] [CrossRef] [PubMed]
  5. Liu, X.L.; Wang, Y.; Li, Y.; Wu, J.S. Quantifying the Spatio-Temporal Process of Township Urbanization: A Large-Scale Data-Driven Approach. Int. J. Geo-Inf. 2019, 8, 389. [Google Scholar] [CrossRef] [Green Version]
  6. Wu, J.G.; Jenerette, G.D.; Buyantuyev, A.; Redman, C.L. Quantifying spatiotemporal patterns of urbanization: The case of the two fastest growing metropolitan regions in the United States. Ecol. Complex. 2011, 8, 1–8. [Google Scholar] [CrossRef]
  7. Liu, M.M.; Huang, Y.N.; Jin, Z.; Ma, Z.W.; Liu, X.Y.; Zhang, B.; Liu, Y.; Yu, Y.; Wang, J.N.; Bi, J. The nexus between urbanization and PM2.5 related mortality in China. Environ. Pollut. 2017, 227, 15–23. [Google Scholar] [CrossRef]
  8. Cao, S.X.; Lv, Y.; Zheng, H.R.; Wang, X. Challenges facing China’s unbalanced urbanization strategy. Land Use Policy 2014, 39, 412–415. [Google Scholar] [CrossRef]
  9. Pu, B.; Qiu, Y.J. A Bibliometric Analysis on Urbanization Research From 1984 to 2013. Open House Int. 2015, 40, 37–43. [Google Scholar] [CrossRef]
  10. Wang, H.J.; He, Q.Q.; Liu, X.J.; Zhuang, Y.H.; Hong, S. Global Urbanization Research From 1991 to 2009: A Systematic Research Review. Landsc. Urban Plan. 2012, 104, 299–309. [Google Scholar] [CrossRef]
  11. Zhang, Q.R.; Li, Y.; Liu, J.S.; Chen, Y.D.; Chai, L.H. A dynamic co-word network-related approach on the evolution of China’s urbanization research. Scientometrics 2017, 111, 1623–1642. [Google Scholar] [CrossRef]
  12. Zhang, D.; Xu, J.P.; Zhang, Y.Z.; Wang, J.; He, S.Y.; Zhou, X. Study on sustainable urbanization literature based on Web of Science, scopus, and China national knowledge infrastructure: A scientometric analysis in CiteSpace. J. Clean. Prod. 2020, 264, 121537. [Google Scholar] [CrossRef]
  13. Balk, D.; Leyk, S.; Montgomery, M.R.; Engin, H. Global Harmonization of Urbanization Measures: Proceed with Care. Remote Sens. 2021, 13, 4973. [Google Scholar] [CrossRef]
  14. Qin, B.; Zhang, Y. Note on urbanization in China: Urban definitions and census data. China Econ. Rev. 2014, 30, 495–502. [Google Scholar] [CrossRef]
  15. Liu, X.; Cao, G.Z.; Liu, T.; Liu, H.C. Semi-urbanization and evolving patterns of urbanization in China: Insights from the 2000 to 2010 national censuses. J. Geogr. Sci. 2016, 26, 1626–1642. [Google Scholar] [CrossRef]
  16. Liu, T.; Qi, Y.J.; Cao, G.Z.; Liu, H. Spatial patterns, driving forces, and urbanization effects of China’s internal migration: County-level analysis based on the 2000 and 2010 censuses. J. Geogr. Sci. 2015, 25, 236–256. [Google Scholar] [CrossRef]
  17. Chan, K.W. Fundamentals of China’s Urbanization and Policy. China Rev.-Interdiscip. J. Gt. China 2010, 10, 63–93. [Google Scholar]
  18. Onda, K.; Sinha, P.; Gaughan, A.E.; Stevens, F.R.; Kaza, N. Missing millions: Undercounting urbanization in India. Popul. Environ. 2019, 41, 126–150. [Google Scholar] [CrossRef] [Green Version]
  19. Megeri, M.N.; Kadi, A.S.; Kengnal, P. Measures of Urbanization in India: A Statistical Analysis. Int. J. Agric. Stat. Sci. 2012, 8, 585–596. [Google Scholar]
  20. Ma, H.T.; Sun, Z. Comprehensive urbanization level and its dynamic factors for five Central Asian countries. J. Geogr. Sci. 2020, 30, 1761–1780. [Google Scholar] [CrossRef]
  21. Castells-Quintana, D.; Wenban-Smith, H. Population Dynamics, Urbanisation without Growth, and the Rise of Megacities. J. Dev. Stud. 2020, 56, 1663–1682. [Google Scholar] [CrossRef]
  22. Iheonu, C.O.; Anyanwu, O.C.; Odo, O.K.; Nathaniel, S.P. Does economic growth, international trade, and urbanization uphold environmental sustainability in sub-Saharan Africa? Insights from quantile and causality procedures. Environ. Sci. Pollut. Res. 2021, 28, 28222–28233. [Google Scholar] [CrossRef] [PubMed]
  23. Ehrlich, D.; Melchiorri, M.; Capitani, C. Population Trends and Urbanisation in Mountain Ranges of the World. Land 2021, 10, 255. [Google Scholar] [CrossRef]
  24. Asabere, S.B.; Acheampong, R.A.; Ashiagbor, G.; Beckers, S.C.; Keck, M.; Erasmi, S.; Schanze, J.; Sauer, D. Urbanization, land use transformation and spatio-environmental impacts: Analyses of trends and implications in major metropolitan regions of Ghana. Land Use Policy 2020, 96, 104707. [Google Scholar] [CrossRef]
  25. Bilozor, A.; Cieslak, I. Review of Experience in Recent Studies on the Dynamics of Land Urbanisation. Land 2021, 10, 1117. [Google Scholar] [CrossRef]
  26. Egidi, G.; Cividino, S.; Vinci, S.; Sateriano, A.; Salvia, R. Towards Local Forms of Sprawl: A Brief Reflection on Mediterranean Urbanization. Sustainability 2020, 12, 582. [Google Scholar] [CrossRef] [Green Version]
  27. Egidi, G.; Salvati, L.; Falcone, A.; Quaranta, G.; Salvia, R.; Vcelakova, R.; Gimenez-Morera, A. Re-Framing the Latent Nexus between Land-Use Change, Urbanization and Demographic Transitions in Advanced Economies. Sustainability 2021, 13, 533. [Google Scholar] [CrossRef]
  28. Ahani, S.; Dadashpoor, H. Urban growth containment policies for the guidance and control of peri-urbanization: A review and proposed framework. Environ. Dev. Sustain. 2021, 23, 14215–14244. [Google Scholar] [CrossRef]
  29. Vogler, J.B.; Vukomanovic, J. Trends in United States Human Footprint Revealed by New Spatial Metrics of Urbanization and Per Capita Land Change. Sustainability 2021, 13, 12852. [Google Scholar] [CrossRef]
  30. Seifollahi-Aghmiuni, S.; Kalantari, Z.; Egidi, G.; Gaburova, L.; Salvati, L. Urbanisation-driven land degradation and socioeconomic challenges in peri-urban areas: Insights from Southern Europe. AMBIO 2022, 1–13. [Google Scholar] [CrossRef]
  31. Lopez-Casado, D. An urban phenomenon embedded in the paradigm shift of informal urbanisation: Illegal allotments in the municipality of Cordoba. Bol. Asoc. Geogr. Esp. 2021, 90. [Google Scholar] [CrossRef]
  32. Adams, J.J. Urbanization, long-run growth, and the demographic transition. J. Demogr. Econ. 2021, 88, 31–77. [Google Scholar] [CrossRef]
  33. Di Clemente, R.; Strano, E.; Batty, M. Urbanization and economic complexity. Sci. Rep. 2021, 11, 3952. [Google Scholar] [CrossRef] [PubMed]
  34. Gross, J.; Yu, O.Y. Types of urbanization and economic growth. Int. J. Urban Sci. 2020, 25, 71–85. [Google Scholar] [CrossRef]
  35. Sharp, D. Haphazard urbanisation: Urban informality, politics and power in Egypt. Urban Stud. 2021, 59, 00420980211040927. [Google Scholar] [CrossRef]
  36. Minuchin, L. Prefigurative urbanization: Politics through infrastructural repertoires in Guayaquil. Political Geogr. 2021, 85, 102316. [Google Scholar] [CrossRef]
  37. Streule, M.; Karaman, O.; Sawyer, L.; Schmid, C. Popular Urbanization: Conceptualizing Urbanization Processes Beyond Informality. Int. J. Urban Reg. Res. 2020, 44, 652–672. [Google Scholar] [CrossRef]
  38. Izakovicova, Z.; Petrovic, F.; Pauditsova, E. The Impacts of Urbanisation on Landscape and Environment: The Case of Slovakia. Sustainability 2022, 14, 60. [Google Scholar] [CrossRef]
  39. Alphan, H. Multi-temporal analysis of urbanisation patterns as coastal development indicators: Eastern Mediterranean coast of Turkey. Ecol. Indic. 2021, 121, 106994. [Google Scholar] [CrossRef]
  40. Bosch, M.; Jaligot, R.; Chenal, J. Spatiotemporal patterns of urbanization in three Swiss urban agglomerations: Insights from landscape metrics, growth modes and fractal analysis. Landsc. Ecol. 2020, 35, 879–891. [Google Scholar] [CrossRef]
  41. Azam, M.; Rehman, Z.U.; Ibrahim, Y. Causal nexus in industrialization, urbanization, trade openness, and carbon emissions: Empirical evidence from OPEC economies. Environ. Dev. Sustain. 2022, 1–21. [Google Scholar] [CrossRef]
  42. Rahman, M.M.; Alam, K. Clean energy, population density, urbanization and environmental pollution nexus: Evidence from Bangladesh. Renew. Energy 2021, 172, 1063–1072. [Google Scholar] [CrossRef]
  43. Zhong, L.N.; Li, X.N.; Law, R.; Sun, S. Developing Sustainable Urbanization Index: Case of China. Sustainability 2020, 11, 4585. [Google Scholar] [CrossRef]
  44. Fan, P.L.; Ouyang, Z.T.; Nguyen, D.D.; Nguyen, T.T.H.; Park, H.; Chen, J.Q. Urbanization, economic development, environmental and social changes in transitional economies: Vietnam after Doimoi. Landsc. Urban Plan. 2019, 187, 145–155. [Google Scholar] [CrossRef]
  45. Zeng, C.; Deng, X.Z.; Dong, J.N.; Hu, P.Y. Urbanization and Sustainability: Comparison of the Processes in “BIC” Countries. Sustainability 2016, 8, 400. [Google Scholar] [CrossRef] [Green Version]
  46. Mulligan, G.F. Revisiting the urbanization curve. Cities 2013, 32, 113–122. [Google Scholar] [CrossRef]
  47. Shen, L.Y.; Zhou, J.Y. Examining the effectiveness of indicators for guiding sustainable urbanization in China. Habitat Int. 2014, 44, 111–120. [Google Scholar] [CrossRef]
  48. Andersen, H.T.; Moller-Jensen, L.; Engelstoft, S. The End of Urbanization? Towards a New Urban Concept or Rethinking Urbanization. Eur. Plan. Stud. 2011, 19, 595–611. [Google Scholar] [CrossRef]
  49. Li, W.; Zhang, P.; Zhao, K.; Zhao, S. The Geographical Distribution and Influencing Factors of COVID-19 in China. Trop. Med. Infect. Dis. 2022, 7, 45. [Google Scholar] [CrossRef]
  50. Ma, T.; Zhou, Y.K.; Zhou, C.H.; Haynie, S.; Pei, T.; Xu, T. Night-time light derived estimation of spatio-temporal characteristics of urbanization dynamics using DMSP/OLS satellite data. Remote Sens. Environ. 2015, 158, 453–464. [Google Scholar] [CrossRef]
  51. Zhang, Q.; Seto, K.C. Can Night-Time Light Data Identify Typologies of Urbanization? A Global Assessment of Successes and Failures. Remote Sens. 2013, 5, 3476–3494. [Google Scholar] [CrossRef] [Green Version]
  52. Hu, X.F.; Qian, Y.G.; Pickett, S.T.A.; Zhou, W.Q. Urban mapping needs up-to-date approaches to provide diverse perspectives of current urbanization: A novel attempt to map urban areas with nighttime light data. Landsc. Urban Plan. 2020, 195, 103709. [Google Scholar] [CrossRef]
  53. Yu, B.L.; Deng, S.Q.; Liu, G.; Yang, C.S.; Chen, Z.Q.; Hill, C.J.; Wu, J.P. Nighttime Light Images Reveal Spatial-Temporal Dynamics of Global Anthropogenic Resources Accumulation above Ground. Environ. Sci. Technol. 2018, 52, 11520–11527. [Google Scholar] [CrossRef] [Green Version]
  54. Fu, H.Y.; Shao, Z.F.; Fu, P.; Cheng, Q.M. The Dynamic Analysis between Urban Nighttime Economy and Urbanization Using the DMSP/OLS Nighttime Light Data in China from 1992 to 2012. Remote Sens. 2017, 9, 416. [Google Scholar] [CrossRef] [Green Version]
  55. He, X.; Zhang, Z.M.; Yang, Z.J. Extraction of urban built-up area based on the fusion of night-time light data and point of interest data. R. Soc. Open Sci. 2021, 8, 210838. [Google Scholar] [CrossRef]
  56. Yang, Z.W.; Chen, Y.B.A.; Guo, G.H.; Zheng, Z.H.; Wu, Z.F. Using nighttime light data to identify the structure of polycentric cities and evaluate urban centers. Sci. Total Environ. 2021, 780, 146586. [Google Scholar] [CrossRef]
  57. Ma, M.G.; Lang, Q.; Yang, H.; Shi, K.F.; Ge, W. Identification of Polycentric Cities in China Based on NPP-VIIRS Nighttime Light Data. Remote Sens. 2020, 12, 3248. [Google Scholar] [CrossRef]
  58. Tang, Y.; Shao, Z.F.; Huang, X.; Cai, B.W. Mapping Impervious Surface Areas Using Time-Series Nighttime Light and MODIS Imagery. Remote Sens. 2021, 13, 1900. [Google Scholar] [CrossRef]
  59. Bergantino, A.S.; mDi Liddo, G.; Porcelli, F. Regression-based measure of urban sprawl for Italian municipalities using DMSP-OLS night-time light images and economic data. Appl. Econ. 2020, 52, 4213–4222. [Google Scholar] [CrossRef]
  60. Duque, J.C.; Lozano-Gracia, N.; Patino, J.E.; Restrepo, P.; Velasquez, W.A. Spatiotemporal dynamics of urban growth in Latin American cities: An analysis using nighttime light imagery. Landsc. Urban Plan. 2019, 191, 103640. [Google Scholar] [CrossRef]
  61. Zheng, Q.M.; Weng, Q.H.; Wang, K. Characterizing urban land changes of 30 global megacities using nighttime light time series stacks. J. Photogramm. Remote Sens. 2021, 173, 10–23. [Google Scholar] [CrossRef]
  62. Keola, S.; Andersson, M.; Hall, O. Monitoring Economic Development from Space: Using Nighttime Light and Land Cover Data to Measure Economic Growth. World Dev. 2015, 66, 322–334. [Google Scholar] [CrossRef]
  63. Qu, C.; Zhang, L.; Wang, M.; Wang, M. GDP Estimation Model of County Areas Based on NPP /VIIRS Satellite Nighttime Light Data. Remote Sens. Land Resour. 2020, 32, 81–87. [Google Scholar] [CrossRef]
  64. Chen, T.H.K.; Prishchepov, A.V.; Fensholt, R.; Sabel, C.E. Detecting and monitoring long-term landslides in urbanized areas with nighttime light data and multi-seasonal Landsat imagery across Taiwan from 1998 to 2017. Remote Sens. Environ. 2019, 225, 317–327. [Google Scholar] [CrossRef]
  65. Gaston, K.J.; Bennie, J.; Davies, T.W.; Hopkins, J. The ecological impacts of nighttime light pollution: A mechanistic appraisal. Biol. Rev. 2013, 88, 912–927. [Google Scholar] [CrossRef] [PubMed]
  66. Huang, Q.X.; Yang, X.; Gao, B.; Yang, Y.; Zhao, Y.Y. Application of DMSP/OLS Nighttime Light Images: A Meta-Analysis and a Systematic Literature Review. Remote Sens. 2014, 6, 6844–6866. [Google Scholar] [CrossRef] [Green Version]
  67. Jiang, S.; Wei, G.; Zhang, Z.; Wang, Y.; Xu, M.; Wang, Q.; Das, P.; Liu, B. Detecting the Dynamics of Urban Growth in Africa Using DMSP/OLS Nighttime Light Data. Land 2021, 10, 13. [Google Scholar] [CrossRef]
  68. Dijkstra, L.; Florczyk, A.J.; Freire, S.; Kemper, T.; Melchiorri, M.; Pesaresi, M.; Schiavina, M. Applying the Degree of Urbanisation to the globe: A new harmonised definition reveals a different picture of global urbanization. J. Urban Econ. 2021, 125, 103312. [Google Scholar] [CrossRef]
  69. Carlucci, M.; Ferrara, C.; Rontos, K.; Zambon, I.; Salvati, L. The long breadth of cities: Revisiting worldwide urbanization patterns, 1950–2030. Appl. Econ. 2020, 52, 4162–4174. [Google Scholar] [CrossRef]
  70. Tian, Y.Y.; Tsendbazar, N.E.; van Leeuwen, E.; Fensholt, R.; Herold, M. A global analysis of multifaceted urbanization patterns using Earth Observation data from 1975 to 2015. Landsc. Urban Plan 2022, 219, 104316. [Google Scholar] [CrossRef]
  71. Williams, J.; Robinson, C.; Bouzarovski, S. China’s Belt and Road Initiative and the emerging geographies of global urbanization. Geogr. J. 2020, 186, 128–140. [Google Scholar] [CrossRef]
  72. Bunnell, T. BRI and beyond: Comparative possibilities of extended Chinese urbanization. Asia Pac. Viewp. 2021, 62, 270–273. [Google Scholar] [CrossRef]
  73. Apostolopoulou, E. A novel geographical research agenda on Silk Road urbanization. Geogr. J. 2021, 187, 386–393. [Google Scholar] [CrossRef]
  74. Taubenbock, H.; Esch, T.; Felbier, A.; Wiesner, M.; Roth, A.; Dech, S. Monitoring urbanization in mega cities from space. Remote Sens. Environ. 2012, 11, 162–176. [Google Scholar] [CrossRef]
  75. Georg, I.; Blaschke, T.; Taubenbock, H. A Global Inventory of Urban Corridors Based on Perceptions and Night-Time Light Imagery. Int. J. Geo-Inf. 2016, 5, 233. [Google Scholar] [CrossRef] [Green Version]
  76. Yu, S.S.; Zhang, Z.X.; Liu, F.; Wang, X.; Hu, S.G. Assessing Interannual Urbanization of China’s Six Megacities Since 2000. Remote Sens. 2019, 11, 2138. [Google Scholar] [CrossRef] [Green Version]
  77. Zhang, X.R.; Song, W.; Wang, J.T.; Wen, B.; Yang, D.Z.; Jiang, S.L.; Wu, Y.B. Analysis on Decoupling between Urbanization Level and Urbanization Quality in China. Sustainability 2020, 12, 6835. [Google Scholar] [CrossRef]
  78. Tumwesigye, S.; Vanmaercke, M.; Hemerijckx, L.M.; Opio, A.; Poesen, J.; Twongyirwe, R.; Van Rompaey, A. Spatial patterns of urbanisation in Sub-Saharan Africa: A case study of Uganda. Dev. S. Afr. 2021, 2021, 1–21. [Google Scholar] [CrossRef]
  79. Chakraborty, S.; Maity, I.; Patel, P.P.; Dadashpoor, H.; Pramanik, S.; Follmann, A.; Novotny, J.; Roy, U. Spatio-temporal patterns of urbanization in the Kolkata Urban Agglomeration: A dynamic spatial territory-based approach. Sustain. Cities Soc. 2021, 67, 102715. [Google Scholar] [CrossRef]
  80. Gangopadhyay, P.; Jain, S.; Suwandaru, A. What Drives Urbanisation in Modern Cambodia? Some Counter-Intuitive Findings. Sustainability 2021, 12, 10253. [Google Scholar] [CrossRef]
  81. Hamnett, C. Is Chinese urbanisation unique? Urban Stud. 2020, 57, 690–700. [Google Scholar] [CrossRef]
  82. Mejia, V. Urban morphology and urbanization process in Ecuador through the night satellite image of the Earth, 1992–2012. Eure-Rev. Latinoam. De Estud. Urbano Reg. 2020, 46, 191–214. [Google Scholar]
  83. Oriol, N.L.; Joan, L.R.; Jordi, M.O. La luz de la ciudad: El proceso de urbanización en España a través de las imágenes nocturnas de la Tierra (1992–2012). In Crisis, Globalización y Desequilibrios Sociales y Territoriales en España [Recurso Electrónico]: Aportación Española al 33.er Congreso de Pekín; Centro Nacional de Información Geográfica: Huesca, Spain, 2016; pp. 246–260. [Google Scholar]
  84. Lo, O.N.; Lopez, J.; Martin, J.; Checa, J. Energy and urban form. The growth of European cities on the basis of night-time brightness. Land Use Policy 2016, 61, 103–112. [Google Scholar] [CrossRef]
  85. Checa, J.; Nello, O. Urban Intensities. The Urbanization of the Iberian Mediterranean Coast in the Light of Nighttime Satellite Images of the Earth. Urban Sci. 2018, 2, 115. [Google Scholar] [CrossRef] [Green Version]
  86. Essien, E. Impacts of Governance toward Sustainable Urbanization in a Midsized City: A Case Study of Uyo, Nigeria. Land 2022, 11, 370. [Google Scholar] [CrossRef]
  87. Hegazy, I.R. Towards sustainable urbanization of coastal cities: The case of Al-Arish City, Egypt. Ain Shams Eng. J. 2021, 12, 2275–2284. [Google Scholar] [CrossRef]
  88. Gu, C.L.; Guan, W.H.; Liu, H.L. Chinese urbanization 2050: SD modeling and process simulation. Sci. China-Earth Sci. 2017, 60, 1067–1082. [Google Scholar] [CrossRef]
  89. Wang, J.T.; Liu, H.B.; Liu, H.; Huang, H. Spatiotemporal Evolution of Multiscale Urbanization Level in the Beijing-Tianjin-Hebei Region Using the Integration of DMSP/OLS and NPP/VIIRS Night Light Datasets. Sustainability 2021, 13, 2000. [Google Scholar] [CrossRef]
  90. Zhang, W.S.; Jiang, L.; Cui, Y.Z.; Xu, Y.; Wang, C.; Yu, J.; Streets, D.G.; Lin, B.Q. Effects of urbanization on airport CO2 emissions: A geographically weighted approach using nighttime light data in China. Resour. Conserv. Recycl. 2019, 150, 104454. [Google Scholar] [CrossRef]
  91. Rabehi, W.; Guerfi, M.; Mahi, H.; Rojas-Garcia, E. Spatiotemporal Monitoring of Coastal Urbanization Dynamics: Case Study of Algiers’ Bay, Algeria. J. Indian Soc. Remote Sens. 2019, 47, 1917–1936. [Google Scholar] [CrossRef]
  92. Addai, K.; Serener, B.; Kirikkaleli, D. Empirical analysis of the relationship among urbanization, economic growth and ecological footprint: Evidence from Eastern Europe. Environ. Sci. Pollut. Res. 2022, 1–12. [Google Scholar] [CrossRef] [PubMed]
  93. Bosah, C.P.; Li, S.X.; Ampofo, G.K.M.; Liu, K.L. Dynamic nexus between energy consumption, economic growth, and urbanization with carbon emission: Evidence from panel PMG-ARDL estimation. Environ. Sci. Pollut. Res. 2021, 28, 61201–61212. [Google Scholar] [CrossRef] [PubMed]
  94. Pilehvar, A.A. Spatial-geographical analysis of urbanization in Iran. Humanit. Soc. Sci. Commun. 2021, 8, 63. [Google Scholar] [CrossRef]
  95. Polinesi, G.; Recchioni, M.C.; Turco, R.; Salvati, L.; Rontos, K.; Rodrigo-Comino, J.; Benassi, F. Population Trends and Urbanization: Simulating Density Effects Using a Local Regression Approach. Int. J. Geo-Inf. 2020, 9, 454. [Google Scholar] [CrossRef]
  96. Gomez, J.A.; Guan, C.H.; Tripathy, P.; Duque, J.C.; Passos, S.; Keith, M.; Liu, J.L. Analyzing the Spatiotemporal Uncertainty in Urbanization Predictions. Remote Sens. 2021, 13, 512. [Google Scholar] [CrossRef]
  97. Sumari, N.S.; Cobbinah, P.B.; Ujoh, F.; Xu, G. On the absurdity of rapid urbanization: Spatio-temporal analysis of land-use changes in Morogoro, Tanzania. Cities 2020, 107, 102876. [Google Scholar] [CrossRef]
  98. Hackman, K.O.; Li, X.C.; Asenso-Gyambibi, D.; Asamoah, E.A.; Nelson, I.D. Analysis of geo-spatiotemporal data using machine learning algorithms and reliability enhancement for urbanization decision support. Int. J. Digit. Earth 2020, 13, 1717–1732. [Google Scholar] [CrossRef]
  99. Swapan, P. Change detection and future change prediction in Habra I and II block using remote sensing and GIS–A case study. Int. J. Eng. Geosci. 2022, 7, 191–207. [Google Scholar] [CrossRef]
  100. Sevgen, S.C. Airborne Lidar Data Classification in Complex Urban Area Using Random Forest: A Case Study of Bergama, Turkey. Int. J. Eng. Geosci. 2019, 4, 45–51. [Google Scholar] [CrossRef]
  101. Yakup, A.E.; Ayazlı, I.E. Investigating changes in land cover in high-density settlement areas by protected scenario. Int. J. Eng. Geosci. 2022, 7, 1–8. [Google Scholar] [CrossRef]
  102. Li, X.P.; Yang, X.D.; Gong, L. Evaluating the influencing factors of urbanization in the Xinjiang Uygur Autonomous Region over the past 27 years based on VIIRS-DNB and DMSP/OLS nightlight imageries. PLoS ONE 2020, 15, e0235903. [Google Scholar] [CrossRef] [PubMed]
  103. Guan, X.Y.; Wang, S.L.; Gao, Z.Y.; Lv, Y.; Fu, X.J. Spatio-temporal variability of soil salinity and its relationship with the depth to groundwater in salinization irrigation district. Acta Ecol. Sin. 2012, 32, 198–206. [Google Scholar]
  104. Miyamoto, S.; Chacon, A. Hossain, M. Martinez, L. Soil salinity of urban turf areas irrigated with saline water I. Spatial variability. Landsc. Urban Plan. 2005, 71, 233–241. [Google Scholar]
  105. She, D.L.; Shao, M.A.; Yu, S.G. Spatial Variability of Soil Water Content on a Cropland-grassland Mixed Slope Land in the Loess Plateau, China. Trans. Chin. Soc. Agric. Mach. 2010, 41, 57–63. [Google Scholar]
  106. Zhang, P.; Li, W.; Zhao, K.; Zhao, S. Spatial Pattern and Driving Mechanism of Urban–Rural Income Gap in Gansu Province of China. Land 2021, 10, 1002. [Google Scholar] [CrossRef]
  107. Li, S.M. Housing inequalities under market deepening: The case of Guangzhou, China. Environ. Plan. A 2012, 44, 2852–2866. [Google Scholar] [CrossRef]
  108. Wang, J.F.; Li, X.H.; Christakos, G.; Liao, Y.L.; Zhang, T.; Gu, X.; Zheng, X.Y. Geographical detectors-based health risk assessment and its application in the neural tube defects study of the Heshun region, China. Int. J. Geogr. Inf. Sci. 2010, 24, 107–127. [Google Scholar] [CrossRef]
  109. Zhao, S.; Li, W.; Zhao, K.; Zhang, P. Change Characteristics and Multilevel Influencing Factors of Real Estate Inventory—Case Studies from 35 Key Cities in China. Land 2021, 10, 928. [Google Scholar] [CrossRef]
  110. Zhao, S.; Zhang, C.; Qi, J. The Key Factors Driving the Development of New Towns by Mother Cities and Regions: Evidence from China. Int. J. Geo-Inf. 2021, 10, 223. [Google Scholar] [CrossRef]
  111. Zhao, S.; Yan, Y.; Han, J. Industrial Land Change in Chinese Silk Road Cities and Its Influence on Environments. Land 2021, 10, 806. [Google Scholar] [CrossRef]
  112. Wang, J.F.; Hu, Y. Environmental health risk detection with GeoDetector. Environ. Model. Softw. 2012, 33, 114–115. [Google Scholar] [CrossRef]
  113. Zhao, S.; Zhao, K.; Yan, Y.; Zhu, K.; Guan, C. Spatio-Temporal Evolution Characteristics and Influencing Factors of Urban Service-Industry Land in China. Land 2022, 11, 13. [Google Scholar] [CrossRef]
  114. Zhang, Q.L.; Seto, K.C. Mapping urbanization dynamics at regional and global scales using multi-temporal DMSP/OLS nighttime light data. Remote Sens. Environ. 2011, 115, 2320–2329. [Google Scholar] [CrossRef]
  115. Tang, P.L.; Huang, J.J.; Zhou, H.; Huang, W.; Huang, X.C. The spatiotemporal evolution of urbanization of the countries along the Belt and Road Initiative using the compounded night light index. Arab. J. Geosci. 2021, 14, 1677. [Google Scholar] [CrossRef]
  116. Zhao, M.; Cheng, W.M.; Zhou, C.H.; Li, M.C.; Huang, K.; Wang, N. Assessing Spatiotemporal Characteristics of Urbanization Dynamics in Southeast Asia Using Time Series of DMSP/OLS Nighttime Light Data. Remote Sens. 2018, 10, 47. [Google Scholar] [CrossRef] [Green Version]
  117. Pandey, B.; Joshi, P.K.; Seto, K.C. Monitoring urbanization dynamics in India using DMSP/OLS night time lights and SPOT-VGT data. Int. J. Appl. Earth Obs. Geoinf. 2013, 23, 49–61. [Google Scholar] [CrossRef]
  118. Xie, Y.H.; Weng, Q.H.; Fu, P. Temporal variations of artificial nighttime lights and their implications for urbanization in the conterminous United States, 2013–2017. Remote Sens. Environ. 2019, 225, 160–174. [Google Scholar] [CrossRef]
  119. Mauro, G. Rural-Urban Transition of Hanoi (Vietnam): Using Landsat Imagery to Map Its Recent Peri-Urbanization. Int. J. Geo-Inf. 2020, 9, 669. [Google Scholar] [CrossRef]
  120. Ma, T.; Yin, Z.; Li, B.L.; Zhou, C.H.; Haynie, S. Quantitative Estimation of the Velocity of Urbanization in China Using Nighttime Luminosity Data. Remote Sens. 2016, 8, 94. [Google Scholar] [CrossRef] [Green Version]
  121. Xu, P.F.; Lin, M.Y.; Jin, P.B. Spatio-temporal Dynamics of Urbanization in China Using DMSP/OLS Nighttime Light Data from 1992–2013. Chin. Geogr. Sci. 2020, 31, 70–80. [Google Scholar] [CrossRef]
  122. Xu, T.; Ma, T.; Zhou, C.H.; Zhou, Y.K. Characterizing Spatio-Temporal Dynamics of Urbanization in China Using Time Series of DMSP/OLS Night Light Data. Remote Sens. 2014, 6, 7708–7731. [Google Scholar] [CrossRef] [Green Version]
  123. Ju, Y.; Dronova, I.; Ma, Q.; Zhang, X. Analysis of urbanization dynamics in mainland China using pixel-based night-time light trajectories from 1992 to 2013. Int. J. Remote Sens. 2017, 38, 6047–6072. [Google Scholar] [CrossRef]
  124. Ma, T.; Zhou, C.H.; Pei, T.; Haynie, S.; Fan, J.F. Quantitative estimation of urbanization dynamics using time series of DMSP/OLS nighttime light data: A comparative case study from China’s cities. Remote Sens. Environ. 2012, 124, 99–107. [Google Scholar] [CrossRef]
  125. Gao, B.; Huang, Q.X.; He, C.Y.; Ma, Q. Dynamics of Urbanization Levels in China from 1992 to 2012: Perspective from DMSP/OLS Nighttime Light Data. Remote Sens. 2015, 7, 1721–1735. [Google Scholar] [CrossRef] [Green Version]
  126. He, C.Y.; Shi, P.J.; Li, J.G.; Chen, J.; Pan, Y.Z.; Li, J.; Zhuo, L.; Toshiaki, I. Restoring urbanization process in China in the 1990s by using non-radiance calibrated DMSP/OLS nighttime light imagery and statistical data. Chin. Sci. Bull. 2006, 51, 1614–1620. [Google Scholar] [CrossRef]
  127. He, C.H.; Du, H.Y. Urbanization, inclusive finance and urban-rural income gap. Appl. Econ. Lett. 2021. [Google Scholar] [CrossRef]
  128. Li, Y.C.; Wang, X.P.; Zhu, Q.S.; Zhao, H. Assessing the spatial and temporal differences in the impacts of factor allocation and urbanization on urban-rural income disparity in China, 2004–2010. Habitat Int. 2014, 42, 76–82. [Google Scholar] [CrossRef]
  129. Zhao, S.D.; Zhao, K.X.; Zhang, P. Spatial Inequality in China’s Housing Market and the Driving Mechanism. Land 2021, 10, 841. [Google Scholar] [CrossRef]
  130. Yuan, Y.; Wang, M.S.; Zhu, Y.; Huang, X.J.; Xiong, X.F. Urbanization’s effects on the urban-rural income gap in China: A meta-regression analysis. Land Use Policy 2020, 99, 104995. [Google Scholar] [CrossRef]
  131. Zhao, M.; Cheng, W.M.; Zhou, C.H.; Li, M.C.; Wang, N.; Liu, Q.Y. GDP Spatialization and Economic Differences in South China Based on NPP-VIIRS Nighttime Light Imagery. Remote Sens. 2017, 9, 673. [Google Scholar] [CrossRef] [Green Version]
  132. Zhang, J. High-speed Rail Construction and County Economic Development: The Research of Satellite Light Data. China Econ. Q. 2017, 16, 1533–1562. [Google Scholar] [CrossRef]
  133. Lin, X.Q.; Wang, Y.; Wang, S.J.; Wang, D. Spatial differences and driving forces of land urbanization in China. J. Geogr. Sci. 2015, 25, 545–558. [Google Scholar] [CrossRef]
  134. Lin, W.Q.; Wu, M.H.; Zhang, Y.; Zeng, R.J.; Zheng, X.J.; Shao, L.; Zhao, L.Y.; Li, S.X.; Tang, Y. Regional differences of urbanization in China and its driving factors. Sci. China-Earth Sci. 2018, 61, 778–791. [Google Scholar] [CrossRef]
  135. Gu, C.L. Urbanization: Processes and driving forces. Sci. China-Earth Sci. 2019, 62, 1351–1360. [Google Scholar] [CrossRef]
  136. Gollin, D.; Jedwab, R.; Vollrath, D. Urbanization with and without industrialization. J. Econ. Growth 2016, 21, 35–70. [Google Scholar] [CrossRef]
  137. Liang, W.; Yang, M. Urbanization, economic growth and environmental pollution: Evidence from China. Sustain. Comput.-Inform. Syst. 2019, 21, 1–9. [Google Scholar] [CrossRef]
  138. Murakami, N. Changes in Japanese industrial structure and urbanization: Evidence from prefectural data. J. Asia Pac. Econ. 2015, 20, 385–403. [Google Scholar] [CrossRef]
  139. Adams, S.; Klobodu, E.K.M. Urbanization, Economic Structure, Political Regime, and Income Inequality. Soc. Indic. Res. 2019, 142, 971–995. [Google Scholar] [CrossRef]
  140. Liddle, B.; Messinis, G. Which comes first-urbanization or economic growth? Evidence from heterogeneous panel causality tests. Appl. Econ. Lett. 2015, 22, 349–355. [Google Scholar] [CrossRef]
  141. Guo, J.H.; Yu, Z.Q.; Ma, Z.H.; Xu, D.Y.; Cao, S.X. What factors have driven urbanization in China? Environ. Dev. Sustain. 2021. [Google Scholar] [CrossRef]
  142. Jetter, M.; Parmeter, C.F. Does Urbanization Mean Bigger Governments? Scand. J. Econ. 2018, 120, 1202–1228. [Google Scholar] [CrossRef] [Green Version]
  143. Zhang, W.J.; Wang, M.Y. Spatial-temporal characteristics and determinants of land urbanization quality in China: Evidence from 285 prefecture-level cities. Sustain. Cities Soc. 2018, 38, 70–79. [Google Scholar] [CrossRef]
  144. You, H.Y.; Yang, X.F. Urban expansion in 30 megacities of China: Categorizing the driving force profiles to inform the urbanization policy. Land Use Policy 2017, 68, 531–551. [Google Scholar] [CrossRef]
  145. Sun, P.J.; Song, W.; Xiu, C.L.; Liang, Z.M. Non-coordination in China’s Urbanization: Assessment and Affecting Factors. Chin. Geogr. Sci. 2013, 23, 729–739. [Google Scholar] [CrossRef] [Green Version]
  146. Sulemana, I.; Nketiah-Amponsah, E.; Codjoe, E.A.; Andoh, J.A.N. Urbanization and income inequality in Sub-Saharan Africa. Sustain. Cities Soc. 2019, 48, 101544. [Google Scholar] [CrossRef]
  147. Wang, Z.B.; Liang, L.W.; Sun, Z.; Wang, X.M. Spatiotemporal differentiation and the factors influencing urbanization and ecological environment synergistic effects within the Beijing-Tianjin-Hebei urban agglomeration. J. Environ. Manag. 2019, 243, 227–239. [Google Scholar] [CrossRef]
  148. Luan, W.F.; Li, X. Rapid urbanization and its driving mechanism in the Pan-Third Pole region. Sci. Total Environ. 2021, 750, 141270. [Google Scholar] [CrossRef]
  149. Yucer, E.; Erener, A. Examining Urbanization Dynamics in Turkey Using DMSP-OLS and Socio-Economic Data. J. Indian Soc. Remote Sens. 2018, 46, 1159–1169. [Google Scholar] [CrossRef]
  150. Xu, F.; Wang, Z.Q.; Chi, G.Q.; Zhang, Z.X. The impacts of population and agglomeration development on land use intensity: New evidence behind urbanization in China. Land Use Policy 2020, 95, 104639. [Google Scholar] [CrossRef]
  151. Liu, T.Y.; Su, C.W.; Jiang, X.Z. Is China’s Urbanization Convergent? Singap. Econ. Rev. 2016, 61, 1550058. [Google Scholar] [CrossRef]
  152. Liu, T.Y.; Su, C.W.; Jiang, X.Z. Convergence of China’s Urbanization. J. Urban Plan. Dev. 2015, 141, 04014023. [Google Scholar] [CrossRef]
  153. Li, L.N.; Liu, Y.S. Spatial-Temporal Patterns and Driving Forces of Sustainable Urbanization in China Since 2000. J. Urban Plan. Dev. 2019, 145, 05019014. [Google Scholar] [CrossRef]
Figure 1. Study Area.
Land 11 00415 g001
Figure 2. Research steps.
Land 11 00415 g002
Figure 3. Spatial cluster analysis of urban night lighting index in Guangxi.
Land 11 00415 g003
Figure 4. Spatial correlation analysis of urban night lighting index in Guangxi.
Land 11 00415 g004
Figure 5. Interaction detector analysis of urban night lighting data in Guangxi.
Land 11 00415 g005
Figure 6. Spatial cluster analysis of night light extended vitality index in Guangxi.
Land 11 00415 g006
Figure 7. Spatial correlation analysis of night light extended vitality index in Guangxi.
Land 11 00415 g007
Figure 8. Spatial analysis of urban night lighting index changes in Guangxi.
Land 11 00415 g008
Figure 9. Interaction detector analysis of night light data changes in Guangxi.
Land 11 00415 g009
Figure 10. Spatial analysis of night light extended vitality index changes in Guangxi.
Land 11 00415 g010
Figure 11. Driving mechanisms of urbanization in Guangxi.
Land 11 00415 g011
Figure 12. Analysis of the policy zoning of urbanization in Guangxi.
Land 11 00415 g012
Table 1. Interaction between Explanatory Variables.
Graphical RepresentationDescriptionInteraction
Land 11 00415 i001q( X i X j ) < Min(q( X i , q( X j ))Weaken, nonlinear
Land 11 00415 i002Min(q( X i ), q( X j )) < q( X i X j ) < Max(q( X i ), q( X j ))Weaken, uni-
Land 11 00415 i003q( X i X j ) > Max(q( X i ), q( X j ))Enhance, bi-
Land 11 00415 i004q( X i X j ) = q( X i ) + q( X j )Independent
Land 11 00415 i005q( X i X j ) < q( X i ) + q( X j )Enhance, nonlinear
Legend: Land 11 00415 i006 Min(q( X i ), q( X j ) ); Land 11 00415 i007 Max(q( X i ), q( X j )); Land 11 00415 i008 q( X i ) + q( X j ); Land 11 00415 i009 q( X i X j ).
Table 2. Model variable description.
VariableIndexCodeSource
Dependent Variable
( Y i )
Urban Night Lighting Index Y 1 Wind Database
Night Light Extended Vitality Index Y 2
Changes of Urban Night Lighting Index Y 3
Changes of Night Light Extended Vitality Index Y 4
Independent Variable
( X i )
Gross Domestic Product X 1 Guangxi statistical yearbook, Guangxi construction Yearbook, Guangxi Statistical Manual, urban statistical bulletin, and government work report
Per capita GDP X 2
Added Value of Secondary Industry X 3
Added Value of Tertiary Industry X 4
Number of Up-scale Enterprises X 5
Resident Population X 6
Population Urbanization Rate X 7
Per Capita Disposable Income of Urban Residents X 8
Per Capita Disposable Income of Rural Residents X 9
Total Retail Sales of Social Consumer Goods X 10
Government Revenue X 11
Table 3. Spatial heterogeneity analysis of urban night lighting index in Guangxi.
201520162017201820192020
Max11,906.9113,017.7711,599.0413,590.2914,990.0315,816.31
Min2.785.079.2416.8430.7055.97
Mean1440.441694.291790.371963.732081.542163.34
SD2216.682523.622501.282733.462871.143070.48
CV1.541.491.401.391.381.42
GI0.660.640.630.620.620.63
Table 4. Factor detector (q) analysis of night light data in Guangxi.
X 1 X 2 X 3 X 4 X 5 X 6 X 7 X 8 X 9 X 10 X 11
Y 1 20150.50 *0.32 *0.38 *0.55 *0.15 *0.08 *0.34 *0.20 *0.22 *0.47 *0.38 *
20190.57 *0.42 *0.43 *0.55 *0.29 *0.15 **0.41 *0.30 *0.25 *0.49 *0.44 *
AVG0.54 *0.37 *0.40 *0.55 *0.22 *0.04 *0.37 *0.25 *0.24 *0.48 *0.41 *
Y 2 20150.45 *0.29 *0.39 *0.47 *0.21 *0.17 *0.34 *0.24 *0.28 *0.41 *0.29 *
20190.52 *0.40 *0.45 *0.45 *0.32 *0.18 *0.45 *0.30 *0.30 *0.44 *0.38 *
AVG0.49 *0.35 *0.42 *0.46 *0.26 *0.18 *0.39 *0.27 *0.29 *0.42 *0.34 *
Y 3 20150.19 *0.17 *0.18 *0.15 *0.04 *0.03 **0.09 *0.21 *0.13 *0.17 *0.19 *
Change0.16 *0.19 *0.26 *0.09 *0.030.18 *0.010.13 *0.16 *0.020.12 **
AVG0.17 *0.18 *0.22 *0.12 *0.02 *0.09 *0.05 *0.17 *0.14 *0.08 *0.09 *
Y 4 20150.21 *0.19 *0.22 *0.18 *0.13 *0.04 *0.22 *0.20 *0.18 *0.18 *0.18 *
Change0.22 *0.21 *0.30 *0.20 *0.13 *0.08 *0.010.14 *0.21 *0.09 *0.18 *
AVG0.21 *0.20 *0.26 *0.19 *0.13 *0.06 *0.11 *0.17 *0.19 *0.14 *0.18 *
Note: * stand for p < 0.05, ** stand for p < 0.1, and “change” represents the calculation result with the change-value in 2015–2019 as the independent variable.
Table 5. Spatial heterogeneity analysis of night light extended vitality index in Guangxi.
201520162017201820192020
Max558.91635.60597.64666.74683.75682.47
Min0.520.871.462.444.116.90
Mean95.42107.01111.39123.87131.15135.39
SD111.02120.88123.46135.17140.60148.60
CV1.161.131.111.091.071.10
GI0.560.540.540.530.520.53
Publisher’s Note: MDPI stays neutral with regard to jurisdictional claims in published maps and institutional affiliations.

