Article

Spatio-Temporal Patterns of the Land Carrying Capacity of Tibet Based on Grain Demand and Calorie Requirement

1
Institute of Geographic Sciences and Natural Resources Research, Chinese Academy of Sciences, Beijing 100101, China
2
College of Resources and Environment, University of Chinese Academy of Sciences, Beijing 100049, China
3
Faculty of Geographical Science, Beijing Normal University, Beijing 100875, China
4
Key Laboratory of Carrying Capacity Assessment for Resource and Environment, Ministry of Natural Resources, Beijing 100101, China
*
Author to whom correspondence should be addressed.
Land 2022, 11(3), 380; https://doi.org/10.3390/land11030380
Submission received: 25 January 2022 / Revised: 28 February 2022 / Accepted: 1 March 2022 / Published: 4 March 2022
(This article belongs to the Special Issue Agricultural Land Management to Meet Future Global Food Demand)

Abstract

:
Tibet constitutes a major part of the Qinghai–Tibet Plateau (QTP) and is a typical ethnic minority (e.g., Tibetan) and ecologically fragile area in the world. Land resources are one of the most important foundations of food production, and Tibet’s increasingly multi-type food demands are putting new pressure on land resources. However, there is still debate on how many people can be supported with the food production in Tibet. Investigating the land carrying capacity (LCC) in Tibet is very important for maintaining food security and formulating sustainable land management and utilization. Based on an analysis of the unique characteristics of the local farming, pastoral production, and dietary consumption, the spatio-temporal patterns of theLCC in Tibet in 2000–2019 were quantitatively assessed against the grain demands and calorie requirements at three different standards of living (i.e., basic prosperity, comprehensive moderate prosperity, and affluence). The dietary consumption was characterized by the high consumption of grains and meat products, and the low consumption of fruits and vegetables. The LCC in Tibet has continued to increase. The LCC in approximately 60% of the counties increased, with the high-LCC counties concentrated mainly in the Yarlung Zangbo River—Nyangqu River—Lhasa River area, and municipal districts and pastoral counties generally experiencing a low LCC. The load on land resources (LoL) in Tibet exhibited the characteristic of overall balance with local overloads and increasing tensions. More than 50% of the counties experienced population overload, mainly in municipal districts and pastoral counties. Food surplus was mainly found in farming counties, while the food production in pastoral counties was generally unable to meet the calorie demand. Considering the important role of land use in maintaining regional food security and ecological security, the conversion of grassland to cultivated land, the occupation of cultivated land, and the phenomenon of cultivated land was used to non grain should be avoided. Trans-regional transport of food should be strengthened to meet the calorie needs in population overload areas in the future. Our study provides a perspective for evaluating the pressure of land resources. The result can provide a reference for realizing the balance of grain and calorie supply–demand and lay a foundation for formulating sustainable land use policies in the QPT.

1. Introduction

Since the late 20th century, the population–land relationship focusing on population, resources, environment, and development has become an increasingly important topic in geography, resources sciences, and other scientific disciplines [1,2]. As a major tool for describing the limitations to development and a major means for assessing the population–land relationship, the land carrying capacity (LCC) has become a major measure of sustainable development [1,2]. The resources and environmental carrying capacity (RECC) has gained increasing attention in research areas such as regional planning, ecosystem services assessment, and sustainable development, especially in the balance of food supply and demand [3,4,5]. Land resources are the basis for the sustenance and development of human society. LCC, a measure of the population size that can be sustained by the current land resources, is a traditional hot topic in research on RECC [6].
The Qinghai–Tibet Plateau (QTP) occupies a unique ecogeographical position, serves as a major barrier protecting the ecological security in China, and is among the areas in the world that are most sensitive to climate change [7]. Moreover, the QTP is a major gathering area for ethnic minorities (e.g., Tibetan) and an area where agricultural–pastoral cultures intersect. The issues of resource environment and food security in the QTP have always received high attention from the government and scholarly community. Because of the unique geographical environmental limitations and the impact of stringent ecological protection policies, the grain production on the QTP does not meet the local consumption demand [8]. Maintaining a food supply–demand balance in the QTP has received high attention from the Chinese Central Government. In his Congratulatory Letter to the Second QTP Comprehensive Scientific Expedition Team of the Chinese Academy of Sciences, for example, Chinese President Xi Jinping highlighted the necessity of further efforts to investigate the resources and environmental carrying capacity (including LCC), disaster risk, and other problems in the plateau [9]. Tibet constitutes a major part of the QTP, and securing food supply–demand balance is of important strategic significance for securing the ecological barrier, promoting stable development in the border areas, and protecting China’s homeland security.
Focusing on the population size that can be sustained by current land resources, Park et al. first introduced the concept of LCC in 1921 [10]. With nearly a century’s development, LCC research has gradually broadened its scope from analysis of grain supply–demand balance to research on food supply–demand balance, with the concepts of cereal equivalent and nutrient equivalent gradually introduced into relevant research [11,12]. The dietary consumption of Chinese residents has changed since the country succeeded in building a moderately prosperous society, and this has led to increasing research on dietary consumption [13,14,15,16] and the emergence of LCC research based on food consumption demand [17,18]. For Tibet, research has been conducted on the individual factors of RECC—such as water resources [19], ecology [20], and grassland [21]—and on the overall RECC [22,23,24]. In particular, long-standing research has been conducted on the LCC in Tibet. In the 1980s, the Commission for Integrated Survey of Natural Resources of the Chinese Academy of Sciences [25] was the first to study the LCC in theQTP. Shang [26] predicted the maximum output of agricultural crops and meat products using an agricultural ecological zone method, and the results showed that Tibet would be short of approximately 50 thousand tons of grain per annum in 2025. In the 1990s, Liu [27] assessed the land resources and investigated the potential capacity of agricultural production in the middle reaches of the Yarlung Zangbo river. Entering the 21st century, Zeng simulated the population carrying capacity in Tibet during 1985–2005, and the results showed that Tibet would face severe population overload in the future [28]. In recent years, Wang et al. [29] and Hao et al. [30] used nutrient equivalent to estimate the LCC in Tibet. Existing research has provided reference methods for LCC research, but there are controversies over whether the land resources in Tibet are overloaded. In addition, the food consumption level is often assumed to be temporally constant, and there is space for improvement with the measurement of effective calorie supply.
In fact, in the vast geographical area of China, different regions differ in food production and dietary consumption; thus, LCC research based on regional food production structure and dietary consumption characteristics can reveal more truthfully the regional levels of load on land resources (LoL). As a unique agricultural geographical unit of China, Tibet consists of farming, pastoral, and farming–pastoral, counties with unique food production and consumption characteristics [31]. In terms of geographical environment and land use in Tibet, the terrain slopes from northwest to southeast and is complex and diverse. The climate is cold and dry in the northwest, and warm and humid in the southeast. The land use type is mainly grassland (about 65% of the total land), and cultivated land are scarce (merely 0.3% of the total land). In particular, there are obvious regional differences between planting and animal husbandry. In terms of socioeconomics, both urbanization and economic development have great potential. In fact, the problems of land resources utilization and food security in Tibet are typical of mountainous–pastoral areas and underdeveloped areas.
Generally, livestock products (mainly beef, mutton, and dairy products) have constituted a major part of the dietary consumption of Tibetan residents, while the local grain production does not satisfy the local demand. The per capita share of grain was only 300 kg in 2019 in Tibet, less than 65% of the national average. In recent years, Tibet has enjoyed rapid socioeconomic development and increasing communication with other Chinese provinces; Meanwhile, the food consumption levels of Tibetan farmers and herdsmen have increased, and their dietary structures have become increasingly diversified. In particular, the consumption demand for rice, wheat, vegetables, and fruits has increased [8]. However, there remain prominent problems, such as imbalanced dietary structures. Overall, Tibet produces only a limited range of plant foods, while the supply of livestock products is constrained by increasingly stringent policies on animal husbandry [32], resulting in prominent structural problems in food supply and demand. Particularly, grazing exclusion increased grazing pressure in unfenced areas, and lowered the satisfaction of herders and food production [33]. Investigating the LCC in Tibet by considering only the demand for grain or the demand for food in individual scenarios cannot reveal the true state and future trends of food supply–demand balance.
In Tibet, food security is not only related to the lives of residents, but also has special significance in socio-economic development, ethnic unity, and border security. After the COVID-19 pandemic, the port blockade led to the interruption of food markets, supply chains, and trade. The issue of “food security” has once again been raised [34]. It is particularly important to consider the security of the food supply considering its own food production capacity. From a long-term perspective, exploring the LCC of Tibet, an area with interlaced farming–pastoral culture and fragile ecological environment, and clarifying the relationship between population and food production–consumption in this area will help promote the sustainable use of land resources on the QTP and socio-economic as well as ecological sustainable development.
Therefore, the present study was aimed at investigating the spatio-temporal patterns of the LCC in Tibet against the grain demands and calorie requirement at different standards of living. This study attempted to answer the following questions. (1) What are the characteristics of the residents’ dietary consumption structure? (2) What is the population size that can be sustained by the land resources (or the LCC)? (3) What is the spatial–temporal pattern of the LoL level? Considering that food is a bond of land resource utilization and human demand, the balance of food supply and demand can not only reflect the degree of food security, but the pressure of the population on land resources. To achieve the research objective and answer the research questions, this study analyzed the food consumption levels and estimated the effective calorie supply levels in Tibet using food production and consumption data and a food–calorie conversion model. The spatio-temporal patterns of the LCC in Tibet in the past nearly two decades (2000–2019) at three spatial scales (i.e., provinces, cities/prefectures and counties) were assessed systematically against different standards of living using an LCC model from two perspectives: population–grain balance that considers the supply and demand for grain only, and calorie supply–demand balance that considers the supply and demand for all major categories of livestock and plant foods. The aim was to quantitatively reveal the LoL and provide scientific support for food security and sustainable development in ecologically fragile areas (e.g., the QTP) across the globe.

2. Study Approach, Materials and Methods
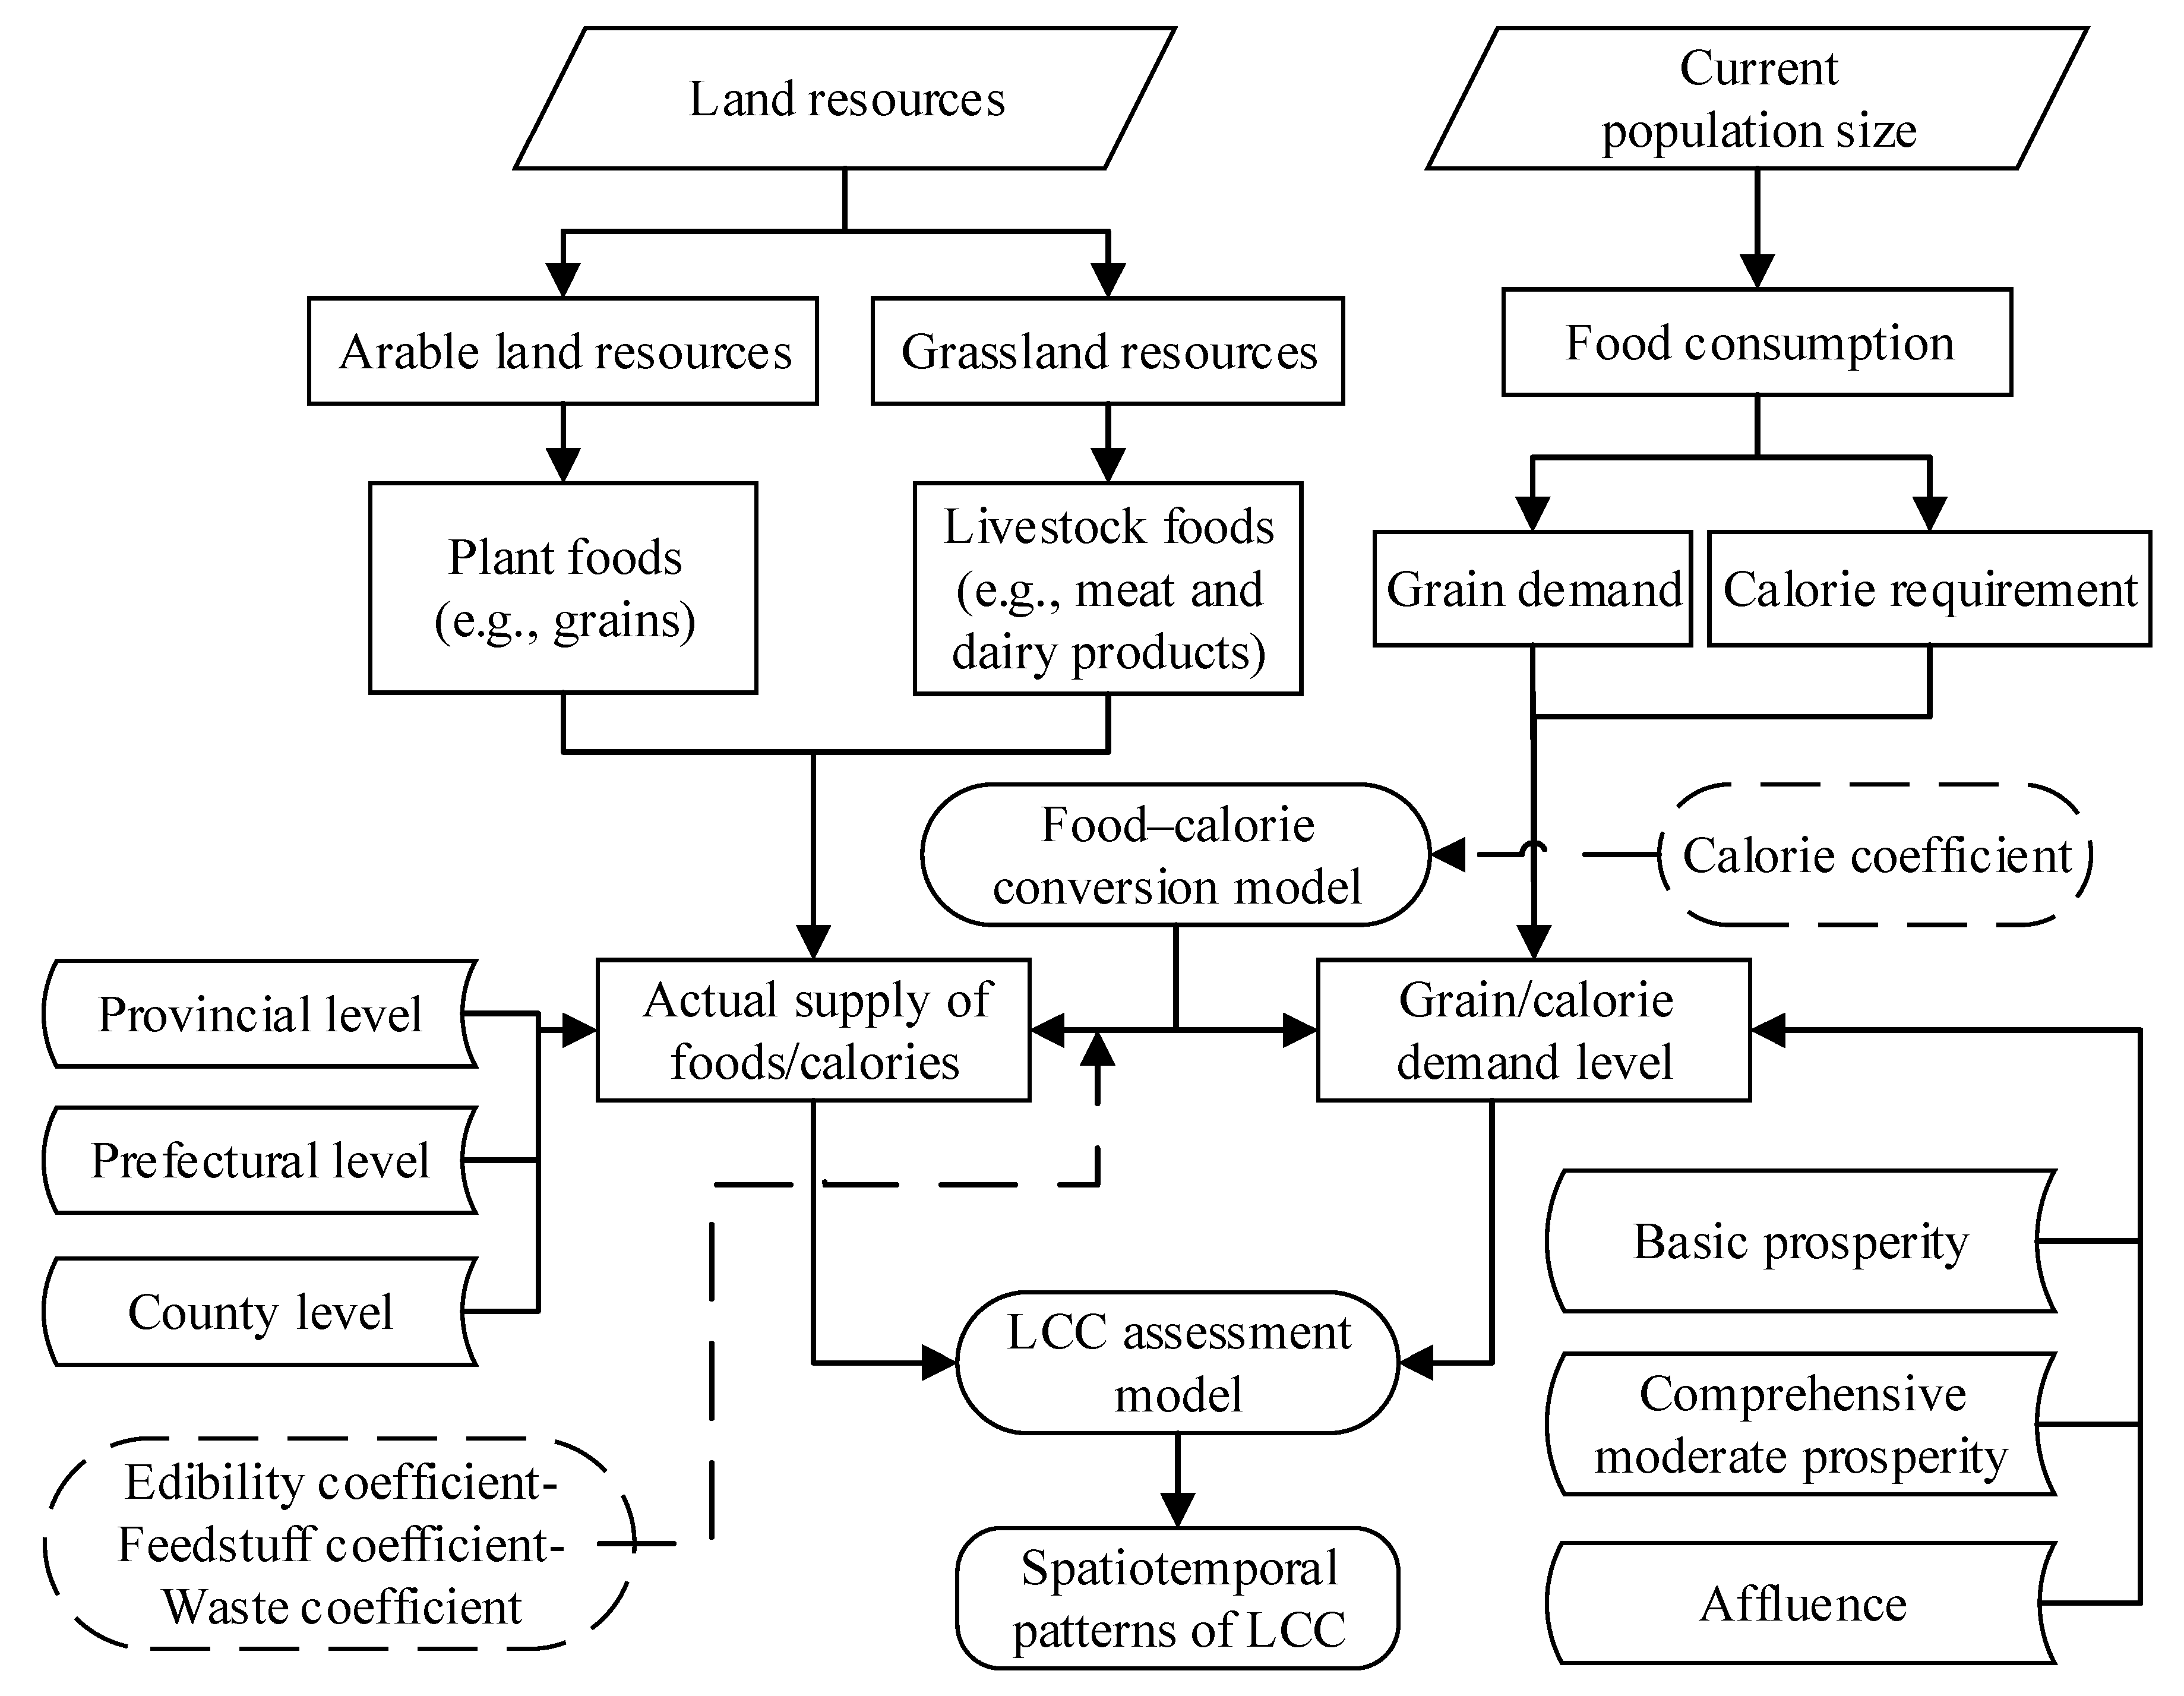
2.1. Study Approach

LCC is essentially a measure of the balance between human consumption and food production, and that between human demand and resources supply. The present study focused on the quantities of land resources and the population. First, the effective calorie supply and dietary nutrition levels were estimated using a food–calorie conversion model based on an analysis of the characteristics of land use and farming and pastoral production. Then, the LCC and LoL levels in Tibet were assessed against the different food demand and calorie requirement levels at different standards of living using an LCC model. Figure 1 shows the theoretical framework of our study.

2.2. Research Methodology

2.2.1. Food–Calorie Conversion Model

Foods differ in calorie content, and a consistent measurement of food supply and demand levels was realized using the food–calorie conversion model:
E n e r g y = F i × C a l
where Energy is the calorie supply level, Fi is the ith category of food (see Table 1), and Cal is the calorie contained in the ith category of food. For estimating the calorie intake on the consumption side, food edibility was considered and estimated using an edibility coefficient. On the supply side, food edibility (as measured using the edibility coefficient) and food waste (measured using a food waste coefficient) were considered. For livestock foods, feedstuff (measured using a feedstuff coefficient) was considered. Table 1 gives the food–calorie conversion parameters for the major categories of foods.

2.2.2. LCC Model

Based on the characteristics of food production in Tibet, the LCC was analyzed against grain demand and calorie requirement using the following model:
L C C = { C L C C = C / C P C E L C C = E / E P C
L C C I = { C L C C I = P a / C L C C E L C C I = P a / E L C C
where CLCC is the LCC estimated against grain demand, ELCC is the LCC estimated against calorie requirement, C is the grain production, E is the calorie supply, CPC is the per capita grain demand, EPC is the per capita calorie requirement (Table 2), Pa is the current population size, LCCI is the LCC index, CLCCI is the LCCI estimated against grain demand and measures the degree of population–grain balance, and ELCCI is the LCCI estimated against calorie requirement and measures the degree of calorie supply–demand balance. LCCI values are classified into three levels and six sub-levels (Table 3) for describing the LoL level.

2.2.3. Definitions of Food Demand and Calorie Requirement Levels

The quantities of grain and calories required for maintaining the basic physiological activities of Chinese residents have usually been estimated to be 400 kg/person/y and 2400 kcal/person/y, respectively [25]. Considering that different types of counties in Tibet differ in grain demand and that the ratio between farming and pastoral populations has been sustained at 7:3, and referencing the grain demand in pastoral counties estimated by existing research (200 kg/person/y) [35], the amount of grain required for maintaining a basic prosperity standard of living in Tibet is estimated to be 340 kg/person/y. Considering that the food consumption structure in Tibet will become increasingly similar to the overall food consumption structure in China, i.e., the grain demand for feedstuff and industrial purposes will increase, the per capita share of grain required for maintaining a comprehensive moderate prosperity standard of living and an affluent standard of living was estimated to be 400 kg/y and 440 kg/y (total of all grain uses, such as feed, seed, processing, losses waste), respectively. To reveal more accurately the degree of population–grain balance in different types of counties in Tibet, the grain demand in the farming counties was assumed to be equal to that in Tibet, and the ratio between farming and pastoral populations in farming–pastoral counties was assumed to be 5:5. On this basis, the grain demand was estimated against the three different standards of living (i.e., basic prosperity, comprehensive moderate prosperity, and affluence. Pastoral counties have low or no grain output, and the degree of population–grain balance in these counties was not analyzed. The calorie requirement was also estimated against the three different standards of living (Table 2).

2.3. Data Sources and Treatment
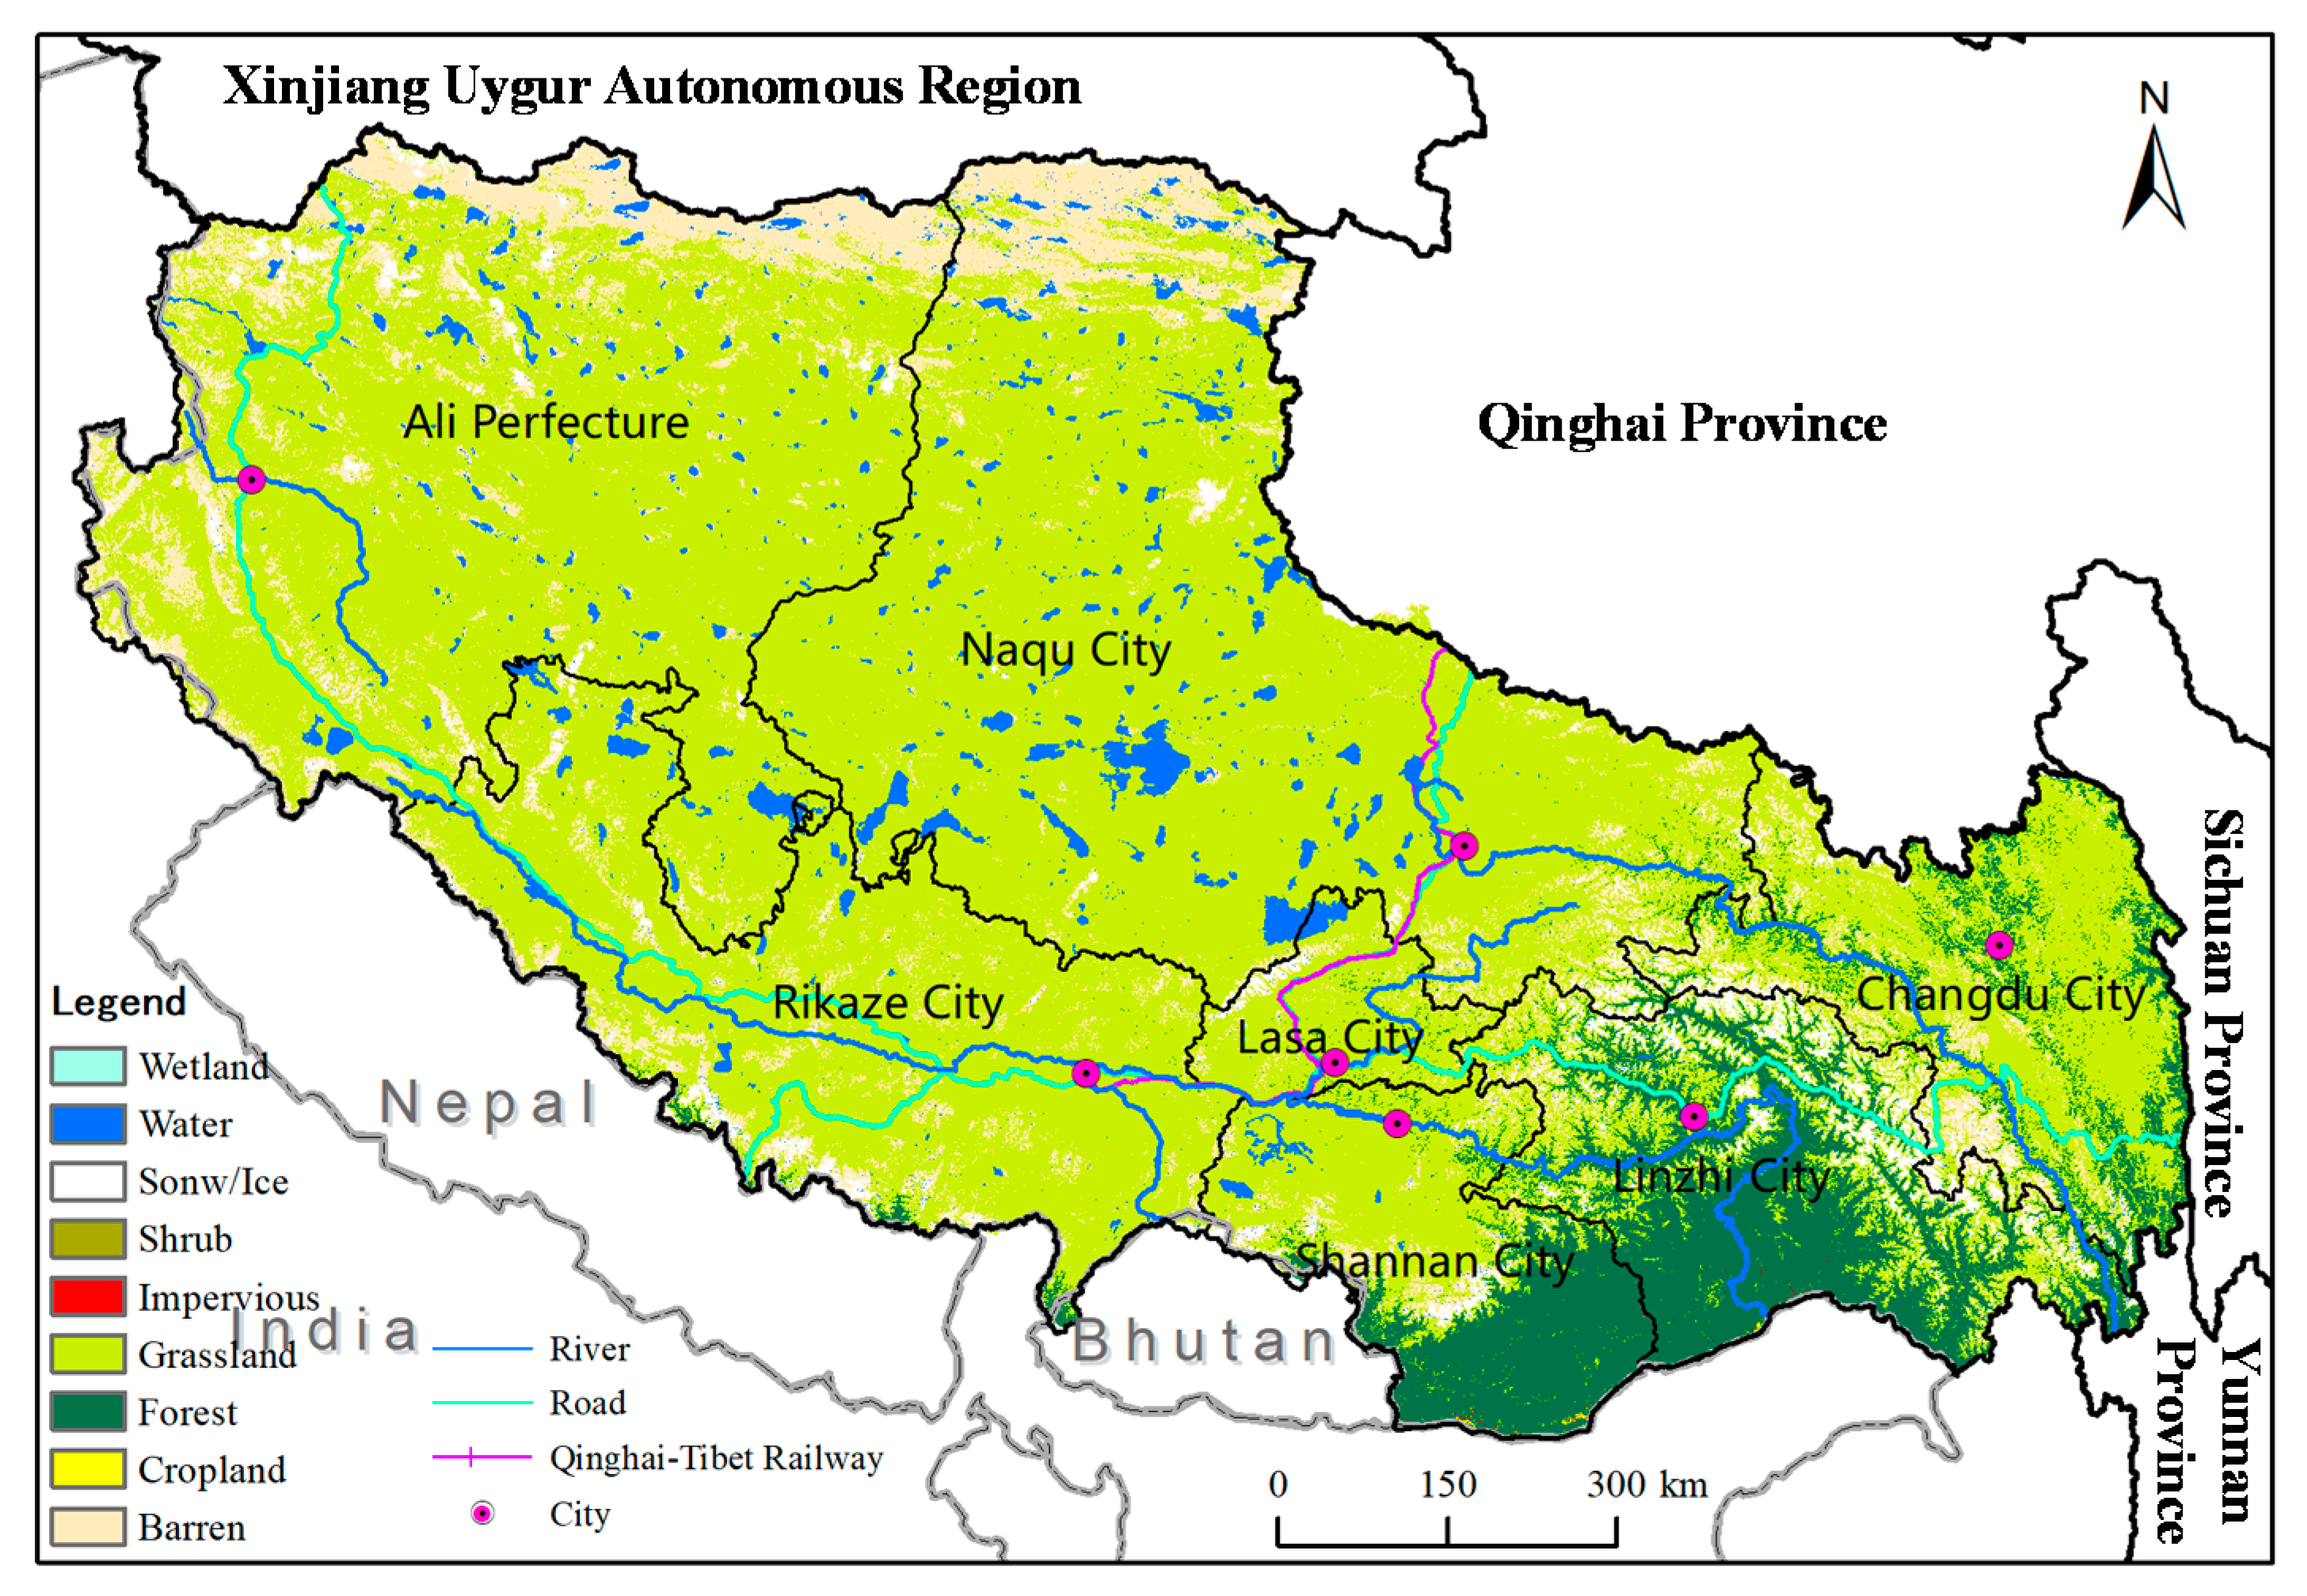
(1) The food production structure in Tibet is relatively simple, with ten main categories of plant foods (e.g., rice, wheat, highland barley, beans, roots and tubers, rapeseed, peanut, vegetables, apple, and pear) and five main categories of livestock foods (beef, mutton, cow milk, sheep milk, and pork). The food output data for 2000–2019 came mainly from the statistics yearbooks of Tibet and its cities (prefectures). (2) The food consumption data came mainly from the statistics yearbooks of Tibet and China. Considering that the data for urban and rural food consumption in the statistics yearbooks after 2017 have included the major categories of food consumption quantities, the average data for 2017–2019 were used to measure the current food consumption levels, and the calorie intake levels in Tibet were calculated using the food–calorie conversion model fed by the consumption data for 43 subcategories of foods. (3) The population data came from the Tibet Statistics Yearbooks and China Population and Employment Statistics Yearbooks for the study time period. (4) The calorie coefficients and edibility coefficients for the major categories of foods came from the China Food Composition 2009 [36]. The waste coefficients (covering waste in mainly the storage and distribution links) and feedstuff coefficients were based on previous studies [37,38] and adjusted according to the actual farming and pastoral production structure in Tibet. (5) The definition of county types in the Tibet Statistics Yearbooks (Table 4) was used.

3. Study Area

Tibet is located in the southwest of the QTP (26°50′~36°53′ N, 78°25′~99°06′ E), and borders with India, Nepal, Bhutan, Bangladesh, and other countries. The average altitude is more than 4000 m, known as the roof of the world. The terrain slopes from northwest to southeast and is complex and diverse. The climate is cold and dry in the northwest and warm and humid in the southeast [39]. Tibet serves as a major barrier protecting the ecological security in China.
Tibet is one of the 34 provincial-level administrative regions in China and is the second largest province at 1.23 million km2, accounting for one-eighth of the geographic expanse. Tibet has a vast territory, but a sparse population [22]. However, as of 2019, its population was 3.506 million people (86% are Tibetan), only accounting for 0.25% of China’s population. At same time, the natural growth rate of the population reached 10.1‰ in Tibet, which is three times that of China’s (3.3‰). Tibet’s GDP was CNY 169.78 billion, accounting for only 0.17% of China’s GDP. The per capita disposable income is CNY 19,501, only 63.45% of China’s. Its urbanization rate is 31.5%, less than half of China’s (68.5%). The economy and urbanization level of Tibet lags behind China’s level. The land use type in Tibet is mainly grassland (about 65% of the total land area), of which Naqu City has the largest grassland area (Figure 2). Forests are mainly distributed in southeastern Tibet (about 10.38% of the land area). Cultivated land and construction land (which, combined, account for 0.40% of the land area) are mainly distributed in the Yarlung Zangbo River—Nyangqu River—Lhasa River area. Water area and water conservancy facilities account for about 4.56%, and other unused land accounts for about 14.71%. Above all, Tibet has the characteristics of mountainous–pastoral–underdeveloped areas and border areas. The rapid population growth and socioeconomic development will bring new challenges to the food supply and new pressure on land resources.

4. Results

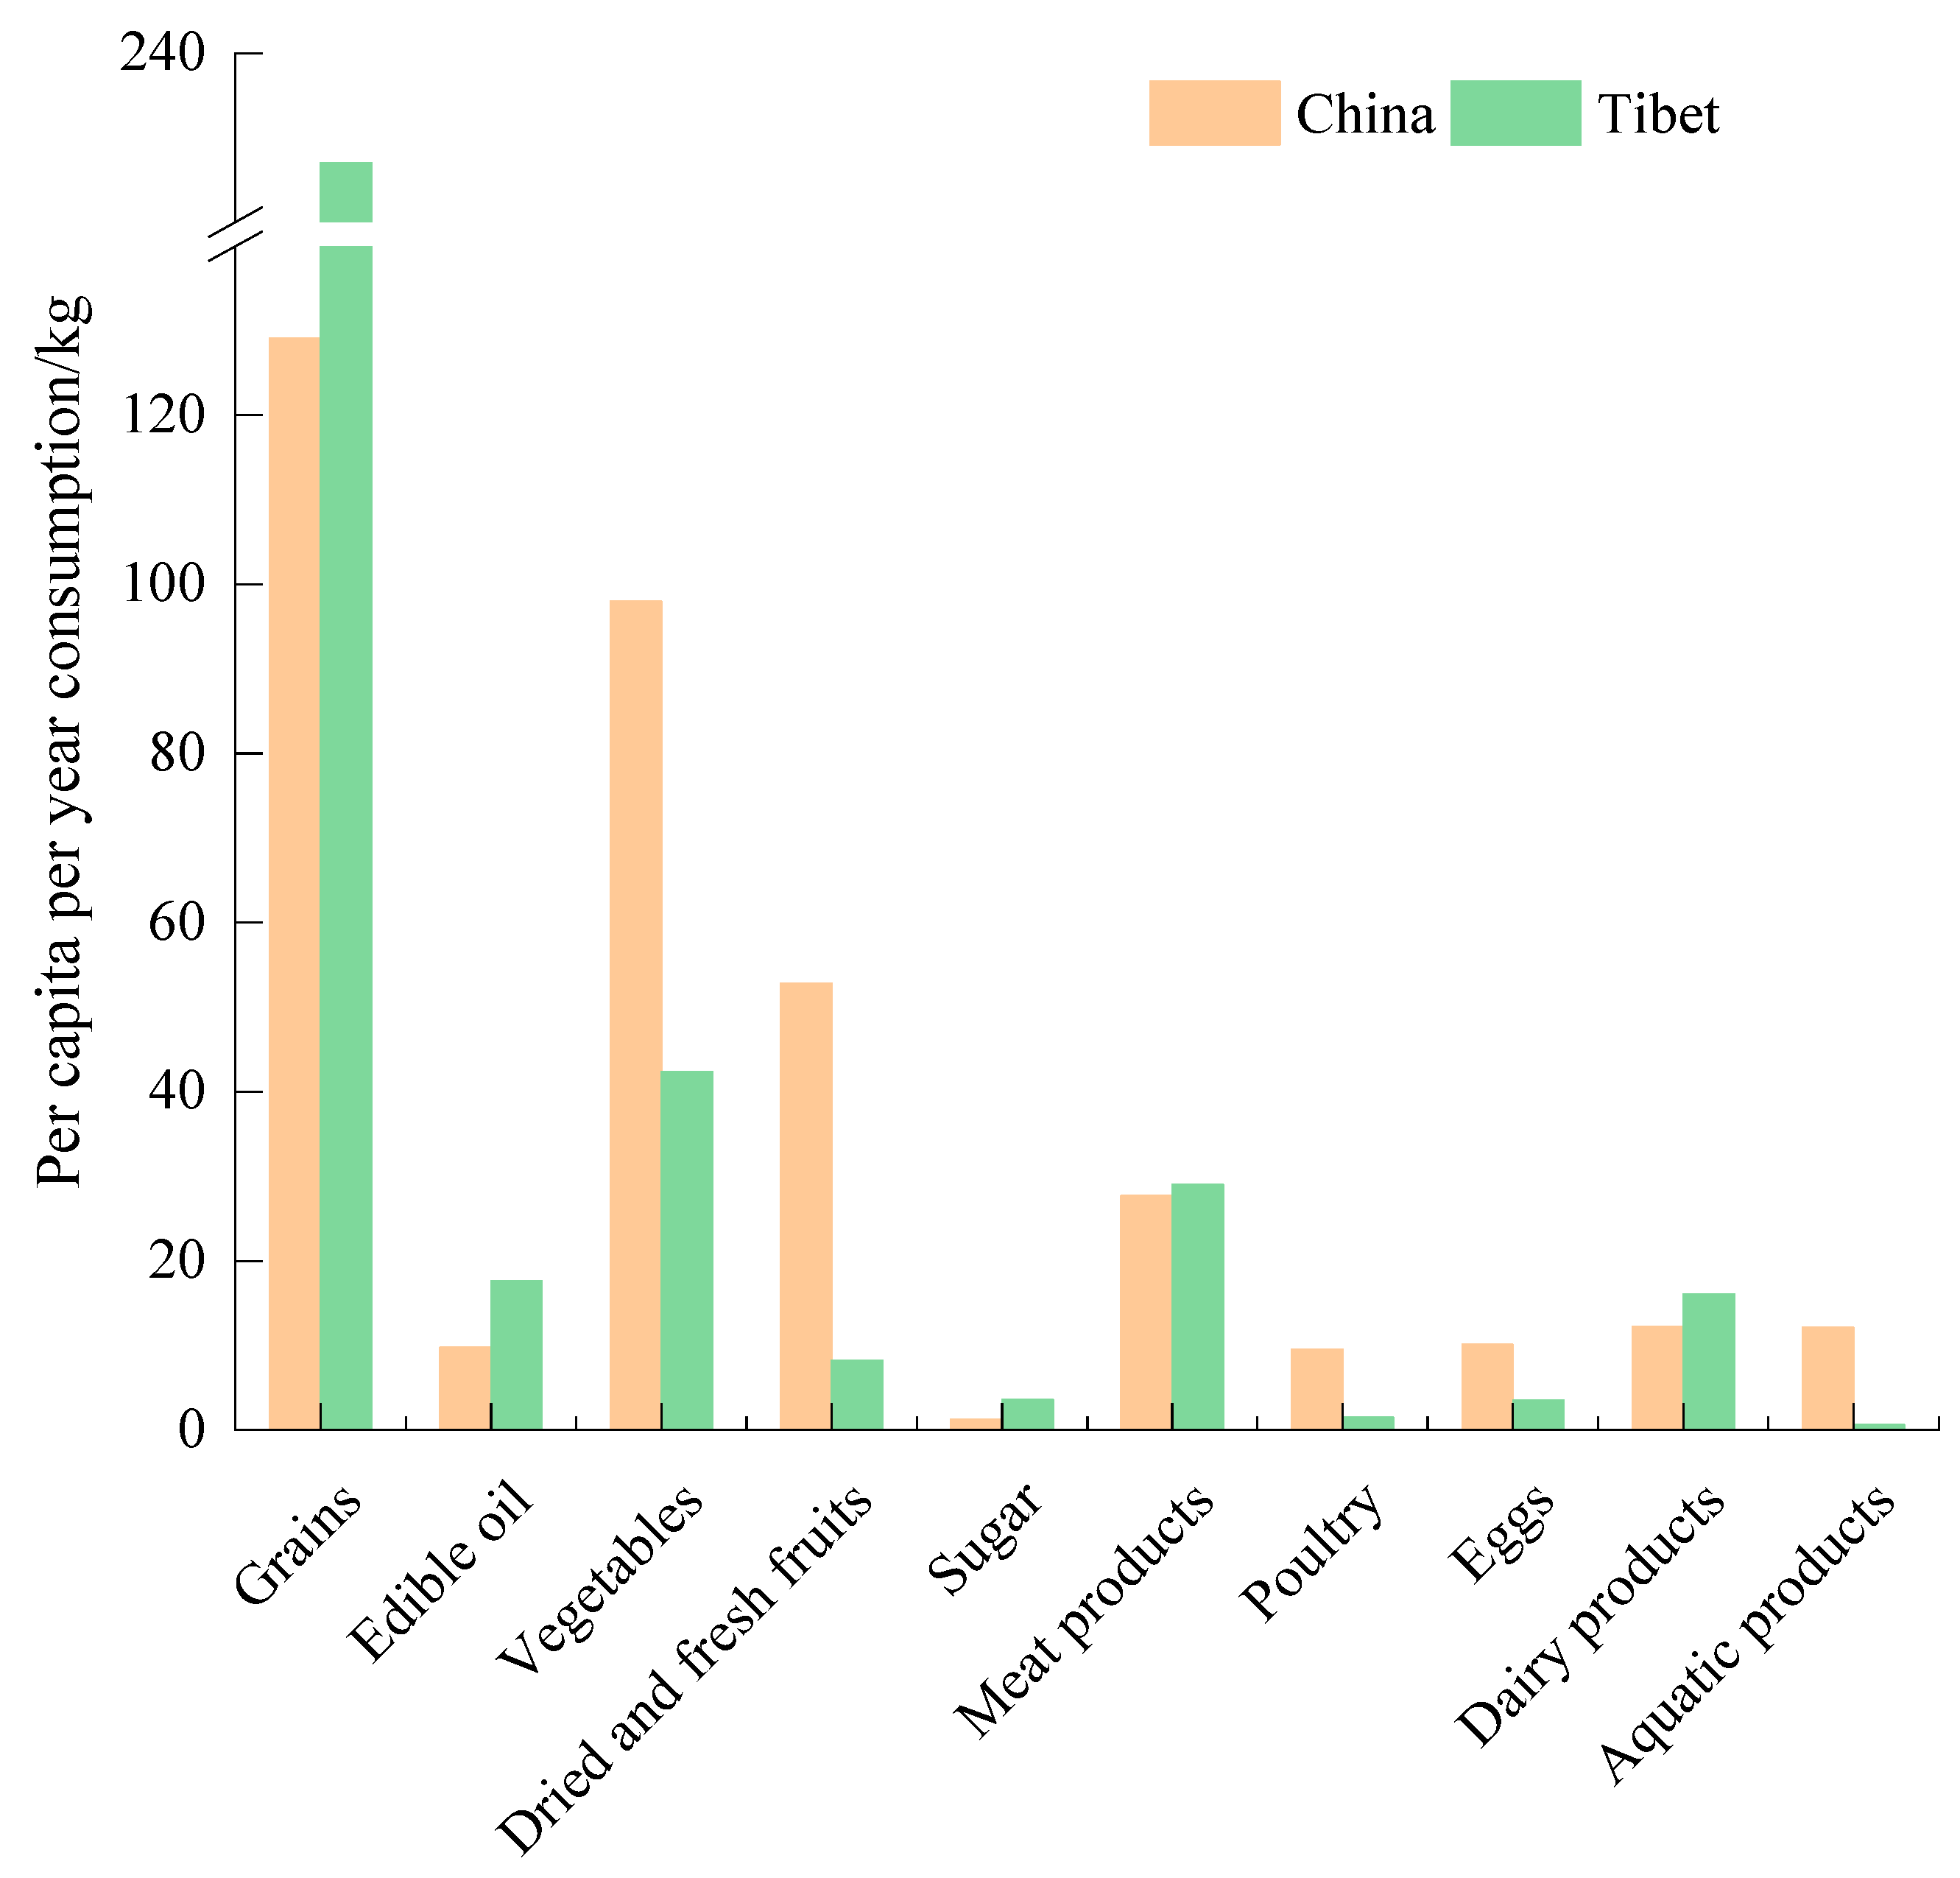
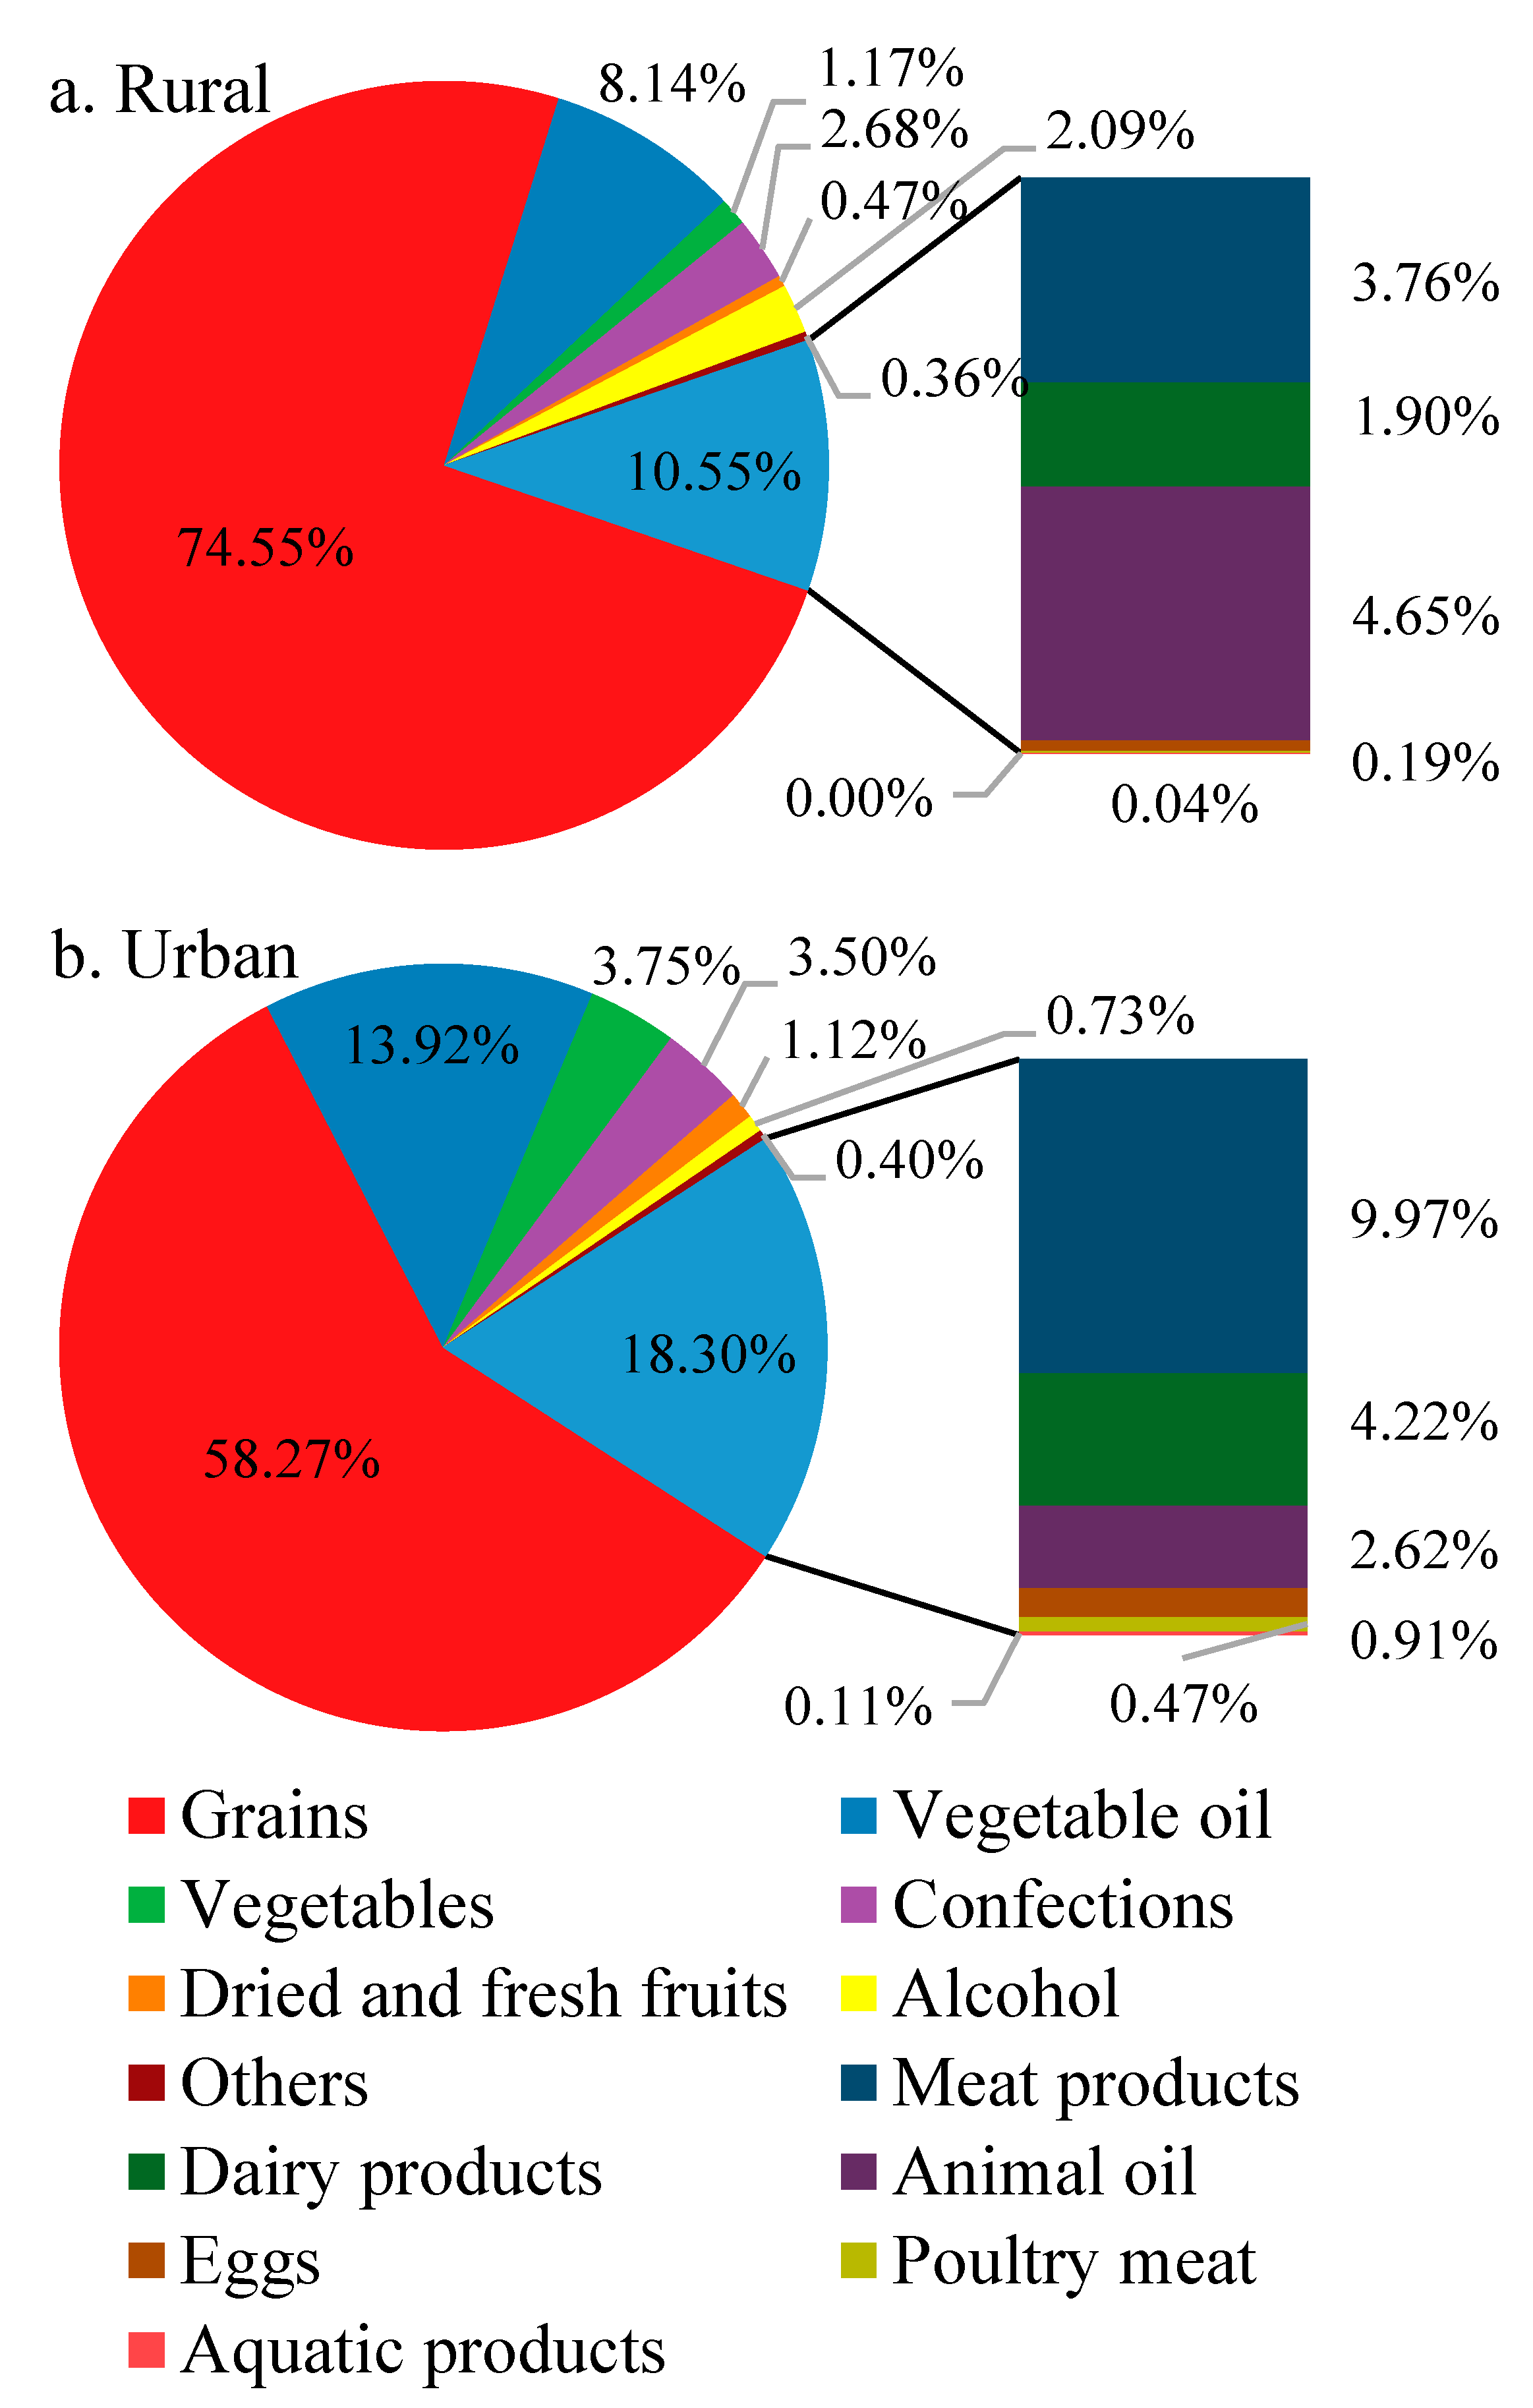
4.1. Food Consumption and Dietary Nutrition
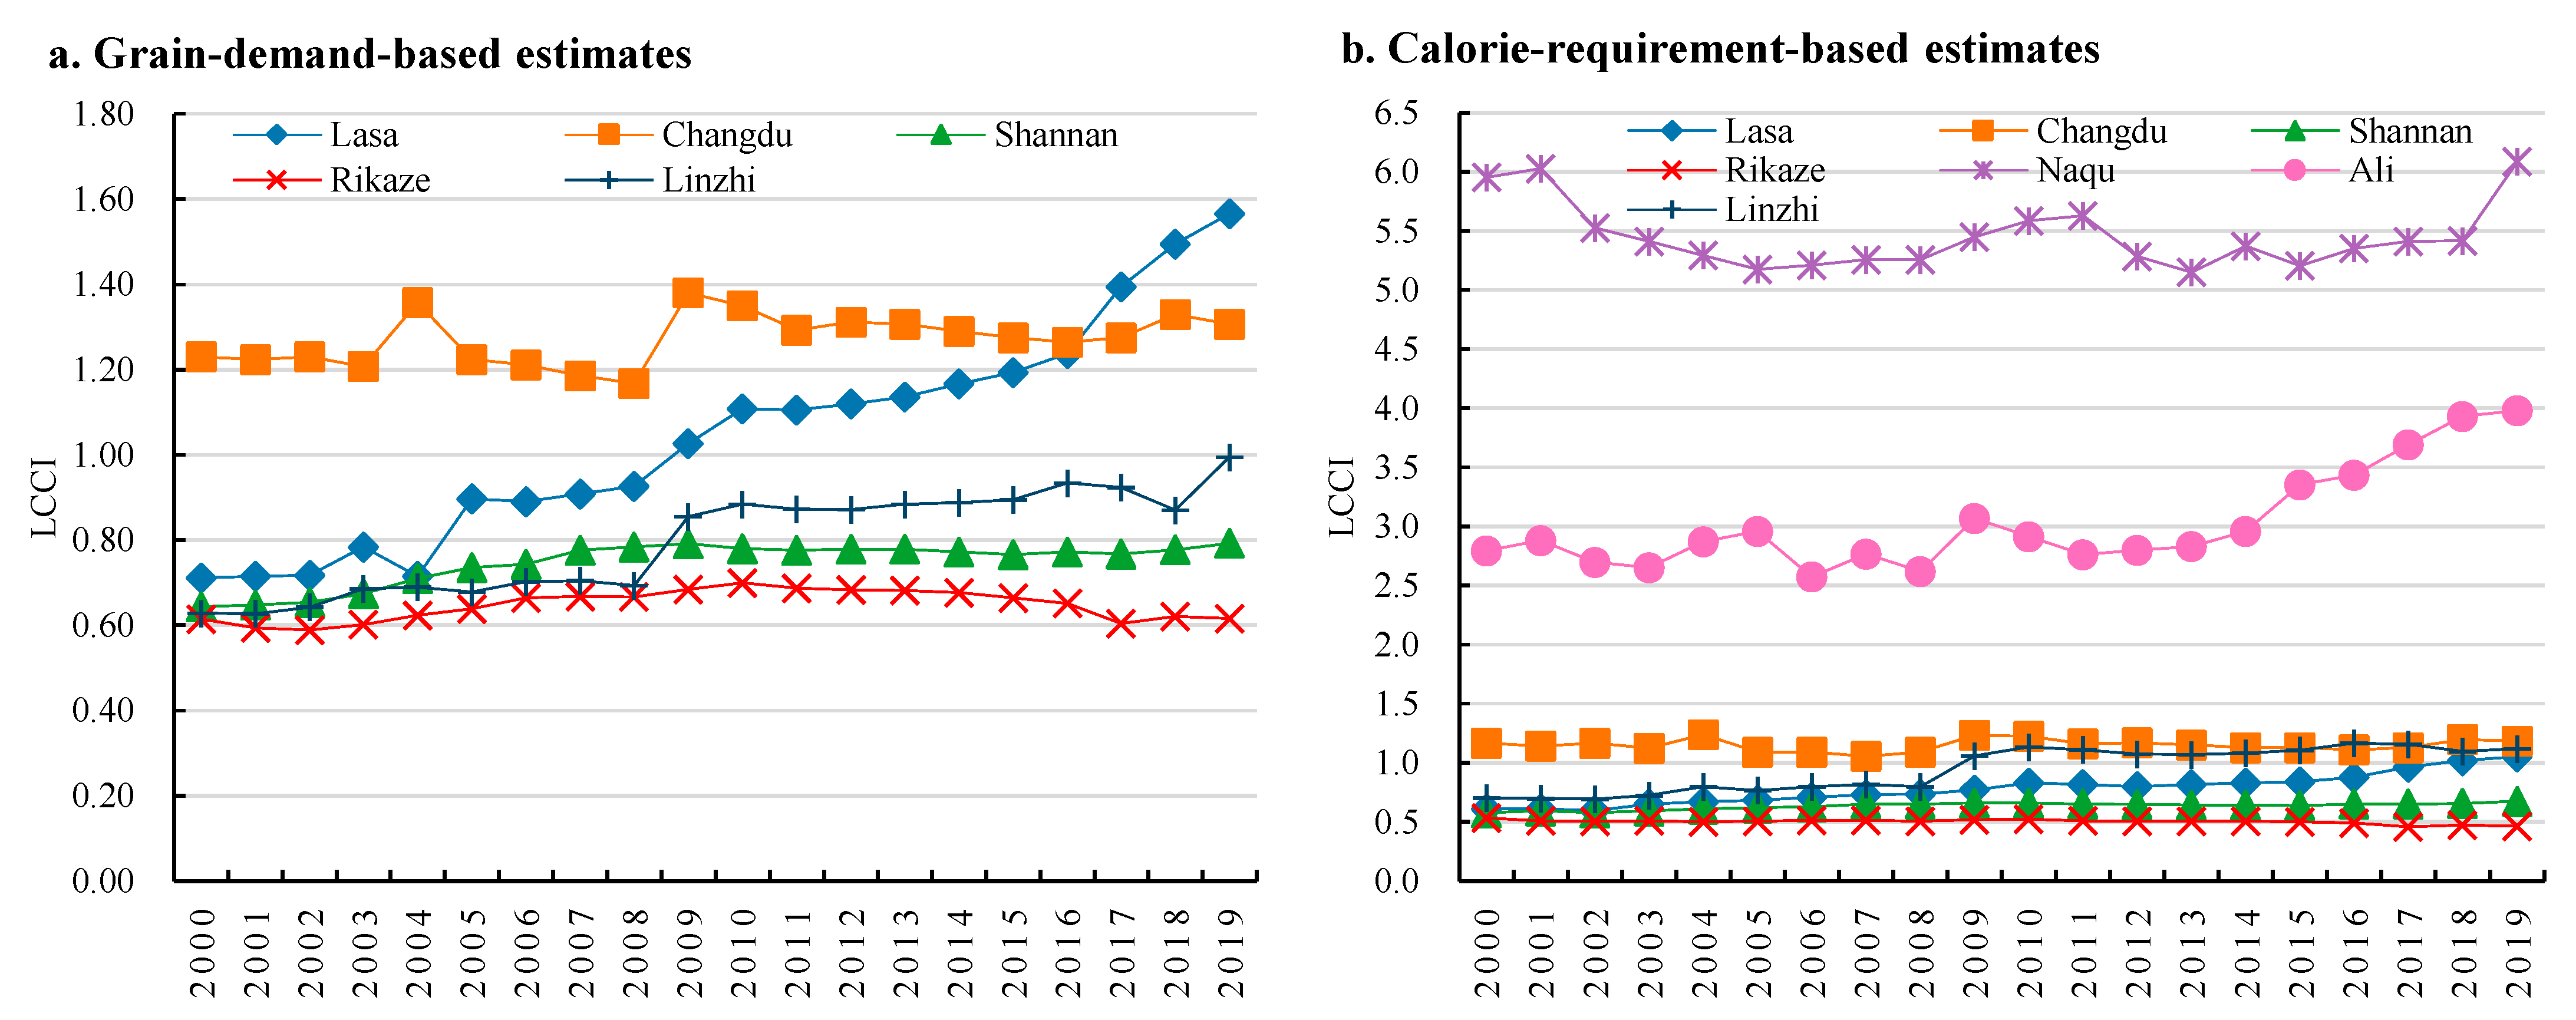
The dietary consumption in Tibet is dominated by grains, with a high consumption of livestock products. At the present stage, grains (97.15% cereals) ranked first in terms of the food consumption by Tibetan residents (227.07 kg/person/y), followed by vegetables (42.40 kg/person/y) and meat products (29.07 kg/person/y). Meat consumption was dominated by beef (56.54%), followed by pork (22.94%) and mutton (18.46%). Edible oil and dairy products ranked fourth (17.63 kg/person/y) and fifth (16.13 kg/person/y), respectively. The per capita per year consumption of grains was 1.76 times the national average (97.93 kg higher than the national average). The consumptions of sugar, edible oil, dairy products, and meat products were higher than the national averages, being 2.74, 1.79, 1.32, and 1.05 times the national averages, respectively. The consumptions of pork, poultry, eggs, dried and fresh fruits, and aquatic products were significantly lower than the national averages. The dietary consumption exhibited the overall characteristics of high consumption of grains and livestock products and low consumption of fruits and vegetables (Figure 3).
Urban and rural food consumption levels differed considerably, and the dietary structure in Tibet was remarkably different from the overall situation in China. The urban and rural grain consumptions were 239.07 and 191.50 kg/person/y, respectively, with the urban consumption being 1.25 times the rural consumption. The consumptions of all major categories of foods by rural residents were lower than those by urban residents, except that the consumption of sugar by rural residents was 0.83 kg/person/y higher than for urban residents. In particular, the consumptions of poultry, dried and fresh fruits, eggs, vegetables, and meat products by rural residents were lower than 40% of those by urban residents. The consumptions of edible oil and dairy products by rural residents were only 67.29% and 69.28%, respectively, of those by urban residents. The urban and rural consumptions of grains, edible oil, dairy products, and sugar in Tibet were 1.57 and 1.74 times, 1.57 and 2.38 times, 7.40 and 4.27 times, and 2.73 and 2.29 times the national averages, respectively. The consumptions of vegetables, fruits, and eggs by rural residents in Tibet were 30%, less than 10%, and 21%, respectively, of the national average rural consumptions. The meat consumption by urban residents in Tibet was 1.8 times the national average urban consumption, whereas that by rural residents was only 81% of the national average rural consumption.
Calorie intake differed insignificantly between urban and rural residents, with plant foods being the major source of calories. The per capita calorie intakes of urban and rural residents were 2960 and 2986 kcal, respectively, with the latter being slightly higher than the former. Plant foods were the major source of calorie intake by both urban and rural residents, with grains accounting for the largest share (about 60%), followed by vegetable oil (approximately 14%) and vegetables and confections (merely 4% each). Livestock foods accounted for nearly 18% of the total calorie supply, which were dominated by meat and dairy products, accounting for 10% and 4% of the total, respectively. For rural residents, grains accounted for nearly 75% of the total calorie intake, and vegetable oil accounted for 8%. Livestock foods accounted for approximately 11% of the total calorie intake, which were dominated by animal oil and meat, each accounting for about 4% of the total calorie intake (Figure 4).

4.2. LCC

4.2.1. LCC Based on Grain Demand

In 2000–2019, the grain production in Tibet increased from 962.23 thousand tons to 1047.06 thousand tons, and the LCC gradually increased when estimated against the grain demand. This translates into an increase in the LCC at the basic prosperity standard of living from 2830.10 thousand persons to 3079.57 thousand persons. The LCC in 2019 estimated against the comprehensive moderate prosperity and affluent standards of living was 2617.64 and 2379.67 thousand persons, respectively (Figure 5).
For the LCC in individual cities/prefectures (Figure 6a), at the basic prosperity standard of living, Rikaze City had the highest LCC of 1025 thousand persons in 2000, followed by Lasa City (565 thousand persons), Shannan City (490 thousand persons), Changdu City (465.8 thousand persons), Linzhi City (more than 200 thousand persons), and the two pastoral cities/prefectures of Naqu City (30.7 thousand persons) and Ali Prefecture (17.8 thousand persons). In 2019, the LCC in four cities/prefectures (Lasa City, Shannan City, Naqu City, and Ali Prefecture) decreased to 460.1 thousand, 483.0 thousand, 24.1 thousand, and 14.5 thousand persons, respectively. The LCC in the other three cities/prefectures increased: Rikaze City achieved the highest increase (274.4 thousand persons), followed by Changdu City (90.4 thousand persons) and Linzhi City (10.4 thousand persons).
For the LCC in individual counties, at the basic prosperity standard of living, six counties (Linzhou, Sangzhuzi District, Jiangzi, Lazi, Bailang, and Duilongdeqing District) had a high LCC of above 100 thousand persons in 2000, while the farming–pastoral counties (Yadong, Zhada, Ritu, and Gaer counties) had a low LCC of less than 10 thousand persons because of low grain output. In 2019, the number of counties with an LCC of higher than 100 thousand persons increased to 11, with 5 farming counties (Sangzhuzi District, Jiangzi, Bailang, Lazi, and Gongga) having an LCC in the range of 100–250 thousand persons. However, farming–pastoral counties such as Yadong, Ritu, Zhada, and Gaer, and some municipal districts, still had a low LCC because of low grain output (Figure 7a). For temporal variations, compared with 2000, 41 non-pastoral counties (most located in farming regions) achieved increases in LCC. In particular, Linzhou, Dingqing, Angren, Karuo District, Jiangda, and Bailang achieved an increase of higher than 50 thousand persons. In contrast, municipal districts (including Dazi, Naidong, Chengguan, and Duilongdeqing District) experienced decreases in LCC because of the impact of urbanization.

4.2.2. LCC Based on Calorie Requirement
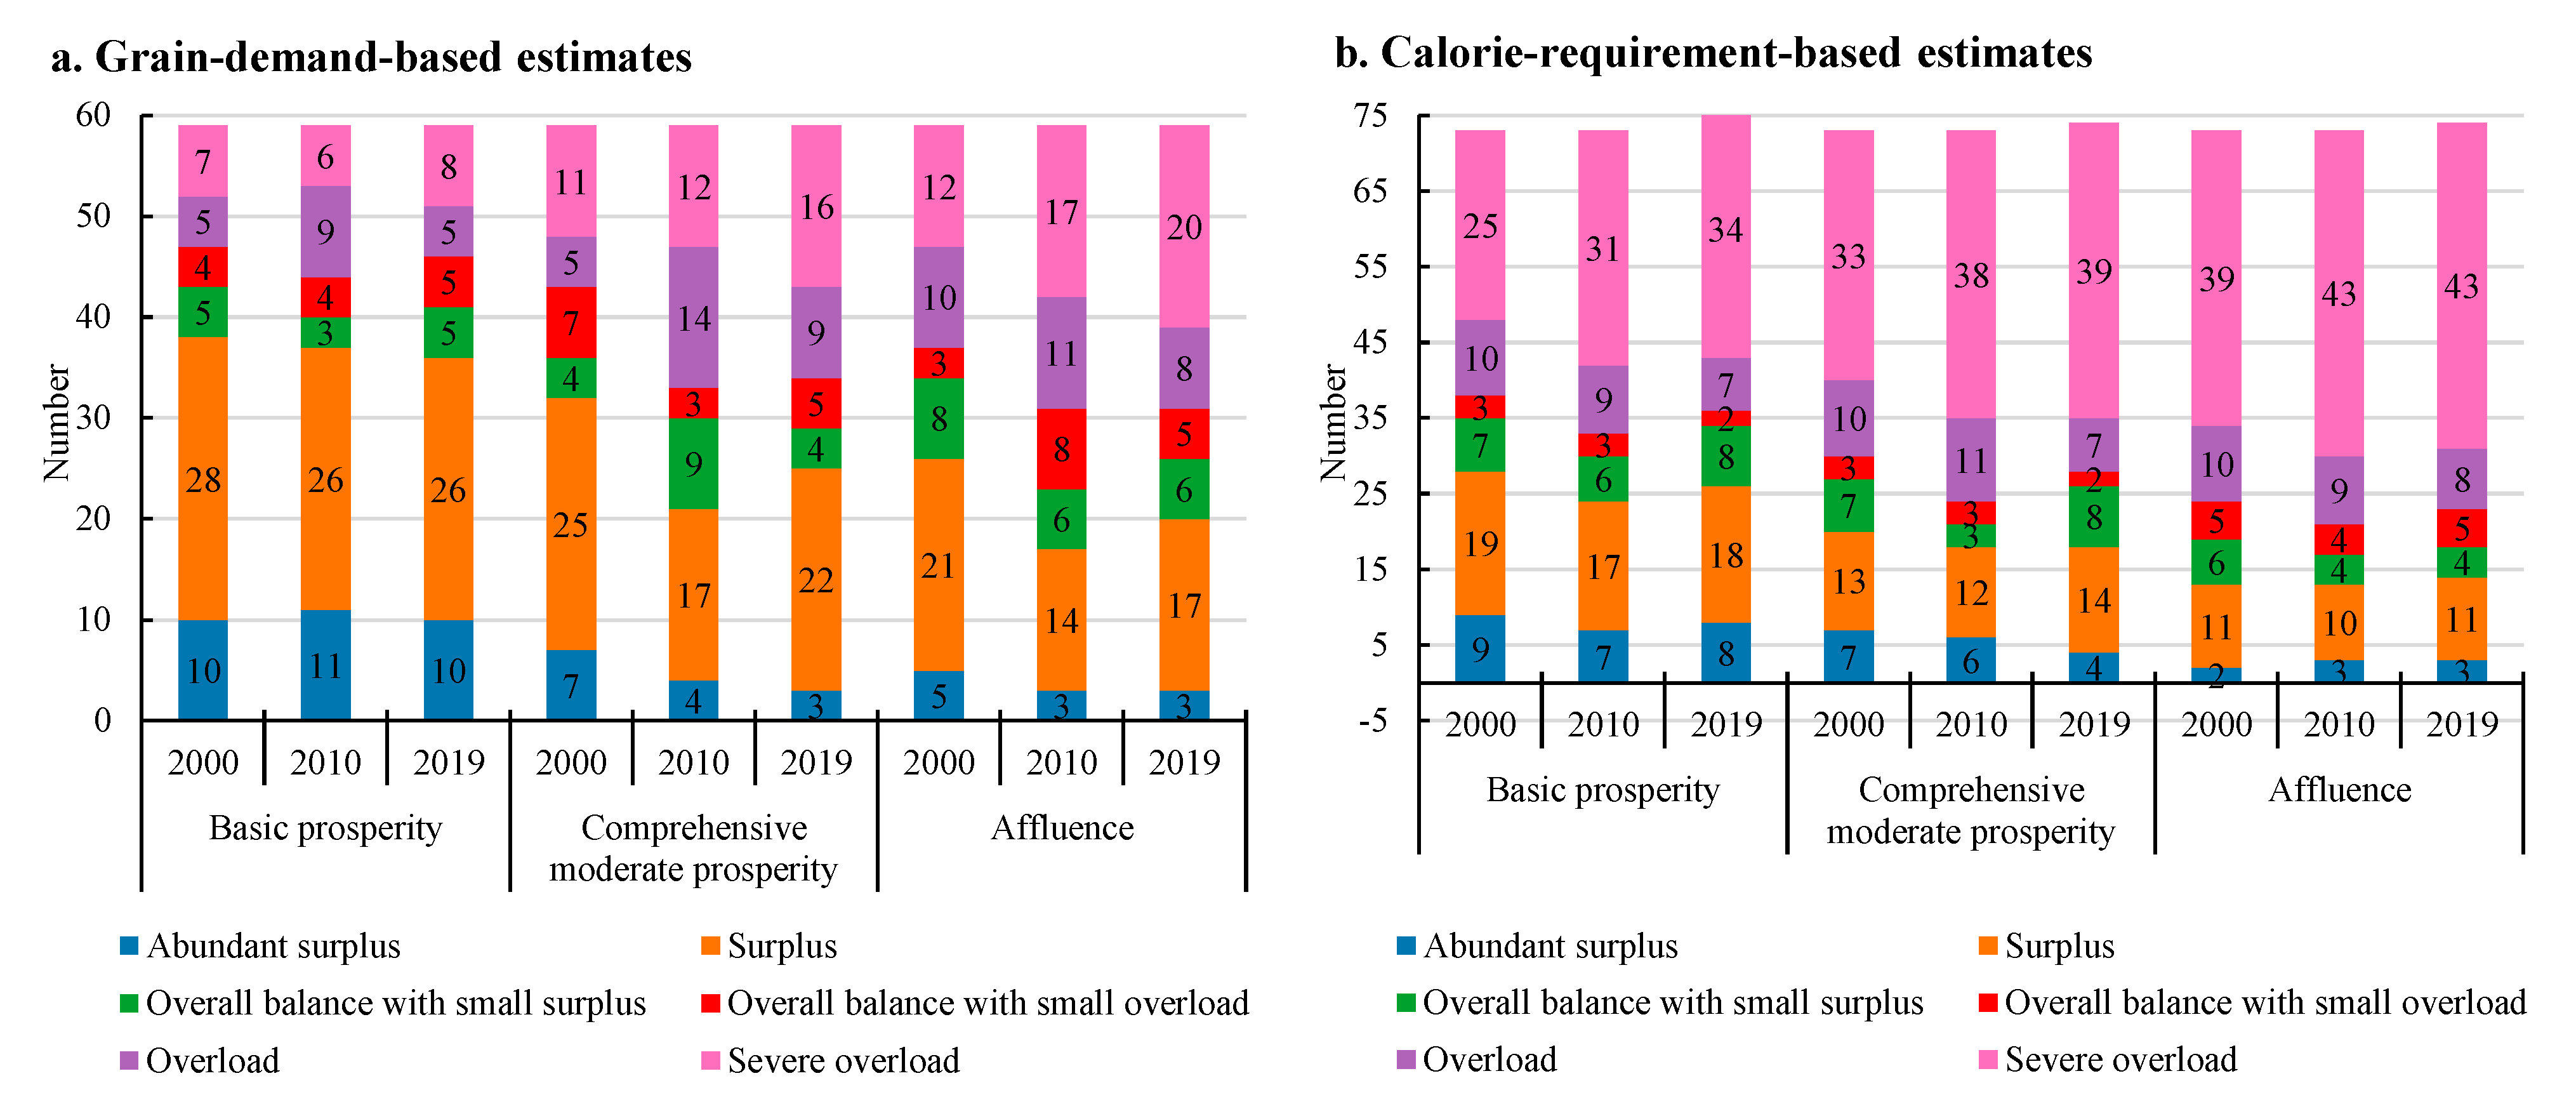
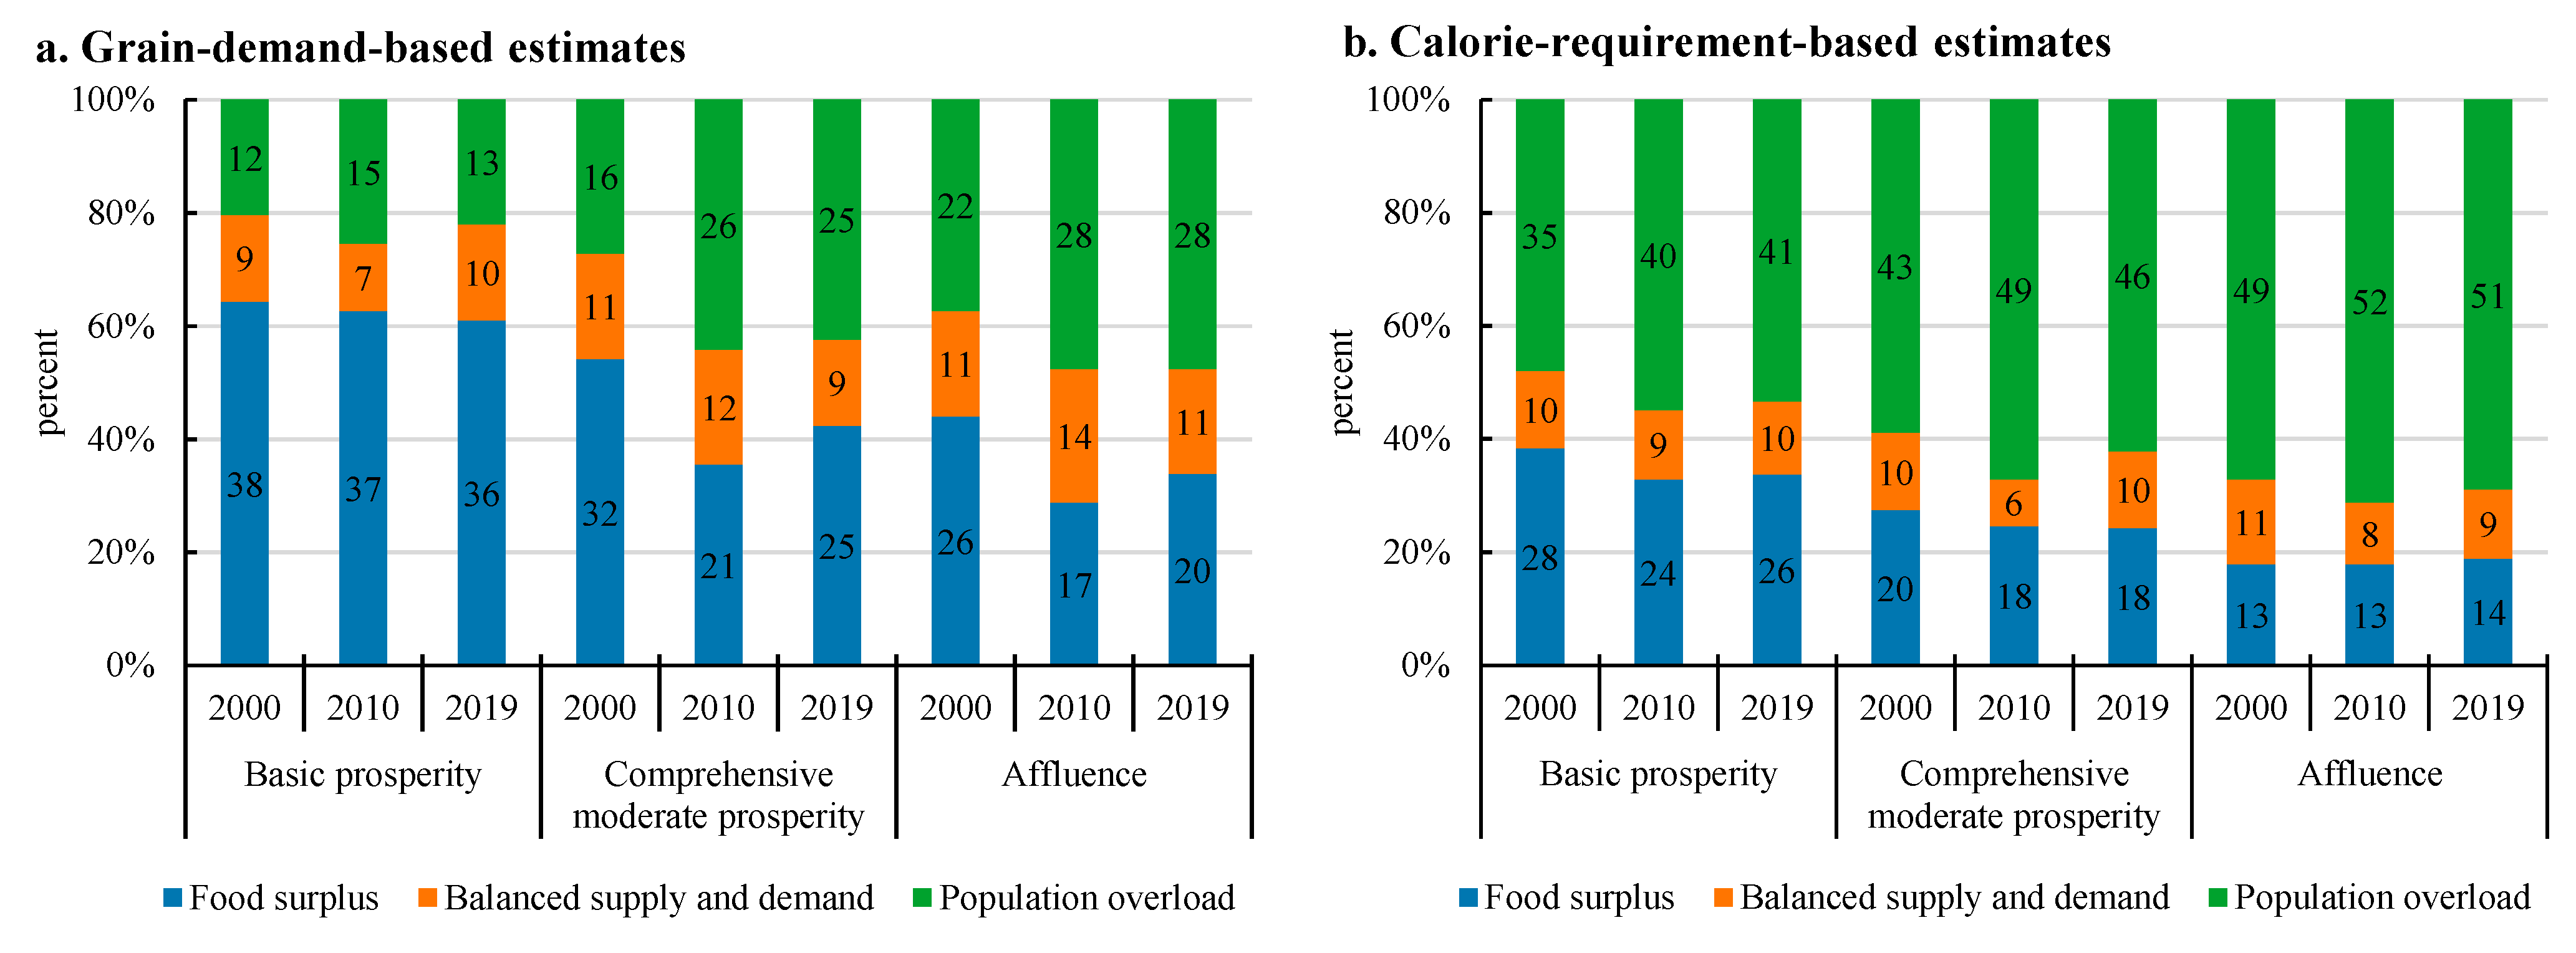
In 2000–2019, the meat output in Tibet increased from 149.30 thousand tons to 277.50 thousand tons, and the milk output increased from 204.00 thousand tons to 466.6 thousand tons, with livestock products being a major source of calorie supply. The calorie supply increased from 2.79 × 10¹² kcal/y to 3.43 × 10¹² kcal/y, and the LCC gradually increased when estimated against the calorie requirement. At the basic prosperity standard of living, the LCC increased from 3184.97 thousand persons to 3913.80 thousand persons. At the comprehensive moderate prosperity and affluent standards of living, the LCC reached 3131.04 and 2683.75 thousand persons, respectively, in 2019 (Figure 8).
For the LCC in individual cities/prefectures, at the basic prosperity standard of living, Rikaze City had the highest LCC (1186.60 thousand persons) in 2000, followed by Lasa City (661.11 thousand persons), Changdu City (491.20 thousand persons), Shannan City (545.88 thousand persons), Linzhi City (204.79 thousand persons), and the two pastoral cities/prefectures of Naqu City (60.89 thousand persons) and Ali Prefecture (26.52 thousand persons). In 2019, the LCC in Rikaze City increased to 1717.97 thousand persons, followed by Lasa City (686.02 thousand persons), Changdu City (617.11 thousand persons), Shannan City (568.13 thousand persons), Lizhi City (212.72 thousand persons), and the two pastoral cities/prefectures of Naqu City (85.81 thousand persons) and Ali Prefecture (28.00 thousand persons). The seven cities/prefectures differed in LCC temporal variations. In particular, Rikaze City enjoyed the largest increase (531.37 thousand persons), followed by Changdu City (125.91 thousand persons). The LCC in Lasa City first increased and then decreased, experiencing an insignificant overall increase during the period. The LCC in Naqu City and Ali Prefectures remained at low levels, with the increases being insignificant (Figure 6b).
For the LCC in individual counties, six farming and farming–pastoral counties (Sangzhuzi District, Linzhou, Lazi, Duilongdeqing District, and Bailang) had a high LCC of above 100 thousand persons in 2000, whereas pastoral counties such as Gaize, Baqing, Cuoqin, Shenzha, and Gaer of Ali Prefecture had a low LCC of less than 10 thousand persons because of limited food output. As of 2019, the spatial pattern of the LCC in individual counties varied insignificantly. The number of counties with an LCC of above 100 thousand persons increased to eight. The counties with a low LCC were mainly concentrated in Ali Prefecture and Naqu City. A total of 23 counties had an LCC of less than 10 thousand persons, including Nierong, Shenzha, Zhada, Baqing, Shuanghu, and Gaer (Figure 7b). Compared with 2000, the LCC increased in 43 counties. The counties with a low LCC were mainly pastoral counties and municipal districts such as Chengguan District.

4.3. LoL

4.3.1. LoL Based on Grain Demand

At the basic prosperity standard of living, the LCCI in Tibet increased from 0.92 to 1.14 in 2000–2019, i.e., the LoL changed from the overall balance with small surplus sub-level to the population overload level, and the population–grain relationship became increasingly strained. At the comprehensive moderate prosperity standard of living, the LCCI fell in the range of 1.08–1.47, i.e., the LoL changed from the overall balance with small overload sub-level to the severe overload sub-level. At the affluent standard of living, the LoL changed from the overload sub-level to the severe overload sub-level (Figure 5).
For LCCI in individual cities/prefectures, at the basic prosperity standard of living, the LCCI in all seven cities/prefectures increased in 2000–2019. In particular, the LCCI in Lasa City increased from 0.71 to 1.57, with the LoL increasing from the surplus sub-level to the severe overload sub-level. The LCCI in Linzhi City increased from 0.63 to 0.99, with the LoL changing from the surplus sub-level to the overall balance with small overload sub-level. The LCCI in Rikaze City fell in the range of 0.59–0.70, and in Shannan City fell in the range of 0.64–0.79, with the LoL remaining at the surplus sub-level. The LCCI in Changdu City fell in the range of 1.17–1.38, with the LoL remaining at the overload sub-level. Naqu City and Ali Prefecture were dominated by pastoral production and experienced a strained population–grain relationship, with the LoL remaining at the severe overload sub-level. The LoL in Lasa City, Changdu City, Naqu City, and Ali Prefecture was at the severe overload sub-level in 2019; the LoL in Linzhi City was at the overload sub-level, with a large load on land resources. The LoL in Shannan and Rikaze Cities was at the overall balance with small surplus and surplus sub-levels, respectively, experiencing a small load on land resources. At the affluent standard of living, only the LoL in Rikaze City was at the surplus sub-level; in Linzhi city it was at the overload sub-level, and in Shannan City it increased to the overall balance with small overload sub-level (Figure 9a).
For the LCCI in individual counties, at the basic prosperity standard of living, the numbers of farming and farming–pastoral counties with an LoL at the food surplus, balanced supply and demand, and population overload levels changed from 38, 9, and 12 in 2000 to 36, 10, and 13 in 2019, respectively, with most counties enjoying a food surplus (Figure 10a). In 2019, the LoL in Chengguan District, Gaer, Biru, Zhada, Suo, Yadong, Duilongdeqing District, and Ritu was at the severe overload sub-level, experiencing a strained population–grain relationship (Figure 7c). The numbers of counties with an LoL at the levels of food surplus, balanced supply and demand, and population overload were 25, 9, and 25, respectively, at the comprehensive moderate prosperity standard of living and 20, 11, and 28, respectively, at the affluent standard of living. Nearly half of the county facing population overloaded (Figure 11a).
Restricted by the limited grain production capacity and rapid population growth rate, the LoL in Tibet is overloaded to varying degrees. It is difficult to meet the food demand of local residents in terms of grain. With the increase in the food demand level in the future, a large amount of grain from inland China will be needed, particularly in the pastoral and farming–pastoral counties, as well as in municipal districts with a high urbanization rate. At the same time, the LOL in Shannan City and Rikaze City is relatively low. There is a certain grain surplus, which is an important grain supply base for Tibet.

4.3.2. LoL Based on Calorie Requirement

At the basic prosperity standard of living, the LCCI in Tibet increased from 0.82 to 0.90 in 2000–2019, with the LoL changing from the surplus sub-level to the overall balance with small surplus sub-level, but remaining low. At the comprehensive moderate prosperity standard of living, the LCCI fell in the range of 1.02–1.12, with the LoL always remaining at the overall balance with small overload sub-level. At the affluent standard of living, the LoL always remained at the overload sub-level (Figure 8).
For the LoL in individual cities/prefectures, at the basic prosperity standard of living, the LCCI in Rikaze City decreased slightly, but the LCCI in the other six cities/prefectures increased by different degrees in 2000–2019. In particular, the LCCI in Ali Prefecture increased from 2.79 to 3.99, with the LoL always remaining at the severe overload sub-level and continuing to increase. The LCCI in Lasa City increased from 0.61 to 1.05, with the LoL changing from the surplus sub-level to the overall balance with small overload sub-level. The LCCI in Linzhi City increased from 0.7 to 1.12, with the LoL changing from the surplus sub-level to the overall balance with small overload sub-level. The LCCI in the other four cities/prefectures varied insignificantly. In 2019, the LoL in Rikaze and Shannan cities was at the abundant surplus and surplus sub-levels, respectively, and the LoL in Changdu and Naqu cities was at the overload and severe overload sub-levels, respectively. For the LCCI in individual cities/prefectures in 2019 estimated against different standards of living, the LoL estimated against the comprehensive moderate prosperity standard of living in Naqu City and Ali Prefecture was at the severe overload sub-level, in Lasa, Changdu, and Linzhi cities was at the overload sub-level, and in Rikaze and Shannan cities was at the surplus sub-level. At the affluent standard of living, the LoL in Rikaze and Shannan cities was at the surplus and overall balance with small surplus sub-levels, respectively, and in the other five cities/prefectures was at the severe overload sub-level (Figure 9b).
For the LoL in individual counties, at the basic prosperity standard of living, the numbers of counties with an LoL at the food surplus, balanced supply and demand, and population overload levels increased from 28, 10, and 35 in 2000 to 26, 10, and 41 in 2019, respectively. The major characteristic of the temporal variations during this period is the increased number of overloaded counties (Figure 10b). In 2019, the number of severely overloaded counties reached 34, mainly consisting of pastoral (15) and farming–pastoral (14) counties. The 21 counties with surplus land resources were mainly farming counties and also included five farming–pastoral counties (Linzhou, Kangma, Qusong, Angren, and Xietongmen) (Figure 7d). In 2019, the numbers of counties with an LoL at the food surplus, balanced supply and demand, and population overload levels were 18, 10, and 46, respectively, at the comprehensive moderate prosperity standard of living, and 14, 9, and 51, respectively, at the affluent standard of living, with nearly 70% of the counties experiencing population overload and a large LoL (Figure 11b).
The LCC in Tibet has increased after considering the supplementation of foods other than grains. As we are aware, the calorie content of non-grain food per unit mass is lower than grain. Compared with grain demand, the spatial difference of LoL is more obvious than when estimated against the calorie requirement. In Tibet, where grassland is the main land use (about 70% of the land area), beef and mutton meat and milk play an important role in calorie supply, especially in pastoral counties. The unique land use and animal husbandry-based production activities determine the animal-based food supply mode in pastoral counties, and the total calorie value of the food supply is low. Therefore, the LCC is low in pastoral counties, and the LoL is relatively large. These counties face the pressure of population overload, and the amount of extraterritorial food, especially grain, is required. On the contrary, after considering other food (no grains), farming counties have improved calorie supply capacity, which is mainly characterized by food surplus. For municipal districts, the population overload is mainly caused by the huge permanent resident population.

5. Conclusions and Discussion

Based on an analysis of the characteristics of farming and pastoral production, the regional differences in Tibet, and of the dietary structure of Tibetan residents, the spatio-temporal patterns of the LCC in Tibet in 2000–2019 were assessed quantitatively at three different spatial scales (i.e., provinces, cities/prefectures and counties) based on the grain demands and calorie requirements at three different standards of living (i.e., basic prosperity, comprehensive moderate prosperity, and affluence) using a food–calorie conversion model and an LCC model. The major contributions of the present study were as follows. (1) Based on the comparative analyses, the dietary consumption characteristics and calorie intake levels in Tibet were summarized. (2) The LCC in Tibet was estimated based on both grain consumption and calorie requirements, and the spatio-temporal patterns of the LCC were analyzed. (3) The spatial patterns of the LoL in Tibet were analyzed against different standards of living.
The results revealed the following. (1) The dietary structure in Tibet is characterized by the high consumption of grains and livestock products and low consumption of fruits and vegetables, with the per capita grain consumption being 1.76 times the national average. The food consumption pattern is the reflection of Tibet’s social and economic development stage and its unique food production structure. According to Bennett’s law [41,42], with the income increasing, the consumption of starchy staple food (cereals, roots and tubers) will decrease relatively, and the consumption of high-nutrition food (livestock products, fruits and vegetables, etc.) will increase. For Tibet, the relatively lagging level of socioeconomic development has resulted in grain-based food consumption. Animal husbandry-based agricultural production activities lead to high meat consumption and relatively low fruit and vegetable consumption. The urban and rural dietary consumption levels differ remarkably. The consumptions of grains and sugar by rural residents are higher than those by urban residents, whereas the consumptions of most other foods by rural residents are less than 40% of those by urban residents, and are significantly lower than the national average rural consumptions. The urban and rural calorie intake levels differ insignificantly, with both being approximately 3000 kcal/person/d. Plant foods are the major source of calorie intake, with grains accounting for a high proportion of calorie intake by urban (60%) and rural (75%) residents.
(2) The LCC in Tibet has been improving and is generally sustained at the balanced supply and demand level. At the basic prosperity standard of living, the grain demand-based LCC in Tibet increased to 3079.6 thousand persons in 2019, and the calorie requirement-based LCC (also considering livestock products and other foods) increased to 3913.8 thousand persons. With increasing population growth, the grain demand-based LCCI and calorie requirement-based LCCI have increased, but remained at approximately 1.0, with the LoL being at the overall balance with small overload and overall balance with small surplus sub-levels, respectively. The LoL estimated against the comprehensive moderate prosperity and affluent standards of living is at the overall balance with small overload and severe overload sub-levels, respectively, indicating an off-balance, strained food supply–demand relationship.
(3) The temporal variations in LCC differ between the cities/prefectures in Tibet, and there are significant spatial differences, with the LoL in some areas being at the severe overload sub-level. Since 2000, the grain demand-based LCC in Lasa City, Shannan City, Naqu City, and Ali Prefecture has decreased at different degrees. Overall, at the basic prosperity standard of living, the LCC in Rikaze City fell in the range of 1000–1700 thousand persons, the LCC in Lasa, Changdu, and Shannan Cities fell in the range of 450–700 thousand persons, the LCC in Linzhi City fell to 200 thousand persons, and the LCC in the two pastoral cities/prefectures of Naqu City and Ali Prefecture is at a low level of below 100 thousand persons. The LCCI in all seven cities/prefectures has increased with the population growth. Rikaze and Shannan cities have exhibited a relatively eased calorie supply–demand relationship, and the other five cities/prefectures have exhibited population overload to different degrees.
(4) More than half of the counties experienced increases in the LCC. Most farming and farming–pastoral counties exhibited a basically balanced population–grain relationship; however, nearly half of the counties exhibited a strained calorie supply–demand relationship. Since 2000, the grain demand-based LCC in 41 of the 59 farming and farming–pastoral counties has increased, with the high-LCC counties concentrated mainly in the YNL area. At the basic prosperity standard of living, the number of counties with grain surplus has decreased slightly; however, 60% of the counties have a grain surplus of different degrees. At the comprehensive moderate prosperity and affluent standards of living, nearly half of the counties have exhibited a strained population–grain relationship. The calorie requirement-based LCC in 43 of the 74 counties has increased, with the low-LCC counties being mainly pastoral counties and municipal districts. At the basic prosperity standard of living, the number of counties with an off-balance, strained calorie supply–demand relationship has increased, with approximately 55% of the counties exhibiting population overload of different degrees. At the comprehensive moderate prosperity and affluent standards of living, more than 60% of the counties have exhibited a strained food supply–demand relationship and an increased LoL.
The LCC in Tibet exhibits the characteristic of “overall balance with local overloads and increasing tensions”. The counties experiencing population overload include municipal districts with high urbanization levels, and most pastoral counties. These counties/districts have a high population density or a simple agricultural production structure, thus experiencing a low level of self-sufficiency in terms of calorie supply. For pastoral counties dominated by livestock product production, the LCC is low because of the low calorie volume produced by a unit of land resources, resulting in an off-balance, strained calorie supply–demand relationship. Therefore, ensuring stable, effective food imports is an important option for alleviating the LoL in these municipal districts and pastoral counties.
The results of the LCC in this study are lower than those of Hao et al. [30]. This difference is mainly on the calorie supply side, and we use more detailed parameters. The calorie coefficient of grain is mainly calculated based on the proportion of highland barley, wheat, and rice (mainly highland barley). Meat and dairy are also refined into subcategories. Such coefficients make the results more accurate, because the calorie per unit of pork is 3.16 times that of beef and 1.95 times that of lamb. In a previous study [30], 391.5 kcal/kg was used for the calorie content of meat. We also consider both the feedstuff coefficient in relation to pork meat production and the edible portion of the food, so our study is closer to the actual calorie supply level in Tibet. This difference is also reflected in the consumption side. As we explained in the data processing, this study combines the consumption data of fine class foods (43 kinds), so the calorie intake level is also lower than the results of Wang et al. [29].
It should be noted that agricultural production activities and food consumption in Tibet are unique. In terms of social economy, Tibet is still underdeveloped compared with the whole country. However, as Tibet has historically achieved comprehensive poverty alleviation, the income of residents, regional transportation conditions, and agricultural/animal husbandry production conditions have been greatly improved. On the other hand, with the change of social environment, the scope and frequency of cultural exchanges between agricultural and pastoral areas, Tibet, and inland China have increased, and the food consumption structure and demands of residents have also changed with those exchanges [43]. All of these factors will promote the development of the local food consumption structure as well as the food consumption structure on a larger geographical scale [44,45].
The demands for vegetables, fruits, and other plant foods in Tibet are expected to increase in the future because of the unique agricultural production and food consumption structures, and the fact that Tibet is still socioeconomically underdeveloped and is undergoing transformations in dietary consumption structure [46]. In 2000–2019, the ratio of the sown area of vegetables and fruits to the sown area of all crops in Tibet increased from 3% to 10%. Because of the impact of policies on pastoral production, the ratio of the sown area of green fodders increased from 2% to 14%, whereas that of grain crops decreased from 87% to 68%. The changes in consumption demand and policies on pastoral development have brought new pressure on the grain production in Tibet and posed a new challenge to the grain supply security.
The limitations and future research of the study are as follows. (1) Because of the availability of limited statistical data, the measurement of the food supply did not include poultry, eggs, or aquatic products. In addition, the present study was based on the current productivity (food output) of land resources, without considering the potential improvement in land productivity. On the consumption side, more in-depth analysis of the trends of food consumption in Tibet is necessary. (2) In fact, supply and demand are two inseparable aspects of LCC and food security. An in-depth analysis of the future consumption demands for foods, especially plant foods, in Tibet will be conducted as the next step, so that the pressure posed by population growth and dietary consumption variations on land resources can be understood systematically. On the production side, the potential for improving the productivity of highland barley and other major grain crops can be investigated further [47] so that the upper limit of the local food supply can be analyzed, thus providing a basis for assessing the food supply–demand balance in Tibet. (3) Another future research direction is the scientific planning of the development of crop farming and animal husbandry, and fine-tuning of the ratio of grain crop to non-grain crop farming, in order to realize the sustainable development of farming and pastoral production and coordinate the ecological and economic benefits with food security based on a scientific understanding of the upper limit of the LCC. Investigating the food production–consumption and LCC of other regions belonging to the QTP (such as Nepal and the Qinghai province of China), and conducting horizontal comparisons to propose the third-pole dimension of food security and land use sustainability policy on a larger scale, would be meaningful.

Author Contributions

C.Z. wrote the manuscript text and contributed to the graphics; Y.Y., C.X., Z.Y. and X.S. contributed to the revision of the methods, data processing, results, and discussion of the manuscript. All authors have read and agreed to the published version of the manuscript.

Funding

This research was funded by the Second Tibetan Plateau Scientific Expedition and Research Program (STEP) (Grant No. 2019QZKK1006), the National Natural Science Foundation of China (Grant No. 42130508), and the Chinese Academy of Sciences (Grant No. ZDRW-XH-2021-3).

Institutional Review Board Statement

Not available.

Informed Consent Statement

Informed consent was obtained from all subjects involved in the study.

Data Availability Statement

The data presented in this study are available on request to authors.

Conflicts of Interest

The authors declare no conflict of interest.

References

  1. Feng, Z.M.; Li, P. The genesis and evolution of the concept of carrying capacity: A view of natural resources and environment. J. Nat. Resour. 2018, 33, 1475–1489. (In Chinese) [Google Scholar]
  2. Feng, Z.M.; Yang, Y.Z.; Yan, H.M.; Pan, T.; Li, P. A review of resources and environment carrying capacity research since the 20th Century: From theory to practice. Resour. Sci. 2017, 39, 379–395. (In Chinese) [Google Scholar]
  3. World Resources Institute. Millennium Ecosystem Assessment. In Ecosystem and Human Well-Being: Biodiversity Synthesis; World Resources Institute: Washington, DC, USA, 2005. [Google Scholar]
  4. Imhoff, M.; Bounoua, L.; Ricketts, T.; Loucks, C.; Harriss, R.; Lawrence, W.T. Global patterns in human consumption of net primary production. Nature 2004, 429, 870–873. [Google Scholar] [CrossRef] [Green Version]
  5. Vasileska, A.; Rechkoska, G. Global and Regional Food Consumption Patterns and Trends. Procedia Soc. Behav. 2012, 44, 363–369. [Google Scholar] [CrossRef] [Green Version]
  6. Niu, F.Q.; Feng, Z.M.; Liu, H. A review on evaluating methods of regional resources and environment carrying capacity. Resour. Sci. 2018, 40, 655–663. (In Chinese) [Google Scholar]
  7. Wang, S.Z.; Liu, F.G.; Zhou, Q.; Chen, Q.; Liu, F. Simulation and estimation of future ecological risk on the Qinghai-Tibet Plateau. Sci. Rep. 2021, 11, 17603. [Google Scholar] [CrossRef] [PubMed]
  8. Wang, L.; Xiao, Y.; Ouyang, Z. Food and Grain Consumption Per Capita in the Qinghai–Tibet Plateau and Implications for Conservation. Nutrients 2021, 13, 3742. [Google Scholar] [CrossRef]
  9. Xi, J.P. Congratulatory letter from Xi Jinping to the Research Group of the Qinghai-Tibet Plateau Comprehensive Scientific Research Institute of the Chinese Academy of Sciences. Bull. Chin. Acad. Sci. 2017, 32, 914. (In Chinese) [Google Scholar]
  10. Park, R.F.; Burgoss, E.W. An Introduction to the Science of Sociology; The University of Chicago Press: Chicago, IL, USA, 1921. [Google Scholar]
  11. Wang, Q.; Yue, T.X.; Wang, C.L.; Fan, Z.M.; Liu, X.H. Spatial-temporal variations of food provision in China. Procedia Environ. Sci. 2012, 13, 1933–1945. [Google Scholar] [CrossRef] [Green Version]
  12. Yue, T.X.; Tian, Y.Z.; Liu, J.Y.; Fan, Z.M. Surface modeling of human carrying capacity of terrestrial ecosystems in China. Ecol. Model. 2008, 214, 168–180. [Google Scholar] [CrossRef]
  13. Du, S.F.; Lu, B.; Zhai, F.Y.; Poplin, B.M. A new stage of the nutrition transition in China. Public Health Nutr. 2002, 5, 169–174. [Google Scholar] [CrossRef] [PubMed] [Green Version]
  14. Zhai, F.Y.; Wang, H.J.; Du, S.F.; He, Y.N.; Wang, Z.H.; Ge, K.Y.; Popkin, B.M. Prospective study on nutrition transition in China. Nutr. Rev. 2009, 67, S56–S61. [Google Scholar] [CrossRef] [PubMed]
  15. Shepon, A.; Eshel, G.; Noor, E.; Milo, R. Energy and protein feed-to-food conversion efficiencies in the US and potential food security gains from dietary changes. Environ. Res. Lett. 2016, 11, 105002. [Google Scholar] [CrossRef]
  16. Gerbens-Leenes, P.W.; Nonhebel, S.; Krol, M.S. Food consumption patterns and economic growth. Increasing affluence and the use of natural resources. Appetite 2010, 55, 597–608. [Google Scholar] [CrossRef]
  17. Peters, C.J.; Wilkins, J.L.; Fick, G.W. Testing a complete-diet model for estimating the land resource requirements of food consumption and agricultural carrying capacity: The New York State example. Renew. Agric. Food Syst. 2007, 22, 145–153. [Google Scholar] [CrossRef] [Green Version]
  18. Peters, C.J.; Picardy, J.; Darrouzet-Nardi, A.F.; Wilkins, J.L.; Timothy, S.G.; Fick, G.W. Carrying capacity of U.S. agricultural land: Ten diet scenarios. Elem. Sci. Anthr. 2016, 4, 000116. [Google Scholar] [CrossRef] [Green Version]
  19. Gao, J.; Liu, Y.J.; Feng, Z.M.; Pan, T.; Yang, Y.Z.; Zhang, H. Research on monitoring and early warning of land and water resources carrying capacity in the Tibet Autonomous Region. Resour. Sci. 2018, 40, 1209–1221. (In Chinese) [Google Scholar]
  20. Du, W.P.; Yan, H.M.; Feng, Z.M.; Yang, Y.Z.; Chen, R.X. Ecological carrying capacity in the China-Nepal corridor based on supply-consumption relationship. Acta Ecol. Sin. 2020, 40, 6445–6458. (In Chinese) [Google Scholar]
  21. Fang, Y.P.; Zhu, F.B.; Yi, S.H.; Qiu, X.P.; Ding, Y.J. Ecological carrying capacity of alpine grassland in the Qinghai–Tibet Plateau based on the structural dynamics method. Environ. Dev. Sustain. 2021, 23, 12550–12578. [Google Scholar] [CrossRef]
  22. Niu, F.Q.; Yang, X.Y.; Zhang, X.P. Application of an evaluation method of resource and environment carrying capacity in the adjustment of industrial structure in Tibet. J. Geogr. Sci. 2020, 30, 319–332. [Google Scholar] [CrossRef]
  23. Wang, L.; Liu, H. Quantitative evaluation of Tibet’s resource and environmental carrying capacity. J. Mt. Sci. 2019, 16, 1702–1714. [Google Scholar] [CrossRef]
  24. Feng, Z.M.; You, Z.; Yang, Y.Z.; Shi, H. Comprehensive evaluation of resource and environment carrying capacity of Tibet based on a three-dimensional tetrahedron model. Acta Geogr. Sin. 2021, 76, 645–662. (In Chinese) [Google Scholar]
  25. The Research Group of China’s Productivity of Land Resource and Its Population Carrying Capacity. China’s Productivity of Land Resource and Its Population Carrying Capacity; China Renmin University Press: Beijing, China, 1991. (In Chinese) [Google Scholar]
  26. Shang, J.L. The land carrying capacity research of the Tibet. Tibet. Stud. 1989, 9, 5–15. (In Chinese) [Google Scholar]
  27. Liu, Y.H. Land System in Mid-Reach Area of Yarlung Zangbo River in Tibet; Science Press: Beijing, China, 1992. (In Chinese) [Google Scholar]
  28. Zeng, J.Q. Prospect on the population carrying capacity of resource in Tibet from1985 to 2005. Southwest China J. Agric. Sci. 2007, 20, 843–849. (In Chinese) [Google Scholar]
  29. Wang, W.; Yan, H.M.; Yang, Y.Z.; Du, W.P. Evaluation of land resources carrying capacity of Tibetan counties based on dietary nutritional demand. J. Nat. Resour. 2019, 34, 921–933. (In Chinese) [Google Scholar] [CrossRef]
  30. Hao, Q.; Feng, Z.M.; Yang, Y.Z.; Zhu, H. Evaluation on land carrying capacity of Tibet based on dietary nutrients: Present and prospects. J. Nat. Resour. 2019, 34, 911–920. (In Chinese) [Google Scholar]
  31. Yan, J.Z.; Wu, Y.Y.; Zhang, Y.L.; Zhou, S.B. Livelihood diversification of farmers and nomads of eastern transect in Tibetan Plateau. J. Geogr. Sci. 2010, 20, 757–770. [Google Scholar] [CrossRef]
  32. Sun, J.; Fu, B.; Zhao, W.; Liu, S.; Liu, G.; Zhou, H.; Chen, Y.; Zhang, Y.; Deng, Y. Optimizing grazing exclusion practices to achieve Goal 15 of the sustainable development goals in the Tibetan Plateau. Sci. Bull. 2021, 66, 1493–1496. [Google Scholar] [CrossRef]
  33. Sun, J.; Liu, M.; Fu, B.J.; Kemp, D.; Zhao, W.W.; Liu, G.H.; Han, G.D.; Wilkes, A.; Lu, X.; Chen, Y.; et al. Reconsidering the efficiency of grazing exclusion using fences on the Tibetan Plateau. Sci. Bull. 2020, 65, 1405–1414. [Google Scholar] [CrossRef]
  34. Laborde, D.; Herforth, A.; Headey, D.; Pee, S.D. COVID-19 pandemic leads to greater depth of unaffordability of healthy and nutrient-adequate diets in low- and middle-income countries. Nat. Food 2021, 2, 473–475. [Google Scholar] [CrossRef]
  35. Duan, J.; Xu, Y.; Sun, X.Y. Spatial patterns and their changes of grain production, grain consumption and grain security in the Tibetan Plateau. J. Nat. Resour. 2019, 34, 673–688. (In Chinese) [Google Scholar] [CrossRef]
  36. National Institute of Nutrition and Food Safety. China CDC. China Food Composition, 2nd ed.; Peking University Medical Press: Beijing, China, 2009. (In Chinese) [Google Scholar]
  37. Gao, L.W.; Xu, Z.R.; Cheng, S.Q.; Xu, S.W.; Zhang, X.Z.; Yu, C.Q.; Sun, W.; Wu, J.X.; Qu, Y.H.; Ma, J. Arable land requirements related food consumption pattern—A case study in Lhasa, Xigaze and Shannan region of rural Tibet. J. Nat. Resour. 2017, 32, 12–14. (In Chinese) [Google Scholar]
  38. Gustavsson, J.; Cederberg, C.; Sonesson, U.; Emanuelsson, A. Global Food Losses and Food Waste—Extent, Causes and Prevention; FAO: Rome, Italy, 2011. [Google Scholar]
  39. Gao, J.; Gai, A.H. Preliminary research on monitoring and early warning of grassland resources carrying capacity in the Tibet Autonomous Region. China Collect. Econ. 2018, 33, 99–101. (In Chinese) [Google Scholar]
  40. Yang, J.; Huang, X. The 30 m annual land cover dataset and its dynamics in China from 1990 to 2019. Earth Syst. Sci. Data 2021, 13, 3907–3925. [Google Scholar] [CrossRef]
  41. Benntt, M.K. International contrasts in food consumption. Geogr. Rev. 1941, 31, 365–376. [Google Scholar] [CrossRef]
  42. Leathers, H.D.; Foster, P. The World Food Problem: Toward Understanding and Ending Undernutrition in the Developing World; Lynn Rienner Publishers: Boulder, CO, USA, 2017. [Google Scholar]
  43. Liu, T.P.; Ga, Z.; Ba, D. A preliminary study on the causes and changes of Tibetan diet consumption. Consum. Econ. 2011, 27, 31–34. (In Chinese) [Google Scholar]
  44. Csutora, M.; Vetőné, M.Z. Consumer income and its relation to sustainable food consumption- obstacle or opportunity? J. Sust. Dev. World. 2014, 21, 512–518. [Google Scholar] [CrossRef]
  45. Zheng, Z.; Henneberry, S.R. The impact of changes in income distribution on current and future food demand in urban China. J. Agr. Resour. Econ. 2010, 35, 51–71. [Google Scholar]
  46. Wang, L.E.; Guo, J.X.; Feng, L.; Luo, Y.H.; Zhang, X.Z.; Fan, Y.Z.; Cheng, S.Q. The structure and characteristics of resident food consumption in rural areas of the Tibetan Plateau: Taking Three-Rivers Region in Tibet as an example. Acta Geogr. Sin. 2021, 76, 2104–2117. (In Chinese) [Google Scholar]
  47. Jia, K.; Yang, Y.Z.; Dong, G.L.; Zhang, C.; Lang, T.T. Variation and determining factor of winter wheat water requirements under climate change. Agric. Water Manag. 2021, 254, 106967. [Google Scholar] [CrossRef]
Figure 1. Study framework and approach.
Land 11 00380 g001
Figure 2. Land use map of Tibet in 2019 [40].
Land 11 00380 g002
Figure 3. Consumptions of major categories of foods in Tibet vs. China. Note: China refers to the average level of the whole of China, while Tibet refers to the average level of Tibet.
Land 11 00380 g003
Figure 4. Composition of the sources of calorie intake by (a) rural and (b) urban residents in Tibet. Note: in the part of food consumption, meat products include pork, beef, mutton meat; poultry meat includes chicken, duck, and goose meat.
Land 11 00380 g004
Figure 5. LCC and LCCI in Tibet estimated against grain demands at different standards of living. Note: CLCC340, CLCC400, and CLCC450 indicate the LCC estimated against the three grain demand levels of 340, 400, and 450 kg, respectively, and CLCCI340, CLCCI400, and CLCCI450 indicate the LCCI estimated against the three grain demand levels, respectively.
Land 11 00380 g005
Figure 6. LCC in individual cities/prefectures estimated against the grain demands (a) and calorie requirements (b) at the basic prosperity standard of living.
Land 11 00380 g006
Figure 7. Spatial pattern of LCC and LoL in Tibet estimated against the basic prosperity standard of living in 2019.
Land 11 00380 g007
Figure 8. LCC and LCCI in Tibet estimated against the calorie requirements at different standards of living. Note: ELCC2400, ELCC3000, and ELCC3500 indicate the LCC estimated against the three calorie intake levels of 2400, 3000, and 3500 kcal, respectively, and ELCCI2400, ELCCI3000, and ELCCI3500 indicate the LCCI estimated against the three different calorie intake levels, respectively.
Land 11 00380 g008
Figure 9. LoL in individual cities/prefectures estimated against the grain demands (a) and calorie requirement (b) at the basic prosperity standard of living. Note: the food production in Naqu City and Ali Prefecture is mainly beef, mutton and milk, with limited grain output, and the LoL estimated against the grain demands is above 10 and 4, respectively. Not shown in figure (a).
Land 11 00380 g009
Figure 10. LoL in individual counties estimated against the grain demand (a) and calorie requirements (b) at different standards of living. Note: the label on the columns is the number of counties.
Land 11 00380 g010
Figure 11. Percentage of LoL level in individual counties estimated against the grain demand (a) and calorie requirements (b) at different standards of living. Note: the label on the columns is the number of counties.
Land 11 00380 g011
Table 1. Food–calorie conversion parameters for major categories of foods.
FoodsCalorie Coefficient
(kcal/100 g)
Edibility
Coefficient
Waste Coefficient
(%)
Feedstuff
Coefficient
Rice3470.7810/
Wheat3390.8510/
Highland barley3420.8510/
Beans3900.94/
Roots and tubes770.8515/
Rapeseed8990.44/
Peanut8990.454/
Vegetables730.8515/
Apple540.7615/
Pear500.8215/
Pork395162.53
Beef125160.28
Mutton203160.28
Cow milk5411.50.1
Sheep milk5911.50.1
Table 2. Grain demand and calorie requirement levels in Tibet at different standards of living.
Standard of LivingGrain (kg/person/y)Calories (kcal/person/y)
Basic prosperity3402400
Comprehensive moderate prosperity4003000
Affluence4403500
Table 3. Classification of LoL levels and sub-levels according to the value of LCCI.
LoL LevelLoL Sub-LevelLCCI Value Range
Food surplusAbundant surplus≤0.5
Surplus0.5–0.875
Balanced supply and demandOverall balance with small surplus0.875–1.0
Overall balance with small overload1.0–1.125
Population overloadOverload1.125–1.5
Severe overload>1.5
Table 4. Classification of Tibetan counties.
TypeQuantityName
Farming county/district35Chengguan*, Duilongdeqing*, Dazi*, Nimu, Qushui, Mozhugongka, Sangzhuzi, Nanmulin, Jiangzi, Dingri, Sajia, Lazi, Bailang, Renbu, Dingjie, Jilong, Nielamu, Zuogong, Mangkang, Luolong, Bianba, Bayi, Milin, Motuo, Bomi, Chayu, Lang, Naidong*, Zhanang, Gongga, Sangri, Qiongjie, Luozha, Jiacha, Longzi
Pastoral county/district15Dangxiong, Zhongba, Saga, Seni*, Jiali, Nierong, Anduo, Shenzha, Bange, Baqing, Nima, Shuanghu, Geji, Gaize, Cuoqin
Farming–pastoral county/district24Linzhou, Angren, Xietongmen, Kangma, Yadong, Gangba, Karuo*, Jiangda, Gongjue, Leiwuqi, Dingqing, Chaya, Basu, Gongbujiangda, Qusong, Cuomei, Cuona, Langkazi, Biru, Suo, Pulan, Zhada, Gaer, Ritu
Counties/district in the Yarlung Zangbo River—Nyangqu River—Lhasa River (YNL) development area18Chengguan*, Duilongdeqing*, Dazi*, Linzhou, Nimu, Qushui, Mozhugongka, Sangzhuzi, Nanmulin, Jiangzi, Lazi, Xietongmen, Bailang, Naidong, Zhanang, Gongga, Sangri, Qiongjie
Note: Regions with a * are urban areas (districts) and regions without a * are counties, according to China’s differentiation criteria between counties and urban areas.
Publisher’s Note: MDPI stays neutral with regard to jurisdictional claims in published maps and institutional affiliations.

