Article

Optimization of Reclamation Measures in a Mining Area by Analysis of Variations in Soil Nutrient Grades under Different Types of Land Usage—A Case Study of Pingshuo Coal Mine, China

1
College of Resources and Environment, Shanxi Agricultural University, Jinzhong 030801, China
2
School of Land Science and Technology, China University of Geosciences Beijing, Beijing 100083, China
3
Key Laboratory of Land Consolidation and Rehabilitation, Ministry of Natural Resources, Beijing 100035, China
4
Technology Innovation Center for Ecological Restoration in Mining Areas, Ministry of Natural Resources, Beijing 100083, China
*
Author to whom correspondence should be addressed.
Land 2022, 11(3), 321; https://doi.org/10.3390/land11030321
Submission received: 22 January 2022 / Revised: 18 February 2022 / Accepted: 20 February 2022 / Published: 22 February 2022
(This article belongs to the Section Land Environmental and Policy Impact Assessment)

Abstract

:
The development of reclaimed mine soils is normally spatially heterogeneous, making the fine management and utilization of reclaimed mined lands difficult. Soil nutrient grading can provide a scientific basis for the precise regulation of soil nutrients, but few related studies are available in reclaimed mined areas. This study aimed to quantify the spatiotemporal variations in soil nutrient grades under different land-use types in a reclaimed mined area on the Loess Plateau, China. The study area was graded by four soil nutrients (soil available potassium (SAK), soil available phosphorus (SAP), soil total nitrogen (STN), and soil organic matter (SOM)), and the variation features of soil nutrient grades in the initial stage of reclamation under four land-use types (i.e., cultivated land, grassland, forestland, and barren land) were systematically characterized by geostatistical analysis, pedodiversity analysis, and correspondence analysis. The results show that during the initial five years after reclamation, the soil nutrient grades of most reclaimed areas increased from Grade V and VI to Grade I–IV, while the improvements were significantly heterogeneous. Notably, the four land-use types had distinct variation characteristics. The barren land had the lowest SAP level, whereas it had the highest proportion, and medium–high grades of SAK, STN, and SOM (88.3, 100.0, and 100.0%, respectively). In terms of quantitative structure, it had the lowest richness index ( S , 2.5) and Shannon’s entropy index ( H , 0.7) and the highest evenness index ( E , 0.8). These results suggest that the barren land had relatively high and balanced nutrients, with the highest homogeneity among the four land-use types. The grassland had considerable improvement in all nutrients (especially SAP; 95.6% of the area had high SAP grades); however, its improvement was the most heterogeneous ( S = 4.5, E = 0.7). As the second-most heterogeneous land-use type ( S = 4.0, E = 0.8), the forestland had relatively low STN, SAP, and SAK levels due to high nutrient uptake and storage by tree species, but it had the highest proportion of area that reached high SOM grades (36.4%) and medium to high SOM grades (100.0%) due to its high community productivity. The cultivated land, which received fertilization for an additional three years, was the most imbalanced in terms of nutrients. It had the highest proportion of area that reached high SAP grades (98.0%); in contrast, its area proportions of low-grade SAK and SOM (69.0 and 32.9%, respectively) were the highest among the four land-use types. Based on the above comprehensive characterization of soil nutrient grade variation, guidance was given for fine management of reclaimed mined land and the optimization of reclamation measures.

1. Introduction

Coal resources are known as “black gold” and “industrial food” and are one of the main energy sources supporting China’s social and economic development. In the past 30 years, China has been the country with the highest coal production globally. According to the National Bureau of Statistics, China’s raw coal production reached 3.75 billion tons in 2019, an annual increase of 4.2% [1]. While promoting the rapid development of China’s economy, coal mining has inevitably destroyed the ecological environment of the mining area and damaged the mine’s land resources. This is especially pronounced in opencast coal mining areas, where the original vegetation is devastated, the natural soil structure is disordered and the terrain is completely reformed [2,3,4]. Land reclamation, as an effective measure for remediating the postmining environment, guiding ecosystem recovery into a desirable trajectory and recovering the utility value of postmining lands, has become an important means of coordinating coal resource extraction and land resource protection [5,6].
Soil provides nutrients, water, and physical support for vegetation growth, and soil reconstruction is a prerequisite for ecosystem restoration in mining areas. The quality of reconstructed soil largely determines the rate and degree of vegetation restoration [7,8]. How to construct reclaimed soil with optimal soil environmental quality in the process of “geomorphologic remodeling, soil reconstruction and vegetation restoration” has always been a key scientific issue for scholars and managers in the field of land reclamation [9]. In the mineral extraction processes of opencast mining, the original topsoil is stripped and stored and then respread over mineral waste in land reclamation to support vegetation recovery. The soil properties undergo considerable changes during these intensive artificial disturbances [10,11,12]. Current studies on reclaimed soil have mostly concentrated on the surface or subsurface layer of the soil [13], and their research fields mainly cover the physical and chemical properties [2,14], nutrient content [15], heavy metal pollution and evaluation [16], organic carbon storage rate [10,17], microorganisms [18], and so on. The research methods for evaluating reclaimed soil mainly include principal component analysis [19], correlation coefficients [20], fuzzy comprehensive evaluation [21], regression–kriging approaches [22] and the modified Nemerow index [23]. This series of studies has evaluated reclaimed soil quality variation following mined land reclamation from different angles and analyzed the evolution characteristics of reclaimed soils under different conditions, providing guidance for constructing ecologically stable reclaimed mine soil.
The land-use type can adequately reflect the effects on land resources imposed by humans [24]. In reclaimed mining areas, different land-use types lead to varying soil nutrient evolution characteristics due to differences in vegetation selection and artificial management [25,26]. Land-use conversion can change the soil nutrient evolution track [27]. Studying the spatial distribution of soil nutrients under different land-use types can provide a reference for the selection and adjustment of land types in mined land reclamation. Using descriptive statistics, two-way multivariate analysis of variance (two-way MANOVA), spatial statistics, and geostatistical analysis, existing studies have confirmed that soil nutrients such as total nitrogen (TN), total phosphorus (TP), available phosphorus (AP), and available potassium (AK) have significantly different characteristics under different land-use types [26,28]. Soil nutrient grading quantifies the soil nutrient level according to measurement criteria, which can provide a scientific basis for the precise regulation of soil nutrients in a region [29]. It is widely applied in agricultural land management and protection in China [30]. In the Second National Soil Census, China developed a national standard of nutrient grading for soils of natural ecosystems or agricultural lands, i.e., the Second National Soil Census Nutrient Grading Standard. Currently, soil nutrient grading research either focuses on a specific soil nutrient element [29,31] or comprehensively evaluates various soil nutrients. Frequently used research methods of the latter usually include the comprehensive quality index [32], fuzzy evaluation [33], and the matter–element model [34].
However, little research has been conducted on nutrient grading of reclaimed mine soils. As a category of technosols [35,36], reclaimed mine soils have great spatial heterogeneity due to heterogeneous parent material, microtopography, and reclamation measures, and different land-use types could further increase this trend [26,28]. The high spatial heterogeneity of reclaimed mine soils makes effective management and rational utilization of reclaimed lands difficult. Nutrient grading of reclaimed mined lands and its spatial–temporal variation can provide a scientific basis for fine management measures and the adjustment of reclamation orientation. When combined with geostatistical analysis, the variation of the characteristics of soil nutrients at different levels can be quantitatively characterized and visually displayed [37]. Pedodiversity analysis has always been a hot topic in soil science research, and many soil scientists have widely discussed the concepts and methods of pedodiversity [38,39,40,41,42]. Characterization of soil nutrient grade diversities can intuitively display not only the richness of soil nutrient grades in each region but also the dispersion degree of soil nutrient distribution at each grade in a certain area. Correspondence analysis (CA) is a visualizable data dimensionality reduction method that can reveal the differences between different categories of the same variable and the corresponding relationships with different variables [43]. Through application of the theory of correspondence analysis to the quantitative characterization of soil nutrient grades, two- or three-dimensional correlation diagrams can be used to clearly express the complex relationship between soil nutrient grades under different conditions. Overall, a comprehensive understanding of the characteristics and applicability of geostatistics, pedodiversity, and correspondence analysis can provide a new idea for the quantitative characterization of the nutrient grades in reclaimed coal mining areas.
This study graded reclaimed mined land in an opencast coal mine according to soil nutrient levels and further comprehensively characterized the variation in soil nutrient grades under different land-use types, aiming to provide a scientific basis for adjusting reclamation measures and optimizing land-use patterns in mining areas. The objectives of this study were: (1) to grade the reclaimed soil nutrients (soil organic matter, total nitrogen, available potassium, and available phosphorus) under different land-use types; (2) to quantify the spatiotemporal variation characteristics of reclaimed soil nutrient grades under different land-use types for enlightening the optimization of land reclamation measures.

2. Study Area and Data Sources
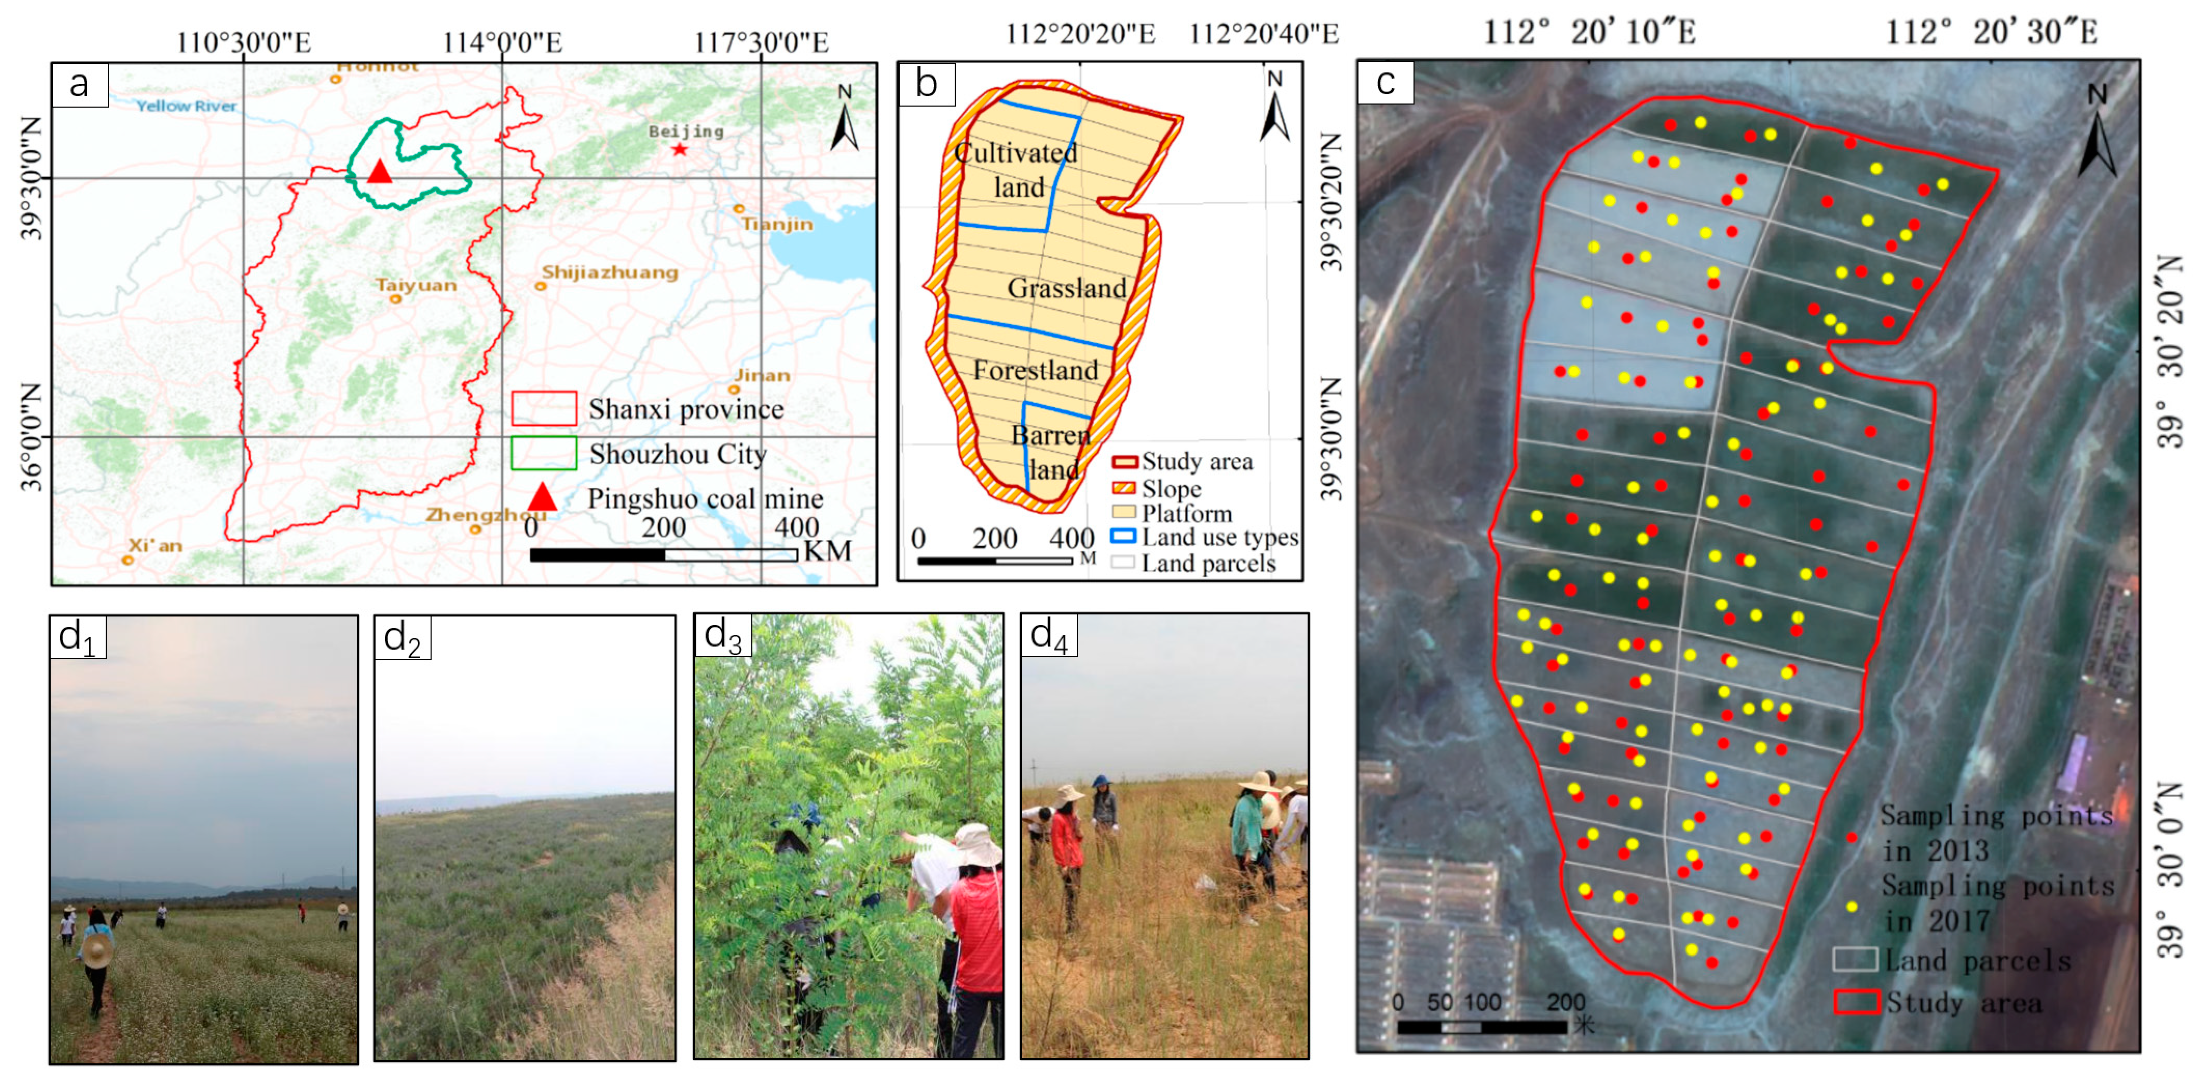
2.1. Study Area

The Pingshuo opencast coal mine (112°10′–113°30′ E and 39°23′–39°37′ N) is located in the northern part of Shanxi Province and the eastern part of the Loess Plateau within the territory of Pinglu District and Shuocheng District. It is the largest opencast coal mine in China, consisting of three major mines: Antaibao, Anjialing, and Donglutian. The climate type is a typical temperate arid and semiarid continental monsoon climate. The annual rainfall in this region is between 428.2 mm and 449 mm and is mainly distributed in July, August, and September. The annual evaporation is between 1786.6 mm and 2598.0 mm, far exceeding the rainfall amount. The average temperature in the region is between 4.8 °C and 7.8 °C, and the largest temperature difference can be as high as 61.8 °C during the year. The regional soil type is Kastanozems according to World Reference Base for Soil Resources [35], with a 35 m thick Quarternary Loess beneath the soil horizon. The abundant Quarternary Loess is an ideal soil substitute material for land reclamation. According to previous tests by our research group, the loess has low content of total nitrogen (<0.5 g/kg), 0.62 g/kg total phosphorus, and about 20 g/kg total potassium [44].
In Antaibao opencast coal mine, the coal seam is burried over 300 m deep. On the strip profile of the mining pit, overburden materials (i.e., soil and rock stratum laying above the coal seam) were stripped to expose the coal seam, and then transported and dumped on the dump profile of the pit. In this way, the mining pit moves on, leaving vast areas of destructed land, i.e., the inner dump. In land reclamation, a loess layer of 1–1.5 m thick was covered on the overburden materials to support plant growth. As the loess was from the Quarternary Loess layer, buried beneath the original soil horizon, the reclaimed soils are typical anthropic technosols according to World Reference Base for Soil Resources [35]. To avoid severe compaction, the rolling process of vehicles and machinery was avoided as much as possible during the restoration process. Our research area is a large platform on the inner dump, which is surrounded by slopes (Figure 1b). The formation of this area began in 2011 and was completed in 2012. The final elevation of the dump was 1474–1480 m. The total study area was 0.44 km2, divided into 36 plots each with an average size of 250 × 150 m. Revegetation was implemented in 2013, and the land-use types are cultivated land, forestland, grassland, and barren land (Figure 1). Before vegetation restoration, this area was fertilized in a unified way except for the barren land. A combination of organic and inorganic fertilizers was used, and a one-time base application was applied, which included 750 kg/hm2 ammonium bicarbonate in autumn, 30.0 t/hm2 organic fertilizer, 300.0 kg/hm2 urea, and 300.0 kg/hm2 diammonium phosphate before sowing. The cultivated vegetation is one crop per year, including buckwheat and maize. Continuous topdressing was carried out within three years of planting, with 10.0 t/hm2 organic fertilizer, 50.0 kg/hm2 urea, and 50.0 kg/hm2 diammonium phosphate. Medicago sativa, a leguminous plant, was planted in the grassland. The grass seeds were sown at 50 kg/hm2, and the amount of replanting was 5–10 kg/hm2 each year for three consecutive years. The mixed planting of trees and shrubs was selected, the area of Pinus sinensis, Populus tomentosa Carr, and Robinia pseudoacacia was 3 × 3 m, and that of Caragana microphylla and Hippophae rhamnoides was 1.5 × 1.5 m. The seedlings were thinned, rearranged, and fixed within three years. Vegetation reconstruction was not carried out on barren land, and the vegetation in this region mainly consists of wild grass seeds carried by the loess parent material covering the surface of the barren land, including Calamagrostis and wheatgrass; additionally, no other management and protection measures have been implemented in the barren land area.

2.2. Soil Sampling

In this experiment, soil samples were collected twice in 2013 and 2017. The first sampling was conducted in June 2013, and 78 soil samples were collected. On the basis of the initial sampling, 81 soil samples were collected in July 2017 according to the reclamation level of each land-use type. To ensure comparability between the two samplings, the layout of quadrats was consistent with the sampling process. According to the size of the plots and the principle of random sampling, two quadrats were established in each plot (three quadrats were established in large plots, and one quadrat was established in small plots). The distribution of quadrats is shown in Figure 1c.
The sampling process used a five-point sampling method; that is, five sampling points were randomly selected near the location of each quadrat, the soil collected from the five points was mixed, and approximately 1 kg of the sample was retained from the mixture. Since the distribution and change in soil nutrients in the topsoil (0–20 cm) were the most obvious and representative [45], the soil was sampled at 0–20 cm. Before the soil samples were tested and analyzed, the soil samples were tagged, air-dried, screened through a 2 mm sieve, and stored for later use.

3. Methods

To quantify the variation characteristics of soil nutrient grades under different land-use types in the opencast coal mine area on the Loess Plateau, the Pingshuo opencast coal mining area was selected as the study area. Spatial interpolation of soil nutrients was carried out by geostatistical methods and then graded into six grades for each soil nutrient. The soil nutrient grading referred to the Second National Soil Census Nutrient Grading Standard, and the specific grading methods are described in detail in Section 3.3. Next, pedodiversity theory was introduced to analyze the diversity characteristics of spatial distribution and the quantitative structure of the soil nutrient grades under different land-use types. Moreover, correspondence analysis was used to explore the relationship between the land-use type and the reclaimed soil nutrient grade. According to the quantitative analysis of the variation characteristics of the soil nutrient grades, the mechanisms of variation under different reclamation types were explored, which provided implications for improving the reclamation soil quality and optimizing the land-use types in mining areas. The research framework is shown in Figure 2.

3.1. Analytical Sources

Soil nutrients were determined after the soil samples were collected and treated, and soil organic matter (SOM) was determined by the potassium dichromate volumetric method [46]. The semimicro Kelvin method was used to determine soil total nitrogen (STN) [46]; available soil potassium (SAK) was determined by the method of NH4OAC extraction and flame photometry at the concentration of 1 mol L−1 [47]. The available soil phosphorus (SAP) was determined by NaHCO3 extraction with a concentration of 0.5 mol L−1 and molybdenum-antimony colorimetry [46].

3.2. Geostatistical Analysis

Geostatistical analysis was used to analyze the spatial variability and distribution characteristics of surface soil nutrients in the study area in 2013 and 2017. The optimal semivariance model and parameters of soil nutrients were fitted by a semivariogram, and interpolation analysis was used to evaluate the spatial value of soil nutrients in the unsampled part of the study area. The semivariogram model is as follows [48]:
γ ( h ) = 1 2 N ( h ) i = 1 N ( h ) [ Z ( x i ) Z ( x i + h ) ] 2
where γ ( h ) represents the semivariogram of h, h represents the spatial interval between two quadrats, N ( h ) represents the total logarithm of the quadrats separated by distance from h , and Z ( x i ) and Z ( x i + h ) are the sample values for Z ( x ) at locations x i and x i + h [ i = 1,2…, N ( h ) ], respectively.
In this study, the semivariogram was calculated by GS + 7.0 (Gamma Design Software, Plainwell, MI, USA). The optimal semivariogram results of soil nutrients have been given in previous research by our group [28]. According to the best fitting semivariance model and parameters, and based on the ArcGIS 10.2 interpolation analysis module (ESRI, Redlands, CA, USA), the ordinary kriging method was used to estimate the soil nutrient distribution of unsampled sites in the study area.

3.3. Soil Nutrient Grading

The Second National Soil Census Nutrient Grading Standard is the normative criterion for soil nutrient grading of natural ecosystems or agricultural lands in China, but it cannot adequately characterize the gradients of the infertile reclaimed mine soil in our study area. As the nutrient levels of the underdeveloped reclaimed mine soil were much lower than those of natural or agricultural soils, nearly all of the study areas corresponded to the lowest or lowest two grades according to the Second National Soil Census Nutrient Grading Standard, and therefore this standard cannot adequately distinguish the heterogeneity of soil nutrients in different parts of the study area (Table 1). Therefore, referring to this standard, we established soil nutrient grades for the study area by dividing the nutrient range of the soil samples into six equal intervals; Grade I represented the highest nutrient level, while Grade VI represented the lowest (Table 1). The study area was then graded according to these grading ranges.

3.4. Pedodiversity Analysis

Based on the soil nutrient grading of the study area, the richness index (S), Shannon’s entropy index (H), and the evenness index (E) of soil nutrient grades in different land-use types were calculated. In this study, the modified Shannon entropy equation [49], which was improved from mathematical ecology [50], was used to calculate the diversity index:
H = i = 1 S p i l n ( p i )
E = H l n ( S )
H = i = 1 S p i l n ( p i )
E = H l n ( S )
In Equations (2) and (3), H represents the diversity of the spatial distribution of soil nutrient grades, S is the number of spatial grids, pi is the ratio of the specific soil area to the total soil area in the spatial grids, and E is the evenness of each soil nutrient grade within the study area. In Equations (4) and (5), H represents the diversity of the quantitative structure of soil nutrient grades, S is the number of soil grades, p i is the ratio of soil nutrient grades to the total soil area, and E is the evenness of various soil nutrient grades within the study area.

3.5. Correspondence Analysis

Correspondence analysis (CA) is a visualizable data dimensionality reduction method that can reveal the differences between different categories of the same variable and the corresponding relationships with different variables [43]. The key step of CA is to sum the original data matrix X, which contains M samples and N variables, according to rows and columns, respectively, to obtain rows x i , columns x j , and sum T, and to calculate the probability matrix P and data transformation matrix Z of the original data. The calculations are as follows:
X = [ x 11 x 1 m x n 1 x n m ] = ( x i j ) n × m
P i j = x i j T
Z i j = T x i j x i x j T x i x j   ( i = 1 , 2 , , n ; j = 1 , 2 , , m )
Then, the covariance matrices A and B of the samples and variables were calculated:
A = Z T · Z  
B = Z · Z T  
Factor analysis of A and B was performed, and the two most important common factors ( R 1 , R 2 ,   a n d   Q 1 , Q 2 ) were extracted. Thus, the data points ( R 1 , Q 1 ) and ( R 2 , Q 2 ) were plotted in the same Cartesian coordinate system, consisting of dimension 1 and dimension 2. In this way, the complex relationship between samples and variables could be analyzed intuitively.
In this study, the land-use types and soil nutrient grades were taken as samples, and the corresponding area of the samples was taken as a variable. SPSS 21.0 statistical software (SPSS, Chicago, IL, USA) was used to analyze the corresponding relationships between the four types of land use and the 24 soil nutrient grades (four types of soil nutrients, and each type of soil nutrient was divided into six grades).

4. Results

4.1. Spatiotemporal Pattern and Quantitative Structure of Soil Nutrient Grades

4.1.1. Spatial and Temporal Patterns

By comparing the spatial distribution of soil nutrients at all grades in 2013 and 2017 (Figure 3), it can be seen that, in most parts, the grades of all four soil nutrient elements increased. However, the variation in the distribution characteristics was different between the nutrient elements. The relative difference in the spatial distribution of the SAP grade was almost unchanged from 2013 to 2017. The high-grade SAP was mainly distributed in cultivated land and grassland, while the low-grade SAP was mainly distributed in forestland and barren land. In 2013, there was little difference in the distribution of SAK among different land-use types, but it had a significant agglomeration effect, with higher SAK in the southeastern part of the study area than in the other areas. After five years of reclamation, the distribution of the SAK grade was relatively dispersed, and the areas with high-grade soil nutrient quality were mainly located in grassland and forestland. STN and SOM had similar spatial distribution characteristics. In 2013, low-grade STN and SOM were concentrated in the northwestern part of the study area, which was mainly composed of cultivated land. By 2017, the contents of STN and SOM showed a patchy distribution, and the high-grade STN and SOM were mainly distributed in the northern and southwestern parts of grassland, while the low-grade STN and SOM were still mainly distributed in cultivated land.

4.1.2. Quantitative Structure

The quantitative structure of soil nutrient classification under different land-use types is shown in Figure 4. In 2013, different land-use types had similar soil nutrient grades. The majority of areas of all land-use types were at the lowest two grades for all soil nutrients except for SAP. Due to nonuniform fertilization, cultivated land had relatively higher SAP grades than the other land-use types, with 53.7 and 12.7% of the areas at Grade III and Grade II, respectively.
In 2017, the soil nutrient grades of each land-use type increased; however, different land-use types showed varying quantitative structures (Figure 4). The disparity in the SAP grades between the four land-use types was obvious, following the order of cultivated land > grassland > forestland > barren land. For the other three soil nutrients, only a small proportion of the area reached high grades (Grade I and II) in each land-use type, while most areas were at medium to high grades (Grade III and IV). Hence, for SAK, STN, and SOM, the four different reclamation orientations were ranked by the proportion of area that reached Grade IV, Grade III, and Grade III, respectively. The ranking of SAK was barren land (88.3%) > grassland (66.0%) > forestland (38.5%) > cultivated land (31.0%); the ranking of STN was barren land (90.4%) > forestland (73.1%) > grassland (71.0%) > cultivated land (37.3%); the order of SOM was forestland (93.6%) > barren land (89.2%) > grassland (45.2%) > cultivated land (32.7%). In addition, it is worth mentioning that barren land had the lowest and the most homogeneous improvement of soil nutrient grades among the four land-use types, with its whole area being inferior to Grade II in terms of SAK, SAP, and SOM, and only 30.1% of the area reached STN II.

4.2. Diversity Characteristics of Soil Nutrient Grades

The study area was divided into 36 grids by land parcels, and the spatial distribution diversity index of each soil nutrient grade in the 36 grids was calculated (Figure 5). The S value represents the number of grids occupied by this type of soil nutrient grade in the study area. In 2013, the high values of S were mainly distributed in Grades V and VI, and a few of them were scattered in other soil nutrient grades. By 2017, high values of S were located in Grades II, III, and IV, showing that, at five years after reclamation, the soil nutrient grades had significantly increased in most areas. The E value represents the spatial dispersion degree of soil nutrients of various grades. The larger the E value is, the more discrete is the spatial distribution of such soil nutrients, and vice versa [42]. In 2013, the soil nutrient grades with the highest E values were SAK-VI, SOM-V, STN-V, and SAP-IV. By 2017, the soil nutrient grades with the highest E values were SAK-V, SAK-IV, STN-III, SOM-III, and SAP-II. As the number of grids remained unchanged, the variation of the H value had a similar trend with that of the E value, i.e., the larger the H value is, the larger the E value is.
The diversity of the quantitative structure of soil nutrient grades is shown in Table 2. In the whole study area, the S values of SAK, STN, and SOM increased by three units from 2013 to 2017, while that of SAP decreased by one unit. The H values of the four kinds of soil nutrients all increased to a certain extent. The E value of all soil nutrient grades increased, except for that of STN, which remained the same. The diversity indices of each land-use type also changed. In 2013, the average S values of the soil nutrient grades of the four land-use types were in the order of barren land < cultivated land < forestland < grassland. The ranking of the average H value was barren land = forestland < cultivated land < grassland. The ranking of the average E value was forestland < barren land < cultivated land < grassland. In 2017, the average S value of the soil nutrient grades of the four land-use types was in the order of barren land < cultivated land < forestland < grassland. The ranking of the average H value was barren land < cultivated land = forestland = grassland. The average E value was in the order of grassland < forestland = barren land = cultivated land. Meanwhile, the average H of each land-use type increased, indicating that each of them became heterogeneous in terms of the soil nutrient grades.

4.3. Correspondence Analysis between Soil Nutrient Grades and Land-Use Types

The correspondence analysis between land-use types and soil nutrient grades (Figure 6) showed that the cumulative variance contribution rates in 2013 and 2017 were 97.7 and 95.2%, respectively, indicating that most information could be explained through these two dimensions. In 2013, the angle between vectors of forestland and barren land (from the origin to FL and BL, respectively) was the smallest, while the angles between the vector of cultivated land and vectors of the other three land-use types were all obtuse angles, indicating that forestland and barren land were the most similar land-use types in terms of the soil nutrient grades, and cultivated land differed widely from the other three land-use types. In 2017, the four land-use types were distributed within four different quadrants, showing that after five years of reclamation, the characteristics of the four land-use types were all different. High grades of SOM-I, STN-I, STN-II, SAK-I, SAK-II, and SAP-II were all nearest to grassland, signifying that grassland had the highest proportion of high-grade soil nutrients, and it had a balanced improvement in different nutrients. This result may relate to the cultivation of alfalfa in grassland and indicate the potential lack of fertilization in alfalfa culture in post-mining areas [36]. Cultivated land was surrounded by SAP-I and SOM-V, meaning that cultivated land had the highest proportion of high-grade SAP and low-grade SOM, which mainly affected by multiple effects of fertilization supplementation and crop uptake [51,52].

5. Discussion

5.1. Development of Soil Nutrient Grades in the Loess Plateau Coal Mine Dump

According to the spatial distribution of soil nutrient grades in 2013 and 2017 (Figure 3), we found that all nutrient grades in the study area had significantly increased. The structural characteristics of the soil nutrient grades (Figure 4 and Figure 5) showed that soil nutrients in most parts of the study area were at Grades V and VI, with only a small proportion at medium soil nutrient grades in 2013. By 2017, soil nutrients reached grades II, III, and IV in most areas and even reached Grade I in some areas, except the barren land, showing that the reconstructed soil nutrients of the mining dumps have been greatly improved through the active guidance of the soil formation process through four years of land reclamation. That is to say, the development of reconstituted soil nutrients in reclaimed dumps in coal mining areas have mainly come from the induced pedogenic processes. Moreover, the S and H values in the whole study area increased from 2013 to 2017 (Table 2), indicating that the soil nutrients in the study area were becoming heterogeneous. These results suggested that land reclamation promoted soil nutrient levels and increased the diversity of the soil nutrient grades.
However, reclaimed mine soil is still infertile when compared with natural and agricultural soils. According to the Second National Soil Census Nutrient Grading Standard (Table 1), SOM and STN were at Grade VI (the lowest grade), and SAP and SAK were mainly at Grade IV and Grade III. The low nutrient grades of reclaimed mine soil were mainly due to the short restoration period and the poor properties of the soil substitutes used for reclamation. In the area of the Loess Plateau, abundant loess is the soil parent material and is an ideal soil substitute for land reclamation. According to the Completion Standards on Land Reclamation Quality of China, in this area, the original soil can be abandoned in mining, and the reclaimed land should be covered with a loess layer of 1~1.5 m to reconstruct the soil [53]. This standard also requires that the land productivity of the reclaimed mined land should reach the level of unmined land in five years. However, our results suggest that the soil nutrients remained at low levels and could not reach this standard in such a short period, even with intensive manual intervention such as fertilization and revegetation. For example, by 2017, the STN and SOM levels for reclaimed mined land were 0.18–0.40 and 2.3–5.2 g kg−1, respectively, much lower than those of surrounding unmined land (0.6 and 7.0 g kg−1, respectively [26]). Obviously, a longer reclamation period is needed for reclaimed mine soils to reach the background nutrient levels in this region.

5.2. Soil Nutrient Grade Variation under Different LAND-Use Types

5.2.1. Spatial and Quantitative Variation

In the first year of reclamation, different land-use types had broadly similar soil nutrient grades (Figure 3 and Figure 4). This was mainly due to the consistent reclamation technology (soil reconstruction and fertilization) in the whole study area. In the soil reconstruction process, the covering material and reclamation operation were homogenized [3,54]. However, since differences in reclamation orientation, labor management, and vegetation types exist among different land-use types, by 2017, the soil nutrient grades significantly varied with the land-use types.
The cultivated land, on the one hand, had the highest area proportion of high-grade SAP (98.0%). On the other hand, it had the highest proportion of low-grade SAK (69.0%) and low-grade SOM (32.9%), and its STN level was obviously the lowest among all land-use types (Figure 4). Moreover, its SAP level was negatively correlated with the STN level (r = −0.715, Table 3). These results show that the cultivated land had imbalanced soil nutrients, i.e., high overall SAP level, but, in contrast, low overall SAK, STN, and SOM levels. As the whole above-ground part of crop (buckwheat and silage maize) was harvested, the main soil nutrient source and sink were fertilization and crop uptake, respectively. Consequently, the nutrient imbalance was probably due to the fact that sole plant species (monoculture of buckwheat or maize) uptake nutrient elements unevenly when compared to vegetation constituted by multiple species.
Grassland had the second highest proportion of high-grade SAP (95.6%) and high-grade SOM (18.8%). Its STN level was also relatively high and was distributed with the only patch of STN-I in the study area. Moreover, the STN level was positively correlated with the SOM level (r = 0.748, Table 3). These results show that revegetation with Medicago sativa can efficiently improve soil nutrients. Existing research has found that Medicago sativa has a strong nitrogen-fixing capacity and decomposes easily, which can rapidly increase STN and SOM [55,56]. Our results agree with this conclusion; furthermore, our results also suggest that this reclamation mode can effectively improve SAP.
Forestland had relatively low SAP, SAK, and STN levels, and a portion of the area remained unchanged at SAP-IV, SAK-VI, SAK-V, and STN-V from 2013 to 2017. A patch of forestland even decreased from SAK-V to SAK-VI (Figure 3). However, it had the highest proportion of high-grade SOM (36.4%), with another 57.2% of the area at SOM-III, which was much higher than that of the other land-use types (Figure 4). The slow improvement (even decrease) in the SAP, SAK, and STN levels and the high SOM level were mainly because the growth of tree species consumed a large amount of nutrients that were converted and stored in their branches and trunk; meanwhile, the forestland had the highest productivity among all land-use types, and the decay of litter increased the SOM [57].
The barren land had the lowest improvement in the SAP level, with no area reaching high-grade SAP (Figure 4). However, it had the highest SAK and STN levels, with 88.3% of the area reaching SAK-IV and 90.4% of the area reaching STN-III, both of which ranked first among the four land-use types. Although it had no area that reached SOM-II, 89.2% of the area reached SOM-III, which was second only to that of the forestland (93.6%). In addition, it had only two or three grades for each soil nutrient, which were the lowest among all land-use types, indicating that its nutrient distribution was the most homogeneous.

5.2.2. Changes in Diversity Characteristics

Different land-use types also lead to varying structural characteristics of soil nutrient grades. According to the diversity indices of soil nutrient grades under different land-use types in 2017 (Table 2), the cultivated land, forestland, and grassland had the same average H of 1.0, which was higher than that of the barren land, suggesting that all three artificial restoration methods would lead to higher heterogeneity in soil nutrient grades than natural restoration. Moreover, the H value is not only affected by the richness of the soil nutrient grades but is also closely related to the area occupied by the soil nutrients of each grade [58,59]. Although the three artificially restored land-use types had the same average H , grassland had the highest average S and lowest E among them, indicating that grassland had the largest discrepancy in soil nutrient levels between high-grade and low-grade areas among all land-use types.
In a two-dimensional graph of CA, the further a point is from the center of the origin, the more obvious are the variable’s features [60,61]. In 2013, the grassland, forestland, and barren land were closer to the origin, while the distance from the cultivated land to the center was longer, indicating that the former three had no significant differences in the structure of the soil nutrient grades but were relatively different from the cultivated land. In 2017, the four land-use types were distributed separately in the four quadrants of the Cartesian coordinate system, and all grades of soil nutrients were scattered around the coordinate plane, indicating that the four land-use types had different variation trends and structure characteristics in terms of the soil nutrient grades. Moreover, high-quality soil nutrients, such as SAK-I, STNI, SAK-II, SOM-I, and SAP-II, were mainly distributed around the grassland, suggesting that the grassland had the highest proportion of high-grade soil nutrients, which demonstrates that Medicago sativa is an ideal species for reclamation in this area. This result is consistent with previous research in this area [62,63]. As the land-use type subjected to the most intensive artificial management, cultivated land, it received extra fertilization in the first three years of reclamation but was mostly surrounded by low nutrient grades (such as SOM-VI, STN-V, and SOM-V), except for SAP-I, indicating that the overall nutrient level was lower than that in the grassland despite the high fertilization input.

5.3. Implications for Reclaimed Land Management and Reclamation Technology Optimization

As a typical arid and semiarid region, the Loess Plateau in China has eight national coal mine bases. Mining activities destroy the original ecosystem and utilizability of land resources, intensifying the contradiction between people and land. In this area, the mined lands must be reclaimed, and the land productivity must reach the medium level of the surrounding area in five years. Due to the abundance of soil parent material (i.e., loess), the original topsoil is commonly abandoned, and loess is used as a soil substitute in reclamation [64]. Additionally, as the loess is abundant in total phosphorus (0.62 g/kg) and total potassium (about 20 g/kg) [44], even without fertiliztion, the soil nutrients increase with years of reclamation [63,65]. However, our study has provided strong evidence that nutrient levels of the reconstructed soils cannot reach this standard in such a short period. Despite the limited improvement on the whole, different reclamation orientations, human interventions, and vegetation types have different influences on the accumulation or decomposition of soil nutrients [25,26,65,66]. Analysis of the nutrient variation in reclaimed mine soils under different land-use types can provide guidance for the fine management of reclaimed mined land and the optimization of reclamation technology [26,64,67].
There has been a long-standing controversy over whether reclaimed mined land should be artificially revegetated or left for natural restoration, and the conclusion varies with bioclimate zones [68,69]. In our study area, the grassland, forestland, and cultivated land were all artificially revegetated, while the barren land was spontaneously restored. From the perspective of soil nutrient development, the barren land, which received the lowest manual intervention, had much higher overall nutrient grades than the cultivated land five years after reclamation (Figure 4), although the cultivated land had been fertilized for an additional three years. Its STN level even exceeded that of the grassland, which was seeded with Medicago sativa, a leguminous species with a high nitrogen-fixing capacity. Moreover, unlike the artificially revegetated land-use types, whose soil nutrient levels showed high heterogeneity, the improvement of all nutrients was homogeneous on the barren land. However, the vegetation cover developed much slower than the artificially revegetated land-use types, leaving the reconstructed soil exposed to a high risk of erosion. Hence, spontaneous restoration could be a good option in reclamation on the Loess Plateau, provided that erosion prevention measures are implemented.
Among the artificially revegetated land-use types, grassland was the most economically important. With modest human intervention (reseeding but no extra fertilization), there was considerable improvement in all soil nutrients (especially in SAP), although this improvement was the most uneven (average S = 4.5, Table 2). As another human-induced revegetated land-use type, forestland had a lower area proportion, reaching medium–high SAK and SAP grades, than the grassland. The low nutrient level occurred because the development of a tree requires a large amount of nutrients, and this situation will be mitigated in the middle stage of reclamation [63,65]. Moreover, owing to high community productivity, the forestland had the highest SOM level among all land-use types, and its area proportion of SOM-III (93.6%, Figure 4) was much higher than that of the grassland (45.2%). These two types of human-induced revegetation, namely, grassland and forestland reclamation, have their own advantages in promoting soil nutrient accumulation, and both of their vegetation develops quickly, providing effective protection for soils from erosion.
The cultivated land differed from other land-use types in terms of soil nutrient sources and cycling. It was continuously fertilized in the first three years after reclamation, providing a much more artificial input of nutrients. However, substantial nutrients were absorbed and assimilated by crops and then lost through harvesting, with little litter left to decay in the soil [51,52]. Hence, the cultivated land had the lowest overall grades of SAK, STN, and SOM (Figure 4). This slow accumulation of STN and SOM on reclaimed cultivated land is consistent with the findings of existing research [5,70,71]. In contrast, due to the imbalanced fertilization and nutrient uptake by monoculture crops, the cultivated land had the highest SAP grade. These results suggest that the improvement of soil nutrients on the cultivated land was limited and highly imbalanced, although the fertilization and manual inputs were highest among all land-use types. Consequently, for cultivated land reclamation, it is not cost-effective to plant crops directly and apply a high amount of fertilization. An economic strategy is to plant Medicago sativa with seeds first, in the first 3~5 years (the same management as that used for grassland reclamation), which can increase soil nutrient levels rapidly and with the lowest cost.

5.4. Limitations and Prospects

The initial stage of land reclamation is the fastest and most critical recovery stage for the reconstruction of soil properties. Studying the reclaimed soil nutrient variation in this stage is of great significance for the timely optimization of land reclamation measures. Therefore, this study focused only on the initial stage of land reclamation (the first and fifth years) to conduct reclaimed soil sampling design, testing, and statistical analysis. However, existing studies have shown that ecological restoration and nutrient accumulation on reclaimed mined land usually require a much longer time span [72,73,74]. Therefore, long-term monitoring of soil nutrients is still needed in further studies.

6. Conclusions

Taking a representative opencast coal mine on the Loess Plateau as an example, this study applied the theories of geostatistics, pedodiversity, and correspondence analysis to grade the reclaimed mined land according to nutrient levels and to quantitatively characterize the spatiotemporal variation in nutrient grades under different land-use types. The results show that the overall nutrient level of reclaimed mine soil increased significantly five years after reclamation, but it remained inferior to that of the surrounding undisturbed soil and needed a longer period to reach the background level. The variation characteristics of soil nutrient grades under different land-use types were obviously different in terms of their spatiotemporal patterns, quantitative structures, and indices. The barren land, the only spontaneously revegetated land-use type, had the lowest area proportion of high nutrient grades, while the majority of this land-use type was at medium to high grades, and it had the most homogeneous and balanced nutrients. With proper erosion prevention measures (vegetation recovery by spontaneous restoration occurs slowly), this can be a good reclamation orientation on the Loess Plateau. As a human-induced revegetated land-use type, the grassland reached a relatively high level in all soil nutrients five years after reclamation, although it had the highest heterogeneity in the soil nutrient grades ( S = 4.5, E = 0.7). Considering the moderate manual input it received, this is an economical and practical reclamation orientation. The forestland had lower SAK, SPA, and STN levels than the grassland, but it had the highest SOM level, with as much as 36.4% of the area reaching high SOM grades. Although forestland requires large amounts of N, P, and K elements in the early stage of reclamation, it has the greatest community productivity, ecosystem service function, and ecosystem stability. The cultivated land had the highest area proportion of high-grade SAP (98.0%), low-grade SAK (69.0%), and low-grade SOM (32.9%), and its STN level was obviously lower than that of the other land-use types. The low and imbalanced soil nutrients, regardless of the highest fertilization and manual input being implemented, suggest that it is not economical to plant crops with continuous fertilization in the early stage of reclamation. Instead, the more economical and effective strategy for improving land productivity is to plant Medicago sativa for 3–5 years. These results comprehensively reflected the variation characteristics of soil nutrient grades under different land-use types in the initial stage of reclamation. Based on these results, suggestions for optimizing reclamation technology and developing fine management of reclaimed mined land were proposed. Our study shows that soil nutrient grading and deep analysis of soil nutrient grades under different land-use types are good tools for adjusting artificial intervention and land-use management of reclaimed mined lands.

Author Contributions

Conceptualization, X.F., Y.G., Z.B., W.Z. and C.Z.; methodology, X.F. and Y.G.; software, Y.G.; validation, X.F., Y.G., Z.B., W.Z. and C.Z.; formal analysis, X.F. and Y.G.; investigation, Y.G.; resources, W.Z. and C.Z.; data curation, X.F., Y.G. and C.Z.; writing—original draft preparation, X.F. and Y.G.; writing—review and editing, Z.B., W.Z. and C.Z.; visualization, Y.G. and C.Z.; supervision, W.Z. and C.Z.; project administration, Z.B., W.Z.; funding acquisition, X.F. and W.Z. All authors have read and agreed to the published version of the manuscript.

Funding

This research was funded by the National Natural Science Foundation of China (No. 41571508) and the Scientific and Technological Innovation Foundation of Shanxi Agricultural University (Ph.D. Research Startup) (No. 2021BQ96).

Data Availability Statement

Not applicable.

Acknowledgments

The authors thank Xiao Li, Hang Pu, and others for their help with soil sampling.

Conflicts of Interest

The authors declare no conflict of interest. The funders had no role in the design of the study; in the collection, analyses, or interpretation of data; in the writing of the manuscript, or in the decision to publish the results.

References

  1. Guan, Y.; Zhou, W.; Bai, Z.; Cao, Y.; Wang, J. Delimitation of supervision zones based on the soil property characteristics in a reclaimed opencast coal mine dump on the loess plateau, China. Sci. Total Environ. 2021, 772, 145006. [Google Scholar] [CrossRef] [PubMed]
  2. Feng, Y.; Wang, J.; Bai, Z.; Reading, L. Effects of surface coal mining and land reclamation on soil properties: A review. Earth-Sci. Rev. 2019, 191, 12–17. [Google Scholar] [CrossRef]
  3. Bai, Z.; Liu, X.; Fan, X.; Zhu, C.; Yang, R. Chapter 18—Ecological reconstruction research and practice in the large open-pit coal mine of the loess plateau, China. In Bio-Geotechnologies for Mine Site Rehabilitation; Elsevier: Amsterdam, The Netherlands, 2018; pp. 323–333. [Google Scholar] [CrossRef]
  4. Lechner, A.M.; Kassulke, O.; Unger, C. Spatial assessment of open cut coal mining progressive rehabilitation to support the monitoring of rehabilitation liabilities. Resour. Policy 2016, 50, 234–243. [Google Scholar] [CrossRef]
  5. Mukhopadhyay, S.; Maiti, S.K.; Masto, R.E. Development of mine soil quality index (msqi) for evaluation of reclamation success: A chronosequence study. Ecol. Eng. 2014, 71, 10–20. [Google Scholar] [CrossRef]
  6. Zhongke, B.; Jingkui, Z. On the land reclamation benefit of China. Ecol. Econ. 1995, 02, 35–39. (In Chinese) [Google Scholar]
  7. Liu, X.; Zhou, W.; Bai, Z. Vegetation coverage change and stability in large open-pit coal mine dumps in China during 1990–2015. Ecol. Eng. 2016, 95, 447–451. [Google Scholar] [CrossRef]
  8. Liu, X.; Cao, Y.; Bai, Z.; Wang, J.; Zhou, W. Evaluating relationships between soil chemical properties and vegetation cover at different slope aspects in a reclaimed dump. Environ. Earth Sci. 2017, 76, 805. [Google Scholar] [CrossRef]
  9. Wang, J.; Yang, R.; Feng, Y. Spatial variability of reconstructed soil properties and the optimization of sampling number for reclaimed land monitoring in an opencast coal mine. Arab. J. Geosci. 2017, 10, 46. [Google Scholar] [CrossRef]
  10. Swab, R.M.; Lorenz, N.; Lee, N.R.; Culman, S.W.; Dick, R.P. From the ground up: Prairies on reclaimed mine land-impacts on soil and vegetation. Land 2020, 9, 455. [Google Scholar] [CrossRef]
  11. Zhengfu, B.; Shaogang, L.; Dan, J.; Li, W. Several basic scientific issues related to mined land remediation. J. China Coal Soc. 2018, 43, 190–197. [Google Scholar]
  12. Hu, Z. Principle and method of soil profile reconstruction for coal mine land reclamation. J. China Coal Soc. 1997, 06, 59–64. (In Chinese) [Google Scholar]
  13. Wang, J.; Qin, Q.; Guo, L.; Feng, Y. Multi-fractal characteristics of three-dimensional distribution of reconstructed soil pores at opencast coal-mine dump based on high-precision ct scanning. Soil Tillage Res. 2018, 182, 144–152. [Google Scholar] [CrossRef]
  14. Belyaeva, O.N.; Haynes, R.J.; Sturm, E.C. Chemical, physical and microbial properties and microbial diversity in manufactured soils produced from co-composting green waste and biosolids. Waste Manag. 2012, 32, 2248–2257. [Google Scholar] [CrossRef] [PubMed]
  15. Wilson-Kokes, L.; Skousen, J. Nutrient concentrations in tree leaves on brown and gray reclaimed mine soils in west virginia. Sci. Total Environ. 2014, 481, 418–424. [Google Scholar] [CrossRef] [PubMed]
  16. Liu, X.; Shi, H.; Bai, Z.; Zhou, W.; Liu, K.; Wang, M.; He, Y. Heavy metal concentrations of soils near the large opencast coal mine pits in China. Chemosphere 2019, 244, 125360. [Google Scholar] [CrossRef] [PubMed]
  17. Ganjegunte, G.K.; Wick, A.F.; Stahl, P.D.; Vance, G.F. Accumulation and composition of total organic carbon in reclaimed coal mine lands. Land Degrad. Dev. 2009, 20, 156–175. [Google Scholar] [CrossRef]
  18. Bi, Y.; Zhang, J.; Song, Z.; Wang, Z.; Qiu, L.; Hu, J.; Gong, Y. Arbuscular mycorrhizal fungi alleviate root damage stress induced by simulated coal mining subsidence ground fissures. Sci. Total Environ. 2019, 652, 398–405. [Google Scholar] [CrossRef]
  19. Mukhopadhyay, S.; Masto, R.E.; Yadav, A.; George, J.; Ram, L.C.; Shukla, S.P. Soil quality index for evaluation of reclaimed coal mine spoil. Sci. Total Environ. 2016, 542, 540–550. [Google Scholar] [CrossRef]
  20. Xie, H.; Lu, X. Research on Comprehensive Assessment of Soil Quality in Coal Mining Area; Aussino Academic Publishing House: Sydney, Australia, 2009; pp. 98–102. [Google Scholar]
  21. Zhenya, Z.; Baolin, J.; Xiaoyuan, S.; Shuyang, Z.; Ke, X. Ahp and fuzzy mathematics based soil quality evaluation in gongwusu. Arid Zone Res. 2014, 31, 1010–1016. [Google Scholar]
  22. Gasch, C.K.; Huzurbazar, S.V.; Stahl, P.D. Small-scale spatial heterogeneity of soil properties in undisturbed and reclaimed sagebrush steppe. Soil Tillage Res. 2015, 153, 42–47. [Google Scholar] [CrossRef]
  23. Qiu, X.; Peng, D.; Wang, H.; Wang, Z.; Cheng, S. Minimum data set for evaluation of stand density effects on soil quality in larix principis-rupprechtii plantations in north China. Ecol. Indic. 2019, 103, 236–247. [Google Scholar] [CrossRef]
  24. Gun, Z.; Hu, Y.; Zheng, X. Evaluating the effectiveness of land use master plans in built-up land management: A case study of the jinan municipality, eastern China. Land Use Policy 2020, 91, 104369. [Google Scholar]
  25. Hu, Z. Spatial variability of physical properties of reclaimed soil in surface coal mine. J. China Univ. Min. Technol. 1992, 21, 34–40. (in Chinese). [Google Scholar]
  26. Zhou, W.; Yang, K.; Bai, Z.; Cheng, H.; Liu, F. The development of topsoil properties under different reclaimed land uses in the pingshuo opencast coalmine of loess plateau of China. Ecol. Eng. 2017, 100, 237–245. [Google Scholar] [CrossRef]
  27. Ge, J.; Wang, S.; Fan, J.; Gongadze, K.; Wu, L. Soil nutrients of different land-use types and topographic positions in the water-wind erosion crisscross region of China’s loess plateau. Catena 2020, 184, 104243. [Google Scholar] [CrossRef]
  28. Guan, Y.; Zhou, W.; Bai, Z.; Cao, Y.; Huang, Y.; Huang, H. Soil nutrient variations among different land use types after reclamation in the pingshuo opencast coal mine on the loess plateau, China. Catena 2020, 188, 104427. [Google Scholar] [CrossRef]
  29. Yuanyuan, S.; Mingjun, D.; Jian, T.; Xianchong, S.; Huili, W.; Qiyun, Q. Forest soil nutrient classification method based on spatial analysis. Pratacult. Sci. 2016, 33, 1112–1117. [Google Scholar]
  30. Liu, J.; Shan, A.; Wu, K.; Zhao, R. Interpretation and verification of agricultural land grading factors based on soil map. China J. Soil Sci. 2019, 50, 776–785. (In Chinese) [Google Scholar]
  31. Li, T.; Wang, H.; Zhou, Z.; Chen, X.; Zhou, J. A new grading system for plant-available potassium using exhaustive cropping techniques combined with chemical analyses of soils. Sci. Rep. 2016, 6, 37327. [Google Scholar] [CrossRef]
  32. Li, H.; Zhu, N.; Wang, S.; Gao, M.; Xia, L.; Kerr, P.G.; Wu, Y. Dual benefits of long-termecological agricultural engineering: Mitigation of nutrient losses and improvement of soil quality. Sci. Total Environ. 2020, 721, 137848. [Google Scholar] [CrossRef]
  33. Rongjiang, Y.; Jinsong, Y.; Xiaobing, C.; Ping, Z.; Xiufang, Z. Classification and fuzzy synthetic evaluation of soil nutrient at plough horizon in coastal region of north jiangsu province. Soils Fertil. Sci. China 2009, 4, 16–20. [Google Scholar]
  34. Tang, J.; Wang, C.; Lin, N.; Li, Z.; Li, H.; Mao, Z. Application of matter-element model in soil nutrient evaluation of ecological fragile region. Chin. Geogr. Sci. 2009, 19, 168–176. [Google Scholar] [CrossRef] [Green Version]
  35. IUSS Working Group WRB. World Reference Base for Soil Resources 2014. In International Soil Classification System for Naming Soils and Creating Legends for Soil Maps; World Soil Resources Reports: Rome, Italy, 2014. [Google Scholar]
  36. Otremba, K.; Tatuśko-Krygier, N.; Kozłowski, M. Chemical properties of technosols in post-mining areas of the konin–turek lignite basin in poland. Soil Sci. Annu. 2020, 71, 334–343. [Google Scholar] [CrossRef]
  37. Wang, J.; Yang, R.; Bai, Z. Spatial variability and sampling optimization of soil organic carbon and total nitrogen for minesoils of the loess plateau using geostatistics. Ecol. Eng. 2015, 82, 159–164. [Google Scholar] [CrossRef]
  38. Ibanez, J.J.; Dealba, S.; Bermudez, F.F.; Garciaalvarez, A. Pedodiversity—Concepts and measures. Catena 1995, 24, 215–232. [Google Scholar] [CrossRef]
  39. Fu, T.; Han, L.; Gao, H.; Liang, H.; Li, X.; Liu, J. Pedodiversity and its controlling factors in mountain regions—A case study of taihang mountain, China. Geoderma 2018, 310, 230–237. [Google Scholar] [CrossRef]
  40. Krasilnikov, P.V.; Gerasimova, M.I.; Golovanov, D.L.; Konyushkova, M.V.; Sidorova, V.A.; Sorokin, A.S. Pedodiversity and its significance in the context of modern soil geography. Eurasian Soil Sci. 2018, 51, 1–13. [Google Scholar] [CrossRef]
  41. Mikhailova, E.A.; Zurqani, H.A.; Post, C.J.; Schlautman, M.A.; Post, G.C. Soil diversity (pedodiversity) and ecosystem services. Land 2021, 10, 288. [Google Scholar] [CrossRef]
  42. XueLei, Z.; Jie, C.; Zitong, G. What to do in China after a review of researches practices on pedodiversity in Europe and America. Acta Ecol. Sin. 2004, 24, 1063–1072. (In Chinese) [Google Scholar]
  43. Ma, F.; Li, D. Comparison study on the application of correspondence analysis in diverse web sites evaluation. Inf. Sci. 2005, 03, 321–328. (In Chinese) [Google Scholar]
  44. Xiao, C.; Yanru, Z.; Xiaoyang, L.; Zhongke, B. Comprehensive evaluation of rock and soil quality of different geological stratum groups in pingshuo opencast coal mine reclamation area. Hydrogeol. Eng. Geol. 2021, 48, 164–173. [Google Scholar]
  45. Ahirwal, J.; Maiti, S.K.; Reddy, M.S. Development of carbon, nitrogen and phosphate stocks of reclaimed coal mine soil within 8 years after forestation with prosopis juliflora (sw.) dc. Catena 2017, 156, 42–50. [Google Scholar] [CrossRef]
  46. Lu, R.K. Soil and Agricultural Chemistry Analysis Methods; Chinese Agricultural Scientific and Technology Press: Beijing, China, 2000. (In Chinese) [Google Scholar]
  47. Helmke, P.A.; Sparks, D.L.; Page, A.L.; Loeppert, R.H.; Soltanpour, P.N.; Tabatabai, M.A.; Johnston, C.T.; Sumner, M.E. Lithium, Sodium, Potassium, Rubidium, and Cesium. Methods Soil Anal 1996, 5, 551–574. [Google Scholar]
  48. Journel, A.G. Mining Geostatistics; Academic Press: New York, NY, USA, 1978. [Google Scholar]
  49. Ren, Y.; Zhang, X. Multi-class geomorphic diversity and its relationship with pedodiversity in Henan province. Soils 2019, 51, 142–151. (In Chinese) [Google Scholar]
  50. Pielou, E.C. An Introduction to Mathematical Ecology; Wiley: New York, NY, USA, 1969. [Google Scholar]
  51. Chen, T.; Chang, Q.; Liu, J.; Clevers, J.G.P.W. Spatio-temporal variability of farmland soil organic matter and total nitrogen in the southern loess plateau, China: A case study in heyang county. Environ. Earth Sci. 2016, 75. [Google Scholar] [CrossRef]
  52. Fang, X.; Xue, Z.; Li, B.; An, S. Soil organic carbon distribution in relation to land use and its storage in a small watershed of the loess plateau, China. Catena 2012, 88, 6–13. [Google Scholar] [CrossRef]
  53. Completion Standards on Land Reclamation Quality; Ministry of Natural Resources of the People’s Republic of China: Beijing, China, 2013; TD/T 1036–2013. Available online: https://kns.cnki.net/kcms/detail/detail.aspx?dbcode=SCSD&dbname=SCSD&filename=SCSD000006658615&uniplatform=NZKPT&v=Oph4xQC-wrWHol1lTblnqhQovMFdEzHRRAi-FgrZGn6nP6W3jDtADcj7kW6hY6Do1HW4muPlnMQ%3d (accessed on 18 January 2022). (In Chinese)
  54. Cao, Y.; Wang, J.; Bai, Z.; Zhou, W.; Zhao, Z.; Ding, X.; Li, Y. Differentiation and mechanisms on physical properties of reconstructed soils on open-cast mine dump of loess area. Environ. Earth Sci. 2015, 74, 6367–6380. [Google Scholar] [CrossRef]
  55. Panchenko, L.; Muratova, A.; Turkovskaya, O. Use of medicago sativa in phytoremediation of polluted soils. In Advances in Environmental Research; Nova Science Publishers, Inc.: New York, NY, USA, 2021; Volume 80, pp. 1–53. [Google Scholar]
  56. Liu, X.; Bai, Z.; Zhou, W.; Cao, Y.; Zhang, G. Changes in soil properties in the soil profile after mining and reclamation in an opencast coal mine on the loess plateau, China. Ecol. Eng. 2017, 98, 228–239. [Google Scholar] [CrossRef] [Green Version]
  57. Šourková, M.; Frouz, J.; Šantrùčková, H. Accumulation of carbon, nitrogen and phosphorus during soil formation on alder spoil heaps after brown-coal mining, near sokolov (Czech Republic). Geoderma 2005, 124, 203–214. [Google Scholar] [CrossRef]
  58. Zhang, X. Pedodiversity: An opportunity for soil geographic studies. Soils 2014, 46, 1–6. [Google Scholar]
  59. Shannon, C.; Weaver, W. The Mathematical Theory of Communication; Illinois Press: Urbana, IL, USA, 1948. [Google Scholar]
  60. Glynn, D. Correspondence analysis. In Methods for Semantics: Quantitative Studies in Polysemy and Synonymy; John Benjamins Publishing Company: Amsterdam, The Netherlands, 2014; pp. 443–486. [Google Scholar]
  61. Greenacre, M.J. Correspondence analysis. Wiley Interdiscip. Rev. Comput. Stat. 2010, 2, 613–619. [Google Scholar] [CrossRef]
  62. Cao, Y.; Bai, Z.; Zhang, G.; Zhou, W.; Wang, J.; Yu, Q.; Du, Z. Soil quality of surface reclaimed farmland in large open-cast mining area of shanxi province. J. Agro-Environ. Sci. 2013, 32, 2422–2428. [Google Scholar]
  63. Zhao, Z.; Shahrour, I.; Bai, Z.; Fan, W.; Feng, L.; Li, H. Soils development in opencast coal mine spoils reclaimed for 1–13 years in the west-northern loess plateau of China. Eur. J. Soil Biol. 2013, 55, 40–46. [Google Scholar] [CrossRef]
  64. Liu, X. Spatial and Temporal Change of Soil Quality in the Artificially Disturbed Areas of the Open-Pit Coal Mine. Ph.D. Thesis, China University of Geosciences, Beijing, China, 2018. [Google Scholar]
  65. Yuan, Y.; Zhao, Z.; Niu, S.; Li, X.; Wang, Y.; Bai, Z. Reclamation promotes the succession of the soil and vegetation in opencast coal mine: A case study from robinia pseudoacacia reclaimed forests, pingshuo mine, China. Catena 2018, 165, 72–79. [Google Scholar] [CrossRef]
  66. Frouz, J.; Prach, K.; Pizl, V.; Hanel, L.; Stary, J.; Tajovsky, K.; Materna, J.; Balik, V.; Kalcik, J.; Rehounkova, K. Interactions between soil development, vegetation and soil fauna during spontaneous succession in post mining sites. Eur. J. Soil Biol. 2008, 44, 109–121. [Google Scholar] [CrossRef]
  67. Pinno, B.D.; Landhaeusser, S.M.; Chow, P.S.; Quideau, S.A.; MacKenzie, M.D. Nutrient uptake and growth of fireweed (Chamerion angustifolium) on reclamation soils. Can. J. For. Res.-Rev. Can. Rech. For. 2014, 44, 1–7. [Google Scholar] [CrossRef]
  68. Herath, D.N.; Lamont, B.B.; Enright, N.J.; Miller, B.P. Comparison of post-mine rehabilitated and natural shrubland communities in southwestern australia. Restor. Ecol. 2009, 17, 577–585. [Google Scholar] [CrossRef]
  69. Martínez-Ruiz, C.; Fernández-Santos, B.; Putwain, P.D.; Fernández-Gómez, M.J. Natural and man-induced revegetation on mining wastes: Changes in the floristic composition during early succession. Ecol. Eng. 2007, 30, 286–294. [Google Scholar] [CrossRef]
  70. Adeli, A.; McLaughlin, M.R.; Brooks, J.P.; Read, J.J.; Willers, J.L.; Lang, D.J.; McGrew, R. Age chronosequence effects on restoration quality of reclaimed coal mine soils in mississippi agroecosystems. Soil science. Soil Sci. 2013, 178, 335–343. [Google Scholar] [CrossRef]
  71. Shrestha, R.K.; Lal, R. Soil carbon and nitrogen in 28-year-old land uses in reclaimed coal mine soils of ohio. J. Environ. Qual. 2007, 36, 1775–1783. [Google Scholar] [CrossRef]
  72. Guan, Y.; Wang, J.; Zhou, W.; Bai, Z.; Cao, Y. Identification of land reclamation stages based on succession characteristics of rehabilitated vegetation in the pingshuo opencast coal mine. J. Environ. Manag. 2022, 305, 114352. [Google Scholar] [CrossRef] [PubMed]
  73. Acton, P.M.; Fox, J.F.; Campbell, J.E.; Jones, A.L.; Rowe, H.; Martin, D.; Bryson, S. Role of soil health in maintaining environmental sustainability of surface coal mining. Environ. Sci. Technol. 2011, 45, 10265–10272. [Google Scholar] [CrossRef] [PubMed]
  74. Amichev, B.Y.; Burger, J.A.; Rodrigue, J.A. Carbon sequestration by forests and soils on mined land in the midwestern and appalachian coalfields of the us. For. Ecol. Manag. 2008, 256, 1949–1959. [Google Scholar] [CrossRef] [Green Version]
Figure 1. Geographical location and distribution of quadrats in the study region ((a) Pingshuo coal mine in Shouzhou city in Shanxi Province; (b) the land reclamation design diagram of the inner dump; (c) the distribution map of soil sampling sites; (d1) field pictures in the cultivated land; (d2) field pictures in the grassland; (d3) field pictures in the forestland; and (d4) field pictures in the barren land).
Land 11 00321 g001
Figure 2. Methodological framework (CL. Cultivated land; GL. Grassland; FL. Forestland; BL. Barren land).
Land 11 00321 g002
Figure 3. Maps of soil nutrient grades in the study area (CL. Cultivated land; GL. Grassland; FL. Forestland; and BL. Barren land).
Land 11 00321 g003
Figure 4. Quantitative structure of soil nutrient grades under different land-use types (CL. Cultivated land; GL. Grassland; FL. Forestland; and BL. Barren land).
Land 11 00321 g004
Figure 5. Distribution diagram of the diversity index of different soil nutrient grades in the study area.
Land 11 00321 g005
Figure 6. Correspondence analysis maps between land-use types and soil nutrient grades (CL. Cultivated land; GL. Grassland; FL. Forestland; and BL. Barren land).
Land 11 00321 g006
Table 1. The soil nutrient grades for the study area and comparison with the Second National Soil Census Nutrient Grading Standard.
Soil NutrientSoil Nutrient Grading Range for the Study AreaThe Second National Soil Census Nutrient Grading Standard
GradeCodeGrading RangeGradeGrading Criterion
SAK (mg kg−1)Grade VISAK-VI52–75Grade Four50–100
Grade VSAK-V75–100
Grade IVSAK-IV100–125Grade Three100–150
Grade IIISAK-III125–150
Grade IISAK-II150–175Grade Two150–200
Grade ISAK-I175–181
SAP (mg kg−1)Grade VISAP-VI3.0–4.0Grade Five3–5
Grade VSAP-V4.0–5.0
Grade IVSAP-IV5.0–7.5Grade Four5–10
Grade IIISAP-III7.5–10.0
Grade IISAP-II10.0–15.0Grade Three10–20
Grade ISAP-I15.0–18.0
STN (g kg−1)Grade VISTN-VI0.18–0.20Grade Six<0.5
Grade VSTN-V0.20–0.24
Grade IVSTN-IV0.24–0.28
Grade IIISTN-III0.28–0.32
Grade IISTN-II0.32–0.36
Grade ISTN-I0.36–0.40
SOM (g kg−1)Grade VISOM-VI2.3–2.8Grade Six<6
Grade VSOM-V2.8–3.3
Grade IVSOM-IV3.3–3.8
Grade IIISOM-III3.8–4.3
Grade IISOM-II4.3–4.8
Grade ISOM-I4.8–5.2
Table 2. Diversity indices of soil nutrient grades under different land-use types.
YearSoil NutrientLand-Use TypeThe Whole Study Area
Cultivated LandForestlandGrasslandBarren Land
SHESHESHESHESHE
2013SAK2.00.20.33.00.70.72.00.60.92.00.71.03.00.60.6
SAP3.01.00.93.00.40.34.00.80.62.00.10.25.00.90.5
STN2.00.20.31.00.00.02.00.40.51.00.00.02.00.50.8
SOM2.00.71.03.00.30.33.00.80.73.00.40.43.00.70.7
Average
value
2.30.50.62.50.30.32.80.60.72.00.30.43.30.70.6
2017SAK2.00.60.95.01.10.75.01.00.63.00.90.86.01.10.6
SAP3.00.70.63.00.90.83.00.50.52.00.71.04.01.20.8
STN4.01.20.94.01.10.85.01.10.73.00.90.85.01.20.8
SOM6.01.40.84.01.00.75.01.40.92.00.30.56.01.40.8
Average
value
3.81.00.84.01.00.84.51.00.72.50.70.85.31.20.8
Table 3. Pearson correlation coefficients between soil nutrients under different land-use types in 2017.
Land-Use TypeSoil NutrientSoil Nutrient
SAPSAKSTNSOM
cultivated landSAP10.642 *−0.715 **−0.315
SAK0.642 *1−0.0350.057
STN−0.715 **−0.03510.503
SOM−0.3150.0570.5031
forestlandSAP1−0.312−0.1790.003
SAK−0.31210.089−0.050
STN−0.1790.08910.218
SOM0.003−0.0500.2181
grasslandSAP10.2050.3570.218
SAK0.20510.2810.177
STN0.3570.28110.748 **
SOM0.2180.1770.748 **1
barren landSAP1−0.526−0.838 *−0.088
SAK−0.52610.7460.248
STN−0.838 *0.74610.433
SOM−0.0880.2480.4331
Note: * represents significant differences at the 0.05 confidence level, and ** represent significant differences at the 0.01 confidence level.
Publisher’s Note: MDPI stays neutral with regard to jurisdictional claims in published maps and institutional affiliations.

