Article

Assessment and Prediction of Carbon Storage Based on Land Use/Land Cover Dynamics in the Tropics: A Case Study of Hainan Island, China

1
School of Architecture, Tianjin University, Tianjin 300072, China
2
School of Civil Engineering, Queen’s University, Kingston, ON K7L 3N6, Canada
*
Author to whom correspondence should be addressed.
Land 2022, 11(2), 244; https://doi.org/10.3390/land11020244
Submission received: 11 January 2022 / Revised: 31 January 2022 / Accepted: 3 February 2022 / Published: 6 February 2022
(This article belongs to the Topic Climate Change and Environmental Sustainability)

Abstract

:
Land use and land cover (LULC) change in tropical regions can cause huge amounts of carbon loss and storage, thus significantly affecting the global climate. Due to the differences in natural and social conditions between regions, it is necessary to explore the correlation mechanism between LULC and carbon storage changes in tropical regions from a broader geographical perspective. This paper takes Hainan Island as the research object, through the integration of the CA-Markov and Integrated Valuation of Ecosystem Services and Tradeoffs (InVEST) models, based on multi-source data, analyses the dynamics of LULC and carbon storage from 1992 to 2019 and the relationship between the two, and predicts future LULC and carbon storage under different scenarios. The results show that (1) the built-up land area of Hainan Island expanded from 103.59 km2 to 574.83 km2 from 1992 to 2019, an increase of 454.91%; the area of cropland and shrubland decreased; and the area of forest increased. (2) Carbon storage showed an upward trend during 1992–2000, and a downward trend during 2000–2019. Overall, LULC changes during 1992–2019 reduced carbon storage by about 1.50 Tg. (3) The encroachment of cropland in built-up land areas is the main reason for the reduction of carbon storage. The conversion of shrubland to forest is the main driving force for increasing carbon storage. The increase and decrease of carbon storage have obvious spatial clustering characteristics. (4) In the simulation prediction, the natural trend scenario (NT), built-up land priority scenario (BP) and ecological priority scenario (EP) reduce the carbon storage of Hainan Island, and the rate of decrease is BP> NT > EP. The cropland priority scenario (CP) can increase the LULC carbon storage, and the maximum increase in 2050 can reach 0.79 Tg. This paper supplements and improves the understanding of the correlation between LULC and carbon storage changes in tropical regions, and can provide guidance for the optimization of LULC structure in tropical regions with high economic development from a low-carbon perspective.

1. Introduction

The negative impacts of global climate change have profoundly changed people’s perception of carbon, and the way human society gets along with the earth’s ecosystem is being tested. Enhancing the amount of carbon storage by the earth’s ecosystem and reducing carbon emissions to enhance the sustainability of human social development have become important issues to be addressed [1,2,3,4]. Land use and land cover (LULC) [5] is the most intuitive and widespread representation of surface systems, covering four types of carbon storage carriers: above-ground biomass, below-ground biomass, soil biomass, and dead biomass [6], which can directly and prominently contribute to carbon storage and carbon emissions [7,8]. Along with the world’s economic growth and resource exploitation, the type, amount, and spatial distribution of LULC are changing more and more frequently, resulting in more than 30% of global carbon emissions [9,10]. Assessing past and predicting future LULC changes, and thus exploring the response relationship between LULC changes and carbon storage changes, is important for rationalising LULC planning and socio-economic activities.
For a long time, because the tropics have a higher carbon density than other temperature zones [11], and due to the continuous emergence of deforestation due to the need for economic development [12], their LULC types have changed significantly [13], so they have consistently been the hotspot of related research. Many current studies have focused on the Amazon [14], central Africa [15], and the equatorial rainforests of Southeast Asia [16], while other tropical regions are very limited. Deforestation in the São Francisco River Basin (SFRB) in South America resulted in a total loss of 133.19 Tg of carbon [17], while LULC carbon storage in coastal Bangladesh showed an increasing trend as the area of planted forests increased [18]. In order to increase the income of farmers or the government, deforestation has occurred in the Amazon [19], Central Africa [20], and Southeast Asia [21] to expand the planting area, which has changed the original LULC composition and reduced the regional carbon storage. The above studies help to understand how LULC changes in the near equatorial region and how it affects carbon storage, and can provide a clear conclusion that changes in forest area are a vital factor [22]. However, as a global issue [23], it is not enough to study only certain regions when we deal with climate change. The scope of research needs to be expanded to better understand the relationship between LULC and carbon storage in tropical regions [24].
As a large tropical island, Hainan Island is located south of the Tropic of Cancer, with a very complex population structure and rapid economic and social evolution [25,26,27,28]. Current research on LULC change often selects a very limited number of different years for comparative analysis [29], which cannot reveal more specific change details, and it is difficult to exclude time errors. Carbon storage studies have focused on specific LULC types, such as coastal mangrove [30] or forest [31], or small administrative regions, such as Sanya [32] or Dongzhaigang [33]. In conclusion, there is a lack of research on the long-term dynamics of LULC in Hainan Island, the transformation mechanism between different types of LULC is still unclear, and long-term quantitative data for carbon storage assessment is also lacking. The implementation of economic and social policies has exacerbated the complexity of Hainan Island’s ecosystem [34]. Qualitatively, Hainan Island has actively responded to the country’s forest conservation policies [35]. Against this background, there is no clear understanding of the expansion path of built-up land. At present, Hainan Island is receiving policy support at the national level [36], and the types of industries and population are undergoing drastic changes [37,38,39,40]. Therefore, in order to optimize low-carbon development, it is urgent to simulate changes in LULC under different development scenarios in the future, and to evaluate the corresponding carbon storages based on reliable data and methods on Hainan Island [41]. Whether it is LULC modelling or carbon storage assessment, appropriate methods and tools are critical. LULC prediction models have experienced many iterations and are widely used in LULC simulations of different scenarios in the future [42,43,44]. The core of these models is the CA-Markov algorithm [45]. Specifically, many extended models from different sources have been applied to practical research, such as IDRISI Selva [46], the future land use simulation model (FLUS) [47], and patch-generating LULC simulation (PLUS) [48]. Recent studies have pointed out that the accuracy of PLUS model is higher than that of other models [48]. Currently, there are two main ways to evaluate carbon storage: one is to quantify based on geophysical and chemical processes [49], and the other is to evaluate based on geographical methods of carbon density and LULC [50]. Some recent studies have pointed out that the research based on geophysical and chemical processes has extremely strict requirements for parameters, so the accuracy of large-scale carbon storage evaluation is not ideal [51]. The Integrated Valuation of Ecosystem Services and Tradeoffs (InVEST) [52] model was developed by the Natural Capital Project of Stanford University and has shown superior performance in many large-scale carbon storage evaluation [53].
By integrating the CA-Markov-based and InVEST models, some new insights have been discovered, showing their strong adaptability in LULC prediction and carbon storage assessment. These study areas vary in size and location [54,55,56,57,58]. Grassland degradation in arid areas of Northwest China is the main factor for the decline of carbon storage. If the development pattern is not changed, the model predicts that carbon storage will continue to decline in the future [54]. With the implementation of ecological protection policies, the carbon storage of the Loess Plateau is increasing. Under different development scenarios, the model calculation shows that there are significant differences in future carbon storage [55]. Human activities have preliminarily affected the LULC structure of Sariska Tiger Reserve in India. If not controlled, the model predicts that the carbon storage in the region will be further reduced in the future [56]. In Wuhan and Nanning, China, the expansion of urban built-up land area is the leading factor in the reduction of carbon storage. The model prediction results point out that an integrated and regulated development pattern can reduce the loss rate of carbon storage in the future [57,58]. The results predicted by the above models provide useful guidance for low-carbon development policies in corresponding regions [54,55,56,57,58].
In this study, we integrated the PLUS model and InVEST model to try to clarify these issues: (1) How did the LULCs of Hainan Island change from 1992 to 2019, and how were the transformations among different LULCs? (2) From 1992 to 2019, how did LULC change affect carbon storage change, and which change was the most critical to carbon storage change? (3) What development scenario is most conducive to improving Hainan Island’s future carbon storage? Is the emphasis on forest conservation the most critical, as in other tropical regions such as the Amazon [59]? This study emphasizes the local characteristics of LULC and carbon storage change, which can supplement the understanding of the mechanism of the relationship between LULC and carbon storage change in tropical regions, and provide specific guidance for the future low-carbon development of Hainan Island.

2. Data Sources and Research Methods

2.1. Overview of the Study Area

Hainan Island is located in the northwestern part of the South China Sea, 108°37′–111°03′ E and 18°10′–20°10′ N (Figure 1). It is the second largest island in China, with a total area of 33,900 km2 and a population of about 10.08 million people, and is separated from Guangdong Province in the north by the Qiongzhou Strait and from Vietnam in the west by the Beibu Gulf. Hainan Island has an elliptical land plane, with a high altitude in the southwest and a low altitude in the northeast, with a clear gradient structure. According to the Köppen climate classification, Hainan Island is mainly located in the tropical monsoon climate (Aw) and the tropical wet and dry or savanna climate (Am) regions, with a few areas in the humid subtropical climate (Cwa) [60] with an average annual precipitation of 1639 mm, an average annual temperature of 22–27 °C, and 1750–2650 h of sunshine per year. Hainan Island is rich in flora and fauna, with a high proportion of cropland in the total area of the island and the basic mode of agriculture being rice fields. In addition, Hainan Island is an important tourist destination in China and was established as a special economic zone in 1988 and as a pilot free trade zone in 2018.

2.2. Data Sources

In this study, we used data from multiple sources (Table 1). LULC data from 1992 to 2019 were sourced from the European Space Agency’s (ESA) Climate Change Initiative (CCI). The LULC data were used for LULC dynamics analysis, carbon storage calculations, and future LULC scenario modelling. The overall accuracy of this dataset is above 90% and covers a full range of years, which is well suited to the needs of this study. CCI’s original maps cover many kinds of LULC types all over the earth, and there are seven land use and land cover types in Hainan Island: cropland, forest, shrubland, grassland, built-up land, wetland, and water. It should be noted that these classifications can represent basic land use and land cover types, but cannot reflect tree species differences or tree ages in more detail. For forest and shrubland, for example, the classification is based on the volume of vegetation and height. Due to the limitation of resolution, this classification standard has been widely used in previous macro-scale related research [54,55,61], and we also follow this standard. Further, built-up land refers to the ground occupied by towns and cities, but also includes some large villages and enterprise plants. Cropland denotes rice fields and forest denotes the surface occupied by various types of trees. Shrubland represents the surface occupied by various types of shrubs. Grassland represents the land surface occupied by various types of herbaceous plants. Wetland represents the land surface occupied by mangroves. Water represents the land surface occupied by rivers, reservoirs, lakes, etc.
The data that drive LULC change can be divided into three main categories (Figure 2): (1) meteorological data from the National Meteorological Information Center, which were processed to obtain annual mean temperature maps and annual mean precipitation maps; (2) socio-economic data from the National Earth System Science Data Center, including population density maps, GDP maps, railway maps, road maps, provincial capital location, city location, county location, and village location, while the distance map was obtained through the ArcMap 10.8 Euclidean Distance Tool; (3) physical geography data including DEM, slope map, aspect map, and river map. The DEM was obtained from the United States Geological Survey (USGS), the river map from the National Earth System Science Data Center, and the slope map and the aspect map were obtained by processing the DEM in ArcMap 10.8.
The LULC data from 1992 to 2019 were used for the change analysis, and the data of 2010, 2015, and 2019 were also used for the LULC simulation combined with the PLUS model to obtain suitable model parameters. The driving factor year of LULC transition was kept around 2015, which is in line with the operating principle of the PLUS model [48], and ensures the accuracy of future LULC simulations by simulating and validating the LULC distribution in 2019. Elevation rarely changes significantly over time, and combined with data accuracy, we chose DEM data with a resolution of 30 m in 2000.
In addition to the spatial data described above, carbon density data (Table 2) were used as input to the Integrated Valuation of Ecosystem Services and Tradeoffs (InVEST) model for carbon storage estimation The carbon density data for each LULC type are divided into four areas: aboveground carbon density (Ca), belowground carbon density (Cb), soil organic carbon density (Cs), and dead organic carbon density (Cd). The carbon density data were mainly cited from China’s terrestrial ecology in the 2010s systematic carbon density dataset [62], which summarises carbon density measurements recorded in previous literature, and we selected data points from the Hainan Island section according to geographical extent and processed them by taking the mean value. Due to the time constraints of the above dataset, we referenced recent studies [63,64]. For LULC types where data were lacking, data from similar areas were consulted to finally refine the required carbon density data [65,66,67,68].

2.3. Methods

The research consisted of three main parts, namely, analysis of historical LULC dynamics, simulation of multiple scenarios of future LULC, and estimation and comparison of carbon storage under different LULC. Figure 3 shows the overall research flow of this study.

2.3.1. Analysis of LULC and Carbon Storage Dynamics

This study used a LULC transfer matrix for LULC change analysis, which helped to identify the types of LULC transfers that have a significant impact on carbon storage change. The transfer matrix is described as follows:
P = p 11 p 1 n p n 1 p n n
where P represents the LULC transfer matrix between years and the element p i j in the matrix represents the probability or absolute area of transfer from type i to type j .
The Field Calculator in ArcGIS 10.8 was used to map the spatial location of LULC conversions to demonstrate the spatial distribution preferences and patterns of conversions between specific types of LULC.
The Getis-Ord Gi* tool was used to identify spatial clusters of statistically significant increases and decreases in carbon density to analyse trends in the spatial distribution of carbon density change. The Getis-Ord Gi* tool uses z-values, p-values, and confidence intervals to characterise the spatial clustering pattern of the input elements. Higher z-values and smaller p-values indicate high value clustering, while lower z-values and smaller p-values indicate low value clustering. When the p-value is greater than 0.1 it is not considered to be significant. Corresponding the p- and z-values, there are four confidence intervals of +3/−3, +2/−2, +1/−1, and 0, representing statistical significance at the 99%, 95%, and 90% confidence levels respectively, with positive values representing hot spots and negative values representing cold spots [69].

2.3.2. LULC Simulation with Markov-PLUS Model

(1)
Multi-Scenario LULC Demand Calculation
The Markov model has good robustness in quantitative forecasting over a large time span and was therefore used to calculate the probability of LULC conversion between different years on Hainan Island and to estimate future LULC demand [70]. The principle of the Markov model can be described as follows:
D t 2 = D t 1 × P t 2 t 1 a
where D t 2 denotes LULC demand at t 2 ; D t 1 denotes LULC status at t 1 ; P is the same as described in Formula (1); and a denotes the difference between the starting and ending years for calculating P .
Forecasting LULC demand for different future scenarios requires first determining the basic transfer probability matrix, and then adjusting the elements in the basic matrix to obtain the transformation probabilities for a given scenario. The different transfer probabilities largely reflect differences in policies and other factors acting on future development. Four future development scenarios are constructed in this paper [54,55,71]: (1) natural trend scenario (NT), which assumes that future LULC will continue the conversion pattern of the previous period; (2) built-up land priority scenario (BP), in which economic development is accelerated and the proportion of other LULC types converted to built-up land areas is increased; (3) cropland priority scenario (CP), strengthening the protection and cultivation of cropland and strictly restricting the conversion of cropland to other LULC types; and (4) ecological priority scenario (EP), strengthening the protection of LULC types with outstanding ecological functions and restricting the conversion of forest and grassland to other LULC types. The above process was programmed in MathWorks MATLAB R2021a for implementation.
(2)
Future LULC Simulation and Validation
The patch-generating LULC simulation model (PLUS) was used for future LULC simulations because of its higher accuracy compared to other software [48]. The PLUS model uses a random forest classification (RFC) algorithm to dig the drivers of LULC expansion, and generates LULC distribution maps based on a CA model containing multi-type random patch seeds and a descending threshold.
The random forest classification (RFC) algorithm is an integrated decision tree-based classifier that takes a random sample from the LULC expansion map, calculates the relationship between the expansion of each LULC type and the drivers described in Section 2.2, and obtains the probability of expansion for each type of LULC at each image pixel, with the following equation [48]:
P i , k d x = n = 1 M I h n x = d M
where P i , k represents the probability of expansion of LULC type k at location i ; the value of d is 1 or 0, where 1 means that conversion of other types to type k occurred at that location and 0 means no conversion; x is the vector of drivers; I h n x = d is the indicator function of the set of decision trees; h n x is the predicted type of the n th decision tree of vector x ; and M is the total number of decision trees.
The CA model influences LULC competition through an adaptive factor to achieve the required amount of any type, while the combination of multi-type random patch seeds and a descending threshold allows for the spatio-temporal dynamic simulation of the automatic generation of LULC patches. The CA model equation is as follows [72]:
S t + 1 = f S t , N
where S t and S t + 1 represent the state of the LULC cell at moments t and t + 1 , respectively; N represents the neighbourhood of the cell; and f represents the LULC conversion rule.
The distribution of LULC conversions from 2010 to 2015 was first calculated, together with the potential drivers maps, and input into the PLUS model to obtain the spatial probability of LULC conversions. Next, the 2015 LULC distribution map was used as the basis, and the actual LULC quantities in 2019 were used as the set values to obtain the simulated one. The model parameters were adjusted repeatedly, the actual LULC distribution map was compared with the simulated one, and the overall accuracy and kappa coefficients were used to evaluate the superiority of the simulation.

2.3.3. Carbon Storage Estimation with the InVEST Model

The Integrated Valuation of Ecosystem Services and Tradeoffs (InVEST) model was used to carry out simulations of carbon storage and distribution. An Excel table (Table 2) containing carbon densities of aboveground, belowground, soil organic, and dead organic biomass for different LULC types was entered into the model to participate in the calculations, and the mathematical principle of the model is as follows [8]:
C = m = 1 n S m × C m a + C m b + C m s + C m d
where C represents the total carbon storage in the study area; m represents the LULC type; n represents the number of LULC types; S m represents the area of LULC type m ; and C m a , C m b , C m s , and C m d represent the carbon density of the aboveground, belowground, soil organic, and dead organic biomass of LULC type m , respectively.

3. Results

3.1. LULC and Carbon Storage Dynamics from 1992 to 2019

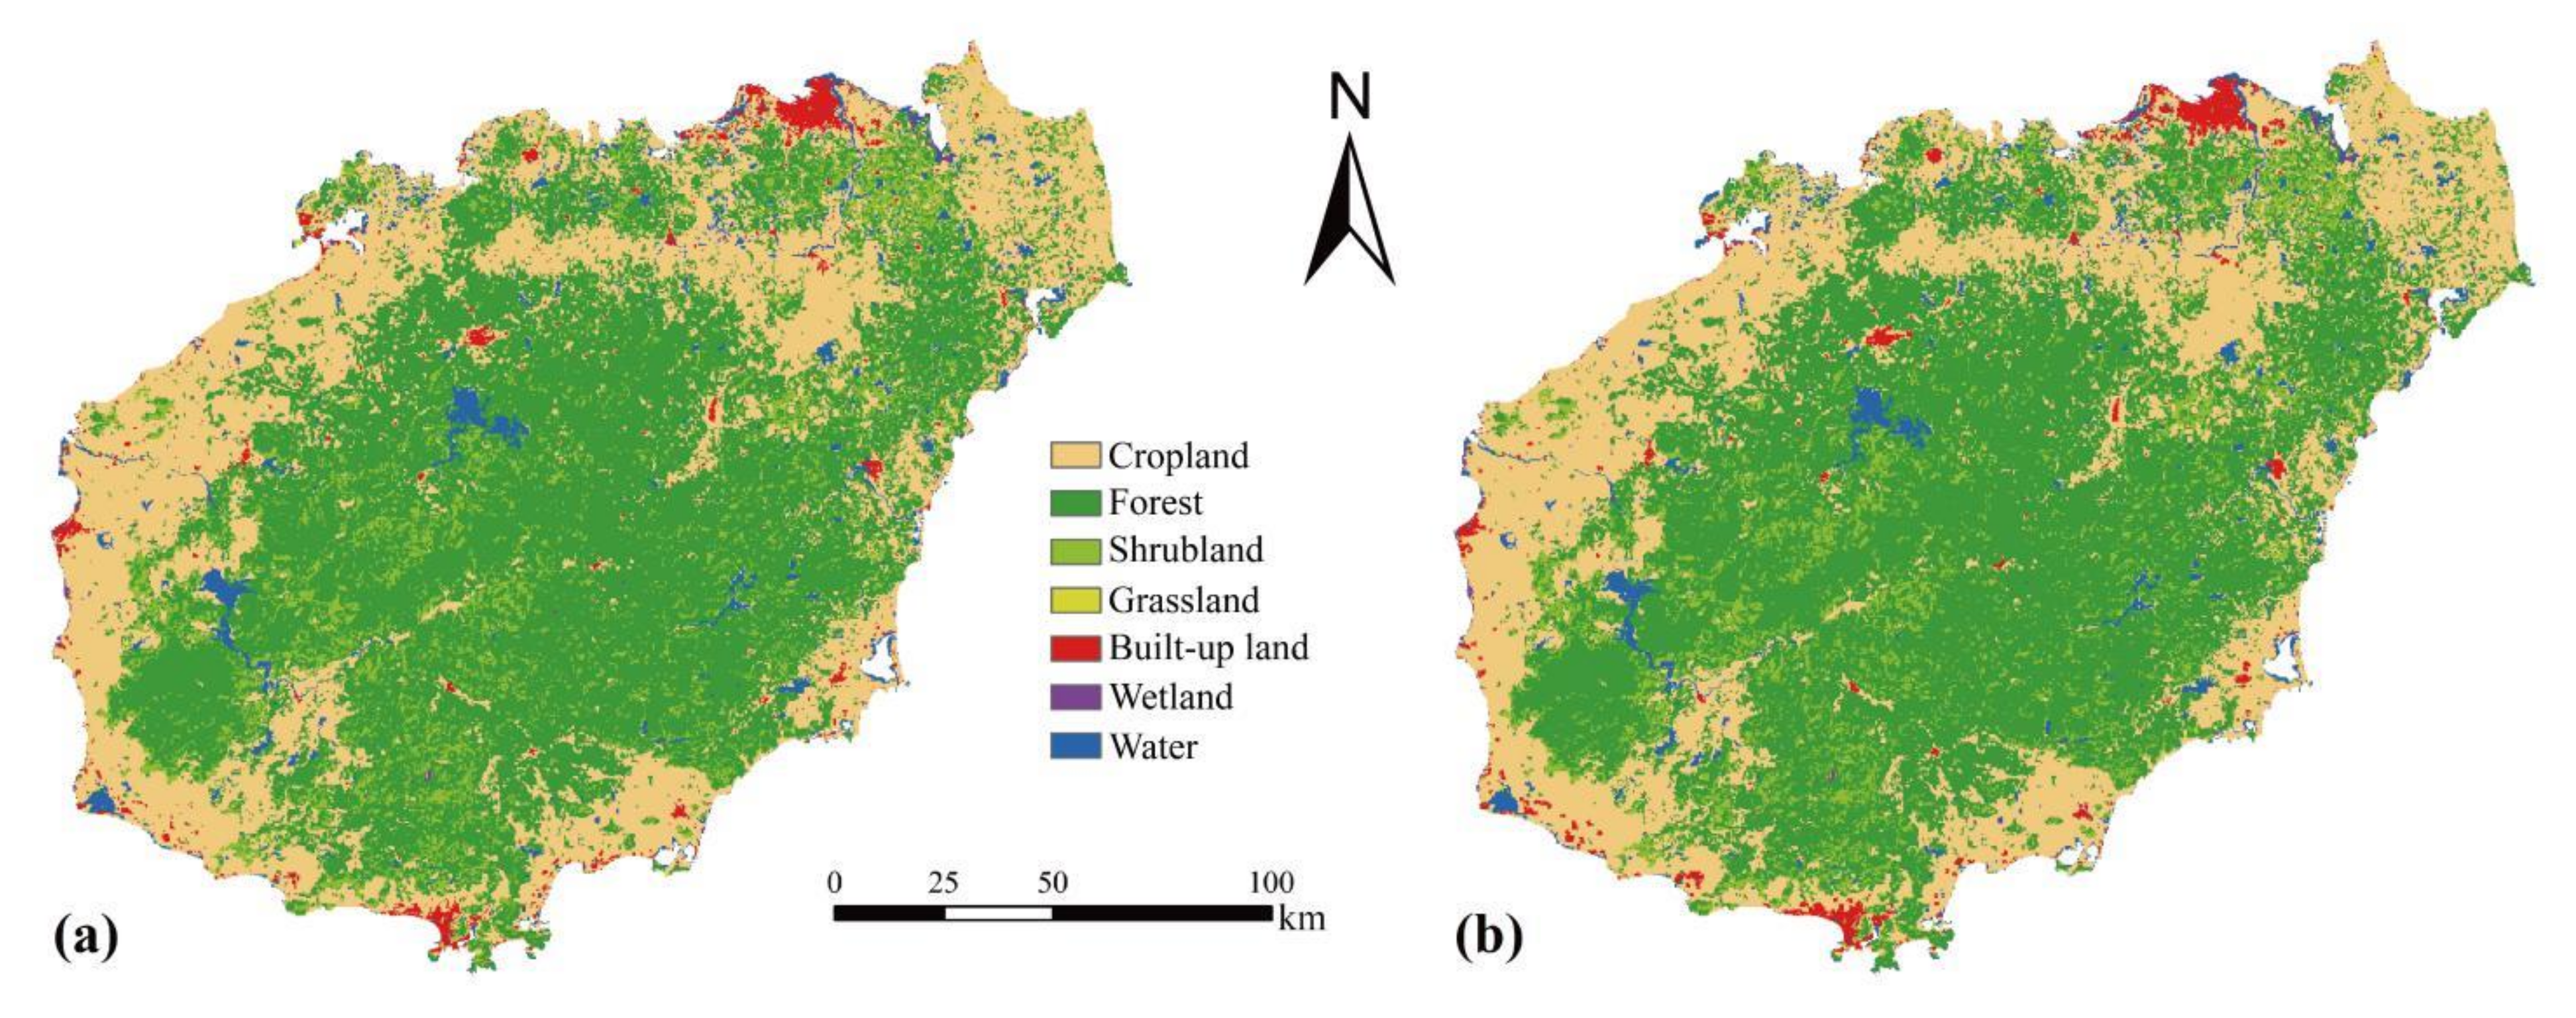
3.1.1. LULC Dynamics from 1992 to 2019 in Hainan Island

From 1992 to 2019, the area changes of different LULC types in Hainan Island varied significantly (Figure 4). Cropland, shrubland, grassland, and water were the LULC types with a net decrease, with cropland having the largest net transfer out at 365.76 km2 and a decrease of 3.03%, and shrubland having the highest decrease of 12.73%. Built-up land, forest, and water are the types of LULC that had a net increase. Among them, the net increase area and net increase ratio of built-up land areas were the highest, at 471.24 km2 and 454.91%, respectively, and the average annual net increase rate was 17.45 km2/a. This corresponds to the rapid development of built-up land construction represented by Haikou and Sanya cities during the 28-year period, with the built-up land area expanding continuously (Figure 5). Ranking the location stability of the various LULC type zones from 1992 to 2019 from highest to lowest, they were built-up land, forest, water, cropland, wetland, shrubland, and grassland, in that order (Table 3). The built-up land areas in 1992 were still built-up land areas in 2019, and had not changed to other LULC types. During this period, other LULC types transformed to built-up land areas to varying degrees. The overall grassland area was the smallest, at 35.46 km2, and its location changes were the most. In 2019, only 67.26% of 1992’s grassland remained unchanged and the rest of the grassland was converted to other LULC types; 24.50% of the grassland was converted from other LULC types.

3.1.2. Carbon Storage Dynamics from 1992 to 2019 in Hainan Island

From 1992 to 2019, the total LULC carbon storage on Hainan Island showed a significant (p < 0.05) decreasing trend, ranging from 429.69 Tg to 431.77 Tg. The year 2000 was the turning point, with carbon storage showing a significant (p < 0.05) increasing and significant (p < 0.05) decreasing trend in the two time periods before and after, with an average rate of increase and decrease of 0.072 Tg/a and 0.11 Tg/a, respectively. The R2 values of the fitted carbon storage changes over the three time periods were 0.65, 0.81, and 0.95, respectively, all with good interpretation. The carbon storage in different strata varied widely during 1992–2019, with carbon storage in the order of high to low in the soil organic layer, aboveground biomass layer, belowground biomass layer, and dead organic layer. Aboveground biomass carbon storage showed a significant (p < 0.05) increasing trend; belowground biomass carbon storage, although fluctuating widely from year to year, still showed an overall increasing trend, but the correlation with year was weak (R2 = 0.45, p < 0.05); soil organic carbon storage showed a significant (p < 0.05) increasing trend before 2000 and a significant (p < 0.05) decreasing trend after 2000, with an overall increasing trend (R2 = 0.85, p < 0.05); and dead organic carbon storage increased significantly (p < 0.05) before 2000 and decreased significantly (p < 0.05) after 2000, with no overall trend associated with year (R2 = 0, p > 0.05) (Figure 6).
The density of carbon storage in different areas of Hainan Island is clearly differentiated, with high-density carbon storage areas concentrated in the central part of the island and a low-density carbon storage ring around the coast (Figure 7). Although local changes in carbon storage density occurred from 1992 to 2019, this overall distribution did not change significantly. From 1992 to 2019, the patches of increasing and decreasing carbon storage were evenly distributed across the southwestern part of Hainan Island, with more patches of decreasing carbon storage than increasing patches in the built-up land and surrounding areas. The distribution of carbon storage changes varied between the different sub-periods, with the year 2000 being the boundary, with the first period of carbon storage change occurring mainly in the southwestern part of Hainan Island, and the latter period being more evenly distributed across Hainan Island as a whole (Figure 8).
The Getis-Ord Gi* hotspot analysis of carbon storage changes from 1992 to 2019 shows that, overall, patches with increasing and decreasing carbon storage have some clustering characteristics. The clustering characteristics are more pronounced for patches with decreasing carbon storage, with the vast majority of patches with decreasing carbon storage falling within or above the 90% confidence interval, meaning that neighbouring patches with decreasing carbon storage tend to have similar reduction values. The number of patches with clustering characteristics that increase carbon storage is about the same as the number of patches without clustering characteristics, meaning that nearly half of the patches that increase carbon storage in close proximity are numerically random. Specifically, patches with a large increase in carbon storage formed clustering hotspots in the bay area of the three rivers entering the estuary, namely, Dongzhai Port, Bamen Bay, and Danzhou Bay, indicating that mangrove conservation has had a positive ecological effect over time [73], while patches with a small increase in carbon storage formed clustering coldspots in the sub-built-up land areas of Haikou. Patches with large decreases in carbon storage formed clustering hotspots around Hainan Island with Haikou and Sanya as the core, while patches with small decreases in carbon storage formed clustering coldspots in the southwestern part of Hainan Island (Figure 9). The clustering characteristics of a patch’s carbon storage changes reflect the transformation of LULC. The confidence level for the clustering of patches with decreasing carbon storage around cities is 99%, closely related to the uniform conversion of cropland to built-up land. Patches with increasing carbon storage in southwest Hainan Island do not have clustering characteristics, corresponding to a complex transformation relationship intertwined between cropland, forest, grassland, and shrubland.

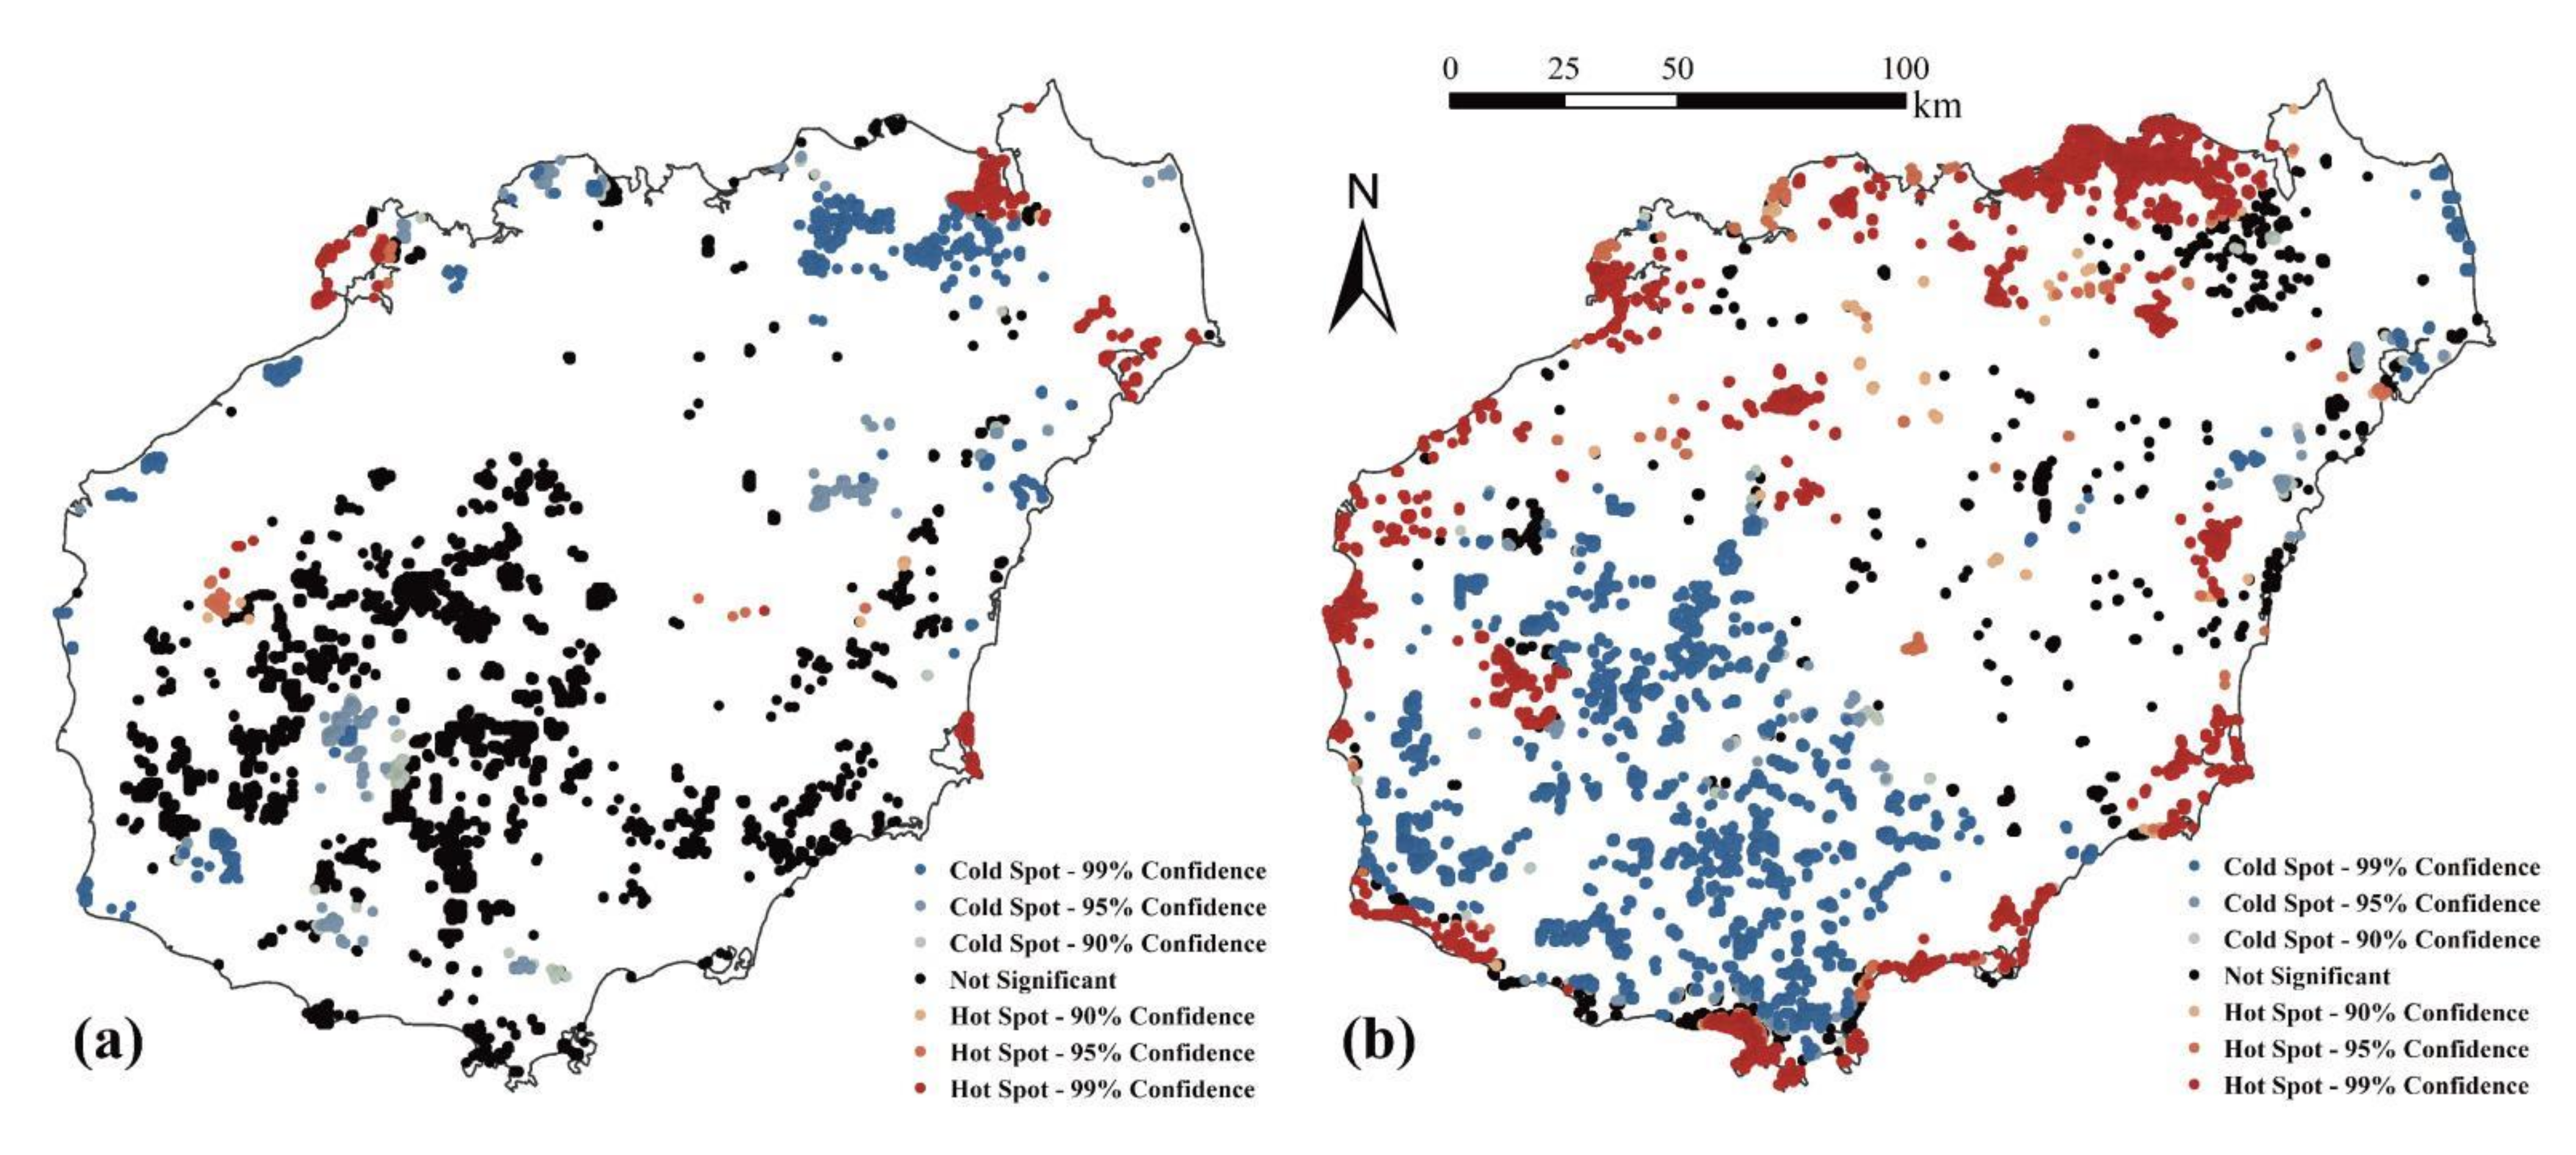
3.2. Response of Carbon Storage to LULC Changes

Carbon storage changes depend on the transformation patterns between LULC types, with some transformations between LULC types enhancing carbon storage and others reducing them. The transformation between different LULC types on Hainan Island is complex, and the overall carbon storage change is the result of a combination of carbon storage changes along multiple pathways, with cropland, forest, and built-up land areas being the key LULC types affecting carbon storage change, and the LULC type transformation associated with them causing the largest amount of carbon storage change.
From 1992 to 2019, the loss of carbon storage on Hainan Island due to the conversion from cropland to other types was 3.07 Tg (Table 4). The transformation of cropland to built-up land areas was the largest, at 434.52 km2, resulting in a loss of carbon storage of 2.95 Tg. Compared to the period before 2000, the average rate of transformation of cropland to built-up land areas accelerated significantly after 2000, when the development of the real estate industry on Hainan Island accelerated [74] and the average rate of carbon storage loss was more than 10 times that of the previous period. The transformation of cropland to water and grassland also occurred, but due to the small size of the area, the resulting carbon storage loss was more limited. The implementation of ecological restoration policies, represented by the return of cropland to forest, contributed to the transformation of some cropland into three types of ecological areas: forest, shrubland, and wetland, bringing an increase in carbon storage of 0.56 Tg, but it was far from enough to compensate for the loss of carbon storage caused by the transformation of cropland into built-up land areas.
From 1992 to 2019, the conversion of other LULC types to forest increased carbon storage by 2.61 Tg. The conversion of shrubland to forest had the largest area of 506.97 km2 and increased carbon storage by 2.19 Tg, but the rate of conversion of shrubland to forest decreased significantly after 2000.Combining Figure 4 and Figure 5, it is clear that the area of forest shrank after 2016, and the space for forest expansion became saturated, which had a negative effect on carbon storage. The conversion of cropland to forest increased carbon storage by 0.42 Tg; the conversion of wetland and water to forest was minimal, resulting in very limited reduction and increase in carbon storage, respectively; built-up land area was in continuous high expansion, and grassland was mainly converted to built-up land and cropland, so they did not produce a conversion to forest, resulting in no gain or loss of carbon storage (Table 5). Unlike tropical regions such as South America, Southeast Asia, and central Africa, where the reduction in carbon storage is due to the shrinking of forest areas [75,76,77,78,79], the change in carbon storage due to the change in forest on Hainan Island is positive, and even though some of the increase in carbon storage is offset by the reduction in carbon storage due to the transfer out of cropland, a small increase in carbon storage can still be maintained.
From 1992 to 2019, the decrease in LULC carbon storage on Hainan Island caused by the continuous increase in built-up land area was 3.24 Tg, the absolute amount of change being greater than the absolute amount of change in carbon storage caused by the decrease in cropland or the increase in forest, and is the most critical aspect of carbon storage change on Hainan Island (Table 6). Apart from the shift from cropland to built-up land areas, which caused the greatest decrease in carbon storage as described above, the shift from forest, shrubland, grassland, and wetland to built-up land areas was more evenly distributed and caused a loss of carbon storage in the range of 0.04–0.18 Tg. Although the shift of water to built-up land areas increased carbon storage by 0.04 Tg, it was not enough to compensate for the loss of carbon due to other shifts, and as water is of high ecological value and should generally be more protected, this shift suggests that the expansion of built-up land areas on Hainan Island is not justified. It is worth noting that, using 2000 as the cut-off year, the rate of conversion of the remaining LULC types to built-up land areas increased significantly between 2000 and 2019 compared to the period 1992–2000, resulting in an accelerated rate of carbon storage loss. This trend is in sharp contrast to the shrinking trend of forest mentioned above, and the pressure of carbon storage on Hainan Island has increased. At the same time, this rate of change also highlights the increasingly negative ecological impacts of the type of economic development dominated by real estate development [80], making it increasingly important to control the dramatic expansion of built-up land areas.

3.3. LULC and Carbon Storage Changes in Hainan Island under Different Future Scenarios

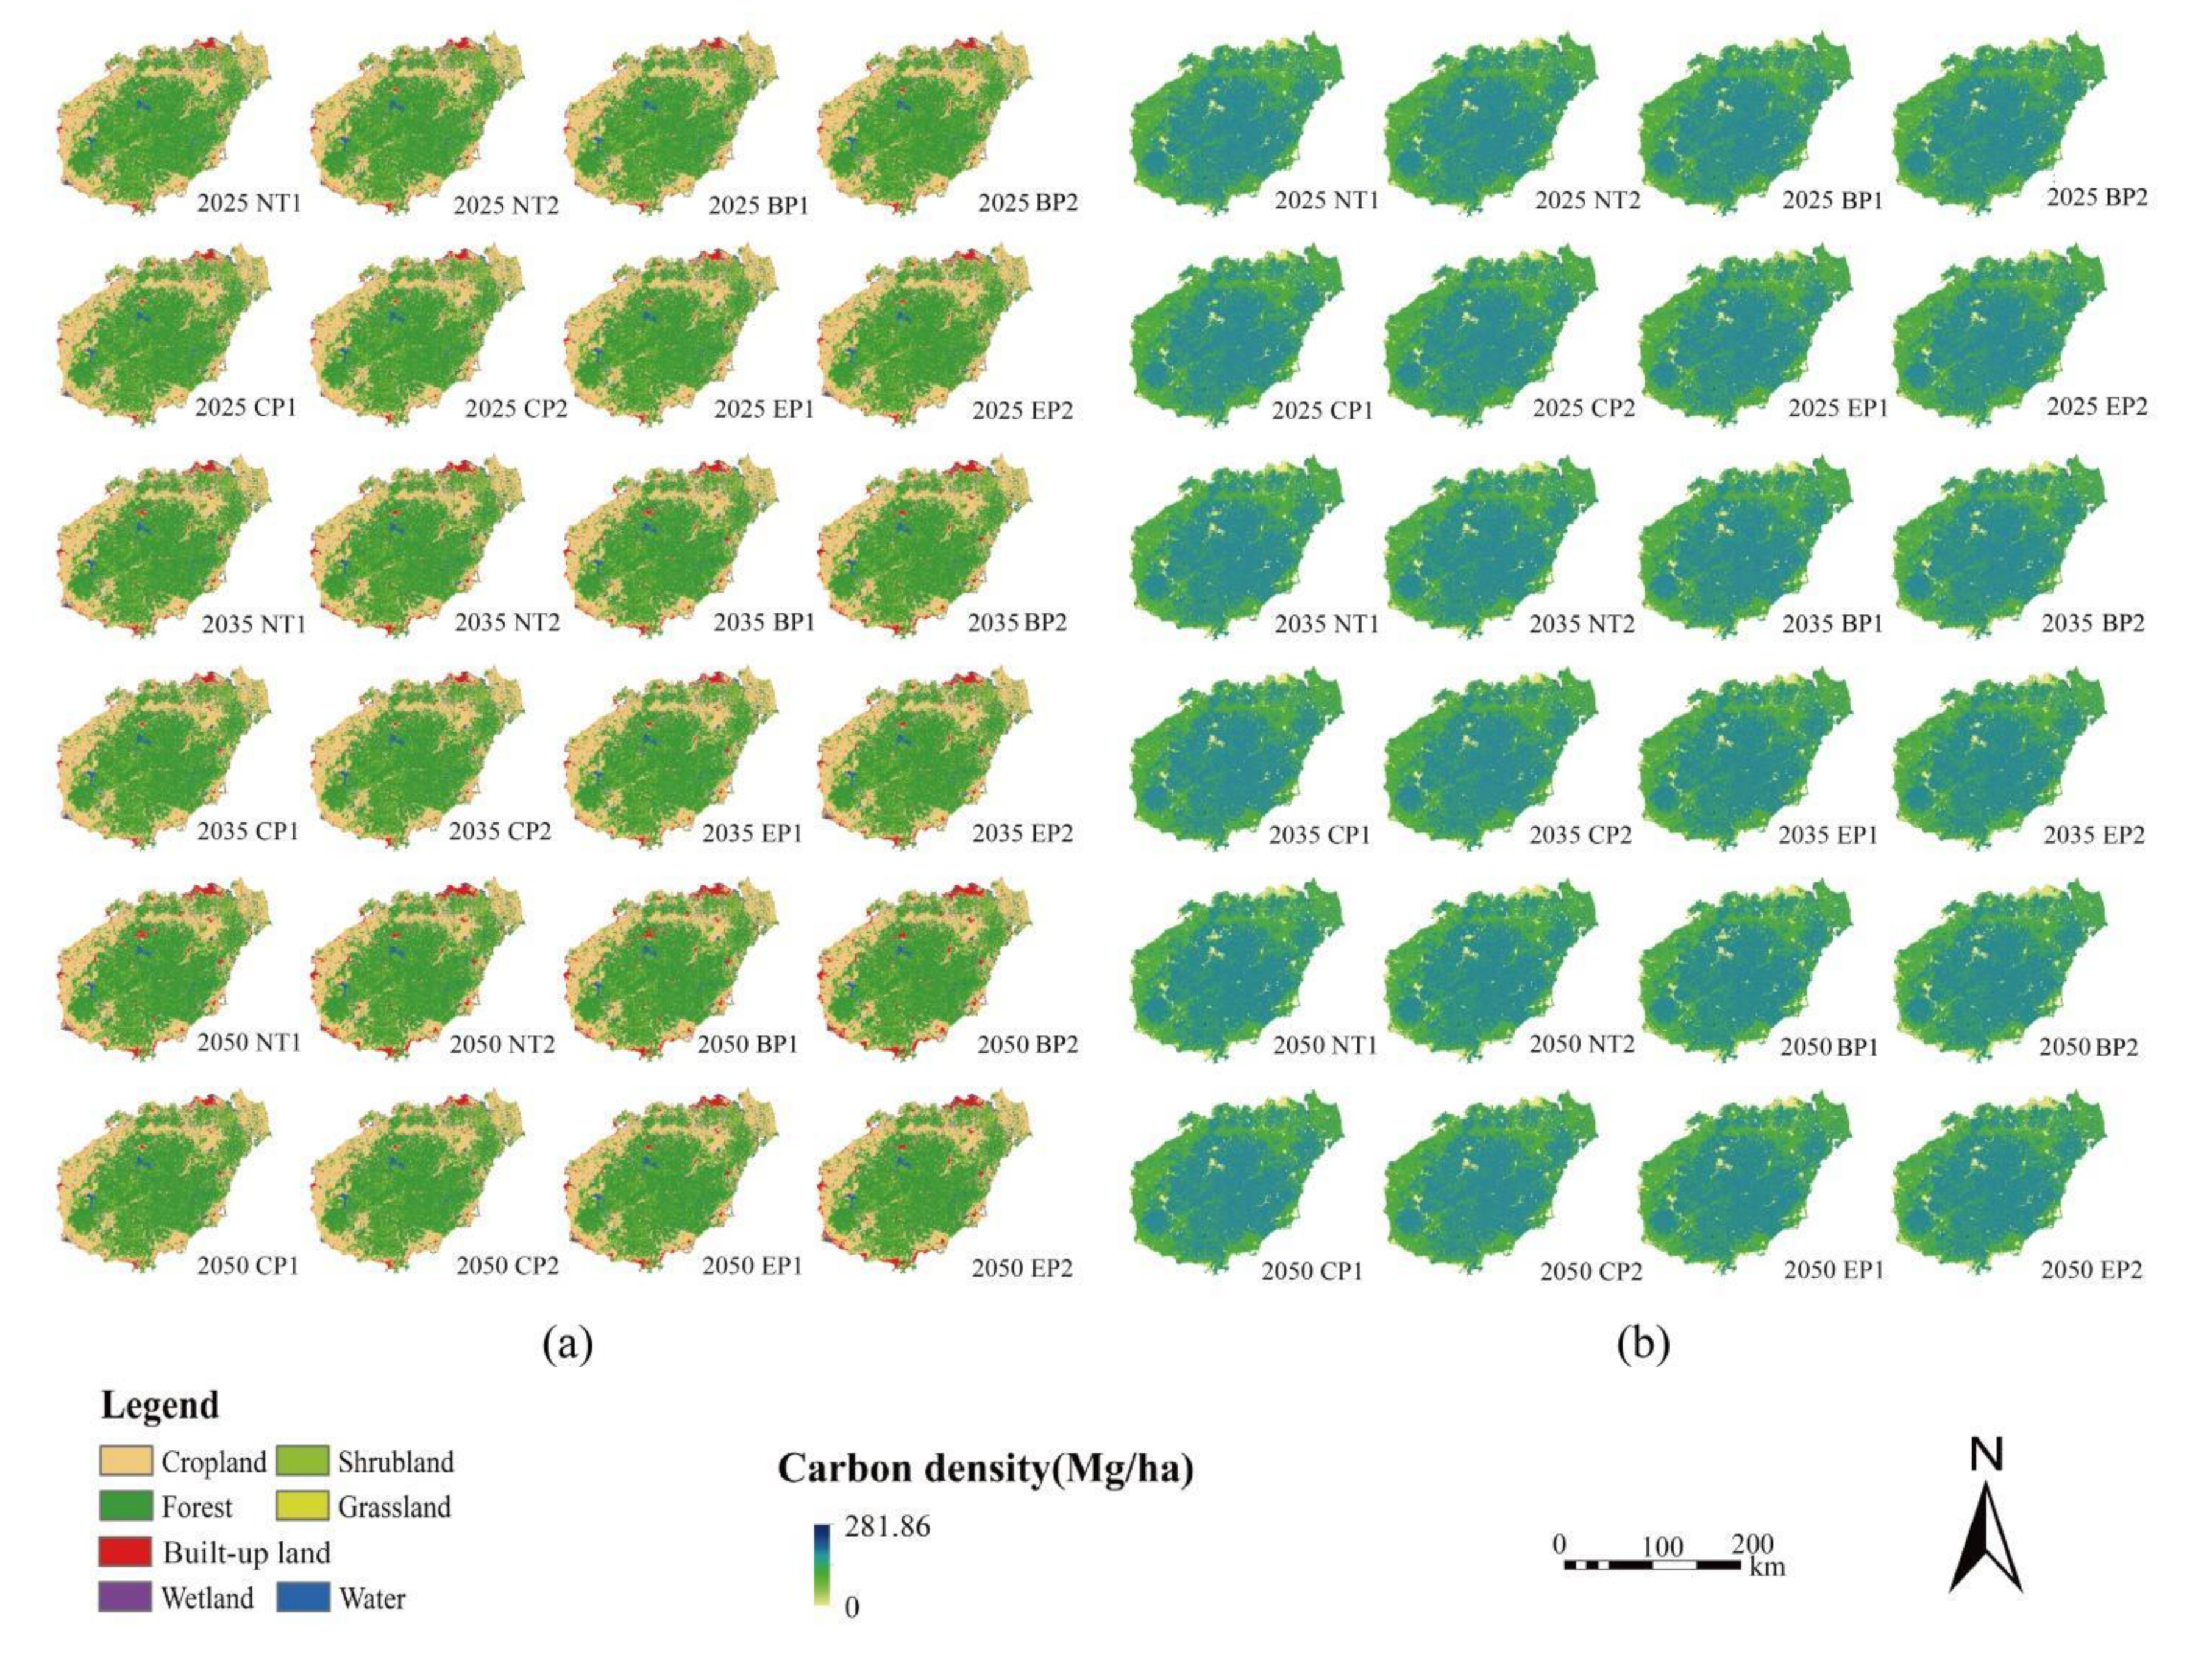
3.3.1. Changes in LULC and Carbon Storage under Different Future Development Scenarios

The results of the 2019 LULC simulation show that the overall accuracy and kappa coefficient are 0.98 and 0.97, respectively, which is a high degree of accuracy, and the final model obtained can meet the needs of this study (Figure 10). Using the probability of LULC transfer between 1992 and 2019 as a basis, the LULC patterns in 2025, 2035, and 2050 were predicted under four different development scenarios: natural trend (NT), built-up land priority (BP), cropland priority (CP), and ecological priority (EP), with significant differences in the results (Table 7, Figure 10). Under the NT, BP, and EP scenarios, the built-up land area expands at a high rate and exceeds 1000 km2 by 2050, while the area of cropland decreases to varying degrees. Under CP, the built-up land area expands slowly to slightly over 600 km2 by 2050, with a significant increase in cropland area to 11,954.88 km2 by 2050, and an increase in forest area. Corresponding to the LULC pattern, the changes in carbon storage vary significantly among the four scenarios. Under NT, BP, and EP, the amount of carbon storage gradually decreases, with BP showing the greatest decrease, at 426.75 Tg by 2050, while the amount of carbon storage under NT and EP does not differ significantly, at 427.70 Tg and 428.04 Tg in 2050, respectively. Under CP, carbon storage gradually increases, with 429.87 Tg, 430.14 Tg, and 430.48 Tg in 2025, 2035, and 2050, respectively, an increase of 0.18 Tg, 0.45 Tg, and 0.79 Tg, respectively, compared to 2019 (Table 7).
Although the LULC pattern and carbon storage of the four development scenarios are different in quantity, they show roughly the same trend in spatial distribution (Figure 11). The existing built-up land areas are gradually extending outwards. The built-up land areas of Haikou City and Sanya City both expand westward along the coastline, and they are the two largest block-shaped built-up land areas on Hainan Island. The built-up land area of the southwest coast of Hainan Island has increased sharply. In 2050, under BP and NT, the built-up land area between Haikou City and Dongfang City will be connected into a strip. Overall, forest is still mainly distributed in the central part of Hainan Island, shrubland is scattered and embedded in the forest, and cropland is distributed around the forest and around the island. The change in the distribution of carbon storage corresponds to the change in LULC. The central part of Hainan Island still has the largest carbon storage, forest still being the type with the largest carbon storage, and the carbon storage at the edge of the original built-up land area and the southwest coastal zone has decreased.

3.3.2. Differences in Prediction Results under Different Transition Probability Bases

The analysis above shows that there are significant differences in LULC and carbon storage change trends between the period before and after 2000, reflecting changes in potential drivers such as development policies in the latter period compared to the previous period, and that predicting LULC and carbon storage dynamics after 2019 using only one development model is not sufficiently objective. This paper therefore uses the probability of LULC transfer between 2000 and 2019 as the basis (Pattern 2) to predict future LULC under four scenarios, NT, BP, CP, and EP, and calculates carbon storage. The results show that the built-up land area increases for all four development scenarios compared to the probability of transfer between 1992 and 2019 (Pattern 1), with Pattern 2 under BP in 2050 corresponding to a built-up land area of 1469.34 km2; the area of forest and cropland decreases, while the area of shrubland increases significantly, depending on the year and scenario, with increases ranging from 43.92 to 209.25 km2. In terms of carbon storage, all development scenarios under Pattern 2 show a decrease in LULC carbon storage compared to Pattern 1, and the difference in carbon storage between the same scenarios increases over time. A total of 425.02 Tg of carbon is stored under Pattern 2 in 2050, a decrease of 4.67 Tg compared to 2019 (Figure 12).
Pattern 2 also differs from Pattern 1 in terms of the spatial distribution of LULC and carbon storage, with built-up land areas expanding further outwards along Pattern 1, and the built-up land area of the southwest coastline of Hainan Island becoming more shaped; shrubland is more widely scattered among forest and cropland; and forest and cropland become shrunken and discrete compared to Pattern 1, but the overall pattern remains the same. The carbon storage at the edges of the built-up land areas is further reduced, with a more pronounced ring of low carbon storage along the coastal zone of Hainan Island, and more patches of low carbon density within the high carbon density areas of forest in Pattern 1 (Figure 11).

4. Discussion

4.1. Mechanisms of Carbon Storage Evolution in the Context of Human–Earth Coupling

The LULC system is one of the highly complex social-ecological systems (SES) whose development and evolution are largely regulated by human activities, while their combined effects simultaneously act on human society [81]. Built-up land human activities can reshape the LULC system, as exemplified by the expansion of built-up land on Hainan Island over the past 30 years. On Hainan Island, while the expansion of built-up land has been closely linked to economic and social development, it has brought with it the negative impact of reduced carbon storage. In the process of coupled human–land development, carbon storage needs to be involved as an important factor in planning to achieve the optimal trade-off [82].
Future LULC and carbon storage benefits vary significantly between development scenarios in the same region, and the same development scenario may have very different carbon storage capacities in different regions due to differences in current conditions. On Hainan Island, the ability of the cropland priority scenario to enhance carbon storage is much higher than that of the ecological priority scenario—here forest area has been expanding [83], so strengthening the protection of forest land is very important, but not the most urgent. The area of the built-up land has always been expanding at a high speed [84], so it is necessary to attach great importance to its planning and optimization. The situation faced by most of the tropical regions of the world is different from that of Hainan Island [85]. In South America, Colombia’s forest is in the process of transforming into cropland and built-up land, so strengthening the protection of forest can better improve carbon storage capacity [86]. The shrinking of forest in northern Brazil is widely known, so an ecological conservation development pattern will help increase carbon storage in this region [77]. Although contradictory to improving local living standards, the implementation of appropriate ecological protection policies in central Africa and Southeast Asia [79] can promote carbon storage. Even in temperate regions, such as China’s Loess Plateau [55] and northwest desert regions [54], ecological conservation policies that promote the growth of forest and grassland areas can maximize carbon storage. The carbon enhancement storage plan for the above areas cannot adapt to the actual situation of Hainan Island, so local realities need to be taken into account when formulating relevant policies with the goal of enhancing carbon storage.

4.2. Strategies for Optimising LULC Structure to Balance Economic Development and Carbon Storage

Since Hainan Province was set up as a special economic zone, the speed of the island’s economic development is at the forefront of the country, and with the steady promotion of the pilot free trade zone policy [87], its future economic development is expected to continue to gain momentum. In addition, due to its pleasant winter climate, Hainan Island has become a destination for some people in northern China to escape the cold weather, and the influx of foreigners has contributed to the development of the real estate sector [88]. This series of initiatives to promote economic and social development and the fact that economic construction is advancing rapidly has put increasing pressure on the ecological environment of Hainan Island. In order to reconcile economic development with the need for carbon storage to promote sustainable regional development, the LULC structure should be optimised in the following ways. First of all, it is necessary to speed up the transformation of the economic development mode of Hainan Island [89]. Compared with the construction industry, high-tech industries and intelligence-intensive industries can occupy smaller areas of cropland, forest, or shrubland [90]. Some studies also pointed out that the real estate development in Hainan Island is currently facing a transition period [91], and it is crucial to make good use of the policy orientation. Secondly, some studies have shown that enhancing the complexity of land use and land cover functions can help increase carbon storage in built-up land, such as productive cities [92,93]. Considering the favourable precipitation and temperature conditions of Hainan Island [94], it may be feasible to implement such planning in built-up land. In addition, we should focus on enhancing the carbon sequestration capacity of forest, grassland, and cropland, such as by strengthening the conservation and management of forest to improve the quality of vegetation, optimising crop types, and improving fertilisation practices [95]. Most importantly, soil carbon storage is the most critical component of surface carbon storage. The physical and chemical properties of soil vary from place to place, and the introduction of new measurement techniques is indispensable [96]. Cutting-edge technical methods including machine learning and vis-NIR spectral can achieve the rapid and accurate measurement of soil physical and chemical properties [97,98,99] and build an ideal-scale LULC soil database, thus providing a basis for making low-carbon development policy recommendations.

4.3. Uncertainty and Limitations

There are some shortcomings in this study that need to be improved in the future. Firstly, the spatial resolution of the LULC data used in this study was 300 m and small village settlements were not included in the study as built-up land areas, which may have resulted in an underestimation of the built-up land area and hence an overestimation of carbon storage. Secondly, this study assumes that carbon density does not change over time, and the data used for land-use carbon density were derived from published literature, which may have caused some uncertainty due to the lack of timeliness. In addition, the CA-Markov model-based LULC simulation has limitations. Although 14 types of factors affecting LULC distribution were selected in this study, the actual causes and forms of LULC conversion are often more complex than expected, so more potential influencing factors need to be included in future simulations.

5. Conclusions

Integrating the CA-Markov and InVEST models, based on LULC, socioeconomic, and other types of data, this study quantitatively evaluated the dynamics of LULC and carbon storage in Hainan Island from 1992 to 2019, and predicted 2025, 2035, and 2050’s LULC and carbon storage by setting four development scenarios. The findings show that the built-up land area expanded from 103.59 square kilometres to 574.83 square kilometres from 1992 to 2019, an increase of 454.91%. The area of cropland and shrubland continued to decline, the area of forest increased slightly, and other LULC types remained relatively stable. The changes in LULC between 1992 and 2019 led to a decrease in carbon storage of about 1.50 Tg, of which carbon storage increased by about 0.58 Tg from 1992 to 2000, and decreased by about 2.08 Tg from 2000 to 2019. The encroachment of cropland by built-up land areas was the main reason for the decrease in carbon storage, and the increase in forest area compensated for the loss of carbon to a certain extent. The increase and decrease of carbon storage have obvious spatial clustering characteristics. The carbon storage of the river estuary area increased significantly, while the carbon storage around the built-up land area decreased significantly. The difference between future LULC and carbon storage under different development scenarios is significant. The NT and BP scenarios reduce the carbon storage of Hainan Island at a relatively rapid rate. The carbon storage under BP in 2050 will be reduced by 4.67 Tg compared to 2019. EP can slightly slow down the rate of carbon storage reduction, CP can increase carbon storage in the future, with the maximum increase of 0.79 Tg in 2050. Hainan Island differs from most tropical regions in the pathways through which LULC change contributes to carbon storage change, requiring a focus on the relationship between built-up land and cropland, starting with the local nature of the ecological role of regional landscape change. This paper complements and refines the understanding of the correlation between LULC and carbon storage changes in the tropics. The results of the scenario modelling can inform the balance between carbon storage benefits and economic development, thereby contributing to the sustainable development of Hainan Island.

Author Contributions

Conceptualization, Q.L. and D.Y.; methodology, Q.L. and D.Y.; software, Q.L.; validation, Q.L., D.Y. and L.C.; formal analysis, Q.L.; investigation, Q.L. and D.Y.; resources, Q.L.; data curation, Q.L.; writing—original draft preparation, Q.L.; writing—review and editing, D.Y. and B.A.; visualization, Q.L.; supervision, D.Y., L.C., and B.A.; project administration, D.Y.; funding acquisition, D.Y. All authors have read and agreed to the published version of the manuscript.

Funding

This research was funded by the National Natural Science Foundation of China (grant number 52078326) and Key Program of the National Natural Science Foundation of China (grant number 51838003).

Institutional Review Board Statement

Not applicable.

Informed Consent Statement

Not applicable.

Data Availability Statement

Not applicable.

Acknowledgments

The authors are grateful to the editor and reviewers for their valuable comments and suggestions.

Conflicts of Interest

The authors declare no conflict of interest.

References

  1. Stankovic, M.; Ambo-Rappe, R.; Carly, F.; Dangan-Galon, F.; Fortes, M.D.; Hossain, M.S.; Kiswara, W.; Van Luong, C.; Minh-Thu, P.; Mishra, A.K.; et al. Quantification of Blue Carbon in Seagrass Ecosystems of Southeast Asia and Their Potential for Climate Change Mitigation. Sci. Total Environ. 2021, 783, 146858. [Google Scholar] [CrossRef] [PubMed]
  2. Li, J.; Guo, X.; Chuai, X.; Xie, F.; Yang, F.; Gao, R.; Ji, X. Reexamine China’s Terrestrial Ecosystem Carbon Balance under Land Use-Type and Climate Change. Land Use Policy 2021, 102, 105275. [Google Scholar] [CrossRef]
  3. Makkonen, M.; Huttunen, S.; Primmer, E.; Repo, A.; Hildén, M. Policy Coherence in Climate Change Mitigation: An Ecosys-tem Service Approach to Forests as Carbon Sinks and Bioenergy Sources. For. Policy Econ. 2015, 50, 153–162. [Google Scholar] [CrossRef]
  4. He, Q.; Zeng, C.; Xie, P.; Liu, Y.; Zhang, M. An Assessment of Forest Biomass Carbon Storage and Ecological Compensation Based on Surface Area: A Case Study of Hubei Province, China. Ecol. Indic. 2018, 90, 392–400. [Google Scholar] [CrossRef]
  5. Zhao, Z.; Sharifi, A.; Dong, X.; Shen, L.; He, B.J. Spatial Variability and Temporal Heterogeneity of Surface Urban Heat Island Patterns and the Suitability of Local Climate Zones for Land Surface Temperature Characterization. Remote Sens. 2021, 13, 4338. [Google Scholar] [CrossRef]
  6. Jiang, W.; Deng, Y.; Tang, Z.; Lei, X.; Chen, Z. Modelling the Potential Impacts of Urban Ecosystem Changes on Carbon Storage under Different Scenarios by Linking the CLUE-S and the InVEST Models. Ecol. Model. 2017, 345, 30–40. [Google Scholar] [CrossRef]
  7. Houghton, R.A. Carbon Emissions and the Drivers of Deforestation and Forest Degradation in the Tropics. Curr. Opin. Environ. Sustain. 2012, 4, 597–603. [Google Scholar] [CrossRef]
  8. Lai, L.; Huang, X.; Yang, H.; Chuai, X.; Zhang, M.; Zhong, T.; Chen, Z.; Chen, Y.; Wang, X.; Thompson, J.R. Carbon Emis-sions from Land-Use Change and Management in China between 1990 and 2010. Sci. Adv. 2016, 2, e1601063. [Google Scholar] [CrossRef] [Green Version]
  9. Houghton, R.A.; House, J.I.; Pongratz, J.; van der Werf, G.R.; DeFries, R.S.; Hansen, M.C.; Le Quéré, C.; Ramankutty, N. Carbon Emissions from Land Use and Land-Cover Change. Biogeosciences 2012, 9, 5125–5142. [Google Scholar] [CrossRef] [Green Version]
  10. Li, W.; Ciais, P.; Peng, S.; Yue, C.; Wang, Y.; Thurner, M.; Saatchi, S.S.; Arneth, A.; Avitabile, V.; Carvalhais, N.; et al. Land-Use and Land-Cover Change Carbon Emissions between 1901 and 2012 Constrained by Biomass Observations. Biogeosciences 2017, 14, 5053–5067. [Google Scholar] [CrossRef] [Green Version]
  11. Djomo, A.N.; Knohl, A.; Gravenhorst, G. Estimations of Total Ecosystem Carbon Pools Distribution and Carbon Biomass Current Annual Increment of a Moist Tropical Forest. For. Ecol. Manag. 2011, 261, 1448–1459. [Google Scholar] [CrossRef]
  12. Kiat, P.E.; Malek, M.A.; Shamsuddin, S.M. Net Carbon stocks Change in Biomass from Wood Removal of Tropical Forests in Sarawak, Malaysia. J. King Saud Univ.-Sci. 2020, 32, 1096–1099. [Google Scholar] [CrossRef]
  13. Cruz, J.S.; Blanco, C.J.C.; Júnior, J.F.O. Modeling of Land Use and Land Cover Change Dynamics for Future Projection of the Amazon Number Curve. Sci. Total Environ. 2022, 811, 152348. [Google Scholar] [CrossRef]
  14. Bonini, I.; Marimon, B.H.J.; Matricardi, E.; Phillips, O.; Petter, F.; Oliveira, B.; Marimon, B.S. Collapse of Ecosystem Carbon Stocks Due to Forest Conversion to Soybean Plantations at the Amazon-Cerrado Transition. For. Ecol. Manag. 2018, 414, 64–73. [Google Scholar] [CrossRef]
  15. Tsozué, D.; Nghonda, J.P.; Tematio, P.; Basga, S.D. Changes in Soil Properties and Soil Organic Carbon Stocks along An Elevation Gradient at Mount Bambouto, Central Africa. CATENA 2019, 175, 251–262. [Google Scholar] [CrossRef]
  16. Hairiah, K.; Noordwijk, M.; Sari, R.R.; Saputra, D.D.; Widianto; Suprayogo, D.; Kurniawan, S.; Prayogo, C.; Gusli, S. Soil Carbon Stocks in Indonesian (Agro) Forest Transitions: Compaction Conceals Lower Carbon Concentrations in Standard Accounting. Agric. Ecosyst. Environ. 2020, 294, 106879. [Google Scholar] [CrossRef]
  17. Fernandes, M.M.; de Moura Fernandes, M.R.; Garcia, J.R.; Matricardi, E.A.T.; de Souza Lima, A.H.; de Araújo Filho, R.N.; Gomes Filho, R.R.; Piscoya, V.C.; Piscoya, T.O.F.; Cunha Filho, M. Land Use and Land Cover Changes and Carbon stock Valuation in the São Francisco River Basin, Brazil. Environ. Chall. 2021, 5, 100247. [Google Scholar] [CrossRef]
  18. Hoque, M.Z.; Cui, S.; Islam, I.; Xu, L.; Ding, S. Dynamics of Plantation Forest Development and Ecosystem Carbon Storage Change in Coastal Bangladesh. Ecol. Indic. 2021, 130, 107954. [Google Scholar] [CrossRef]
  19. Kabuanga, J.M.; Kankonda, O.M.; Saqalli, M.; Maestripieri, N.; Bilintoh, T.M.; Mweru, J.-P.M.; Liama, A.B.; Nishuli, R.; Mané, L. Historical Changes and Future Trajectories of Deforestation in the Ituri-Epulu-Aru Landscape (Democratic Re-public of the Congo). Land 2021, 10, 1042. [Google Scholar] [CrossRef]
  20. González-González, A.; Villegas, J.C.; Clerici, N.; Salazar, J.F. Spatial-Temporal Dynamics of Deforestation and Its Drivers Indicate Need for Locally-Adapted Environmental Governance in Colombia. Ecol. Indic. 2021, 126, 107695. [Google Scholar] [CrossRef]
  21. Tang, X.; Woodcock, C.E.; Olofsson, P.; Hutyra, L.R. Spatiotemporal Assessment of Land Use/Land Cover Change and Associated Carbon Emissions and Uptake in the Mekong River Basin. Remote Sens. Environ. 2021, 256, 112336. [Google Scholar] [CrossRef]
  22. Zhang, Q.; Justice, C.O.; Desanker, P.V. Impacts of Simulated Shifting Cultivation on Deforestation and the Carbon Stocks of the Forests of Central Africa. Agric. Ecosyst. Environ. 2002, 90, 203–209. [Google Scholar] [CrossRef]
  23. Hase, V.; Mahl, D.; Schäfer, M.S.; Keller, T.R. Climate Change in News Media across the Globe: An Automated Analysis of Issue Attention and Themes in Climate Change Coverage in 10 Countries (2006–2018). Glob. Environ. Chang. 2021, 70, 102353. [Google Scholar] [CrossRef]
  24. Nguyen, H.; Nguyen, T.T.H. Above-Ground Biomass Estimation Models of Mangrove Forests Based on Remote Sensing and Field-Surveyed Data: Implications for C-PFES Implementation in Quang Ninh Province, Vietnam. Reg. Stud. Mar. Sci. 2021, 48, 101985. [Google Scholar] [CrossRef]
  25. Fang, X.; Zou, J.; Wu, Y.; Zhang, Y.; Zhao, Y.; Zhang, H. Evaluation of the Sustainable Development of an Island “Blue Economy”: A Case Study of Hainan, China. Sustain. Cities Soc. 2021, 66, 102662. [Google Scholar] [CrossRef]
  26. Kee, H.L.; Hoon, H.T. Trade, Capital Accumulation and Structural Unemployment: An Empirical Study of the Singapore Economy. J. Dev. Econ. 2005, 77, 125–152. [Google Scholar] [CrossRef] [Green Version]
  27. Jussawalla, M.; Cheah, C.W. Towards an Information Economy: The Case of Singapore. Inf. Econ. Policy 1983, 1, 161–176. [Google Scholar] [CrossRef]
  28. Dou, X. Low Carbon-Economy Development: China’s Pattern and Policy Selection. Energy Policy 2013, 63, 1013–1020. [Google Scholar] [CrossRef]
  29. Liu, Q.; Yang, Z.; Chen, Y.; Lei, J.; Chen, Z.; Chen, X. Multi-scenario Simulation of Land Use Change and Its Eco-environmental Effect in Hainan Island Based on CA-Markov Model. Ecol. Environ. Sci. 2021, 30, 1522–1531. [Google Scholar]
  30. Hu, J.; Xin, K.; Li, Z.; Gao, C.; Yan, K. Carbon Storage and Sequestration Function Evaluation in Dongzhaigang Mangrove Reserve of Hainan. Wetl. Sci. 2015, 13, 338–343. [Google Scholar]
  31. Lin, S.; Zheng, P.; Cai, Q. The Change of Forest Biomass and Carbon Storage and Prediction of Carbon Sink Value in Baisha County, Hainan. Trop. For. 2014, 42, 14–17. [Google Scholar]
  32. Zhao, M.; Chen, K.; Shi, Y. Analysis of the Carbon Storage and Fixation of Mangrove Forests in Sanya. J. Qiongzhou Univ. 2013, 20, 85–88. [Google Scholar]
  33. Gao, C.; Hu, J.; Yan, K.; Xin, K. Carbon Dioxide and Methane Emission Fluxes from Soil in Mangrove Forest in Dongzhaigang, Hainan. Wetl. Sci. 2017, 15, 351–357. [Google Scholar]
  34. Yu, Z. Study on the Optimization of Hainan Regional Governance System Based on Watershed Social Ecosystem. J. Hainan Norm. Univ. Nat. Sci. 2020, 33, 287–298. [Google Scholar]
  35. Yu, X.; Wang, H. How Should the Center Lead China’s Reforestation Efforts?—Policy Making Games between Central and Local Governments. Resour. Conserv. Recycl. 2013, 80, 64–84. [Google Scholar] [CrossRef]
  36. Meng, G. Implications of International Experiences for the Planning and Development of Hainan Free Trade Port. Resour. Sci. 2021, 43, 217–228. [Google Scholar] [CrossRef]
  37. Bekkers, E.; Koopman, R.B.; Rêgo, C.L. Structural Change in the Chinese Economy and Changing Trade Relations with the World. China Econ. Rev. 2021, 65, 101573. [Google Scholar] [CrossRef]
  38. Cai, Z.; Liu, Q.; Cao, S. Real Estate Supports Rapid Development of China’s Urbanization. Land Use Policy 2020, 95, 104582. [Google Scholar] [CrossRef]
  39. Wang, Y.; Wall, G. Administrative Arrangements and Displacement Compensation in Top-down Tourism Planning—A Case from Hainan Province, China. Tour. Manag. 2007, 28, 70–82. [Google Scholar] [CrossRef]
  40. Jiang, Z.; Wang, P. Analysis on Evaluation of Regional Technological Innovation Capability and Spatial Difference in Hainan Province—Empirical Analysis Based on Panel Data of 18 Cities and Counties in 2009–2014. Econ. Geogr. 2016, 36, 24–30. (In Chinese) [Google Scholar]
  41. Sun, J.; Jiang, Q. A Study on the Integrated Development of Regional Low-carbon Economy from the Perspective of Emission Peak and Carbon Neutrality: Strategic Implication and Strategy Selection. Seek. Truth 2021, 48, 36–43+169. [Google Scholar]
  42. Mohamed, A.; Worku, H. Simulating Urban Land Use and Cover Dynamics Using Cellular Automata and Markov Chain Ap-proach in Addis Ababa and the Surrounding. Urban Clim. 2020, 31, 100545. [Google Scholar] [CrossRef]
  43. Mondal, M.S.; Sharma, N.; Garg, P.K.; Kappas, M. Statistical Independence Test and Validation of CA Markov Land Use Land Cover (LULC) Prediction Results. Egypt. J. Remote Sens. Space Sci. 2016, 19, 259–272. [Google Scholar] [CrossRef] [Green Version]
  44. Mitsova, D.; Shuster, W.; Wang, X. A Cellular Automata Model of Land Cover Change to Integrate Urban Growth with Open Space Conservation. Landsc. Urban Plan. 2011, 99, 141–153. [Google Scholar] [CrossRef]
  45. Xu, X.; Du, Z.; Zhang, H. Integrating the System Dynamic and Cellular Automata Models to Predict Land Use and Land Cover Change. Int. J. Appl. Earth Obs. Geoinf. 2016, 52, 568–579. [Google Scholar] [CrossRef]
  46. Nurwanda, A.; Zain, A.F.M.; Rustiadi, E. Analysis of Land Cover Changes and Landscape Fragmentation in Batanghari Regency, Jambi Province. Procedia-Soc. Behav. Sci. 2016, 227, 87–94. [Google Scholar] [CrossRef] [Green Version]
  47. Tan, Z.; Guan, Q.; Lin, J.; Yang, L.; Luo, H.; Ma, Y.; Tian, J.; Wang, Q.; Wang, N. The Response and Simulation of Ecosystem Services Value to Land Use/Land Cover in an Oasis, Northwest China. Ecol. Indic. 2020, 118, 106711. [Google Scholar] [CrossRef]
  48. Liang, X.; Guan, Q.; Clarke, K.C.; Liu, S.; Wang, B.; Yao, Y. Understanding the Drivers of Sustainable Land Expansion Using a Patch-Generating Land Use Simulation (PLUS) Model: A Case Study in Wuhan, China. Comput. Environ. Urban Syst. 2021, 85, 101569. [Google Scholar] [CrossRef]
  49. Wang, Q.; Watanabe, M.; Ouyang, Z. Simulation of Water and Carbon Fluxes Using BIOME-BGC Model over Crops in China. Agric. For. Meteorol. 2005, 131, 209–224. [Google Scholar] [CrossRef]
  50. Quesada, B.; Arneth, A.; Robertson, E.; de Noblet-Ducoudré, N. Potential Strong Contribution of Future Anthropogenic Land-Use and Land-Cover Change to the Terrestrial Carbon Cycle. Environ. Res. Lett. 2018, 13, 064023. [Google Scholar] [CrossRef]
  51. Fatichi, S.; Leuzinger, S.; Körner, C. Moving Beyond Photosynthesis: From Carbon Source to Sink-driven Vegetation Modeling. New Phytol. 2014, 201, 1086–1095. [Google Scholar] [CrossRef]
  52. Liang, Y.; Liu, L.; Huang, J. Integrating the SD-CLUE-S and InVEST Models into Assessment of Oasis Carbon Storage in Northwestern China. PLoS ONE 2017, 12, e0172494. [Google Scholar] [CrossRef]
  53. Thompson, T.M. Modeling the Climate and Carbon Systems to Estimate the Social Cost of Carbon. WIREs Clim. Chang. 2018, 9, e532. [Google Scholar] [CrossRef]
  54. Zhu, G.; Qiu, D.; Zhang, Z.; Sang, L.; Liu, Y.; Wang, L.; Zhao, K.; Ma, H.; Xu, Y.; Wan, Q. Land-Use Changes Lead to a De-crease in Carbon Storage in Arid Region, China. Ecol. Indic. 2021, 127, 107770. [Google Scholar] [CrossRef]
  55. Liang, Y.; Hashimoto, S.; Liu, L. Integrated Assessment of Land-Use/Land-Cover Dynamics on Carbon Storage Services in the Loess Plateau of China from 1995 to 2050. Ecol. Indic. 2021, 120, 106939. [Google Scholar] [CrossRef]
  56. Babbar, D.; Areendran, G.; Sahana, M.; Sarma, K.; Raj, K.; Sivadas, A. Assessment and Prediction of Carbon Sequestration Using Markov Chain and InVEST Model in Sariska Tiger Reserve, India. J. Clean. Prod. 2021, 278, 123333. [Google Scholar] [CrossRef]
  57. Nie, X.; Lu, B.; Chen, Z.; Yang, Y.; Chen, S.; Chen, Z.; Wang, H. Increase or Decrease? Integrating the CLUMondo and In-VEST Models to Assess the Impact of the Implementation of the Major Function Oriented Zone Planning on Carbon Storage. Ecol. Indic. 2020, 118, 106708. [Google Scholar] [CrossRef]
  58. Li, L.; Song, Y.; Wei, X.; Dong, J. Exploring the Impacts of Urban Growth on Carbon Storage under Integrated Spatial Regu-lation: A Case Study of Wuhan, China. Ecol. Indic. 2020, 111, 106064. [Google Scholar] [CrossRef]
  59. Guadalupe, V.; Sotta, E.D.; Santos, V.F.; Aguiar, L.J.G.; Vieira, M.; Oliveira, C.P.; Siqueira, J.V.N. REDD+ Implementation in a High Forest Low Deforestation Area: Constraints on Monitoring Forest Carbon Emissions. Land Use Policy 2018, 76, 414–421. [Google Scholar] [CrossRef]
  60. Peel, M.C.; Finlayson, B.L.; McMahon, T.A. Updated World Map of the Köppen-Geiger Climate Classification. Hydrol. Earth Syst. Sci. 2007, 11, 1633–1644. [Google Scholar] [CrossRef] [Green Version]
  61. Zhang, Y.; Liu, Y.; Wang, Y.; Liu, D.; Xia, C.; Wang, Z.; Wang, H.; Liu, Y. Urban Expansion Simulation Towards Low-carbon Development: A Case Study of Wuhan, China. Sustain. Cities Soc. 2020, 63, 102455. [Google Scholar] [CrossRef]
  62. Xu, L.; Yu, G.; He, N. Changes of Soil Organic Carbon Storage in Chinese Terrestrial Ecosystems from the 1980s to the 2010s. Acta Geogr. Sin. 2018, 73, 2150–2167. (In Chinese) [Google Scholar]
  63. Li, C.; Cai, R.; Yan, X. Analysis on the Changes of Carbon Budget of Mangrove Wetland in Hainan Dongzhaigang during 2010–2018. Mar. Sci. Bull. 2020, 39, 488–497. (In Chinese) [Google Scholar]
  64. Ke, X.; Tang, L. Impact of Cascading Processes of Urban Expansion and Cropland Reclamation on the Ecosystem of a Carbon Storage Service in Hubei Province, China. Acta Ecol. Sin. 2019, 39, 672–683. [Google Scholar]
  65. Chuai, X.; Huang, X.; Lai, L.; Wang, W.; Peng, J.; Zhao, R. Land Use Structure Optimization Based on Carbon Storage in Several Regional Terrestrial Ecosystems across China. Environ. Sci. Policy 2013, 25, 50–61. [Google Scholar] [CrossRef]
  66. Zhang, C.; Tian, H.; Chen, G.; Chappelka, A.; Xu, X.; Ren, W.; Hui, D.; Liu, M.; Lu, C.; Pan, S.; et al. Impacts of Urbanization on Carbon Balance in Terrestrial Ecosystems of the Southern United States. Environ. Pollut. 2012, 164, 89–101. [Google Scholar] [CrossRef]
  67. Xi, X.; Li, M.; Zhang, X.; Zhang, Y.; Yang, Y. Research on Soil Organic Carbon Distribution and Change Trend in Middle-East Plain and Its Vicinity in China. Earth Sci. Front. 2013, 20, 154–165. [Google Scholar]
  68. Li, K.; Wang, S.; Cao, M. Vegetation and Soil Carbon Storage in China. Sci. Sin. Terrae 2003, 1, 72–80. (In Chinese) [Google Scholar] [CrossRef]
  69. Kuznetsov, A.; Sadovskaya, V. Spatial Variation and Hotspot Detection of COVID-19 Cases in Kazakhstan, 2020. Spat. Spatio-Temporal Epidemiol. 2021, 39, 100430. [Google Scholar] [CrossRef]
  70. Mansour, S.; Al-Belushi, M.; Al-Awadhi, T. Monitoring Land Use and Land Cover Changes in the Mountainous Cities of Oman Using GIS and CA-Markov Modelling Techniques. Land Use Policy 2020, 91, 104414. [Google Scholar] [CrossRef]
  71. Dargains, A.; Cabral, P. A GIS-based Methodology for Sustainable Farming Planning: Assessment of Land Use/Cover Changes and Carbon Dynamics at Farm Level. Land Use Policy 2021, 111, 105788. [Google Scholar] [CrossRef]
  72. Sang, L.; Zhang, C.; Yang, J.; Zhu, D.; Yun, W. Simulation of Land Use Spatial Pattern of Towns and Villages Based on CA–Markov Model. Math. Comput. Model. 2011, 54, 938–943. [Google Scholar] [CrossRef]
  73. Zhu, B.; Liao, J.; Shen, G. Combining Time Series and Land Cover Data for Analyzing Spatio-Temporal Changes in Man-grove Forests: A Case Study of Qinglangang Nature Reserve, Hainan, China. Ecol. Indic. 2021, 131, 108135. [Google Scholar] [CrossRef]
  74. Li, L.; Wang, J.; Chen, T. Thinking on the Potential Development of Seasonal Migrant of Retirees in Hainan Province from the Perspective of Tourism. Areal Res. Dev. 2015, 34, 100–104. (In Chinese) [Google Scholar]
  75. Dos Santos, A.M.; da Silva, C.F.A.; de Almeida Junior, P.M.; Rudke, A.P.; de Melo, S.N. Deforestation Drivers in the Brazilian Amazon: Assessing New Spatial Predictors. J. Environ. Manag. 2021, 294, 113020. [Google Scholar] [CrossRef] [PubMed]
  76. Naughton-Treves, L. Deforestation and Carbon Emissions at Tropical Frontiers: A Case Study from the Peruvian Amazon. World Dev. 2004, 32, 173–190. [Google Scholar] [CrossRef]
  77. Bullock, E.L.; Woodcock, C.E. Carbon Loss and Removal Due to Forest Disturbance and Regeneration in the Amazon. Sci. Total Environ. 2021, 764, 142839. [Google Scholar] [CrossRef] [PubMed]
  78. Tegegne, Y.T.; Lindner, M.; Fobissie, K.; Kanninen, M. Evolution of Drivers of Deforestation and Forest Degradation in the Congo Basin Forests: Exploring Possible Policy Options to Address Forest Loss. Land Use Policy 2016, 51, 312–324. [Google Scholar] [CrossRef]
  79. Sasaki, N.; Myint, Y.Y.; Abe, I.; Venkatappa, M. Predicting Carbon Emissions, Emissions Reductions, and Carbon Removal Due to Deforestation and Plantation Forests in Southeast Asia. J. Clean. Prod. 2021, 312, 127728. [Google Scholar] [CrossRef]
  80. Carpio, A.; Ponce-Lopez, R.; Lozano-García, D.F. Urban Form, Land Use, and Cover Change and Their Impact on Carbon Emis-sions in the Monterrey Metropolitan Area, Mexico. Urban Clim. 2021, 39, 100947. [Google Scholar] [CrossRef]
  81. Kalantari, Z.; Santos Ferreira, C.S.; Page, J.; Goldenberg, R.; Olsson, J.; Destouni, G. Meeting Sustainable Development Chal-lenges in Growing Cities: Coupled Social-Ecological Systems Modeling of Land Use and Water Changes. J. Environ. Manag. 2019, 245, 471–480. [Google Scholar] [CrossRef]
  82. Hobbs, T.J.; Neumann, C.R.; Meyer, W.S.; Moon, T.; Bryan, B.A. Models of Reforestation Productivity and Carbon Sequestration for Land Use and Climate Change Adaptation Planning in South Australia. J. Environ. Manag. 2016, 181, 279–288. [Google Scholar] [CrossRef]
  83. Lei, J.; Chen, Z.; Chen, X.; Li, Y.; Wu, T. Spatio-temporal Changes of Land Use and Ecosystem Services Value in Hainan Island from 1980 to 2018. Acta Ecol. Sin. 2020, 40, 4760–4773. [Google Scholar]
  84. Liu, K.; Wang, J. Driving Mechanism of Land Conduct on Urban Spatialexpansion in China: Empirical Analysis based on 273 Prefecture-level Cities. Resour. Sci. 2021, 43, 764–775. [Google Scholar]
  85. Meyfroidt, P.; Lambin, E.F. Global Forest Transition: Prospects for an End to Deforestation. Annu. Rev. Environ. Resour. 2011, 36, 343–371. [Google Scholar] [CrossRef]
  86. Armenteras, D.; Murcia, U.; González, T.M.; Barón, O.J.; Arias, J.E. Scenarios of Land Use and Land Cover Change for NW Amazonia: Impact on Forest Intactness. Glob. Ecol. Conserv. 2019, 17, e00567. [Google Scholar] [CrossRef]
  87. Meng, G.; Yang, K.; Zhu, F.; Mao, Y.; Zeng, Z.; Dong, X. Hainan of China: The evolution from a special economic zone to a comprehensive and compound free trade port. Geogr. Res. 2018, 37, 2363–2382. (In Chinese) [Google Scholar]
  88. Duan, S.; Su, Q. Driving Forces of Seasonal Migratory Retirees in the Context of Aging: A Case Study of Sanya. Trop. Geogr. 2021, 41, 441–448. (In Chinese) [Google Scholar]
  89. Liu, Y.; Zhou, L.; Zhang, N. Real Estate Dependence, Industrial Layout and Financial Balance—Based on the Analysis of Hainan’s Micro Data. Fisc. Sci. 2021, 70, 9–31. [Google Scholar]
  90. Liu, Y.; Yang, R.; Sun, M.; Zhang, L.; Li, X.; Meng, L.; Wang, Y.; Liu, Q. Regional Sustainable Development Strategy based on the Coordination between Ecology and Economy: A Case Study of Sichuan Province, China. Ecol. Indic. 2022, 134, 108445. [Google Scholar] [CrossRef]
  91. Jiang, Y.; Mohabir, N.; Ma, R.; Zhu, P. Sorting Through Neoliberal Variations of Ghost Cities in China. Land Use Policy 2017, 69, 445–453. [Google Scholar] [CrossRef]
  92. Song, Q.; Liu, T.; Qi, Y. Policy Innovation in Low Carbon Pilot Cities: Lessons Learned from China. Urban Clim. 2021, 39, 100936. [Google Scholar] [CrossRef]
  93. Ma, W.; de Jong, M.; de Bruijne, M.; Mu, R. Mix and Match: Configuring Different Types of Policy Instruments to Develop Successful Low Carbon Cities in China. J. Clean. Prod. 2021, 282, 125399. [Google Scholar] [CrossRef]
  94. Li, S.; Zhang, B.; Ma, B.; Hou, Q.; He, H. Spatiotemporal Evolution of Effective Accumulated Temperatures of ≥5 °C and ≥10 °C based on Grid Data in China from 1961 to 2016. J. Nat. Resour. 2020, 35, 1216–1227. [Google Scholar]
  95. Batjes, N.H. Soil Carbon stocks of Jordan and Projected Changes upon Improved Management of Croplands. Geoderma 2006, 132, 361–371. [Google Scholar] [CrossRef]
  96. Shi, Z.; Wang, Q.; Peng, J.; Ji, W.; Liu, H.; Li, X.; Rossel, R.A.V. Development of a National VNIR Soil-Spectral Library for Soil Classification and Prediction of Organic Matter Concentrations. Sci. China Earth Sci. 2014, 57, 1671–1680. [Google Scholar] [CrossRef]
  97. Zhao, D.; Wang, J.; Zhao, X.; Triantafilis, J. Clay Content Mapping and Uncertainty Estimation Using Weighted Model Averaging. CATENA 2022, 209, 105791. [Google Scholar] [CrossRef]
  98. Zhao, D.; Arshad, M.; Li, N.; Triantafilis, J. Predicting Soil Physical and Chemical Properties Using Vis-NIR in Australian Cotton Areas. CATENA 2021, 196, 104938. [Google Scholar] [CrossRef]
  99. Zhao, D.; Zhao, X.; Khongnawang, T.; Arshad, M.; Triantafilis, J. A Vis-NIR Spectral Library to Predict Clay in Australian Cotton Growing Soil. Soil Sci. Soc. Am. J. 2018, 82, 1347–1357. [Google Scholar] [CrossRef]
Figure 1. The location and general geographical information of Hainan Island.
Land 11 00244 g001
Figure 2. Driving factors of LULC conversion.
Land 11 00244 g002
Figure 3. The research flow chart of this study.
Land 11 00244 g003
Figure 4. LULC dynamics of Hainan Island from 1992 to 2019.
Land 11 00244 g004
Figure 5. LULC distribution dynamics of Hainan Island from 1992 to 2019.
Land 11 00244 g005
Figure 6. Carbon storage dynamics of Hainan Island from 1992 to 2019.
Land 11 00244 g006
Figure 7. Carbon storage distribution dynamics of Hainan Island from 1992 to 2019.
Land 11 00244 g007
Figure 8. Spatial distribution of carbon storage changes of Hainan Island from 1992 to 2019.
Land 11 00244 g008
Figure 9. Hotspot distribution of carbon storage change from 1992 to 2019: (a) represents an increase in carbon storage, (b) represents a decrease in carbon storage.
Land 11 00244 g009
Figure 10. (a) The actual LULC distribution in 2019 and (b) the simulated LULC distribution in 2019.
Land 11 00244 g010
Figure 11. (a) Distribution of LULC of Hainan Island under different future development scenarios; (b) distribution of carbon storage of Hainan Island under different future development scenarios. 1 denotes Pattern 1 and 2 denotes Pattern 2.
Land 11 00244 g011
Figure 12. Changes in carbon storage relative to 2019 under different future development scenarios. 1 denotes Pattern 1 and 2 denotes Pattern 2.
Land 11 00244 g012
Table 1. Details of LULC and driving factors data.
DataData AttributeYearsFormat/
Resolution
Sources
LULCLULC and land cover1992–2019Raster/300 mhttps://www.esa-landcover-cci.org
MeteorologyTemperature2010–2015Raster/1000 mhttps://data.cma.cn
Precipitation2010–2015Raster/1000 mhttps://data.cma.cn
GeographyDEM2000Raster/30 mhttps://earthexplorer.usgs.gov
River network2015Shapefilehttp://www.geodata.cn
Social economyPopulation
GDP
Railway network
Road network
Capital point
City point
County point
Settlement point
2015Shapefilehttp://www.geodata.cn
Table 2. Carbon density of each LULC type in Hainan Island (Ca—aboveground carbon density, Cb—belowground carbon density, Cs—soil organic carbon density, and Cd—dead organic carbon density).
LULC TypesCarbon Density (Mg/hm2)
CaCbCsCd
Cropland5.721.1896.612.10
Forest19.765.3125.432.80
Shrubland4.393.67101.330.70
Grassland4.205.8487.761.30
Built-up land2.600.7534.400
Wetland34.4516.84227.163.41
Water0000
Table 3. Proportion of transfers between LULC types, 1992–2019.
2019
CroplandForestShrublandGrasslandBuilt-Up LandWetlandWater
1992Cropland95.10%0.73%0.41%0.02%3.59%0.06%0.09%
Forest0.21%98.63%1.10%0.00%0.03%0.01%0.02%
Shrubland5.00%14.09%80.69%0.00%0.17%0.02%0.03%
Grassland12.69%0.00%0.00%67.26%17.51%1.02%1.52%
Built-up land0.00%0.00%0.00%0.00%100.00%0.00%0.00%
Wetland0.65%0.26%0.00%0.00%10.75%87.44%0.91%
Water0.65%0.02%0.00%0.47%1.11%0.31%97.45%
Table 4. Changes in carbon storage from the conversion of cropland to other land types.
LULC Type1992–20002000–20191992–2019
Area/km2Carbon/TgArea/km2Carbon/TgArea/km2Carbon/Tg
Cropland->Forest25.830.1231574464.260.3063916887.750.418392
Cropland->Shrubland6.840.0030643242.660.0191116849.320.02209536
Cropland->Grassland00002.88−0.00187488
Cropland->Built-up land15.48−0.10504728424.35−2.8796391434.52−2.94865272
Cropland->Wetland1.980.03489754.500.07931257.020.1237275
Cropland->Water8.64−0.091247045.22−0.0551284211.07−0.11691027
Total58.77−0.03517506540.99−2.52995166592.56−2.50322301
Table 5. Changes in carbon storage from the conversion of other land types to forest.
LULC Type1992–20002000–20191992–2019
Area/km2Carbon/TgArea/km2Carbon/TgArea/km2Carbon/Tg
Cropland->Forest25.830.123157464.260.3063916887.750.418392
Shrubland->Forest206.370.8915184314.191.3573008506.972.1901104
Grassland->Forest000000
Built-up land->Forest000000
Wetland->Forest0.18−0.002314260.09−0.001157130.18−0.00231426
Water->Forest0.090.00137960.090.001379610.180.00275922
Total232.471.01374119378.631.66391496595.082.60894736
Table 6. Changes in carbon storage from the transition of other land types to built-up land.
LULC Type1992–20002000–20191992–2019
Area/km2Carbon/TgArea/km2Carbon/TgArea/km2Carbon/Tg
Cropland->Built-up land15.48−0.10504728424.35−2.8796391434.52−2.948653
Forest->Built-up land0.18−0.002079725.13−0.059272025.85−0.067591
Shrubland->Built-up land0.09−0.000651061.35−0.00976596.12−0.044272
Grassland->Built-up land0.72−0.00441725.49−0.033681156.21−0.038098
Wetland->Built-up land0.36−0.008787967.11−0.173562217.47−0.18235
Water->Built-up land0.990.003737259.990.0377122511.070.04179
Total17.82−0.11724597453.42−3.11820813471.24−3.23917
Table 7. Future LULC and carbon storage under four different scenarios.
YearsScenariosLULC Area/km2Carbon Storage/Tg
CroplandForestShrublandGrasslandBuilt-Up LandWetlandWater
2025NT11,640.3317,472.963051.0930.87677.6174.43988.56429.33
BP11,613.3317,472.603051.0930.78705.1574.25988.65429.14
CP11,769.8417,454.333039.4830.15583.0272.81986.22429.87
EP11,640.1517,474.223052.4432.22669.6076.14991.08429.39
2035NT11,503.0817,582.312912.4929.88847.3575.69985.05428.70
BP11,432.3417,581.322912.5829.61919.7175.24985.05428.19
CP11,846.1617,532.362882.8828.08596.3471.46978.57430.14
EP11,502.9017,585.732915.9133.30826.2080.28991.53428.87
2050NT11,296.8917,730.272724.7528.531098.4577.31979.65427.70
BP11,163.2417,728.22724.6628.171235.4376.50979.65426.75
CP11,954.8817,632.262670.7525.38615.6069.66967.32430.48
EP11,296.9817,737.22730.7834.741057.586.49992.16428.04
Publisher’s Note: MDPI stays neutral with regard to jurisdictional claims in published maps and institutional affiliations.

