Article

Drone-Based Identification of Erosive Processes in Open-Pit Mining Restored Areas

1
Grumets Research Group, Departament de Geografia, Edifici B, Universitat Autònoma de Barcelona, E08193 Bellaterra (Cerdanyola del Vallès), Catalonia, Spain
2
Centre de Recerca Ecològica i Aplicacions Forestals (CREAF), E08193 Bellaterra (Cerdanyola del Vallès), Catalonia, Spain
3
Division of Geotechnical Engineering and Geosciences, Department of Civil and Environmental Engineering, Universitat Politècnica de Catalunya-BarcelonaTech, E08034 Barcelona, Catalonia, Spain
4
RPAS Unit, Aerial Support Service, Rural Agents Corp Government of Catalonia, E08130 Santa Perpètua de Mogoda, Catalonia, Spain
*
Author to whom correspondence should be addressed.
Land 2022, 11(2), 212; https://doi.org/10.3390/land11020212
Submission received: 31 December 2021 / Revised: 20 January 2022 / Accepted: 26 January 2022 / Published: 29 January 2022
(This article belongs to the Special Issue Land Degradation and Sustainable Land Management)

Abstract

:
Unmanned Aerial Systems, or drones, are very helpful tools for managing open-pit mining operations and developing ecological restoration activities. This article presents a method for identifying water erosion processes in active quarries by means of drone imagery remote sensing, in the absence of pre-existing imagery or mapping for comparison. A Digital Elevation Model (DEM) with a spatial resolution (SR) >10 cm and an orthophoto with an SR >2.5 cm were generated from images captured with a drone and their subsequent photogrammetric processing. By using Geographical Information Systems tools to process the DEM, a detailed drainage network was obtained, the areas of detected water erosion were separated, and the watersheds in the gullies identified. Subsequently, an estimated DEM before the erosive processes was reconstructed by interpolating the gully ridges; this DEM serves as a reference for the relief before the erosion. To calculate the volume of eroded material, the DEM of Differences was calculated, which estimates the volume difference between the previously estimated DEM and the current DEM. Additionally, we calculated the material necessary for the geomorphological adaptation of the quarry and the slope map, which are two valuable factors closely related to the monitoring of erosive processes. The results obtained allowed us to identify the erosion factors quickly and accurately in this type of mining. In the case of water-filled quarries, it would be important to characterize the subsurface relief. Essentially, the presented method can be applied with affordable and non-invasive materials to create digital grid maps at 10 cm resolution, obtaining data ready for 3D metrics, being a very practical landscape modelling tool for characterizing the restoration evolution of open-pit mining spaces.

1. Introduction

Extracting raw materials such as sand, gravel, crushed stone, brick clays, gypsum, and ornamental stones requires intensive and extensive efforts as all of these products are obtained from open-pit mining operations [1]. The open-pit mining method is used where large volumes of materials are mobilized, which gives rise to the formation of quarries [2]. Open-pit mining is one of the most land-degrading and landscape-modifing activities. Public awareness of sustainable land management has been growing, and since the 1990s, environmental policies and restoration actions have been increasingly focused on addressing environmental impacts [3]. In this type of mining, exploitation occurs in phases where the extraction of materials is linked with the ecological restoration of previously exploited areas, which generally includes geomorphological adaptation [4]. Open-pit mining can trigger erosive processes and landslides depending mainly on four principal factors (soil or substrate characteristics, vegetative cover, topography, and climate) [5]. Thus, to protect the environment, international organizations such as the United Nations (UN) and the Organization for Economic Co-operation and Development (OECD) have established guidelines [6,7]. At the same time, national policies (e.g., China [8], Canada [9], South Africa [10], Colombia [11], Australia [12], and Spain [13]) are becoming more and more committed to the responsible management of waste from extractive industries, and to protecting and rehabilitating the area affected by mining activities. These rehabilitating frameworks aim to prevent, or at least mitigate and rectify, land erosion as much as possible.
Open-pit mining causes the destruction of soil vegetation, the formation of steep slopes, and the accumulation of waste and production materials. Consequently, these detrimental factors catalyze erosive processes that are further aggravated by meteorological conditions. Given the urgency of addressing and finding solutions to environmental impacts, decision makers are becoming increasingly interested in monitoring and modelling [14]. So far, soil erosion characterization [15] has been traditionally modeled with the Universal Soil Loss Equation (USLE) [16] and the Revised USLE (R-USLE) [17], by using topographic information, land cover information, Digital Elevation Models (DEMs), field observations, and environmental measurements applied by technicians [18,19]. These specialists rely on official cartography, satellite and/or airborne imagery, lidar data, and many atmospheric sensors to characterize the erosion evolution of a given quarry. Remote sensing is one of the most important data sources for land management, land use and land cover mapping, and change detection. Since the 1970s, airborne and satellite remote sensing has provided large amounts of spatial and thematic data for environmental monitoring. Since the mid-2010s, the sensor miniaturization and commercialization of affordable Unmanned Aerial Systems (UASs) or drones have provided new possibilities of remote sensingdata capture, especially very detailed aerial images, for relief modelling and waterflow [20,21]. By using photogrammetric techniques, such as Structure from Motion (SfM), and Geographical Information System (GIS) tools, it is possible to generate topographic maps and three-dimensional models for monitoring mining production in stages [22], the calculation of stockpiles and dumps [23], as well as the analysis of the fragmentation of extracted material. Therefore, they are instrumental in planning and administrating future work in mines, both in terms of exploitation [24] and restoration [25].
A UAS includes an Unmanned Aerial Vehicle (UAV), a ground station, a communications link, and often a sensor to capture data. In relatively small areas (around 10 km2), UASs are the best tools for obtaining information by remote sensing since they are inexpensive, deploy quickly, and can fly at low altitudes, thereby limiting atmospheric effects such as clouds and fog. UAVs can carry different types of sensors depending on their mission, including acoustic, visual, chemical, and biological sensors for environmental remote sensing purposes [26]. Compared to previous methods, the planned acquisition of optical imagery from a UAS joining the image processing with SfM and GIS results in various monitoring and volume calculations, which are essential for time and cost reduction. The use of UASs facilitates the obtainment of Digital Surface Models (DSMs), orthoimagery, land cover mapping, and the generation of three-dimensional models with centimetric resolution [27]. In addition to supporting the monitoring of mining production, risk maps can be obtained by processing and analyzing the images captured with a UAS. With these maps of areas that are difficult to access due to steep slopes and unstable ground, one can examine the rock geometry and analyze the topography in areas where explosives were used, among other extractive activities [28].
The monitoring of soil erosion in quarries with UASs has been evolving since 2015. In 2018 Padró et al. [29] presented a whole series of high-quality products derived from drone flights, which were intended to support ecological restoration plans in the 483 open-pit mining operations in Catalonia (Spain, Europe). With regional government assistance, a detailed workflow was proposed to support both the mining process and post-mine-closure activities using UASs [30,31]. The aim was to offer a set of techniques for generating spatial information, including vegetation indices, soil erosion, drainage networks, and digital models, among other measures supporting restoration policies [25].
The main objective of this work is to define in detail and demonstrate, with high-quality and high-resolution images, the applicability of a methodology for identifying areas eroded by surface runoff, focusing on the case where there is no reference DEM of before the erosion. The novelty of this work lies in the strategy of estimating the DEM before the erosion process (DEMT0), from which the current DEM (DEMT1) is subtracted to obtain a DEM of Differences (DoD) and the eroded volume of soil between time date 0 (T0) and date 1 (T1) is quantified. Apart from the method itself, interesting results could be derived from the slope map, whereby erosion rates can be estimated and erosion ranges can be determined according to slope categories. We focused on open-pit mine scenarios located in Catalonia, Spain. Based on the results obtained using this monitoring methodology, private companies and public administrations could be significantly supported in their decision-making concerning quarry operations and further restorations with the help of renewable and accurate mapping products.

2. Materials and Methods
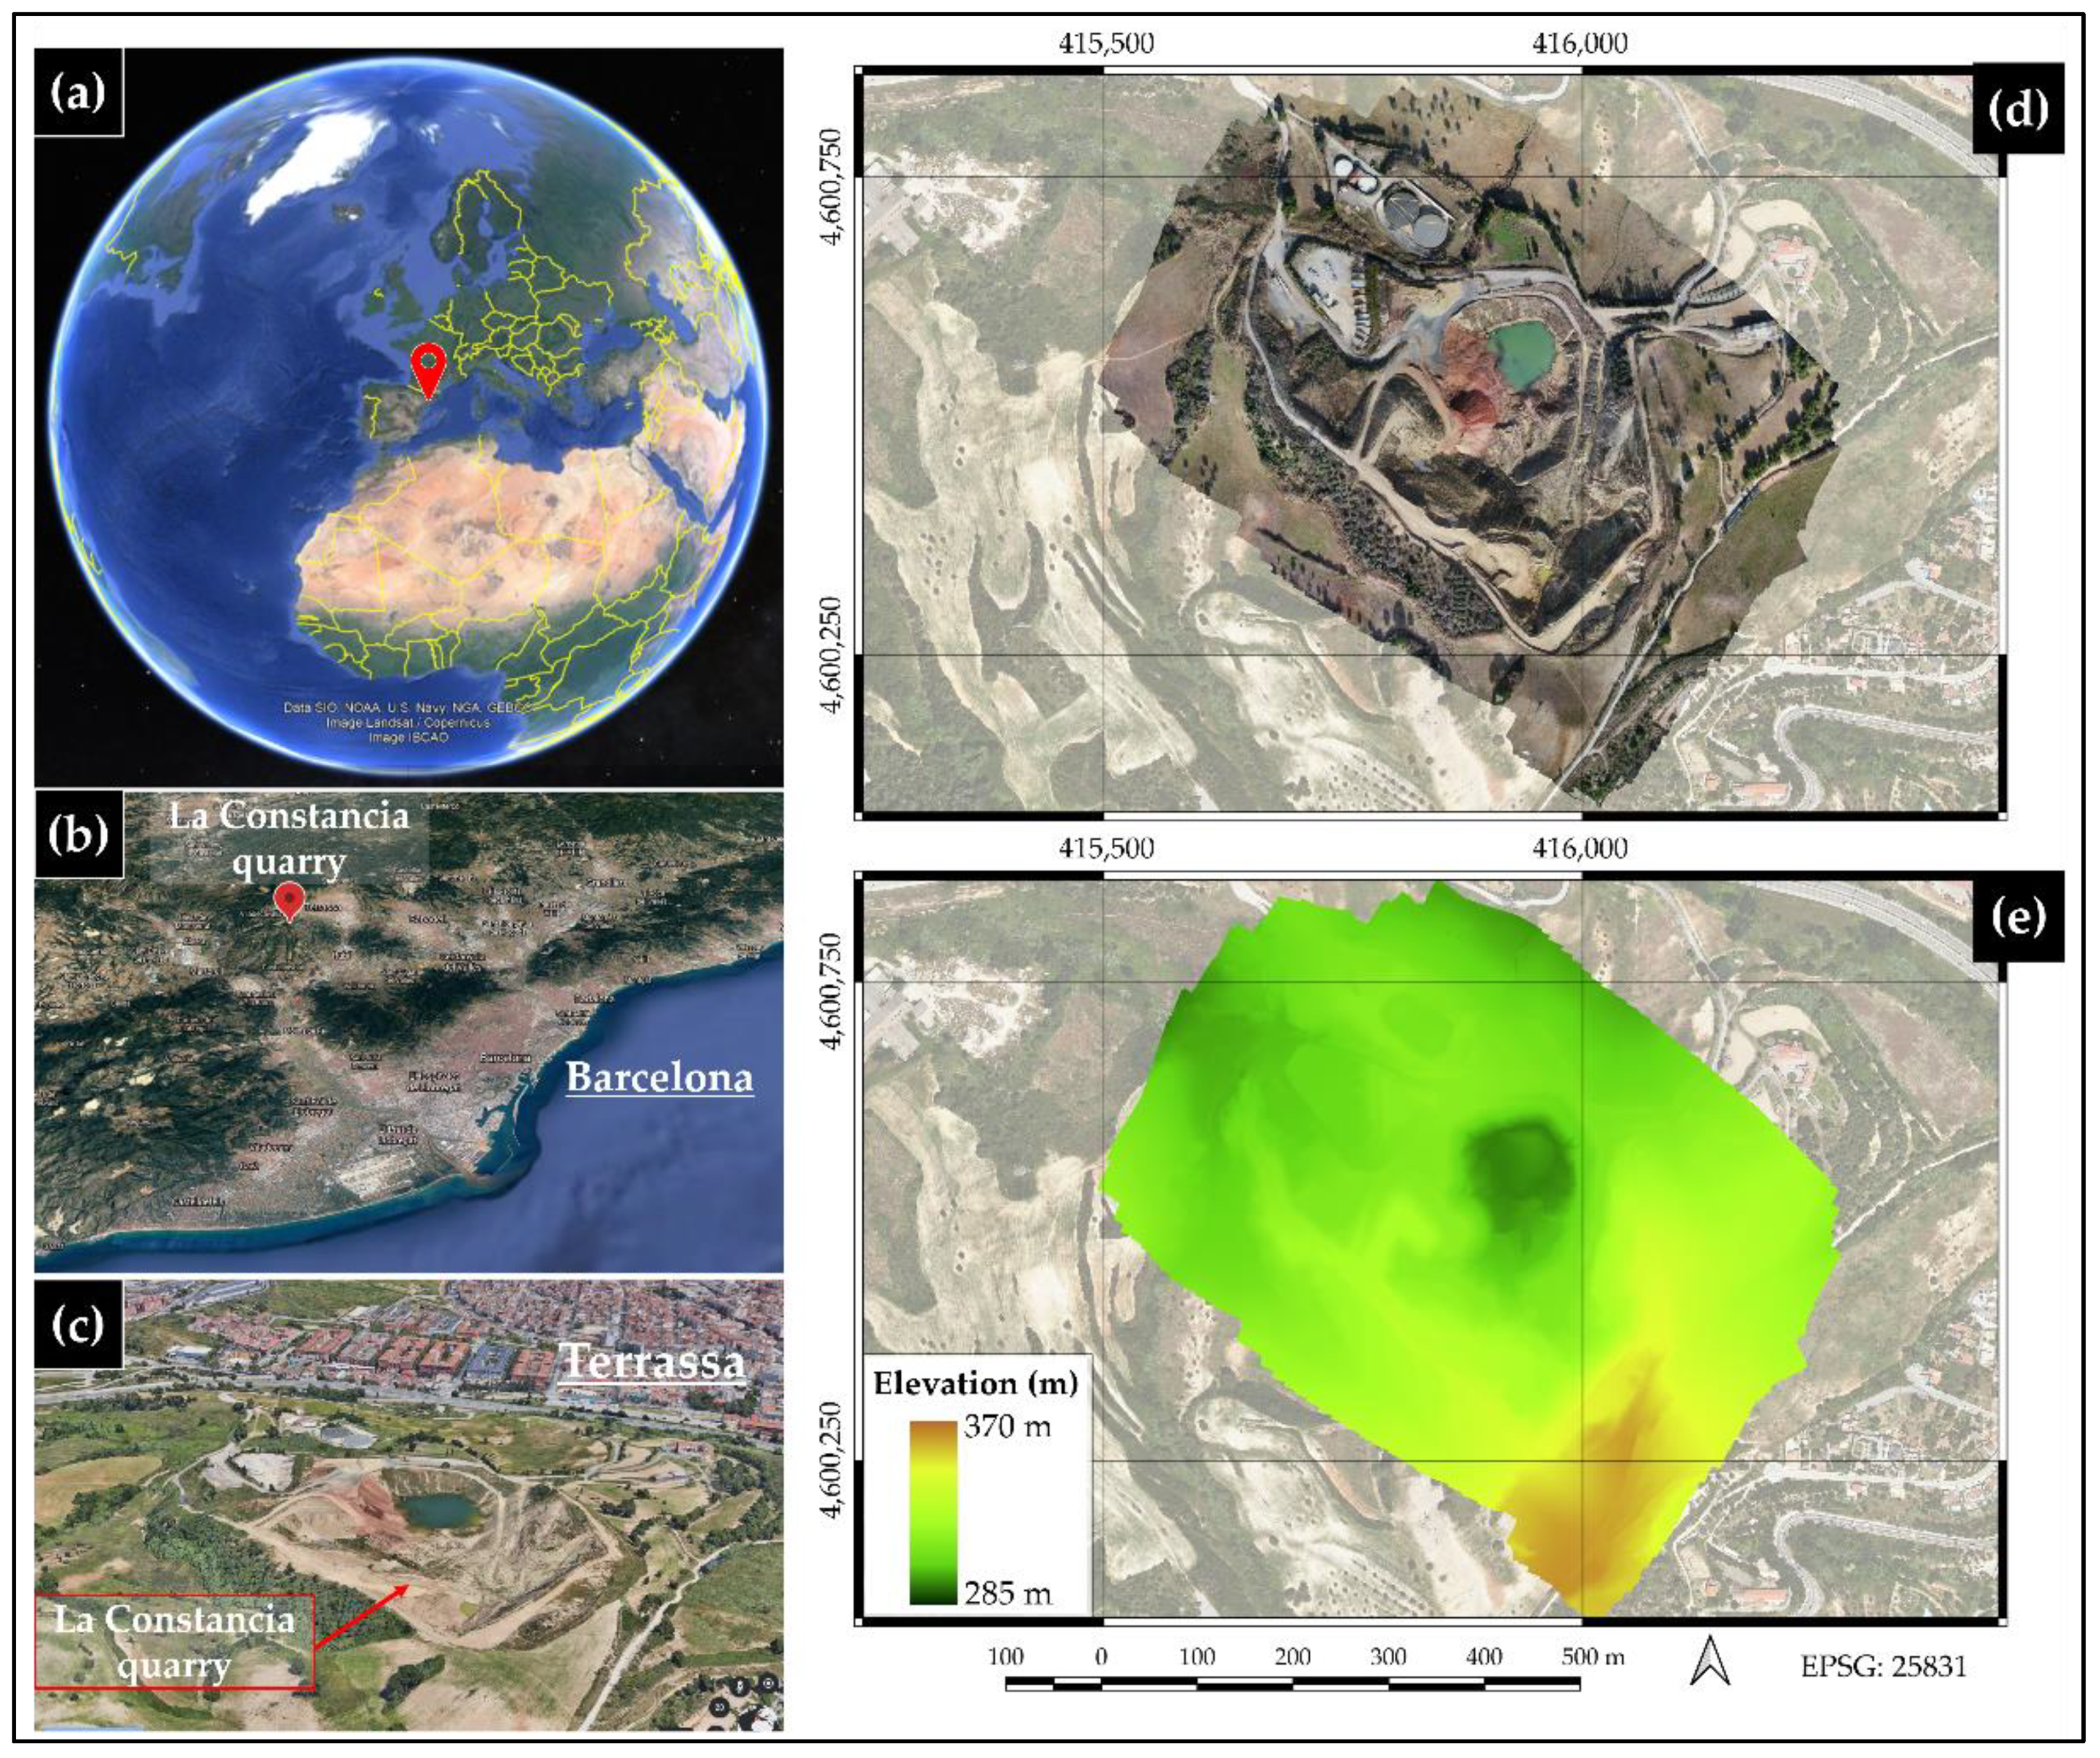
2.1. Study Area

The study area corresponded to the “La Constancia” quarry (Lat. 41°33′8.2547″ Lon. 1°59′31.7548″), which is part of the municipality of Terrassa (Catalonia, Spain, Europe) (Figure 1). The open-pit mine extracts inert aggregate materials, such as sand and gravel of different sizes, which are currently used for construction work. According to the geological map of the area, Miocene non-consolidated conglomerates with a silty-sandy matrix are the geological substrate which mainly constitutes those granular materials [32].
The study area has a Mediterranean sub-humid climate, where intense rainfalls during summer and autumn are frequent. According to the data from the closest meteorological station (Sabadell-Parc Agrari), the area was affected by two intense rainfall episodes (>50 mm/h) during October and December 2019 [33].
The drone-acquired data coversd a wide and heterogeneous area that includes buildings, roads, and areas surrounding the front side, where the aggregates are extracted. The area which corresponds to the bottom of the mining basin has water deposits and was delimited and omitted to avoid errors in processing. Thus, we had a study area of approximately 36 ha, with a polygonal shape of 725 m × 550 m, wherein the land height varied between 288 m and 367 m above sea level. Specifically, there was a difference of near 80 m between the quarry bottom and its highest part (Figure 1). The most eroded part, which is the focus of the study and where more significant processes were undertaken, had a polygonal shape of 200 m × 150 m.

2.2. Unmanned Aerial Vehicle (UAV), Image Sensor and Flight Planning
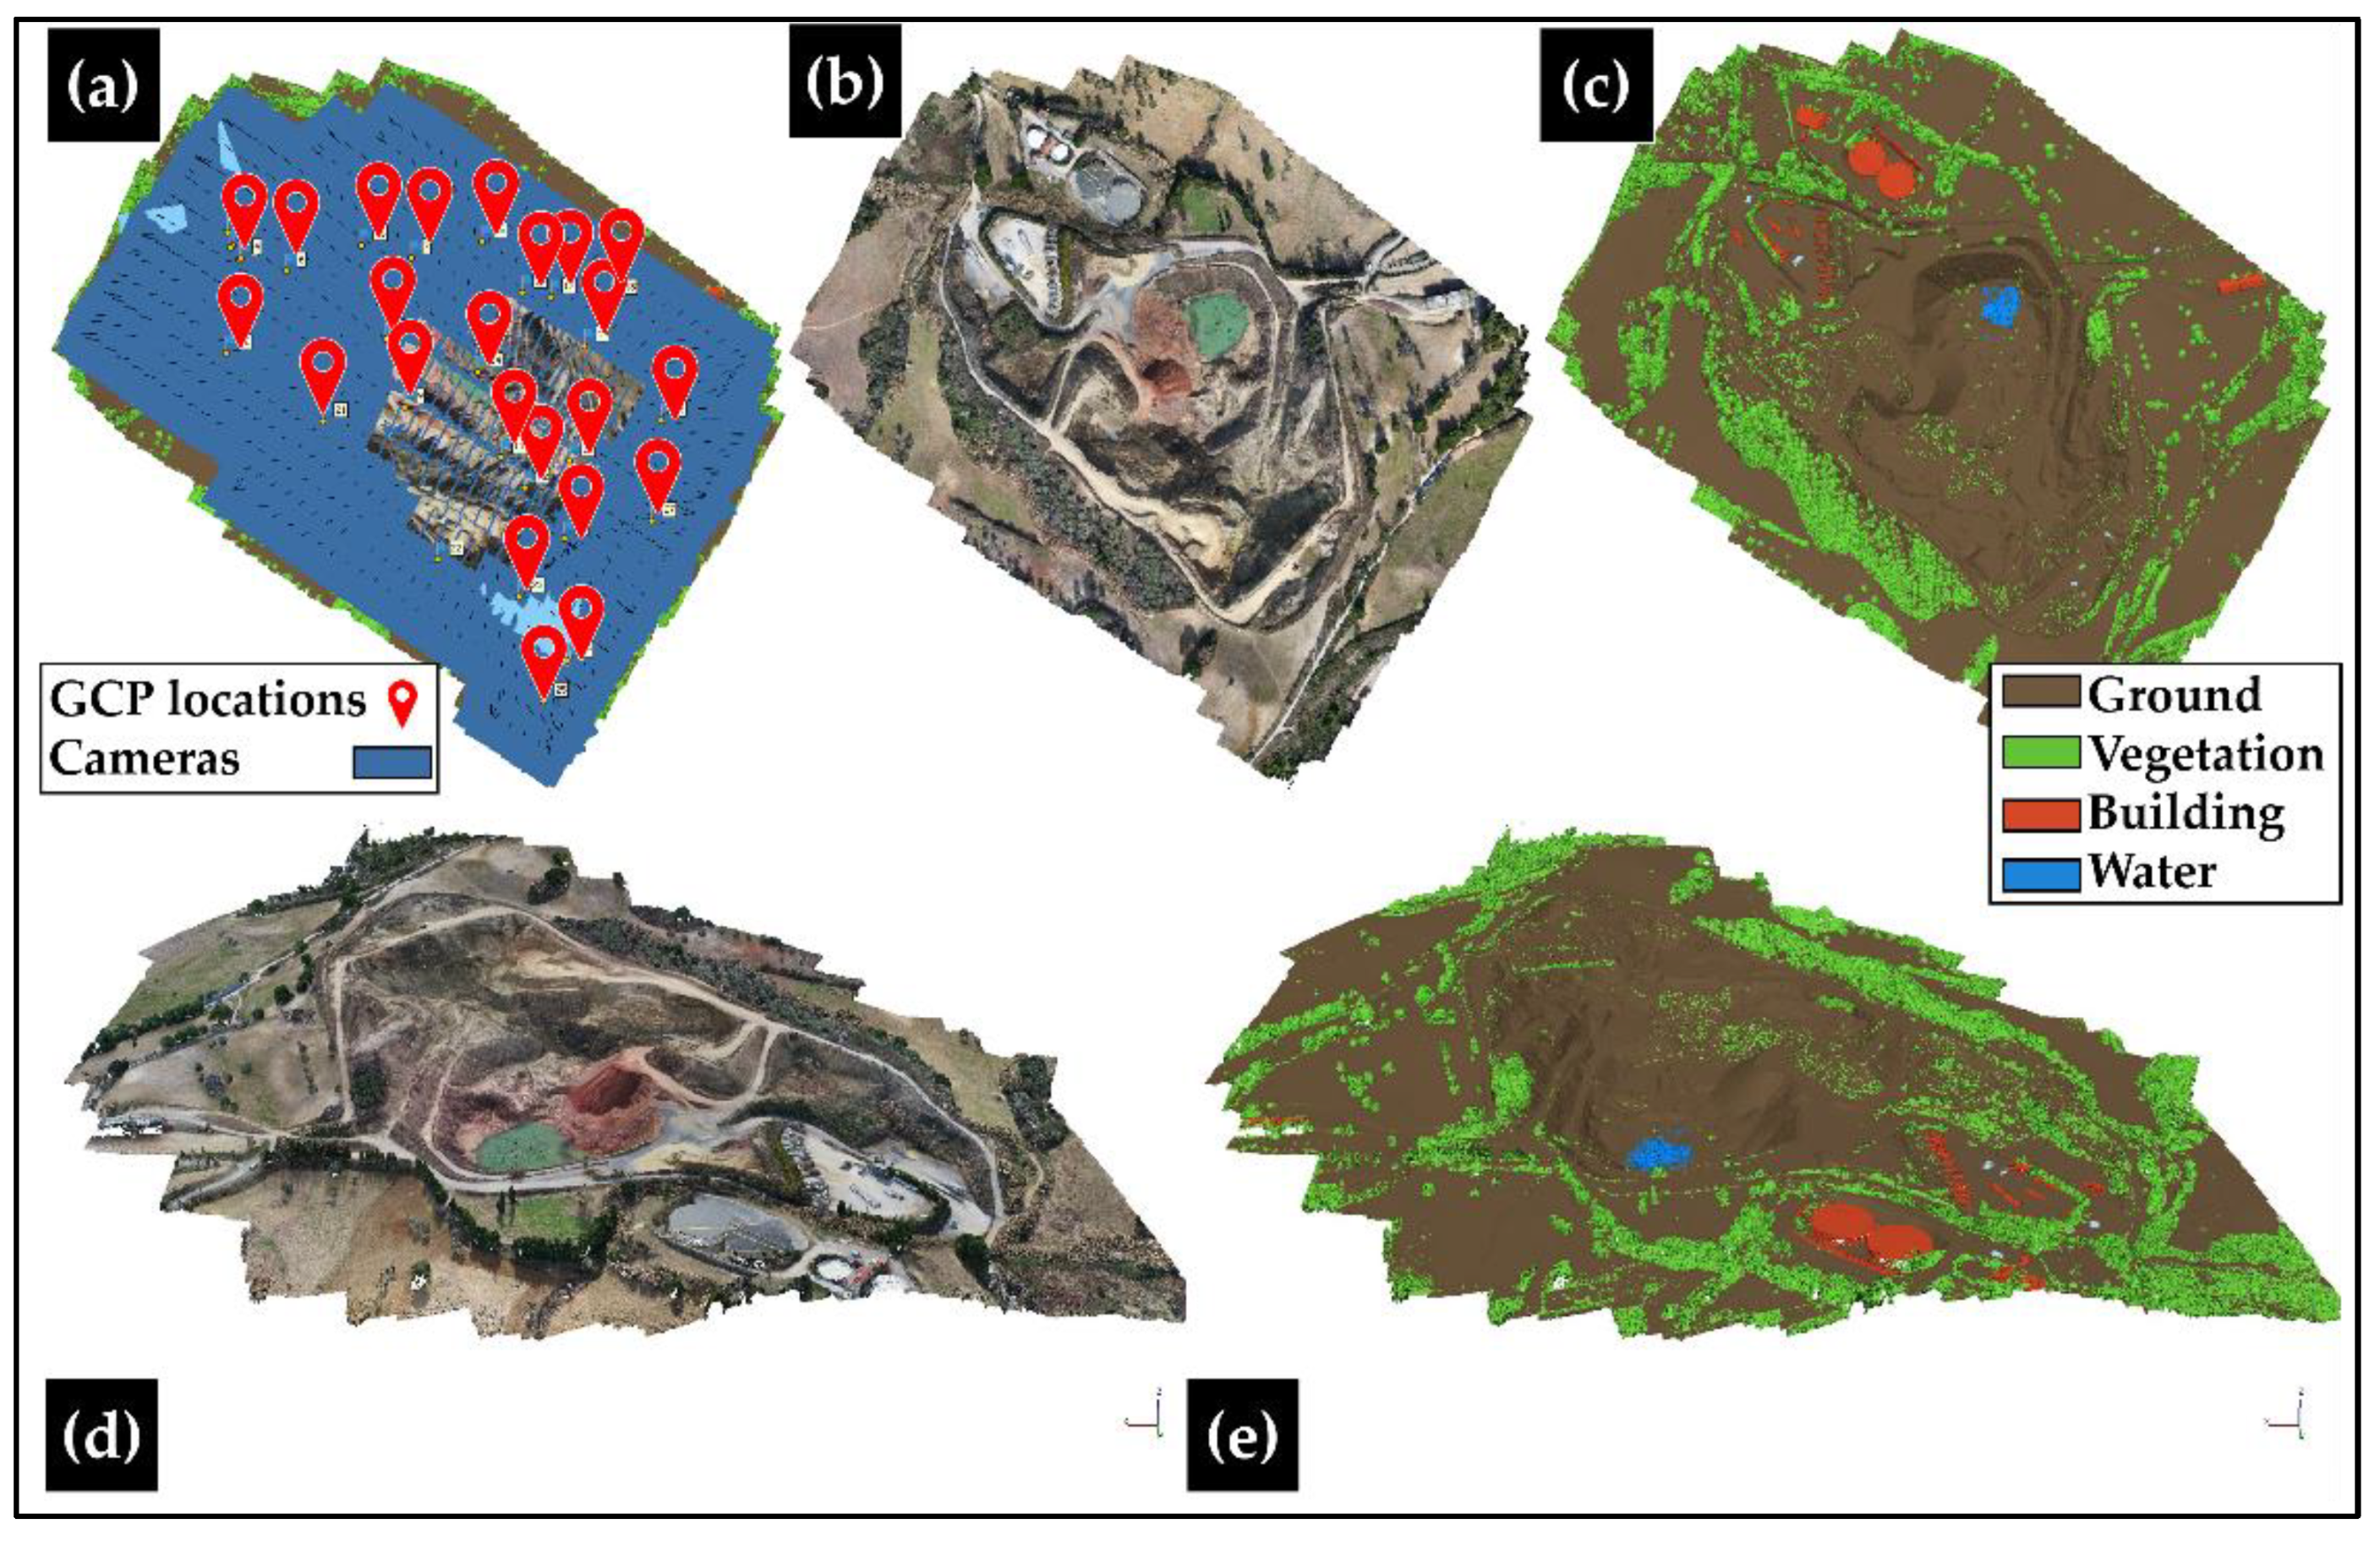
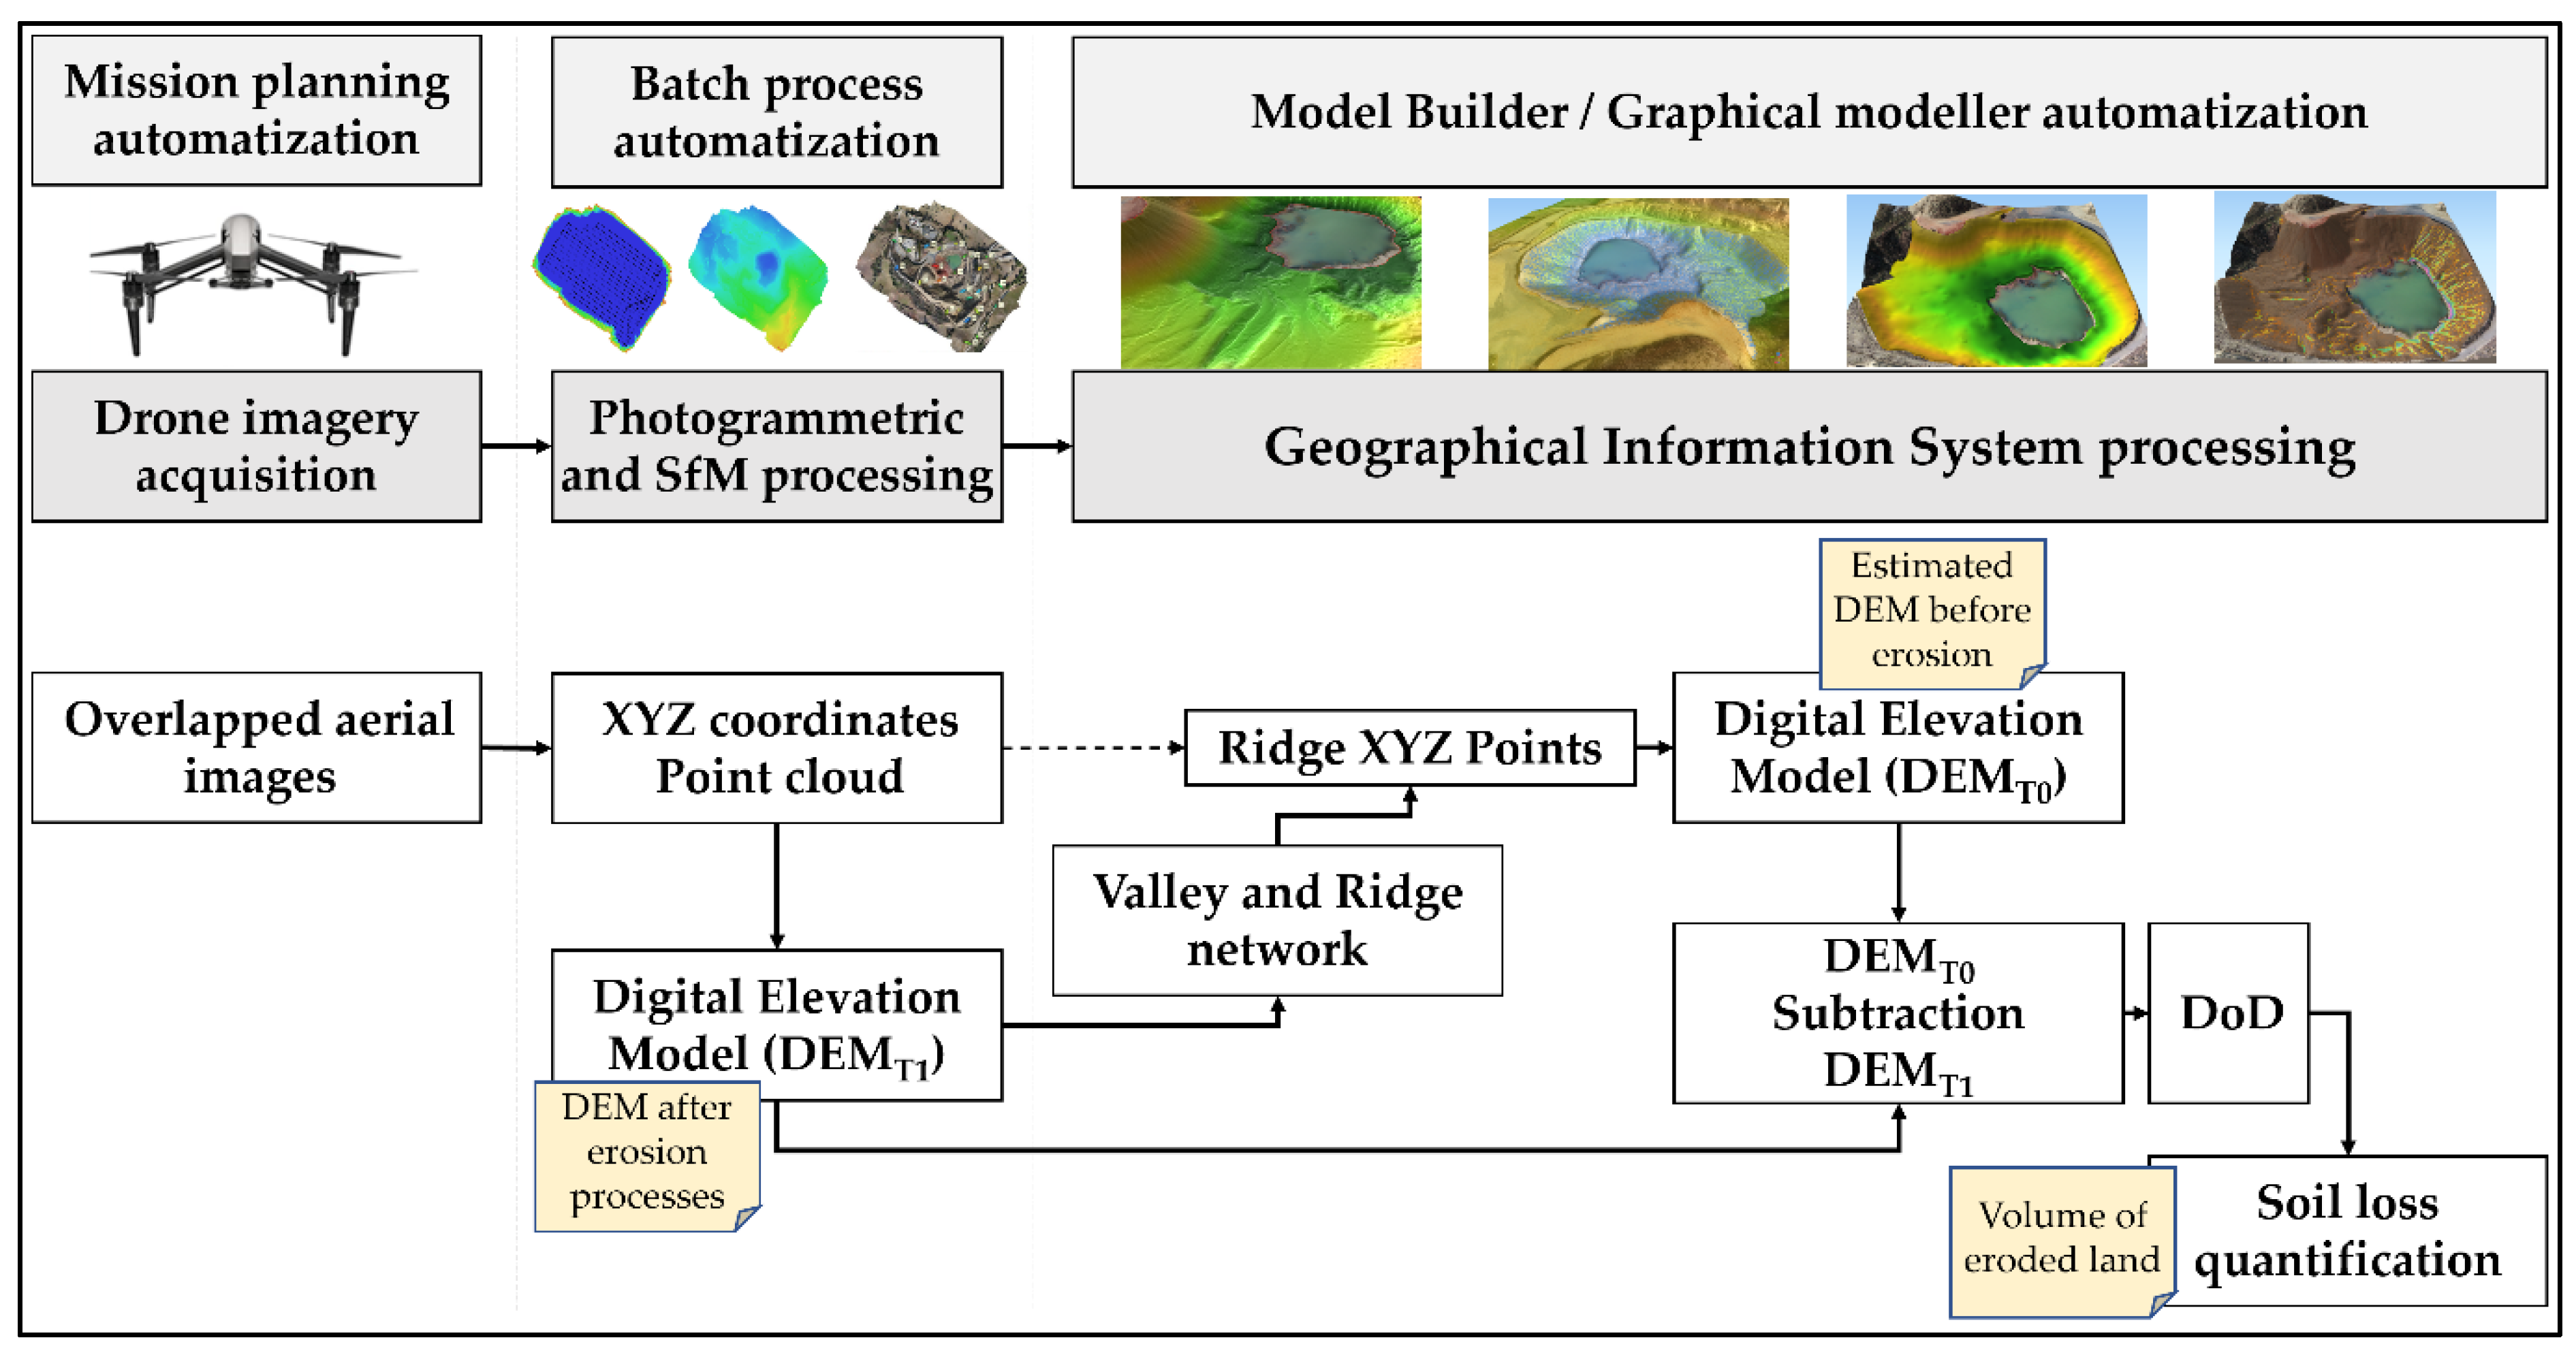
A photogrammetric survey was carried out on 5 May 2021, between 11:55 a.m. CET and 12:45 p.m. CET under excellent weather conditions. Georeferencing was carried out by locating 24 Ground Control Points uniformly distributed throughout the flight area and subsequently corroborated by photointerpretation. The Ground Control Point georeferencing method has been tested and compared with other methods (e.g., Post-Processed Kinematic) and offers optimal results [34]. To cover the study area, 753 photographs were taken with a transverse and longitudinal overlap of 80%, at an average flight altitude of 115 m above the ground, covering an area of 353,000 m2. The Unmanned Aerial Vehicle used was a DJI Inspire 2 [35], which has a magnesium-aluminum alloy shell and carbon fiber arms, can fly at speeds of up to 94 km/h with a thrust of 2 kg per rotor, 15” propellers, and a maximum flight time of 27 min. The sensor used was DJI Zenmuse X5S (FC6520) RGB of 20.8 MP (5280 × 3956 pixels). The sensor is stabilized by three axes of precise motor rotation with ± 0.01° control driven by a dedicated processor. Vibration is reduced by using three shock-absorbing balls.

2.3. Methodology

Widely used software was employed for the photogrammetric treatment of drone images (Agisoft Metashape PhotoScan 1.5.2 [36]) and GIS processing (ArcGIS 10.8 [37], MiraMon 8.2e [38], QGIS 3.10 [39], and SAGA 7.9.0 [40]). The main novelty of this workflow was the method of estimating the DEM in 2019, before the erosion process (DEMT0), from the DEM after the erosion process (DEMT1), in 2021. Subtracting the current DEM (DEMT1), which is the result of erosion processes, from the estimated DEMT0 makes it possible to obtain a DoD and quantify the volume of eroded material. A Digital Surface Model (DSM) was obtained with the photogrammetric processing of the drone-acquired images. Thanks to the overlapping of the images, a 3D point cloud (XYZ coordinates) with a very dense sampling can be constructed. The point cloud was classified to keep only the terrain points, thus avoiding vegetation and building surfaces (Figure 2).
Therefore, only ground points’ Z coordinate (altitude) was interpolated to model the terrain surface and obtain a grid map containing the terrain altitude (DEMT1). This DEM was used to obtain the current drainage network by applying GIS tools based on the aspect and slope models of DEMT1, which defines the water flow direction, water flow accumulation, the channel flow network, and the watershed ridge divisions. The estimated DEM before the erosion process (DEMT0) was obtained from the interpolation of the Z coordinate (altitude) of the 3D point cloud points located on the ridges of the DEMT1. By selecting the points close to the watershed divisions and interpolating them, the terrain surface was modelled and rasterized to obtain a primary grid map with the terrain altitude (DEMT0), being a reasonable approximation of the original relief before the erosion processes considering that there was no previous direct source of data. If the original 3D point cloud was not available, a variant could be reached if the DEMT1 cells intersecting the ridge vector were converted to points, for cloud comparison, interpolation, and rasterization.
In this processing, special care was given to ensure that the cell-size value of the DEM before erosion was equal to the cell-size value of the current DEM, so as to avoid errors in the subsequent comparison of Digital Elevation Models. Finally, an arithmetic subtraction operation was executed (DEMT0–DEMT1) to obtain a difference raster that corresponds to the volume of material eroded.
Taking into account that slope inclination and length are factors affecting the erosion process, the slope calculation was carried out using the classification criteria of Lugo Hubp [41], which classifies the slopes in five categories given the well-known correlation between slope and erosion: planar (0–3°), slightly inclined (3–12°), inclined (12–30°), sliding (30–45°), and free fall (>45°).
The drone imagery acquisition was fully planned, automatized, and replicable by using mission planner software. The photogrammetric and SfM processing was automatized using batch processes. The GIS process to extract hydrologic and morphometric information from a DEM was fully automatized with the graphical model builder tools of ArcGIS 10.8 or QGIS 3.10 (Figure 3).

3. Results

From the photogrammetric processing, an orthophotomosaic of 2.4 cm/pixel native resolution was obtained, which was resampled to 2.5 cm/pixel to facilitate raster processing and conform with the Catalan official mapping agency’s cartography grid (multiple of 2.5 cm). A point cloud with a density of 122 points/m2 was generated, which allowed us to elaborate a DEM with a resolution of 10 cm/pixel using only the points classified as ground. In the AOI the vegetation coverage is negligible, as can be observed in the orthoimage, thus avoiding possible errors related to 3D point cloud classification errors. At this spatial resolution, the photointerpretation of the relief at very high detail is possible, particularly when combining 2D and 3D models (Figure 4).

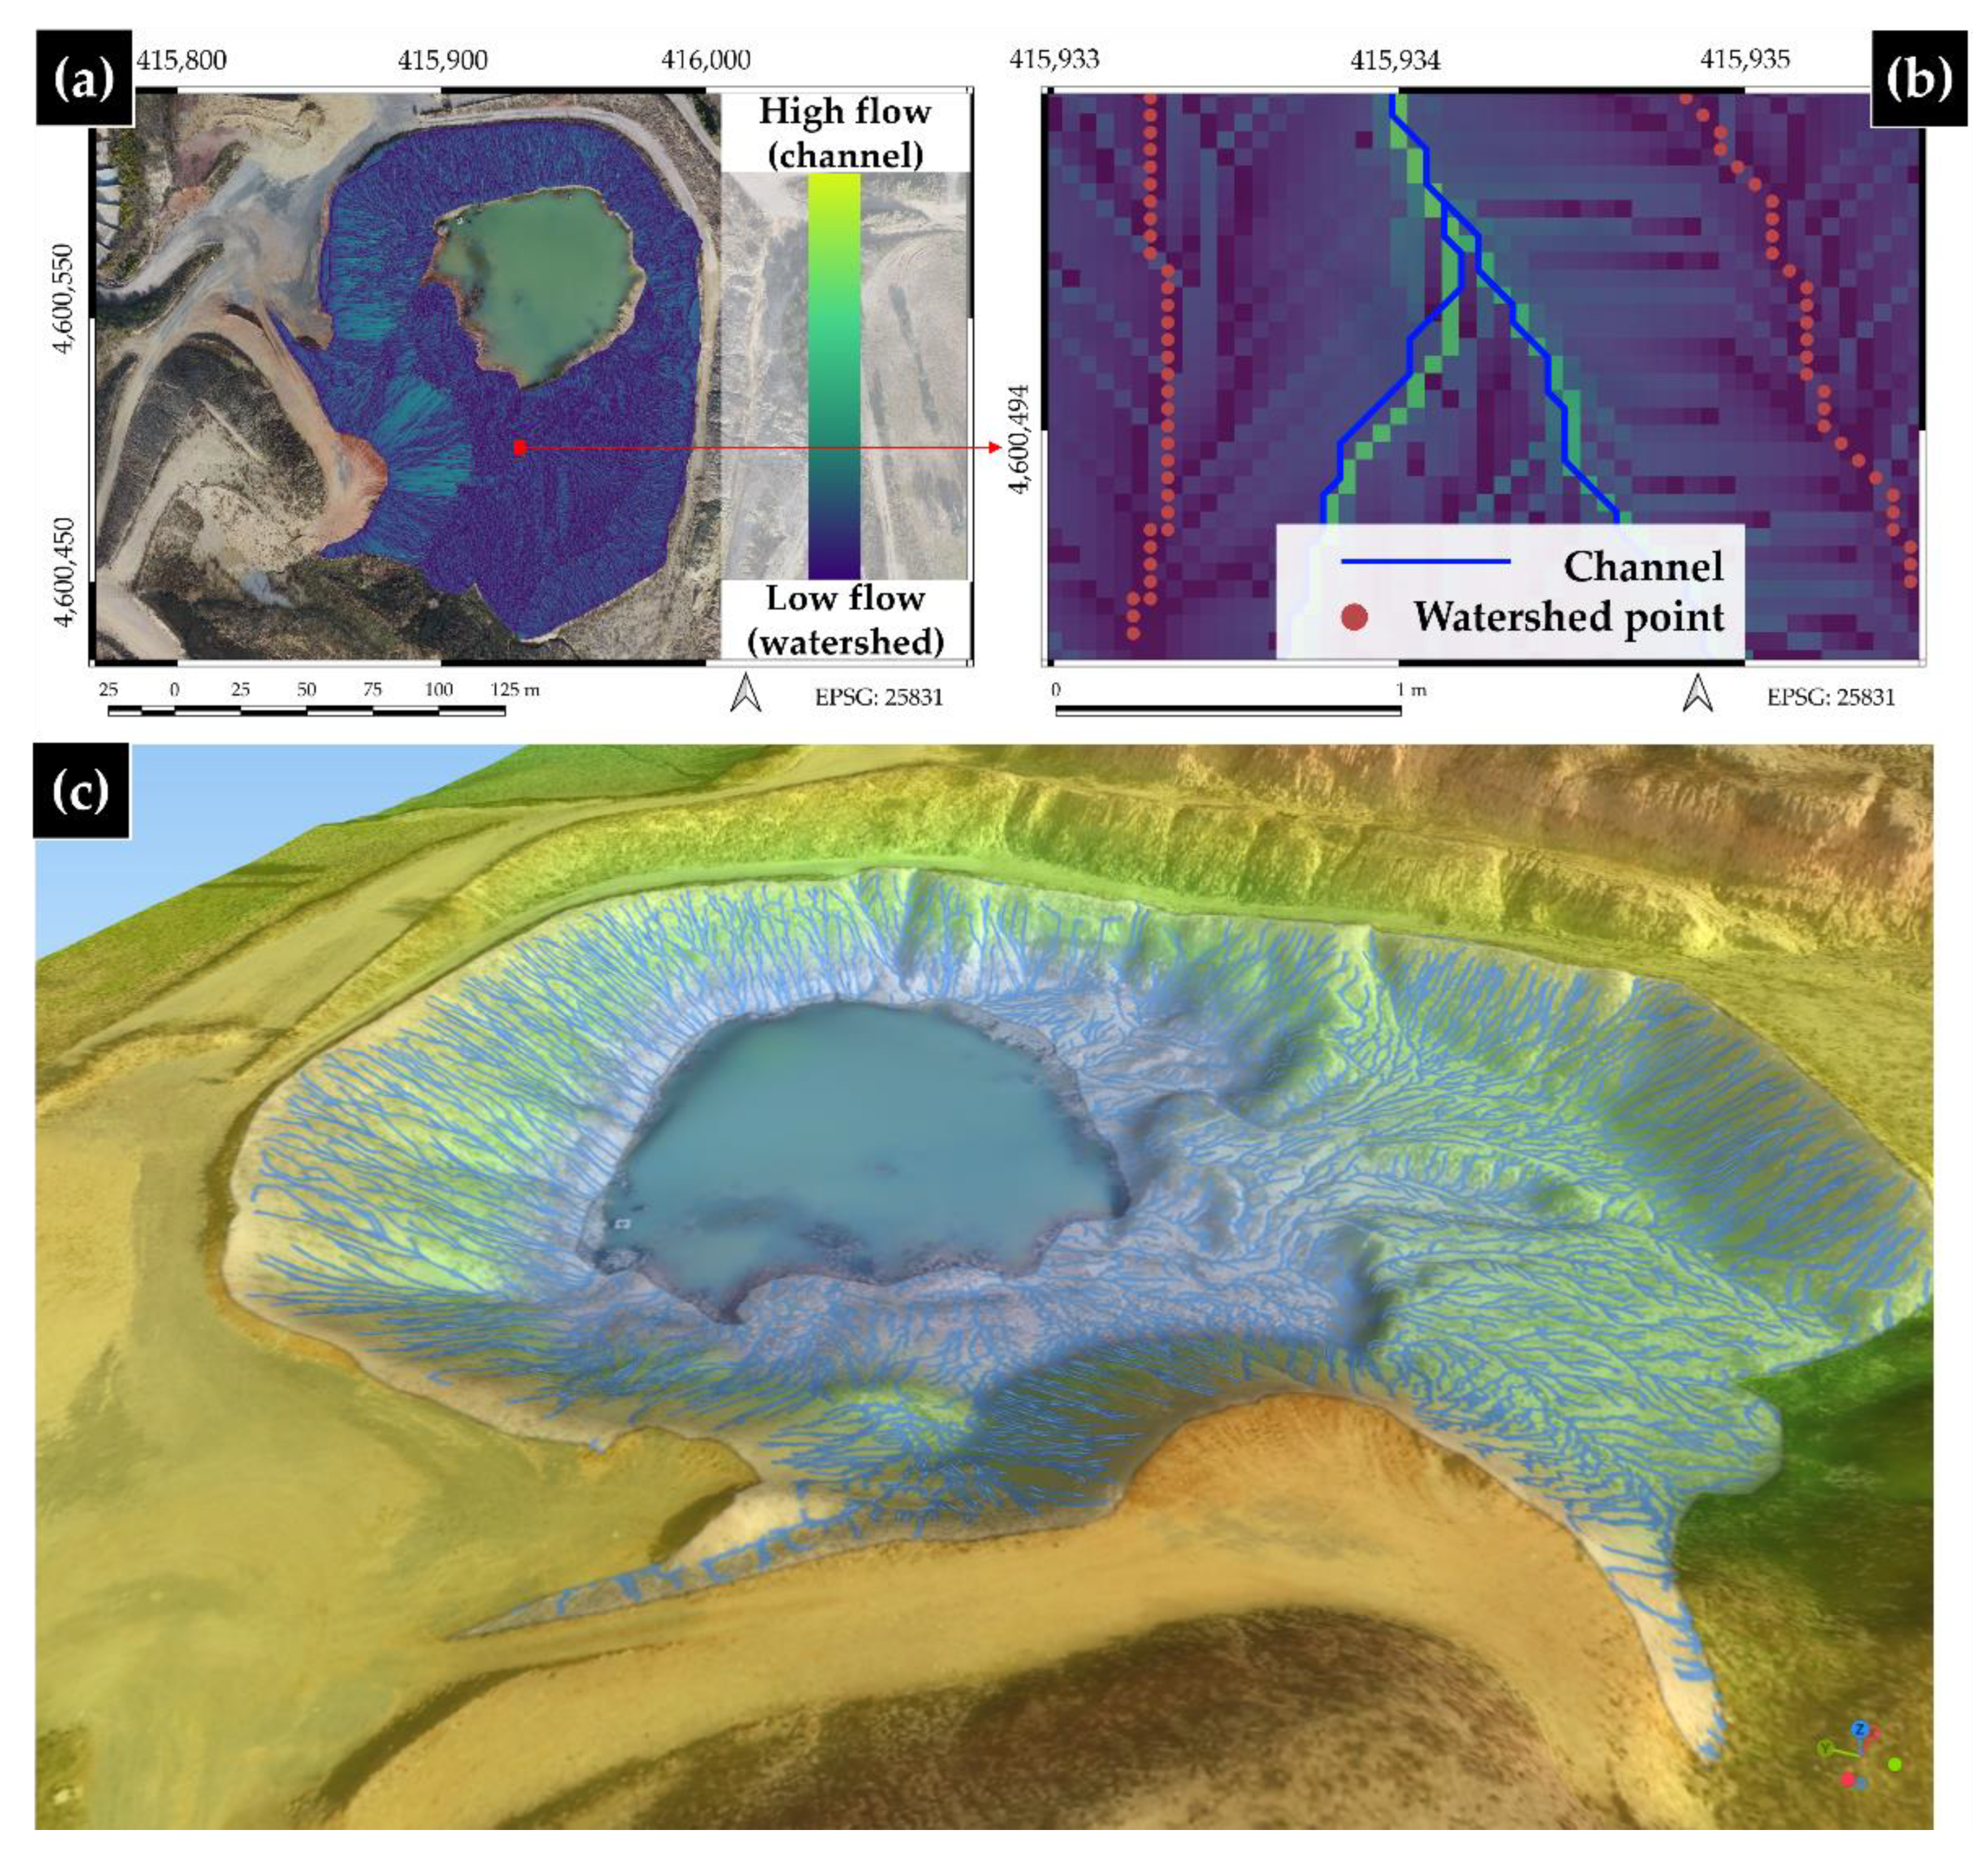
3.1. Morphometric Analysis and Drainage Network

To carry out this analysis, the 10 cm resolution DEM T1 was used as the main input. The slope and aspect models were calculated for initial morphometric analysis. Firstly, the sinks were corrected by using an algorithm [42] to modify the elevation values in those places of the DEM where water could accumulate. In this correction, the drainage network flowed without interruption through the model. Secondly, the drainage network derived from the DEMT1 was characterized by the natural course of water and sediment transport by gravity on the ground, using the catchment area algorithm [43]. Subsequently, the flow direction was calculated to determine the direction of the water flow from one pixel to another, considering each pixel as eight adjacent cells (D8), following the direction where there was a more pronounced slope from the cell being analyzed. Cells with concentrated flow accumulation were used to identify the channels of the drainage network [44] in order to determine the amount of water that flowed through each cell from the adjacent cells and allow the extraction of the sectors of the land where water accumulates (Figure 5).
Once detected, the channels, together with the DEMT1, were used to delimit the watershed network. The selection of the XYZ points of the dense point cloud, located over the watershed lines, was the key to obtaining the reference altitudes on the ridges, being the T0 estimation. Interpolating the Z coordinate at the ridges, it was possible to approximate a DEMT0 (Figure 6).

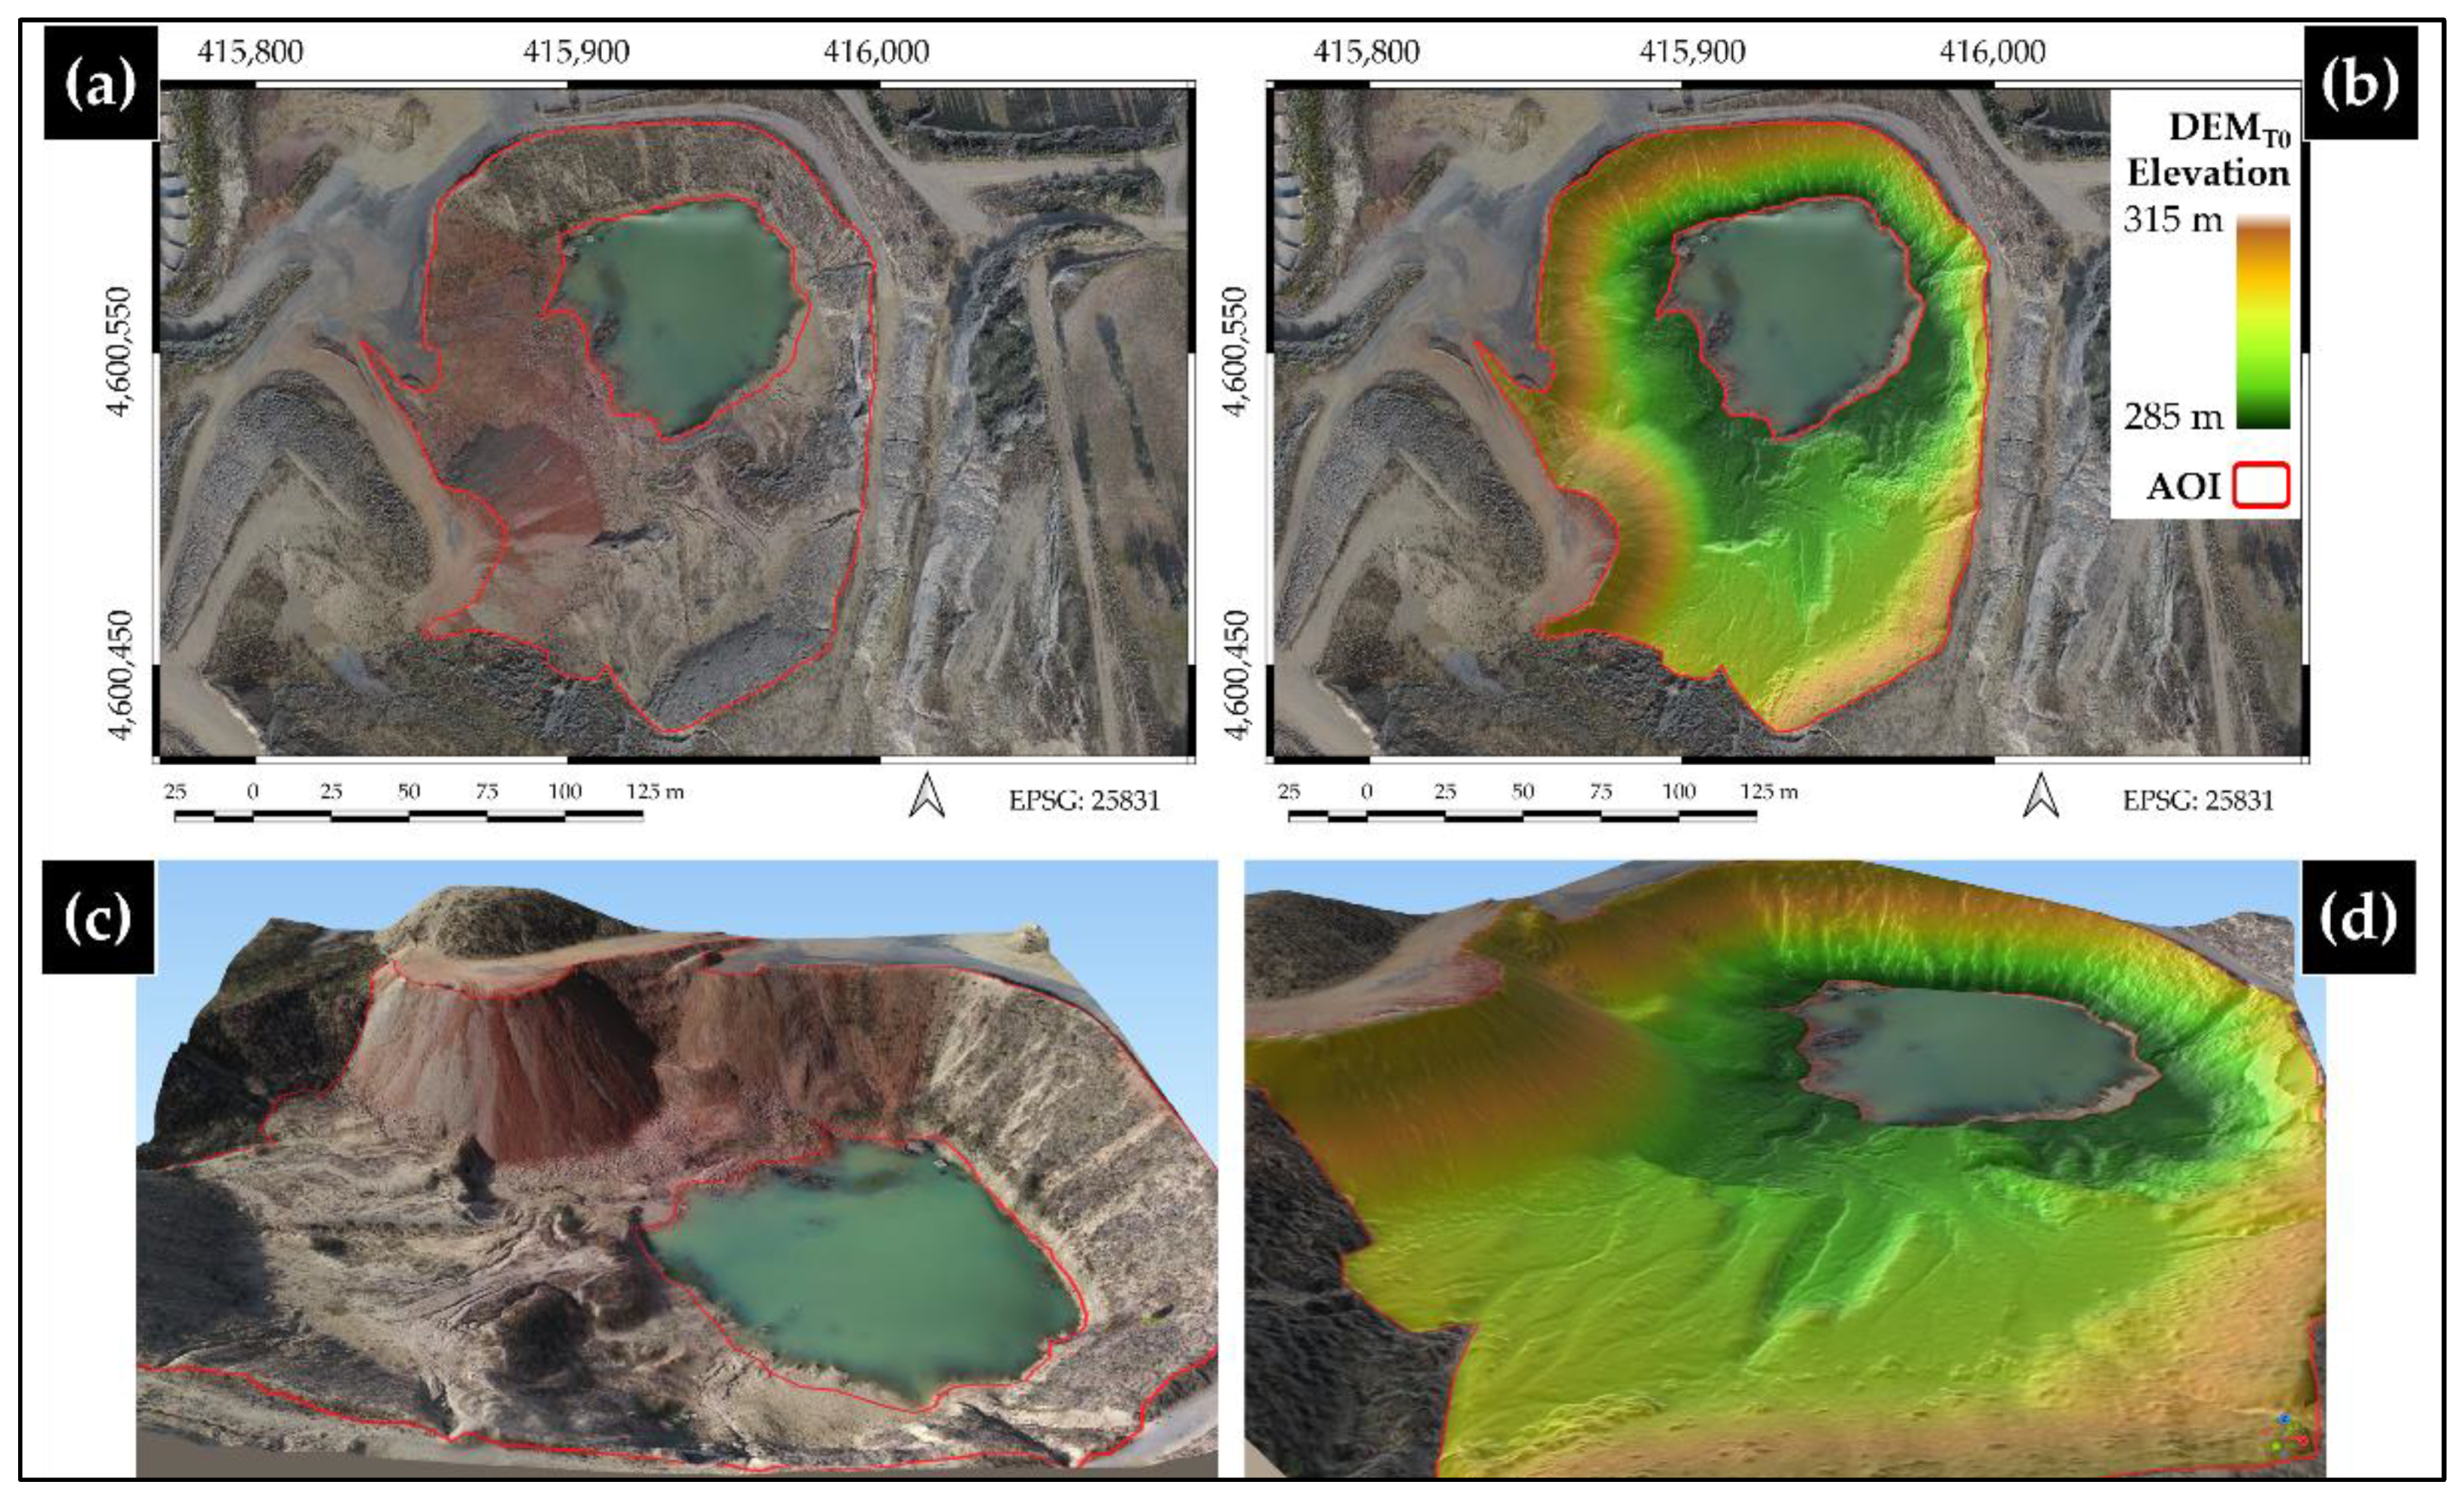
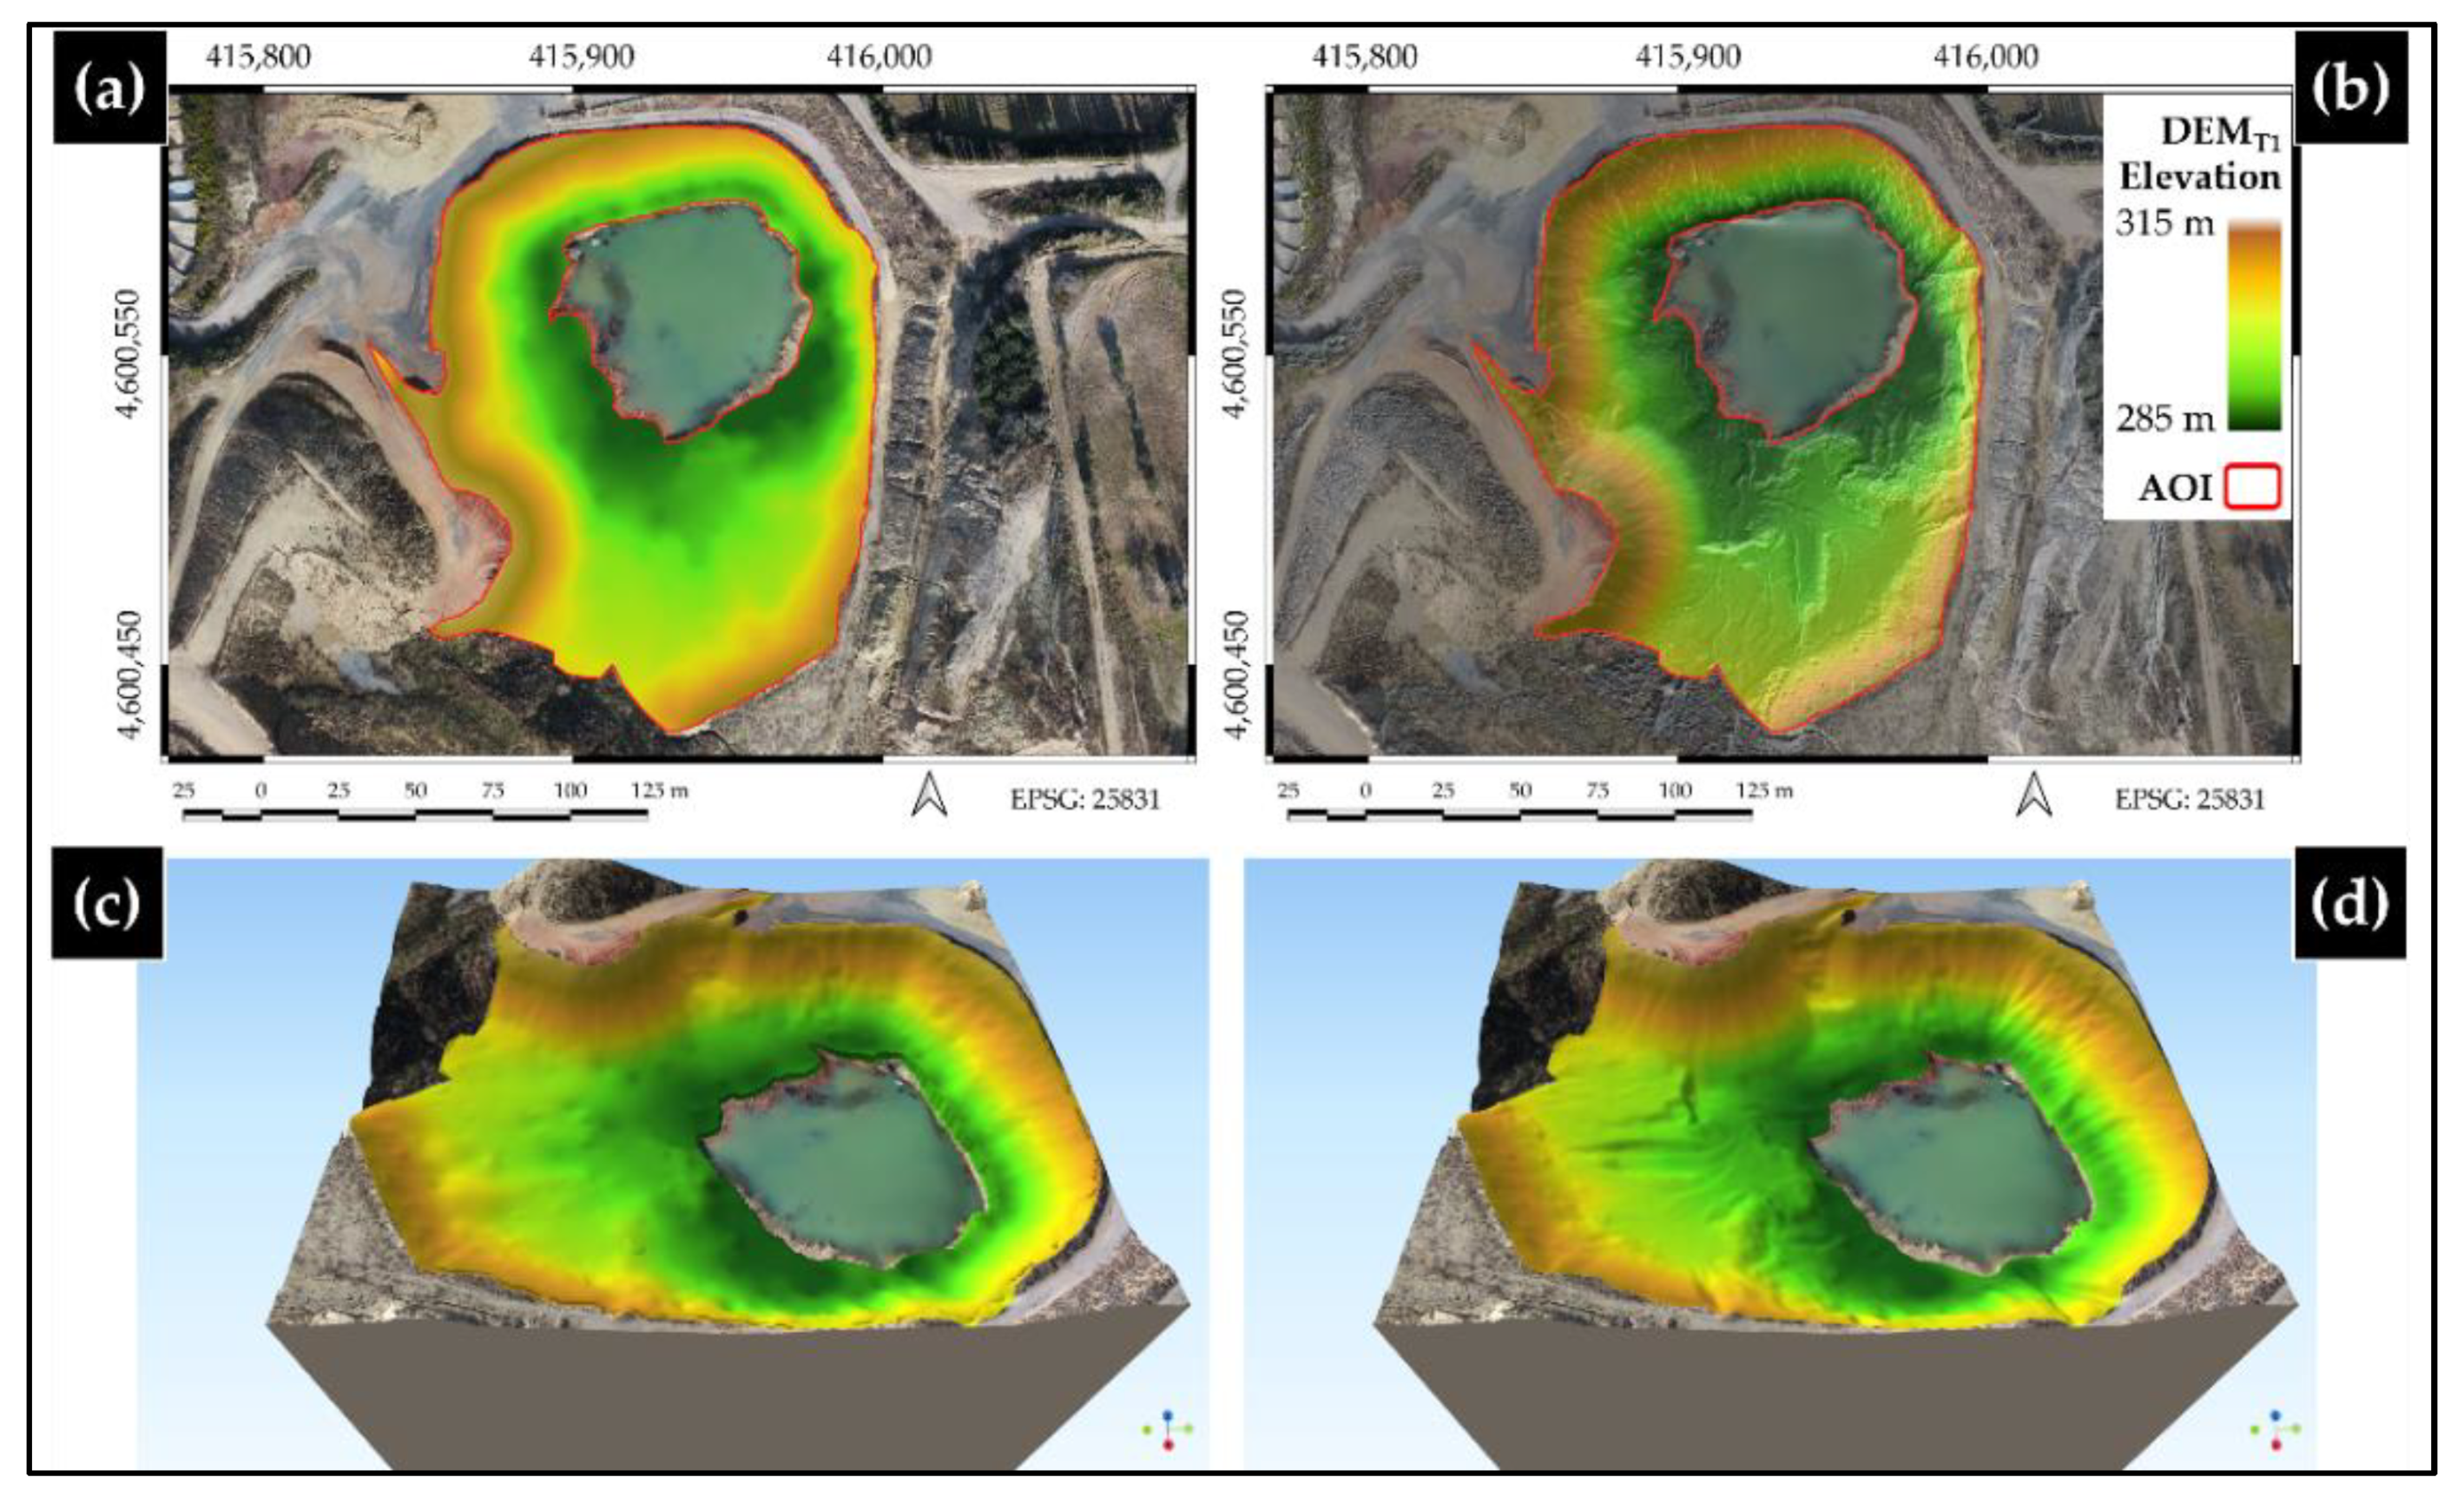
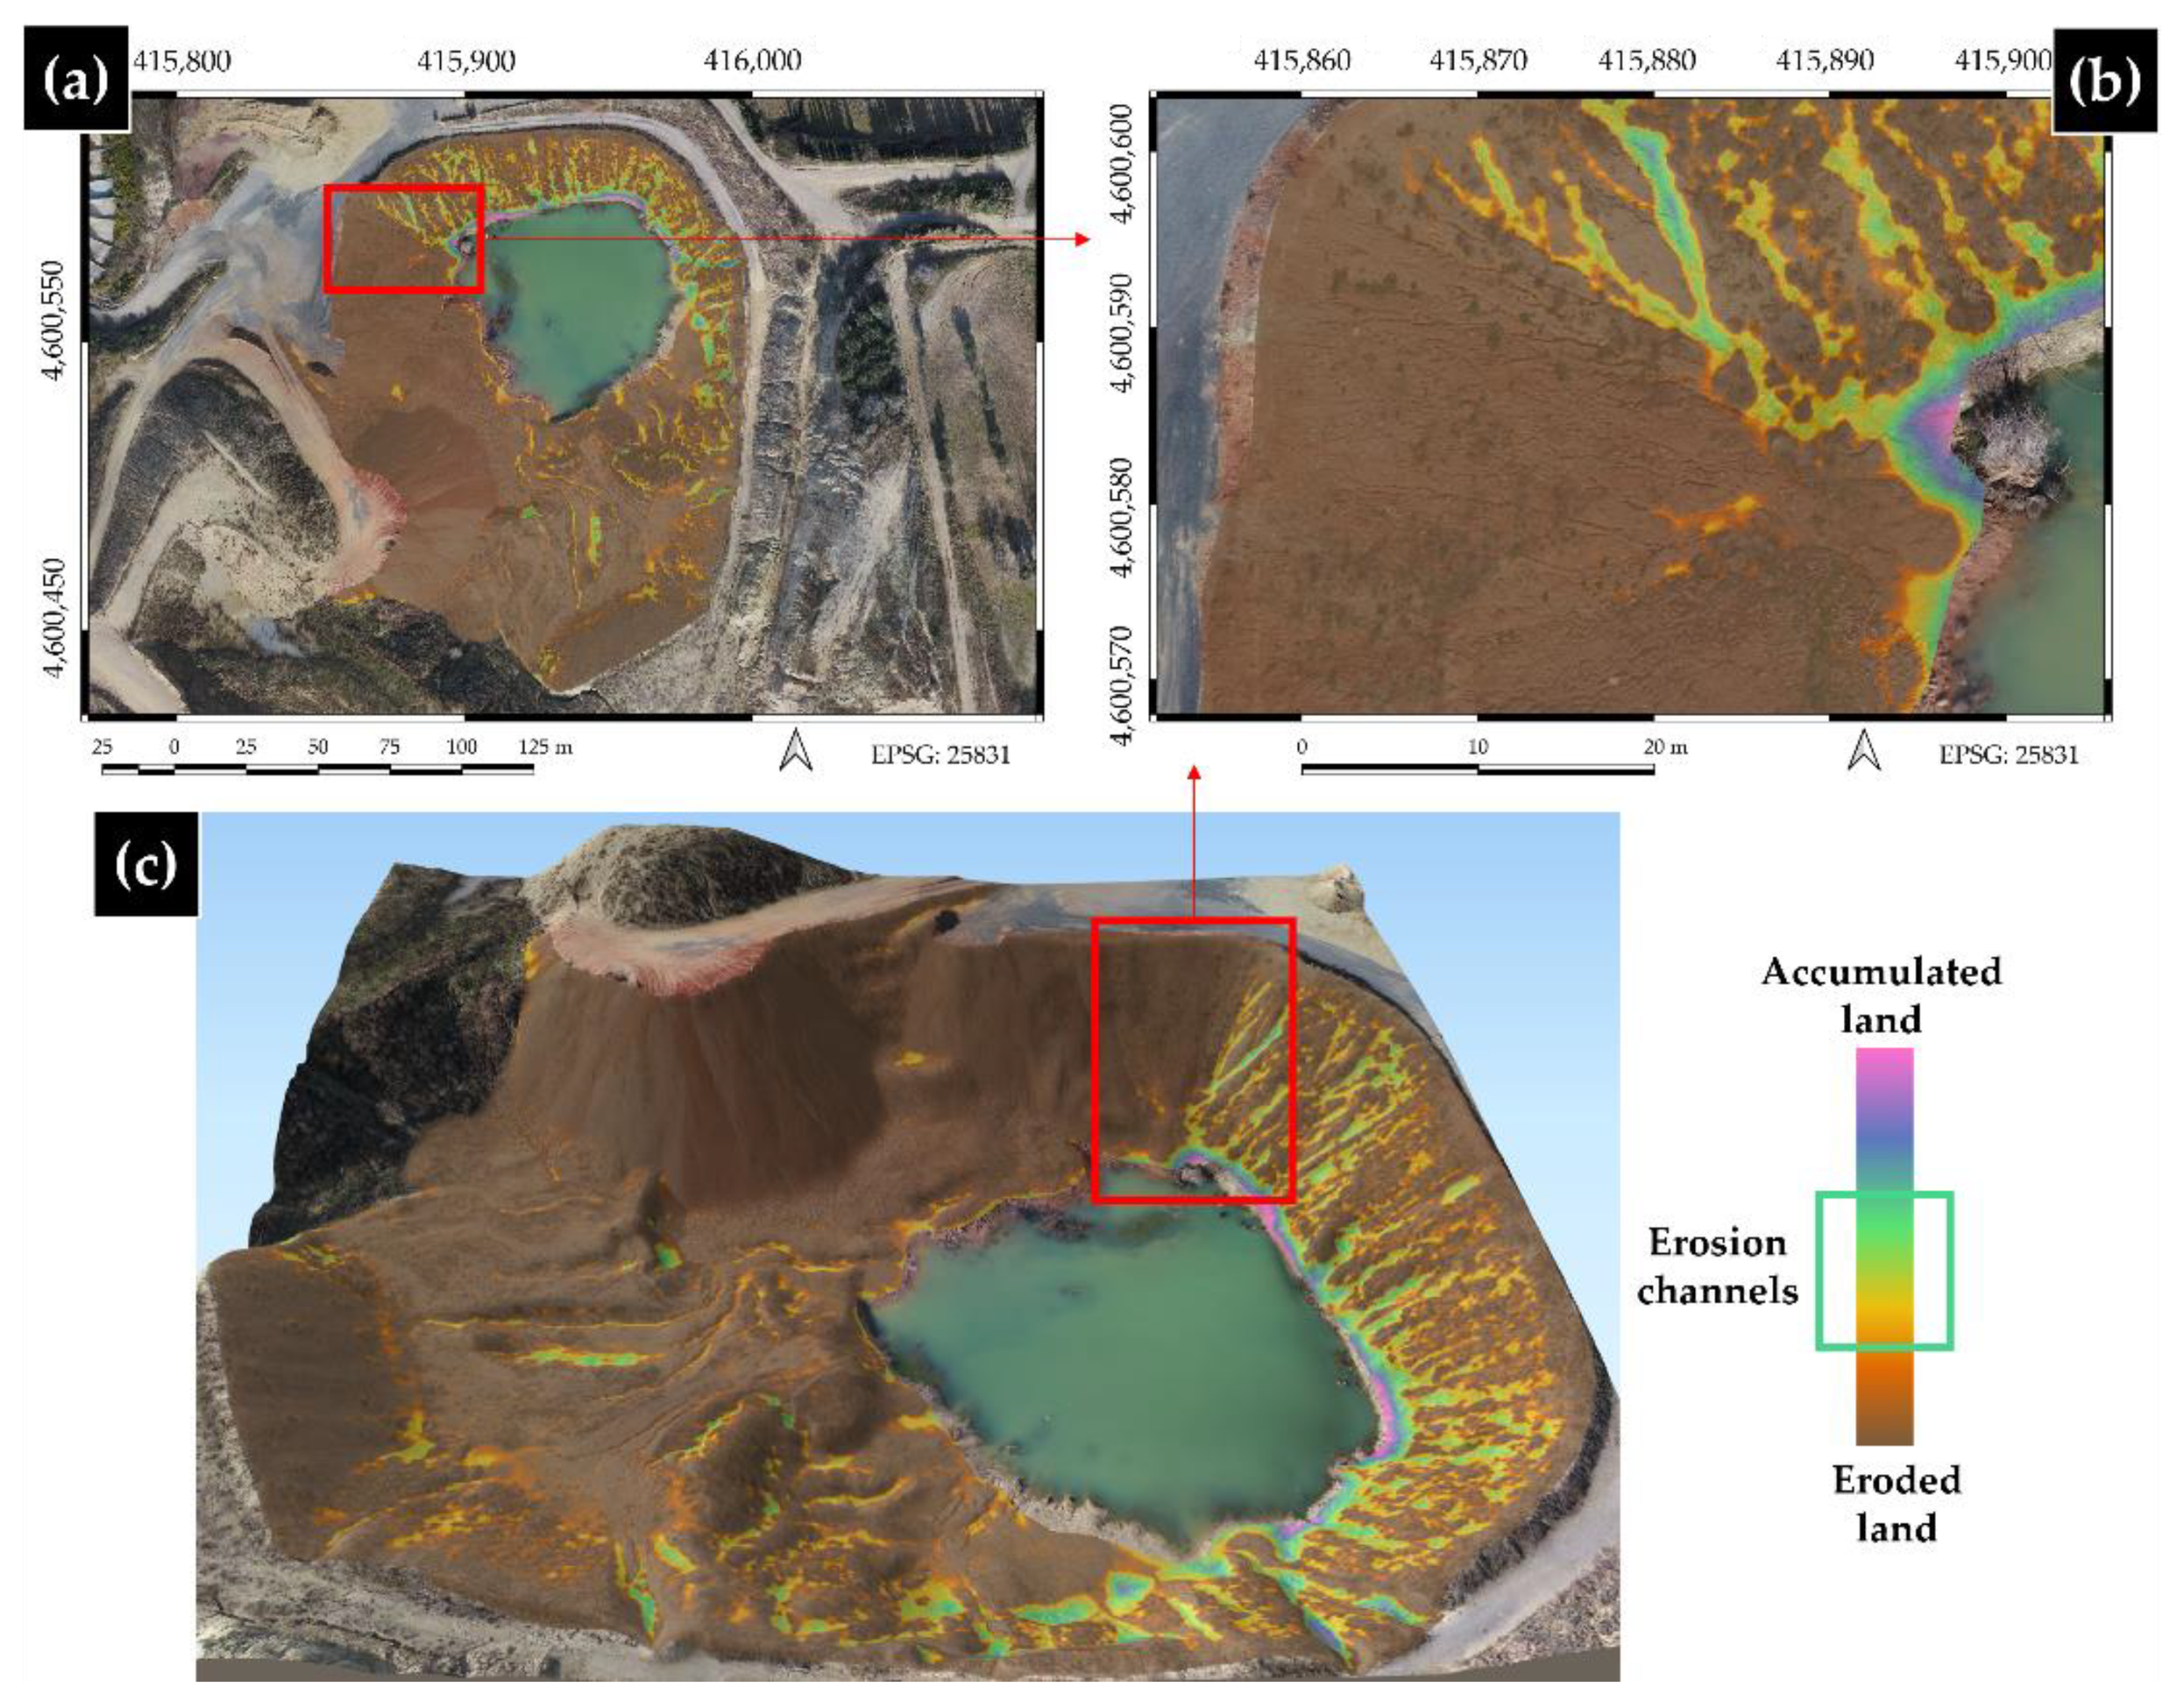
3.2. Erosion Estimation

The DEM of Differences between two DEMs is a technique used to estimate geomorphological changes and quantify volumes of material, mainly in land exposed to water erosion [45]. Erosion in the area occurs mainly in the form of gullies because the material of the slopes is not compacted and the topographic slope in some areas is very steep. The calculation of eroded material was obtained by means of an arithmetic subtraction operation (DEMT0–DEMT1) (Figure 7).
Difference raster values of 0 referred to areas with no change in volume, the positive values corresponded to land-eroded areas, and the negative values corresponded to land accumulation areas. Likewise, the slope raster was reclassified and clipped to the same scope of the difference raster to obtain adequate results by conducting the zonal statistical analysis, which generated tables of slope-category data sets by the area and volume of the eroded material. In Figure 4b, the browned areas are those without evidence of soil loss due to erosion, followed by areas with orange and yellow colors. On the other side, magenta areas are those with greater land accumulation, followed by areas with blue and green colors. As can be seen in the previous image, the effects caused by erosion and the subsequent material accumulation at lower slopes were observed and could be quantified. Laminar erosion processes, mainly the formation of gullies of different depths, are represented as variations in coloration. Through the gullies the material was dragged in granulated form towards the bottom of the quarry. In total, a removal amount of approximately 15,414.9 m3 was estimated, corresponding to an erosion rate of 364 Mg/ha/year, considering a substrate density of 1.7 Mg/m3 [46].

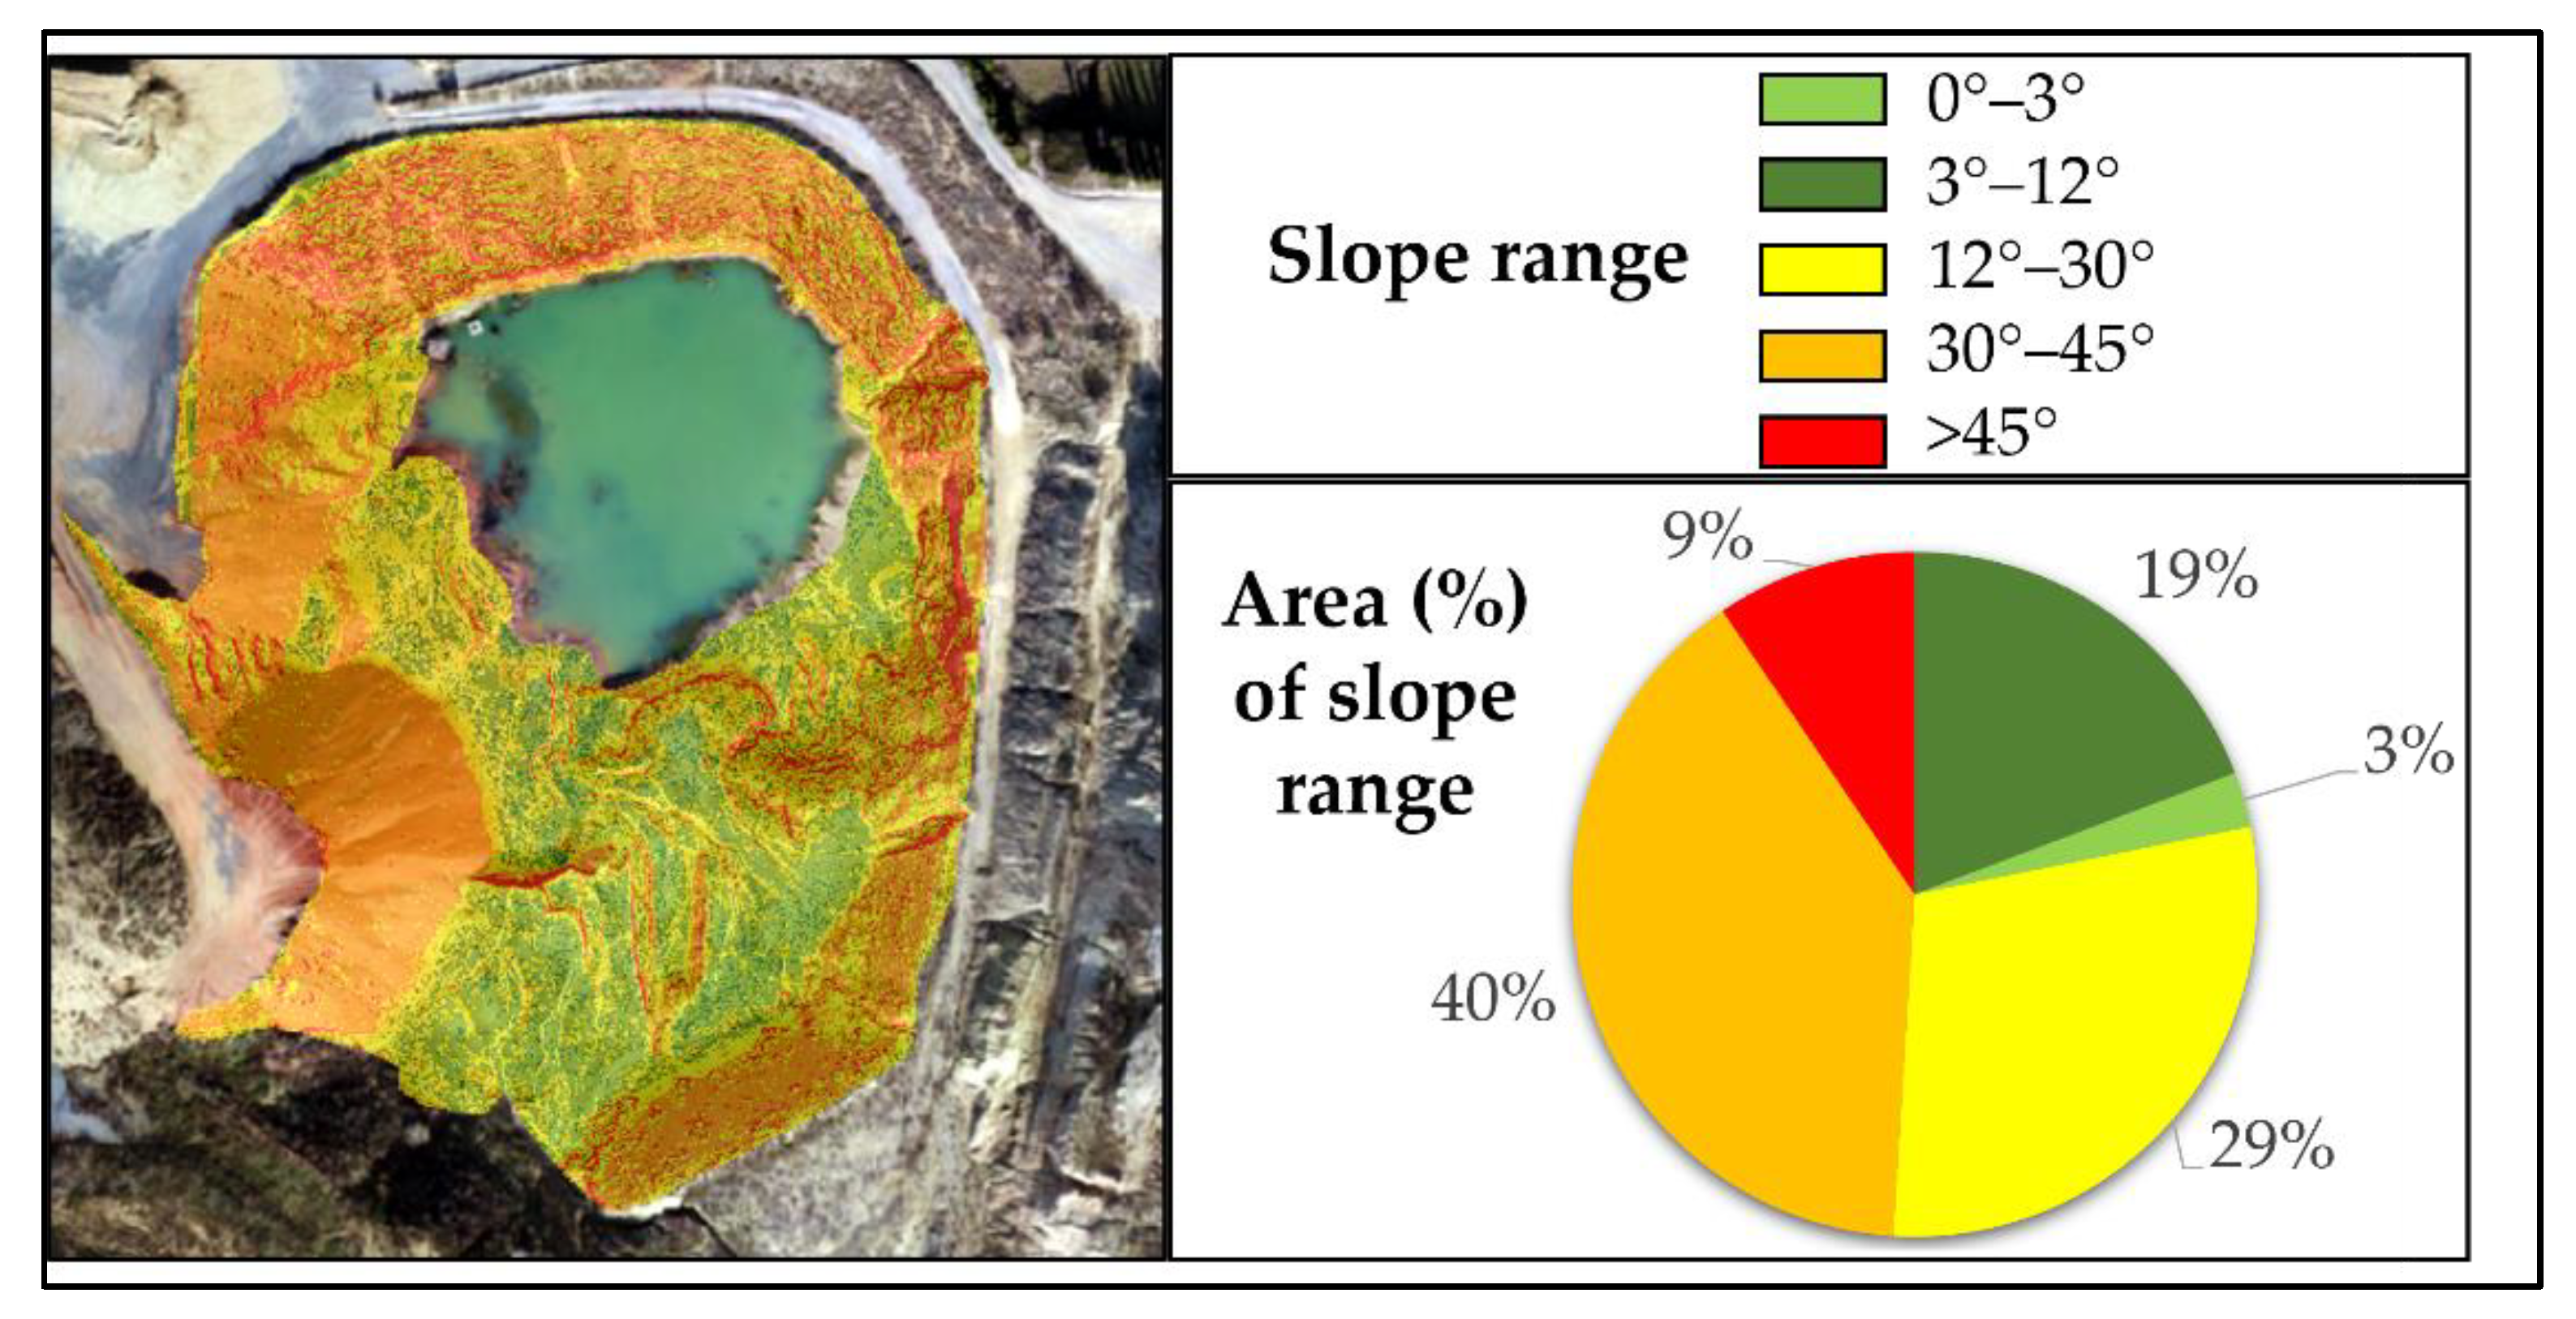
3.3. Slopes and Erosion Identification

Slope maps are useful in hydrological studies and erosion models. To produce slope maps, it is necessary to calculate the slope of the land with respect to a horizontal plane. In this case study, the slope calculation was made based on the following categories [41]: planar (0–3°), slightly inclined (3–12°), inclined (12–30°), sliding (30–45°), and free fall (>45°). In terms of area, half of the land (49%) presents slopes greater than 30°, which in theory would facilitate the drag phenomenon mainly when there is drizzle, while only 3% of the area is part of the land categorized as plain (Figure 8).
To analyze the relationship between the eroded area and the slope of the land, the eroded area calculation was performed for each slope category at pixel scale (Table 1).

4. Discussion

Water erosion occurs when it rains and the infiltration capacity of the land is saturated, or when the intensity of rain exceeds the rate of soil permeability, and subsequently the water runs superficially (runoff) and drags soil particles, which are mostly removed by the direct impact of raindrops [47]. Erosion in mining activities can cause structural risks such as landslides, and therefore it is important to understand erosion behavior. The analysis carried out accurately identifies the erosion of the slopes and calculates the volume of displaced material [48].
The use of UASs for aerial image acquisition represents an affordable and accurate source of data for mining environments, as is well documented in recent research studies [24,25,27]. The photogrammetric and SfM processing allowed the generation of a 3D dense point cloud, orthoimage, and DEMT1 at a very high sampling distance for the entire area of interest, which is consistent with recent studies [22,28]. The methodology used for estimating the pixels corresponding to channels and watersheds, according to a method previously tested and implemented in morphometric [43] and hydrologic [44] analysis, was applied in this research with success in drone imagery, and enabled us to construct an estimated DEM (DEMT0) using the points of the dense point cloud located over the watersheds of DEMT1. The estimated erosion was calculated by applying DoD technique [45]. The raster product of this processing was obtained with GIS software, which is widely used for morphometric and water balance analysis, as the analytical capabilities of the algorithms implemented on Digital Elevation Models and imagery can yield results in very high detail.
To improve the process of detecting the ridges or bottoms of gullies, it was very important to take into account the meteorological conditions when carrying out flights using UASs. It was necessary to pay attention to these factors in order to minimize the presence of shadows that could cause errors; capturing images during cloudy days reduces the shadow presence, when diffuse solar irradiance is dominant over direct sun irradiance [29]. Shadow reduction techniques can also be applied [49]. Additionally, it is important to determine the geomorphology under water bodies to avoid underestimating erosion records because it is the lowest area of the land where the entrained material ends up accumulating.
The method implemented for the quantitative estimation of erosion may vary according to some aspects at the researcher’s discretion, such as the choice of pixels considered to represent different levels of erosion in the gullies or when the type of interpolation is chosen (different methods generate different results). Another aspect to consider would be how to determine the submerged terrain, where the dragged material ends up accumulating. In calculating volumes and areas, results may vary depending on whether only the DEM is used, or if the vector file is included to identify the area volume for each range of slopes. In the latter case, the calculation algorithms are different, since statistical subsets are used and this causes differences in results. It is also important to consider the difference in the geometry of the pixels (square shape), and the polygons of the vector file (mainly triangular irregular shapes). The calculation of the erosion rate was carried out considering events of great activity on bare soil and with little resistance to weathering, which would explain the high values obtained.
In general terms, we consider that the implemented methodology is robust and easily replicable in other scenarios with similar geomorphological conditions, either in natural areas or in the framework of infrastructure works where water erosion can be a factor for evaluation. Additionally, the methodology would facilitate the risk analysis of structural problems caused by erosion.

5. Conclusions

As demonstrated in this study as well as previous literature, remote sensing using drone-acquired imagery is a very useful tool for the morphometric characterization of terrains in open-pit mining activities, especially for erosion processes related to restored areas. However, drone data for the initial moment of the erosion process are not often available, and the DEM before the erosion process (DEMT0) must therefore be estimated from the current DEM (DEMT1). Here we described a new strategy for estimating the DEM before the erosion process by using well-known GIS techniques based on hydrologic analysis (channel network and watershed detection). From the estimated DEMT0, the current DEM T1 was subtracted to obtain a DEM of Differences (DoD) and identify the estimated eroded area and volume of soil between the date 0 (T0) and date 1 (T1). In this case study, an erosion detection and calculation workflow was applied, providing valuable information for quarry restoration management, particularly regarding those areas with higher erosion rates and subsequent land accumulations. Controlling the slope and calculating erosion rates enable the monitoring of areas with active erosion processes and facilitate decisionmaking that is crucial for implementing stabilization measures in areas of high landslide susceptibility. Therefore, the presented method is proven to be valid and highly suitable for mining operations and applicable to other geomorphologically similar scenarios.

Author Contributions

Conceptualization, V.C., P.M. and J.-C.P.; data acquisition, R.R.-C. and D.S.; methodology, P.M. and J.-C.P.; software, J.C., P.M. and J.-C.P.; validation, V.C. and J.C.; formal analysis, J.C.; investigation, V.C.; resources, V.C. and J.M.A.; data curation, V.C., P.M., R.R.-C. and J.M.A.; writing—original draft preparation, J.C. and J.-C.P.; writing—review and editing, R.R.-C., J.C., J.-C.P., V.C. and J.M.A.; visualization, P.M., J.C. and J.-C.P.; supervision, V.C.; project administration, V.C.; funding acquisition, V.C. All authors have read and agreed to the published version of the manuscript.

Funding

This research was funded by the Government of Catalonia through the project “Research and Innovation in the process and restoration of extractive activities” and by the European Union through the LIFE project “New Life for Drylands” (LIFE20 PRE/IT/000007).

Institutional Review Board Statement

Not applicable.

Informed Consent Statement

Not applicable.

Data Availability Statement

The data that support the findings of this study are available from the corresponding author upon reasonable request.

Conflicts of Interest

The authors declare no conflict of interest.

References

  1. European Commission. Internal Market, Industry, Entrepreneurship and SMEs. Available online: https://ec.europa.eu/growth/sectors/raw-materials/eip/strategic-implementation-plan_en (accessed on 19 January 2022).
  2. Altiti, A.H.; Alrawashdeh, R.O.; Alnawafleh, H.M. Open Pit Mining, Mining Techniques—Past, Present and Future, 1st ed.; Abhay, S., Ed.; IntechOpen: London, UK, 2021; Available online: https://www.intechopen.com/chapters/71931 (accessed on 19 January 2022).
  3. United Nations, and Deutsche Stiftung für Internationale Entwicklung. Mining and the Environment: The Berlin Guidelines: A Study Based on an International Round Table in June 1991, Organized by the Department of Technical Co-Operation for Development, United Nations, and the Development Policy Forum of the German Foundation for International Development; Mining Journal Books: London, UK, 1992. [Google Scholar]
  4. Narendra, B.H.; Siregar, C.A.; Turjaman, M.; Hidayat, A.; Rachmat, H.H.; Mulyanto, B.; Maharani, R. Managing and Reforesting Degraded Post-Mining Landscape in Indonesia: A Review. Land 2021, 10, 658. [Google Scholar] [CrossRef]
  5. Segura-Salazar, J.; Tavares, L.M. Sustainability in the Minerals Industry: Seeking a Consensus on Its Meaning. Sustainability 2018, 10, 1429. [Google Scholar] [CrossRef] [Green Version]
  6. United Nations Environment Programme. Sustainability Reporting in the Mining Sector. Current Status and Future Trends. 2020. Available online: https://www.unep.org/resources/report/sustainability-reporting-mining-sector (accessed on 19 January 2022).
  7. Organization for Economic Co-operation and Development. OECD Brochure: A Global Standard: Towards Responsible Mineral Supply Chains. 2020. Available online: https://mneguidelines.oecd.org/Brochure_OECD-Responsible-Mineral-Supply-Chains.pdf (accessed on 19 January 2022).
  8. Government of China. The 13th Five Year Plan for Economic and Social Development of the People’s Republic of China (2016–2020). 2016. Available online: https://en.ndrc.gov.cn/policies/202105/P020210527785800103339.pdf (accessed on 19 January 2022).
  9. Canadian Government. The Canadian Minerals and Metals Plan. 2020. Available online: https://www.minescanada.ca/sites/default/files/cmmp-actionplan2020_rev52_feb_29_2020-a_en.pdf (accessed on 19 January 2022).
  10. Minerals Council South Africa. Modernization: Towards the Mine of Tomorrow. 2020. Available online: https://www.mine2030.co.za/ (accessed on 19 January 2022).
  11. Government of Colombia. Decreto 1076 de 2015 Sector Ambiente y Desarrollo Sostenible. 2015. Available online: https://www.funcionpublica.gov.co/eva/gestornormativo/norma.php?i=78153 (accessed on 19 January 2022).
  12. Australian Government. Mine Rehabilitation. Leading Practice Sustainable Development Program for the Mining Industry. 2016. Available online: https://www.industry.gov.au/sites/default/files/2019-04/lpsdp-mine-rehabilitation-handbook-english.pdf (accessed on 19 January 2022).
  13. Government of Spain. Real Decreto-ley 975/2009, del 12 de Junio, Sobre Gestión de los Residuos de las Industrias Extractivas y de Protección y Rehabilitación del Espacio Afectado por Actividades Mineras. 2009. Available online: https://www.boe.es/buscar/act.php?id=BOE-A-2009-9841 (accessed on 19 January 2022).
  14. Huang, Y.; Espley, S. A 3D mine simulation model for decision-making in mine design and production. International Journal of Surface Mining. Reclam. Environ. 2005, 19, 251–259. [Google Scholar] [CrossRef]
  15. Ramli, M.; Thamrin, M.; Asrafil, M. Analysis of Soil Erosion on Mine Area. IOP Conf. Ser. Mater. Sci. Eng. 2020, 875, 012052. [Google Scholar] [CrossRef]
  16. Wischmeier, W.H.; Smith, D.D. Predicting Rainfall Erosion Losses: A Guide to Conservation Planning with Universal Soil Loss Equation (USLE); Agriculture Handbook; Department of Agriculture: Washington, DC, USA, 1978.
  17. Renard, K.G.; Foster, G.R.; Weesies, G.A.; Porter, J.P. RUSLE: Revised universal soil loss equation. J. Soil Water Conserv. 1991, 46, 30–33. [Google Scholar]
  18. Duarte, L.; Cunha, M.; Teodoro, A.C. Comparing Hydric Erosion Soil Loss Models in Rainy Mountainous and Dry Flat Regions in Portugal. Land 2021, 10, 554. [Google Scholar] [CrossRef]
  19. Barrena-González, J.; Rodrigo-Comino, J.; Gyasi-Agyei, Y.; Pulido Fernández, M.; Cerdà, A. Applying the RUSLE and ISUM in the Tierra de Barros Vineyards (Extremadura, Spain) to Estimate Soil Mobilisation Rates. Land 2020, 9, 93. [Google Scholar] [CrossRef] [Green Version]
  20. Jaramillo, R.; Padró, J.-C. Generación de cartografía a partir de imágenes captadas con dron de ala fija, asociada a proyectos hidráulicos fluviales. GeoFocus 2020, 26, 93–117. [Google Scholar] [CrossRef]
  21. Guirado, R.; Padró, J.-C.; Zoroa, A.; Olivert, J.; Bukva, A.; Cavestany, P. StratoTrans: Unmanned Aerial System (UAS) 4G Communication Framework Applied on the Monitoring of Road Traffic and Linear Infrastructure. Drones 2021, 5, 10. [Google Scholar] [CrossRef]
  22. Yaqiu, Y.; Cunhao, J.; Jing, L.; Jie, W.; Xing, J.; Hao, W.; Yu, X.; Lushou, Z. Mining Ground Surface Information Extraction and Topographic Analysis Using UAV Video Data. In Proceedings of the E3S Web of Conferences, Shanghai, China, 18–20 September 2020; Volume 194, p. 05030. [Google Scholar] [CrossRef]
  23. Andras, M.; Domozi, Z. Tracking Production Volumes of Open-Pit Mines with Photogrammetry. In Proceedings of the 2017 European Modelling Symposium (EMS), Manchester, UK, 20–21 November 2017; pp. 100–106. [Google Scholar] [CrossRef]
  24. Honarmand, M.; Shahriari, H. Geological Mapping Using Drone-Based Photogrammetry: An Application for Exploration of Vein-Type Cu Mineralization. Minerals 2021, 11, 585. [Google Scholar] [CrossRef]
  25. Carabassa, V.; Montero, P.; Alcañiz, J.M.; Padró, J.-C. Soil Erosion Monitoring in Quarry Restoration Using Drones. Minerals 2021, 11, 949. [Google Scholar] [CrossRef]
  26. Manfreda, S.; McCabe, M.; Miller, P.; Lucas, R.; Pajuelo Madrigal, V.; Mallinis, G.; Ben-Dor, E.; Helman, D.; Estes, L.; Ciraolo, G.; et al. On the Use of Unmanned Aerial Systems for Environmental Monitoring. Remote Sens. 2018, 10, 641. [Google Scholar] [CrossRef] [Green Version]
  27. Shahmoradi, J.; Talebi, E.; Roghanchi, P.; Hassanalian, M. A Comprehensive Review of Applications of Drone Technology in the Mining Industry. Drones 2020, 4, 34. [Google Scholar] [CrossRef]
  28. Ren, H.; Zhao, Y.; Xiao, W.; Hu, Z. A review of UAV monitoring in mining areas: Current status and future perspectives. Int. J. Coal Sci. Technol. 2019, 6, 320–333. [Google Scholar] [CrossRef] [Green Version]
  29. Padró, J.C.; Carabassa, V.; Balagué, J.; Brotons, L.; Alcañiz, J.; Pons, X. Monitoring opencast mine restorations using Unmanned Aerial System (UAS) imagery. Sci. Total Environ. 2018, 657, 1602–1614. [Google Scholar] [CrossRef]
  30. Carabassa, V.; Montero, P.; Crespo, M.; Padró, J.C.; Balagué, J.; Alcañiz, J.M.; Brotons, L.; Pons, X. UAS Remote Sensing Products for Supporting Extraction Management and Restoration Monitoring in Open-Pit Mines. Proceedings 2019, 30, 4. [Google Scholar] [CrossRef] [Green Version]
  31. Carabassa, V.; Montero, P.; Crespo, M.; Padró, J.C.; Pons, X.; Balagué, J.; Brotons, L.; Alcañiz, J. Unmanned aerial system protocol for quarry restoration and mineral extraction monitoring. J. Environ. Manag. 2020, 270, 110717. [Google Scholar] [CrossRef]
  32. ICGC. Mapa Geològic de Catalunya. Institut Cartogràfic i Geològic de Catalunya. 2021. Available online: http://betaportal.icgc.cat/visor/client_utfgrid_geo.html (accessed on 19 January 2022).
  33. SMC. Xarxa Agrometeorològica de Catalunya (Estació Sabadell-Parc Agrari). Servei Meteorològic de Catalunya. 2022. Available online: https://ruralcat.gencat.cat/agrometeo.estacions (accessed on 19 January 2022).
  34. Padró, J.-C.; Muñoz, F.J.; Planas, J.; Pons, X. Comparison of four UAV georeferencing methods for environmental monitoring purposes focusing on the combined use with airborne and satellite remote sensing platforms. Int. J. Appl. Earth Obs. Geoinf. 2019, 79, 130–140. [Google Scholar] [CrossRef]
  35. DJI. Inspire 2 User Manual v1.0 2016.12. 2016. Available online: https://dl.djicdn.com/downloads/inspire_2/INSPIRE+2+User+Manual+.pdf (accessed on 19 January 2022).
  36. Agisoft LLC. Agisoft Metashape User Manual: Professional Edition, Version 1.5. 2019. Available online: https://www.agisoft.com/pdf/metashape-pro_1_5_en.pdf (accessed on 19 January 2022).
  37. ESRI. ArcGIS Desktop: Release 10.8; Environmental Systems Research Institute: Redlands, CA, USA, 2016. [Google Scholar]
  38. Pons, X. MiraMon. Sistema d’Informació Geogràfica i Software de Teledetecció. Versió 8.1f [MiraMon. Geographical Information System and Remote Sensing Software. Version 8.2e]. Centre de Recerca Ecològica i Aplicacions Forestals, CREAF. Bellaterra. 2021. Available online: http://www.creaf.uab.cat/miramon/Index_usa.htm (accessed on 19 January 2022).
  39. QGIS.org. QGIS Geographic Information System. QGIS Association. 2021. Available online: http://www.qgis.org (accessed on 19 January 2022).
  40. Conrad, O.; Bechtel, B.; Bock, M.; Dietrich, H.; Fischer, E.; Gerlitz, L.; Wehberg, J.; Wichmann, V.; Böhner, J. System for Automated Geoscientific Analyses (SAGA) v. 2.1.4. Geosci. Model Dev. 2015, 8, 1991–2007. [Google Scholar] [CrossRef] [Green Version]
  41. Lugo-Hubp, J.I. Elementos de Geomorfología Aplicada (Métodos Cartográficos): Universidad Nacional Autónoma de México; Instituto de Geografía: México City, Mexico, 1988; 128p. [Google Scholar]
  42. Wang, L.; Liu, H. An efficient method for identifying and filling surface depressions in digital elevation models for hydrologic analysis and modelling. Int. J. Geogr. Inf. Sci. 2006, 20, 193–213. [Google Scholar] [CrossRef]
  43. Wood, J. Geomorphometry in LandSerf. In Geomorphometry: Concepts, Software, Applications. Developments in Soil Science; Hengl, T., Reuter, H.I., Eds.; Elsevier: Amsterdam, The Netherlands, 2009; Volume 33, pp. 333–349. [Google Scholar]
  44. Fairfield, J.; Leymarie, P. Drainage Networks from Grid Digital Elevation Models. Water Resour. Res. 1991, 27, 709–717. [Google Scholar] [CrossRef]
  45. Williams, R.D. DEMs of Difference. In Geomorphological Techniques (Online Edition); Cook, S.J., Clarke, L.E., Nield, J.M., Eds.; British Society for Geomorphology: London, UK, 2012; pp. 1–17. [Google Scholar]
  46. Chesworth, W. (Ed.) Encyclopedia of Soil Science; Springer: Berlin/Heidelberg, Germany, 2008; ISBN 978-1-4020-3994-2. [Google Scholar]
  47. Farek, V.; Unucka, J.; Ponfzilova, I.; Gergerova, M.; Židek, D.; Pallos, R. Assessment of the runoff conditions of small ungauged catchments using GIS and fully distributed hydrologic models. Acta Montan. Slovaca 2014, 19, 22–30. [Google Scholar]
  48. Krusekopf, H.H. The effect of slope on soil erosion. In University of Missouri Agricultural Experimental Station Research Bulletin; University Archives of the University of Missouri-Columbia: Columbia, MI, USA, 1943; p. 363. [Google Scholar]
  49. Pons, X.; Padró, J.-C. An Operational Radiometric Correction Technique for Shadow Reduction in Multispectral UAV Imagery. Remote Sens. 2021, 13, 3808. [Google Scholar] [CrossRef]
Figure 1. (a) Location of the study area. Source: Modified from Google Earth. (b) Regional location of “La Constancia” quarry near Barcelona, Spain, Europe. Source: Modified from Google Earth. (c) Local location of “La Constancia” quarry in Terrassa, Catalonia. Source: Modified from Google Earth. (d) Orthoimagery of the “La Constancia” quarry. Source: Drone imagery acquired during this study processed by the authors. (e) Digital Elevation Model of the “La Constancia” quarry. Source: Drone imagery acquired during this study was processed by the authors.
Land 11 00212 g001
Figure 2. (a) Camera coverage and Ground Control Point (GCP) locations. (b) 2D nadiral perspective of RGB colored point cloud. (c) 2D nadiral perspective of point cloud classification (ground points were used for the DEM construction). (d) 3D perspective of RGB colored point cloud. (e) 3D perspective of point cloud classification. Source: Drone imagery acquired during this study processed with Metashape Photoscan by the authors.
Land 11 00212 g002
Figure 3. Complete workflow from the data caption to the eroded volume estimation.
Land 11 00212 g003
Figure 4. (a) Orthoimage resulting from the UAS flight and delimitation of the Area of Interest (AOI). (b) Digital Elevation Model (DEM) resulting from the UAS flight. (c) Detail of the 3D representation of the orthoimage in the AOI. (d) 3D representation of the DEM and the orthoimage in the AOI, where the eroded terrain can be clearly seen. Source: Drone imagery acquired during this study processed with QGIS by the authors.
Land 11 00212 g004
Figure 5. (a) Flow water catchment (Log10 for better visualization) of the Area of Interest (AOI) based on DEMT1. (b) Zoom of (a), with the channels and the XYZ points located over the watershed, which were used to build DEMT0. (c) 3D representation of DEMT1 with the channel network.
Land 11 00212 g005
Figure 6. (a) DEMT0 of the Area of Interest (AOI), estimating the terrain morphology before the erosion process. (b) DEMT1 of the AOI based on drone-acquired imagery. (c) 3D representation of DEMT0. (d) 3D representation of DEMT1.
Land 11 00212 g006
Figure 7. (a) Erosion map resulting from the difference between DEMT0 and DEMT1 (DoD) at the Area of Interest (AOI). (b) Detail of (a). (c) 3D representation of the erosion map at the AOI.
Land 11 00212 g007
Figure 8. DEMT1 slopes analysis at the Area of Interest (AOI) (water is not computed).
Land 11 00212 g008
Table 1. Area eroded by range of slopes.
Range (Degrees)Area (m2)Volume (m3)Area of Slope Range (%)
0–3191.1357.73
3–121117.62462.319
12–301569.13923.029
30–451903.16495.540
>45640.62176.29
Total18,22415,414.7100
Publisher’s Note: MDPI stays neutral with regard to jurisdictional claims in published maps and institutional affiliations.

