Article

Detailed Soil Survey Field and Laboratory Data as a Critical Tool for Optimizing the Arable Cropping Capability Evaluation of a Representative Episaturated Soil Pedon in Greece

by
Dionisios Gasparatos
* and
Orestis Kairis
Laboratory of Soil Science and Agricultural Chemistry, Agricultural University of Athens, 75 Iera Odos Street, 118 55 Athens, Greece
*
Author to whom correspondence should be addressed.
Land 2022, 11(2), 182; https://doi.org/10.3390/land11020182
Submission received: 13 December 2021 / Revised: 17 January 2022 / Accepted: 20 January 2022 / Published: 24 January 2022
(This article belongs to the Special Issue Land: 10th Anniversary)

Abstract

:
The objective of the present work is to contribute to the examination of the interconnections between soil classification/soil mapping and soil capability for agricultural use. A pedon scale analytical field along with laboratory data of an episaturated agricultural soil of Thessaly (Greece), allowed for the optimization of soil fertility class evaluation and its corresponding agricultural value. Specific soil properties, low chroma colors and the distribution of redoximorphic features within the soil profile (Fe-Mn concretions) revealed the presence of impermeable argillic horizons, resulting in a perched water table in late winter and spring. The evaluation of the soil pedon was carried out through the accurate parameterization and implementation of a technical soil classification system and a soil rating method, both of which are well known worldwide, and which use detailed soil survey data. The results confirmed the general principle that only by using detailed soil survey field and laboratory data can any technical soil classification system or soil rating method be adapted and properly applied. Both the classification system and the scoring methodology of the soil profile reached the same conclusion: characterizing the studied soil as of good potential for general arable cropping or as of fair agricultural value. This was achieved only by considering the phenomenon of episaturation, which emerged from the plethora of detailed soil survey data, guiding the classification system and the scoring methodology to produce reliability and represent real situation results.

1. Introduction

A basic principle that applies to soil classification systems is that the most detailed (lowest) taxonomic category of a natural system is a prerequisite for the documentation and synthesis of any other technical classification system, which is created for a special purpose [1]. This is because, unlike technical classification systems, a natural system such as the United States Department of Agriculture (USDA) Keys to Soil Taxonomy [2] or the World Reference Base for Soil Resources (WRB) Taxonomy System [3] attempts to present the relationships among as many important soil properties as possible. It is easily understood that the lower the level of the natural classification system used in a soil survey, the more and of greater detail the required data must be. Nevertheless, much of the generic information recorded on soil maps is of no agronomic interest in terms of serving the establishment and growth of agricultural crops, and it does not represent properties related to soil fertility [4]. Only in cases of semi-detailed and detailed maps, combined with their respective soil surveys data, it is possible to meet several of the agronomic requirements concerning soil productivity and agricultural management [5]. The Soil Fertility Capability Classification (SFCC) system [6,7], as a technical soil classification system, was created to assist the development of interconnections between soil classification/soil mapping and soil fertility/plant growth [8]. The SFCC system quantitatively describes the soil profile (soil pedon) [5] by using dynamic as well as inherent soil attributes [9], composing a soil identity (SFCC class) that can then be interpreted in fertility assessment and management [9,10], thus satisfying both pedologists and agronomists [8]. Fundamentally, the SFCC system evaluates soil potential for cropping while considering physical and chemical fertility constraints [8,11]. A methodology of similar scope involves the procedure for rating the agricultural value of soil according to the original Storie index (SI) or its modifications (MSI) [12,13,14,15,16,17]. Unlike the SFCC system, MSI methodology determines a score that classifies the soil from excellent, for agricultural production, to nonagricultural usage [13]. The Storie soil scoring scale was derived from a systematic study of the widely variated California soils in the United States of America [18].
Aquic conditions are characterized by continuous or temporary saturation of soil with water that remains long enough to result in redoximorphosis and redistribution within the soil profile of the two redox sensitive elements, Fe and Mn, which are affected greatly by alternating periods of reduction and oxidation. In soil maps, especially at a small scale (1:1 million or coarser), no distinction is made between soils that are affected by ascending groundwater (groundwater gley soils) and soils in which only the upper horizons are temporarily water saturated (surface water gley soils). Surface water gley or episaturated soils exhibit a relatively impermeable layer between 30 and 100 cm, causing waterlogging within the upper solum after persistent rainfall, without signs of wetness in the deeper horizons [19]. The layers that create perched water tables may have pedogenic (e.g., fine-textured argillic, natric, fragipan, plinthic horizons) or lithogenic (e.g., hard bedrock, cemented sedimentary rocks) origin, while cultivation practices such as tillage with powerful farm tractors artificially induce restrictive layers. Several studies have pointed out that there is a complex interaction between the type of water table, the redox processes, the formation of redoximorphic features, and the redistribution of nutrients that, in the case of episaturated soils, accumulates in the peds interior and thus far away from roots [20,21,22]. Nevertheless, aquic conditions and hydromorphological patterns in terms of land use and management are key factors in evaluating soil suitability and limitations.
The demand for soil resource information that is more specific to the local/field level by the public and private sectors and policy makers has recently increased. In this context, the SFCC and MSI methodologies for estimating the agricultural value of soil were parameterized and applied, based on the analytical laboratory and field data, to evaluate a representative episaturated soil pedon of Thessaly (Greece). As successful soil management requires the knowledge of local/field level soil resources, the novelty of this work lies in the fact that it highlights the importance of a soil survey with detailed laboratory and field data in revealing the effect of soil hydromorphology on soil suitability and in optimizing the evaluative power of the original SFCC classification system and MSI methodology.

2. Materials and Methods
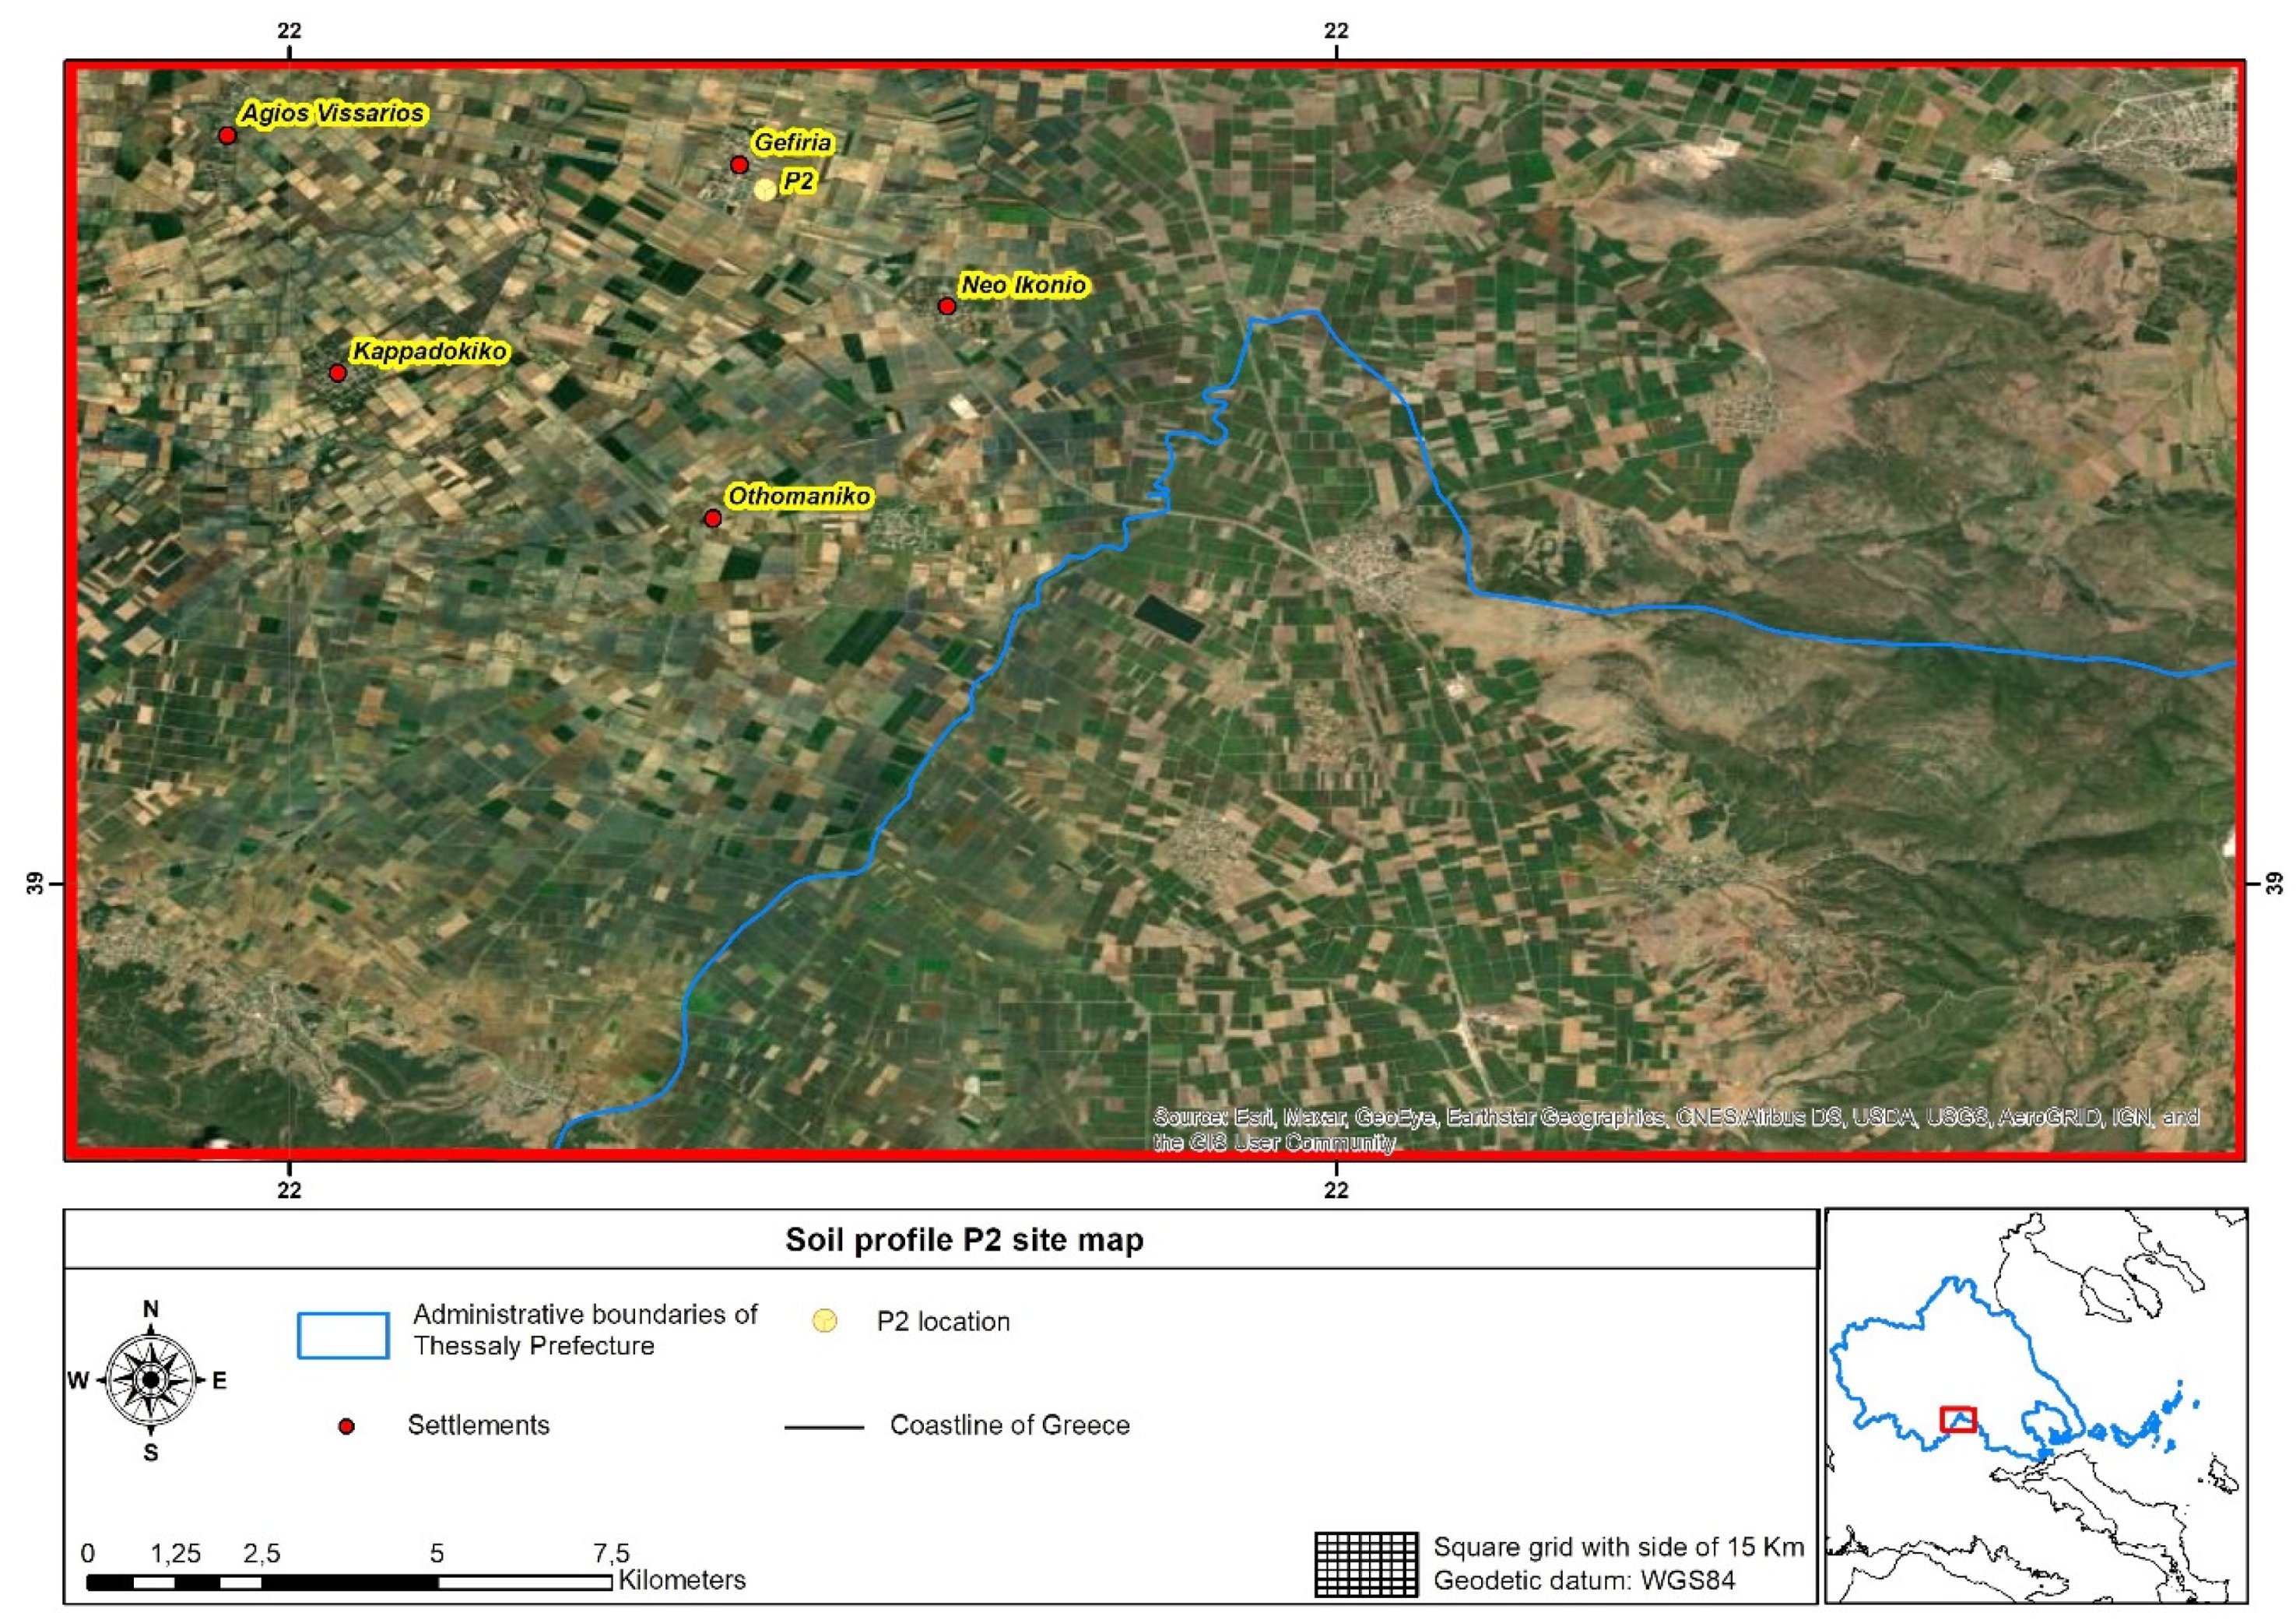
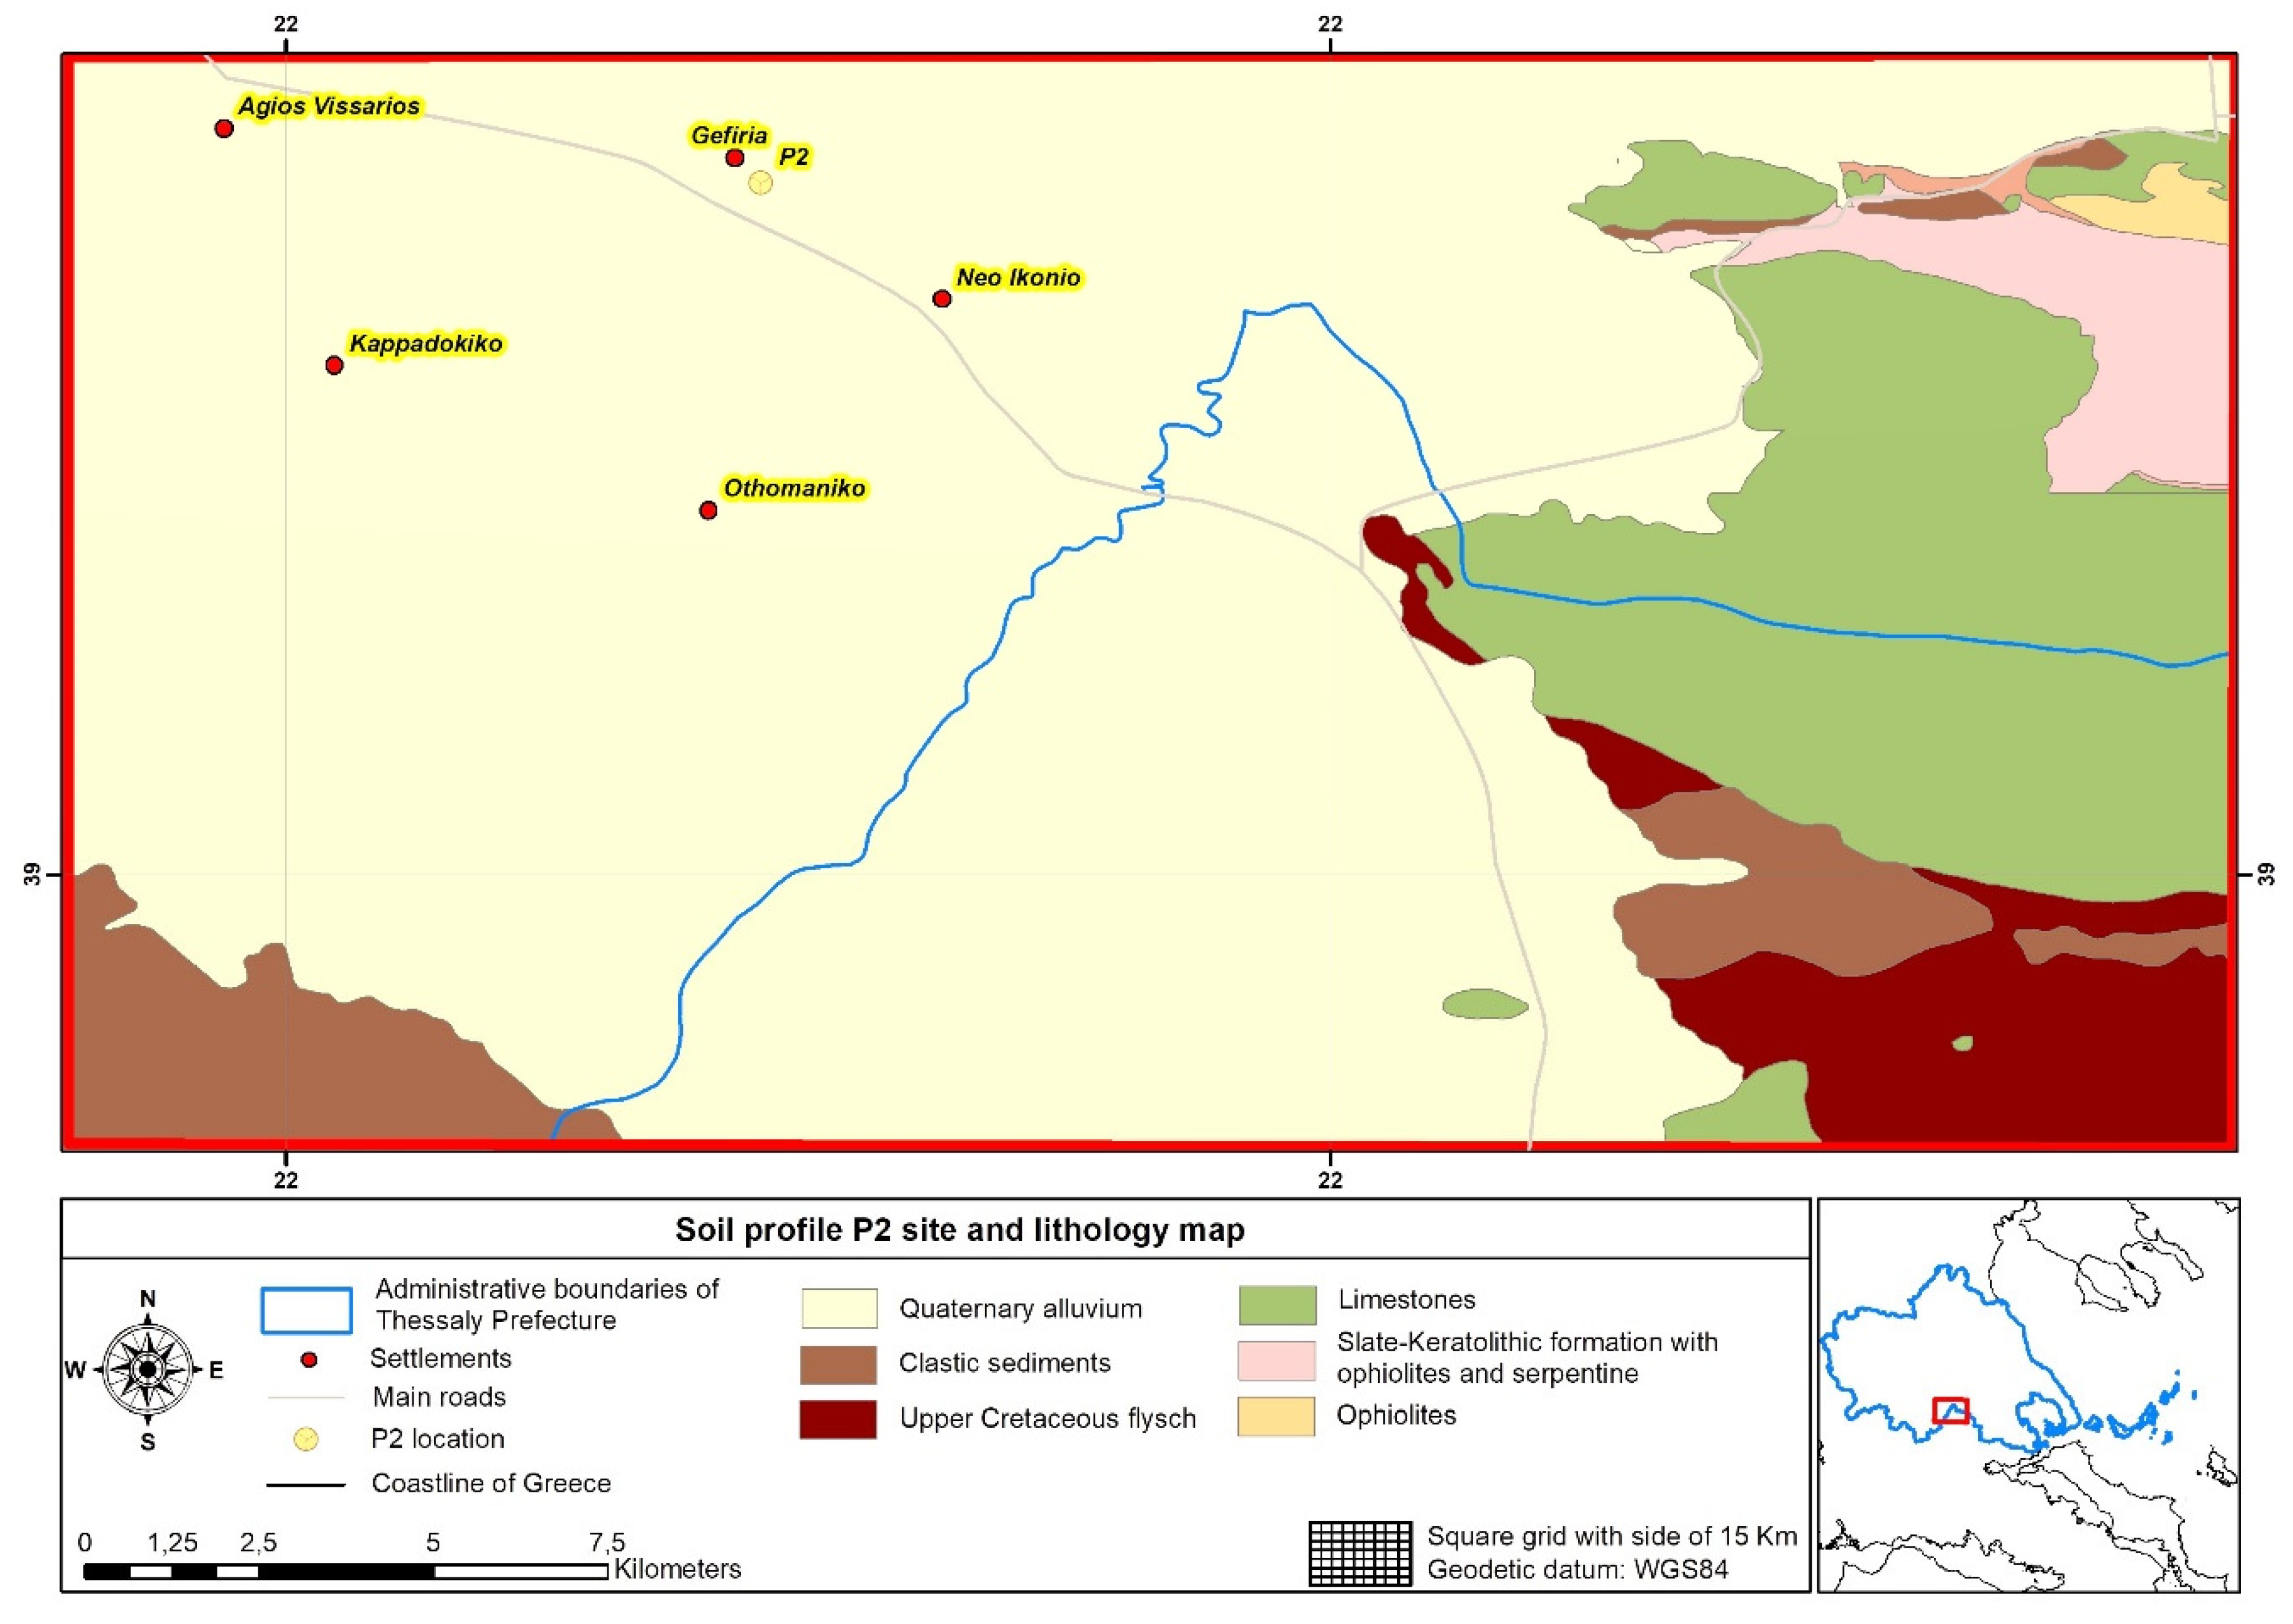
2.1. Study Area

The study area was located in the Gefiria region (coordinates: x: 22°11′26.26″ E, y: 39°17′22.61″ N) in the province of Karditsa (Central Greece). The soil profile P2 location and geology maps (Figure 1 and Figure 2) were compiled by using ArcGIS v.10.4 software (Environmental Systems Research Institute, ESRI, Redlands, California, United States of America). A typical Mediterranean climate with a marked dry period in summer prevails at Karditsa. The mean annual air temperature is 15.7 °C and the mean annual precipitation is 740 mm. The soil moisture regime is characterized as xeric, which is typical for the soils under a Mediterranean climate. As the estimated mean annual soil temperature is above 15 °C but lower than 22 °C and the mean winter soil temperature is >5 °C (at a depth of 50 cm), the temperature regime of the area is thermic. The parent material of the study area consists of alluvial deposits formed in the late quaternary (Figure 1). The land is used mainly for cotton (Gossypium hirsutum L.) and wheat (Triticum aestivum L. and Triticum durum L.) cultivation.

2.2. Soil Profile Sampling, Analyses, and Evaluation Methods

As a representative of the Gefiria agricultural area (Karditsa alluvial plain), an episaturated soil profile was selected, described, and sampled by pedogenetic horizons. The soil was classified according to soil taxonomy as Aquic Haploxeralf [24]. The profile is situated in a flat to almost flat position (2% slope), and it is imperfectly drained, showing seasonal wet surface horizons in late winter and spring.
The standard procedures and terminology for the description of the soil profile are from soil taxonomy and are given in Table 1.
Soil samples were collected from each horizon for physical and chemical analysis. The samples were air-dried, crushed, passed through a 2 mm sieve and stored in plastic bags. For particle size analysis, organic matter was oxidized with 30% H2O2, and dispersion was achieved by agitating the soil samples overnight with Na2CO3. The sand fractions were separated by wet sieving, oven-dried and then fractionated by dry-sieving into 5 size classes: very coarse sand (2–1 mm), coarse sand (1–0.5 mm), medium sand (0.5–0.25 mm), fine sand (0.25–0.1 mm) and very fine sand (0.1–0.05 mm). The silt and clay fractions were determined by pipette. The calcium carbonate equivalent was determined by HCl dissolution and the measurement of evolved CO2. The organic C was determined by K2Cr2O7 oxidation method, and the soil pH was measured in 1:1 (w/v) soil/water slurries. Cation exchange capacity and base cations (Ca, Mg, K, and Na) were determined using 1 M NH4OAC (pH 7) and measured with atomic absorption spectroscopy (Ca and Mg) (VarianA-300) and by flame emission spectroscopy (K and Na). Samples were extracted with dithionite–citrate–bicarbonate (DCB, Fed), ammonium oxalate (Feo) and sodium pyrophosphate (Fep) to determine the crystalline, amorphous and organic forms of Fe, respectively.
In order to gain some insights about the studied soil pedon, the redoximorphic features in the form of redox concentrations of the profile were described. Redoximorphosis is a critical pedogenic process in the studied soil pedon, and these features are morphological soil characteristics that are related to drainage conditions and are formed by the reductive dissolution and oxidation of Fe and Mn oxides. The Munsell soil color chart was used to describe the soil matrix and Fe mottles color. Moreover, the redox concentrations of the soil profile in the form of Fe–Mn concretions were evaluated according to the following procedure [25,26]. First, 200 g air-dried uncrushed soil samples were dispersed overnight in 0.25 M Na2CO3 and wet sieved on a set of sieves with openings of 4.76. 2.00, 1.00, 0.50 and 0.25 mm, respectively. All materials (concretions, quartz, organic residues) retained on the sieves were oven-dried overnight at 105 °C and then weighed. For the three first fractions (very coarse, coarse and medium), contaminants were removed by hand picking. The fine and very fine fractions of concretions were determined by selective dissolution with aqua regia at 80 °C for 3 h.
Table 2 summarizes the main morphological and physicochemical characteristics of the studied soil pedon.
For the synopsis of P2 soil pedon description and the evaluation of its suitability for arable cropping, the SFCC system was used [7]. The SFCC system presents two categorical levels, containing quantitative and over time [27] information of performance, with the first describing topsoil and subsoil texture. The second categorical level is based on eighteen possible indicators called condition modifiers, which use soil taxonomy characteristics (Table 3).
In order to estimate P2 soil pedon agricultural value, the parametric MSI methodology was used [13]. This methodology classifies soils independently of other biophysical and economic factors that could potentially determine the viability and satisfactory yield of a particular crop in them. The classification of soils is performed with the help of a parametric index (MSI) using a multiplicative scheme, which is presented in Equation (1).
MSI = A × B × C × X
Based on the methodology, four general factors were considered. Factor A of MSI score soils are based on the characteristics of the soil profile without considering the textural composition of the surface soil (Table 3). Soil texture of the surface layer is considered by factor B of Equation (1). Factor C records and scores the slope of the soil surface, and finally, factor X includes several possible limiting (modifying) factors that could potentially degrade the suitability of a soil for agricultural use (e.g., drainage, alkali content, nutrient level, acidity, erosion, microrelief) (Table 3). Then, all the factor scores are multiplied together to produce an index rating from 0–100%, classifying the soil into six classes (Table 4).

3. Results and Discussion

3.1. Soil Properties

Soils that experience saturation by a perched water table above an impervious argillic horizon often have light-colored E horizons with chroma of less than three, and at the same time, less clay and free Fe oxides than the underlying horizons [21,28,29]. The transitional horizon BE in our study meets the aforementioned conditions supporting the hypothesis of episaturation in the soil profile. Particle size analysis of all horizons supports that clay translocation has taken place (Table 5). The clay content in soil horizons ranges from 22.8% to 40.0% with loamy surface textures, while clayey and silty clay soils are dominant in the illuvial part of the profile at which a strong medium angular blocky structure, typical of argillic horizon, prevails. Moreover, the fine (0.2 μm) to total clay ratios are significantly higher in the B horizons than in the surface horizons; therefore, these horizons meet the textural requirements for argillic horizons. In addition, abundant clay coatings, mostly on the surfaces of pores and mineral grains, as the result of the progressive deposition of clay particles, were identified during micromorphological observations of thin section images (data not shown). The bulk density for the argillic horizons ranges from 1.70 to 1.76 g cm−3, values that are higher than their overlying and underlying horizons. These argillic horizons exhibit reduced root presence or root restriction and abundant clay skins. In the upper part of the pedon, slightly acidic conditions occur, while at depths below 100 cm, the pH values increase due to the presence of calcium carbonates. In addition, CaCO3 has accumulated in the calcic horizon (Ck) in the form of abundant CaCO3 glaebules. The soil horizons contain little organic matter, indicating the dominance of the mineralization process, a characteristic of arable Luvisols formed under Mediterranean conditions [30]. The high CEC and the relative high amounts of Mg2+ compared to Ca2+ are strongly related to clay mineralogy. Only the Ap horizon of soil shows high a content of K+ due to fertilization. Base saturation values are representative of the Alfisol order (Luvisol Soil Reference Group). The depth distribution of different Fe forms is shown in Table 6. In all horizons, Fed > Feo, indicating that most of the Fe in the soil profile exists in free oxide forms. Maximum free iron oxides are found in argillic horizons, suggesting that clay illuviation is an active pedogenic process responsible for Fe translocation. The maximum of oxalate (Feo) and pyrophosphate (Fep) extractable Fe occurred in the surface horizons with the higher organic matter content. Ratios of oxalate to dithionite–extractable Fe (Feo/Fed) were considerably higher in the upper part of the profile than in the Bt and C horizons, which points to a lower degree of iron oxide crystallization in argillic horizons (Figure 3). As previous studies suggest, the Fed maxima in the Bt horizons of Alfisols coincide with low Feo/Fed ratios [31,32].

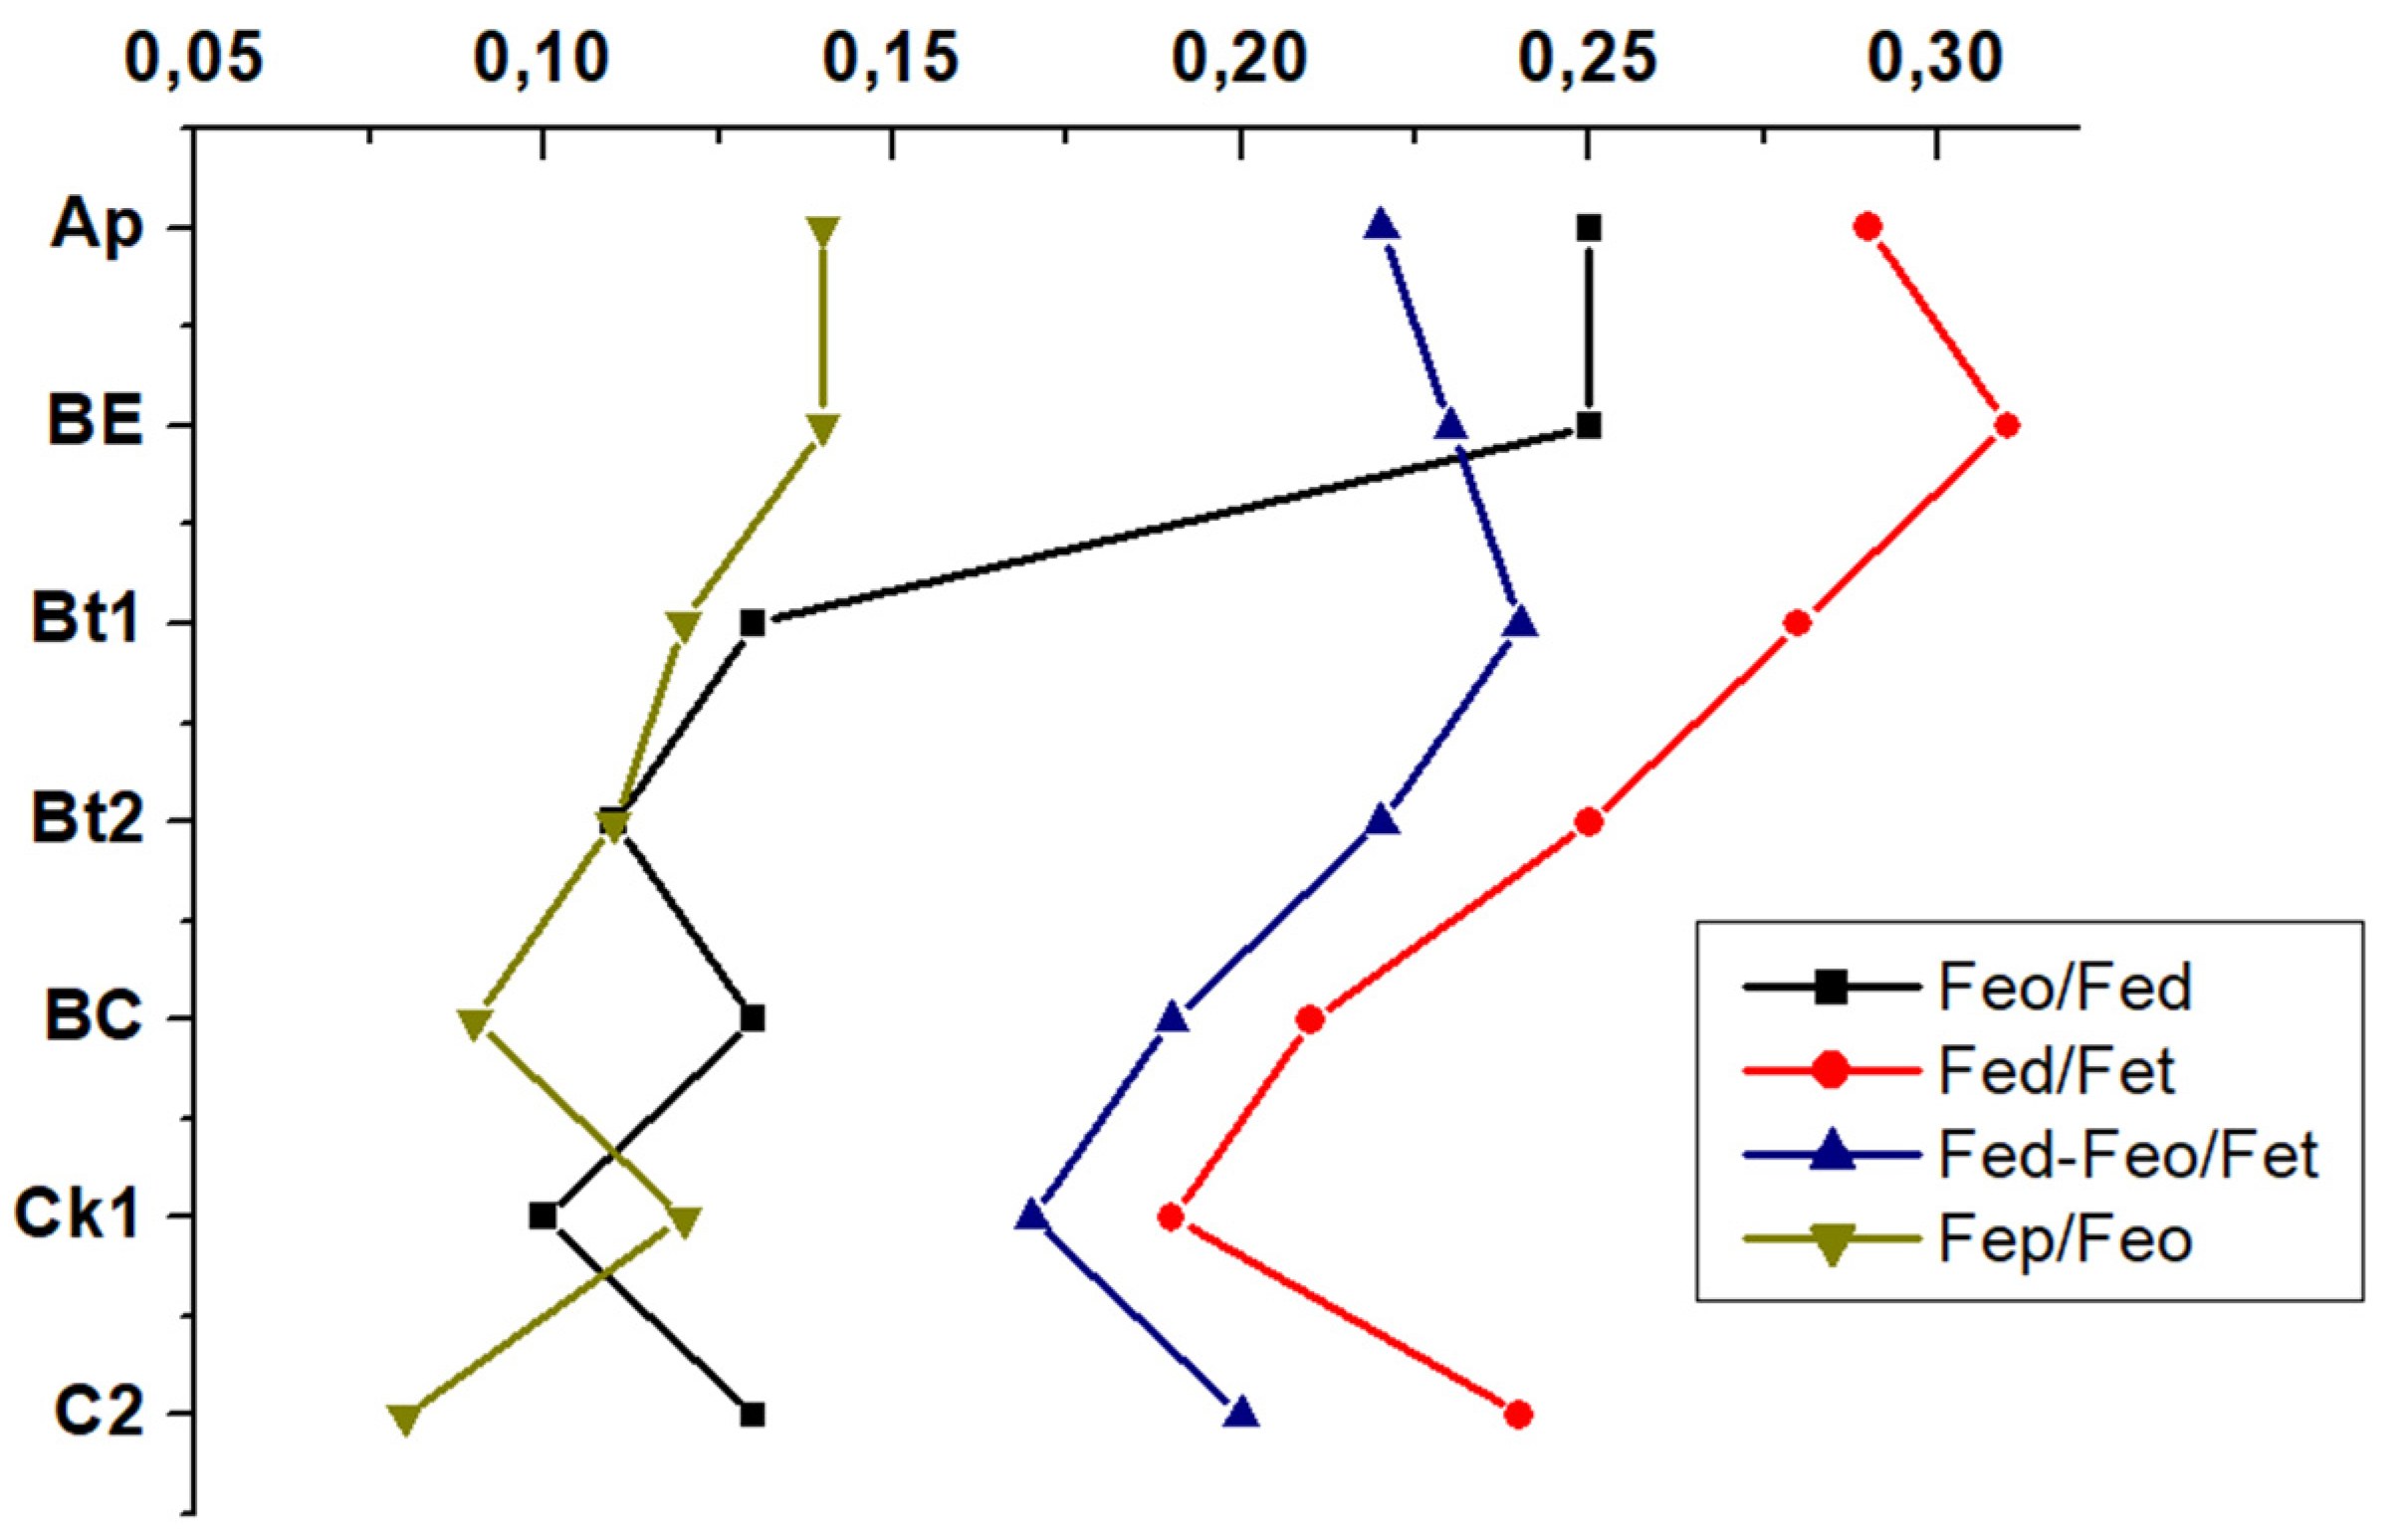
3.2. Redox Concentrations

Soil morphological features have been used as diagnostic indicators of soil drainage class and as a requisite for soil classification and soil survey interpretation, reflecting the strong correlation that exists between redox potential, O2 content, aquic conditions, and soil characteristics through complex interacting soil forming processes [33]. In this study, the Ap and BE horizons have a two-chroma (10YR 4/2) matrix (dark greyish brow color), indicating that these horizons are saturated with water during part of the year (Table 1). Moreover, the mottling patterns in the soil profile demonstrate alternative oxidation–reduction phenomena occurring periodically, mostly in the upper part of the profile [34]. The ped interior reflects oxidizing conditions with mottles of high chromas (6 to 8) and hues of 5 YR, which can be identified as Fe masses (soft bodies of Fe with variable shapes). The abundance and the contrast of Fe masses depend on the depth of the soil profile. In the eluvial part, the Fe masses are few with prominent contrast, while in the argillic horizons, the mottles are many with less contrast. Fe–Mn concretions were observed in all horizons. The total content ranged from 0.21% to 3.54% with a maximum in the eluvial part (BE horizon). Below the BE horizon, concretions decreased sharply, especially in the lower part of the soil profile (Table 7).
As the concretion contents decrease, their proportion of the concretions in the fine and very fine fractions (1.00–0.25 mm) increase (Table 7). Several studies have shown that Fe–Mn concretions are commonly formed on soils with restricted internal drainage as the result of alternating oxidation and reduction cycles, and they are therefore used as diagnostic indicators of soil redoximorphosis [35,36]. In the studied soil profile, the maximum content of concretions occurs in the BE horizon, above the restricted clay horizons Bt1 and Bt2, which creates episaturation. The zone of saturation corresponds to the surface of a seasonally perched water table on top of the relatively impermeable argillic horizons. This distribution of Fe–Mn concretions is in accordance with the patterns observed by Rhoton et al. [37] in Fragiudalfs and Childs and Leslie [38] in Fragiochrepts. Our results indicate that redoximorphosis has a great impact in the genesis and the assessment of the soil resources in the study area.

3.3. SFCC System and MSI Soil Rating Implementation to P2

Based on the categorical levels of the SFCC system [7] and according to the P2 horizon’s description and soil analyses, the soil mapping unit represented by P2 was characterized by the symbol: L/Cgb (0–2%). Specifically, as far as the characterization of the textural composition of the soil’s surface layer is concerned, the plowing horizon (Ap) was examined. Respectively for the description of the subsoil texture, the next 30 cm of the soil profile was examined, only in cases that within this depth a textural change was noted. According to Table 2, the plowing horizon (Ap) of the P2 soil profile has a loamy texture (L), while from a 35 cm depth of the soil profile to 58 cm (Bt1), a change in the textural composition, from L to C-CL, occurred. Conforming to the SFCC system (Table 3), aquic soil conditions were defined by the presence of ≤2 chroma soil matrix within 50 cm from the surface and below all A horizons. As reported in Table 2, for the first 35 cm of the soil profile (Ap and BE), the above-mentioned condition was confirmed. In the argillic horizons (Bt1, Bt2), the chroma value was slightly increased, suggesting that these horizons are also periodically saturated but are less reduced than the overlying horizons. Therefore, we considered that the soil profile up to the lower limit of the argillic horizons (Bt1 and Bt2) presented aquic soil conditions due to the phenomenon of episaturation, and for this reason, we proposed the letter g of the SFCC system to be used for its description (Table 3). Because of the almost flat surface of the P2 soil profile site, the slope was appended to 0–2% class. The absence of carbonates up to 96 cm of the soil profile depth (Table 2) meets the criterion of letter b according to the SFCC system (Table 3). On the argillic horizons (Bt1 and Bt2), percentages greater than 35% of clay fraction (40%) were recorded (Table 2). Although 2:1 expanding clays were identified, we could not support that their percentage was greater than 50% because no quantitative analysis of the mineral composition was carried out [39]. Therefore, it is not possible to attribute the letter v to the symbol of the SFCC system for the P2 description.
The P2 profile represents soils on old terraces with moderately developed profiles and a moderately dense subsoil layer (Bt1 and Bt2), which according to Table 3, where the scoring criteria of MSI factors [11] are recorded, they are rated with 87.5% for factor A. Up to a depth of 35 cm (Ap and BE), the P2 soil profile was characterized by a loamy soil texture and therefore was appended to 100% class of B factor grading, according to the MSI methodology (Table 4). The nearly level (0–2%) slope of the P2 soil surface classified it in the grade category of 100% as far as the C factor was concerned (Table 3). Finally, a score of 60% was attributed to the X factor of the MSI methodology, considering both the restrictions of drainage (due to episaturation) and inherent nutrient soil status in accordance with the principles of Liebig’s law of the minimum [40]. In total, MSI received the value of 52.5%, which classified the P2 soil profile in category 3 of Storie’s evaluation table (Table 4), corresponding to soils that are generally of fair quality in their agricultural usage.
The core of the SFCC system concerns the conversion of soil mapping units into soil fertility mapping units [41], requiring the evaluation of several soil pedons to cartographically distinguish them. Nevertheless, even the identity of the examined soil, represented by the system’s symbol, easily highlights its individual characteristics of good potential for general arable cropping. The same conclusion for the P2 soil pedon was reached by Storie’s methodology, following a different and more autonomous path. The Storie’s rating scale, which is independent of other pedons, classified the soil as of fair quality or of fair agricultural value.

4. Conclusions

As highlighted and confirmed by the present work, it is necessary to take into account data of a detailed scale, specifically at the level of soil pedon, for the adaptation and proper usage of any technical system or rating methodology for soil evaluation. Pedon characterization data, morphological descriptions and laboratory analyses are prerequisites in order to reveal the complex interaction between hydromorphic properties and soil use interpretation. In the case of this work, if there were no detailed field and laboratory data of the soil profile sampling, which confirmed the existence of an impermeable clay horizon and the episaturation process, it would not be possible to accurately characterize the soil according to the SFCC system or to correctly score it by the MSI method regarding the soil’s pedon fertility class and its corresponding agricultural value. Creating synergies and strong linkages between detailed/specific soil data and soil evaluation methodologies will foster further advances in addressing soil resource issues ranging from local to global scales.

Author Contributions

Conceptualization, D.G.; methodology, O.K. and D.G.; validation, D.G. and O.K.; investigation, D.G. and O.K.; writing—original draft preparation, O.K. and D.G.; writing—review and editing, D.G. and O.K.; supervision, D.G.; funding acquisition, D.G. All authors have read and agreed to the published version of the manuscript.

Funding

This research received no external funding.

Data Availability Statement

Data are available upon request.

Conflicts of Interest

The authors declare no conflict of interest.

References

  1. Cline, M.G. Basic principles of soil classification. Soil Sci. 1949, 67, 81–92. [Google Scholar] [CrossRef]
  2. Soil Survey Staff. Soil Taxonomy: A Basic System of Soil Classification for Making and Interpreting Soil Surveys, 2nd ed.; Natural Resources Conservation Service; U.S. Department of Agriculture Handbook 436; U.S. Department of Agriculture: Washington, DC, USA, 2021. [Google Scholar]
  3. IUSS Working Group WRB. World Reference Base or Soil Resources 2014, Update 2015 International Soil Classification System for Naming Soils and Creating Legends for Soil Maps; World Soil Resources Reports No. 106; FAO: Rome, Italy, 2005. [Google Scholar]
  4. Latham, M. Evaluation of the Soil and Land Resource. In Soil Science and Sustainable Land Management in the Tropics; Syers, J.K., Rimmer, D.L., Eds.; Cab International in Association with the British Society of Soil Science: Wallingford, UK, 1994. [Google Scholar]
  5. Kairis, O.; Dimitriou, V.; Aratzioglou, C.; Gasparatos, D.; Yassoglou, N.; Kosmas, C.; Moustakas, N. A Comparative Analysis of a Detailed and Semi-Detailed Soil Mapping for Sustainable Land Management Using Conventional and Currently Applied Methodologies in Greece. Land 2020, 9, 154. [Google Scholar] [CrossRef]
  6. Sanchez, P.; Couto, W.; Buol, S. The fertility capability soil classification system: Interpretation, applicability and modification. Geoderma 1982, 27, 283–309. [Google Scholar] [CrossRef]
  7. Sanchez, P.; Palm, C.; Buol, S. Fertility capability soil classification: A tool to help assess soil quality in the tropics. Geoderma 2003, 114, 157–185. [Google Scholar] [CrossRef]
  8. Orimoloye, J. Fertility Capability Classification of Some Flood Plain Soils in Kogi State, Central Nigeria. Life Sci. 2016, 13, 48–55. [Google Scholar] [CrossRef]
  9. Chandrakala, M.; Bhoora, P.; Niranjana, K.V.; Sujatha, K.; Rajendra, H.; Chandran, P. Application of Soil Fertility Capability Classification (FCC) in Dry Semi Arid Land of South Telangana Plateau, Andhra Pradesh. Commun. Soil Sci. Plant Anal. 2021, 52, 161–171. [Google Scholar] [CrossRef]
  10. Amaresh, D. Soil fertility capability classification as management options to remediate plant growth and production related constraints of some subtropical soils on varying parent materials and altitude. Int. J. Agric. Sci. Res. 2015, 5, 115–124. [Google Scholar]
  11. Minh, V. The Rice Soil Fertility Capability Classification System. Int. J. Environ. Rural. Dev. 2011, 2-1, 7–12. [Google Scholar]
  12. Storie, R.E. An Index for Rating the Agricultural Value of Soils, Agricultural Experiment, Station Bulletin 556; University of California Agricultural Experiment Station: Berkley, CA, USA, 1933. [Google Scholar]
  13. Storie, R.E. Storie Index Soil Rating. Division of Agricultural Science, 1978, University of California. Available online: http://anrcatalog.ucanr.edu/pdf/3203.pdf (accessed on 15 November 2021).
  14. El Ghonamey, Y. Evaluation of some soils in North Western Paris oasis (egypt) using Storie index and Sys models. Egypt. J. Agric. Res. 2015, 93, 1–23. [Google Scholar] [CrossRef]
  15. El-Gammal, M.; Ali, R.; Eissa, R. Land use assessment of barren areas in Damietta Governorate, Egypt using remote sensing. Egypt. J. Basic Appl. Sci. 2014, 1, 151–160. [Google Scholar] [CrossRef] [Green Version]
  16. O’Geen, A.T.; Southard, S.B. A revised Storie Index modeled in NASIS. Soil Surv. Horiz. 2005, 46, 98–108. [Google Scholar] [CrossRef]
  17. Emad, M.; Ahmed, S.; Abdalsamad, A. Land Capability Classification of Wadi Jerafi Basin, North Sinai Egypt. Alex. Sci. Exch. J. 2019, 40, 43–59. [Google Scholar] [CrossRef]
  18. Storie, R.E.; Weir, W.W. Generalized Soil Map of California, Manual 6; Division of Agriculture and Natural Resources, University of California College of Agriculture: Los Angeles, CA, USA, 1951; p. 61. [Google Scholar]
  19. Vepraskas, M.J.; Lindbo, D.L. Redoximorphic Features as Related to Soil Hydrology and Hydric Soils. In Hydropedology: Synergistic Integration of Soil Science and Hydrology; Lin, H., Ed.; Academic Press: Cambridge, MA, USA; Elsevier: London, UK; Amsterdam, The Netherlands, 2012; pp. 143–172. [Google Scholar]
  20. Wiederhold, J.G.; Teutsch, N.; Kraemer, S.M.; Halliday, A.N.; Kretzschmar, R. Iron isotope fractionation during pedogenesis in redoximorphic soils. Soil Sci. Soc. Am. J. 2007, 71, 1840–1850. [Google Scholar] [CrossRef]
  21. Blume, H.-P.; Brümmer, G.W.; Fleige, H.; Horn, R.; Kandeler, E.; Kögel-Knabner, I.; Kretzschmar, R.; Stahr, K.; Wilke, B.-M. Scheffer/Schachtschabel Soil Science, 1st ed.; Springer: Berlin/Heidelberg, Germany, 2016. [Google Scholar]
  22. Dorau, K.; Wessel-Bothe, S.; Milbert, G.; Schrey, H.P.; Elhaus, D.; Mansfeldt, T. Climate change and redoximorphosis in a soil with stagnic properties. Catena 2020, 190, 104528. [Google Scholar] [CrossRef]
  23. IGME (Institute of Geology and Mineral Exploration) Geological Map of Greece, Scale 1:500,000, Greece, 1983. Available online: https://shop.geospatial.com/product/03-GRAC-Greece-50000-Geological-Maps (accessed on 10 November 2021).
  24. Soil Survey Staff. Keys to Soil Taxonomy, 12th ed.; USDA-Natural Resources Conservation Service: Washington, DC, USA, 2014. [Google Scholar]
  25. Gasparatos, D.; Haidouti, C.; Tarenidis, D. Characterization of iron oxides in Fe-rich concretions from an imperfectly drained Greek soil: A study by selective-dissolution techniques and X-ray diffraction. Arch. Agron. Soil. Sci. 2004, 50, 485–493. [Google Scholar] [CrossRef]
  26. Phillippe, W.R.; Blevins, R.L.; Barnhisel, R.I.; Bailey, H.H. Distribution of concretions from selected soils of the inner bluegrass region of Kentucky. Soil Sci. Soc. Am. Proc. 1972, 36, 171–173. [Google Scholar] [CrossRef]
  27. Smyth, A.; Dumanski, J. A framework for evaluating sustainable land management. Can. J. Soil Sci. 1995, 75, 401–406. [Google Scholar] [CrossRef]
  28. Thomasson, A.J.; Bullock, P. Pedology and hydrology of some surface water gley soils. Soil Sci. 1975, 119, 341–348. [Google Scholar] [CrossRef]
  29. Świtoniak, M.; Mroczek, P.; Bednarek, R. Luvisols or Cambisols? Micromorphological Study of Soil Truncation in Young Morainic Landscapes—Case Study: Brodnica and Chełmno Lake Districts (North Poland). Catena 2016, 137, 583–595. [Google Scholar] [CrossRef]
  30. Ortiz, I.; Simón, M.; Dorronsoro, C.; Martín, F.; García, I. Soil Evolution over the Quaternary Period in a Mediterranean Climate (SE Spain). Catena 2002, 48, 131–148. [Google Scholar] [CrossRef]
  31. Jaworska, H.; Dąbkowska-Naskręt, H.; Kobierski, M. Iron oxides as weathering indicator and the origin of Luvisols from the Vistula glaciation region in Poland. J. Soils Sediments 2016, 16, 396–404. [Google Scholar] [CrossRef] [Green Version]
  32. Moustakas, N.K.; Barouchas, P.E. Free oxide distribution in poorly and well drained soils developed on calcareous alluvial deposits. Pedosphere 2003, 13, 345–351. [Google Scholar]
  33. Vepraskas, M.J.; Craft, C.B. Wetland Soils: Genesis, Hydrology, Landscapes, and Classification, 2nd ed.; CRC Press: Boca Raton, FL, USA, 2016. [Google Scholar]
  34. Richardson, J.L.; Hole, F.D. Mottling and iron distribution in a glossoboralf-haplaquoll hydrosequence on a glacial moraine in northwestern Wisconsin. Soil Sci. Soc. Am. J. 1979, 43, 552–558. [Google Scholar] [CrossRef]
  35. Zhang, M.; Karathanasis, A.D. Characterization of iron-manganese concretions in Kentuky alfisols with perched water tables. Clays Clay Min. 1997, 45, 428–439. [Google Scholar] [CrossRef]
  36. Jiang, Z.D.; Wang, Q.B.; Libohova, Z.; Adhikari, K.; Brye, K.R.; Sun, Z.X.; Sun, F.J.; Jiang, Y.Y.; Owens, P.R. Fe–Mn concentrations in upland loess soils in mid-continental North America: A step towards dynamic soil survey. Catena 2021, 202, 105273. [Google Scholar] [CrossRef]
  37. Rhoton, F.E.; Bigham, J.M.; Schulze, D.G. Properties of iron-manganese nodules from a sequence of eroded fragipan soils. Soil Sci. Soc. Am. J. 1993, 57, 1386–1392. [Google Scholar] [CrossRef]
  38. Childs, C.W.; Leslie, D.M. Interelement relationships in iron-manganese concretions from a catenary sequence of yellow-grey earth soils in loess. Soil Sci. 1977, 123, 369–376. [Google Scholar] [CrossRef]
  39. Gasparatos, D. Genesis of Fe–Mn Concretions and Nodules in Alfisols of Thessaly. Ph.D. Thesis, Agricultural University of Athens, Athens, Greece, 2007; p. 275. [Google Scholar]
  40. Von Liebig, J. Die Grundsa¨tze der Agricultur-Chemie mit Rucksicht auf die in England angestellten Untersuchungen. In England: The Relations of Chemistry to Agriculture and the Agricultural Experiments of Mr. J.B. Lawes., 1st and 2nd eds.; Friedrich Vieweg und Sohn Publ. Co.: Braunschweig, Germany, 1855. [Google Scholar]
  41. Jasper, C.D. Using the fertility capability classification system in soil survey reports. Soil Surv. Horiz. 2004, 45, 137–143. [Google Scholar] [CrossRef] [Green Version]
Figure 1. Soil profile P2 location map.
Land 11 00182 g001
Figure 2. Simplified lithological map of the study area [23].
Land 11 00182 g002
Figure 3. Depth functions of Fe forms ratios. Feo, poorly crystallized Fe-xides; Fed, free Fe oxides; Fet, total Fe; Fep, organic Fe compounds.
Land 11 00182 g003
Table 1. Profile P2 horizons description [24].
HorizonDepth (cm)Description
Ap0–19Dark grayish brown (10YR 4/2) slightly moist; loam (L); weak, fine, granular (1fgr); no effervescent; abrupt boundary
BE19–35Dark grayish brown (10YR 4/2) slightly moist; loam (L); moderate, medium, subangular blocky (2msbk); no effervescent; clear boundary
Bt135–58Brown (10YR 5/3) slightly moist; clay—clay loam (C-CL); moderate, medium, angular blocky (2mabk); no effervescent; gradual boundary
Bt258–96Brown (10YR 5/3) slightly moist; siltyclay—silty clay loam (SiC-SiCL); strong, medium, angular blocky (3mabk); no effervescent; clear boundary
BC96–112Yellowish brown (10YR 5/4) slightly moist; silty clay—silty clay loam (SiC-SiCL); weak, medium, subangular blocky (1mabk); slightly effervescent; clear boundary
Ck1112–148Pale brown (10YR 6/3) slightly moist; clay loam (CL); weak, medium, subangular blocky (1msbk); violently effervescent; diffuse boundary
C2148–170Yellowish brown (10YR 5/6) slightly moist; clay loam—loam (CL-L); weak, medium, subangular blocky (1msbk); slightly effervescent
Table 2. Profile P2 horizons soil analyses.
HorizonSoil TextureRedoximorphic Features #Clay CoatingsCaCO3 (%)pHOrganic Matter (%)CECExchangeable KExchangeable CaExchangeable MgExchangeable NaBase Saturation (%)
Sand (%)Silt (%)Clay (%)Characterization
Ap29.547.722.8Lf1p 5 YR 6/8--6.51.2717.730.65.855.310.6370
BE28.845.226Lf1p 5 YR 6/8+-6.41.3218.420.465.45.730.6867
Bt1233740C-CLm3f 10 YR 6/8+++-6.50.6422.960.48513.130.9865
Bt219.140.940SiC-SiCLm2f 10 YR 6/8+++-6.90.329.020.525.6512.730.9868
BC19.540.739.8SiC-SiCL-+traces7.90.2429.960.4313.0113.921.2796
Ck124.744.530.8CL--16.480.2429.960.3932.9813.331.27100
C228.544.726.8CL-L--traces7.90.0325.430.3210.0113.691.0499
-, +, +++ indicate increasing abundance of soil characteristics: absence, occasional, abundant; CEC = cation exchange capacity; L = loam; C = clay; CL = clay loam; SiC = silty clay; SiCL = silty clay loam. # abundance: few (f), many (m); size: fine (1) < 5 mm, medium (2) 5 to 15 mm, and large (3) > 15 mm in diameter; contrast: faint (f), prominent (p).
Table 3. Parameters of the SFCC system and the MSI soil rating chart that were used in describing and evaluating P2 soil profile [7,13].
SFCC System ParametersMSI Soil Rating Chart Parameters
Lloamy topsoil: <35% clay but not loamy sand or sandFactor A: Soils on older alluvial fans. alluvial plains. or terraces having moderately developed profiles (moderately dense subsoils)80–95%
Cclayey subsoil: texture as in typeFactor B: loam100%
gaquic soil moisture regime; mottles ≤ 2 chroma within 50 cm for surface and below all A horizons or soil saturated with water for >60 days in most years.Factor C: nearly level (0–2%)100%
bfree CaCO3 within 50 cm (fizzing with HCl), or pH > 7.3Factor X: moderately waterlogged40–80%
(0–2%)where desirable place range in % slope (i.e., 0–15%; 15–30%; >30%)Factor X: fair nutrient (fertility) level95–100%
Table 4. MSI total soil grading classes (Adapted from [13]).
Soil Grading ClassesRate between (%)
Grade 1 (excellent): Soils that are suitable for a wide range of crops including alfalfa, orchard, truck and field crops.80 and 100
Grade 2 (good): Soils that are suitable for most crops. Yields generally good to excellent.60 and 79
Grade 3 (fair): Soils that are generally of fair quality. with less wide range of suitability than grades 1 and 2. Soils in this grade may give good results with certain specialized crops.40 and 59
Grade 4 (poor): Soils that have a narrow range in their agricultural possibilities. For example, a few soils in this grade may be good for rice but not good for many other uses.20 and 39
Grade 5 (very poor): Soils of limited use except for pasture because of adverse conditions such as shallowness roughness and alkali content.10 and 19
Grade 6 (nonagricultural): Soils include for example soils of high alkali content and steep broken land.less than 10
Table 5. Particle size distribution expressed as weight-percent of the fine-earth fractions (<2.00 mm).
HorizonDepth
(cm)
Sand Fractions
(%)
Total Sand
(%)
2.00–1.00
(mm)
1.00–0.50
(mm)
0.50–0.250
(mm)
0.250–0.100
(mm)
0.100–0.050
(mm)
Ap0–19-1.624.109.1014.6829.5
BE19–35-1.644.039.3013.8328.8
Bt135–58-1.143.227.6011.0423.0
Bt258–96-0.622.487.009.0019.1
BC96–112-0.532.486.4010.0919.5
Ck1112–148-0.651.267.1015.6924.7
C2148–170 0.432.8910.0015.1828.5
HorizonDepth
(cm)
Silt fractions
(%)
Total silt
(%)
50–20
(μm)
20–5
(μm)
5–2
(μm)
Ap0–1930.5110.007.2047.7
BE19–3523.6111.6010.0045.2
Bt135–5812.2117.207.6937.0
Bt258–9618.5113.209.2040.9
BC96–11213.7118.808.1940.7
Ck1112–14822.9119.602.0044.5
C2148–17022.3116.406.0044.7
HorizonDepth
(cm)
Clay fractions
(%)
Total clay
(%)
2–0.2
(μm)
<0.2
(μm)
Ap0–1912.0110.7922.8
BE19–3514.0012.0026.0
Bt135–5816.4123.5940.0
Bt258–9617.6122.3940.0
BC96–11222.6017.2039.8
Ck1112–14819.2111.5930.8
C2148–17015.2011.6026.8
Table 6. Distribution of various Fe forms in the studied soil profile. Total iron (Fet), iron extracted with dithionite–citrate–bicarbonate, iron extracted with ammonium oxalate (Feo), and iron extracted with sodium pyrophosphate (Fep).
HorizonDepth
(cm)
Fe Forms
(%)
FetFedFeoFep
Ap0–194.461.310.330.045
BE19–354.431.370.340.046
Bt135–585.861.640.220.027
Bt258–965.761.440.160.018
BC96–1125.811.240.160.015
Ck1112–1485.961.150.120.014
C2148–1706.151.450.190.015
Table 7. Mean concentrations of Fe–Mn concretions in the very coarse (>4.76 mm), coarse (4.76–2.00 mm), medium (2.00–1.00 mm), fine (1.00–0.50 mm) and very fine factions (0.50–0.25 mm).
HorizonDepth
(cm)
Fractions of Fe–Mn Concretions
(g/100 g Soil)
Total
>4.76
(mm)
4.76–2.00
(mm)
2.00–1.00
(mm)
1.00–0.50
(mm)
0.50–0.25
(mm)
Ap0–19-1.311.270.480.403.46
BE19–350.051.401.260.460.373.54
Bt135–58-0.560.500.260.281.60
Bt258–96-0.520.420.220.221.38
BC96–112-0.150.110.200.240.70
Ck1112–148---0.200.230.43
C2148–170--0.020.080.110.21
Publisher’s Note: MDPI stays neutral with regard to jurisdictional claims in published maps and institutional affiliations.

