
Progress in Dust Modelling, Global Dust Budgets, and Soil Organic Carbon Dynamics

Abstract
:1. Introduction
2. Dust Models Adopted Worldwide
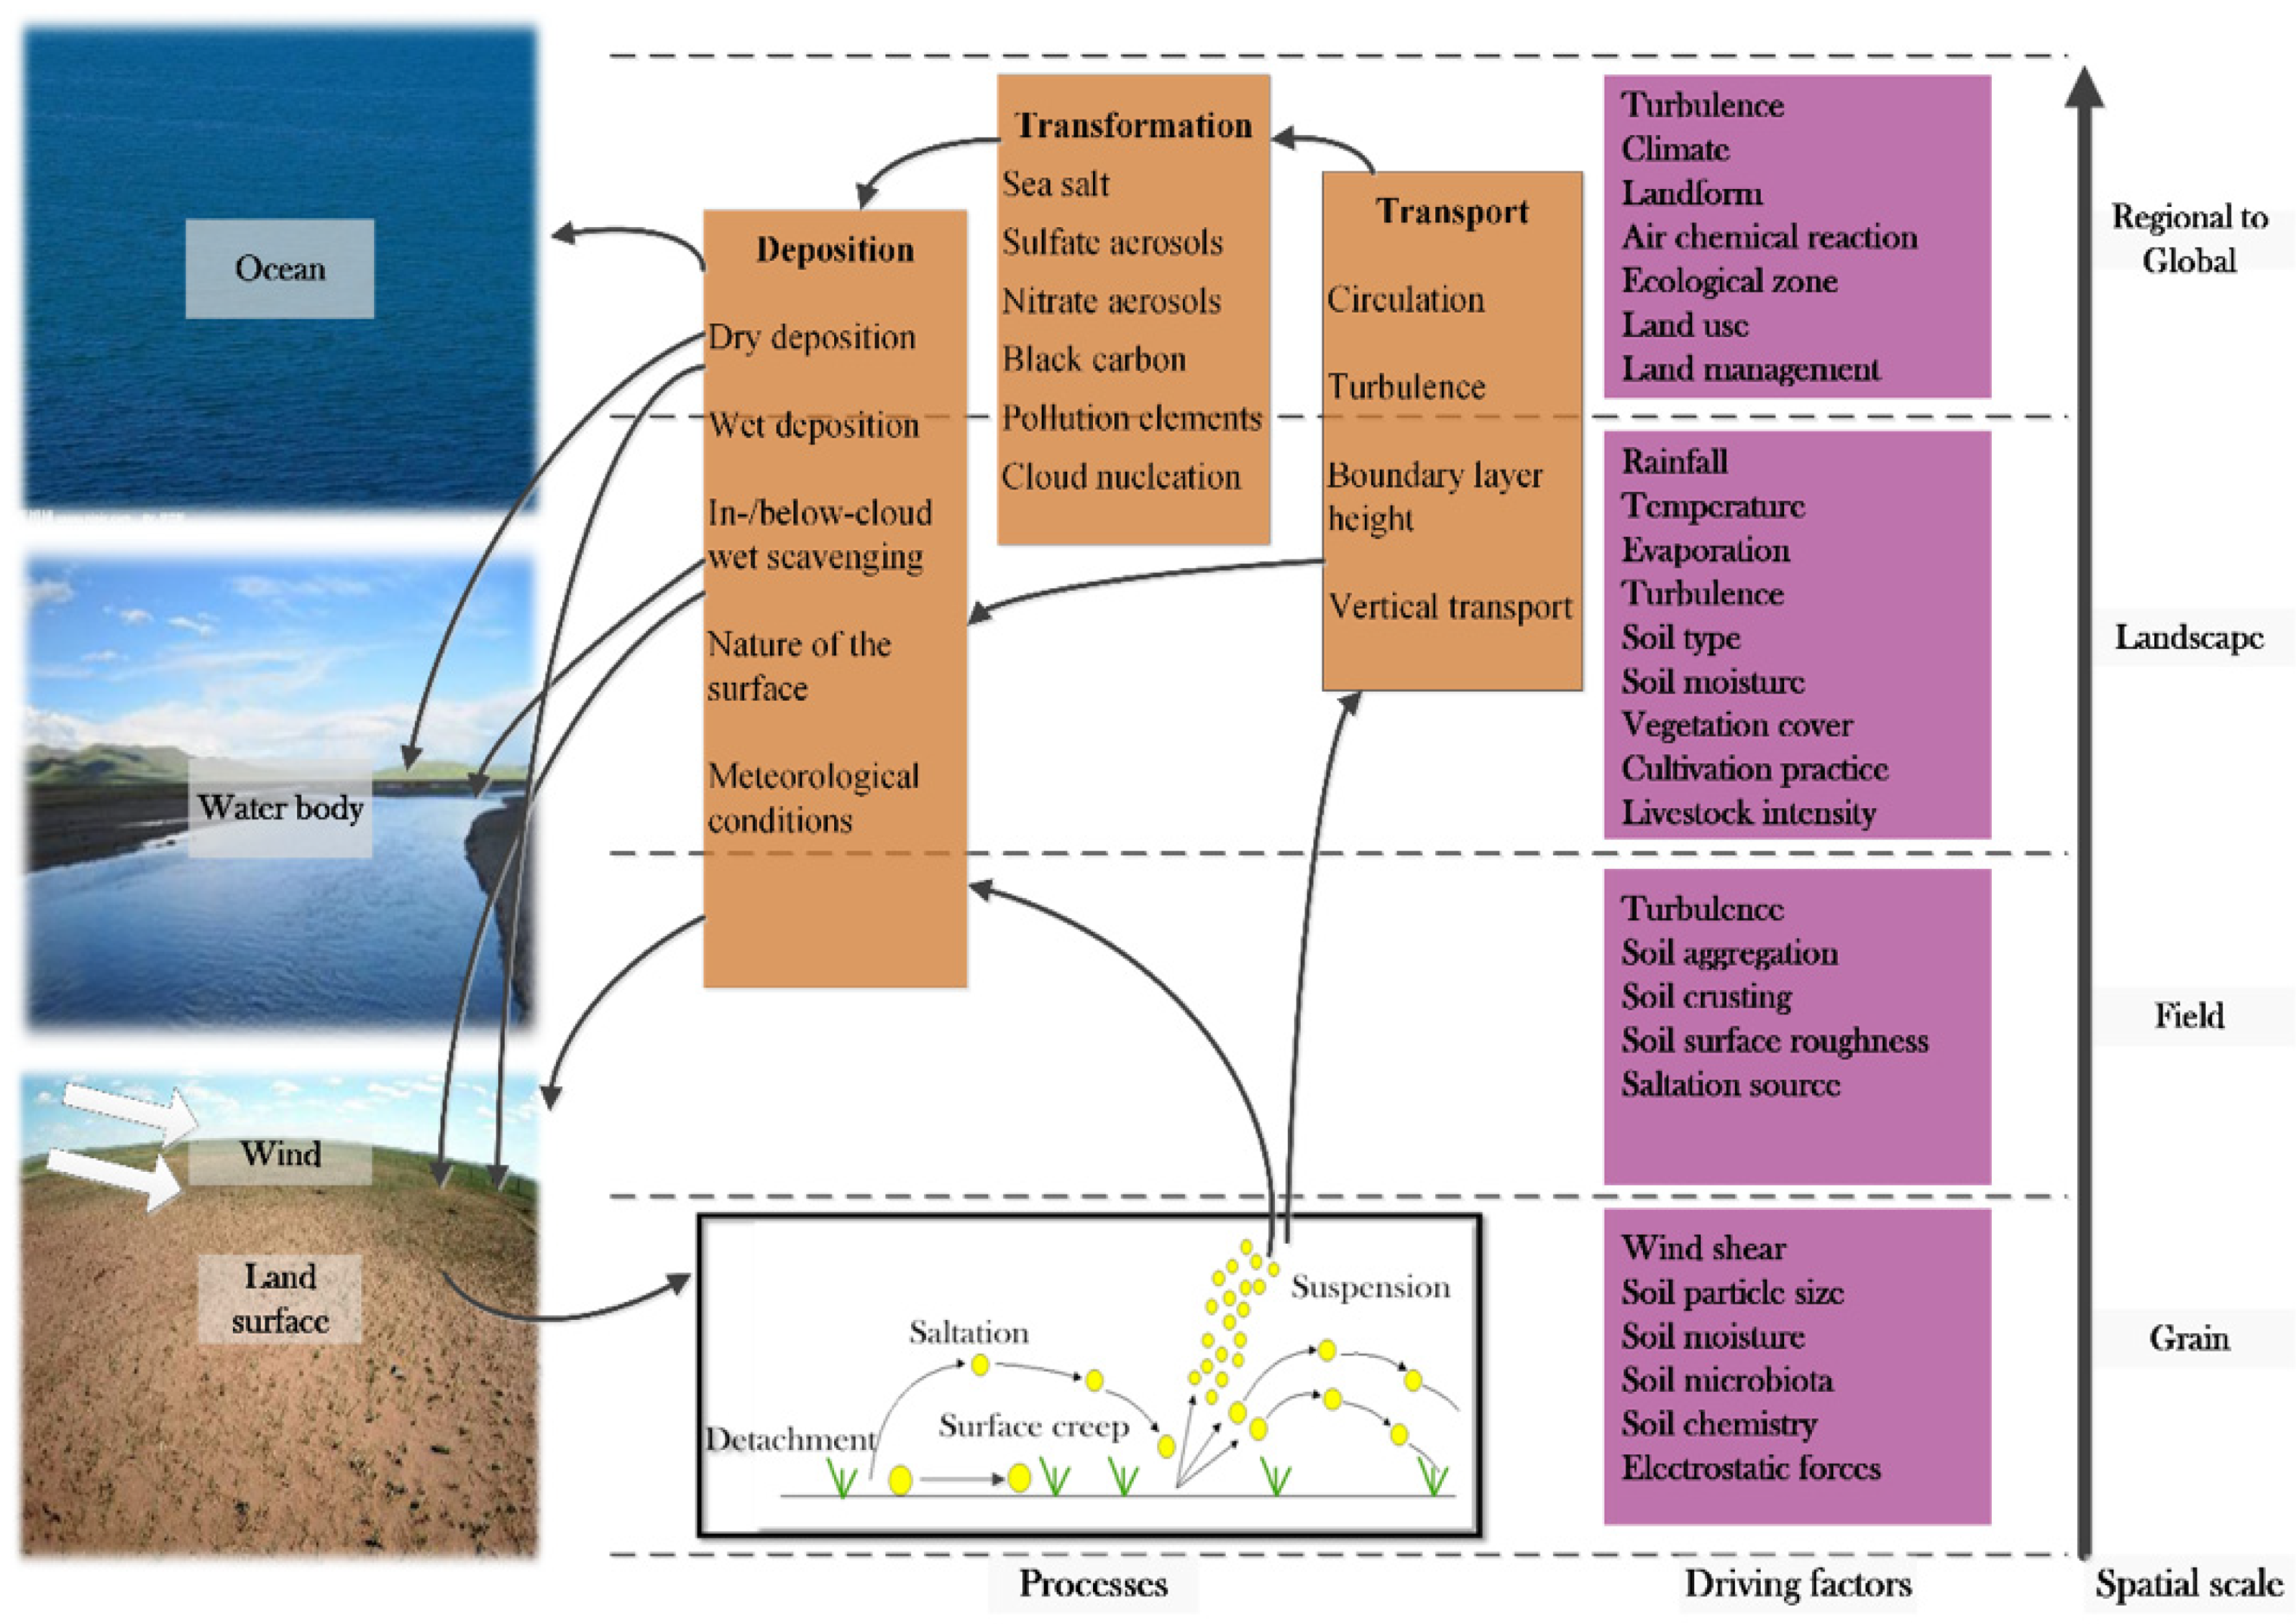
2.1. Factors Influencing Dust Emissions at Multiple Scales
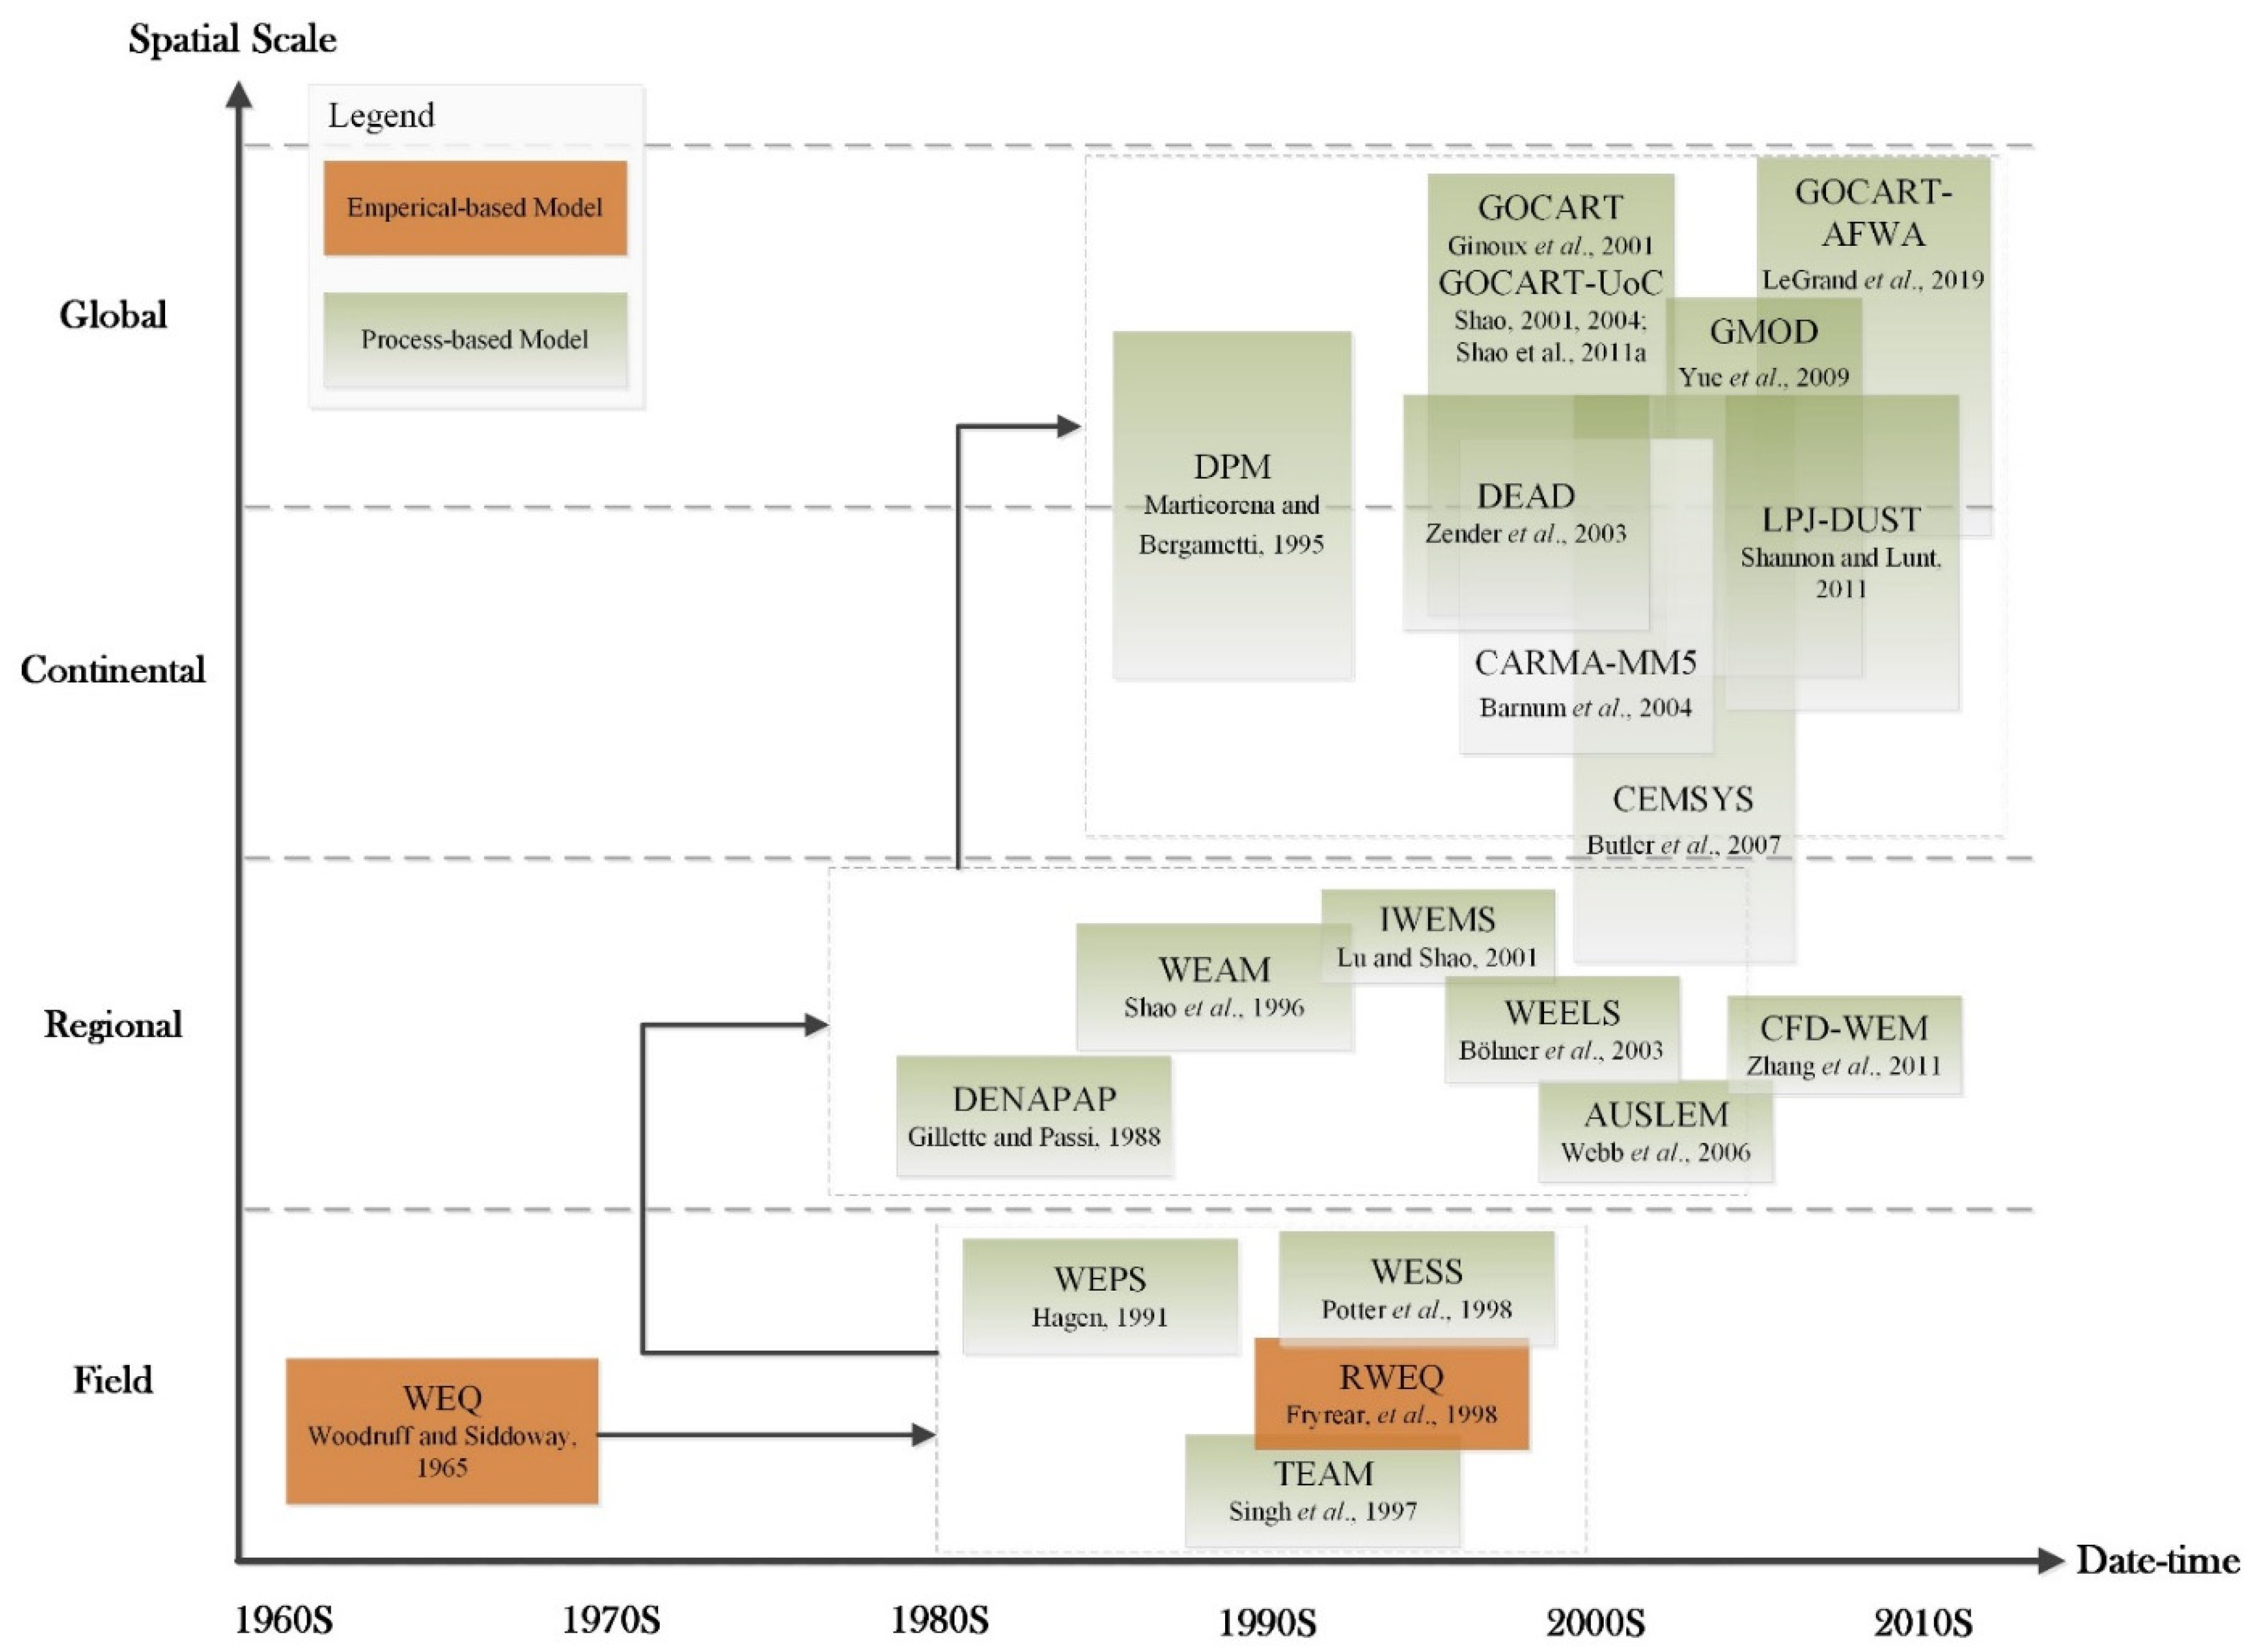
2.2. Dust Models at Multiple Spatial and Temporal Scales

3. Global Dust Budgets
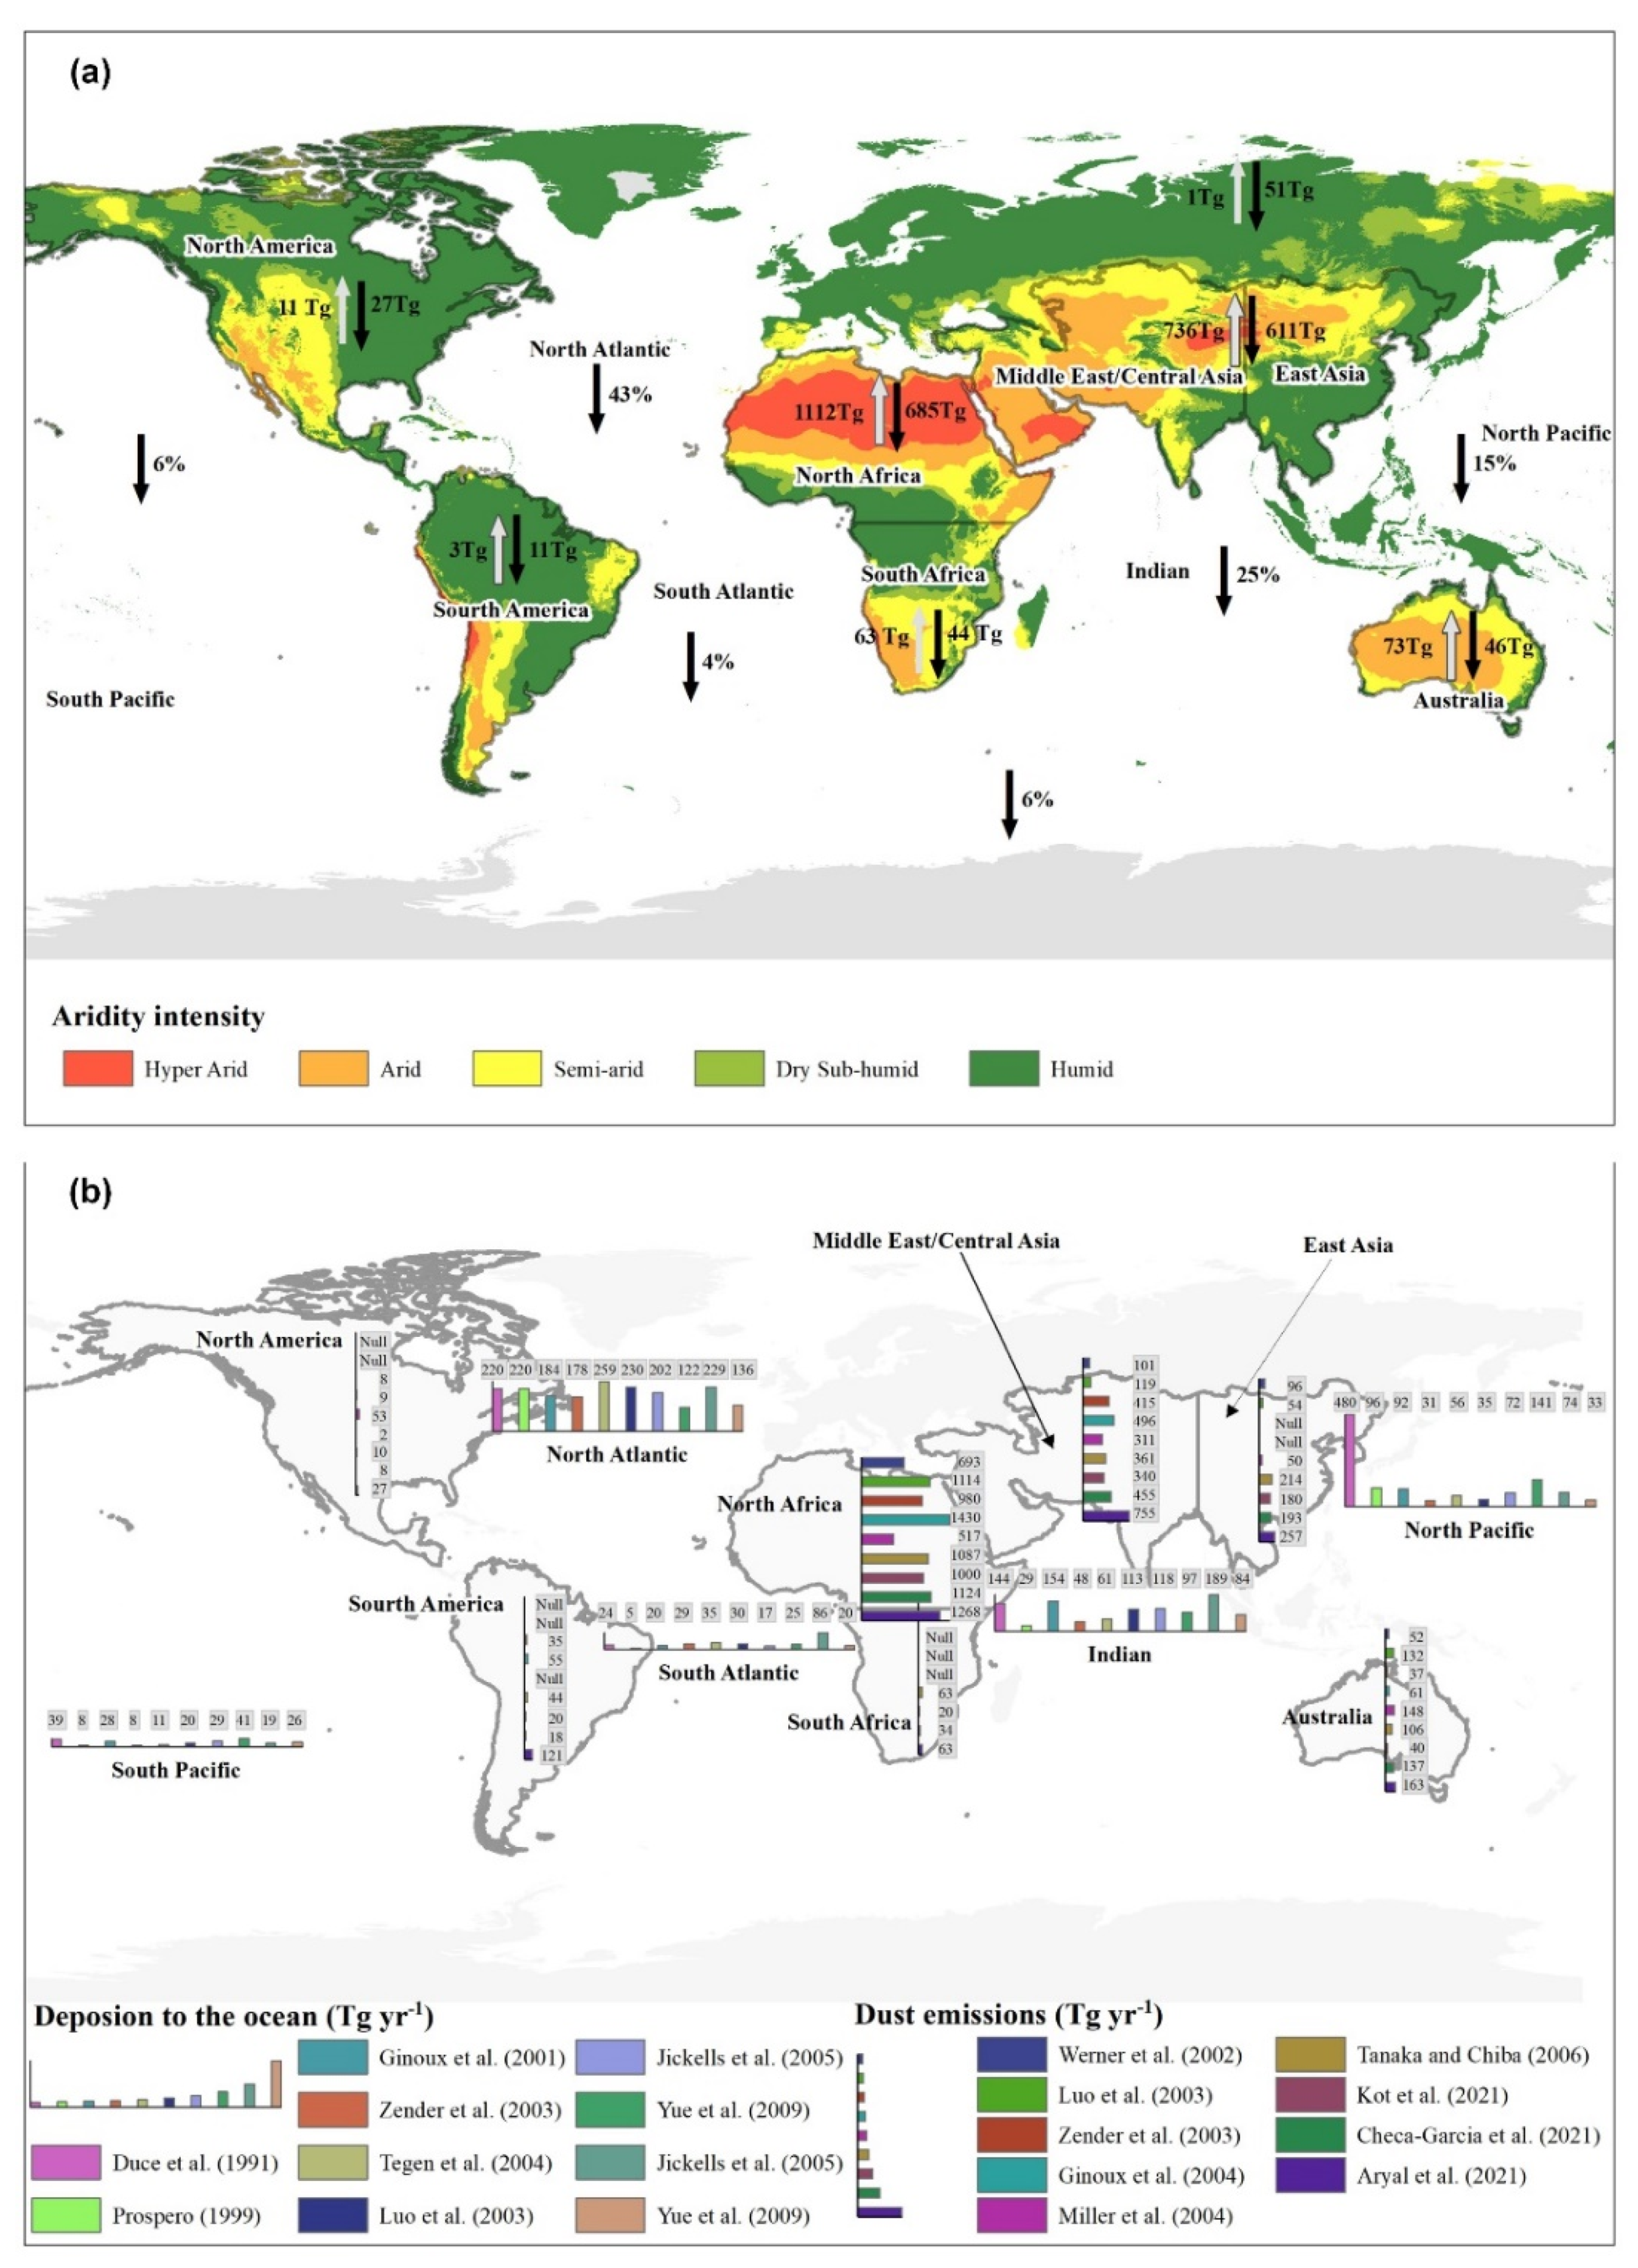
3.1. Dust Sources and Sinks
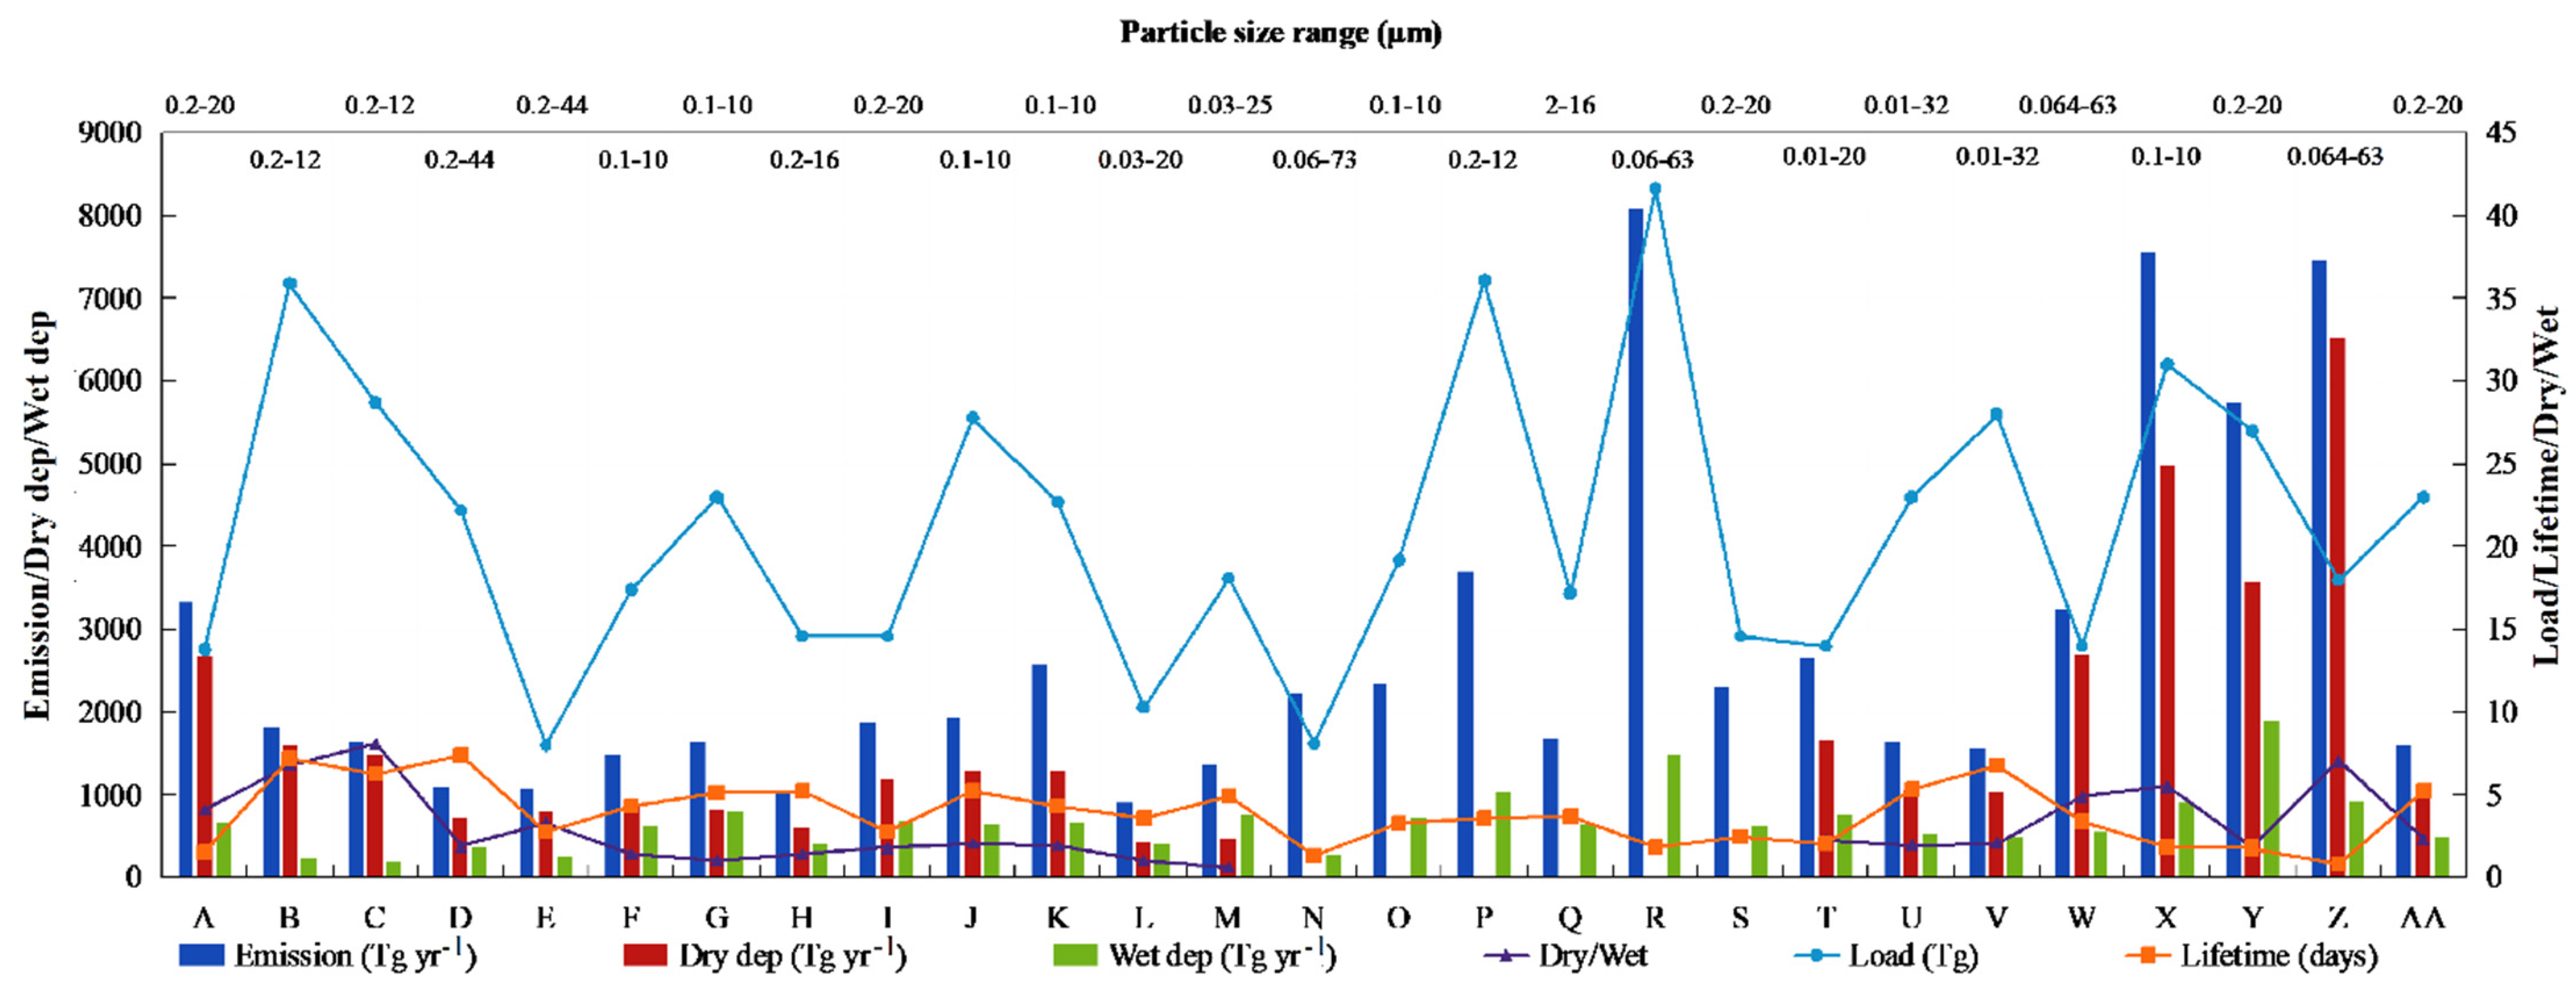
3.2. Dust Budgets

4. Dust Emission and SOC Dynamics
4.1. Loss of SOC Due to Dust Emission
4.2. Fate of SOC in Dust
5. Conclusions
Author Contributions
Funding
Acknowledgments
Conflicts of Interest
References
- Belnap, J.; Munson, S.M.; Field, J.P. Aeolian and fluvial processes in dryland regions: The need for integrated studies. Ecohydrology 2011, 4, 615–622. [Google Scholar] [CrossRef]
- Li, J.; Okin, G.S.; Alvarez, L.; Epstein, H. Quantitative effects of vegetation cover on wind erosion and soil nutrient loss in a desert grassland of southern New Mexico, USA. Biogeochemistry 2007, 85, 317–332. [Google Scholar] [CrossRef]
- Hoffmann, C.; Funk, R.; Reiche, M.; Li, Y. Assessment of extreme wind erosion and its impacts in Inner Mongolia, China. Aeolian Res. 2011, 3, 343–351. [Google Scholar] [CrossRef]
- Pokharel, A.K.; Kaplan, M.L.; Fiedler, S. Subtropical dust storms and downslope wind events. J. Geophys. Res. Atmos. 2017, 122, 10191–10205. [Google Scholar] [CrossRef] [Green Version]
- Pokharel, A.K.; Kaplan, M.L.; Fiedler, S. The role of jet adjustment processes in subtropical dust storms. J. Geophys. Res. Atmos. 2017, 122, 12122–12139. [Google Scholar] [CrossRef] [Green Version]
- Gregory, J.M.; Wilson, G.R.; Singh, U.B.; Darwish, M.M. TEAM: Integrated, process-based wind-erosion model. Environ. Modell. Softw. 2004, 19, 205–215. [Google Scholar] [CrossRef]
- Webb, N.P.; Mcgowan, H.A. Approaches to modelling land erodibility by wind. Prog. Phys. Geog. 2009, 33, 587–613. [Google Scholar] [CrossRef]
- Buschiazzo, D.E.; Zobeck, T.M. Validation of WEQ, RWEQ and WEPS wind erosion for different arable land management systems in the Argentinean Pampas. Earth Surf. Proc. Land 2010, 33, 1839–1850. [Google Scholar] [CrossRef]
- Song, H.; Zhang, K.; Piao, S.; Wan, S. Spatial and temporal variations of spring dust emissions in northern China over the last 30 years. Atmos. Environ. 2016, 126, 117–127. [Google Scholar] [CrossRef]
- Buschiazzo, D.E.; Funk, R. Wind erosion of agricultural soils and the carbon cycle. In Soil Carbon Science Management & Policy for Multiple Benefits; CABI: Egham, UK, 2014; pp. 161–168. [Google Scholar]
- Shao, Y. A model for mineral dust emission. J. Geophys. Res. Atmos. 2001, 106, 20239–20254. [Google Scholar] [CrossRef]
- Wang, X.; Oenema, O.; Hoogmoed, W.B.; Perdok, U.D.; Cai, D. Dust storm erosion and its impact on soil carbon and nitrogen losses in northern China. Catena 2006, 66, 221–227. [Google Scholar] [CrossRef]
- Huneeus, N.; Schulz, M.; Balkanski, Y.; Griesfeller, J.; Prospero, M.J.; Kinne, S.; Bauer, S.; Boucher, O.; Chin, M.; Dentener, F.; et al. Global dust model intercomparison in AeroCom phase I. Atmos. Chem. Phys. 2010, 10, 7781–7816. [Google Scholar] [CrossRef] [Green Version]
- Wu, C.; Lin, Z.; Liu, X. The global dust cycle and uncertainty in CMIP5 (Coupled Model Intercomparison Project phase 5) models. Atmos. Chem. Phys. 2020, 20, 10401–10425. [Google Scholar] [CrossRef]
- Tegen, I.; Werner, M.; Harrison, S.P.; Kohfeld, K.E. Relative importance of climate and land use in determining present and future global soil dust emission. Geophys. Res. Lett. 2004, 31, 325–341. [Google Scholar] [CrossRef] [Green Version]
- Chadwick, O.A.; Derry, L.A.; Vitousek, P.M.; Huebert, B.J.; Hedin, L.O. Changing sources of nutrients during four million years of ecosystem development. Nature 1999, 397, 491–497. [Google Scholar] [CrossRef]
- Reynolds, R.; Belnap, J.; Reheis, M.; Lamothe, P.; Luiszer, F. Aeolian dust in Colorado Plateau soils: Nutrient inputs and recent change in source. Proc. Natl. Acad. Sci. USA 2001, 98, 7123–7127. [Google Scholar] [CrossRef] [Green Version]
- Jickells, T.D.; An, Z.S.; Andersen, K.K.; Baker, A.R.; Bergametti, G.; Brooks, N.; Cao, J.J.; Boyd, P.W.; Duce, R.A.; Hunter, K.A.; et al. Global iron connections between desert dust, ocean biogeochemistry, and climate. Science 2005, 308, 67–71. [Google Scholar] [CrossRef] [PubMed] [Green Version]
- Alfaro, S.C. Influence of soil texture on the binding energies of fine mineral dust particles potentially released by wind erosion. Geomorphology 2008, 93, 157–167. [Google Scholar] [CrossRef]
- Chappell, A.; Sanderman, J.; Thomas, M.; Read, A.; Leslie, C. The dynamics of soil redistribution and the implications for soil organic carbon accounting in agricultural south-eastern Australia. Glob. Chang. Biol. 2012, 18, 2081–2088. [Google Scholar] [CrossRef]
- Song, H.; Wang, K.; Zhang, Y.; Hong, C.; Zhou, S. Simulation and evaluation of dust emissions with WRF-Chem (v3.7.1) and its relationship to the changing climate over East Asia from 1980 to 2015. Atmos. Environ. 2017, 167, 511–522. [Google Scholar] [CrossRef]
- Li, L.; Sokolik, I.N. Analysis of dust aerosol retrievals using satellite data in Central Asia. Atmosphere 2018, 9, 288. [Google Scholar] [CrossRef] [Green Version]
- Wang, K.; Zhang, Y.; Zhang, X.; Fan, J.; Leung, L.R.; Zheng, B.; Zhang, Q.; He, K. Fine-scale application of WRF-CAM5 during a dust storm episode over East Asia: Sensitivity to grid resolutions and aerosol activation parameterizations. Atmos. Environ. 2018, 176, 1–20. [Google Scholar] [CrossRef]
- Song, H.; Zhang, K.; Piao, S.; Liu, L.; Wang, Y.-P.; Chen, Y.; Yang, Z.; Zhu, L.; Wan, S. Soil organic carbon and nutrient losses resulted from spring dust emissions in Northern China. Atmos. Environ. 2019, 213, 585–596. [Google Scholar] [CrossRef]
- Hashizume, M.; Kim, Y.; Ng, C.F.S.; Chung, Y.; Madaniyazi, L.; Bell, M.L.; Guo, Y.L.; Kan, H.D.; Honda, Y.; Yi, S.M.; et al. Health effects of asian dust: A systematic review and meta-analysis. Environ. Health Perspect. 2020, 128, 66001. [Google Scholar] [CrossRef] [PubMed]
- Wang, L.; Cai, K.; Si, Y.; Yu, C.; Zheng, H.; Li, S. Evaluation of Himawari-8 version 2.0 aerosol products against AERONET ground-based measurements over central and northern China. Atmos. Environ. 2020, 224, 117357. [Google Scholar] [CrossRef]
- Liu, X.; Song, H.; Lei, T.; Liu, P.; Xu, C.; Wang, D.; Yang, Z.; Xia, H.; Wang, T.; Zhao, H. Effects of natural and anthropogenic factors and their interactions on dust events in Northern China. Catena 2021, 196, 104919. [Google Scholar] [CrossRef]
- Yang, L.; Ren, Q.; Zheng, K.; Jiao, Z.; Ruan, X.; Wang, Y. Migration of heavy metals in the soil-grape system and potential health risk assessment. Sci. Total Environ. 2022, 806, 150646. [Google Scholar] [CrossRef] [PubMed]
- Wang, T.; Zhang, L.; Zhou, S.; Zhang, T.; Zhai, S.; Yang, Z.; Wang, D.; Song, H. Effects of ground-level ozone pollution on yield and economic losses of winter wheat in Henan, China. Atmos. Environ. 2021, 262, 118654. [Google Scholar] [CrossRef]
- Zhang, T.; He, W.; Zheng, H.; Cui, Y.; Song, H.; Fu, S. Satellite-based ground PM2.5 estimation using a gradient boosting decision tree. Chemosphere 2021, 268, 128801. [Google Scholar] [CrossRef] [PubMed]
- Mctainsh, G.; Lynch, A.; Tews, E. Climatic controls upon dust storm occurrence in Eastern Australia. J. Arid Environ. 1998, 39, 457–466. [Google Scholar] [CrossRef]
- Prospero, J.M.; Ginoux, P.; Torres, O.; Nicholson, S.E.; Gill, T.E. Environmental characterization of global sources of atmospheric soil dust identified with the Nimbus 7 Total Ozone Mapping Spectrometer (TOMS) absorbing aerosol product. Rev. Geophys. 2002, 40, 1002. [Google Scholar] [CrossRef]
- Ginoux, P.; Prospero, J.M.; Torres, O.; Chin, M. Long-term simulation of global dust distribution with the GOCART model: Correlation with North Atlantic Oscillation. Environ. Modell. Softw. 2004, 19, 113–128. [Google Scholar] [CrossRef]
- Zobeck, T.M.; Parker, N.C.; Haskell, S.; Guoding, K. Scaling up from field to region for wind erosion prediction using a field-scale wind erosion model and GIS. Agric. Ecosyst. Environ. 2000, 82, 247–259. [Google Scholar] [CrossRef]
- Maman, S. The Central Asian ergs: A study by remote sensing and geographic information systems. Aeolian Res. 2012, 3, 353–366. [Google Scholar] [CrossRef]
- Guo, J.; Tao, N.; Fu, W.; Deng, M.; Wang, Y. Integration of multi-source measurements to monitor sand-dust storms over North China: A case study. Acta Meteorol. Sin. 2013, 27, 566–576. [Google Scholar] [CrossRef]
- Borrelli, P.; Lugato, E.; Montanarella, L.; Panagos, P. A new assessment of soil loss due to wind erosion in european agricultural soils using a quantitative spatially distributed modelling approach. Land Degrad. Dev. 2017, 28, 335–344. [Google Scholar] [CrossRef] [Green Version]
- Woodruff, N.P.; Siddoway, F. A wind erosion equation. Soil Sci. Soc. Am. J. 1965, 29, 602–608. [Google Scholar] [CrossRef]
- Fryrear, D.; Stout, J.; Hagen, L.; Vories, E. Wind erosion: Field measurement and analysis. Trans. ASAE 1991, 34, 155–0160. [Google Scholar] [CrossRef]
- Lu, H.; Shao, Y. Toward quantitative prediction of dust storms: An integrated wind erosion modelling system and its applications. Environ. Modell. Softw. 2001, 16, 233–249. [Google Scholar] [CrossRef]
- Böhner, J.; Schäfer, W.; Conrad, O.; Gross, J.; Ringeler, A. The WEELS model: Methods, results and limitations. Catena 2003, 52, 289–308. [Google Scholar] [CrossRef]
- Zender, C.S.; Bian, H.; Newman, D. Mineral Dust Entrainment and Deposition (DEAD) model: Description and 1990s dust climatology. J. Geophys. Res. Atmos. 2003, 108, 4416. [Google Scholar] [CrossRef] [Green Version]
- Yue, X.; Wang, H.; Wang, Z.; Fan, K. Simulation of dust aerosol radiative feedback using the Global Transport Model of Dust: 1. Dust cycle and validation. J. Geophys. Res. Atmos. 2009, 114, D10202. [Google Scholar] [CrossRef]
- Webb, N.P.; Chappell, A.; Strong, C.L.; Marx, S.K.; Mctainsh, G.H. The significance of carbon-enriched dust for global carbon accounting. Glob. Chang. Biol. 2012, 18, 3275–3278. [Google Scholar] [CrossRef] [Green Version]
- Chappell, A.; Baldock, J.A. Wind erosion reduces soil organic carbon sequestration falsely indicating ineffective management practices. Aeolian Res. 2016, 22, 107–116. [Google Scholar] [CrossRef]
- Chappell, A.; Webb, N.P.; Butler, H.J.; Strong, C.L.; Mctainsh, G.H.; Leys, J.F.; Rossel, R.V. Soil organic carbon dust emission: An omitted global source of atmospheric CO2. Glob. Chang. Biol. 2013, 19, 3238–3244. [Google Scholar] [CrossRef] [PubMed]
- Chappell, A.; Baldock, J.; Sanderman, J. The global significance of omitting soil erosion from soil organic carbon cycling schemes. Nat. Clim. Chang. 2016, 6, 187. [Google Scholar] [CrossRef]
- Lal, R. Soil erosion and the global carbon budget. Environ. Int. 2003, 29, 437–450. [Google Scholar] [CrossRef]
- Lancaster, N.; Baas, A. Influence of vegetation cover on sand transport by wind: Field studies at Owens Lake, California. Earth Surf. Proc. Land. 1998, 23, 69–82. [Google Scholar] [CrossRef]
- Baas, A. Complex systems in aeolian geomorphology. Geomorphology 2007, 91, 311–331. [Google Scholar] [CrossRef]
- Bauer, B.O. Contemporary research in aeolian geomorphology. Geomorphology 2009, 105, 1–5. [Google Scholar] [CrossRef]
- Shao, Y.; Wyrwoll, K.H.; Chappell, A.; Huang, J.; Lin, Z.; Tainsh, M.; Mikami, M.; Tanaka, T.Y.; Wang, X.; Yoon, S. Dust cycle: An emerging core theme in Earth system science. Aeolian Res. 2011, 2, 181–204. [Google Scholar] [CrossRef]
- Zhang, Z.; Wieland, R.; Reiche, M.; Funk, R.; Hoffmann, C.; Li, Y.; Sommer, M. Wind modelling for wind erosion research by open source computational fluid dynamics. Ecol. Inform. 2011, 6, 316–324. [Google Scholar] [CrossRef]
- Webb, N.P.; Strong, C.L.; Chappell, A.; Marx, S.K.; Mctainsh, G.H. Soil organic carbon enrichment of dust emissions: Magnitude, mechanisms and its implications for the carbon cycle. Earth Surf. Proc. Land. 2013, 38, 1662–1671. [Google Scholar] [CrossRef]
- Tanaka, T.Y.; Chiba, M. A numerical study of the contributions of dust source regions to the global dust budget. Glob. Planet. Chang. 2006, 52, 88–104. [Google Scholar] [CrossRef]
- Neff, J.C.; Ballantyne, A.P.; Farmer, G.L.; Mahowald, N.M.; Conroy, J.L.; Landry, C.C.; Overpeck, J.T.; Painter, T.H.; Lawrence, C.R.; Reynolds, R.L. Increasing eolian dust deposition in the western United States linked to human activity. Nat. Geosci. 2008, 1, 189–195. [Google Scholar] [CrossRef]
- Webb, N.P.; Strong, C.L. Soil erodibility dynamics and its representation for wind erosion and dust emission models. Aeolian Res. 2011, 3, 165–179. [Google Scholar] [CrossRef]
- Stout, J.E.; Zobeck, T.M. The Wolfforth field experiment: A wind erosion study. Soil Sci. 1996, 161, 616–632. [Google Scholar] [CrossRef]
- Field, J.P.; Breshears, D.D.; Whicker, J.J. Toward a more holistic perspective of soil erosion: Why aeolian research needs to explicitly consider fluvial processes and interactions. Aeolian Res. 2009, 1, 9–17. [Google Scholar] [CrossRef]
- Li, J.; Okin, G.S.; Herrick, J.E.; Belnap, J.; Munson, S.M.; Miller, M.E. A simple method to estimate threshold friction velocity of wind erosion in the field. Geophys. Res. Lett. 2010, 37, L10402. [Google Scholar] [CrossRef]
- Jarrah, M.; Mayel, S.; Tatarko, J.; Funk, R.; Kuka, K. A review of wind erosion models: Data requirements, processes, and validity. Catena 2020, 187, 104388. [Google Scholar] [CrossRef]
- Zobeck, T.M. Soil properties affecting wind erosion. J. Soil Water Conserv. 1991, 46, 112–118. [Google Scholar]
- Belnap, J.; Gillette, D.A. Disturbance of biological soil crusts: Impacts on potential wind erodibility of sandy desert soils in southeastern Utah. Land Degrad. Dev. 1997, 8, 355–362. [Google Scholar] [CrossRef]
- Cornelis, W.; Gabriels, D. The effect of surface moisture on the entrainment of dune sand by wind: An evaluation of selected models. Sedimentology 2003, 50, 771–790. [Google Scholar] [CrossRef]
- Hagen, L.J. Evaluation of the Wind Erosion Prediction System (WEPS) erosion submodel on cropland fields. Environ. Modell. Softw. 2004, 19, 171–176. [Google Scholar] [CrossRef]
- Nickovic, S.; Vukovic, A.; Vujadinovic, M.; Djurdjevic, V.; Pejanovic, G. High-resolution mineralogical database of dust-productive soils for atmospheric dust modeling. Atmos. Chem. Phys. 2012, 12, 845–855. [Google Scholar] [CrossRef] [Green Version]
- Journet, E.; Balkanski, Y.; Harrison, S.P. A new data set of soil mineralogy for dust-cycle modeling. Atmos. Chem. Phys. 2014, 14, 3801–3816. [Google Scholar] [CrossRef] [Green Version]
- Perlwitz, J.; Pérez García-Pando, C.; Miller, R. Predicting the mineral composition of dust aerosols—Part 1: Representing key processes. Atmos. Chem. Phys. 2015, 15, 11593–11627. [Google Scholar] [CrossRef] [Green Version]
- Pérez García-Pando, C.; Miller, R.L.; Perlwitz, J.P.; Rodríguez, S.; Prospero, J.M. Predicting the mineral composition of dust aerosols: Insights from elemental composition measured at the Izaa Observatory. Geophys. Res. Lett. 2016, 43, 10520–10529. [Google Scholar] [CrossRef]
- Pi, H.; Sharratt, B.; Feng, G.; Lei, J. Evaluation of two empirical wind erosion models in arid and semi-arid regions of China and the USA. Environ. Modell. Softw. 2017, 91, 28–46. [Google Scholar] [CrossRef] [Green Version]
- Batt, R.G.; Peabody, S.A., II. Threshold friction velocities for large pebble gravel beds. J. Geophys. Res. Atmos. 1999, 104, 24273–24279. [Google Scholar] [CrossRef] [Green Version]
- Marticorena, B.; Bergametti, G.; Gillette, D.; Belnap, J. Factors controlling threshold friction velocity in semiarid and arid areas of the Unite States. J. Geophys. Res. Atmos. 1997, 102, 23277–23287. [Google Scholar] [CrossRef]
- Shao, Y.; Lu, H. A simple expression for wind erosion threshold friction velocity. J. Geophys. Res. Atmos. 2000, 105, 22437–22443. [Google Scholar] [CrossRef]
- Gillette, D.A.; Stockton, P.H. The effect of nonerodible particles on wind erosion of erodible surfaces. J. Geophys. Res. Atmos. 1989, 94, 12885–12893. [Google Scholar] [CrossRef]
- Rice, M.; Mcewan, I.; Mullins, C. A conceptual model of wind erosion of soil surfaces by saltating particles. Earth Surf. Process. Land. 1999, 24, 383–392. [Google Scholar] [CrossRef]
- Okin, G.; Gillette, D.; Herrick, J. Multi-scale controls on and consequences of aeolian processes in landscape change in arid and semi-arid environments. J. Arid Environ. 2006, 65, 253–275. [Google Scholar] [CrossRef]
- Wu, C.; Lin, Z.; He, J.; Zhang, M.; Liu, X.; Zhang, R.; Brown, H. Aprocess-oriented evaluation of dustemission parameterizations in CESM: Simulation of a typical severe duststorm in East Asia. J. Adv. Modeling Earth Syst. 2016, 8, 1432–1452. [Google Scholar] [CrossRef]
- Wu, C.; Lin, Z.; Liu, X.; Li, Y.; Lu, Z.; Wu, M. Can climate models reproduce the decadal change of dust aerosol in East Asia? Geophys. Res. Lett. 2018, 45, 9953–9962. [Google Scholar] [CrossRef]
- Wu, M.; Liu, X.; Zhang, L.; Wu, C.; Lu, Z.; Ma, P.L.; Wang, H.; Tilmes, S.; Mahowald, N.; Matsui, H.; et al. Impacts of aerosol dry deposition on black carbon spatial distributions and radiative effects in the Community Atmosphere Model CAM5. J. Adv. Modeling Earth Syst. 2018, 10, 1150–1171. [Google Scholar] [CrossRef] [Green Version]
- Kok, J.F. A scaling theory for the size distribution of emitted dust aerosols suggests climate models underestimate the size of the global dust cycle. Proc. Natl. Acad. Sci. USA 2021, 108, 1016–1021. [Google Scholar] [CrossRef] [Green Version]
- Kok, J.F.; Adebiyi, A.A.; Albani, S.; Balkanski, Y.; Checa-Garcia, R.; Chin, M.; Colarco, P.R.; Hamilton, D.S.; Huang, Y.; Ito, A.; et al. Contribution of the world’s main dust source regions to the global cycle of desert dust. Atmos. Chem. Phys. 2021, 21, 8169–8193. [Google Scholar] [CrossRef]
- Fryrear, D.; Saleh, A.; Bilbro, J. A single event wind erosion model. Trans. ASAE 1998, 41, 1369. [Google Scholar] [CrossRef]
- Potter, K.; Williams, J.; Larney, F.; Bullock, M. Evaluation of EPIC’s wind erosion submodel using data from southern Alberta. Can. J. Soil Sci. 1998, 78, 485–492. [Google Scholar] [CrossRef]
- Singh, U.B.; Gregory, J.M.; Wilson, G.R. Texas erosion analysis model: Theory and validation. In Proceedings of the Wind Erosion: An International Symposium/Workshop, Manhattan, KS, USA, 3–5 June 1997. [Google Scholar]
- Shao, Y.; Raupach, M.R.; Leys, J.F. A model for predicting aeolian sand drift and dust entrainment on scales from paddock to region. Soil Res. 1996, 34, 309–342. [Google Scholar] [CrossRef] [Green Version]
- Barnum, B.H.; Winstead, N.S.; Wesely, J.; Hakola, A.; Colarco, P.R.; Toon, O.B.; Ginoux, P.; Brooks, G.; Hasselbarth, L.; Toth, B. Forecasting dust storms using the CARMA-dust model and MM5 weather data. Environ. Modell. Softw. 2004, 19, 129–140. [Google Scholar] [CrossRef]
- Butler, H.J.; Shao, Y.; Leys, J.F.; Mctainsh, G. Modelling Wind Erosion at National and Regional Scale Using the CEMSYS Model: National Monitoring and Evaluation Framework, Prepared for the National Land & Water Resources Audit; Technical Report; National Land and Water Resources Audit: Canberra, Australia, 2007.
- LeGrand, S.L.; Polashenski, C.; Letcher, T.W.; Creighton, G.A.; Peckham, S.E.; Cetola, J.D. The AFWA dust emission scheme for the GOCART aerosol model in WRF-Chem v3. 8.1. Geosci. Model Dev. 2019, 12, 131–166. [Google Scholar] [CrossRef] [Green Version]
- Shao, Y.P. Simplification of a dust emission scheme and comparison with data. J. Geophys. Res. Atmos. 2004, 109, D10202. [Google Scholar] [CrossRef] [Green Version]
- Shao, Y.; Ishizuka, M.; Mikami, M.; Leys, J. Parameterization of size-resolved dust emission and validation with measurements. J. Geophys. Res. Atmos. 2011, 116, D08203. [Google Scholar] [CrossRef]
- Webb, N.P.; Mcgowan, H.A.; Phinn, S.R.; Mctainsh, G.H. AUSLEM (AUStralian Land Erodibility Model): A tool for identifying wind erosion hazard in Australia. Geomorphology 2006, 78, 179–200. [Google Scholar] [CrossRef]
- Gillette, D.A.; Passi, R. Modeling dust emission caused by wind erosion. J. Geophys. Res. Atmos. 1988, 93, 14233–14242. [Google Scholar] [CrossRef] [Green Version]
- Gomes, L.; Rajot, J.; Alfaro, S.; Gaudichet, A. Validation of a dust production model from measurements performed in semi-arid agricultural areas of Spain and Niger. Catena 2003, 52, 257–271. [Google Scholar] [CrossRef]
- Ginoux, P.; Chin, M.; Tegen, I.; Prospero, J.M.; Holben, B.; Dubovik, O.; Lin, S.J. Sources and distributions of dust aerosols simulated with the GOCART model. J. Geophys. Res. Atmos. 2001, 106, 20255–20273. [Google Scholar] [CrossRef]
- Shannon, S.; Lunt, D. A new dust cycle model with dynamic vegetation: LPJ-dust version 1.0. Geosci. Model Dev. 2011, 4, 85–105. [Google Scholar] [CrossRef] [Green Version]
- Hagen, L. A wind erosion prediction system to meet user needs. J. Soil Water Conserv. 1991, 46, 106–111. [Google Scholar]
- Flaounas, E.; Kotroni, V.; Lagouvardos, K.; Klose, M.; Flamant, C.; Giannaros, T.M. Sensitivity of the WRF-Chem (V3.6.1) model to different dust emission parametrisation: Assessment in the broader Mediterranean region. Geosci. Model Dev. 2017, 10, 2925–2945. [Google Scholar] [CrossRef] [Green Version]
- Shao, Y.; Yang, Y.; Wang, J.; Song, Z.; Leslie, L.M.; Dong, C.; Zhang, Z.; Lin, Z.; Kanai, Y.; Yabuki, S. Northeast Asian dust storms: Real-time numerical prediction and validation. J. Geophys. Res. Atmos. 2003, 108, 4691. [Google Scholar] [CrossRef] [Green Version]
- Kurosaki, Y.; Mikami, M. Regional difference in the characteristic of dust event in East Asia: Relationship among dust outbreak, surface wind, and land surface condition. J. Meteorol. Soc. Jpn. 2005, 83A, 1–18. [Google Scholar] [CrossRef] [Green Version]
- Koven, C.D.; Fung, I. Identifying global dust source areas using high-resolution land surface form. J. Geophys. Res. Atmos. 2008, 113, D22204. [Google Scholar] [CrossRef] [Green Version]
- Gregorich, E.; Greer, K.; Anderson, D.; Liang, B. Carbon distribution and losses: Erosion and deposition effects. Soil Till. Res. 1998, 47, 291–302. [Google Scholar] [CrossRef]
- Fratini, G.; Santini, M.; Ciccioli, P.; Valentini, R. Evaluation of a wind erosion model in a desert area of northern Asia by eddy covariance. Earth Surf. Proc. Land. 2009, 34, 1743–1757. [Google Scholar] [CrossRef]
- Fryrear, D.; Wassif, M.; Tadrus, S.; Ali, A. Dust measurements in the Egyptian northwest coastal zone. Trans. ASABE 2008, 51, 1255–1262. [Google Scholar] [CrossRef]
- Fan, S.; Moxim, W.; Levy, H. Aeolian input of bioavailable iron to the ocean. Geophys. Res. Lett. 2006, 33, L07602. [Google Scholar] [CrossRef] [Green Version]
- Borrelli, P.; Ballabio, C.; Panagos, P.; Montanarella, L. Wind erosion susceptibility of European soils. Geoderma 2014, 232, 471–478. [Google Scholar] [CrossRef]
- Holben, B.N.; Tanre, D.; Smirnov, A.; Eck, T.; Slutsker, I.; Abuhassan, N.; Newcomb, W.; Schafer, J.; Chatenet, B.; Lavenu, F. An emerging ground-based aerosol climatology: Aerosol optical depth from AERONET. J. Geophys. Res. Atmos. 2001, 106, 12067–12097. [Google Scholar] [CrossRef]
- Zhao, A.; Ryder, C.; Wilcox, L. How well do the CMIP6 models simulate dust aerosols? Atmos. Chem. Phys. Discuss. 2021. [Google Scholar] [CrossRef]
- Luo, C.; Mahowald, N.M.; Del Corral, J. Sensitivity study of meteorological parameters on mineral aerosol mobilization, transport, and distribution. J. Geophys. Res. Atmos. 2003, 108, 4447. [Google Scholar] [CrossRef] [Green Version]
- Werner, M.; Tegen, I.; Harrison, S.; Kohfeld, K.; Prentice, I.; Balkanski, Y.; Rodhe, H.; Roelandt, C. Seasonal and interannual variability of the mineral dust cycle under present and glacial climate conditions. J. Geophys. Res. Atmos. 2002, 107, 4744. [Google Scholar] [CrossRef] [Green Version]
- Miller, R.; Tegen, I.; Perlwitz, J. Surface radiative forcing by soil dust aerosols and the hydrologic cycle. J. Geophys. Res. Atmos. 2004, 109, D04203. [Google Scholar] [CrossRef]
- Duce, R.A.; Tindale, N.W. Atmospheric transport of iron and its deposition in the ocean. Limnol. Oceanogr. 1991, 36, 1715–1726. [Google Scholar] [CrossRef]
- Prospero, J.M. The atmospheric transport of particles to the ocean. Part. Ocean 1996, 57, 19–52. [Google Scholar]
- Takemura, T.; Okamoto, H.; Maruyama, Y.; Numaguti, A.; Higurashi, A.; Nakajima, T. Global three-dimensional simulation of aerosol optical thickness distribution of various origins. J. Geophys. Res. Atmos. 2000, 105, 17853–17873. [Google Scholar] [CrossRef]
- Chin, M.; Ginoux, P.; Kinne, S.; Torres, O.; Holben, B.N.; Duncan, B.N.; Martin, R.V.; Logan, J.A.; Higurashi, A.; Nakajima, T. Tropospheric aerosol optical thickness from the GOCART model and comparisons with satellite and Sun photometer measurements. J. Atmos. Sci. 2002, 59, 461–483. [Google Scholar] [CrossRef]
- Tegen, I.; Harrison, S.P.; Kohfeld, K.; Prentice, I.C.; Coe, M.; Heimann, M. Impact of vegetation and preferential source areas on global dust aerosol: Results from a model study. J. Geophys. Res. Atmos. 2002, 107, 4576. [Google Scholar] [CrossRef] [Green Version]
- Aryal, Y.N.; Evans, S. Global dust variability explained by drought sensitivity in CMIP6 models. J. Geophys. Res. Earth 2021, 126, e2021JF006073. [Google Scholar] [CrossRef]
- Checa-Garcia, R.; Balkanski, Y.; Albani, S.; Bergman, T.; Carslaw, K.; Cozic, A.; Dearden, C.; Marticorena, B.; Michou, M.; van Noije, T.; et al. Evaluation of natural aerosols in CRESCENDO Earth system models (ESMs): Mineral dust. Atmos. Chem. Phys. 2021, 21, 10295–10335. [Google Scholar] [CrossRef]
- Mahowald, N.M.; Baker, A.R.; Bergametti, G.; Brooks, N.; Duce, R.A.; Jickells, T.D.; Kubilay, N.; Prospero, J.M.; Tegen, I. Atmospheric global dust cycle and iron inputs to the ocean. Glob. Biogeochem. Cycles 2005, 19, GB4025. [Google Scholar] [CrossRef]
- Yan, H.; Wang, S.; Wang, C.; Zhang, G.; Patel, N. Losses of soil organic carbon under wind erosion in China. Glob. Chang. Biol. 2005, 11, 828–840. [Google Scholar] [CrossRef]
- Chappell, A.; Webb, N.; Leys, J.; Waters, C.; Orgill, S.; Eyres, M. Minimising soil organic carbon erosion by wind is critical for land degradation neutrality. Environ. Sci. Policy 2019, 93, 43–52. [Google Scholar] [CrossRef]
- Pimentel, D.; Kounang, N. Ecology of soil erosion in ecosystems. Ecosystems 1998, 1, 416–426. [Google Scholar] [CrossRef]
- Lobe, I.; Amelung, W.; Du Preez, C.C. Losses of carbon and nitrogen with prolonged arable cropping from sandy soils of the South African Highveld. Eur. J. Soil Sci. 2001, 52, 93–101. [Google Scholar] [CrossRef]
- Van Oost, K.; Quine, T.; Govers, G.; De Gryze, S.; Six, J.; Harden, J.; Ritchie, J.; Mccarty, G.; Heckrath, G.; Kosmas, C. The impact of agricultural soil erosion on the global carbon cycle. Science 2007, 318, 626–629. [Google Scholar] [CrossRef]
- Yang, Y.; Fang, J.; Ji, C.; Ma, W.; Mohammat, A.; Wang, S.; Wang, S.; Datta, A.; Robinson, D.; Smith, P. Widespread decreases in topsoil inorganic carbon stocks across China’s grasslands during 1980s–2000s. Glob. Chang. Biol. 2012, 18, 3672–3680. [Google Scholar] [CrossRef]
- Duan, K.; Caldwell, P.V.; Sun, G.; Mcnulty, S.G.; Zhang, Y.; Shuster, E.; Liu, B.; Bolstad, P.V. Understanding the role of regional water connectivity in mitigating climate change impacts on surface water supply stress in the United States. J. Hydrol. 2019, 570, 80–95. [Google Scholar] [CrossRef]
- Du, H.; Li, S.; Webb, N.; Zuo, X.; Liu, X. Soil organic carbon (SOC) enrichment in aeolian sediments and SOC loss by dust emission in the desert steppe, China. Sci. Total Environ. 2021, 798, 149189. [Google Scholar] [CrossRef] [PubMed]
- Ren, Z.; Zheng, H.; He, X.; Zhang, D.; Shen, G.; Zhai, C. Changes in spatio-temporal patterns of urban forest and its above-ground carbon storage: Implication for urban CO2 emissions mitigation under China’s rapid urban expansion and greening. Environ. Int. 2019, 129, 438–450. [Google Scholar] [CrossRef] [PubMed]
- Lal, R. Accelerated Soil erosion as a source of atmospheric CO2. Soil Till Res. 2019, 188, 35–40. [Google Scholar] [CrossRef]
- Du, H.; Wang, T.; Xue, X.; Li, S. Estimation of soil organic carbon, nitrogen, and phosphorus losses induced by wind erosion in Northern China. Land Degrad. Dev. 2019, 30, 1006–1022. [Google Scholar] [CrossRef]
- Lei, L.; Zhang, K.; Zhang, X.; Wang, Y.; Xia, J.; Piao, S.; Hui, D.; Zhong, M.; Ru, J.; Zhou, Z.; et al. Plant feedback aggravates soil organic carbon loss associated with wind erosion in Northwest China. J. Geophys. Res. Biogeosci. 2019, 124, 825–839. [Google Scholar] [CrossRef]
- Zou, X.; Zhang, Z.; Zhou, Z.; Qiu, Q.; Luo, J. Landscape-scale spatial variability of soil organic carbon content in a temperate grassland: Insights into the role of wind erosion. Catena 2021, 207, 105635. [Google Scholar] [CrossRef]
- Webb, N.P.; Gowan, M.; Phinn, S.R.; Leys, J.F.; Tainsh, M. A model to predict land susceptibility to wind erosion in western Queensland, Australia. Environ. Modell. Softw. 2009, 24, 214–227. [Google Scholar] [CrossRef]
- Dlugoss, V.; Fiener, P.; Van Oost, K.; Schneider, K. Model based analysis of lateral and vertical soil carbon fluxes induced by soil redistribution processes in a small agricultural catchment. Earth Surf. Proc. Land. 2012, 37, 193–208. [Google Scholar] [CrossRef]
- Harper, R.; Gilkes, R.; Hill, M.; Carter, D. Wind erosion and soil carbon dynamics in south-western Australia. Aeolian Res. 2010, 1, 129–141. [Google Scholar] [CrossRef]
- Óskarsson, H.; Arnalds, Ó.; Gudmundsson, J.; Gudbergsson, G. Organic carbon in Icelandic Andosols: Geographical variation and impact of erosion. Catena 2004, 56, 225–238. [Google Scholar] [CrossRef]
- Van Oost, K.; Verstraeten, G.; Doetterl, S.; Notebaert, B.; Wiaux, F.; Broothaerts, N.; Six, J. Legacy of human-induced C erosion and burial on soil–atmosphere C exchange. Proc. Natl. Acad. Sci. USA 2012, 109, 19492–19497. [Google Scholar] [CrossRef] [Green Version]
- Su, Y.Z.; Zhao, W.Z. Soil organic carbon dynamics: Wind erosion effect. Acta Ecol. Sin. 2005, 25, 2049–2054. [Google Scholar]
- Mahowald, N.; Albani, S.; Kok, J.F.; Engelstaeder, S.; Scanza, R.; Ward, D.S.; Flanner, M.G. The size distribution of desert dust aerosols and its impact on the Earth system. Aeolian Res. 2014, 15, 53–71. [Google Scholar] [CrossRef] [Green Version]
- Li, X.; Song, H.; Zhai, S.; Lu, S.; Kong, Y.; Xia, H.; Zhao, H. Particulate matter pollution in Chinese cities: Areal-temporal variations and their relationships with meteorological conditions (2015–2017). Environ. Pollut. 2018, 246, 11–18. [Google Scholar] [CrossRef]
- Li, P.; Liu, L.; Wang, J.; Wang, Z.; Wang, X.; Bai, Y.; Chen, S. Wind erosion enhanced by land use changes significantly reduces ecosystem carbon storage and carbon sequestration potentials in semiarid grasslands. Land Degrad. Dev. 2018, 29, 3469–3478. [Google Scholar] [CrossRef]
- Ward, D.S.; Mahowald, N.M.; Kloster, S. Potential climate forcing of land use and land cover change. Atmos. Chem. Phys. 2014, 14, 12701–12724. [Google Scholar] [CrossRef] [Green Version]
- Ginoux, P.; Prospero, J.M.; Gill, T.E.; Hsu, N.C.; Zhao, M. Global-scale attribution of anthropogenic and natural dust sources and their emission rates based on MODIS Deep Blue aerosol products. Rev. Geophys. 2012, 50, 1–36. [Google Scholar] [CrossRef]
- Li, Z.; Wang, Y.; Guo, J.; Zhao, C.; Cribb, M.; Dong, X.; Fan, J.; Gong, D.; Huang, J.; Jiang, M.; et al. East Asian Study of Tropospheric Aerosols and their Impact on Regional Clouds, Precipitation, and Climate (EAST-AIRCPC). J. Geophys. Res.-Atmos. 2019, 124, 13026–13054. [Google Scholar] [CrossRef] [Green Version]
- Chen, S.; Jiang, N.; Huang, J.; Xu, X.; Zhang, H.; Zang, Z.; Huang, K.; Xu, X.; Wei, Y.; Guan, X. Quantifying contributions of natural and anthropogenic dust emission from different climatic regions. Atmos. Environ. 2018, 191, 94–104. [Google Scholar] [CrossRef]
- Chen, S.; Jiang, N.; Huang, J.; Zang, Z.; Guan, X.; Ma, X.; Luo, Y.; Li, J.; Zhang, X.; Zhang, Y. Estimations of indirect and direct anthropogenic dust emission at the global scale. Atmos. Environ. 2019, 200, 50–60. [Google Scholar] [CrossRef]
- Chen, S.; Huang, J.; Qian, Y.; Zhao, C.; Kang, L.; Yang, B.; Wang, Y.; Liu, Y.; Yuan, T.; Wang, T.; et al. An overview of mineral dust modeling over East Asia. J. Meteorol. Res. 2017, 31, 633–653. [Google Scholar] [CrossRef]
- Mahowald, N.; Lindsay, K.; Rothenberg, D.; Doney, S.C.; Moore, J.K.; Thornton, P.; Randerson, J.T.; Jones, C.D. Desert dust and anthropogenic aerosol interactions in the Community Climate System Model coupled-carbon-climate model. Biogeosciences 2011, 8, 387–414. [Google Scholar] [CrossRef] [Green Version]
- Mahowald, N.M.; Scanza, R.; Brahney, J.; Goodale, C.L.; Hess, P.G.; Moore, J.K.; Neff, J.C. Aerosol deposition impacts on land and ocean carbon cycles. Curr. Clim. Chang. Rep. 2017, 3, 16–31. [Google Scholar] [CrossRef] [Green Version]


| Reference | Model Name | Category | Spatial Scale | Input Data | Output Data |
|---|---|---|---|---|---|
| [92] | DENAPAP | Emission | R | Soil roughness, probability density function for wind speed, threshold wind velocity, field length | Dust emissions |
| [38] | WEQ | Emission | F | Soil surface, ridges, surface roughness, climate, field length, wind, vegetation cover | Soil loss rates |
| [39] | WEPS | Emission | F | Weather conditions, soils properties, management, management decisions, threshold wind velocity | Soil loss rates |
| [85] | WEAM | Emission | F | Climate, soil types, vegetation cover | Dust emissions, dust depositions |
| [84] | TEAM | Emission | F | Wind, relative humidity, clay content, particle size distribution, surface cover factor, soil erodibility, soil bulk density, length of the erosion segments | Soil loss rate, dust concentration, dust emission, dust deposition |
| [82] | RWEQ | Emission | F | Weather factor, percentage dry aggregation, soil crust factor, soil roughness, vegetation cover | Dust emissions, dust depositions |
| [83] | WESS | Emission | F | Wind, soil surface, ridge height | Dust emission, dust deposition |
| [40] | IWEMS | Transport | R | Soil properties (strength, fine content, bulk density, particle size distribution), surface characteristics (land use, frontal area index, vegetation height), climate (rainfall, evaporation, wind velocity) | Dust emissions, dust trajectories |
| [41] | WEELS | Emission | R | Soil moisture, soil erodibility, soil surface roughness, land use | Wind erosion risk |
| [42] | DEAD | Transport | C, G | Vegetation cover, surface soil moisture, soil texture, threshold wind velocity, particle size distributions, optical properties, land surface and geographic constraints | Dust emissions, dry depositions, wet depositions |
| [93] | DPM | Emission | C, G | Soil particle size distribution, surface roughness, threshold wind velocity | Dust emissions |
| [86] | CARMA-Dust | Transport | C, G | MM5 forecast data | Dust concentrations |
| [91] | AUSLEM | Emission | R | Rainfall, soil moisture, evaporation, vegetation cover, percentage of sand, silt and clay in topsoil | Wind erosion hazards |
| [87] | CEMSYS | Transport | R, C | Soil texture, soil type, vegetation, roughness, soil moisture, land surface, atmospheric data | Soil losses, dust concentrations |
| [43] | GMOD | Transport | C, G | Meteorological conditions, wind friction speed, relative humidity of the surface air, threshold wind velocity, densities of mineral dust and dry air, effective radius of the particles | Dust concentrations, dust depositions, dust optical thickness, particle size distributions |
| [53] | CFD-WEM | Transport | R | Digital elevation model (DEM), surface roughness length, land uses, threshold wind velocities | Sensitive areas to wind erosion |
| [95] | LPJ-dust | Transport | C, G | Vegetation cover, soil texture, soil moisture, snow depth, threshold wind velocity, temperature, wind speed | Dust sources, dust emissions, dust trajectories, dust depositions |
| Model Name | Validation Region | Observed Parameter | R Square (R2) | References |
|---|---|---|---|---|
| WEQ | Argentina | Average annual soil loss | R2 = 0.96 | [8] |
| WEAM | Inner Mongolia, China Wind tunnel Experiments at Loxton and Borrika, Australia | Vertical dust flux Saltation flux | R2 = 0.87 R2 = 0.66 | [102] [85] |
| TEAM | U.S.A. | Horizontal dust flux | R2 = 0.71 to 0.82 | [6] |
| RWEQ | Argentina Egypt China and U.S.A. | Saltation flux Saltation flux Saltation flux | R2 = 0.96 R2 = 0.91 R2 = 0.02 to 0.81 | [8] [103] [70] |
| WEPS | U.S.A. | Amount of suspended material | R2 = 0.71 | [65] |
| DPM | Mu Us Desert, China | Saltation flux | R2 = 0.83 | [104] |
| WEELS | 25 member states of the European Union | Wind-erodible fraction of the soil | R2 = 0.50 | [105] |
| Shao dust scheme | Japan–Australia Dust Experiment (JADE) | Vertical dust flux | R2 = 0.89 | [89,90] |
| Reference | Research Period | Reference | Research Period |
|---|---|---|---|
| [111] | 1981–1989 | [110] | 31 years |
| [112] | 1981–1990s | [18] | 1980–1990 |
| [94] | 1987–1997 | [55] | 1990–1995 |
| [113] | 1990 | [43] | 20 years |
| [114] | 1990, 1996, 1997 | [13] | 1996–2006 |
| [115] | 1982–1993 | [14] | 1960–2018 |
| [109] | 1979–1988 | [116] | 1950–2014 |
| [108] | 1979–2000 | [117] | 2000–2014 |
| [42] | 1990–1999 | [80] | 2004–2008 |
| [33] | 1981–1996 |
| Region | Min-Max Dust Emission (t ha−1 yr−1) | SOC Erosion Flux (t C ha−1 yr−1) | Wind Eroded Area (×106 ha) | Total SOC Erosion (Tg C yr−1) | Oxidation at 20% SOC Erosion (Tg C yr−1) |
|---|---|---|---|---|---|
| Africa | 2.8–7.7 | 0.06–0.16 | 186 | 11.1–29.1 | 9–23 |
| Asia | 1.2–2.6 | 0.03–0.06 | 222 | 5.7–12.3 | 5–10 |
| South America | 0.8–1.3 | 0.02–0.03 | 42 | 0.8–1.2 | 1–1 |
| North America | 0.1–1.5 | 0.00–0.03 | 35 | 0.1–1.2 | 0–1 |
| Europe | 0 | 0 | 42 | 0 | 0–0 |
| Oceania | 2.3–9.3 | 0.05–0.19 | 16 | 0.8–3.0 | 1–2 |
| Global | 1.6–4.2 | 0.03–0.09 | 543 | 18.6–47.4 | 15–38 |
Publisher’s Note: MDPI stays neutral with regard to jurisdictional claims in published maps and institutional affiliations. |
© 2022 by the authors. Licensee MDPI, Basel, Switzerland. This article is an open access article distributed under the terms and conditions of the Creative Commons Attribution (CC BY) license (https://creativecommons.org/licenses/by/4.0/).
Share and Cite
Chen, W.; Meng, H.; Song, H.; Zheng, H. Progress in Dust Modelling, Global Dust Budgets, and Soil Organic Carbon Dynamics. Land 2022, 11, 176. https://doi.org/10.3390/land11020176
Chen W, Meng H, Song H, Zheng H. Progress in Dust Modelling, Global Dust Budgets, and Soil Organic Carbon Dynamics. Land. 2022; 11(2):176. https://doi.org/10.3390/land11020176
Chicago/Turabian StyleChen, Weixiao, Huan Meng, Hongquan Song, and Hui Zheng. 2022. "Progress in Dust Modelling, Global Dust Budgets, and Soil Organic Carbon Dynamics" Land 11, no. 2: 176. https://doi.org/10.3390/land11020176