Article

Quantification of Ecosystem-Scale Methane Sinks Observed in a Tropical Rainforest in Hainan, China

1
Center for Ecological Forecasting and Global Change, College of Forestry, Northwest A&F University, Xianyang 712100, China
2
Faculty of Architecture and Urban Planning, Chongqing University, Chongqing 400045, China
3
Chengdu Institute of Biology, Chinese Academy of Sciences, Chengdu 610041, China
4
College of Hydrology and Water Resources, Hohai University, Nanjing 210098, China
5
School of Life Science and Engineering, Southwest University of Science and Technology, Mianyang 621010, China
6
Jianfengling National Key Field Observation and Research Station for Forest Ecosystem, Research Institute of Tropical Forestry, Chinese Academy of Forestry, Guangzhou 510520, China
7
Department of Biology Sciences, Institute of Environment Sciences, University of Quebec at Montreal, C.P. 8888, Succ. Centre-Ville, Montreal, QC H3C 3P8, Canada
*
Author to whom correspondence should be addressed.
Land 2022, 11(2), 154; https://doi.org/10.3390/land11020154
Submission received: 28 November 2021 / Revised: 13 January 2022 / Accepted: 15 January 2022 / Published: 19 January 2022

Abstract

:
Tropical rainforest ecosystems are important when considering the global methane (CH4) budget and in climate change mitigation. However, there is a lack of direct and year-round observations of ecosystem-scale CH4 fluxes from tropical rainforest ecosystems. In this study, we examined the temporal variations in CH4 flux at the ecosystem scale and its annual budget and environmental controlling factors in a tropical rainforest of Hainan Island, China, using 3 years of continuous eddy covariance measurements from 2016 to 2018. Our results show that CH4 uptake generally occurred in this tropical rainforest, where strong CH4 uptake occurred in the daytime, and a weak CH4 uptake occurred at night with a mean daily CH4 flux of −4.5 nmol m−2 s−1. In this rainforest, the mean annual budget of CH4 for the 3 years was −1260 mg CH4 m−2 year−1. Furthermore, the daily averaged CH4 flux was not distinctly different between the dry season and wet season. Sixty-nine percent of the total variance in the daily CH4 flux could be explained by the artificial neural network (ANN) model, with a combination of air temperature (Tair), latent heat flux (LE), soil volumetric water content (VWC), atmospheric pressure (Pa), and soil temperature at −10 cm (Tsoil), although the linear correlation between the daily CH4 flux and any of these individual variables was relatively low. This indicates that CH4 uptake in tropical rainforests is controlled by multiple environmental factors and that their relationships are nonlinear. Our findings also suggest that tropical rainforests in China acted as a CH4 sink during 2016–2018, helping to counteract global warming.

1. Introduction

Atmospheric methane (CH4) is an important greenhouse gas with global warming potential (GWP) 28−32 times that of carbon dioxide (CO2) over a century [1,2,3] and accounts for approximately 20% of global radiative forcing [4,5]. The global atmospheric CH4 concentration has consistently increased and was approximately 2.6 times higher in 2018 compared to its recorded preindustrial equilibrium value in 1750 [6]. Atmospheric CH4 has a short lifetime (approximately 9 years; [7]); hence, a reduction in CH4 emissions or a rise in CH4 uptake would rapidly lead to a decrease in its atmospheric concentration and radiative forcing in a few decades. Therefore, a reduction in CH4 emissions or an increase in CH4 uptake is recognized as an effective option for mitigating global warming, especially on decadal timescales [6,8]. Although major CH4 sources (e.g., rice cultivation, biomass burning, wetland emissions) and CH4 sinks (e.g., oxidation by hydroxyl radicals (OH) in the troposphere and oxidation by methanotrophic bacteria in aerated soils) have been identified [9,10,11,12], research on the CH4 sink (uptake) by upland forests is lacking, and the quantification of the CH4 budget of upland ecosystems is still limited by large uncertainties [4,6,9,13].
Forests with ~30% of the land surface coverage store ~45% of terrestrial carbon and play an important role in regulating and mitigating global warming [14,15]. Upland forest soils are recognized as potential CH4 sinks [6,16,17]. However, trees may produce and emit CH4, especially in wet and warm climates [18], and forest soil CH4 uptake may decrease when rainfall increases [19]. Any sink-to-source transition in tropical forest ecosystems could have a significant impact on the global CH4 budget. The warm temperatures and moist soils of tropical forests support high rates of carbon (C) cycling [14,20]. Tropical forests account for ~55% of the global net carbon sink in forests but have unknown contributions to the global forest CH4 budget [14,15]. It is unclear whether upland tropical rainforest soils are potential sinks or sources in the global atmospheric CH4 budget [6]. Therefore, it is important to understand CH4 dynamics and the mechanisms of CH4 variations in tropical forest ecosystems. In recent decades, studies in tropical mountain forests have only been reported using static chambers [21,22]. Previous studies of CH4 dynamics measured by the eddy covariance (EC) technique have only been reported in tropical swamp forests or tropical peatland forests [23,24]. Thus, there is still a lack of direct and quasi-continuous measurements of CH4 dynamics over the ecosystem scale in tropical mountain forests [6,25].
Previous studies have indicated that CH4 emissions and uptake are controlled by multiple factors, including soil water content [19,26,27], soil temperature [28,29,30], soil nutrients [31,32,33], natural disturbances [34,35,36], and forest management practices [37,38]. CH4 emission and uptake are mainly affected by two microbial processes. Methanogenesis is typically carried out by methanogens [39], and CH4 oxidation is the only known biological process that is based on methanotrophic processes in natural ecosystems [40,41]. Both methanogens and methanotrophs are regulated by soil water content and soil temperature. Soil water content can influence the diffusion rate of oxygen to the oxidation zone [42,43]. In addition, a higher soil water content can be beneficial to methanogens and reduce methanotroph activity [44,45,46]. High soil temperature increases the activity of methanogens, the activity of methanogenic substrates (acetyl-producing bacteria or hydrogen-producing bacteria), and plant metabolism, therefore promoting the production and emission of CH4 [47,48]. High soil temperature also enhances methanotroph activity, further increasing CH4 uptake. Methanotrophs seem to be less sensitive to soil temperature and have a wider tolerance than methanogens [49,50]. Growing studies on CH4 dynamics in forest ecosystems indicate that there are far more complex biogeochemical environments and soil processes, which makes a rigorous understanding of the forest CH4 balance difficult. Improvements in understanding forest ecosystem CH4 dynamics require a new focus on the complex interaction between productive and consumptive processes occurring from the subsurface ground to the top of the canopy at the ecosystem scale [51]. Many previous studies on forest CH4 fluxes were measured using the static chamber method [21,22,52]. However, the static chamber method focuses on CH4 exchange across the soil–atmosphere interface with a small spatial scale (from cm−2 to m−2) and a low sampling frequency (from weekly to monthly). These localized soil flux measurements are difficult to scale up due to their high spatial and temporal variability. The state-of-the-art eddy covariance (EC) technique provides a long-term and quasi-continuous quantification of greenhouse gas fluxes (e.g., CO2 and CH4) over the ecosystem scale [53]. The EC technique can account for all potential CH4 flux pathways and integrated flux contributions from multiple ecosystem components within the footprint area [54,55]. Currently, the EC technique has been applied worldwide in various types of ecosystems with CH4 flux measurements from 200 sites [23,24,56]. However, to date, there are no studies of CH4 flux dynamics using the EC technique in tropical rainforests.
For the first time, we observed and analyzed 3 years of EC measurements of CH4 fluxes from a tropical mountain forest in Hainan Province, China. The main objectives of this study were to (1) characterize the temporal variations in the CH4 flux from the tropical mountain rainforest; (2) quantify the annual CH4 flux budget; and (3) explore the key environmental drivers of tropical forest CH4 fluxes at the ecosystem scale.

2. Materials and Methods

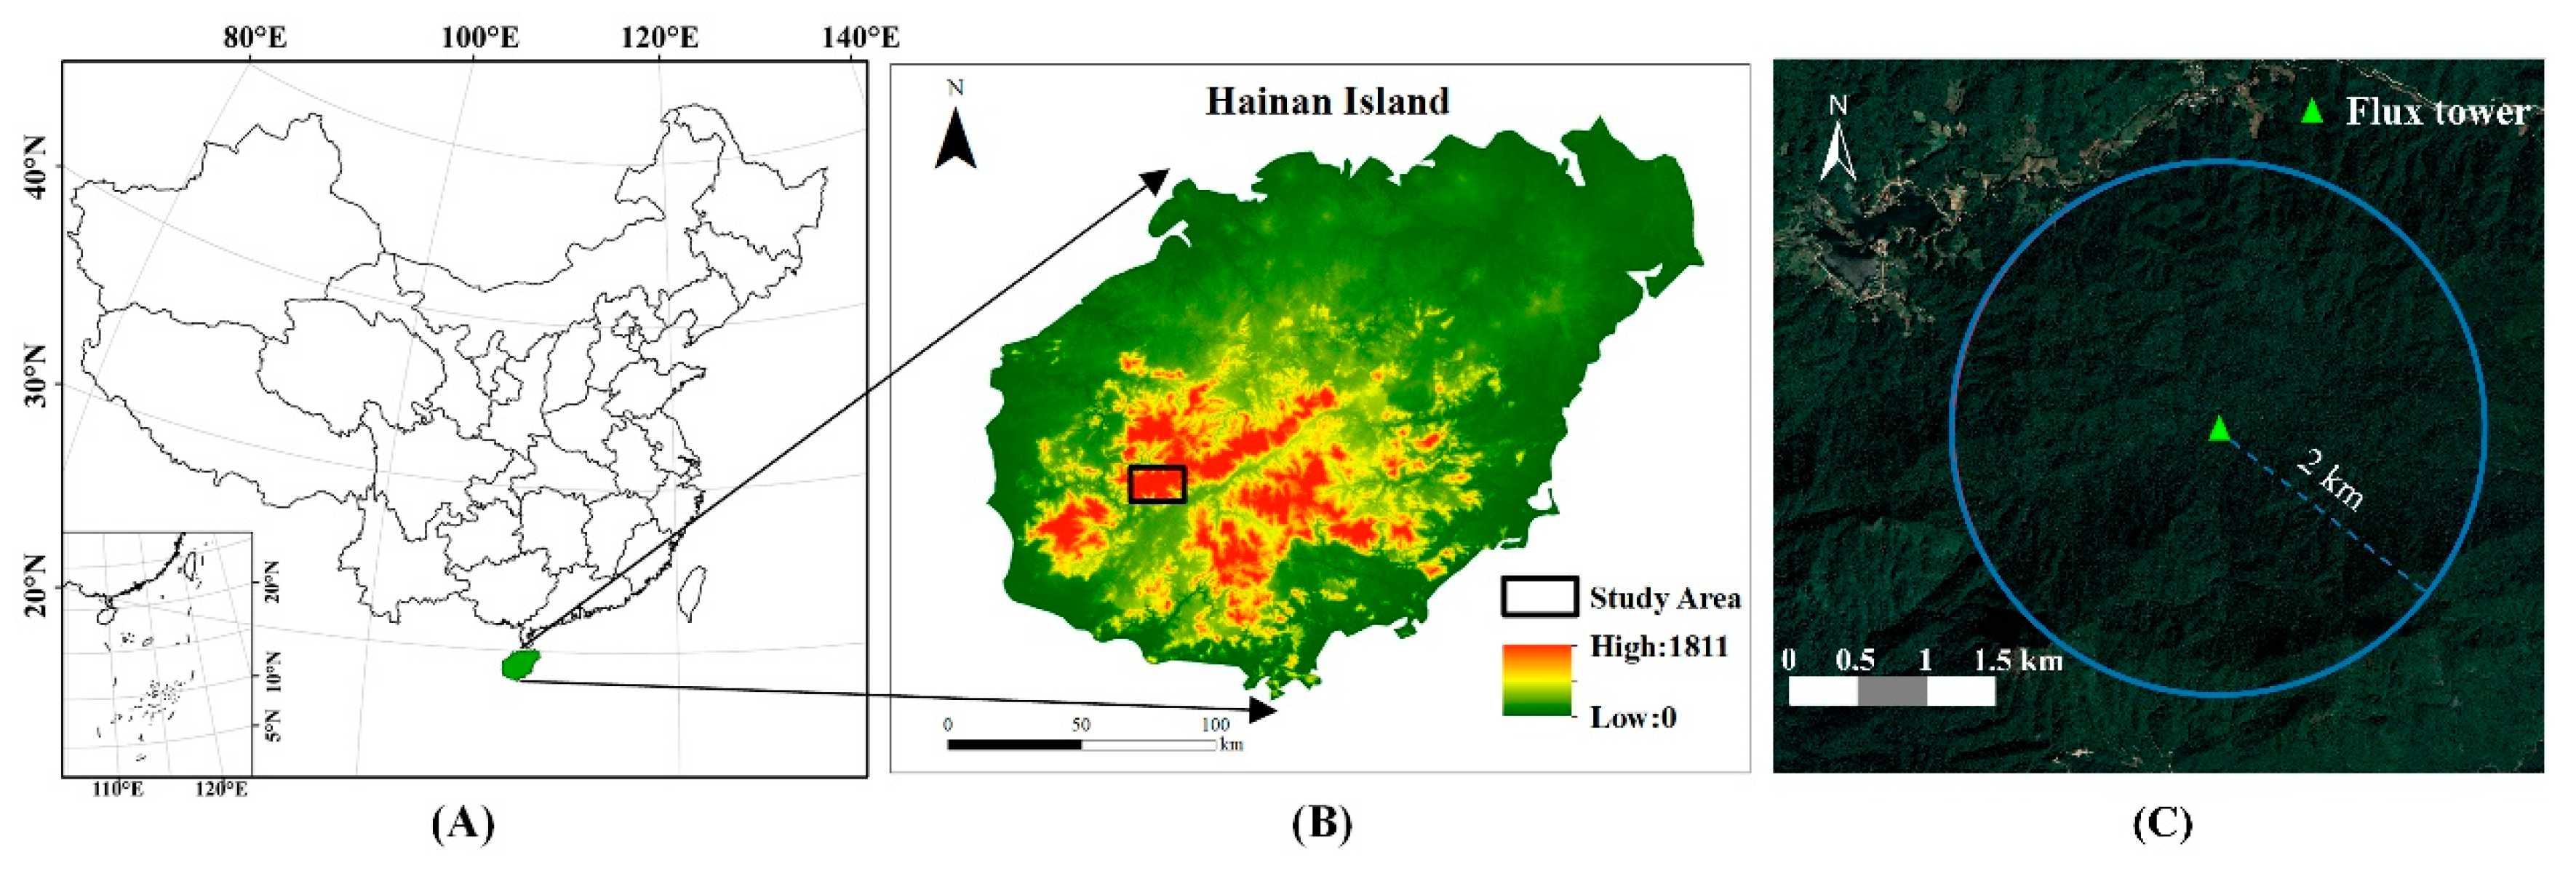
2.1. Site Description

This study was conducted in the Jianfengling National Natural Reserve (JFL) (18°23′–18°50′ N, 108°36′–109°05′ E) in the southwestern part of Hainan Island, Hainan Province, China (Figure 1). The reserve is influenced by a tropical monsoonal climate with distinct wet seasons (May–October) and dry seasons (November–April). The annual mean temperature and total precipitation (1980–2006) were 19.8 °C and 2449 mm, respectively. The precipitation comes mainly from typhoons, thunderstorms, and topographic rain. Approximately 80–90% of the annual precipitation falls during the wet season [57]. The total area of the reserve is approximately 470 km2, of which approximately 150 km2 is covered by mountain rainforest. The altitude of the study site is approximately 900 m. The dominant species around the site are Gironniera subaequalis, Mallotus hookerianus, Cyclobalanopsis patelliformis, and Cryptocarya chinensis. The mean height of the rainforest canopy is 25 m.

2.2. Flux and Ancillary Measurements

The EC technique was used to measure the ecosystem-scale CH4 flux from January 2016 to December 2018. The EC system was installed in a relatively flat region. The EC system included an open-path CH4 infrared gas analyzer (LI-7700, LI-COR Biosciences, Lincoln, NE, USA), an open-path CO2/H2O infrared gas analyzer (LI-7500A, LI-COR), and a three-dimensional sonic anemometer (CAST3, Campbell Sci., Inc., Logan, UT, USA (CSI)). These sensors were placed at a height of 45 m above the soil surface. All the measured raw data were recorded at a frequency of 10 Hz and stored by a data logger (LI-7550, LI-COR).
The environmental factors were measured by their related sensors, including air temperature (Tair, measured by LI-7700, LI-COR), soil temperature at 10 cm depth (Tsoil, measured by Hobo data loggers, S-THB-M002, Onset Computer Corporation, Pocasset, MA, USA), soil volumetric water content at 10 cm depth (VWC, measured by Hobo data loggers, S-SMC-M005, Onset Computer Corporation), precipitation (measured by TE525MM, Campbell Scientific Instruments, Logan, UT, USA), and atmospheric pressure (Pa, measured by LI-7700, LI-COR).

2.3. Data Processing

The CH4 flux in 30 min block averages was calculated using EddyPro software (version 6.2.0, LI-COR Biosciences, Lincoln, NE, USA). We set several advanced settings during data processing. A double rotation of axis rotation was used for tilt correction. The block average method was chosen for the detrending method [58]. The default covariance maximization was used for time lag detection [59]. A compensation of density fluctuations (WPL terms) was also implemented [60]. Additionally, the despiking of raw data [61] and steady-state and turbulent conditions [62] were used for quality control and flux correction.
After data processing by EddyPro, we further controlled the quality of the data. Data within the ±15° of the CAST-3 were rejected to avoid the influence of the CAST-3 instrument on turbulence. Data recorded during the periods of rainfall were also discarded. Data were retained only when the relative signal strength indicator (RSSI) was >10, which indicated a good condition of the optical path [63]. Furthermore, a threshold of friction velocity (u*) of 0.18 < u* < 2 m s−1 was determined to ensure well-developed atmospheric mixing conditions in analysis [64]. The quality of the CH4 flux data was classified by the quality flags of “0”, “1”, and “2”, which represent high-quality CH4 flux data, intermediate-quality CH4 flux data, and poor-quality CH4 flux data, respectively [62]. Data with quality flags of “2” generally occurred when data intervals were produced in high-frequency data recording durations. To get a credible relationship between CH4 flux and environmental variables, only data with quality flags of “0” were used for further analysis. After the quality control of the CH4 flux data, 25.57% of the raw half-hourly CH4 flux data remained for further analysis.

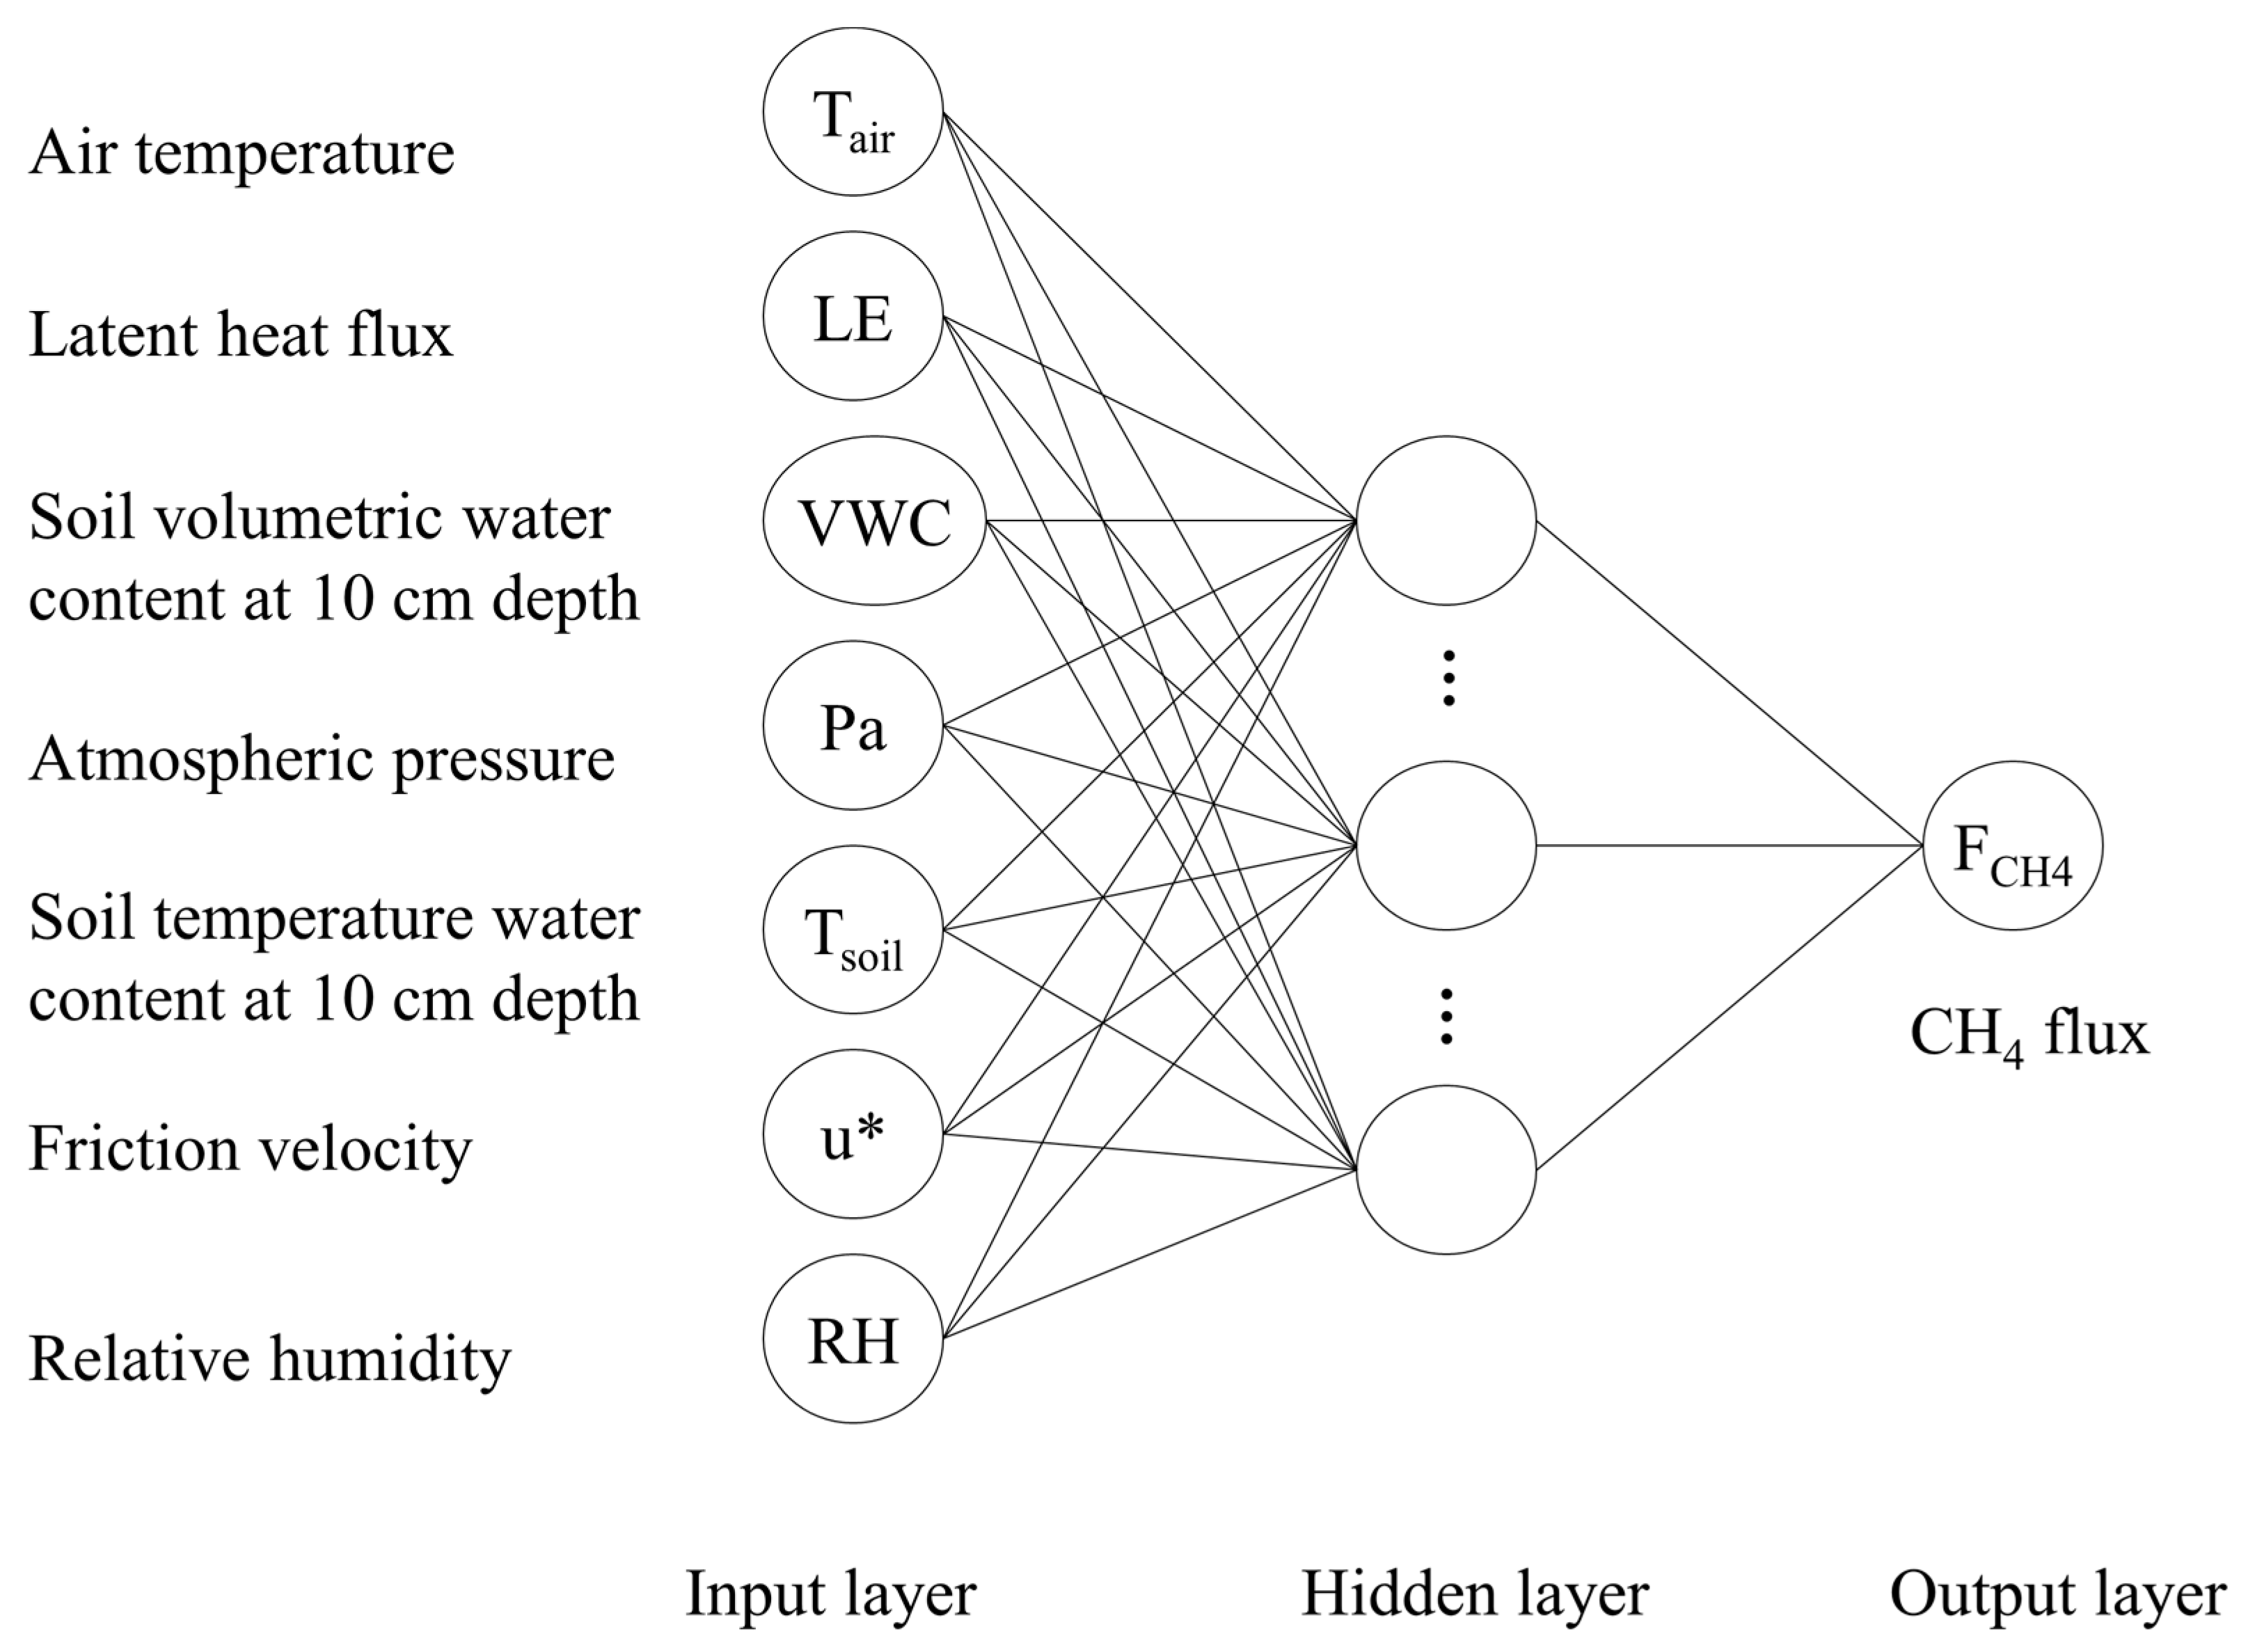
2.4. Gap Filling of CH4 Flux

To estimate the CH4 flux budget, the random forest (RF) method was used to fill in the gap among the half-hourly averaged CH4 flux time series. The RF approach has been tested for eddy flux gap filling at many sites globally, and it outperformed other techniques for all sites and all gap conditions [65]. Thus, we used the RF for gap filling exactly following Kim et al. (2020) [65]. The variables as potential relative factors of the CH4 flux used to train the RF included air temperature (Tair), soil temperature at 10 cm depth (Tsoil), soil volumetric water content at 10 cm depth (VWC), net ecosystem exchange (NEE), latent heat flux (LE), sensible heat flux (H), vapor pressure deficit (VPD), relative humidity (RH), precipitation, and friction velocity (u*). The RF gap filling of CH4 in our study also showed good performance with R2 = 0.78.
The uncertainties of the annual CH4 flux budget were estimated, including the random uncertainty of the CH4 flux and the uncertainty of CH4 flux gap filling. The random uncertainty of each half-hourly CH4 flux was estimated through the empirical models described by [66] during EddyPro processing. The uncertainty of gap filling for the CH4 flux was also estimated when interpolating the missing data [65].

2.5. Data Analysis

The relationship between CH4 flux and environmental variables was complex and different over various ecosystems. We carried out both traditional stepwise linear regression and artificial neural network (ANN) to test which method was suitable for exploring the relationship between CH4 flux and environmental variables in this tropical rainforest ecosystem. For both stepwise regression and ANN model, the processed CH4 flux without gap filling and related environmental variables were used for next analysis.
We used the forward stepwise regression, which started with an empty model and searched for the best performance model by adding environmental variables one by one (Table 1). Whether the input environmental variables remained in the model depended on the estimated information gain. When every variable was added, hypothesis testing was conducted by calculating a p value. If the p value of the model with added variable was statistically significant (p < 0.05), then the added variable would remain in the model; otherwise, the added variable would be rejected. We implemented the stepwise regression analysis using R v3.6.1.
We used a feed-forward artificial neural network (ANN) with MATLAB 2014a v8.3.0532. We implemented ANN model based on toolbox “nnstart” by MATLAB and optimized the parameters of “nnstart”. Figure 2 shows the structure of the ANN [67]. Firstly, the CH4 flux and environmental variables were normalized by “mapminmax” function in MATLAB. Secondly, we set train-function as “trainlm” and divided input data into three parts for training, testing, and validation with ratio of 0.7, 0.15, and 0.15. Thirdly, we started ANN with an empty model and added environmental variables one by one following their order in stepwise regression. Fourthly, we trained each ANN model at least 10,000 times and made sure that p value of the model was statistically significant (p < 0.05) to get the best performance model. After extensive training testing, number of 13 neurons was suitable and selected for this study. We also tested the various different orders of environmental variables in stepwise regression. However, performances (R2) of these models were not as good as those in Table 1.

3. Results

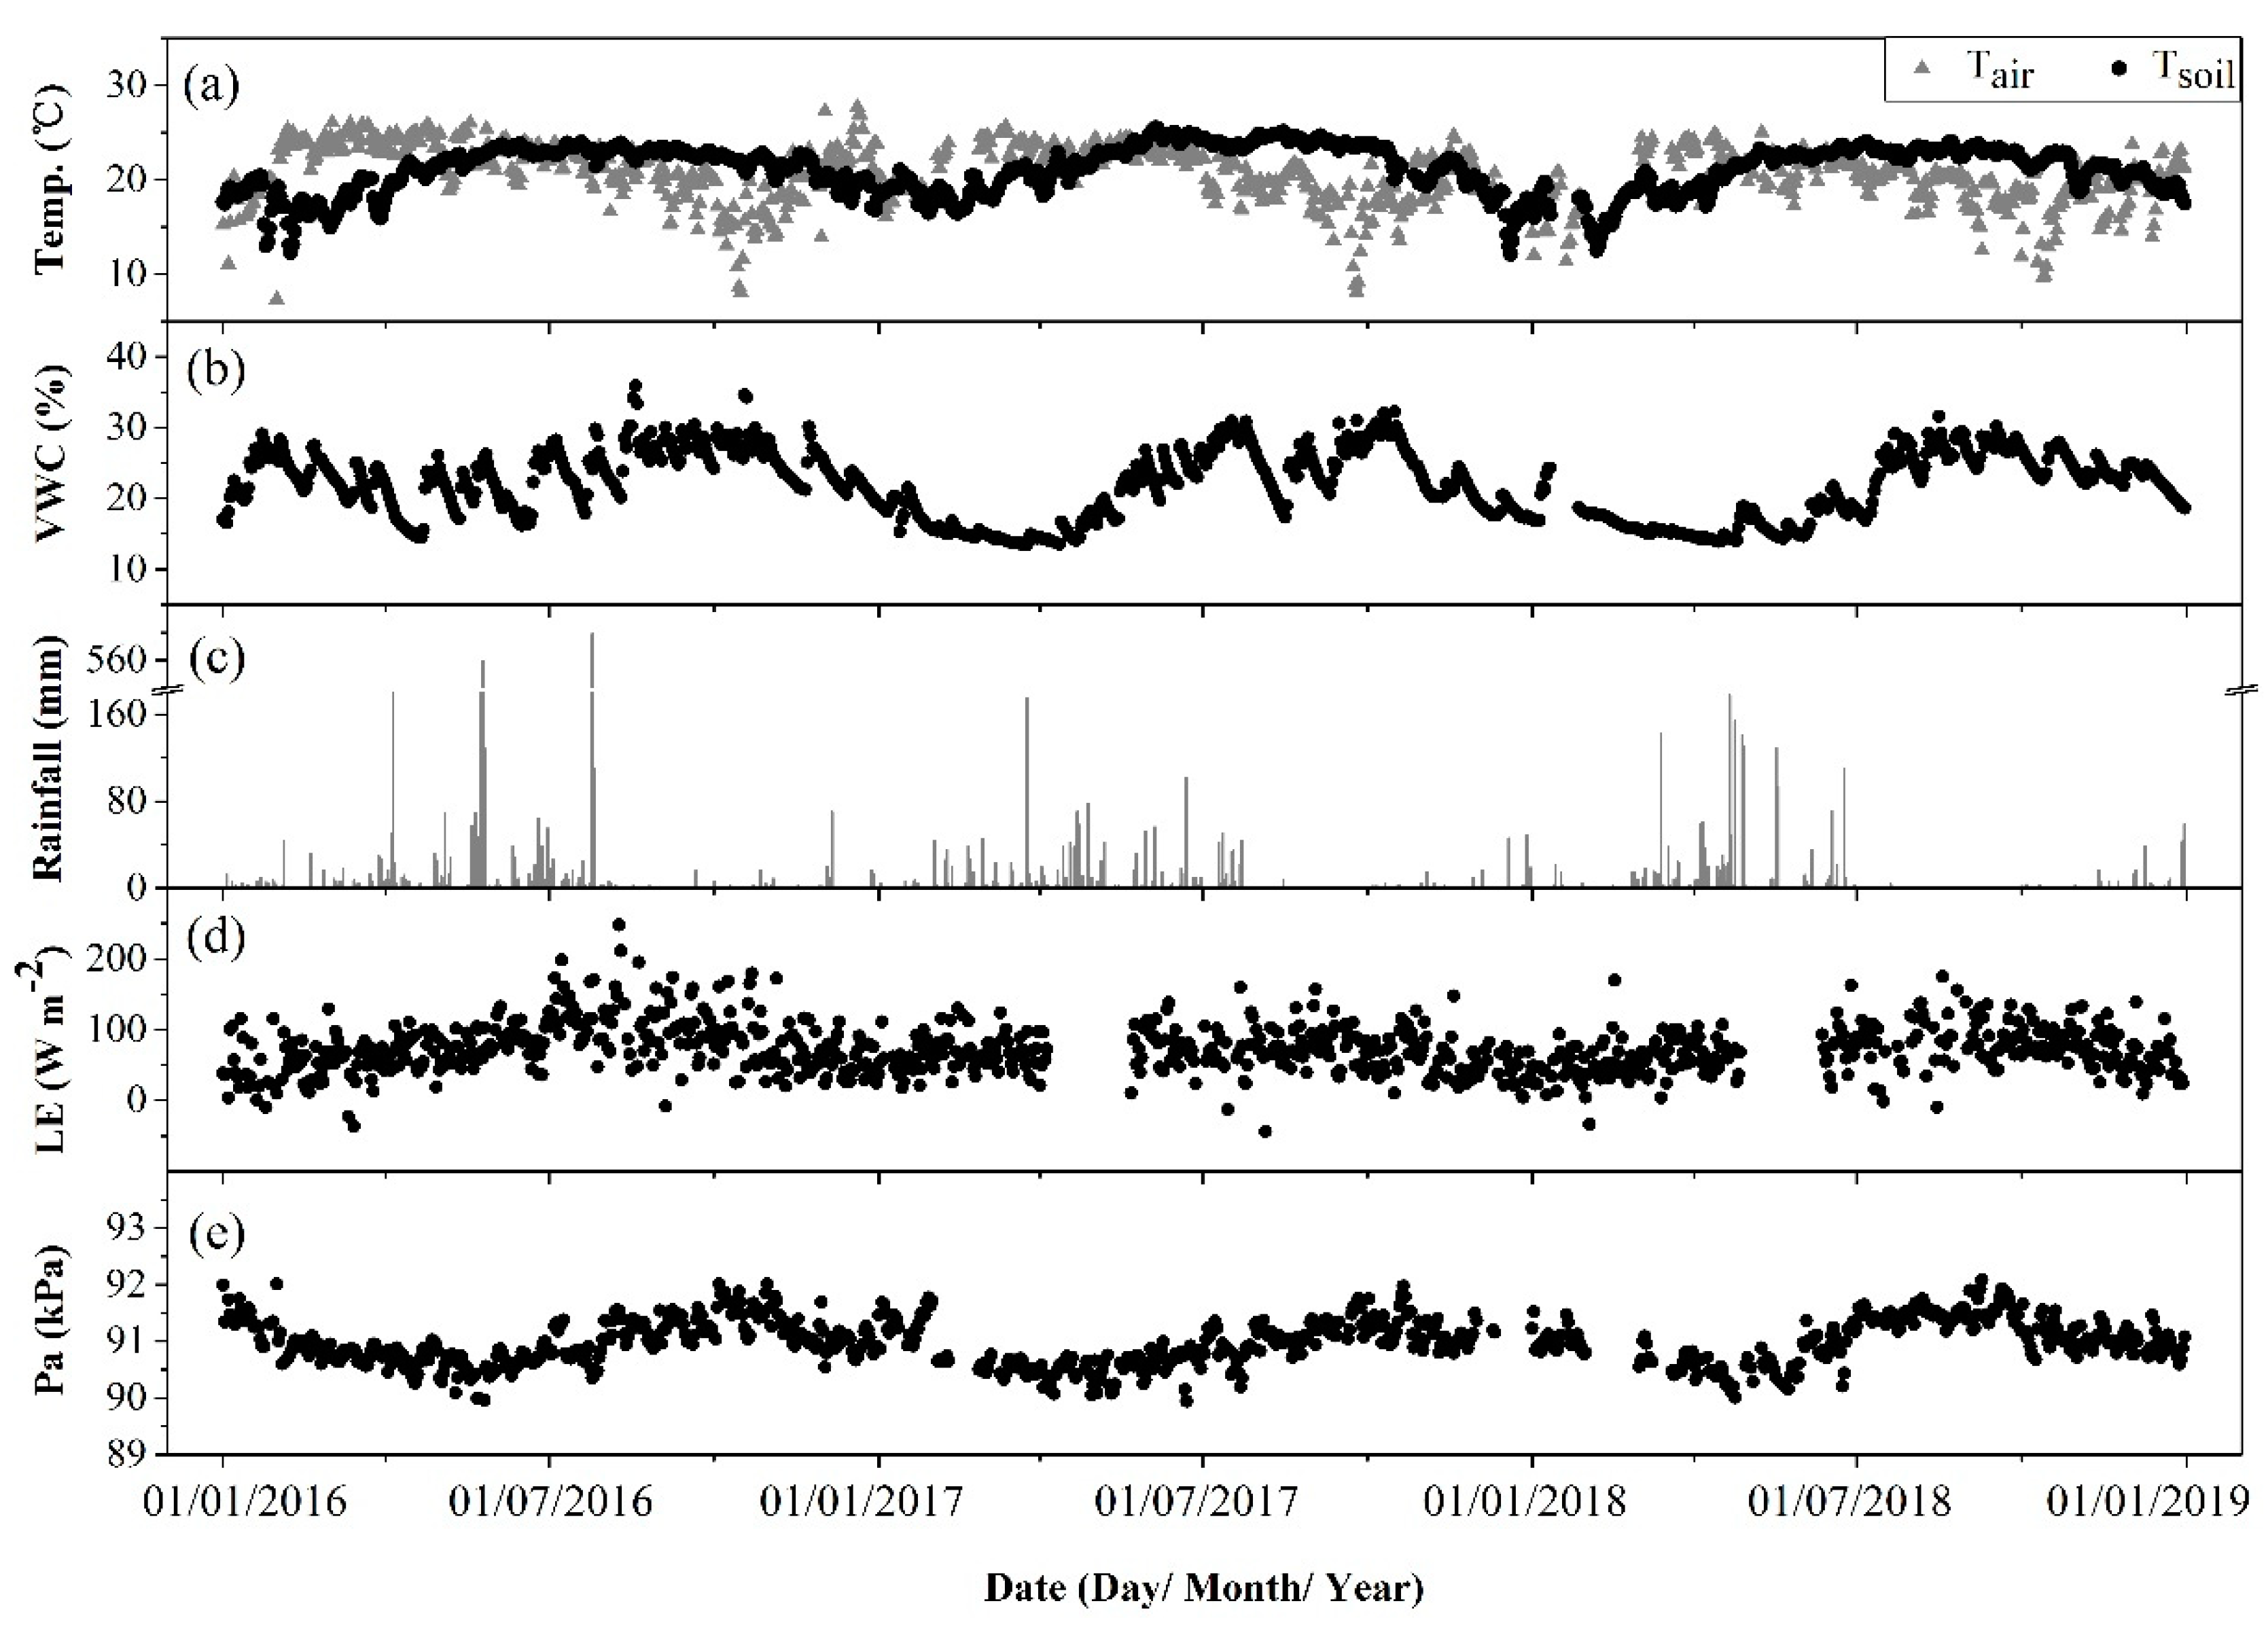
3.1. Variations in Meteorological and Soil Factors during the Study Period

From 01 June 2016, to 31 December 2018 (Figure 3), the mean daily air temperature (±SD) was 20.6 ± 3.2 °C, with a range of 7.4–27.7 °C. The annual average Pa and LE were 91.0 ± 0.4 kPa and 72.1 ± 34.3 W m−2, ranging from 89.9 to 92.1 kPa and −43.5 to 247.9 W m−2, respectively. The total annual rainfall in 2016, 2017, and 2018 was 3458, 1941, and 2198 mm, respectively. For the soil variables, the Tsoil trend at 10 cm depth (21.1 ± 2.5 °C, range of 12.1–25.5 °C) was similar to that of Tair. In addition, the VWC was 21.9 ± 4.8%, with a range of 13.5–35.9%.

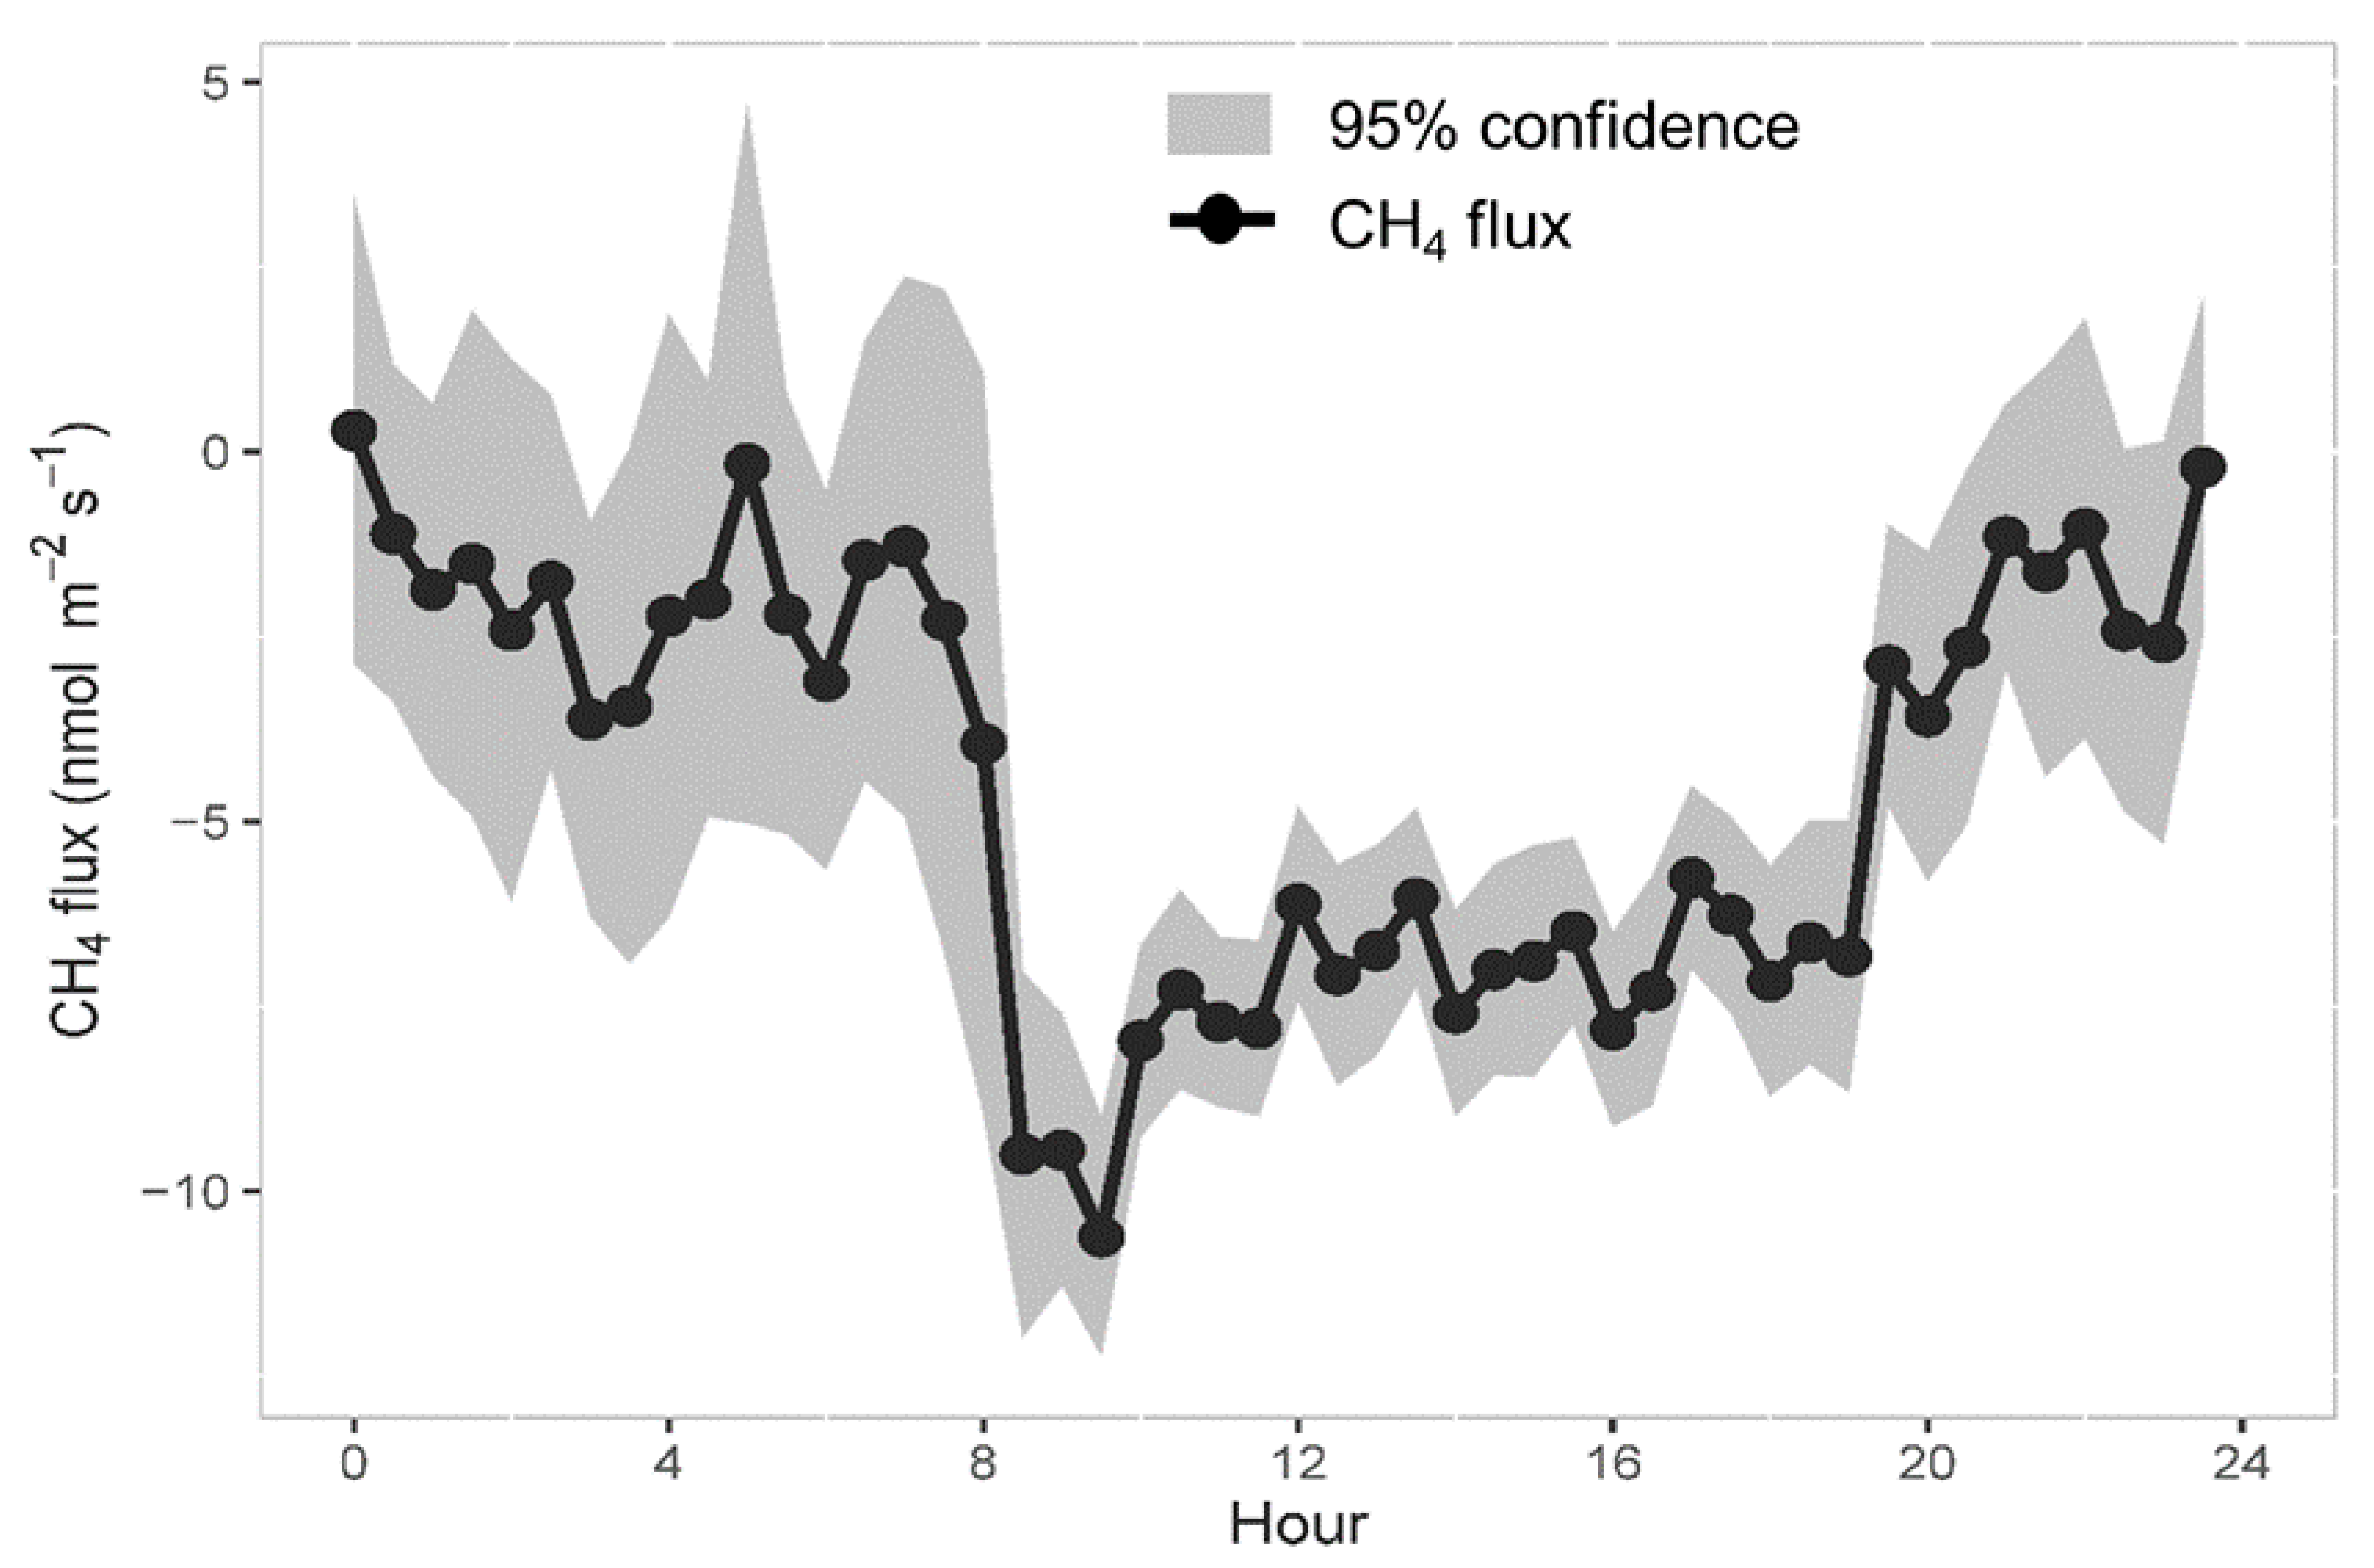
3.2. Diurnal Variations in CH4 Flux

The diurnal pattern of the CH4 flux showed that the CH4 flux during the night was distinctly greater than during the day (Figure 4). The mean CH4 fluxes for the whole day, during the daytime, and at night were −4.5, −6.6, and −2.4 nmol m−2 s−1, with ranges of −10.6~0.3, −10.6~−1.3, and −6.8~0.3 nmol m−2 s−1, respectively. Approximately 73.5% of the net CH4 uptake (CH4 flux < 0) occurred during the daytime, and 26.5% occurred at night. The CH4 flux decreased steadily and slowly beginning at midnight and sharply dropped at approximately 7 a.m. Then, it reached the uptake peak of −10.6 nmol m−2 s−1 at 9:30 a.m. After the CH4 flux peak, the CH4 flux increased slowly during the next 9.5 h until it reached −6.8 nmol m−2 s−1 at 7 p.m. Then, the CH4 flux increased quickly from 7 to 7:30 p.m. and increased slowly in the last hours of daylight. During the majority of the day and night, the CH4 flux was relatively stable. Dramatic changes in CH4 flux only occurred during sunrise and sunset.

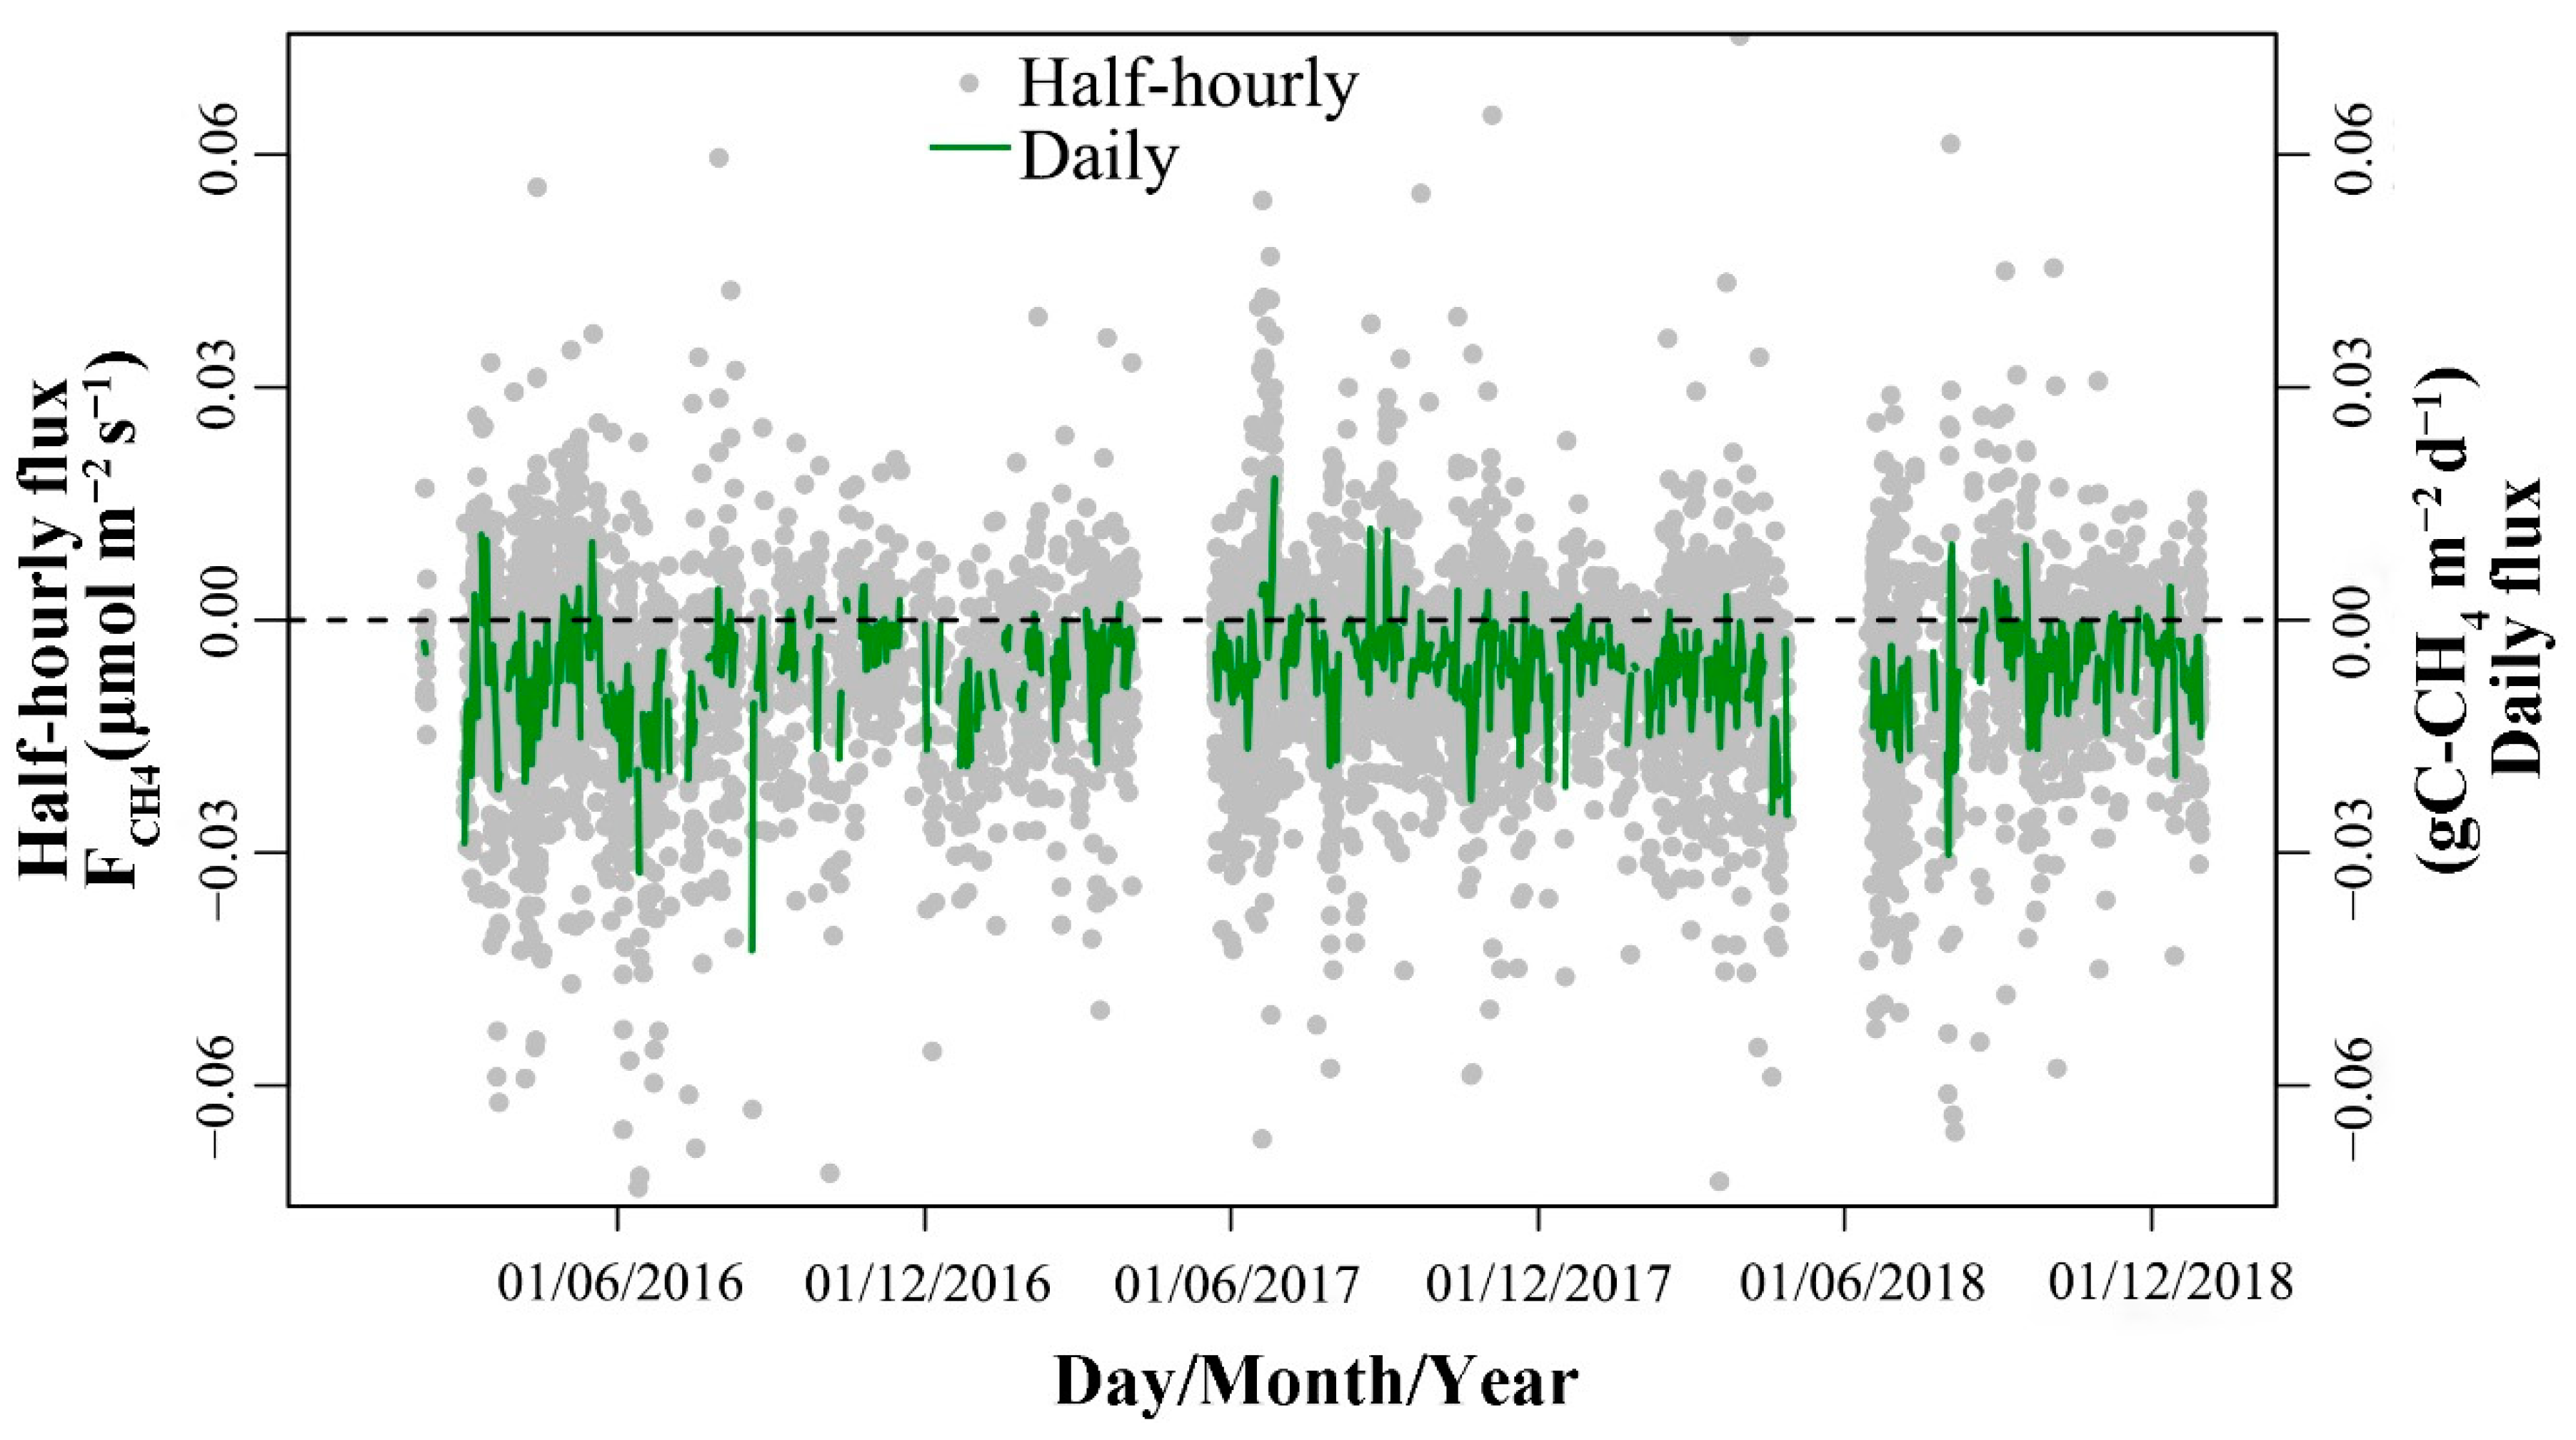
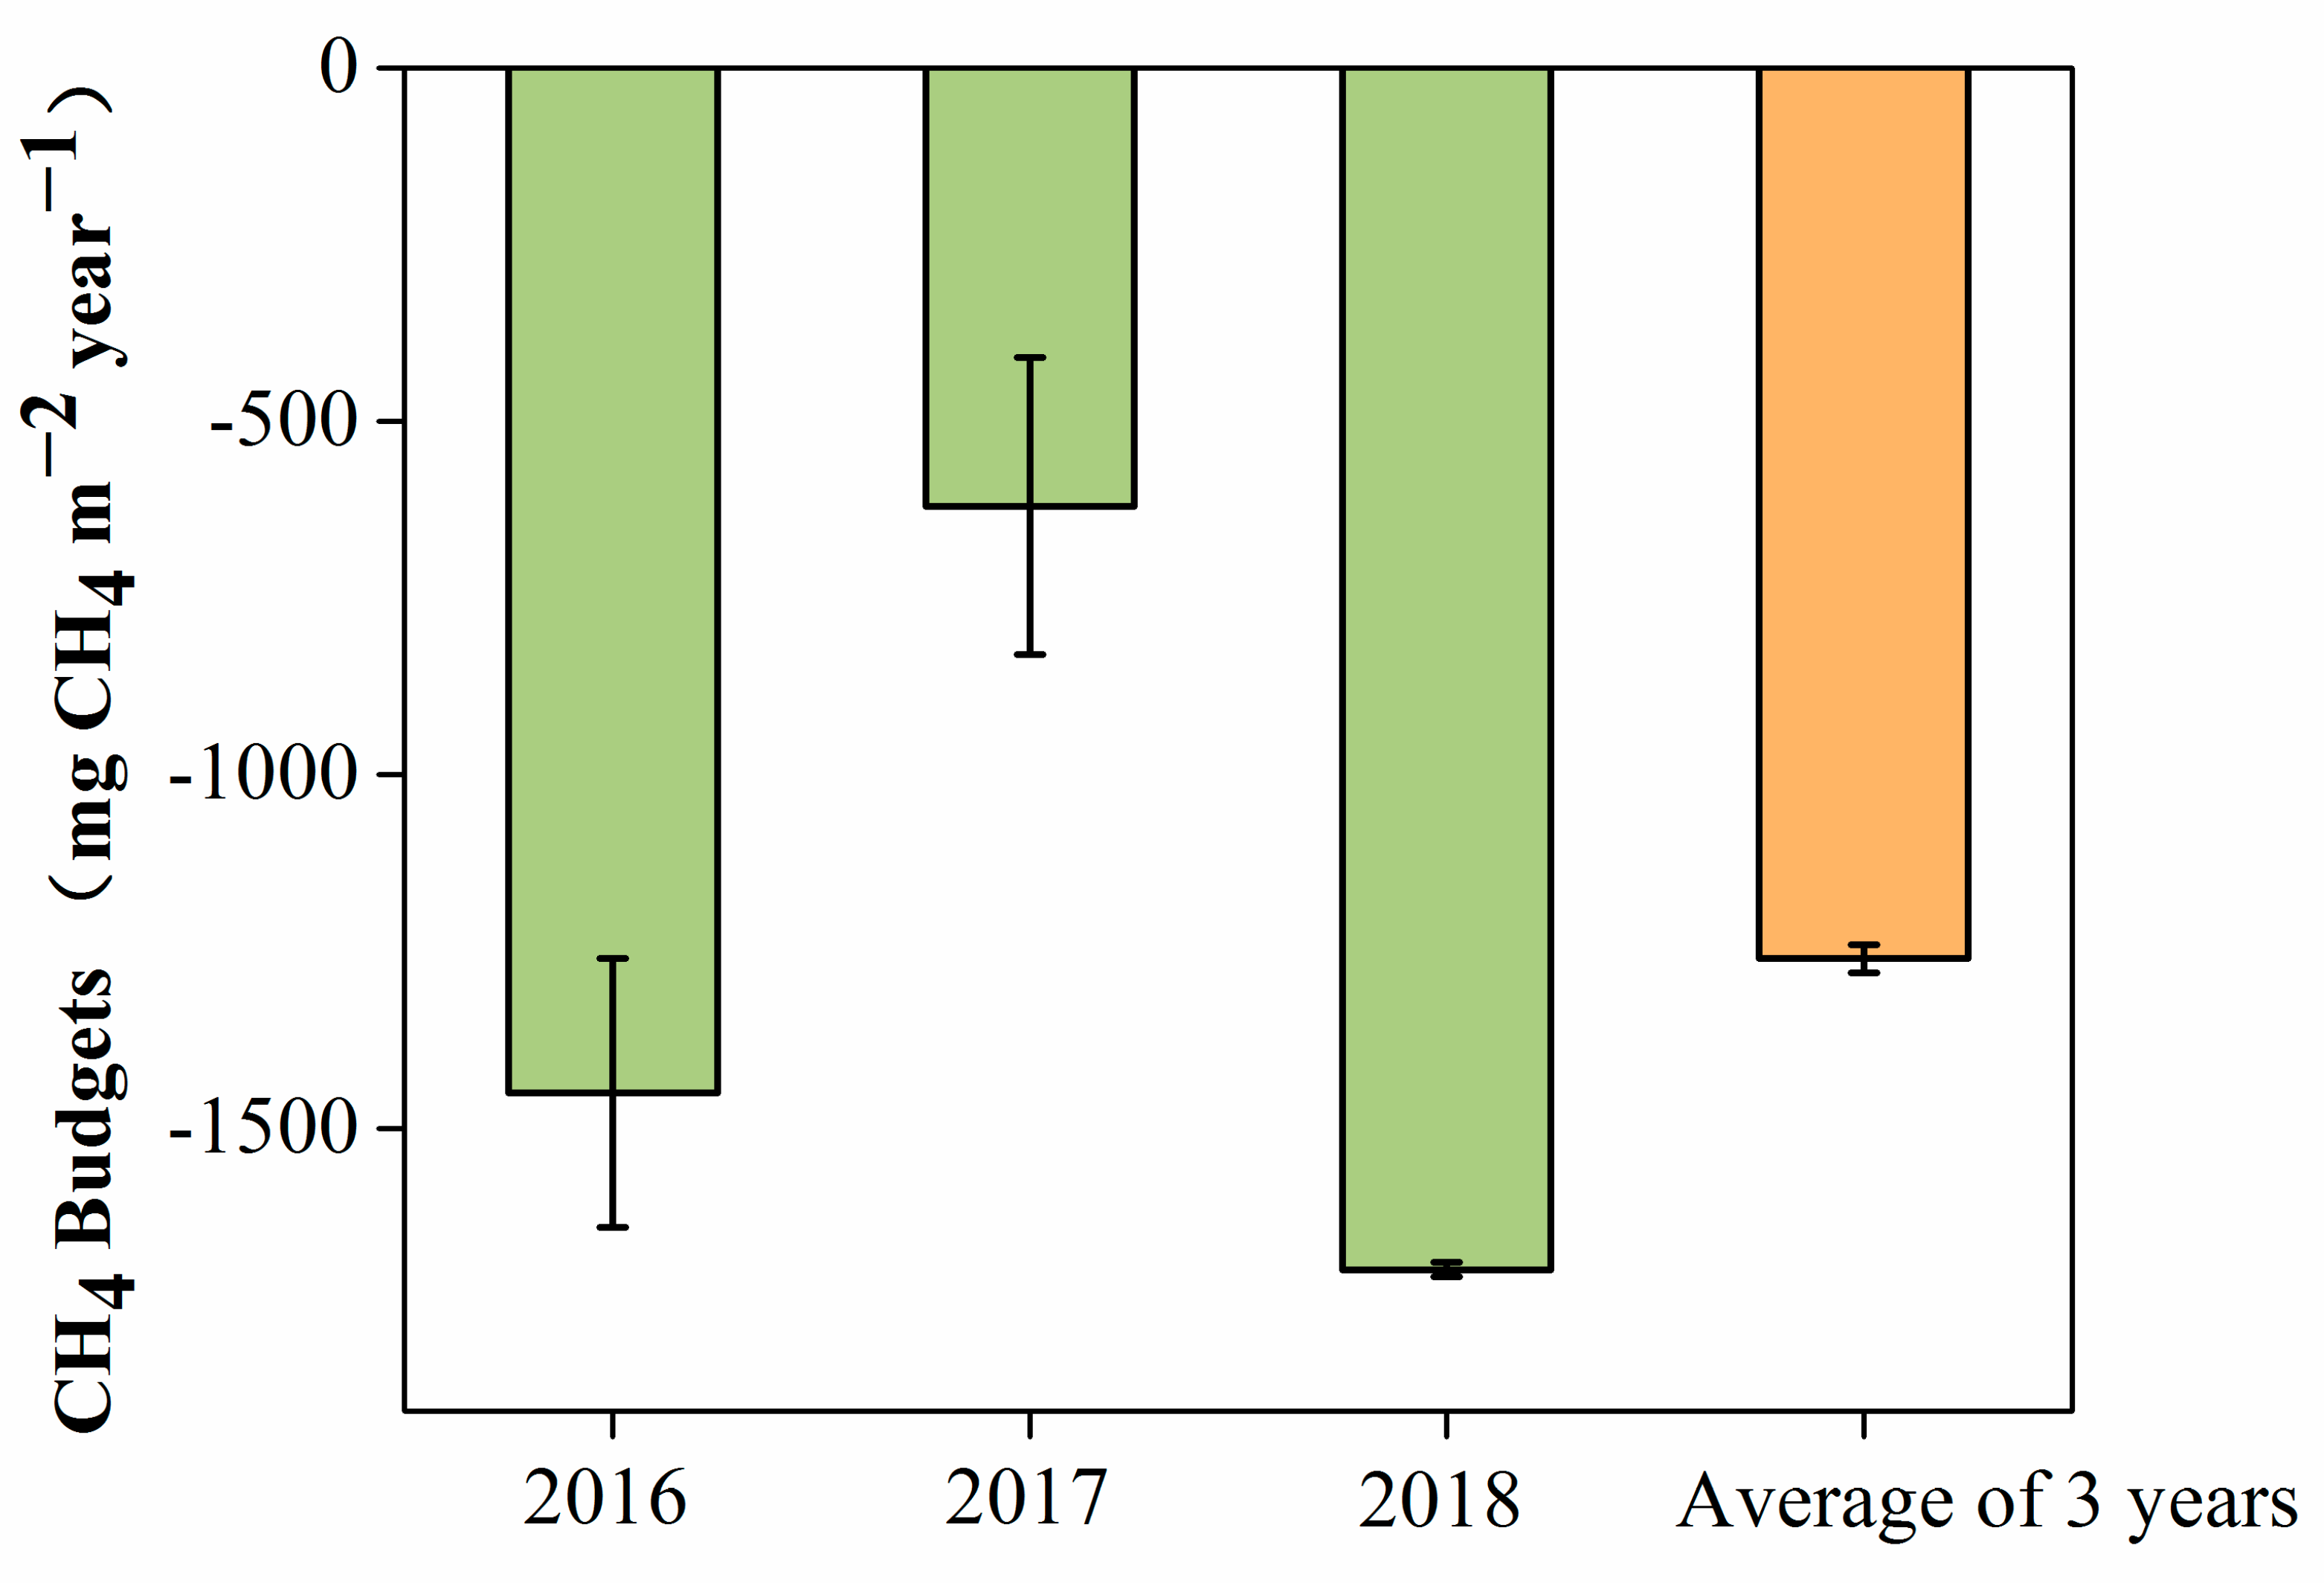
3.3. Seasonal Variations in CH4 Flux and Budget of CH4 Flux

Seasonal variations in the CH4 flux were not obvious, while air temperature and rainfall were distinct between the wet and dry seasons. The average CH4 fluxes during the 3 years, wet season, and dry season were −8.80, −8.91, and −8.65 mg CH4 m−2 day−1, respectively (Figure 5). The dry season and wet season CH4 fluxes were −11.0 and −10.97 mg CH4 m−2 day−1 in 2016, −7.84 and −5.91 mg CH4 m−2 day−1 in 2017, and −8.13 and −10.00 mg CH4 m−2 day−1 in 2018, respectively. The CH4 uptake in the wet season was slightly higher than that in the dry season in both 2016 and 2018 but was slightly lower in 2017.
After gap filling, the annual budgets (net ecosystem of CH4 exchange) of CH4 were −1450 ± 190 mg CH4 m−2 year−1, −620 ± 210 mg CH4 m−2 year−1, and −1700 ± 10 mg CH4 m−2 year−1 in 2016, 2017, and 2018, respectively (Figure 6). The average budget of CH4 over the entire study period was −1260 ± 20 mg CH4 m−2 year−1. The study site acted as a net sink of CH4 during the 3-year study period.

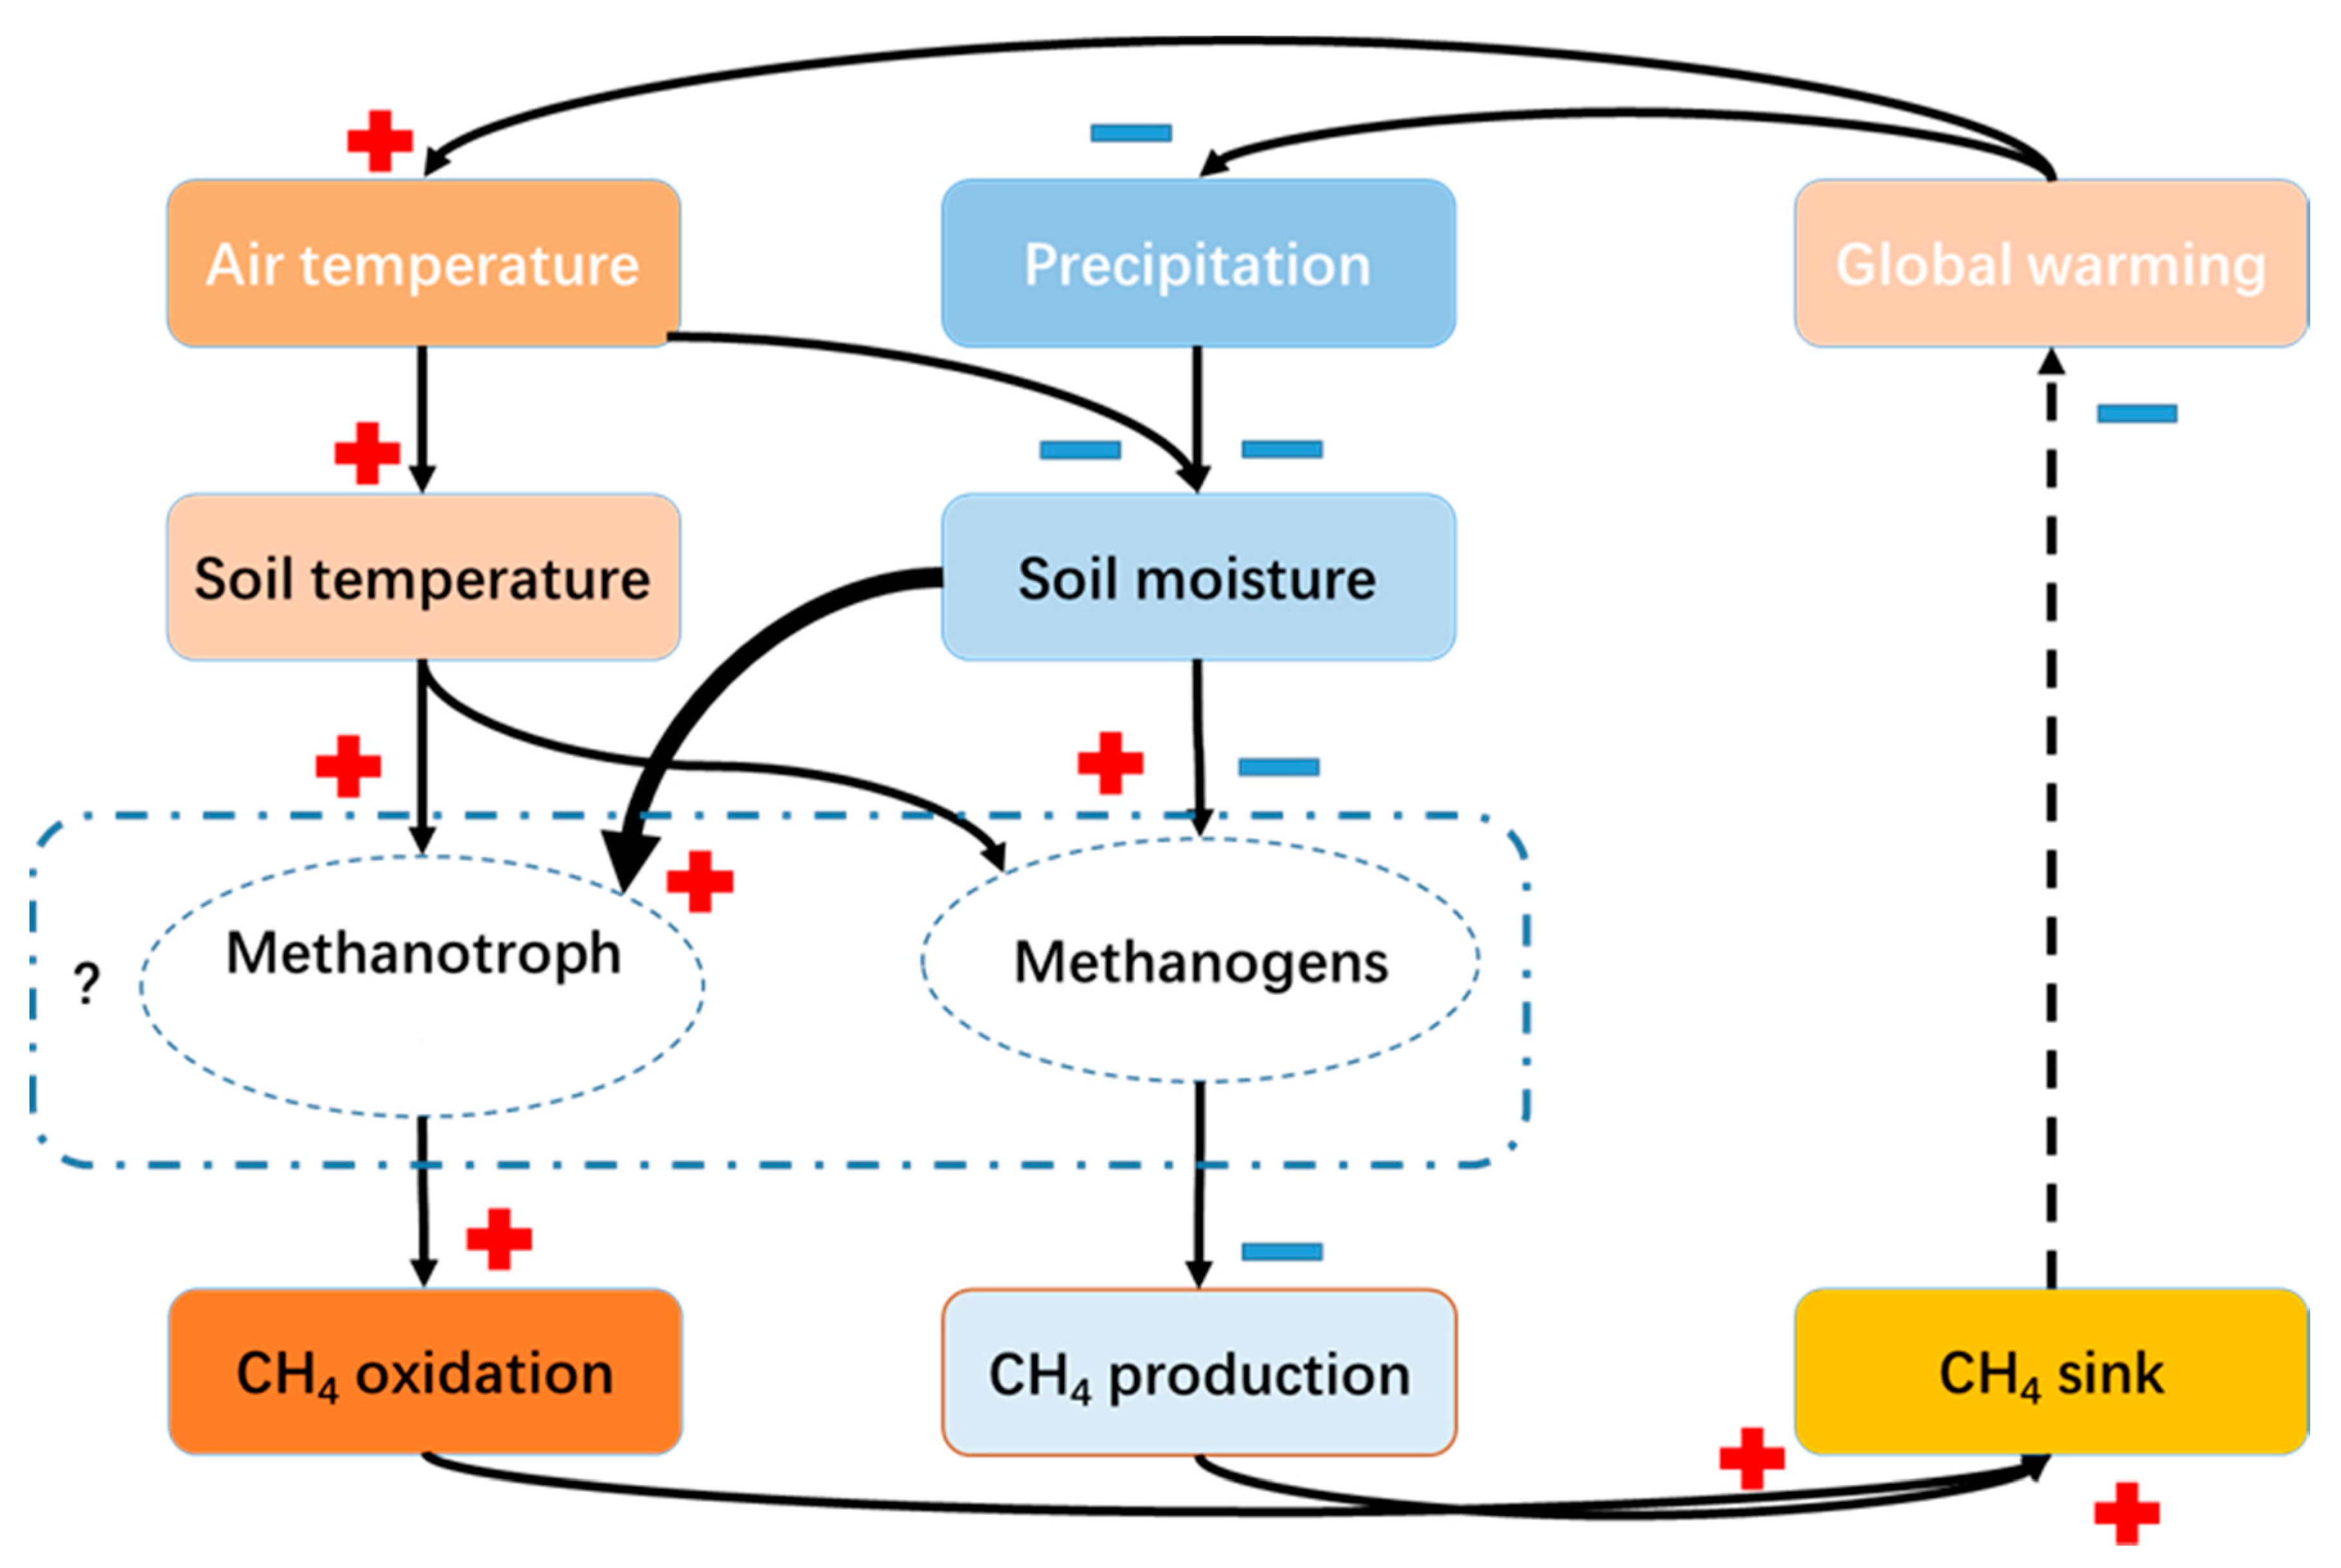
3.4. Environmental Drivers of CH4 Flux

We used stepwise multivariate linear regression and an artificial neural network to quantify the relationships between CH4 flux and various environmental variables (Table 1). We found that Tair, LE, VWC, Pa, RH, u*, and Tsoil were all significantly associated with CH4 flux based on stepwise multivariate linear regression. However, the stepwise linear regression model could only account for 11.7% of the total variance in the daily CH4 flux.
Consistent with the results of traditional stepwise multivariate linear regression analysis, the artificial neural network model showed that Tair, LE, VWC, Pa, and Tsoil were the five most important factors of the daily CH4 flux. The artificial neural network model accounted for 68.9% of the total variance in the daily CH4 flux.

4. Discussion

4.1. Temporal Variations and Annual Budgets of CH4 Flux

The diurnal CH4 flux pattern indicated that a greater uptake of CH4 occurred in the daytime and a lower uptake of CH4 occurred at night during the 3-year study period. Similar diurnal CH4 flux patterns of CH4 uptake have been reported in broad-leaved Korean pine forests in China [68] and in tropical mountain rainforests in South Vietnam [69], but both were measured using the static chamber method (Table 2). Diurnal CH4 emission patterns in tropical forests have also been reported in tropical peat forests, tropical swamp forests, and tropical mangroves, which are rich in soil water content, with CH4 emissions ranging from 0 to 40 nmol m−2 s−1 [24,70,71]. A diurnal CH4 flux pattern with emission peaks has also been reported in rice paddies and wetlands [72,73]. Unfortunately, there are no reports of similar diurnal CH4 flux patterns observed in tropical mountain rainforest ecosystems using the EC approach.
The average daily CH4 flux was mostly CH4 uptake with no significant seasonal variation. The average daily CH4 flux (−8.80 mg CH4 m−2 day−1) was 1.7~6.5 times higher than the previous static-chamber-based estimation in the same tropical rainforest ecosystem [21,22]. Furthermore, based on the static chamber method, Wei et al. (2018) [22] observed a similar pattern of CH4 uptake without seasonal variation at the same tropical rainforest site. Other studies also showed that CH4 uptake in the dry season was approximately 2~4 times stronger than that in the wet season in tropical forests in Hainan Province, China [21,74]. Based on EC measurements, Sakabe et al. (2018) [71] observed a pattern of CH4 uptake in the dry season and CH4 emissions in the wet season in tropical peat swamp forests in Indonesia. The CH4 flux mechanism in tropical rainforests can be complex and was preliminarily thought to be related to soil water content and soil temperature.
The mean annual budget of the CH4 flux in the JFL tropical rainforest was −1260 ± 20 mg CH4 m−2 year−1 during the 3-year study period. In a global synthesis of 124 estimates of the soil CH4 flux of tropical forests from 54 published studies in upland forests, Zhao et al. (2019) [74] reported that the mean annual uptake of CH4 in tropical forest soil was −378.7 ± 61.3 mg CH4 m−2 year−1 in the Asia-Pacific region and −334.7 ± 48 mg CH4 m−2 year−1 globally. Our tropical forest CH4 uptake measurements were 3.3 times higher than those of tropical forest soils in the Asia-Pacific region. A reason for this may be due to the difference in the measurement technique: the CH4 fluxes in tropical Asia-Pacific soils were mainly measured by the static chamber method and EC method, while our results were only measured by the EC method. In addition, some studies on tropical Asia-Pacific sites were conducted during a brief period (e.g., only observed in summer), while our observations lasted continuously for approximately 3 years. For the same tropical forest, our mean annual CH4 uptake was 1.7~6.5 times higher than the previous chamber-based estimations in tropical or subtropical forest ecosystems [21,22,52,69,74]. However, to date, there is no report of CH4 fluxes measured by the EC approach for this same tropical mountain rainforest ecosystem. In addition, some recent studies indicated a net CH4 source with an emission range from 0.12 to 20.3 g CH4 m−2 year−1 in tropical mangrove ecosystems, subtropical mangrove ecosystems, and subtropical salt marsh ecosystems [54,70,71,76,77].

4.2. Environmental Drivers of CH4 Flux

In the diurnal pattern of CH4 flux, the difference between day and night could be related to the changes in meteorological variables (e.g., radiation and temperature). The diurnal pattern of the CH4 flux in tropical rainforests differs from that of tropical peat forests, tropical flooded forests, and subtropical mangroves, which could be caused by the soil temperature and soil water table depth [21,69,77].
CH4 uptake in natural ecosystems occurs by microbial oxidation, which is the only known biological process [41]. In the first crucial step for aerobic methanotrophs to oxidize methane, both oxygen and methane need to diffuse into soil methanotrophs. This process is easily affected by the soil water content [43,78,79]. In addition, abundant soil moisture could result in CH4 emissions by methanogens. Therefore, soil water content plays the most important role in the CH4 dynamics of forest soils [19,26,80].
High temperature increases the substrates of methanotrophs by stimulating the metabolic activities of microorganisms and plants [47,81]. Second, temperature affects methanotrophs. The optimum temperature for methane oxidation is 20 to 30 °C [82]. The temperature at our tropical site (21.1 ± 2.5) is relatively suitable for methanotrophs.
LE has been generally considered an important driver of CH4 flux in wetlands, as increased evaporation can enhance convection to enhance CH4 transport [83,84]. In addition, increased turbulent mixing, such as u*, can enhance CH4 transport, although it has been found to be more important in regulating shorter-term (e.g., hourly) CH4 fluxes [85,86].
It is widely recognized that CH4 dynamics in forest ecosystems are affected by multiple environmental factors [24,25,70,71]. Our correlation analysis results reveal that a single factor (such as Tair, LE, VWC, Pa, RH, u*, and Tsoil) could not be considered the most significant dynamic of CH4 flux in tropical rainforests. Each of the seven factors was individually significant to the CH4 flux based on stepwise multivariate linear regression but made a relatively low contribution to the total variance in the daily CH4 flux (11.7%). Obviously, the relationships and dynamics of the CH4 flux were nonlinear and involved the complicated interaction of multiple factors (Tair, LE, VWC, Pa, and Tsoil), which could account for 68.9% of the total variance in the daily CH4 flux by our artificial neural network model (Table 1 and Figure 2).
However, our results presented here are still limited and could be improved in future investigations. First, several data gaps in CH4 fluxes existed because of the influence of typhoons and instrument failure, which had an unavoidable influence on investigating the relationship between the CH4 flux and environmental factors. Although the data gaps were filled using the RF approach during the estimation of the annual CH4 budget, the gap-filling method may lead to some uncertainty in the annual CH4 budget estimation. Second, additional auxiliary data could help to understand the mechanisms of CH4 flux dynamics. All trees could transport and emit soil-produced CH4 by diffusion or xylem transport. In addition, living trees and deadwood are capable of emitting CH4 produced inside trees by microorganisms [18,87]. Ground water level (GWL), soil microbial activities (methanogens and methanotrophs, Figure 7), and the ages and species of trees in forest ecosystems could provide more information to explore the complicated interactions of CH4 flux with multiple environmental factors.

5. Conclusions

In this study, we presented a first attempt at using the EC technique to investigate the dynamics and annual budget of the CH4 flux and its environmental control factors in a tropical rainforest in Hainan Province, China. The diurnal pattern of the CH4 flux exhibited greater CH4 uptake in the daytime and lower CH4 uptake at night. Most of the daily CH4 flux was CH4 uptake without a significant seasonal variation during the 3-year study period. The results from both the artificial neural network and traditional stepwise multivariate linear models indicate that Tair, LE, VWC, Pa, and T soil were the most important factors controlling daily CH4 dynamics. Moreover, the artificial neural network model accounting for daily CH4 flux variance (68.9%) performed much better than the traditional stepwise multivariate linear model (10.1%). The average annual CH4 uptake was −1.26 ± 0.02 g CH4 m−2 year−1, with a range of −0.62 to −1.70 g CH4 m−2 year−1. The tropical rainforest of Hainan Province, China, acted as a CH4 sink during 2016–2018, helping to counteract global warming. Overall, this study filled the research gap of CH4 fluxes in tropical rainforests at the ecosystem scale, providing unique field observation data for informing and validating the simulations of process-based CH4 dynamic models for global tropical rainforest CH4 budgets.

Author Contributions

Conceptualization, C.P., H.L., Q.Z. and H.C.; methodology, H.C., C.P. and H.L.; resources, D.C. and Y.L.; investigation, Z.L., H.W., G.Y., W.L. and F.W.; data analysis, Z.L. and H.L.; data curation, Z.L.; writing—original draft preparation, Z.L.; writing—review and editing, C.P. and H.L.; project administration and funding acquisition, C.P. All authors have read and agreed to the published version of the manuscript.

Funding

This research was funded by the National Key R&D Program of China, grant number 2016YFC050020.

Data Availability Statement

The data presented in this study are available on reasonable request from the corresponding author. The data are not publicly available due to privacy.

Acknowledgments

We wish to acknowledge the Jianfengling National Key Field Observation and Research Station for their help in the field investigation.

Conflicts of Interest

The authors declare no conflict of interest.

References

  1. Etminan, M.; Myhre, G.; Highwood, E.J.; Shine, K.P. Radiative forcing of carbon dioxide, methane, and nitrous oxide: A significant revision of the methane radiative forcing. Geophys. Res. Lett. 2016, 43, 12614–12623. [Google Scholar] [CrossRef]
  2. IPCC. Climate Change 2013: The Physical Science Basis. Contribution of Working Group I to the Fifth Assessment Report of IPCC the Intergovernmental Panel on Climate Change; Stocker, T.F., Qin, D., Eds.; Cambridge University Press: Cambridge, UK; New York, NY, USA, 2013; p. 1535. [Google Scholar] [CrossRef] [Green Version]
  3. Myhre, G.; Shindell, D.; Bréon, F.-M.; Collins, W.; Fuglestvedt, J.; Huang, J.; Douglas Dounald Koch, M.D.; Lamarque, J.-F.; Lee, D.; Mendoza, B.; et al. Anthropogenic and Natural Radiative Forcing. In Climate change 2013: The Physical Science Basis. Contribution of Working Group I to the Fifth Assessment Report of the Intergovernmental Panel on Climate Change; Stocker, T.F., Qin, D., Eds.; Cambridge University Press: Cambridge, UK; New York, NY, USA, 2013; pp. 659–740. [Google Scholar]
  4. Kirschke, S.; Bousquet, P.; Ciais, P.; Saunois, M.; Canadell, J.G.; Dlugokencky, E.J.; Bergamaschi, P.; Bergmann, D.; Blake, D.R.; Bruhwiler, L.; et al. Three decades of global methane sources and sinks. Nat. Geosci. 2013, 6, 813–823. [Google Scholar] [CrossRef]
  5. Neubauer, S.C.; Megonigal, J.P. Moving Beyond Global Warming Potentials to Quantify the Climatic Role of Ecosystems. Ecosystems 2015, 18, 1000–1013. [Google Scholar] [CrossRef] [Green Version]
  6. Saunois, M.; Stavert, A.R.; Poulter, B.; Bousquet, P.; Canadell, J.G.; Jackson, R.B.; Raymond, P.A.; Dlugokencky, E.J.; Houweling, S.; Patra, P.K.; et al. The Global Methane Budget 2000–2017. Earth Syst. Sci. Data 2020, 12, 1561–1623. [Google Scholar] [CrossRef]
  7. Prather, M.J.; Holmes, C.D.; Hsu, J. Reactive greenhouse gas scenarios: Systematic exploration of uncertainties and the role of atmospheric chemistry. Geophys. Res. Lett. 2012, 39, L09803. [Google Scholar] [CrossRef] [Green Version]
  8. Shindell, D.; Kuylenstierna, J.C.; Vignati, E.; van Dingenen, R.; Amann, M.; Klimont, Z.; Anenberg, S.C.; Muller, N.; Janssens-Maenhout, G.; Raes, F.; et al. Simultaneously mitigating near-term climate change and improving human health and food security. Science 2012, 335, 183–189. [Google Scholar] [CrossRef] [Green Version]
  9. Bousquet, P.; Ciais, P.; Miller, J.B.; Dlugokencky, E.J.; Hauglustaine, D.A.; Prigent, C.; van der Werf, G.R.; Peylin, P.; Brunke, E.G.; Carouge, C.; et al. Contribution of anthropogenic and natural sources to atmospheric methane variability. Nature 2006, 443, 439–443. [Google Scholar] [CrossRef]
  10. Curry, C.L. Modeling the soil consumption of atmospheric methane at the global scale. Glob. Biogeochem. Cycles 2007, 21, GB4012. [Google Scholar] [CrossRef]
  11. Neef, L.; van Weele, M.; van Velthoven, P. Optimal estimation of the present-day global methane budget. Glob. Biogeochem. Cycles 2010, 24, GB4024. [Google Scholar] [CrossRef]
  12. Zhuang, Q.; Melillo, J.M.; Kicklighter, D.W.; Prinn, R.G.; McGuire, A.D.; Steudler, P.A.; Felzer, B.S.; Hu, S. Methane fluxes between terrestrial ecosystems and the atmosphere at northern high latitudes during the past century: A retrospective analysis with a process-based biogeochemistry model. Glob. Biogeochem. Cycles 2004, 18, GB3010. [Google Scholar] [CrossRef]
  13. Turner, A.J.; Frankenberg, C.; Kort, E.A. Interpreting contemporary trends in atmospheric methane. Proc. Natl. Acad. Sci. USA 2019, 116, 2805–2813. [Google Scholar] [CrossRef] [PubMed] [Green Version]
  14. Bonan, G.B. Forests and climate change: Forcings, feedbacks, and the climate benefits of forests. Science 2008, 320, 1444–1449. [Google Scholar] [CrossRef] [Green Version]
  15. Pan, Y.D.; Birdsey, R.A.; Fang, J.Y.; Houghton, R.; Kauppi, P.E.; Kurz, W.A.; Phillips, O.L.; Shvidenko, A.; Lewis, S.L.; Canadell, J.G.; et al. A Large and Persistent Carbon Sink in the World′ s Forests. Science 2011, 333, 988–993. [Google Scholar] [CrossRef] [PubMed] [Green Version]
  16. Dlugokencky, E.J.; Nisbet, E.G.; Fisher, R.; Lowry, D. Global atmospheric methane: Budget, changes and dangers. Philos. Transactions. Ser. A Math. Phys. Eng. Sci. 2011, 369, 2058–2072. [Google Scholar] [CrossRef] [Green Version]
  17. Saunois, M.; Bousquet, P.; Poulter, B.; Peregon, A.; Ciais, P.; Canadell, J.G.; Dlugokencky, E.J.; Etiope, G.; Bastviken, D.; Houweling, S.; et al. The global methane budget 2000–2012. Earth Syst. Sci. Data 2016, 8, 697–751. [Google Scholar] [CrossRef] [Green Version]
  18. Covey, K.R.; Megonigal, J.P. Methane production and emissions in trees and forests. New Phytol. 2018, 222, 35–51. [Google Scholar] [CrossRef]
  19. Ni, X.Y.; Groffman, P.M. Declines in methane uptake in forest soils. Proc. Natl. Acad. Sci. USA 2018, 115, 8587–8590. [Google Scholar] [CrossRef] [PubMed] [Green Version]
  20. Malhi, Y.; Roberts, J.T.; Betts, R.A.; Killeen, T.J.; Li, W.; Nobre, C.A. Climate change, deforestation, and the fate of the Amazon. Science 2008, 319, 169–172. [Google Scholar] [CrossRef] [PubMed] [Green Version]
  21. Jia, G.; Quan, X.U.; Yang, H.; Yang, Q.; Yide, L.I.; Liu, W. Soil methane flux of tropical mountain rainforest canopy gaps in Jianfengling, Hainan Island. J. For. Environ. 2020, 40, 126–132. [Google Scholar] [CrossRef]
  22. Wei, H.; Peng, C.; Liu, S.; Liu, X.; Li, P.; Song, H.; Yuan, M.; Wang, M. Variation in Soil Methane Fluxes and Comparison between Two Forests in China. Forests 2018, 9, 204. [Google Scholar] [CrossRef] [Green Version]
  23. Querino, C.A.S.; Smeets, C.J.P.P.; Vigano, I.; Holzinger, R.; Moura, V.; Gatti, L.V.; Martinewski, A.; Manzi, A.O.; de Araújo, A.C.; Röckmann, T. Methane flux, vertical gradient and mixing ratio measurements in a tropical forest. Atmos. Chem. Phys. 2011, 11, 7943–7953. [Google Scholar] [CrossRef] [Green Version]
  24. Tang, A.C.I.; Stoy, P.C.; Hirata, R.; Musin, K.K.; Aeries, E.B.; Wenceslaus, J.; Melling, L. Eddy Covariance Measurements of Methane Flux at a Tropical Peat Forest in Sarawak, Malaysian Borneo. Geophys. Res. Lett. 2018, 45, 4390–4399. [Google Scholar] [CrossRef] [Green Version]
  25. Feng, H.; Guo, J.; Han, M.; Wang, W.; Peng, C.; Jin, J.; Song, X.; Yu, S. A review of the mechanisms and controlling factors of methane dynamics in forest ecosystems. For. Ecol. Manag. 2020, 455, 117702. [Google Scholar] [CrossRef]
  26. Hiltbrunner, D.; Zimmermann, S.; Karbin, S.; Hagedorn, F.; Niklaus, P.A. Increasing soil methane sink along a 120-year afforestation chronosequence is driven by soil moisture. Glob. Change Biol. 2012, 18, 3664–3671. [Google Scholar] [CrossRef]
  27. Wang, H.; Yu, L.; Zhang, Z.; Liu, W.; Chen, L.; Cao, G.; Yue, H.; Zhou, J.; Yang, Y.; Tang, Y.; et al. Molecular mechanisms of water table lowering and nitrogen deposition in affecting greenhouse gas emissions from a Tibetan alpine wetland. Glob. Change Biol. 2016, 23, 815–829. [Google Scholar] [CrossRef] [PubMed] [Green Version]
  28. Helbig, M.; Quinton, W.L.; Sonnentag, O. Warmer spring conditions increase annual methane emissions from a boreal peat landscape with sporadic permafrost. Environ. Res. Lett. 2017, 12, 115009. [Google Scholar] [CrossRef] [Green Version]
  29. Karbin, S.; Hagedorn, F.; Dawes, M.A.; Niklaus, P.A. Treeline soil warming does not affect soil methane fluxes and the spatial micro-distribution of methanotrophic bacteria. Soil Biol. Biochem. 2015, 86, 164–171. [Google Scholar] [CrossRef]
  30. Yvon-Durocher, G.; Allen, A.P.; Bastviken, D.; Conrad, R.; Gudasz, C.; St-Pierre, A.; Thanh-Duc, N.; del Giorgio, P.A. Methane fluxes show consistent temperature dependence across microbial to ecosystem scales. Nature 2014, 507, 488–491. [Google Scholar] [CrossRef] [PubMed] [Green Version]
  31. Mori, T.; Ohta, S.; Ishizuka, S.; Konda, R.; Wicaksono, A.; Heriyanto, J.; Hamotani, Y.; Gobara, Y.; Kawabata, C.; Kuwashima, K.; et al. Soil greenhouse gas fluxes and C stocks as affected by phosphorus addition in a newly established Acacia mangium plantation in Indonesia. For. Ecol. Manag. 2013, 310, 643–651. [Google Scholar] [CrossRef]
  32. Song, L.; Tian, P.; Zhang, J.; Jin, G. Effects of three years of simulated nitrogen deposition on soil nitrogen dynamics and greenhouse gas emissions in a Korean pine plantation of northeast China. Sci. Total Environ. 2017, 609, 1303–1311. [Google Scholar] [CrossRef]
  33. Veraart, A.J.; Steenbergh, A.K.; Ho, A.; Kim, S.Y.; Bodelier, P.L.E. Beyond nitrogen: The importance of phosphorus for CH4 oxidation in soils and sediments. Geoderma 2015, 259–260, 337–346. [Google Scholar] [CrossRef]
  34. Carnicer, J.; Coll, M.; Ninyerola, M.; Pons, X.; Sanchez, G.; Penuelas, J. Widespread crown condition decline, food web disruption, and amplified tree mortality with increased climate change-type drought. Proc. Natl. Acad. Sci. USA 2011, 108, 1474–1478. [Google Scholar] [CrossRef] [Green Version]
  35. Seidl, R.; Thom, D.; Kautz, M.; Martin-Benito, D.; Peltoniemi, M.; Vacchiano, G.; Wild, J.; Ascoli, D.; Petr, M.; Honkaniemi, J.; et al. Forest disturbances under climate change. Nat. Clim. Change 2017, 7, 395–402. [Google Scholar] [CrossRef] [PubMed] [Green Version]
  36. Yavitt, J.B. Land use history determines non-native earthworm impacts on atmospheric methane consumption in forest soils, central New York State. Can. J. Soil Sci. 2015, 95, 321–330. [Google Scholar] [CrossRef] [Green Version]
  37. Keller, M.; Varner, R.; Dias, J.D.; Silva, H.; Crill, P.; de Oliveira, R.C. Soil-atmosphere exchange of nitrous oxide, nitric oxide, methane, and carbon dioxide in logged and undisturbed forest in the Tapajos National Forest, Brazil. Earth Interact. 2005, 9, 1–28. [Google Scholar] [CrossRef] [Green Version]
  38. Sundqvist, E.; Vestin, P.; Crill, P.; Persson, T.; Lindroth, A. Short-term effects of thinning, clear-cutting and stump harvesting on methane exchange in a boreal forest. Biogeosciences 2014, 11, 6095–6105. [Google Scholar] [CrossRef] [Green Version]
  39. Thauer, R.K.; Kaster, A.K.; Seedorf, H.; Buckel, W.; Hedderich, R. Methanogenic archaea: Ecologically relevant differences in energy conservation. Nat. Rev. Microbiol. 2008, 6, 579–591. [Google Scholar] [CrossRef]
  40. Kallistova, A.Y.; Merkel, A.Y.; Tarnovetskii, I.Y.; Pimenov, N.V. Methane formation and oxidation by prokaryotes. Microbiology 2017, 86, 671–691. [Google Scholar] [CrossRef]
  41. Tveit, A.T.; Hestnes, A.G.; Robinson, S.L.; Schintlmeister, A.; Dedysh, S.N.; Jehmlich, N.; von Bergen, M.; Herbold, C.; Wagner, M.; Richter, A.; et al. Widespread soil bacterium that oxidizes atmospheric methane. Proc. Natl. Acad. Sci. USA 2019, 116, 8515–8524. [Google Scholar] [CrossRef] [Green Version]
  42. Keller, M.; Mitre, M.E.; Stallard, R.F. Consumption of atmospheric methane in soils of central Panama: Effects of agricultural development. Glob. Biogeochem. Cycles 1990, 4, 21–27. [Google Scholar] [CrossRef]
  43. Verchot, L.V.; Davidson, E.A.; Cattânio, J.H.; Ackerman, I.L. Land-Use Change and Biogeochemical Controls of Methane Fluxes in Soils of Eastern Amazonia. Ecosystems 2000, 3, 41–56. [Google Scholar] [CrossRef]
  44. Lohila, A.; Aalto, T.; Aurela, M.; Hatakka, J.; Tuovinen, J.P.; Kilkki, J.; Penttilä, T.; Vuorenmaa, J.; Hänninen, P.; Sutinen, R.; et al. Large contribution of boreal upland forest soils to a catchment-scale CH4 balance in a wet year. Geophys. Res. Lett. 2016, 43, 2946–2953. [Google Scholar] [CrossRef] [Green Version]
  45. Sakabe, A.; Kosugi, Y.; Takahashi, K.; Itoh, M.; Kanazawa, A.; Makita, N.; Ataka, M. One year of continuous measurements of soil CH4 and CO2 fluxes in a Japanese cypress forest: Temporal and spatial variations associated with Asian monsoon rainfall. J. Geophys. Res. Biogeosci. 2015, 120, 585–599. [Google Scholar] [CrossRef] [Green Version]
  46. van Kruistum, H.; Bodelier, P.L.E.; Ho, A.; Meima-Franke, M.; Veraart, A.J. Resistance and Recovery of Methane-Oxidizing Communities Depends on Stress Regime and History; A Microcosm Study. Front. Microbiol. 2018, 9, 1714. [Google Scholar] [CrossRef] [Green Version]
  47. Davidson, E.A.; Belk, E.; Boone, R.D. Soil water content and temperature as independent or confounded factors controlling soil respiration in a temperate mixed hardwood forest. Glob. Change Biol. 1998, 4, 217–227. [Google Scholar] [CrossRef] [Green Version]
  48. Koh, H.-S.; Ochs, C.A.; Yu, K. Hydrologic gradient and vegetation controls on CH4 and CO2 fluxes in a spring-fed forested wetland. Hydrobiologia 2009, 630, 271–286. [Google Scholar] [CrossRef]
  49. Bowden, R.D.; Newkirk, K.M.; Rullo, G.M. Carbon dioxide and methane fluxes by a forest soil under laboratory-controlled moisture and temperature conditions. Soil Biol. Biochem. 1998, 30, 1591–1597. [Google Scholar] [CrossRef] [Green Version]
  50. Koschorreck, M.; Conrad, R. Oxidation of Atmospheric Methane in Soil—Measurements in the Field, in Soil Cores and in Soil Samples. Glob. Biogeochem. Cycles 1993, 7, 109–121. [Google Scholar] [CrossRef]
  51. Liu, J.; Chen, H.; Zhu, Q.; Shen, Y.; Wang, X.; Wang, M.; Peng, C. A novel pathway of direct methane production and emission by eukaryotes including plants, animals and fungi: An overview. Atmos. Environ. 2015, 115, 26–35. [Google Scholar] [CrossRef]
  52. Tang, X.; Liu, S.; Zhou, G.; Zhang, D.; Zhou, C. Soil-atmospheric exchange of CO2, CH4, and N2O in three subtropical forest ecosystems in southern China. Glob. Change Biol. 2006, 12, 546–560. [Google Scholar] [CrossRef]
  53. Baldocchi, D.D. Assessing the eddy covariance technique for evaluating carbon dioxide exchange rates of ecosystems: Past, present and future. Glob. Change Biol. 2003, 9, 479–492. [Google Scholar] [CrossRef] [Green Version]
  54. Krauss, K.W.; Holm, G.O.; Perez, B.C.; McWhorter, D.E.; Cormier, N.; Moss, R.F.; Johnson, D.J.; Neubauer, S.C.; Raynie, R.C. Component greenhouse gas fluxes and radiative balance from two deltaic marshes in Louisiana: Pairing chamber techniques and eddy covariance. J. Geophys. Res. Biogeosci. 2016, 121, 1503–1521. [Google Scholar] [CrossRef] [Green Version]
  55. Petrescu, A.M.; Lohila, A.; Tuovinen, J.P.; Baldocchi, D.D.; Desai, A.R.; Roulet, N.T.; Vesala, T.; Dolman, A.J.; Oechel, W.C.; Marcolla, B.; et al. The uncertain climate footprint of wetlands under human pressure. Proc. Natl. Acad. Sci. USA 2015, 112, 4594–4599. [Google Scholar] [CrossRef] [PubMed] [Green Version]
  56. Knox, S.H.; Jackson, R.B.; Poulter, B.; McNicol, G.; Fluet-Chouinard, E.; Zhang, Z.; Hugelius, G.; Bousquet, P.; Canadell, J.G.; Saunois, M.; et al. FLUXNET-CH4 Synthesis Activity: Objectives, Observations, and Future Directions. Bull. Am. Meteorol. Soc. 2019, 100, 2607–2632. [Google Scholar] [CrossRef] [Green Version]
  57. Chen, D.; Li, Y.; Liu, H.; Xu, H.; Xiao, W.; Luo, T.; Zhou, Z.; Lin, M. Biomass and carbon dynamics of a tropical mountain rain forest in China. Sci. China Life Sci. 2010, 53, 798–810. [Google Scholar] [CrossRef]
  58. Wilczak, J.M.; Oncley, S.P.; Stage, S.A. Sonic anemometer tilt correction algorithms. Bound. Layer Meteorol. 2001, 99, 127–150. [Google Scholar] [CrossRef]
  59. Fan, S.-M.; Wofsy, S.C.; Bakwin, P.S.; Jacob, D.J.; Fitzjarrald, D.R. Atmosphere-biosphere exchange of CO2 and O3 in the central Amazon Forest. J. Geophys. Res. 1990, 95, 16851. [Google Scholar] [CrossRef]
  60. Webb, E.K.; Pearman, G.I.; Leuning, R. Correction of flux measurements for density effects due to heat and water vapour transfer. Q. J. R. Meteorol. Soc. 1980, 106, 85–100. [Google Scholar] [CrossRef]
  61. Vickers, D.; Mahrt, L. Quality control and flux sampling problems for tower and aircraft data. J. Atmos. Ocean. Technol. 1997, 14, 512–526. [Google Scholar] [CrossRef]
  62. Foken, T.; Göockede, M.; Mauder, M.; Mahrt, L.; Amiro, B.; Munger, W. Post-Field Data Quality Control. In Handbook of Micrometeorology: A Guide for Surface Flux Measurement and Analysis; Lee, X., Massman, W., Eds.; Springer: Dordrecht, The Netherlands, 2005; pp. 181–208. [Google Scholar]
  63. Wang, M.; Wu, J.; Lafleur, P.M.; Luan, J.; Chen, H.; Zhu, X. Temporal shifts in controls over methane emissions from a boreal bog. Agric. For. Meteorol. 2018, 262, 120–134. [Google Scholar] [CrossRef]
  64. Reichstein, M.; Falge, E.; Baldocchi, D.; Papale, D.; Aubinet, M.; Berbigier, P.; Bernhofer, C.; Buchmann, N.; Gilmanov, T.; Granier, A.; et al. On the separation of net ecosystem exchange into assimilation and ecosystem respiration: Review and improved algorithm. Glob. Change Biol. 2005, 11, 1424–1439. [Google Scholar] [CrossRef]
  65. Kim, Y.; Johnson, M.S.; Knox, S.H.; Black, T.A.; Dalmagro, H.J.; Kang, M.; Kim, J.; Baldocchi, D. Gap-filling approaches for eddy covariance methane fluxes: A comparison of three machine learning algorithms and a traditional method with principal component analysis. Glob. Change Biol. 2020, 26, 1499–1518. [Google Scholar] [CrossRef]
  66. Finkelstein, P.L.; Sims, P.F. Sampling error in eddy correlation flux measurements. J. Geophys. Res. Atmos. 2001, 106, 3503–3509. [Google Scholar] [CrossRef]
  67. Knox, S.H.; Matthes, J.H.; Sturtevant, C.; Oikawa, P.Y.; Verfaillie, J.; Baldocchi, D. Biophysical controls on interannual variability in ecosystem-scale CO2 and CH4 exchange in a California rice paddy. J. Geophys. Res. Biogeosci. 2016, 121, 978–1001. [Google Scholar] [CrossRef]
  68. Xiao, D.M.; Wang, M.; Wang, Y.S.; Ji, L.Z.; Han, S.J. Fluxes of soil carbon dioxide, nitrous oxide and firedamp in broadleaved/Korean pine forest. J. For. Res. 2004, 15, 107–112. [Google Scholar] [CrossRef]
  69. Dušek, J.; Nguyen, V.X.; Le, T.X.; Pavelka, M. Methane and carbon dioxide emissions from different ecosystems at the end of dry period in South Vietnam. Trop. Ecol. 2020, 62, 1–16. [Google Scholar] [CrossRef]
  70. Dalmagro, H.J.; Zanella de Arruda, P.H.; Vourlitis, G.L.; Lathuilliere, M.J.; de Nogueira, S.J.; Couto, E.G.; Johnson, M.S. Radiative forcing of methane fluxes offsets net carbon dioxide uptake for a tropical flooded forest. Glob. Change Biol. 2019, 25, 1967–1981. [Google Scholar] [CrossRef] [PubMed]
  71. Sakabe, A.; Itoh, M.; Hirano, T.; Kusin, K. Ecosystem-scale methane flux in tropical peat swamp forest in Indonesia. Glob. Change Biol. 2018, 24, 5123–5136. [Google Scholar] [CrossRef] [PubMed]
  72. Chamberlain, S.D.; Hemes, K.S.; Eichelmann, E.; Szutu, D.J.; Verfaillie, J.G.; Baldocchi, D.D. Effect of Drought-Induced Salinization on Wetland Methane Emissions, Gross Ecosystem Productivity, and Their Interactions. Ecosystems 2019, 23, 675–688. [Google Scholar] [CrossRef]
  73. Song, W.; Wang, H.; Wang, G.; Chen, L.; Jin, Z.; Zhuang, Q.; He, J.S. Methane emissions from an alpine wetland on the Tibetan Plateau: Neglected but vital contribution of the nongrowing season. J. Geophys. Res. Biogeosci. 2015, 120, 1475–1490. [Google Scholar] [CrossRef]
  74. Zhao, J.F.; Peng, S.S.; Chen, M.P.; Wang, G.Z.; Cui, Y.B.; Liao, L.G.; Feng, J.G.; Zhu, B.; Liu, W.J.; Yang, L.Y.; et al. Tropical forest soils serve as substantial and persistent methane sinks. Sci. Rep. 2019, 9, 16799. [Google Scholar] [CrossRef]
  75. Jha, C.S.; Rodda, S.R.; Thumaty, K.C.; Raha, A.K.; Dadhwal, V.K. Eddy covariance based methane flux in Sundarbans mangroves, India. J. Earth Syst. Sci. 2014, 123, 1089–1096. [Google Scholar] [CrossRef] [Green Version]
  76. Li, H.; Dai, S.; Ouyang, Z.; Xie, X.; Guo, H.; Gu, C.; Xiao, X.; Ge, Z.; Peng, C.; Zhao, B. Multi-scale temporal variation of methane flux and its controls in a subtropical tidal salt marsh in eastern China. Biogeochemistry 2018, 137, 163–179. [Google Scholar] [CrossRef]
  77. Liu, J.; Zhou, Y.; Valach, A.; Shortt, R.; Kasak, K.; Rey-Sanchez, C.; Hemes, K.S.; Baldocchi, D.; Lai, D.Y.F. Methane emissions reduce the radiative cooling effect of a subtropical estuarine mangrove wetland by half. Glob. Change Biol. 2020, 26, 4998–5016. [Google Scholar] [CrossRef]
  78. Steudler, P.A.; Melillo, J.M.; Feigl, B.J.; Neill, C.; Piccolo, M.C.; Cerri, C.C. Consequence of forest-to-pasture conversion on CH4fluxes in the Brazilian Amazon Basin. J. Geophys. Res. Atmos. 1996, 101, 18547–18554. [Google Scholar] [CrossRef] [Green Version]
  79. Yan, Y.; Sha, L.; Cao, M.; Zheng, Z.; Tang, J.; Wang, Y.; Zhang, Y.; Wang, R.; Liu, G.; Wang, Y.; et al. Fluxes of CH4 and N2O from soil under a tropical seasonal rain forest in Xishuangbanna, Southwest China. J. Environ. Sci. 2008, 20, 207–215. [Google Scholar] [CrossRef]
  80. Yu, X.; Song, C.; Sun, L.; Wang, X.; Shi, F.; Cui, Q.; Tan, W. Growing season methane emissions from a permafrost peatland of northeast China: Observations using open-path eddy covariance method. Atmos. Environ. 2017, 153, 135–149. [Google Scholar] [CrossRef]
  81. Le Mer, J.; Roger, P. Production, oxidation, emission and consumption of methane by soils: A review. Eur. J. Soil Biol. 2001, 37, 25–50. [Google Scholar] [CrossRef]
  82. Nesbit, S.P.; Breitenbeck, G.A. A Laboratory Study of Factors Influencing Methane Uptake by Soils. Agric. Ecosyst. Environ. 1992, 41, 39–54. [Google Scholar] [CrossRef]
  83. Knox, S.H.; Sturtevant, C.; Matthes, J.H.; Koteen, L.; Verfaillie, J.; Baldocchi, D. Agricultural peatland restoration: Effects of land-use change on greenhouse gas (CO2 and CH4) fluxes in the Sacramento-San Joaquin Delta. Glob. Change Biol. 2015, 21, 750–765. [Google Scholar] [CrossRef]
  84. Morin, T.H.; Bohrer, G.; Naor-Azrieli, L.; Mesi, S.; Kenny, W.T.; Mitsch, W.J.; Schäfer, K.V.R. The seasonal and diurnal dynamics of methane flux at a created urban wetland. Ecol. Eng. 2014, 72, 74–83. [Google Scholar] [CrossRef]
  85. Chu, H.S.; Chen, J.Q.; Gottgens, J.F.; Ouyang, Z.T.; John, R.; Czajkowski, K.; Becker, R. Net ecosystem methane and carbon dioxide exchanges in a Lake Erie coastal marsh and a nearby cropland. J. Geophys. Res. Biogeosci. 2014, 119, 722–740. [Google Scholar] [CrossRef]
  86. Koebsch, F.; Jurasinski, G.; Koch, M.; Hofmann, J.; Glatzel, S. Controls for multi-scale temporal variation in ecosystem methane exchange during the growing season of a permanently inundated fen. Agric. For. Meteorol. 2015, 204, 94–105. [Google Scholar] [CrossRef]
  87. Keppler, F.; Hamilton, J.T.G.; Brass, M.; Rockmann, T. Methane emissions from terrestrial plants under aerobic conditions. Nature 2006, 439, 187–191. [Google Scholar] [CrossRef] [PubMed]
Figure 1. (A) Site location map of Hainan Province, China, (B) topography of the study area, and (C) Google Earth map around flux tower.
Land 11 00154 g001
Figure 2. The structure of the artificial neural network with three layers: an input layer, a hidden layer, and an output layer. The input layer contains seven variables: Tair (air temperature), LE (latent heat flux), VWC (soil volumetric water content at 10 cm depth), Pa (atmospheric pressure), Tsoil (soil temperature at 10 cm depth), u* (friction velocity), and RH (relative humidity).
Land 11 00154 g002
Figure 3. Time series of daily averaged environmental variables at the tropical rainforest site during the study period, including temperature ((a), air temperature, Tair; soil temperature at 10 cm depth, Tsoil; °C), soil volumetric water content at 10 cm depth ((b), VWC, %), rainfall ((c), mm), latent heat flux ((d), LE, W m−2), and atmospheric pressure ((e), Pa, kPa).
Land 11 00154 g003
Figure 4. Diurnal pattern of CH4 flux from tropical rainforests over the 3-year study period. The gray area stands for 95% confidence.
Land 11 00154 g004
Figure 5. Time series of half-hourly (gray circles) and daily (green lines) CH4 fluxes.
Land 11 00154 g005
Figure 6. Annual CH4 budgets in 3-year study period.
Land 11 00154 g006
Figure 7. Schematic diagram of the global warming impacts on tropical rainforest CH4 uptakes. Global warming, facilitating high temperatures and low precipitation, can increase soil temperature, decrease soil moisture levels, accelerate methanotroph activities, and moderate methanogen activities, leading to an increase in CH4 oxidation in tropical rainforests and thus generating negative feedback against global warming.
Land 11 00154 g007
Table 1. Relationships between daily CH4 flux and various environmental variables using stepwise multivariate linear regression (R2) and an artificial neural network (R2). Tair: air temperature, VWC: soil volumetric water content at −10 cm, LE: latent heat flux, Tsoil: soil temperature at −10 cm, Pa: atmospheric pressure, u*: friction velocity, RH: relative humidity. *** p < 0.001.
Environmental VariablesStepwiseArtificial Neural Network
R2R2
Tair0.068 ***0.504
Tair + LE0.091 ***0.608
Tair + LE + VWC0.101 ***0.624
Tair + LE + VWC + Pa0.101 ***0.563
Tair + LE + VWC + Pa + Tsoil0.101 ***0.689
Tair + LE + VWC + Pa + Tsoil + u*0.111 ***0.624
Tair + LE + VWC + Pa + Tsoil + u*+ RH0.117 ***0.624
Table 2. Reported FCH4 in different ecosystems in tropical and subtropical regions. Daily and annual fluxes are presented for short-term and long-term eddy covariance measurements, respectively.
CountryLatitudeClimateEcosystem TypeMethodDurationDaily Flux
(mg CH4 m−2 day−1)
Annual Flux
(g CH4 m−2 year−1)
References
China18°03′ N, 108°03′ ETropicalMountain rainforestChamberevery quarter in a year−1.34NA[22]
China18°38′ N, 108°57′ ETropicalMountain rainforestChamberevery month in a year−4.98 NA[21]
Vietnam12°10′ N, 108°41′ ETropicalMontane rainforestChamber6 days−0.4–−1.07NA[69]
China23°11′ N, 112°33′ ESubtropicalForestChamberevery month in a yearNA−0.453[69]
China18°40′ N, 109°54′ ETropicalRainforestChamberevery month in 2 yearsNA−0.267[74]
China18°03′ N, 108°03′ ETropicalMontane rainforestEC3 years−8.80−1.26This study
India21°48′ N, 88°37′ ETropicalMangroveEC2 months0.11NA[75]
Malaysia1°27′ N, 111°08′ ETropicalPeat forestEC2 months0.024NA[24]
America29°30′ N, 90°26′ WSubtropicalSalt marshEC1.25 yearsNA11.1[54]
China31°31′ N, 121°57′ ESubtropicalSalt marshEC2 yearsNA17.6[76]
Indonesia2°19′ S, 113°54′ ETropicalPeat swamp forestEC1 yearNA0.12−0.23[71]
Brazil16°29′ S, 56°24′ WTropicalFlooded forestEC3.5 yearsNA20.3[70]
China22°29′ N, 114°01′ ESubtropicalMangroveEC3 yearsNA11.7[77]
Publisher’s Note: MDPI stays neutral with regard to jurisdictional claims in published maps and institutional affiliations.

