Article

Correlation between Urban Commercial Nodes and the Development of Sci-Tech Enterprises in Hangzhou West High-Tech Corridor, China

1
Department of Architecture, Zhejiang University, Hangzhou 310058, China
2
International Center for Architecture & Urban Development Studies, Zhejiang University, Hangzhou 310058, China
3
China Institute for New Urbanization Studies, Zhejiang University, Hangzhou 310058, China
4
School of Architecture and Urban Planning, Anhui Jianzhu University, Hefei 230601, China
*
Author to whom correspondence should be addressed.
Land 2022, 11(11), 2086; https://doi.org/10.3390/land11112086
Submission received: 25 October 2022 / Revised: 15 November 2022 / Accepted: 16 November 2022 / Published: 18 November 2022
(This article belongs to the Section Urban Contexts and Urban-Rural Interactions)

Abstract

:
Single-function industrial parks are transforming into innovation districts which combine innovation elements with urban elements. As one of the urban elements, the urban commercial nodes (UCNs) have exhibited a co-evolution phenomenon with sci-tech enterprises (STEs) in innovation districts. However, the urban planning practice of many innovation districts still falls behind in converting industrial land to commercial land use after construction, and the problem of mismatching commercial resources with consumer demand persists. This study aimed to explore how to rationalize the planning of UCNs to make them better fulfill the mission of serving economic growth by analyzing the correlation between UCNs and the development of STEs. The Hangzhou West High-Tech Corridor was adopted as a typical research sample which represents the latest development trend occurring in China’s most innovative districts and leads China in the coordinated development of sci-tech industries and urban life. Using point-of-interest data, Internet assessment data, and corporate business information data, a spatial correlation test and partial least squares regression analysis were performed. The results show that there was a significant spatial correlation between UCNs and STEs. The scale of UCNs had a significant positive correlation with the degree of agglomeration, development scale, and comprehensive development level of the STEs. The catering; hotel; and culture, sports, and entertainment industries correlated the most with STE development. The commercial complex was one of the physical forms that were conducive to the development of surrounding STEs. This study provides references for rational planning of UCNs and STE clusters, and for optimizing the allocation of commercial resources and physical commercial forms in the urban planning process of innovation districts.

1. Introduction

Single-function industrial parks have faced many development difficulties due to the lack of urban elements, such as the separation of industry and city, low land output efficiency, talent loss, and the mismatch between employment population and consumption structure [1,2,3]. In the context of China’s urbanization transformation and innovation-driven development strategy [4,5], urban industrial spaces have experienced an evolution from single-function “industrial parks” to urban “innovation districts”, which integrate innovative elements and multiple urban elements [6,7,8,9]. The urban commercial node (UCN) is one of the urban elements and provides diversified living services inside innovation districts. Driven by market demand, UCNs and sci-tech enterprises (STEs), respectively, represent the most active areas of consumption and the main vehicles of production in innovation districts, and have exhibited a co-evolution phenomenon. The integration of urban producing and living functions reflects the transformation of urban development from “production-oriented” to “people-oriented”.
Although some planning theories have advocated for an appropriate mix of STE clusters and UCNs in innovation districts, such as the theory of urban mixed land use [10], the theory of urban amenity [11], and the strategy of industry–city integration [12,13], the urban planning practice of many innovation districts still falls behind in converting industrial land to commercial land use after construction, and the problem of mismatching commercial resources with consumer demand persists. First, the previous urban planning of innovation districts only regarded the commercial service facilities as a basic supporting function. Many government-led urban planning innovation districts still focused on introducing STEs and productive service industries and did not view their development with an urbanization attitude. Since there were not enough spaces reserved for commercial service industries in productive clusters, many industrial parks faced problems associated with lacking commercial functions soon after they were built. For example, Shanghai Lujiazui CBD converted the entire bottom of the office buildings to commercial service function shortly after construction, and Shanghai Zhangjiang High-Tech Park replaced some software parks with commercial centers [14]. Additionally, the mismatch between commercial resources and the consumer demand of surrounding STEs makes many newly built commercial centers fail to meet the planning expectations of attracting people. According to our investigation of many of China’s new innovation districts, many upscale commercial centers are far less popular on holidays than on workdays. The queues are mainly observed in restaurants and supermarkets, while retail stores such as clothing shops are unpopular for most of the time. Therefore, at this stage of high-quality urban development, it is necessary to reflect on how to plan UCNs in relation to STEs in order to make them better fulfill the mission of serving regional economic growth: How to rationalize the spatial distribution of UCNs and STEs in innovation districts? How will the allocation of commercial resources in UCNs benefit the development of surrounding STEs?
The Hangzhou West High-Tech Corridor is a characteristic case for studying the correlation between UCNs and the development of STEs. Unlike most one-time planned industrial parks in China, the Corridor is special, as it is not a “planned project”. The concept of Hangzhou West High-Tech Corridor was first proposed by Hangzhou Municipal Government in 2014. Before that, these areas were separately governed and planned by three district governments. The Corridor has experienced multi-level government-led urban planning, real estate development, urban regeneration, formal and informal urban village transformation, and spontaneous development processes, rather than following a particular planning model and being built on a piece of vacant land all at once. As a result, the Corridor is a multi-function innovation district where old and new urban areas coexist and working and living is integrated, and it consists of different urban morphology compared with traditional single-function industrial parks. In other words, the urban elements inside the Corridor have already existed when the innovation elements were introduced. After that, the innovation elements and the urban elements have promoted each other and developed together. Therefore, the Corridor leads China in the coordinated development of sci-tech industries and urban life.
The Corridor represents the latest development trend in China’s innovation districts. First, the innovation elements inside the Corridor are highly concentrated, leading to the rapid growth of the economy and a rapid inflow of knowledgeable workers. There are giant parks with a single enterprise (represented by Alibaba Xixi Park), incubation parks for emerging small- and medium-sized enterprises (represented by Haichuang Park), and characteristic towns (represented by The Dream Town) [15]. From 2016 to 2020, the average annual growth of the added value of industry in the Corridor was 23%, the average annual growth of the added value of the high-tech industry was 22.6%, and the added value of the core industries of the digital economy accounted for more than 30% of the added value of Zhejiang Province [16]. In 2020, the total number of talented professionals in the Corridor reached 450,000 [16]. The resident population of the Corridor is about 950,000, with an average annual growth rate of 21%, and the net inflow rate of talent was 2.5 times higher than in Hangzhou. Residents aged 18–38 accounted for more than 50% of the population, far exceeding the average of Hangzhou [17]. Second, the urban functions inside the Corridor are relatively mature. The outstanding ecological resources, sufficient urban amenities, as well as a balanced job–housing relationship [18] contribute to the livability of the Corridor. UCNs of different scales are located inside the Corridor. The Corridor contains the west Hangzhou CBD (which is one of the sub-centers of Hangzhou and is under construction), many newly built independent commercial complexes, as well as lively commercial streets with small-scale open blocks in the old city. As a result, the integration of UCNs and STEs created a lively 24 h atmosphere in the Corridor, avoiding the silent night scene associated with traditional industrial parks. Thus, data from abundant enterprises and commercial facilities provided an adequate research sample for this study.
This study aimed to understand the correlation between UCNs and STEs, including the spatial and statistical correlations between development indicators, adopting the Hangzhou West High-Tech Corridor as a research sample. Essentially, we aimed to investigate the mutual impact of the mixed-use commercial and industrial land on the development of STEs in innovation districts. According to the Industrial Classification for National Economic Activities 2017 (GB/T4754-2017) [19], we chose commercial service industries to represent UCN, including the catering industry; hotel industry; retail industry; resident service industry; finance and insurance industry; and the culture, sports, and entertainment industry. Multivariate data, quantitative spatial analysis, and statistical analysis were used to study the spatial correlation between UCNs and STEs and to compare the differences in the correlation between six commercial service industries and the development of STEs. This study revealed guidelines for reasonably mixing urban industrial land and commercial land and optimizing the allocation of urban commercial resources in the urban planning process of innovative districts. In addition, the results provide a reference for repairing the commercial functions in urban single-function built-up industrial parks.
Following this introduction in Section 1, relevant studies and practices are summarized in Section 2. The study area and data source are presented in Section 3. Then, the methodological approach is elaborated in Section 4. Afterwards, results of the spatial and statistical correlation between STEs and UCNs are revealed in Section 5. Finally, in Section 6, the key findings are highlighted, and some suggestions for the urban planning of innovation districts are discussed.

2. Review of Relevant Studies

This study focused on the interactive relationship between UCNs and the development of STEs in innovation districts. Relevant studies have included the attitude change of the planning of industrial parks towards UCNs, the demand for commercial services from knowledge workers, and the factors affecting the development of STEs.
The transformation of urban industrial spaces from single-function industrial parks which exclude commercial service facilities to multi-function innovation districts which advocate the integration of commercial land and industrial land is well documented. In the past three decades’ rapid urbanization process [20], China has built large numbers of single-function industrial parks, imitating the planning model based on urban functional zoning theory in western countries. Previous single-function industrial parks excluded urban functions (including commercial service function), as the high-polluting traditional industries have forced the urban functions to separate from the production function. Meanwhile, urban industrial land was intensively planned to leverage the advantages of assembly effects, strive for preferential policies, and attract capital investment [21]. However, the lack of urban functions has restricted industrial upgrading and caused the industrial parks to become isolated economic islands [22]. With the transformation of traditional industrial parks into innovation districts, some planning theories started to advocate the mixing of STE clusters with commercial facilities. The theory of urban mixed land use proposed to mix residential, commercial, industrial, transportation, and other functions to implement sustainable urban development by ensuring multiple functions within reasonable distances [10]. The theory of urban amenity suggests that diverse and convenient commercial services could attract knowledge workers by providing attractive shopping centers, cultural spaces, restaurants, and sports facilities, thereby enhancing regional competitiveness [11]. The industry–city integration strategy proposed the economic development subject should transform from a single production-oriented park to a diversified urban area that combines production, services, and consumption [12,13,23]. Meanwhile, the number of jobs created by catering, retail, and leisure services is even more than those in knowledge-intensive sectors [24]. These lower value-added jobs also have important implications for promoting social equity and urban prosperity. In recent years, proposals of repairing UCN functions in single-function industrial parks can be observed globally. North Carolina’s Research Triangle Park introduced a vibrant central district allowing for greater density of amenities, including more retail [9]. The 22@Barcelona Plan suggested a compact and diverse city with coexisting activities such as research, technology transfer, housing, and trading in one high-quality environment [25]. Large numbers of skilled people were attracted by this new sustainable urban lifestyle, in which the traditional division between production and consumption is blurred [26]. The London Plan 2004 proposed the concept of a Central Activity Zone (CAZ). Unlike CBDs with functions limited to financial industry, CAZs are multifunctional urban service centers that include commercial, office, leisure, restaurants, culture, and education. Previous studies have theoretically advocated a mixed industrial and commercial land in innovation districts, but there is still lack of researches on specifically guiding how to reasonably plan UCNs in practice.
Some studies explain the necessity of UCNs inside the innovation districts from the perspective of knowledge workers’ demands. Only by becoming a “city of people” can an innovation district accomplish its “mission of innovation.” The driving force behind the development of sci-tech industries appears to be its ability to attract and retain skilled workers [27]. An educated and talented workforce is considered to be a key asset for clustering innovative industries and stimulating economic growth [28,29,30]. Knowledge workers are generally characterized as being highly educated and highly compensated. Thus, they typically seek sophisticated lifestyles, including a higher quality of life with greater cultural and social characteristics [31,32,33], rather than simply where the high-paying jobs are [34]. UCNs can provide diverse urban amenities for the local workforce. Therefore, in terms of physical urban spaces, mixing UCNs and STE clusters is conducive to attract and retain talent in innovation districts [11]. Regarding the social and cultural atmosphere, knowledge workers prefer ambience-enhancing social amenities that encourage social and business interactions [35,36], such as cafés and restaurants, dynamic nightlife, street art, ample leisure and academic activities, etc. [37]. Through these social activities, informal interactions among knowledge workers promote the spillover of knowledge [38]. UCNs are the main places that enable these social activities. Therefore, to some extent, UCNs are also responsible for producing innovation. The existing literature has described some of the required commercial service facilities and commercial activities inside innovation districts from the perspective of knowledge workers’ needs, such as cafés, restaurants, shopping malls, leisure, culture. However, few studies focused on systematically comparing the differences in the contribution of the six commercial service industries to the development of surrounding STEs.
Previous studies on the factors influencing the development of STEs include factors that directly impact the development of STEs, and ancillary factors that correlated with the development of STEs. In the past, Sci-Tech parks focused more on the direct factors, such as a broader framework policy [39]; financial capital and the guidance of managing funds [40,41]; diversified professional advisory and resource intermediary services provided by Sci-Tech parks [42]; and the regional interaction among universities, industry, and government [43]. However, with the industrial upgrading, the extensive development mode which simply relied on policy preferences and investments has fallen into a bottleneck. At this time, as an ancillary factor, the correlation between urban elements and the development of STEs has become more significant. The proximity of residential and working areas may promote the development and agglomeration of STEs, and more people commuting within 5 km was conducive to the innovative development of STEs [18]. Open spaces, especially for wetlands, parks, and squares, have significant quantitative correlations with the number and the scale of STEs [44]. Although many studies considered UCN as one of the necessary urban elements in innovation districts from the perspective of knowledge workers’ needs, there is a lack of research supporting what factors of UCNs are necessary from the perspective of STE performance in innovation districts.
In summary, existing studies have encouraged the mixing of industrial and commercial land in innovation districts, and some researches have explained the necessity of UCNs from the perspective of the demand of knowledge workers. However, there is still a lack of material regarding what kind of commercial services are needed from the perspective of the development of STEs, and a lack of discussion regarding the relevance of UCNs and STEs from the perspective of urban planning. We speculate that these are two of the reasons for the insufficient reservation of commercial-use land allocation and the mismatch of commercial resources with consumer demands. Therefore, this study started from the above gaps and selected the Hangzhou West High-Tech Corridor, which leads China in the coordinated development of sci-tech industries and urban life, as a typical research sample. This article used spatial analysis and statistical analysis to filter the beneficial commercial service elements for the development of STEs, and provided references for how to plan UCNs inside innovation districts.

3. Study Area, Data Source, and Data Preprocessing
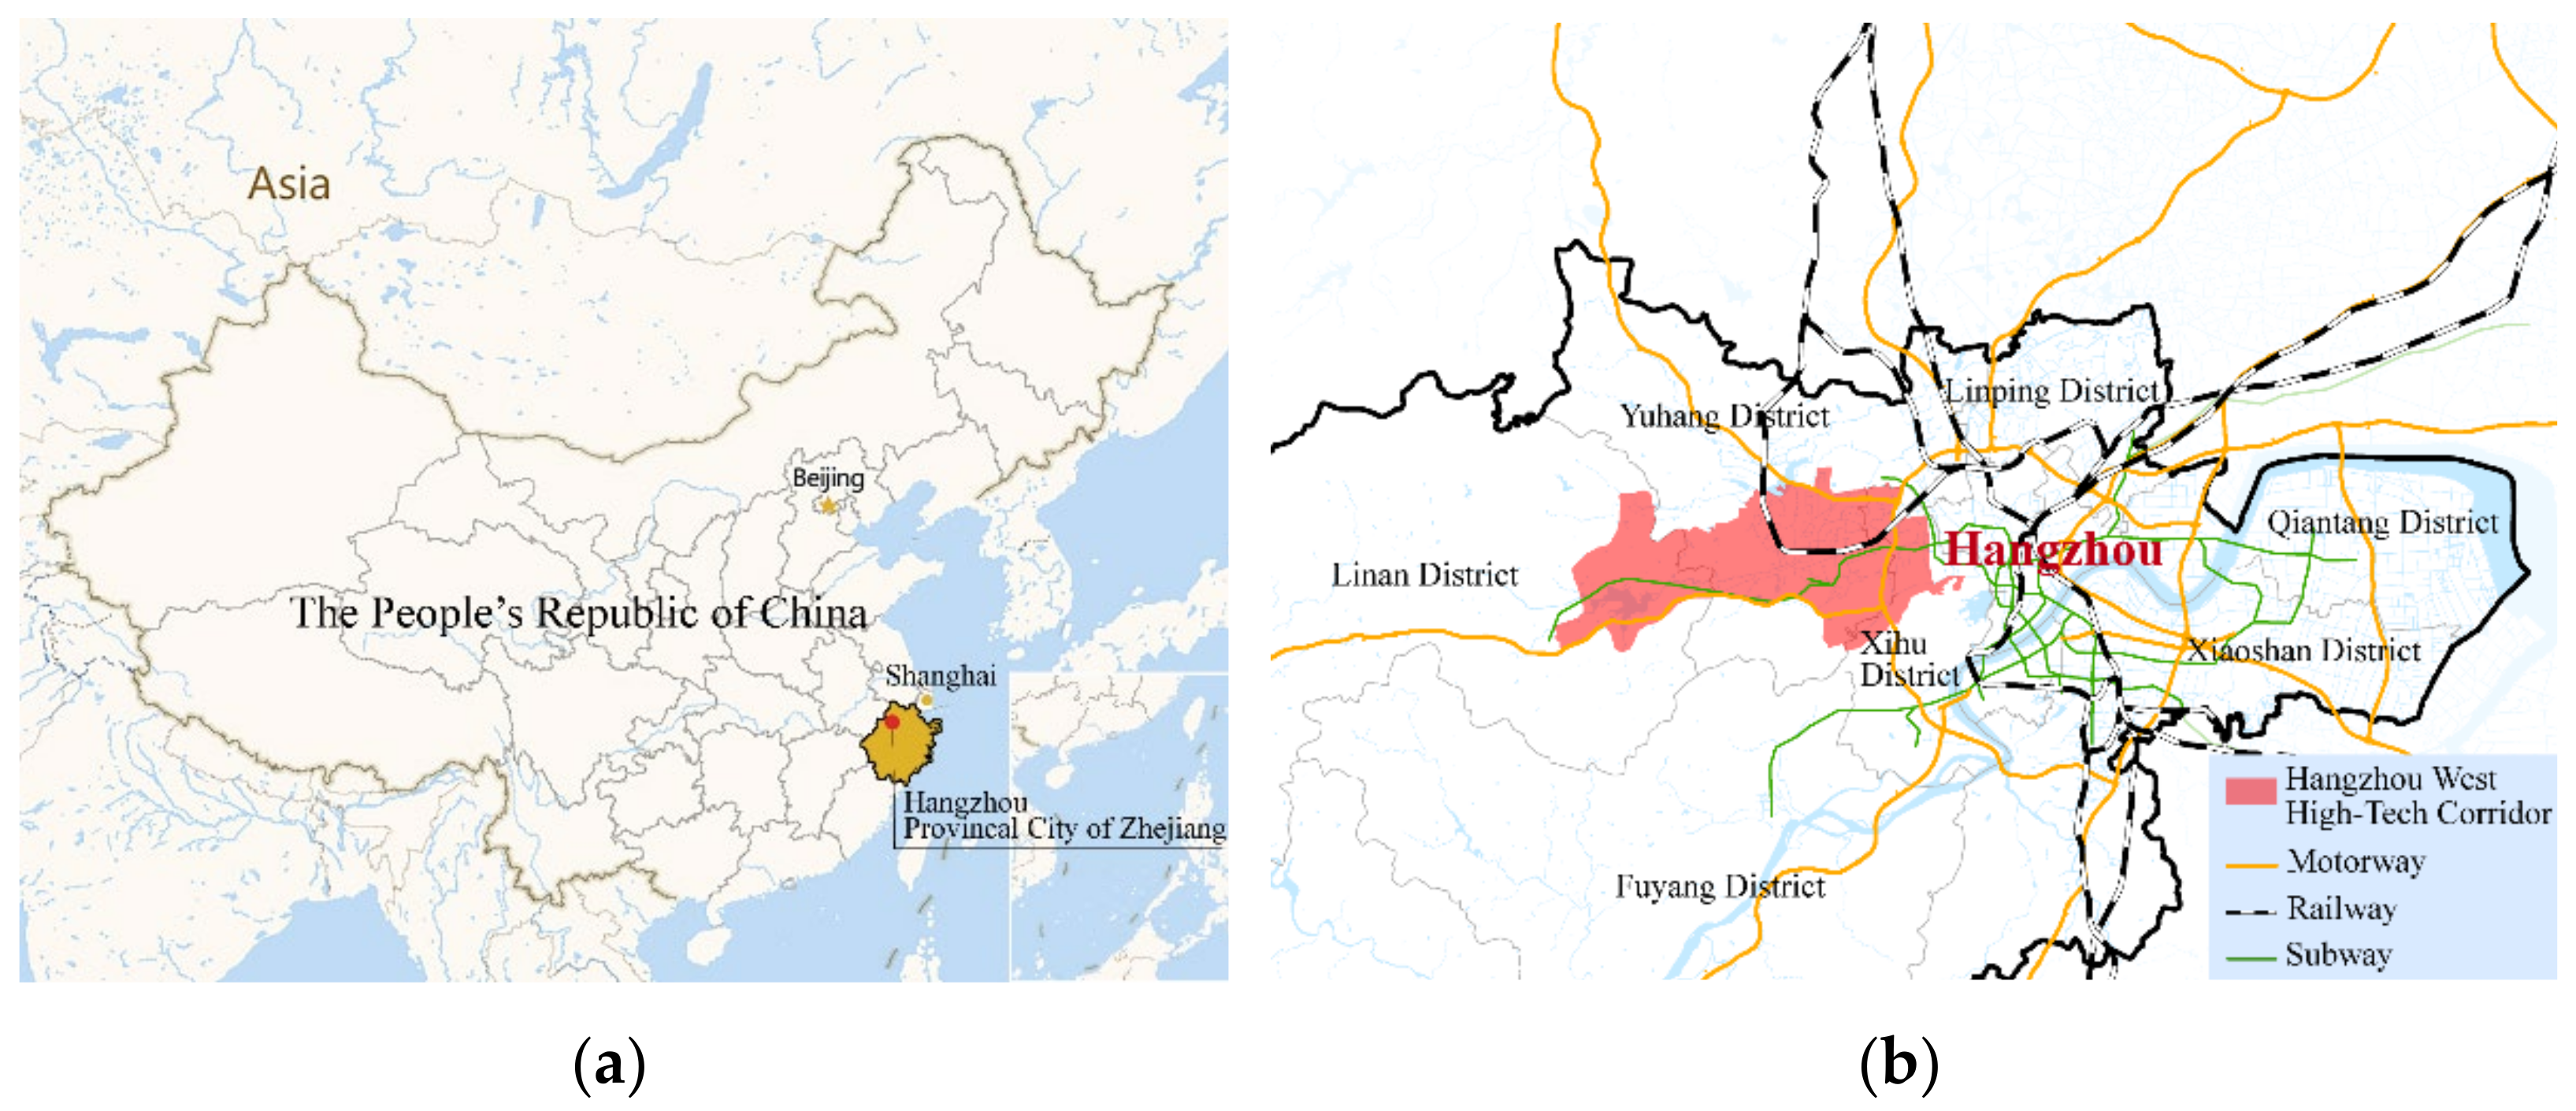
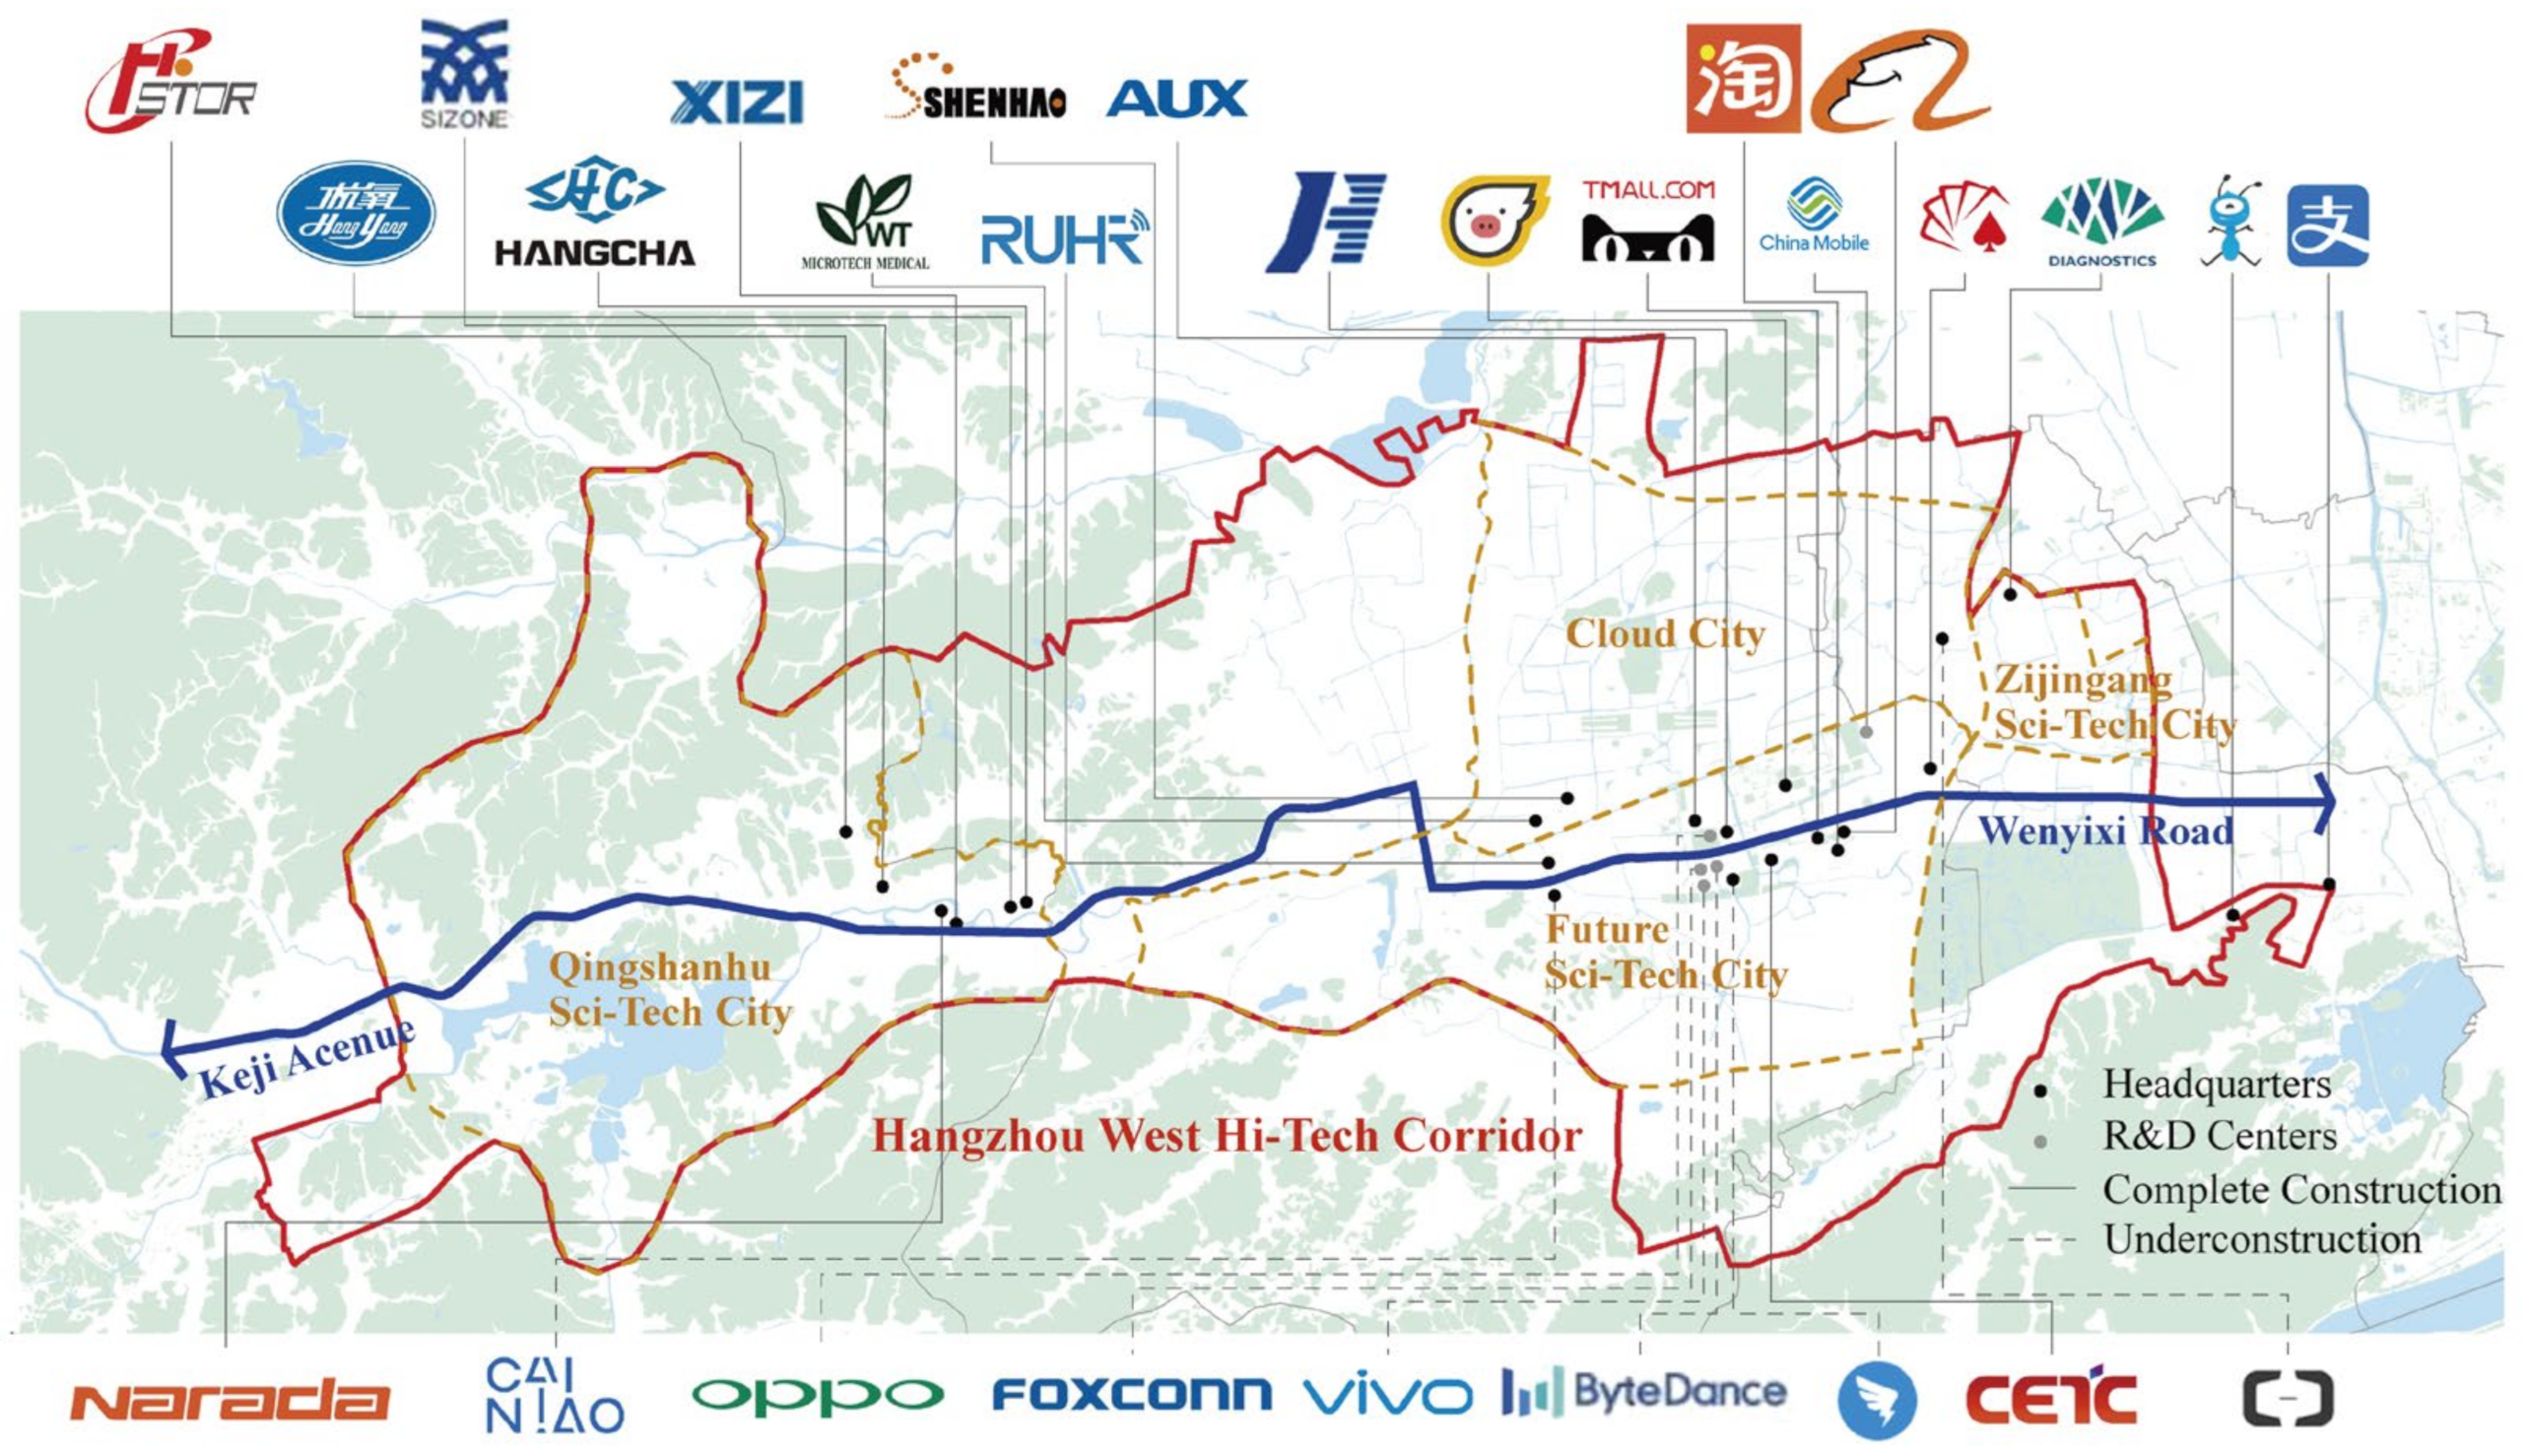
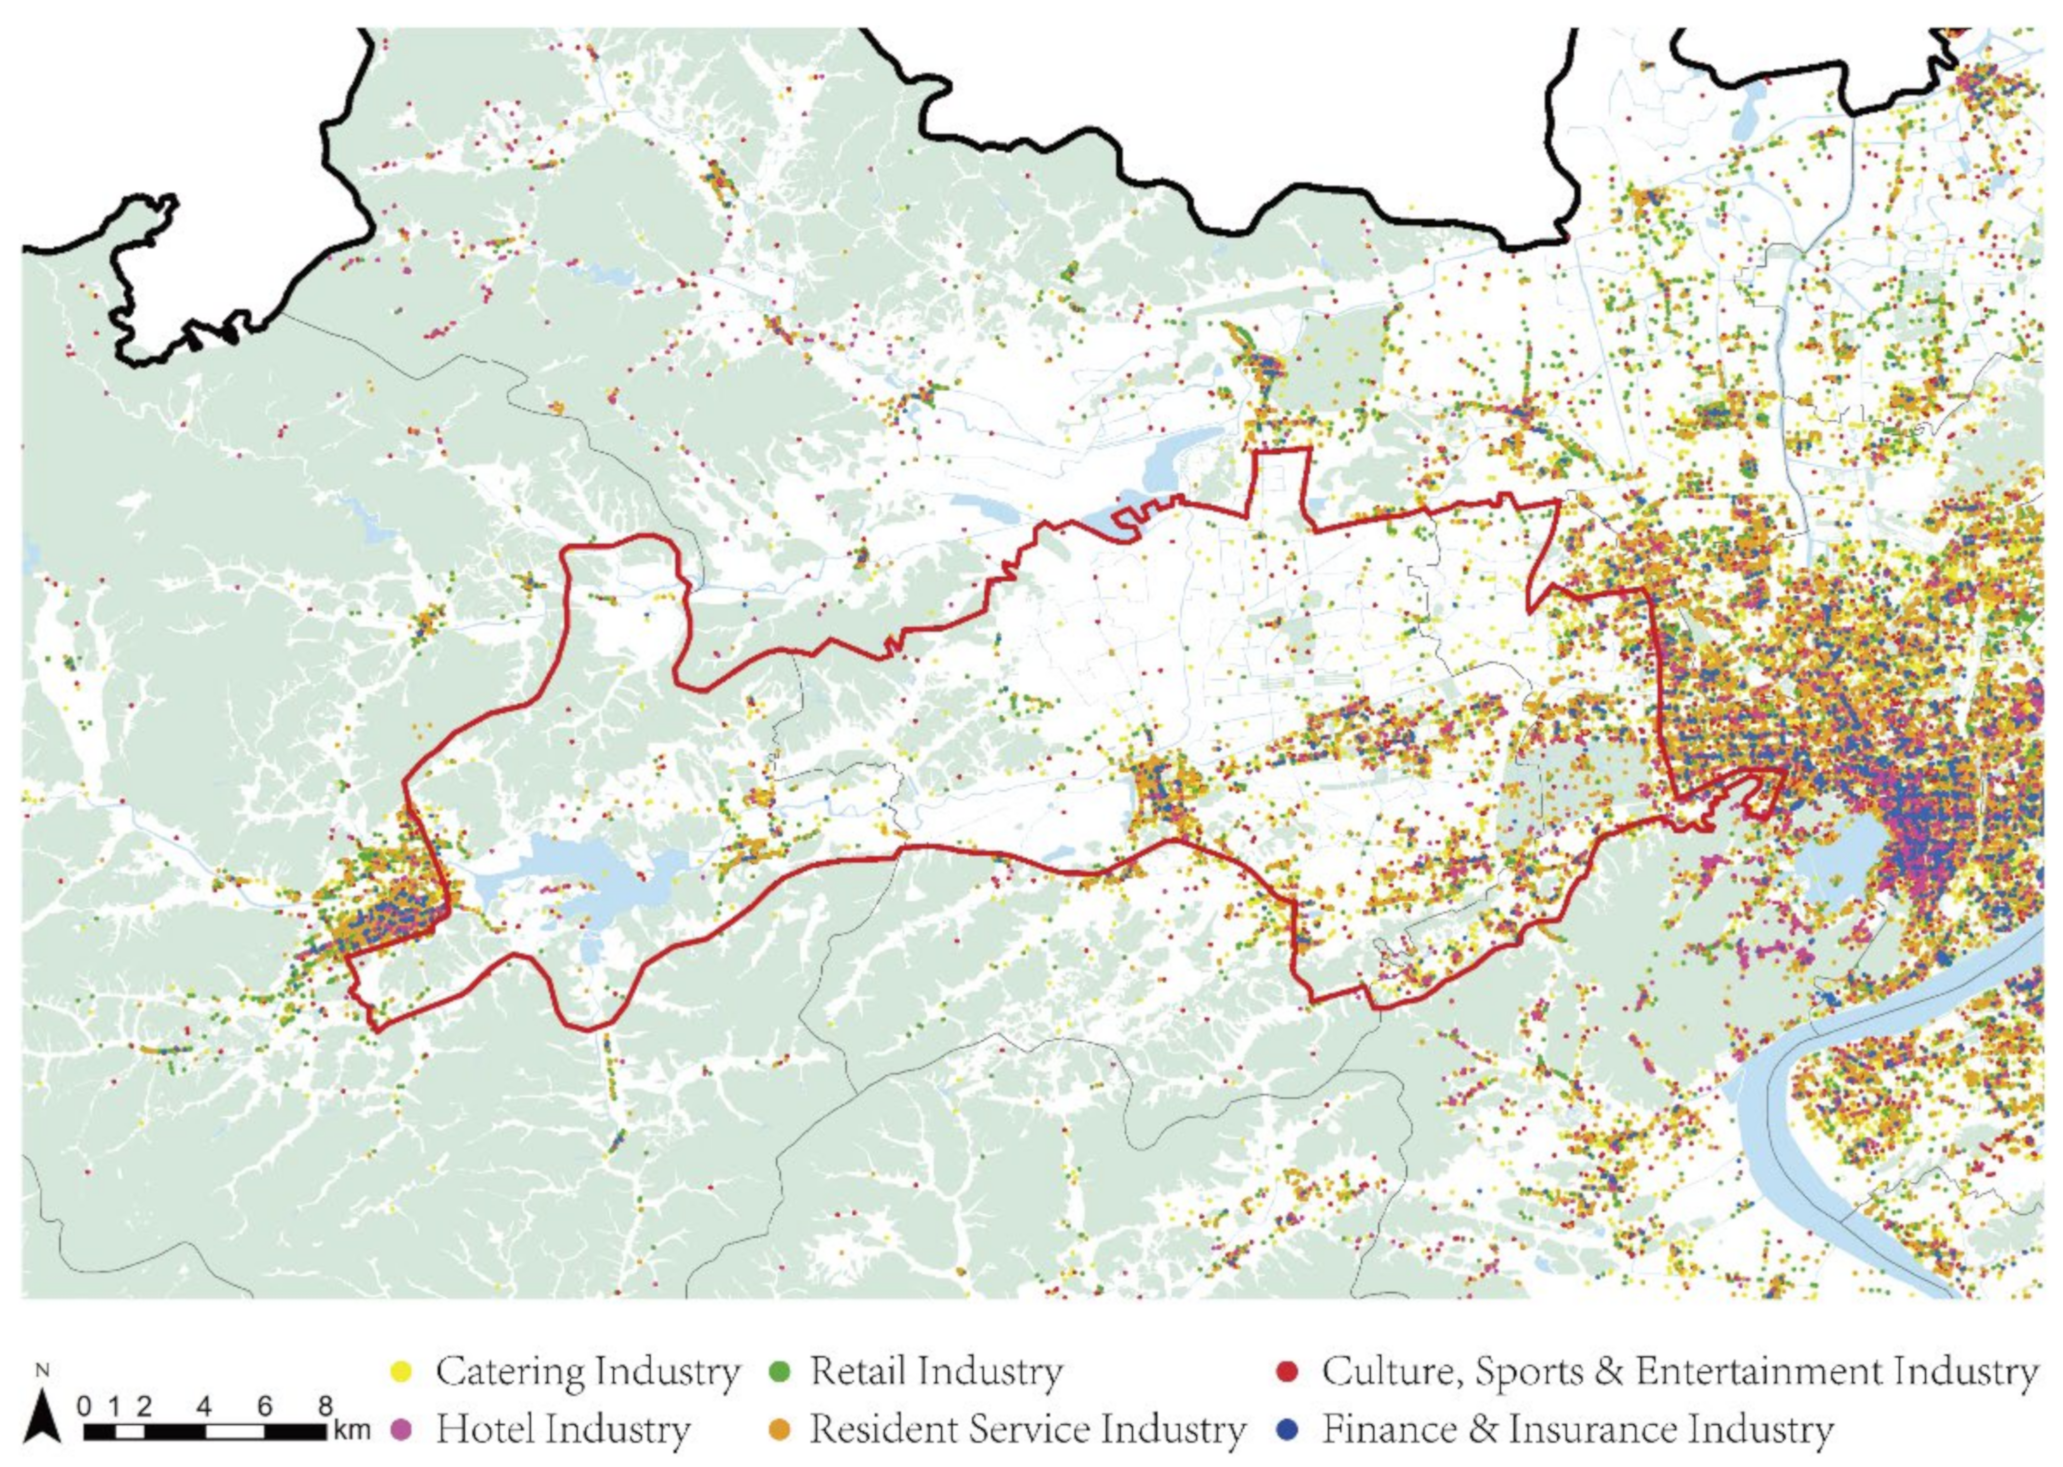
3.1. Study Area

This study took the core area of the Hangzhou West High-Tech Corridor and a one-kilometer periphery outside its planning boundary as the study area. The Corridor is located in the west of Hangzhou (Figure 1a,b), which is the provincial capital city of Zhejiang Province in China, and one of the core cities in the Yangtze River Delta metropolitan cluster. As a national innovation demonstration zone, Hangzhou has gathered numerous innovation resources and endeavors to build “the first city of China’s digital economy” [45]. The boundary of the Corridor starts from the Yuquan and Zijingang campus of Zhejiang University in the east and ends at Zhejiang A&F University in the west, running through the Xihu District, Yuhang District, and Lin’an District. The Corridor takes Wenyi-West Road and Keji Avenue as a 33 km main axis from east to west that connects Zijingang Sci-Tech City, Future Sci-Tech City, Cloud City, and Qingshanhu Sci-Tech City. Its total area is about 398 square kilometers. The density of the commercial service facilities within one kilometer (about 15 min walking distance) outside the east and west sides of the planning boundary of the Corridor was greater than that within the Corridor. We believe these commercial facilities still have an important correlation with the Corridor; thus, all commercial facilities within one kilometer of the outside boundary were included in this study.
As the core industrial cluster of the Corridor, the digital economy industry cluster has formed many complete industrial chains and mature industrial platforms, including the new generation of artificial intelligence, cloud computing and big data, integrated circuits, 5G Internet of Things, blockchains, and digital trade. Many world-renowned corporate headquarters and corporate R&D centers agglomerate in this area, including Alibaba, AUX, and Cethik (Figure 2).

3.2. Data Source

In this study, two types of point-of-interest (POI) data, commercial facilities data and enterprise credit information data, were used to represent the development of UCNs and STEs. POI data is a kind of spatial point data based on latitude and longitude information, basically including four data dimensions: name, address, coordinates, and category. Compared with POI data based on check-in information or geo-tagged photos, the POI data based on Internet maps contains all officially registered points, so it can overcome the incompleteness and sampling bias of traditional POI data [46]. Spatial analysis of POI data through GIS has been widely used in the classification of urban land use [47], urban functional area recognition [48], urban spatial structure [49,50] and other urban studies. At the same time, Internet assessment and corporate business information data can supplement POI data, providing a wealth of indicator choices for quantitative research.

3.2.1. Commercial Facilities Data

This study used Internet assessment data and Internet map data as two types of commercial facilities’ POI data. The catering industry data came from Dianping.com, which is a leading platform for local life information and trading in China. The hotel industry data came from Ctrip.com, which is one of the largest Internet hotel reservation platforms in China. Data from the retail industry; resident service industry; finance and insurance industry; and culture, sports, and entertainment industry came from Baidu Map. The data collection area of the commercial facilities was 119.611928°–120.202695° east longitude and 30.077554°–30.490629° north latitude. After data cleaning and deduplication, 136,516 data points of commercial facilities were finally obtained, of which 20,588 points were inside the Corridor. The time of data acquisition was March 2021. The classification, dimension, size, and spatial distribution of data are as follows (Table 1, Figure 3):

3.2.2. Development Data of STEs

The Corridor takes the digital economy, life science and healthcare, and advanced materials as three core industry clusters. Among them, the digital economy industry accounts for 90% [51]. Considering that there is currently no precise definition of STE in China, this study used digital economy enterprises inside the Corridor to represent STEs. Development data of STEs was obtained through Qichacha, Tianyancha, and Qixinbao, which are the official certificated platforms of the National Enterprise Credit Information Publicity System in China. The data collection steps are as follows:
Firstly, filter the industry codes of digital economy core industries. According to the Statistical Classification Catalogue of Digital Economy Core Industries in Zhejiang Province (published by the Zhejiang Bureau of Statistics) [52], digital economy core industries include: (1) computer, communications, and other electronic equipment manufacturing; (2) electronic information and electromechanical manufacturing; (3) special electronic equipment manufacturing; (4) the telecom, radio and television, and satellite transmission service industry; (5) Internet and related service industry; (6) the software and information technology service industry; and (7) the cultural digital content service industry. Corresponding industry codes can be found in the Industrial Classification for National Economic Activities 2017 (GB/T4754-2017).
Secondly, collect a list of names of STEs in the Corridor. Use industry codes to collect all digital economy core industry enterprises via the search function of Qichacha. The data collection area is the same as for the commercial facilities data.
Thirdly, supplement the developmental data of enterprises. According to the list of names of the enterprises, obtain developmental data through Qichacha, Tianyancha, and Qixinbao, including registered address, registered capital, number of insured persons, average salary, number of intellectual properties, number of software copyrights, and comprehensive score.
Finally, 27,745 data points of STEs were obtained, of which 5684 points were inside the Corridor. The classification, dimension, size, and spatial distribution of data are as follows (Table 2, Figure 4):

3.2.3. Traffic Isochrones Data

This study used the traffic accessibility of each UCN, which was defined by the traffic isochrones circle, as the research sample for statistical analysis. Compared with an equidistant circle, a traffic isochrones circle can scientifically reflect accessibility in both the time and space dimensions. However, traditional traffic isochrones were generally calculated by the GIS platform through the urban road network and road speed limit data, which results in low accuracy and difficult data acquisition. The Xdc traffic isochrones tool can use the Gaode Map route planning API (application programming interface) to obtain point-to-point traffic time-consumption data and generate the isochrones in ArcGIS [53,54]. By utilizing plentiful urban road network and traffic data in Gaode Map, high accuracy traffic isochrones data can be acquired with this tool.

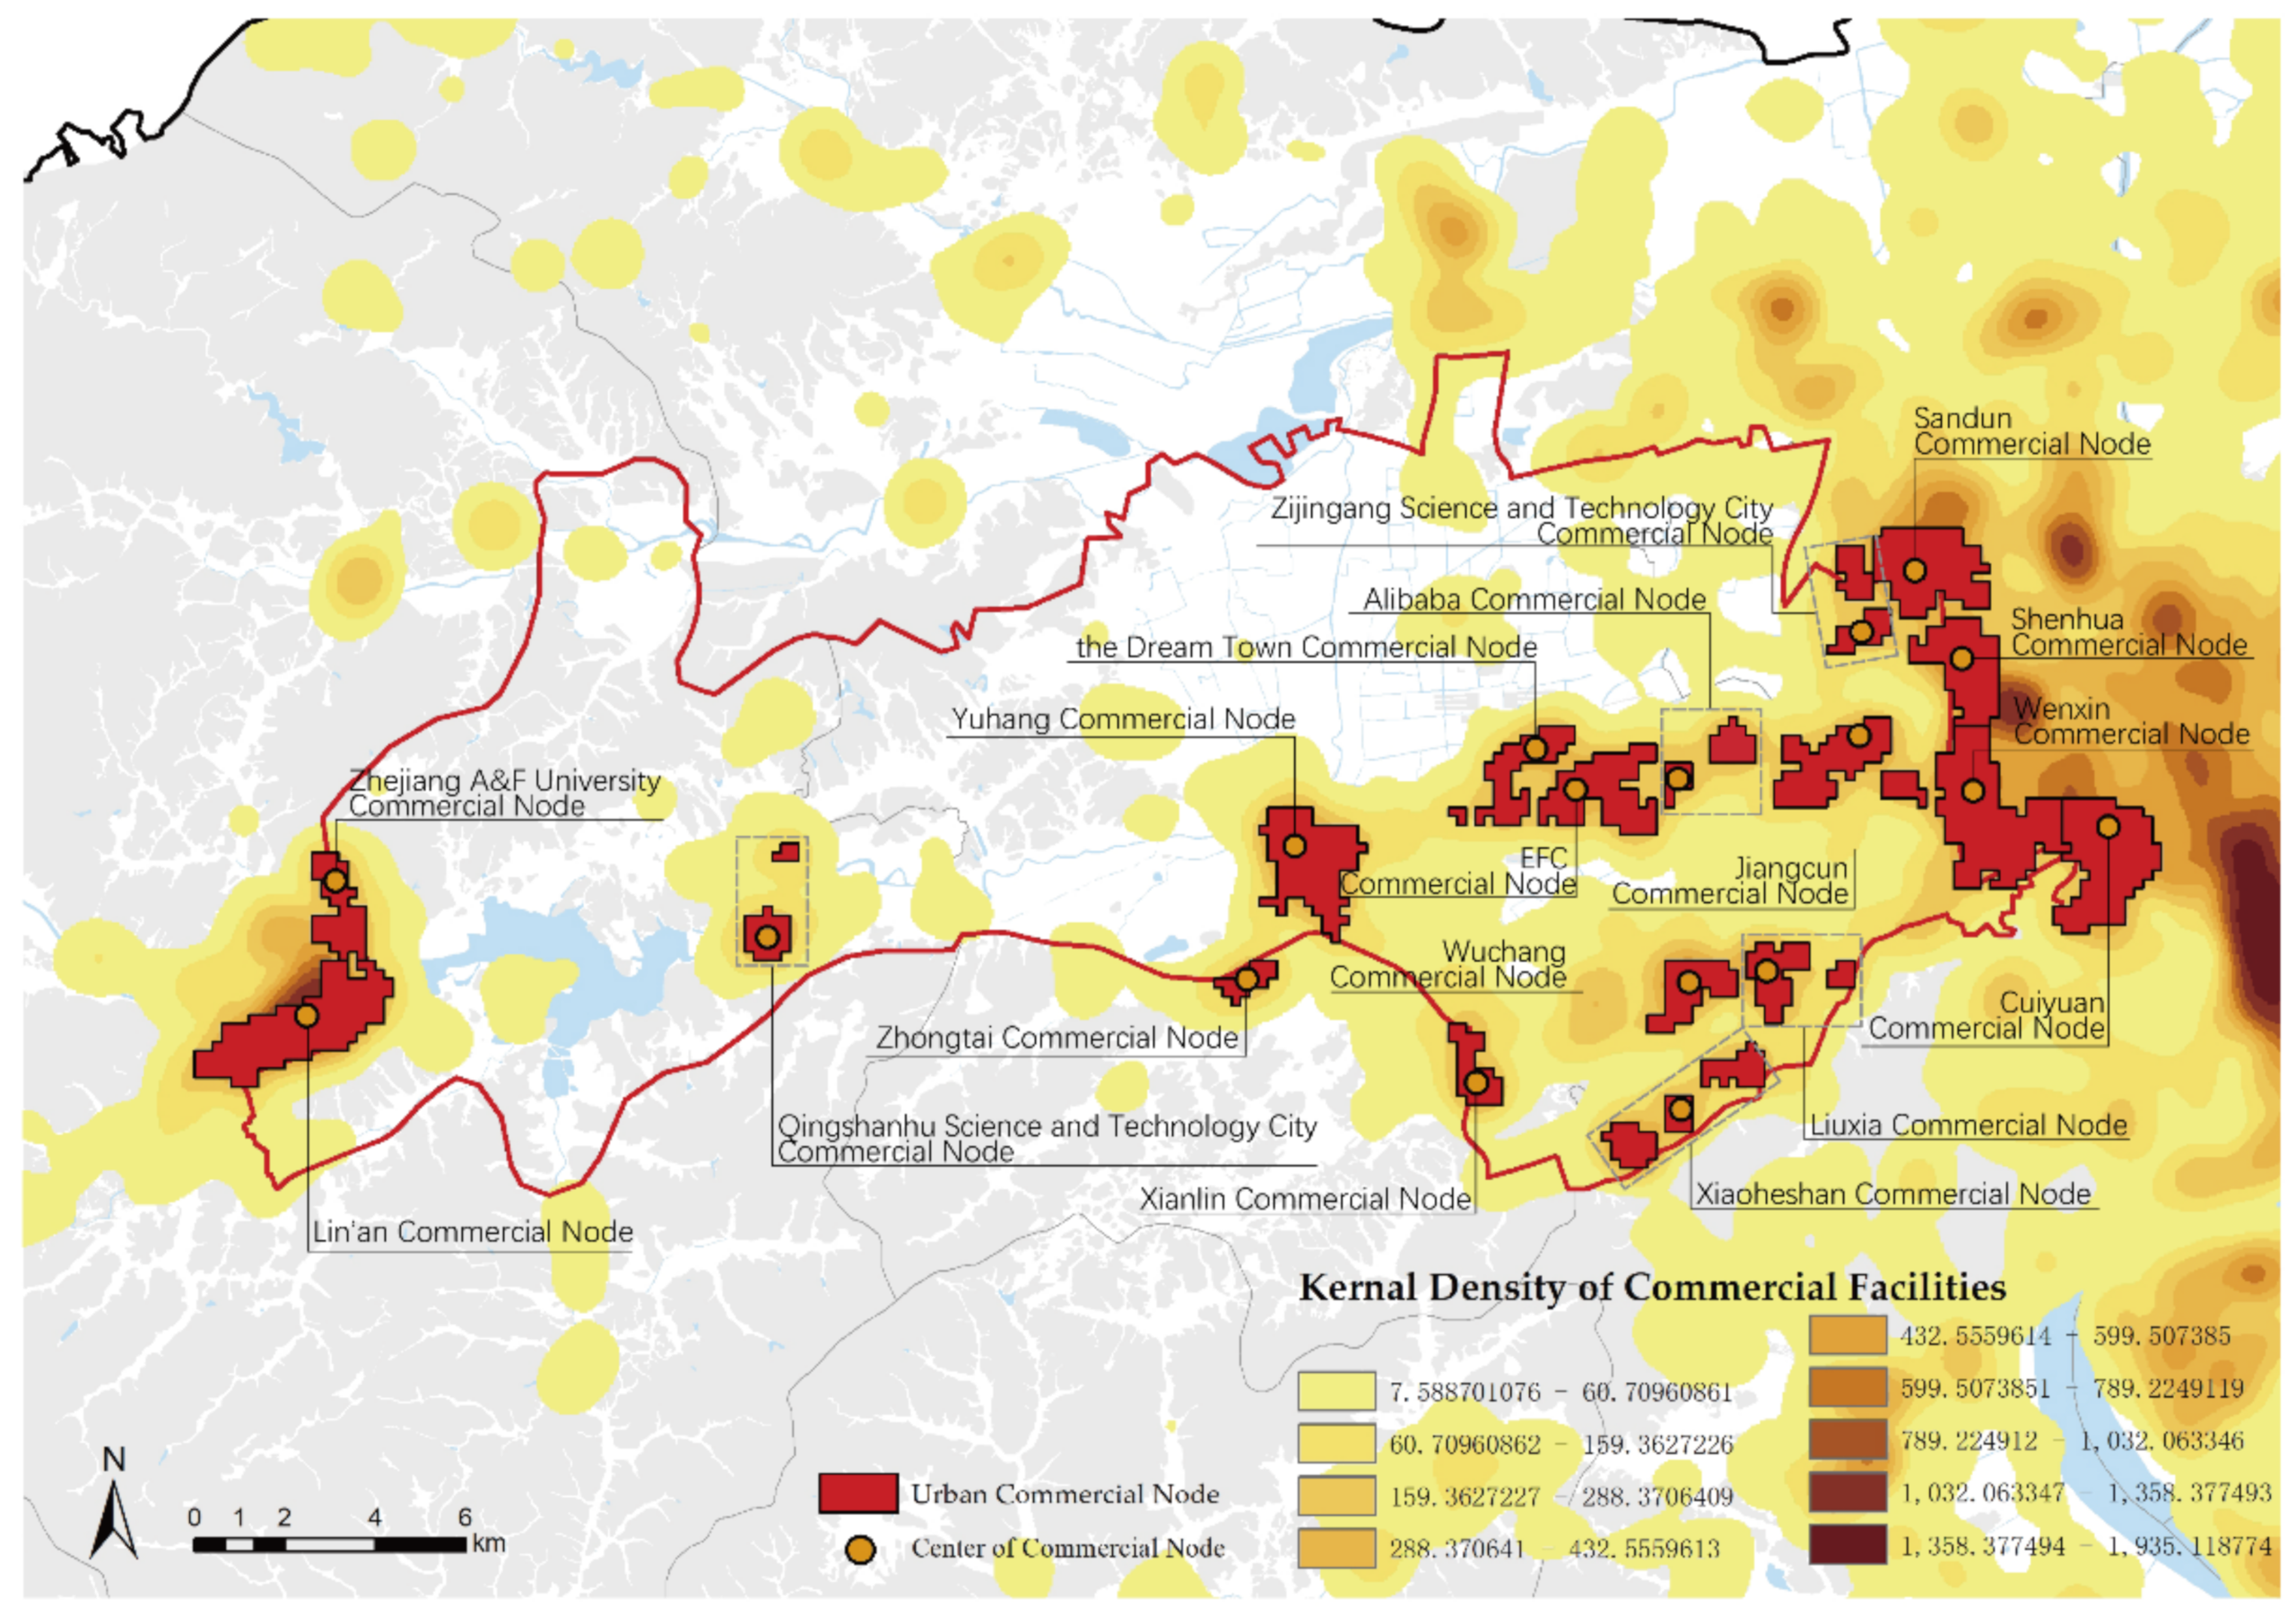
3.3. Data Preprocessing: Filtering UCNs Based on Commercial Facilities’ Data

This study used the commercial facilities’ data to obtain the commercial agglomeration districts through kernel density estimation (KDE) and hotspot analysis in ArcGIS. Then, we eliminated hotspots that primarily served residential and scenic areas. Finally, 18 UCNs were collected inside and within one kilometer outside the boundary of the Corridor.

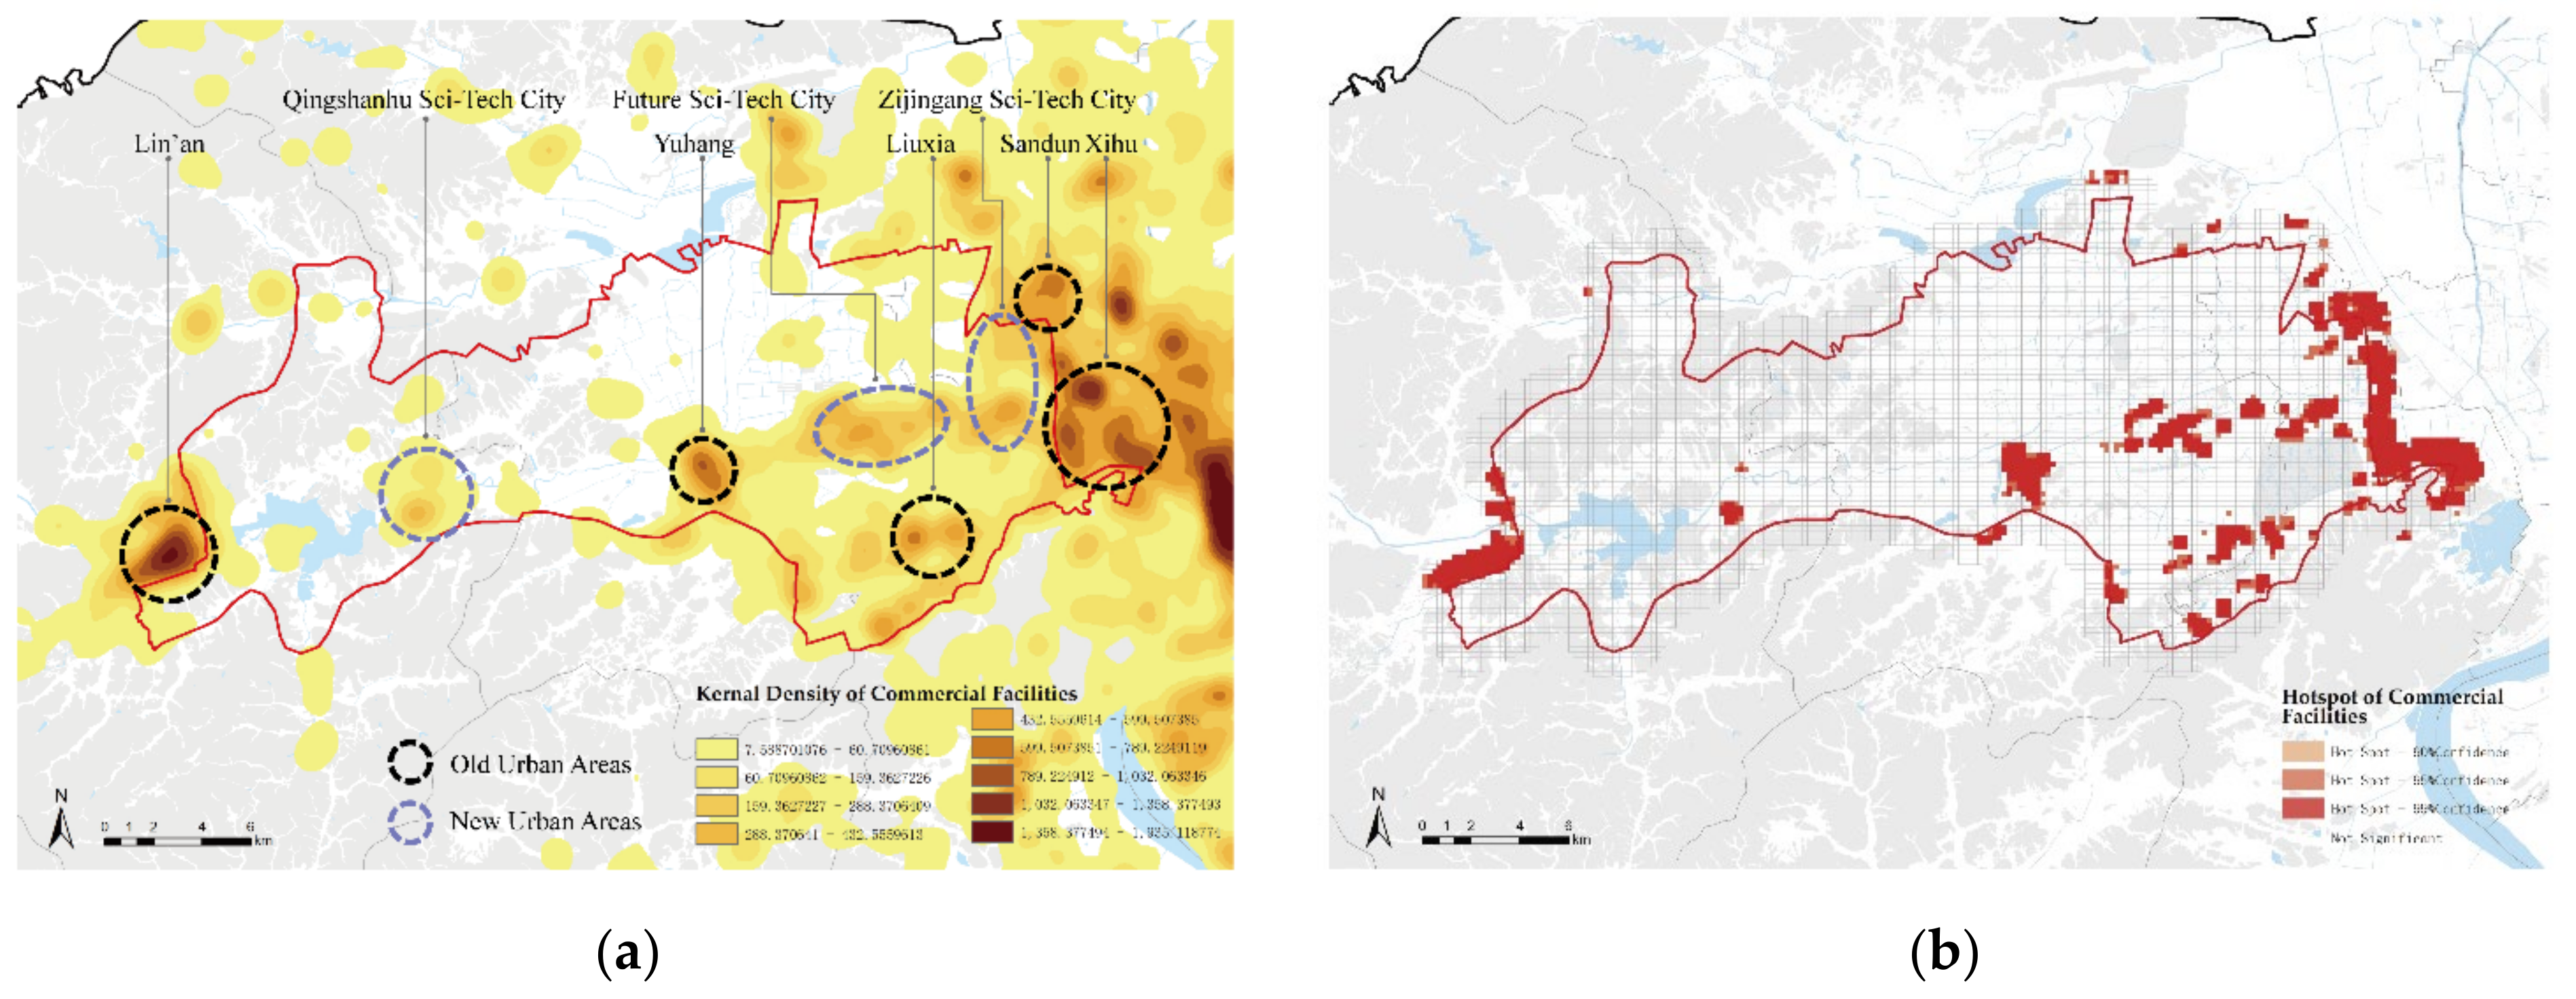
3.3.1. Search for Agglomeration Areas of Commercial Facilities by KDE and Hotspot Analysis

KDE, which is a nonparametric way to estimate the probability density function of a random variable [55], allows one to estimate the intensity of a point pattern and to represent it by means of a smoothed continuous surface [56]. KDE often uses a 200–1200 m search radius as an important reference parameter [57]. This study was based on the urban scale; thus, a higher value of 1000 m was selected as the search radius. In this way, both large- and small-scale commercial agglomeration areas could be depicted. Figure 5a shows a visualization of this analysis, with the darker areas corresponding to a higher degree of agglomeration of commercial facilities.
Hotspot analysis was used to aid KDE in resolving the boundaries of commercial agglomeration areas. A hotspot is essentially a local cluster of significantly higher values of a certain indicator within a defined neighborhood [58]. Getis-ord Gi* statistics can be used to identify statistically significant hotspots. Compared with KDE, the advantage of the Getis-ord Gi* statistics is that they take the value of all neighboring features into consideration, report hotspots with different levels of statistical significance, and the outputted hotspots can present a better continuous surface [59]. This study took a 200 × 200 m grid as the basic unit of the Getis-ord Gi* statistics, divided the study area, and counted the number of commercial facilities in each unit. A 200 × 200 m grid is about the smallest scale of block inside the Corridor, which allows more accurate statistics on the distribution of commercial facilities. Then, Getis-ord Gi*statistics were performed in ArcGIS to analyze the commercial hotspots in the Corridor (Figure 5b).
The results are as follows:
  • Commercial facilities were spatially clustered, with higher density in the east than in the west. Commercial hotspots and high-value kernel density areas were basically overlapped. The boundaries of commercial hotspots were more clearly defined through hotspot analysis.
  • The old urban area represented by Xihu, Lin’an, Yuhang, and Liuxia had a high density of commercial facilities, while the new urban areas represented by the Future Sci-Tech City, Qingshanhu Sci-Tech City, and Jiangcun had a relatively low density but had already formed a commercial cluster.

3.3.2. Eliminating Commercial Agglomerations that Are Not Relevant to This Study and Filtering UCN Research Samples
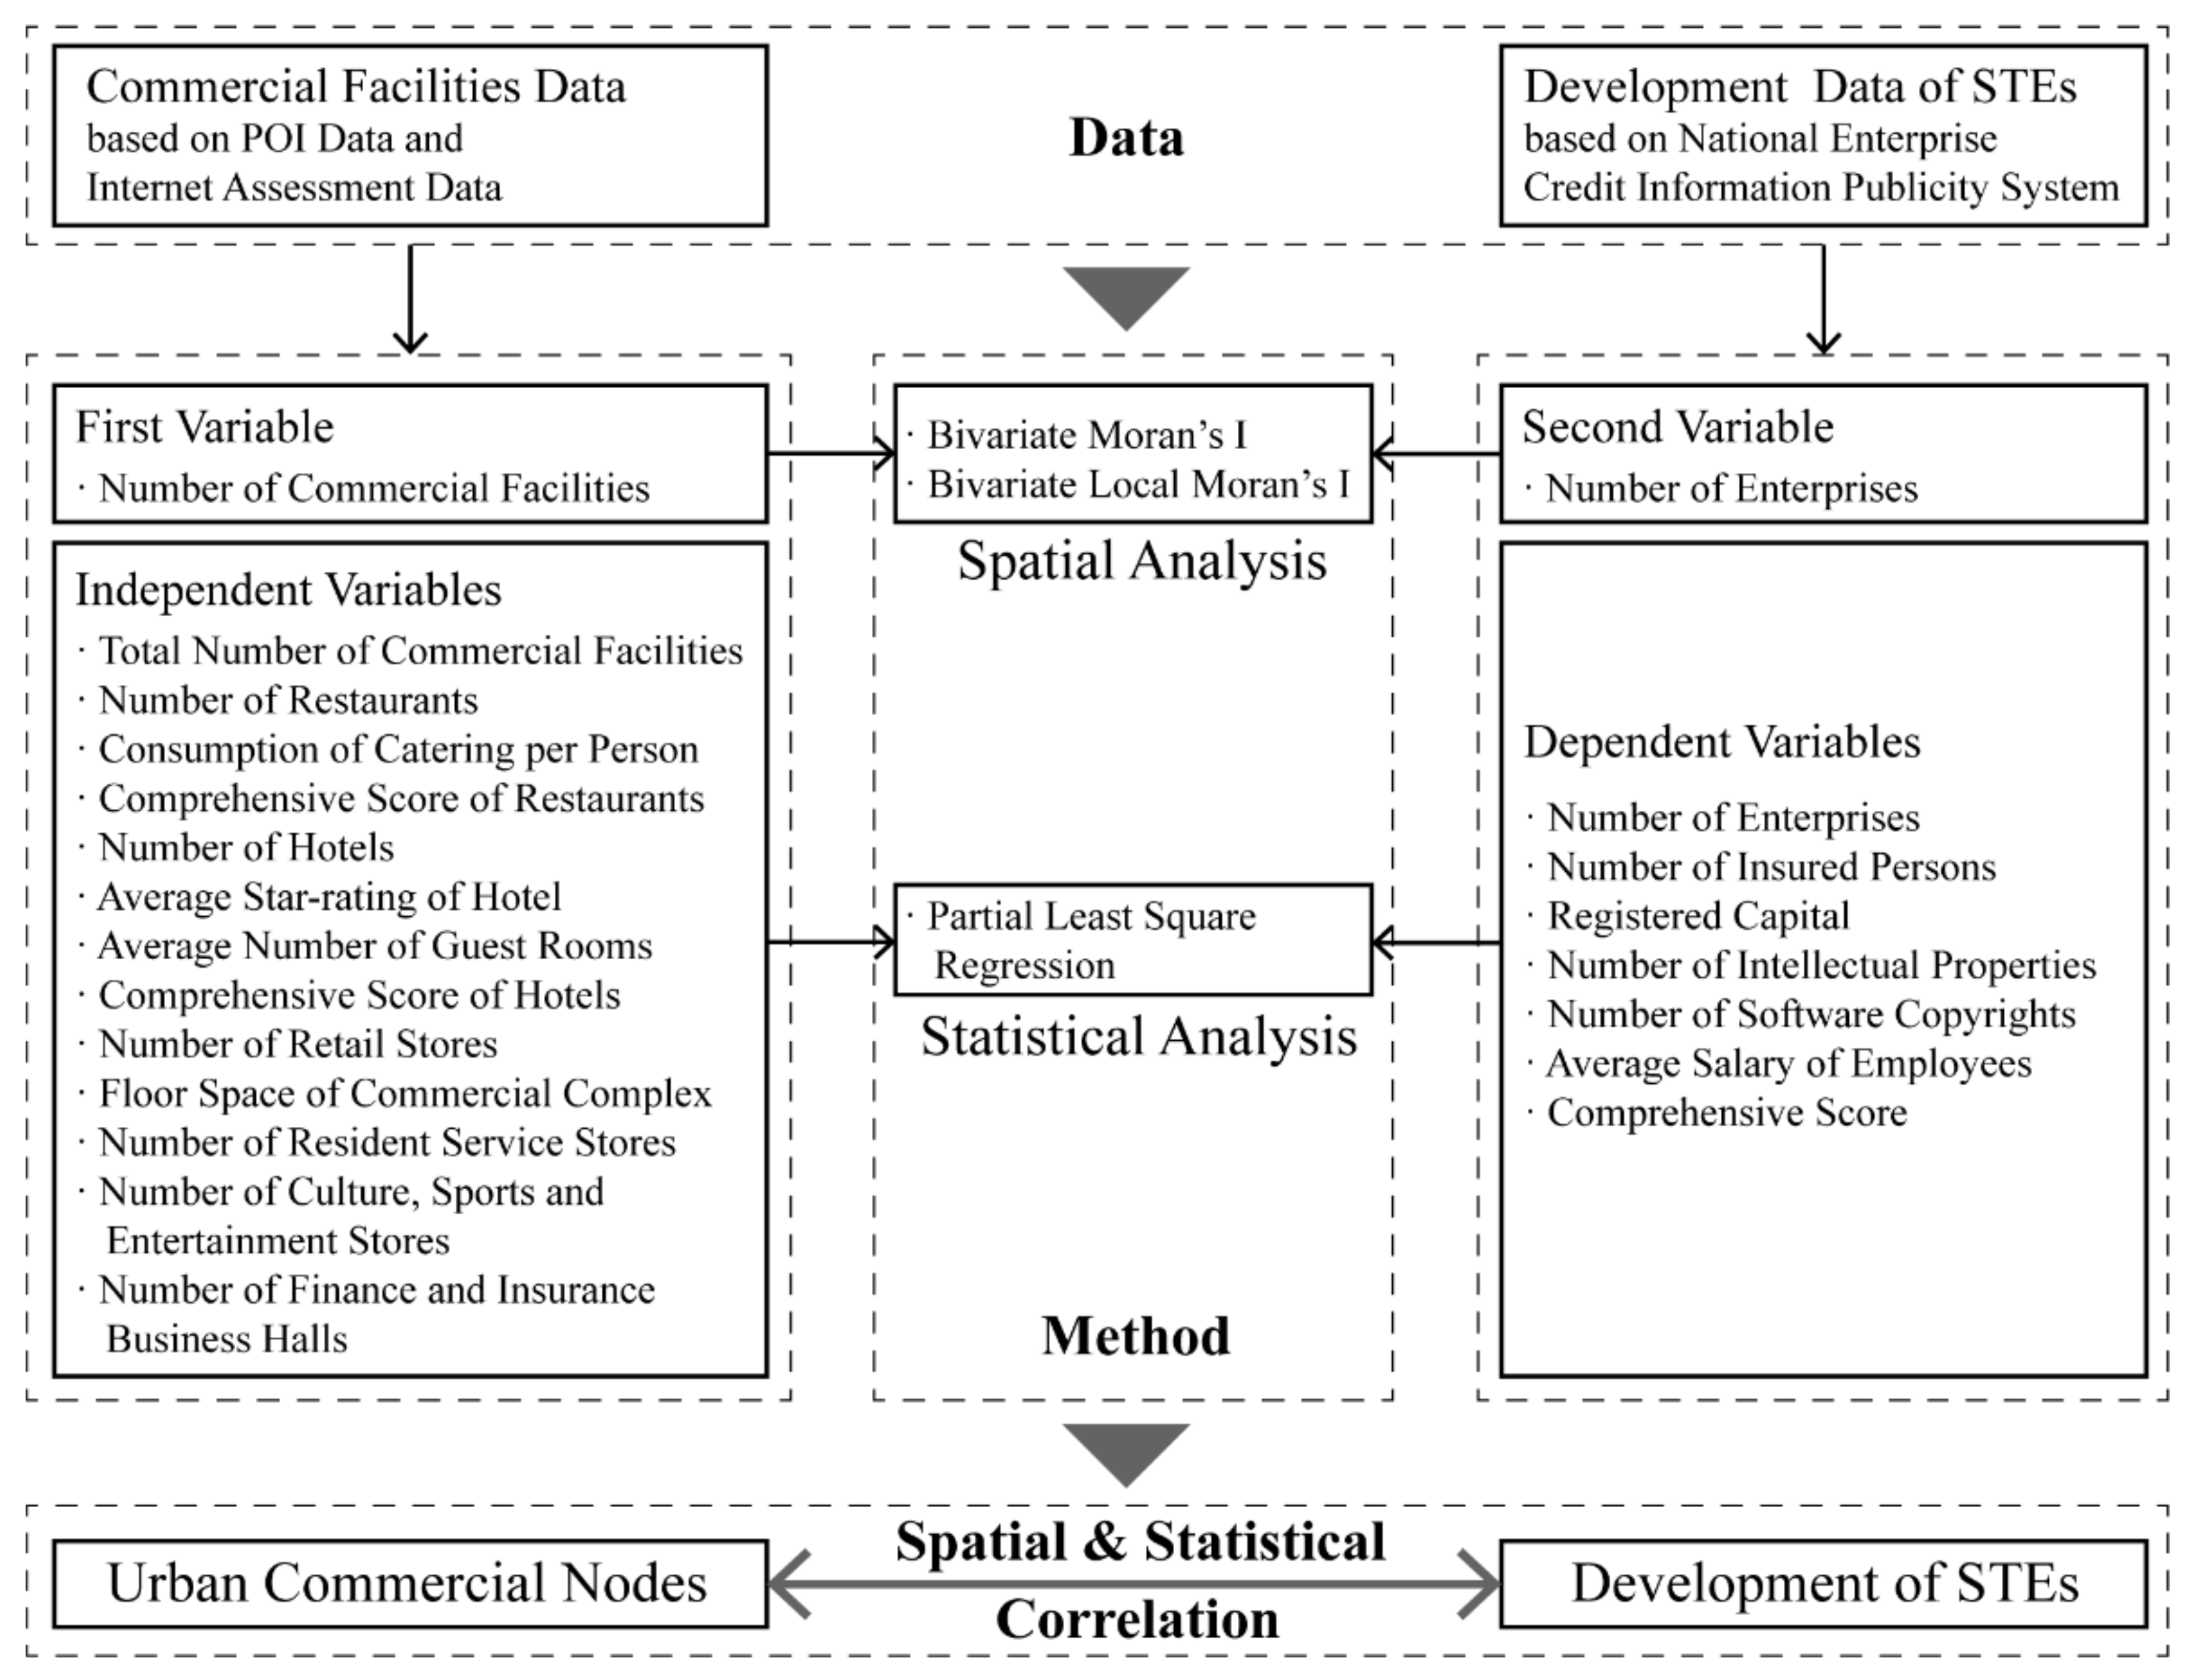
The standard process for filtering and dividing UCNs in this study was performed as follows: First, commercial agglomerations with a continuous hotspot of less than 0.5 square kilometers were eliminated. Second, this study mainly focused on the correlation between UCN and STEs; thus, some hotspots that mainly provide commercial services for tourists in mountainous areas and scenic spots, such as Liangzhu Cultural Village, were excluded. Third, for continuous commercial hotspots, such as the eastern part of the Corridor, UCNs were divided according to the administrative boundaries of the subdistricts. Finally, 18 UCNs were selected (Figure 6).
We chose the point with the highest kernel density value in each UCN as the center. Detailed information of each UCN is as follows (Table 3):

4. Methods

The correlation between UCNs and the development of STEs was analyzed by spatial analysis and statistical analysis methods. First, spatial statistics in ArcGIS were used to observe the changes in STE attributes with the distance from UCNs. Second, the spatial correlation between commercial facilities and enterprises was analyzed by bivariate Moran’s I and bivariate local Moran’s I tools in Geoda. Then, partial least squares regression method was used to analyze the correlation between specific indicators of UCNs and the development of STEs. A flowchart of the study method is shown as follows (Figure 7):

4.1. Spatial Correlation Test

Bivariate Moran’s I was used to explore spatial clustering and spatial dispersion. Two types of bivariate Moran’s I method, namely, global bivariate Moran’s I and bivariate local Moran’s I, were used in this study. Global bivariate Moran’s I represents the spatial correlation between observation p and observation q across the entire area, whereas bivariate local Moran’s I investigates spatial correlations within different spatial units [60]. The calculation equations are as follows:
I p q = n i = 1 n j = 1 n w i j z p i z q i n 1 i = 1 n j = 1 n w i j
I p q = z p i j = 1 n w i j z q j
In Formulas (1) and (2), I p q and I p q are the global bivariate Moran’s I and bivariate local Moran’s I for variable p and variable q, respectively; n is the total number of spatial units; w i j is a spatial weight matrix for measuring spatial correlations between the ith and jth spatial unit based on queen contiguity; p i and q j are the values of spatial units i and j, respectively; p ̲ and q ̲ are the average values of variable p and variable q, respectively; σ p and σ q are the standard deviations of variable p and variable q, respectively; and z p i = p i p ̲ σ p ; z q j = q j q ̲ σ q .
The range of I p q and I p q is [−1, 1] where a positive value indicates that a higher p is more easily surrounded with a higher q. Inversely, a negative value indicates that a higher p is more easily surrounded by a lower q. The greater the absolute values of I p q and I p q , the stronger the spatial correlation between p and q. The bivariate local Moran’s I method can visualize local spatial correlations by generating cluster maps that illustrate four types of spatial correlation between p and q in each unit at a certain significance level: high–high type (H–H) indicates high p values surrounded by high q values; high–low type (H–L) indicates high p values surrounded by low q values; low–high type (L–H) indicates low p values surrounded by high q values; and low–low type (L–L) indicates low p values surrounded by low q values.

4.2. Statistical Analysis

Statistical analysis focused on the correlation between UCNs and the development of STEs, taking every UCN as a research sample, selecting indicators reflecting the comprehensive development level of UCNs and STEs, and using partial least squares regression (PLSR) as the statistical analysis method.

4.2.1. Research Samples

This study used traffic isochrone circles to reflect the traffic accessibility of UCN, taking the center of each UCN as the starting point, and selecting a 15 min driving time isochrone circle as the research sample of statistical analysis.
The 15 min driving time isochrone circle was selected for the following reasons. First, online shopping is highly popular in Hangzhou; thus, offline consumption represented by UCNs has a strong spatial and temporal regional scope. Second, “996” (the work time is from 9 a.m. to 9 p.m., six days a week) is the mainstream working pattern of digital economy enterprises, which compresses the living activities of employees. Offline consumption pursues efficiency and convenience. A 15 min one-way transportation time is suitable for a fast-paced work style. Additionally, efficient public transportation, such as the subway system, is still under construction in the Corridor. Considering the rainy seasons in Hangzhou, driving is still the most convenient mode of transportation in the Corridor.

4.2.2. Independent Variables and Dependent Variables

In total, 13 indicators reflecting UCN development level were selected as independent variables. In previous studies, the number of commercial facilities in different commercial service industries was often used as an indicator to reflect the degree of agglomeration of regional commerce [61,62]. Some studies also used consumption per person, the comprehensive score, and the number of reviews included in Internet assessment data to evaluate the grade, satisfaction, and hotness of commercial facilities [63]. Thus, this study selected 13 indicators that reflect the comprehensive development of UCNs and then divided them into seven categories: the scale of UCN; catering industry; hotel industry; retail industry; resident service industry; culture, sports, and entertainment industry; and the finance and insurance industry. This study took these 13 indicators as independent variables: namely, the total number of commercial facilities (X1); the number of catering restaurants (X2); the consumption of catering per person (X3); the comprehensive score of catering restaurants (X4); the number of hotels (X5); the average star-rating of hotels (X6); the average number of guest rooms (X7); the comprehensive score of hotels (X8); the number of retail stores (X9); the floor space of commercial complexes (X10); the number of resident service stores (X11); the number of culture, sports, and entertainment stores (X12); and the number of finance and insurance business halls (X13; see Table 4).
Seven indicators reflecting STE development level were selected as dependent variables. Scholars mostly use intellectual properties (including patent applications, trademarks, software copyrights, etc.) to measure the innovation ability of enterprises [64]. For traditional production-oriented enterprises, intellectual properties are mainly dominated by patents and trademarks, while for digital economy enterprises, software copyrights become a more important indicator for evaluating corporate innovation ability [65]. According to the Statistical Classification of Large, Medium, Small and Micro Enterprises in 2017 (issued by the Chinese National Bureau of Statistics), the scale of enterprises is classified by the number of employees, total assets, and business income [66]. Because the total assets and business income of some enterprises are confidential, this study used the number of insured persons and the amount of registered capital to reflect the development scale of STEs. Seven indicators that reflect the development of STEs were divided into five categories: agglomeration degree, development scale, innovation ability, salary package, and comprehensive development level. These seven indicators were used as the dependent variables: namely, the number of enterprises (Y1), the number of insured persons (Y2), the registered capital of enterprises (Y3), the number of intellectual properties (Y4), the number of software copyrights (Y5), the average salary of employees (Y6), and the comprehensive score (Y7; see Table 5).

4.2.3. Partial Least Squares Regression

PLSR is a multiple linear regression statistical method that can solve the problems of the collinearity of independent variables and small sample size [67]. It is a collective application of multiple linear regression, canonical correlation analysis, and principal component analysis. First, it condenses multiple independent variables X into the principal component U. Then the relationship between U and X is analyzed by means of canonical correlation analysis. Finally, by repeating multiple linear regression, the relationship between U and multiple dependent variables Y will be obtained to identify the relationship between X and Y.
This study counted the data of 13 independent variables and seven dependent variables in each UCN research sample. Because of the small sample size and the multicollinearity of the independent variables, the PLSR method is suitable for this study.
The specific calculation analysis is divided into the following three steps:
Firstly, determine the optimal number of principal components. By cross-validity analysis (see Formula (5)), when Q h 2     0.0975 , increasing the number of principal components is meaningless. The number of principal components being used at this time is the optimal number. For multiple dependent variables Y, perform multiple cross-validity analysis to obtain the optimal principal components for each dependent variable Y.
Q h 2 = 1 P R E S S h / S S h 1  
In Formula (3), h represents the number of principal components. SS is the error sum of squares, and PRESS is the predicted error sum of squares.
Secondly, perform an accuracy analysis. Principal component U is an extracted information collection of independent variables X. Accuracy analysis is used to examine the extraction rate (the variance interpretation rate) of the principal component U to the original data X.
Thirdly, run PLSR analysis in SPSS. Analyze the correlation between X and Y. Output the regression coefficient, the standardized regression coefficient, the significance of relationship, and the R-squared value.

5. Results

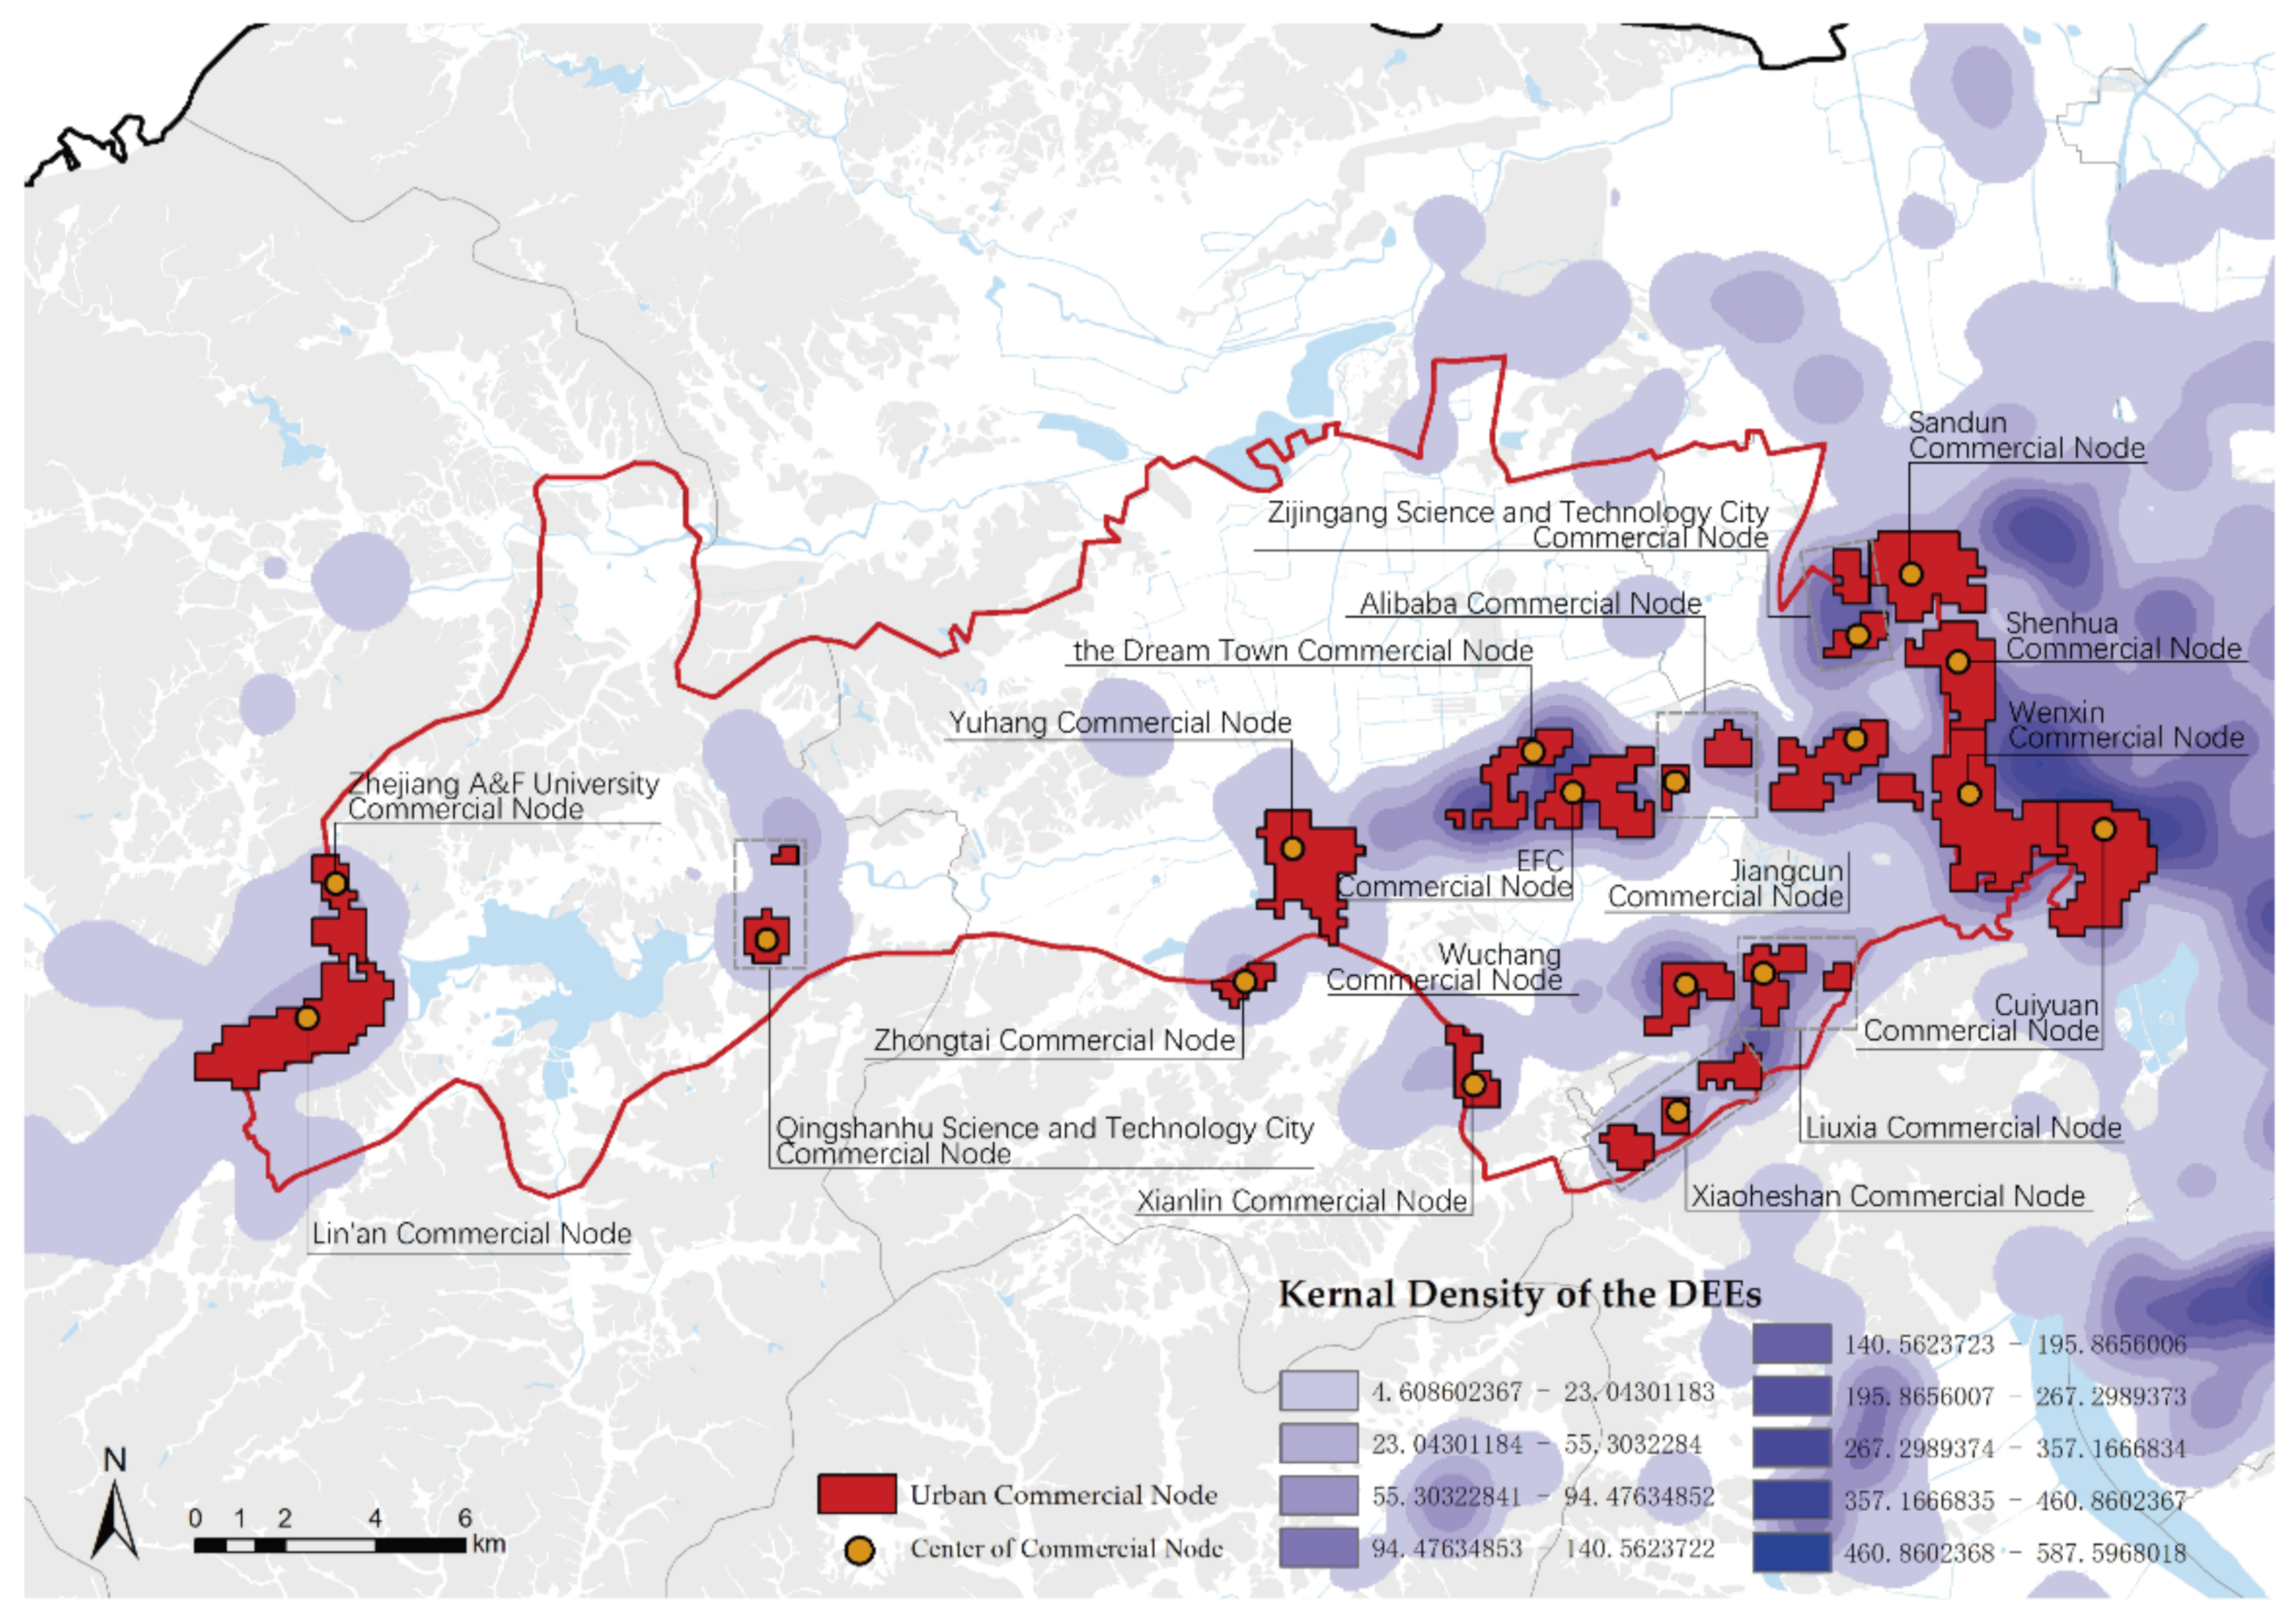
5.1. Spatial Correlations between UCNs and STEs

The kernel density estimation of STEs overlaps with the areas of UCNs (Figure 8). In general, UCNs occurred near the areas with high STE density. The agglomeration areas of STEs and the areas of UCNs were highly geographically overlapped. In old urban areas (such as Linan, Yuhang, and Sandun), the area of UCNs was relatively large, while the density of STEs was relatively low. UCNs have almost covered the entire STE agglomeration areas. In newly built sci-tech cities (such as the Future Sci-Tech City and the Zijingang Sci-Tech city), the density of STEs was higher than that of the old urban areas, while the areas of UCNs were mostly smaller than those of the old urban areas. The UCNs have not yet covered all the areas where STEs were highly concentrated (e.g., the Dream Town, EFC, and Zijingang Sci-Tech City), although UCNs and STE clusters were close to each other.

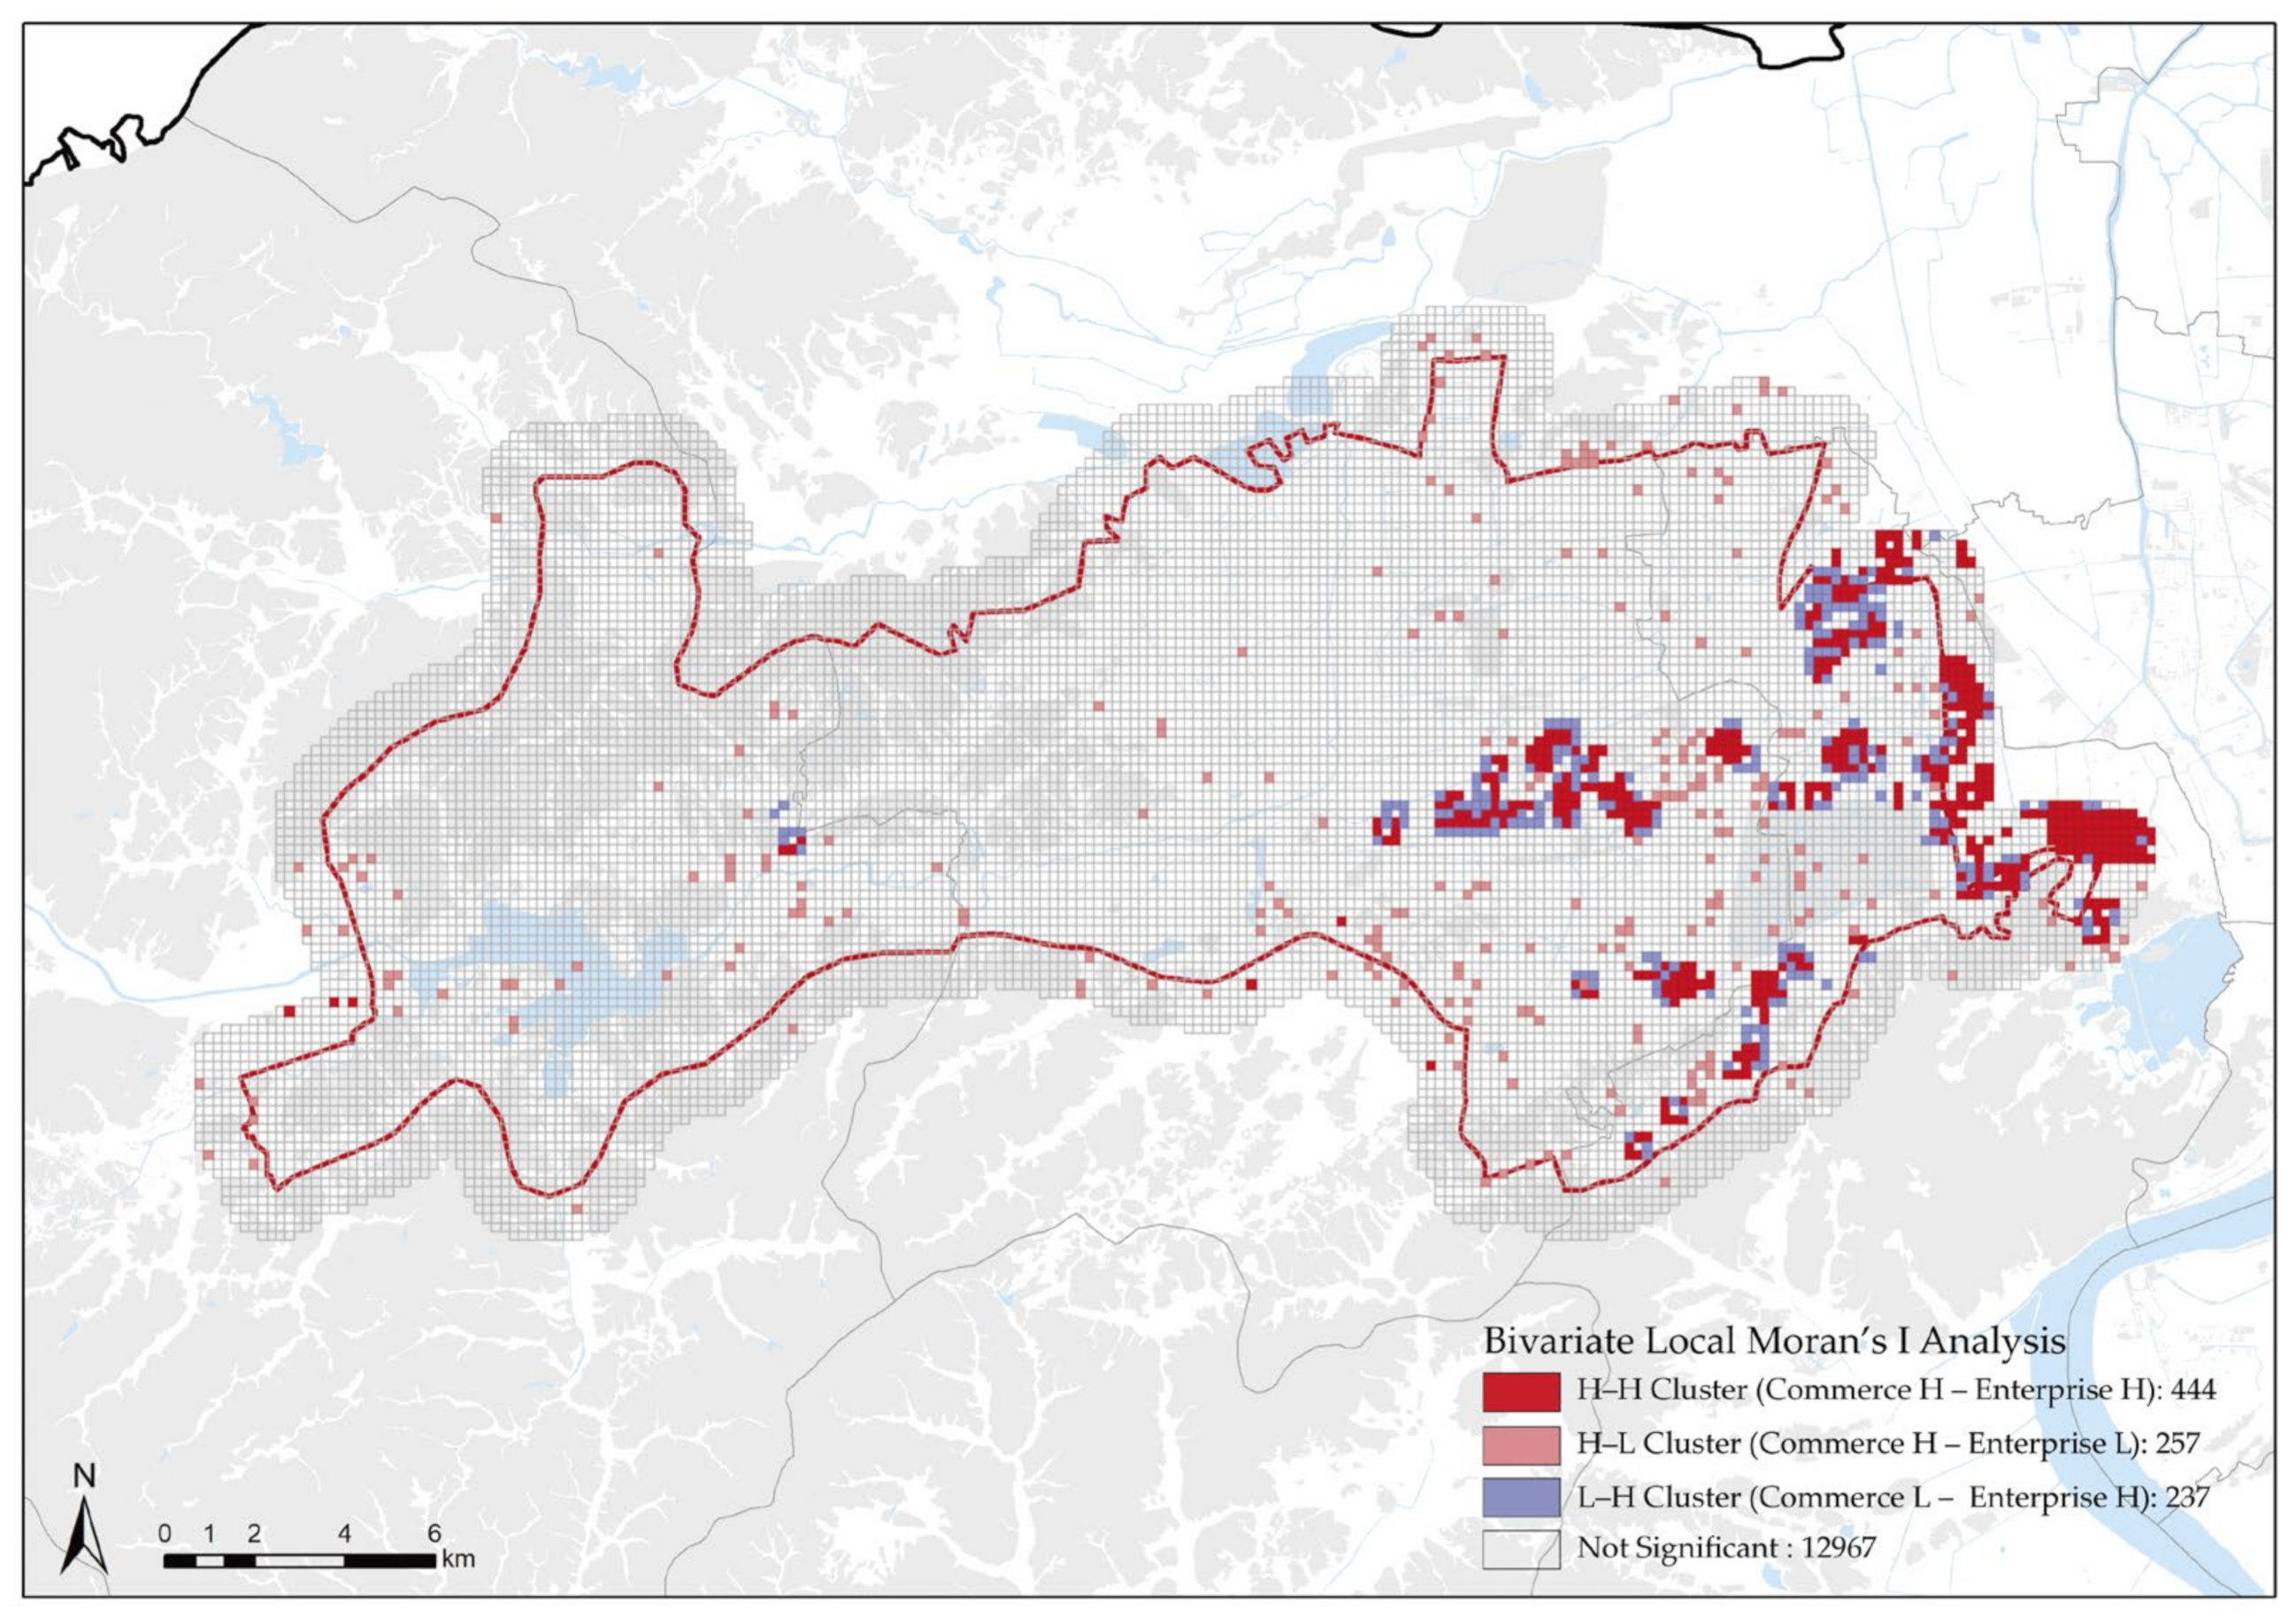
5.1.1. Spatial Correlation Test Using Global Bivariate Moran’s I and Bivariate Local Moran’s I Map

This study took a 200 × 200 m grid as the unit, with the number of commercial facilities in each grid as the first variable, and the number of STEs as the second variable. The results from global bivariate Moran’s I showed a significantly positive spatial correlation between commercial facilities and enterprises, with the Moran’s I value at 0.187. (The randomization 999 significance test was conducted through GeoDa software, and the results showed that the p-value was 0.001 and the Z value was 56.8822, which passed the significance test.)
The bivariate local Moran’s I map displayed three types of spatial correlations between commercial facilities and STEs (p < 0.05, Figure 9).
  • The H–H (a high value of UCN facilities surrounded by a high value of STEs) areas were mainly found in the eastern part of the Corridor, dominated by Sandun, Zijingang Sci-Tech City, Jiangcun, the Future Sci-Tech City, the Liuxia-Xiaoheshan higher education zone, Shenhua, Wenxin, and Cuiyuan. A few were distributed in Lin’an, Yuhang, Qingshanhu Sci-Tech City, and Zhongtai Industrial Park.
  • Almost all L–H (a low value of UCN facilities surrounded by a high value of STEs) areas appeared within 500 m of the H–H areas, indicating that commercial facilities were highly concentrated in the core of the enterprise clusters, which means that STEs and commercial facilities were already well mixed in the Corridor.
  • The H–L (a high value of UCN facilities surrounded by a low value of STEs) areas were scattered near the residential areas, indicating that these commercial facilities mainly provided services to nearby residential areas.

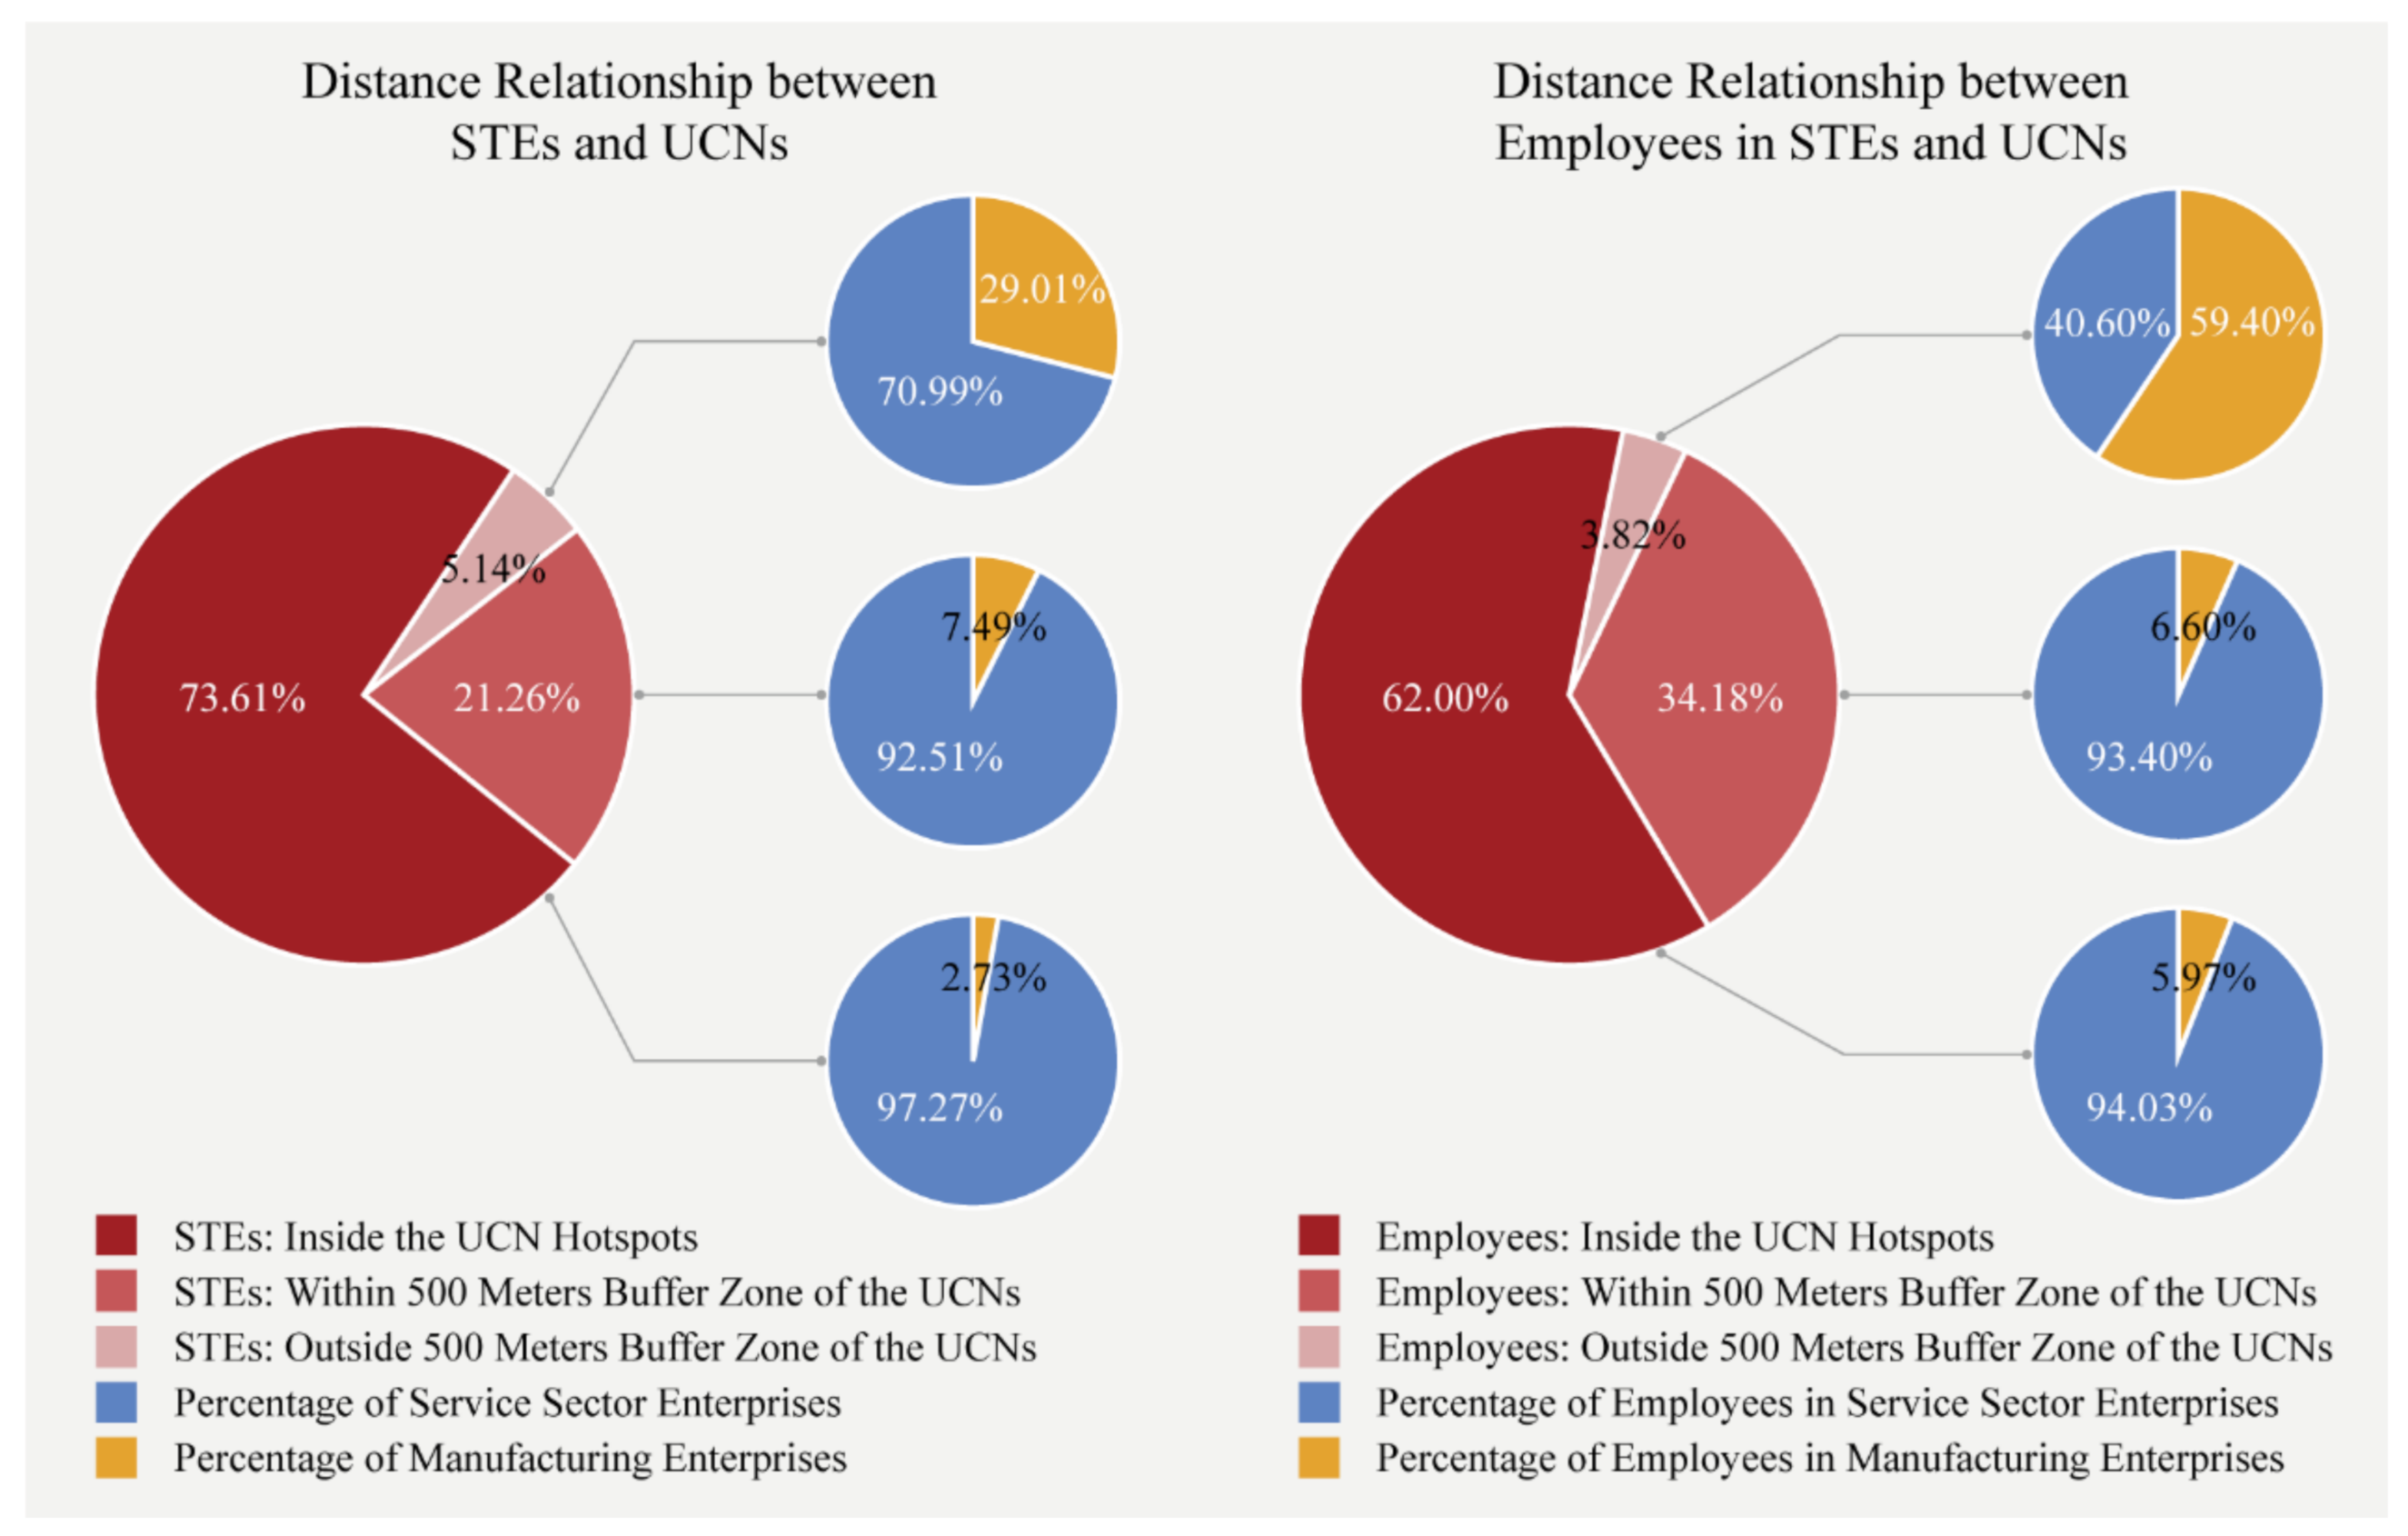
5.1.2. Relevance of Location and Site Selection

We calculated the site selection relationships between STEs and UCNs (Figure 10). We found that 73.61% of STEs and 62% of STE employees were located inside the UCN hotspots (≥90% confidence level). Among them, the service sector enterprises accounted for 97.27% and the service sector employees accounted for 94.03%. The manufacturing enterprises accounted for only 2.73% and the manufacturing employees accounted for 5.97%. Additionally, 21.26% of STEs and 34.18% of the STE employees were situated within 500 m of the UCN hotspots. Among them, the service sector enterprises accounted for 92.51% and the service sector employees accounted for 93.40%. The manufacturing enterprises accounted for 7.49% and the manufacturing employees accounted for 6.60%. Moreover, only 5.13% of STEs and 3.82% of the STE employees were located more than 500 m away from UCN hotspots. Among them, almost 30% of the STEs and nearly 60% of the employees belong to the manufacturing sector.
These results show a high correlation between STEs and UCNs in terms of site selection:
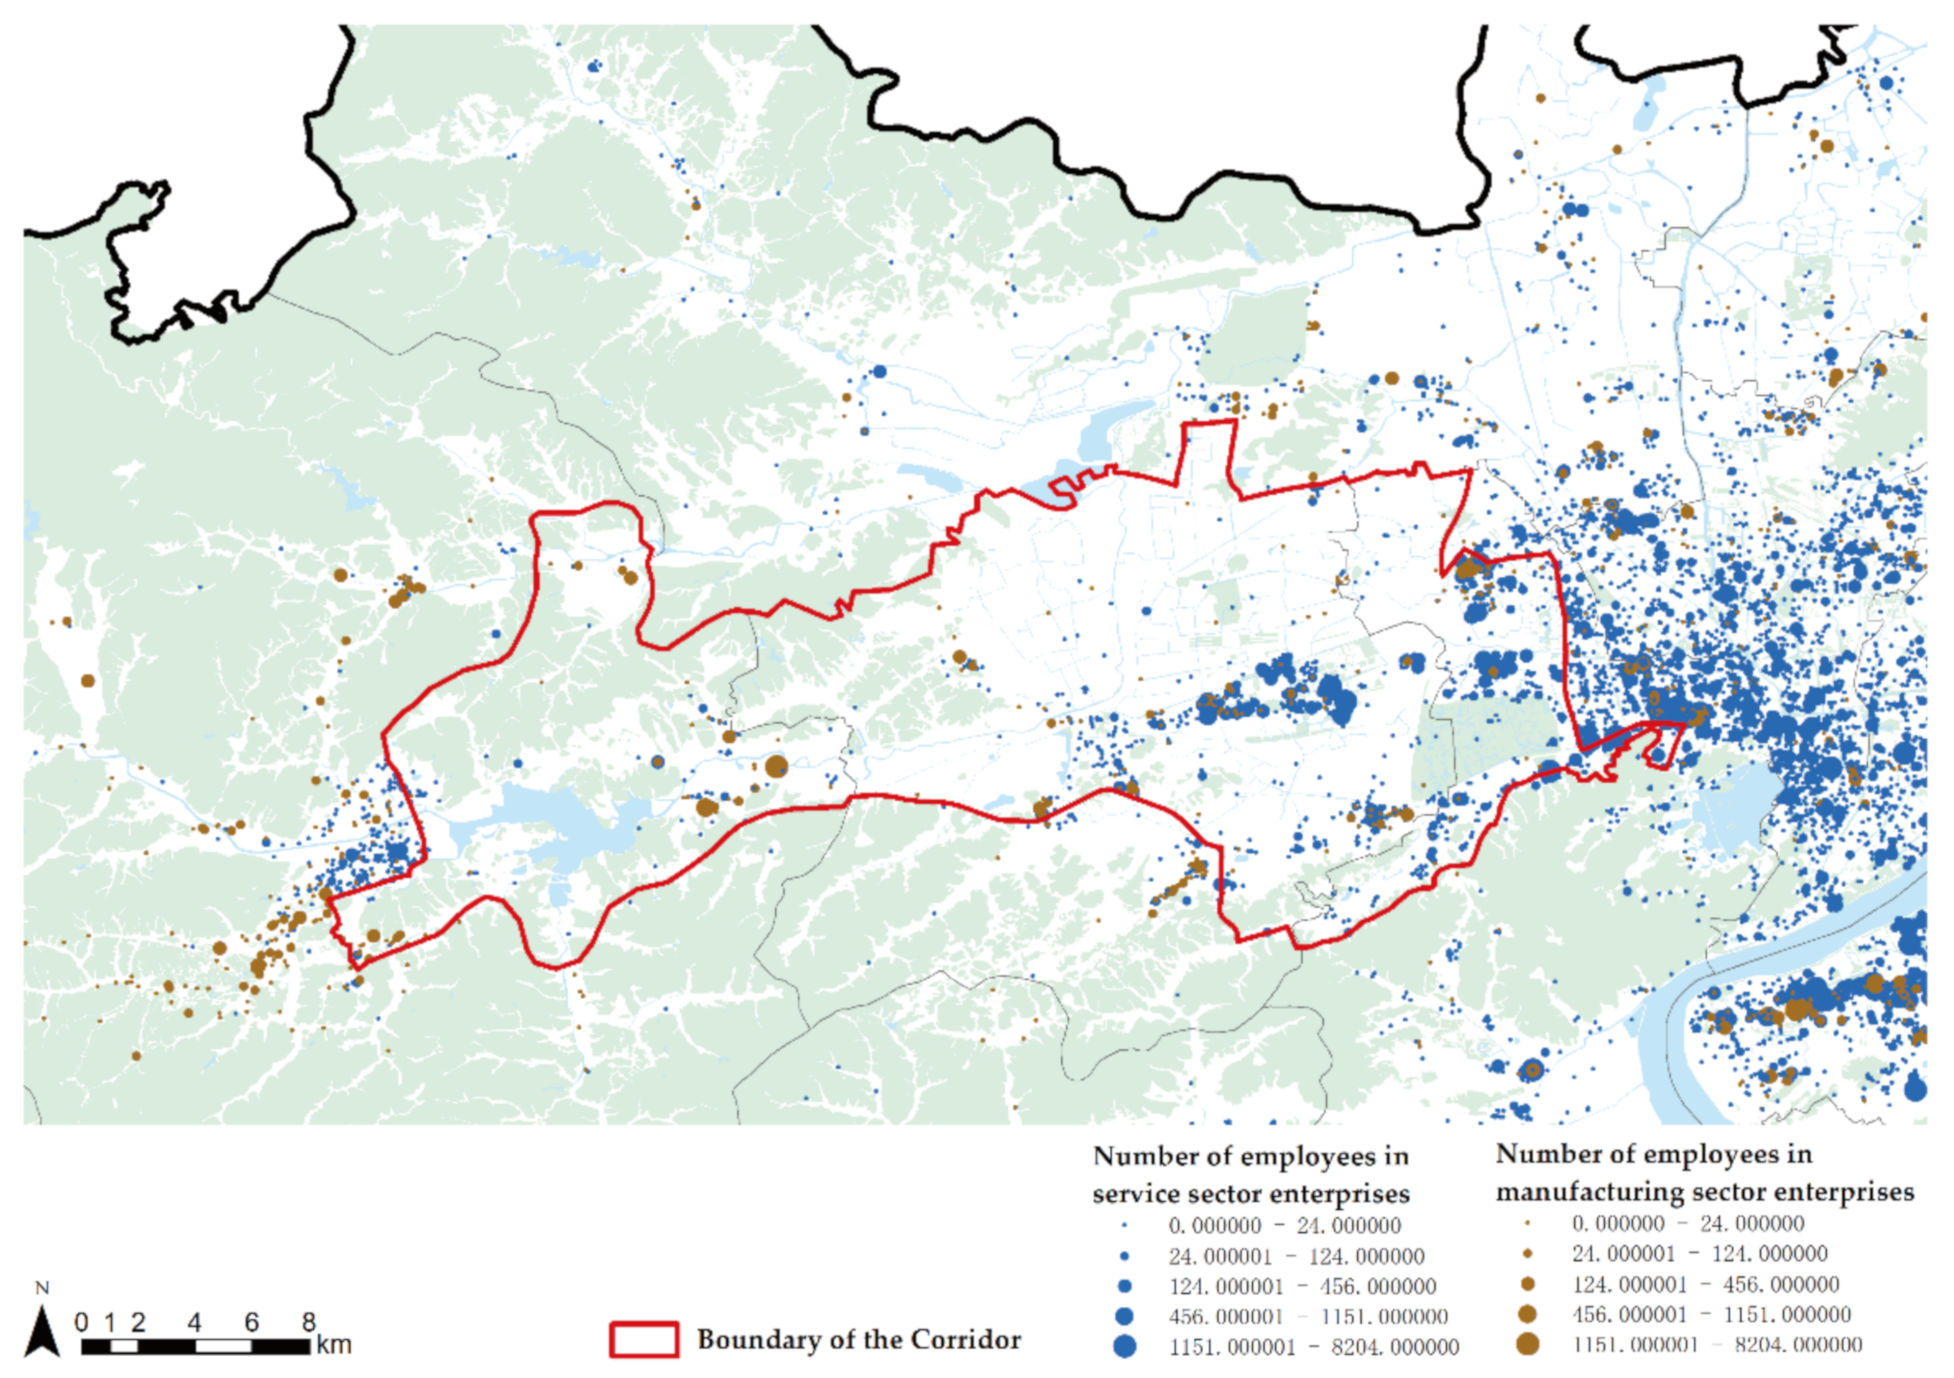
  • The UCN areas and their 500 m buffer zone cover 94.86% of STEs and 96.18% of the STE employees.
  • Service sector STEs tend to be located closer to UCNs than manufacturing STEs.
  • Smaller-scale STEs prefer to be located inside the UCNs, while larger-scale STEs prefer to be located within a 500 m buffer zone surrounding UCNs. This distance is not too far away from the UCN, and they maintain their own development space.

5.2. Correlations among Indicators of UCNs and the Development Indicators of STEs

The data of the 13 independent variables and seven dependent variables in the 18 UCNs were counted. Supposing that the m independent variables X1, …, Xm and the p dependent variables Y1, …, Yp are all standardized variables, the n-times standardized observation data matrix of the independent variable group and that of the dependent variable group are denoted as follows (see Formula (4)). In this study, m = 13 (13 indicators related to UCN were considered as independent variables); p = 7 (seven indicators related to the development of STEs were considered as dependent variables); and n = 18 (18 UCNs were considered as the sample size).
X 0 n × m =       x 11     x 1 m x 21     x 2 m     x n 1     x n m     ,   Y 1 =       y 11   y 21     y n 1       , ,   Y p =       y 1 p   y 2 p     y n p    
The first step is to determine the optimal number of principal components by cross-validity analysis. When the number of principal components of the seven dependent variables Y is 1, Q h 2 = 1 . When the number of principal components is 2, Q h 2 are all less than 0.0975 (Table 6). Therefore, for the seven dependent variables Y, the numbers of the optimal principal components of the independent variables are all one.
The second step is to extract the principal component U1 and perform accuracy analysis. For the seven dependent variables Y, the comprehensive extraction ratios of principal component U1 for X are 60.8%, 59.2%, 52.9%, 54.2%, 58.0%, 59.5%, and 60.7% (Table 7).
Then, analyze the correlation between X and Y by PLSR. The regression coefficients and the significance of PLSR are shown in Table 8. The standardized regression coefficients are displayed in Figure 11.
First, we focused on the correlation between the scale of UCN and the development of STEs:
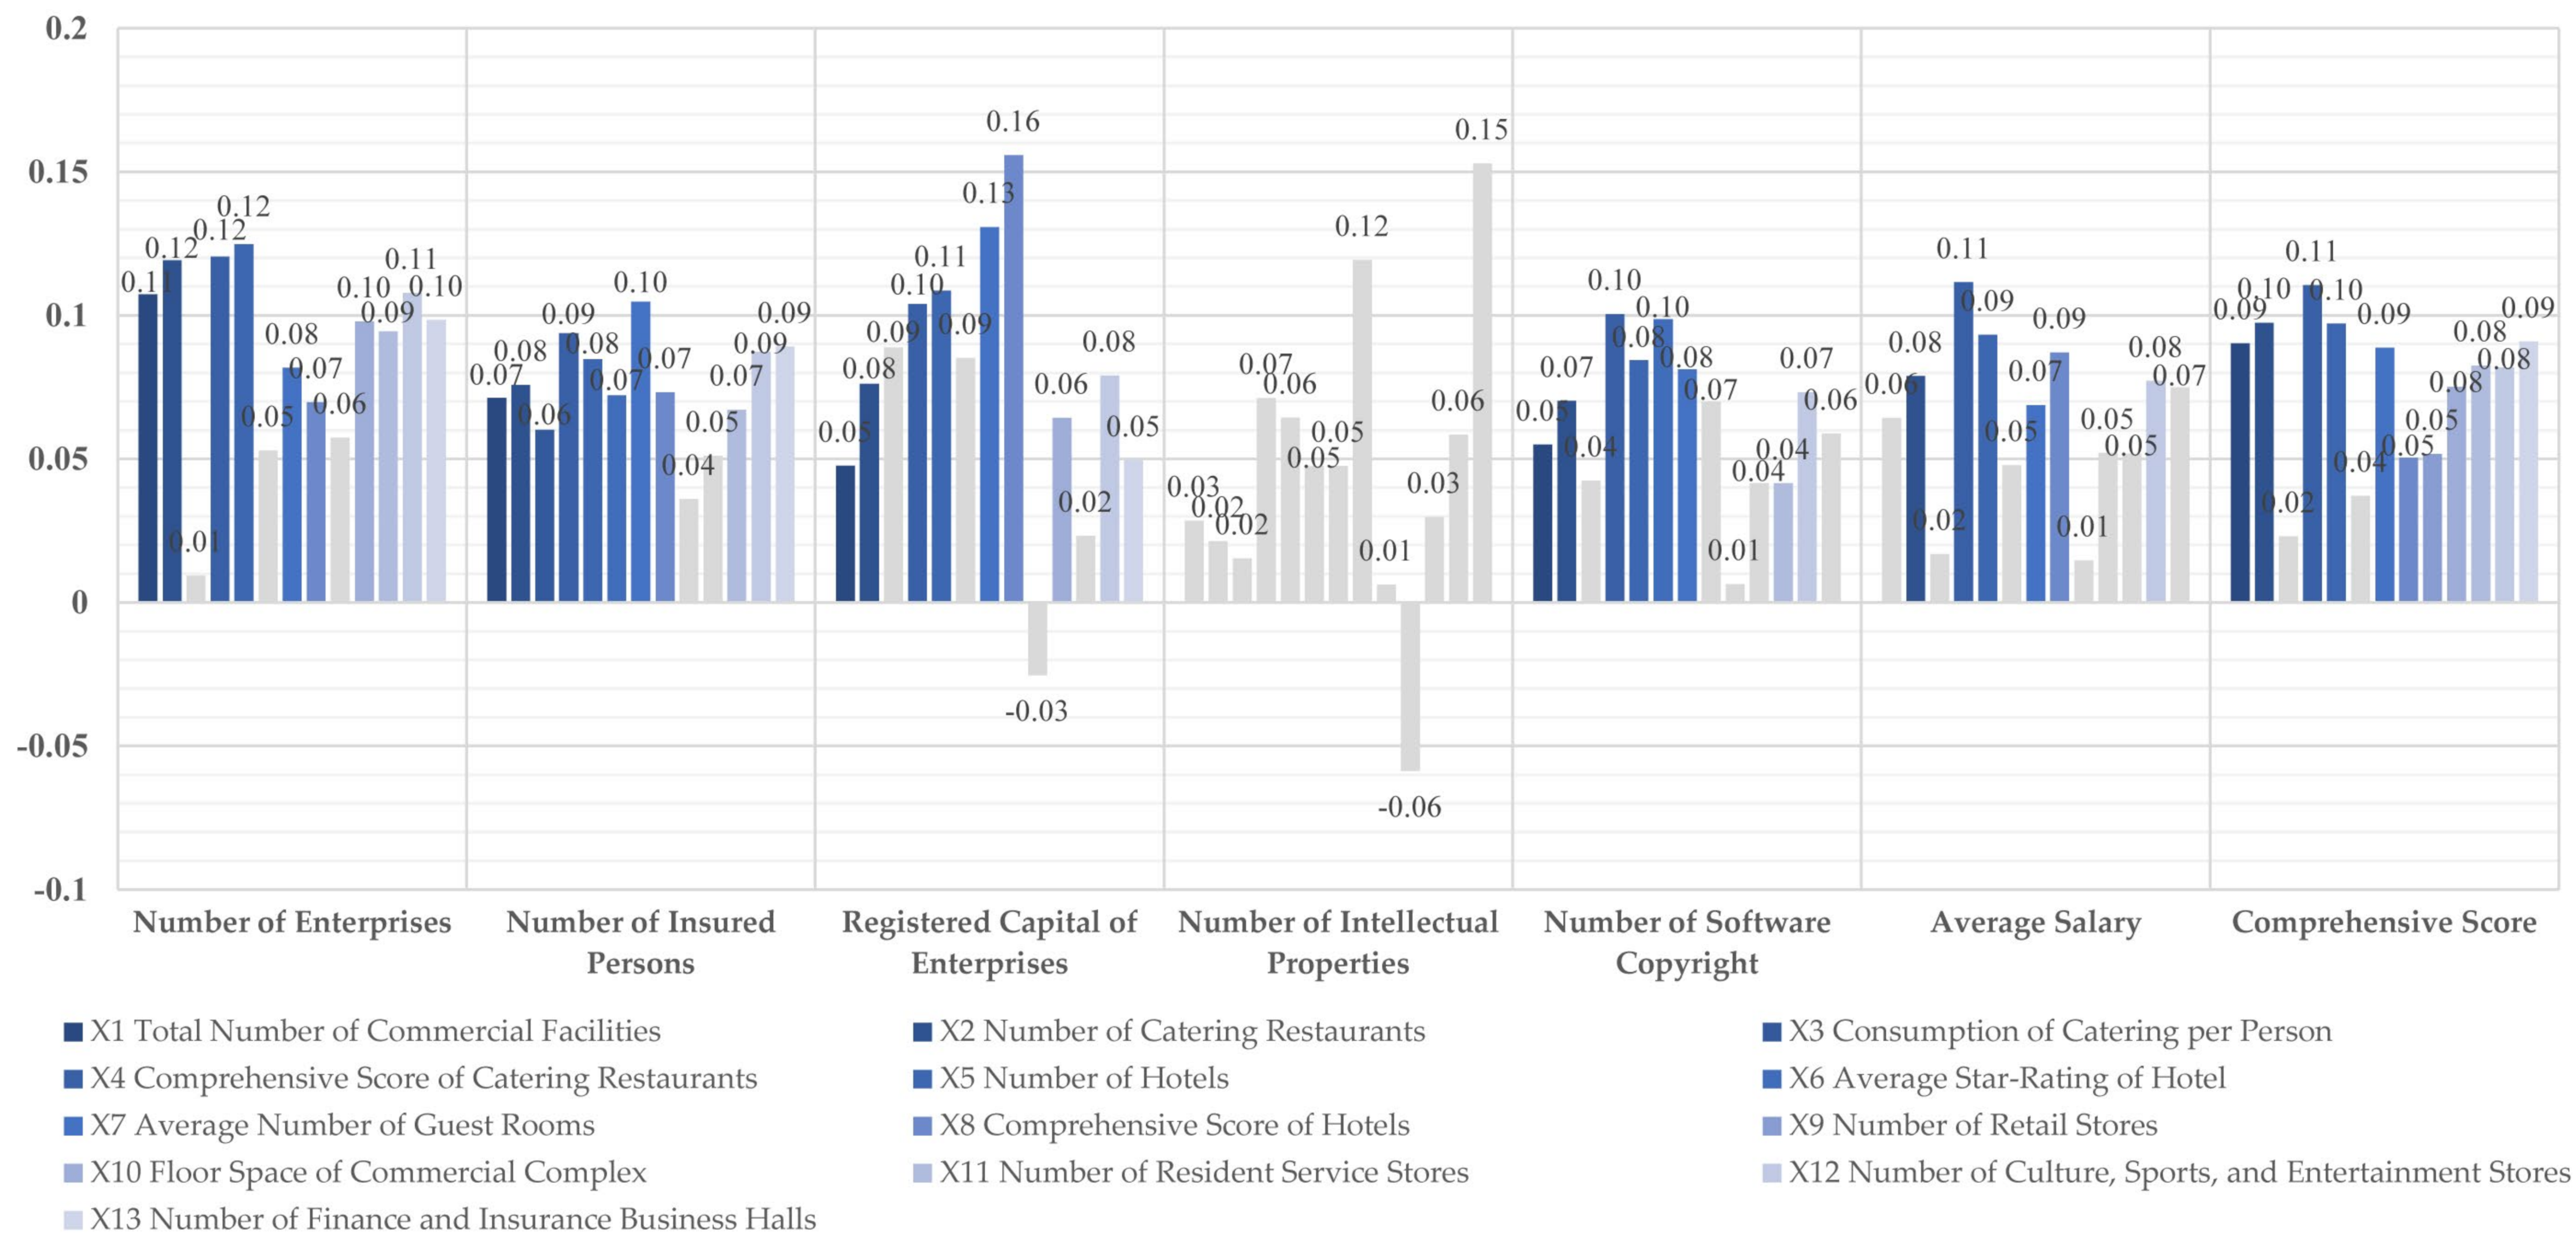
  • The scale of UCN had a positive correlation with the number of enterprises, the number of insured persons, the amount of registered capital, the number of software copyrights, and the comprehensive score of enterprises at the 0.01 significance level. There is no significant correlation between the number of commercial facilities and the other two dependent indicators.
Second, we compared the differences in the correlation significance between the six commercial service industries and the development of STEs.
  • The number and the comprehensive score of catering restaurants have a significant positive correlation with the number of enterprises, the number of insured persons, the amount of registered capital, the number of software copyrights, the average salary, and the comprehensive score of enterprises. The consumption of catering per person only has a positive correlation with the number of insured persons of enterprises and has no significant correlation with other indicators of corporate development. That means, compared with the grade of restaurants, the number and the satisfaction of catering restaurants have a more significant relevance with corporate development.
  • The number of hotels and the average number of guest rooms have a significant positive correlation with the number of enterprises, the number of insured persons, the amount of registered capital, the number of software copyrights, the average salary, and the comprehensive score of enterprises. The comprehensive score of hotels has a positive correlation with the number, the number of insured persons, the amount of registered capital, the average salary, and the comprehensive score of enterprises. The average star-rating of hotels only has a significant positive correlation with the number of insured persons and the number of software copyrights. That means, compared with the grade of hotels, the number, scale, and satisfaction have a more significant relevance with corporate development.
  • The number of retail stores only has a significant positive correlation with the comprehensive score of enterprises and has no significant correlation with other indicators of corporate development. The floor space of commercial complexes has a significant positive correlation with the number of enterprises, the amount of registered capital, and the comprehensive score of enterprises.
  • The number of resident service stores has a significant positive correlation with the number of enterprises, the number of insured persons, the number of software copyrights, and the comprehensive score of enterprises. The number of culture, sports, and entertainment stores has a significant positive correlation with the number of enterprises, the number of insured persons, the amount of registered capital, the number of software copyrights, the average salary, and the comprehensive score of enterprises. The number of finance and insurance business halls has a significant positive correlation with the number of enterprises, the number of insured persons, the amount of registered capital, and the comprehensive score of enterprises.
Third, we compared the degree of the correlation between the 13 independent variables and the development of STEs by comparing the standardized regression coefficient. For each dependent variable Y, we selected the four independent variables with the highest standardized coefficients from the significantly correlated independent variables X, and observed which commercial service industries they belong to. In summary, the catering; hotel; and culture, sports, and entertainment industries correlated the most with STE development.
  • The four most correlated independent variables with the number of enterprises (Y1) are the number of catering restaurants (X2), the comprehensive score of catering restaurants (X4), the number of hotels (X5), and the number of culture, sports, and entertainment stores (X12).
  • The four most correlated independent variables with the number of insured persons (Y2) are the comprehensive score of catering restaurants (X4); the average number of guest rooms (X7); the number of culture, sports, and entertainment stores (X12); and the number of finance and insurance business hall (X13).
  • The four most correlated independent variables with the registered capital of enterprises (Y3) are the comprehensive score of catering restaurants (X4), the number of hotels (X5), the average number of guest rooms (X7), and the comprehensive score of hotels (X8).
  • The four most correlated independent variables with the number of software copyrights (Y5) are the comprehensive score of catering restaurants (X4), the number of hotels (X5), the average star-rating of hotels (X6), and the average number of guest rooms (X7).
  • The four most correlated independent variables with the average salary of employees (Y6) are the comprehensive score of catering restaurants (X4), the number of hotels (X5), the comprehensive score of hotels (X8), and the number of culture, sports, and entertainment stores (X12).
  • The four most correlated independent variables with the comprehensive score of STEs (Y7) are the number of catering restaurants (X2), the comprehensive score of catering restaurants (X4), the number of hotels (X5), and the average number of guest rooms (X7).
In addition, we have also found that none of the 13 independent indicators have a significant correlation with the number of intellectual properties of enterprises (Y4), and the R-squared value of Y4 is 0.216, which is relatively low compared with other dependent variables.

6. Key Findings

This study focused on the correlation between UCNs and STEs, including verifying the spatial correlation of location and site selection, and comparing the differences in the correlation between six commercial service industries and the development of STEs. Essentially, facing the problems of converting the land use from industrial to commercial and the mismatch between commercial resources and the consumer demands in innovation districts, this study aimed to explore how to plan the UCNs and the STE clusters to be more conducive to the development of innovation districts. The Hangzhou West High-Tech Corridor, which represents the latest development trend in China’s innovation districts, was selected as a typical study case. First, a spatial correlation test and spatial statistics were performed to verify the relevance of site selection between UCNs and STEs. Second, based on POI data, Internet assessment data, and corporate business information data, 13 indicators reflecting six major commercial service industries and 7 indicators reflecting corporate development were selected. Then, partial least squares regression was performed to analyze the correlation between UCNs and the development of STEs. The main findings of this study can be expressed as follows:
  • There was a significant correlation related to the spatial distribution between UCNs and STEs. Almost all L–H areas were within 500 m of the H–H areas. The UCN areas, and the 500 m buffer zone surrounding them, covered 94.86% of STEs and 96.18% of the STE employees. The service sector STEs tended to be located closer to UCNs than the manufacturing STEs. The distance from small-scale STEs to UCNs was shorter than that of large-scale STEs.
  • UCNs may promote the development of surrounding STEs. The scale of UCN had a significant positive correlation on the agglomeration, scale, and comprehensive development level of STEs. Improving the number and upgrading the comprehensive score of restaurants and hotels may promote the agglomeration, development scale, salary, and comprehensive development level of STEs. The scales of the resident service industry; culture, sports, and entertainment industry; and finance and insurance industry all contributed to a certain extent to different aspects of corporate development.
  • There were differences in the degree of mutual influences between the six commercial service industries and the development of surrounding STEs. Catering and hotel industries were the two most correlated industries for corporate development. The scale and satisfaction of catering and hotel industries might be conducive to the development of STEs. The culture, sports, and entertainment industry also made a relatively high contribution to STE development, while the number of retail stores had almost no significant correlation with the development of STEs.
  • The commercial complex may be one of the physical forms that were conducive to the development of surrounding STEs. The floor space of the commercial complex had a significant positive correlation on the agglomeration, scale, and comprehensive development level of STEs. It can be inferred that the highly developed Internet economy has already digested much of consumer demand. Only when massive retail stores gather into commercial complexes will they promote the development of surrounding STEs.
Compared with previous researches, the contribution of this study is mainly in guiding how to rationalize the planning of UCNs in innovation districts. First, several previous studies believed that commercial service facilities (including cafés, restaurants, entertainment facilities, shopping malls, etc.) are conducive to the development of innovation districts by improving the quality of life [31,33], attracting and retaining knowledge workers, enhancing regional competitiveness [11], and creating places for knowledge spillover [38]. The current study validated these arguments and further examined the differences in the correlation of six commercial service industries from the perspective of STE performance. On this basis, suggestions for the spatial planning of UCNs and STE clusters, and the rational allocation of commercial resources in innovation districts were proposed.
Moreover, previous researches suggested that creating a “high quality” living environment is conducive to attract and retain talents in innovation districts [30,32,38], but few literatures have specifically explained the standard of “high quality”. From the perspective of UCNs, the “high quality” seems irrelevant to the price factor. In this study, the two indicators representing the prices of catering and hotel industries, namely, the consumption of catering per person, and the average star-rating of hotels, were not significantly correlated with the development of STEs. This indicates that although knowledge workers are generally characterized by high-income attributes, it does not mean they prefer more expensive commercial services. Instead, the number and the comprehensive score of commercial facilities are positively correlated with the development of STEs. Therefore, “richness” and the “satisfaction” may be the criteria for evaluating a “high quality” UCN.
Therefore, this study put forward the following suggestions for future urban planning and design in new urban innovative districts:
First, the urban planning and design of innovation districts should consider allocating sufficient commercial land at an appropriate distance from the STE clusters. Referring to the Hangzhou West High-Tech Corridor, we believe that about 500 m accessible to UCNs from STE clusters is reasonable. We suggest that small-scale STEs could be located within the UCN areas, while large-scale STEs may be distributed within 500 m from the UCNs, which is a distance that not only provides easy access to commercial services, but also reserves enough space for their own development.
Second, in terms of commercial resource allocation, priority can be properly granted to the quantity and quality of catering and hotel industries in urban innovation districts. The catering industry can guarantee the rapid and abundant supply of food for the STE employees. The hotel industry may cooperate with STEs to provide enhanced services. In addition, the space utilized by the culture, sports, and entertainment industry should be fully reserved because it is also relied on by businesses and has a relatively high degree of correlation with corporate development. This is inextricably related to high-income people’s consumer demand for cultural life, health care, and recreation.
Finally, the commercial complexes could be one of the space carriers for UCNs in innovation districts. In the context of the widespread popularity of online shopping, the commercial complex may be one of the good forms of physical commercial space. Since online shopping has become the first choice of consumption for young people, shopping itself is no longer the main function of physical commerce. Instead, spiritual demands that can force people to go out of their houses, such as social and entertainment consumption, will become the future of offline formats. Therefore, a commercial complex that integrates catering, retail, entertainment, and other forms of commercial services can effectively attract crowds. This study also verified that commercial complexes may promote the development of surrounding STEs. Thus, different scales of commercial complexes should be rationally arranged in urban innovation districts to promote the healthy development of the real economy and improve urban functions and spatial quality.
This study investigated the correlation between UCNs and the development of STEs in innovation districts, adopting the Hangzhou West High-Tech Corridor—which is not a “planned project” as it has experienced constant dynamic planning adjustments—as a special study case. The randomness, spontaneity, and complexity of urban elements inside the Corridor are the result of a combination of market-driven and planning-driven processes. In this study, we consider the correlation of UCNs and the development of STEs as a symbiotic rather than a causal relationship. In addition to UCNs, a reasonable job–housing relationship [18] and abundant open spaces and ecological resources [44] are also necessary urban elements for innovation districts. These urban elements do not independently influence the development of innovation districts. Essentially, an integrated urban morphology consisting of various urban elements is the foundation of the sustainable development trend of urban innovation districts.
There are some limitations in this study in terms of indicator selection and sampling data. First, this study referred to national standards and previous studies when selecting the indicators of UCNs and STEs. Only some of the available indicators were selected, which may influence the research results. Meanwhile, as some corporate economic data was confidential, corporate development data did not cover all STEs, which will lead to a small bias of sample data.
Future research will discuss how different types of UCNs effect the development of industrial parks and urbanization from the perspective of urban design and space–time evolution. Furthermore, dynamic big data such as cellular signaling data and traffic congestion data should supplement indicators such as travel range and traffic accessibility, which will help to explore the type and proportion of mixed land use between urban commercial and industrial functions. This will provide references for the urban planning of new urban districts and the functional repair of single-function urban built areas.

Author Contributions

Conceptualization, Y.W.; methodology, Y.W. and X.L.; formal analysis, X.L.; investigation, X.L.; data curation, X.L.; writing—original draft preparation, X.L.; writing—review and editing, Y.W., W.X., Y.Y. and X.L.; visualization, X.L.; supervision, Y.W.; funding acquisition, Y.W. All authors have read and agreed to the published version of the manuscript.

Funding

This research was funded by the National Natural Science Foundation of China (No. 51778559).

Data Availability Statement

The data presented in this study are available on request from the corresponding author.

Acknowledgments

The authors are grateful for the support of the National Natural Science Foundation of China. The contents of this paper are solely the responsibility of the authors and do not represent the official views of the institutes and funding agencies.

Conflicts of Interest

The authors declare no conflict of interest.

References

  1. Liao, X. Problems of Land Use in Industrial Parks and the Solutions. Frontiers 2017, 17, 74–77. [Google Scholar]
  2. Pi, Q.; Wang, K. Out of the Isolated Island: An Overview of China Economic and Technological Development Zone, 1st ed.; SDX Joint Publishing Company: Beijing, China, 2004; pp. 209–212. [Google Scholar]
  3. Zeng, Z.; Zhou, J. Traditional Industrial Park Transition and Restructuring for Industry-city Integration. Plan 2013, 29, 46–50. [Google Scholar]
  4. Bezpalov, V.V.; Fedyunin, D.V.; Solopova, N.A.; Avtonomova, S.A.; Lochan, S.A. A Model for Managing the Innovation-driven Development of a Regional Industrial Complex. Entrep. Sustain. Issues 2019, 6, 1884–1896. [Google Scholar] [CrossRef]
  5. Chen, M.; Liu, W.; Lu, D.; Chen, H.; Ye, C. Progress of China’s new-type urbanization construction since 2014: A preliminary assessment. Cities 2018, 78, 180–193. [Google Scholar] [CrossRef]
  6. Boddy, M. Geographical economics and urban competitiveness: A critique. Urban Stud. 1999, 36, 811–842. [Google Scholar] [CrossRef]
  7. Katz, B.; Bradley, J. The Metropolitan Revolution: How Cities and Metros Are Fixing Our Broken Politics and Fragile Economy; Brookings Institution Press: Washington, DC, USA, 2013. [Google Scholar]
  8. Clark, J.; Huang, H.-I.; Walsh, J.P. A typology of ‘innovation districts’: What it means for regional resilience. Camb. J. Reg. Econ. Soc. 2010, 3, 121–137. [Google Scholar] [CrossRef]
  9. Katz, B. The Rise of Innovation Districts: A New Geography of Innovation in America; Metropolitan Policy Program at Brookings: Washington, DC, USA, 2014. [Google Scholar]
  10. Jabareen, Y.R. Sustainable Urban Forms–Their Typologies, Models, and Concepts. J. Plan. Educ. Res. 2006, 26, 38–52. [Google Scholar] [CrossRef]
  11. Glaeser, E.L.; Kolko, J. Consumer city. J. Econ. Geogr. 2001, 1, 27–50. [Google Scholar] [CrossRef]
  12. Dong, O.; Li, H.; Lin, L.; Zhao, S.; Yuan, Z. Industry-city Integration in Urban Transition: Sino-Malaysia Industrial Park Case. Planners 2014, 6, 25–31. [Google Scholar]
  13. Liu, C.; Xinyang, L.I.; Hang, X. Path toward City-Industry Integration in New Urban Development Zones. Urban Plan. Forum 2012, z1, 104–109. [Google Scholar]
  14. Wu, Y. Shaping a Mature Urban Form for the Science Park Conceptual Plan of New Zhangjiang Hi-Tech Park. Archit. Cult. 2007, 37, 24–31. [Google Scholar]
  15. Wu, Y.; Song, S. Comparative Study on the Spatial Form of "Internet +" Emerging Industrial Parks in Hangzhou West Innovation Corridor—Taking Xixi Park of Alibaba, the First Phase of ZOTP and Dream Town as Examples. Archit. Cul. 2018, 10, 83–85. [Google Scholar]
  16. “14th Five Year Plan” for the Development of Hangzhou West Hi-Tech Corridor. Available online: http://cxkc.hangzhou.gov.cn/art/2021/7/13/art_1228936445_58895638.html (accessed on 13 July 2021).
  17. Matters about Job-Housing Relationship in Hangzhou West High-Tech Corridor. Available online: https://mp.weixin.qq.com/s/2sE6cUHeSjYfVk4QILHViQ (accessed on 26 November 2021).
  18. Wu, Y.; Yang, Y.; Chen, Q.X.; Xu, W.S. The Correlation between the Jobs-Housing Relationship and the Innovative Development of Sci-Tech Parks in New Urban Districts: A Case Study of the Hangzhou West Hi-Tech Corridor in China. ISPRS Int. Geo-Inf. 2020, 9, 762. [Google Scholar] [CrossRef]
  19. Industrial Classification for National Economic Activities 2017. Available online: http://www.stats.gov.cn/tjsj/tjbz/hyflbz/201710/t20171012_1541679.html (accessed on 29 September 2017).
  20. World Bank, Development Research Center of the State Council. Urban China: Toward Efficient, Inclusive, and Sustainable Urbanization; World Bank: Washington, DC, USA, 2014. [Google Scholar]
  21. Jie, Z.; Wang, Y. Industrial Park Development Threshold Analysis in Fast Urbanization Period: Institutional Innovation in Suzhou-Wuxi-Changzhou Region. Planners 2011, 9, 9–14. [Google Scholar]
  22. Wang, H. Inter-relations and Spatial Effect between New Development Zones and Their Mother City. City Plan. Rev. 2003, 27, 20–25. [Google Scholar]
  23. Wenbin, L.I.; Chen, H. Analysis of City-Industry Integration and Planning Strategies. Urban Plan. Forum 2012, z1, 99–103. [Google Scholar]
  24. Leon, N. Attract and Connect: The 22@Barcelona Innovation District and the Internationalisation of Barcelona Business. Innov.-Manag. Policy Pract. 2008, 10, 235–246. [Google Scholar] [CrossRef]
  25. Pique, J.M.; Miralles, F. Areas of innovation in cities: The evolution of 22@Barcelona. Int. J. Knowl.-Based Dev. 2019, 10, 3–25. [Google Scholar] [CrossRef]
  26. Charnock, G.; Ribera-Fumaz, R. A new space for knowledge and people? Henri Lefebvre, representations of space, and the production of 22@Barcelona. Environ. Plan. D-Soc. Space 2011, 29, 613–632. [Google Scholar] [CrossRef]
  27. Lazzeretti, L.; Boix, R. Do Creative Industries Cluster? Mapping Creative Local Production Systems in Italy and Spain. Ind. Innov. 2008, 15, 549–567. [Google Scholar] [CrossRef] [Green Version]
  28. Clifton, N. The "creative class" in the UK: An initial analysis. Geogr. Ann. Ser. B-Hum. Geogr. 2008, 90B, 63–82. [Google Scholar] [CrossRef]
  29. Pancholi, S.; Yigitcanlar, T. Governance that matters Identifying place-making challenges of Melbourne’s Monash Employment Cluster. J. Place Manag. Dev. 2017, 10, 73–87. [Google Scholar] [CrossRef]
  30. Pancholi, S.; Yigitcanlar, T. Place making for innovation and knowledge-intensive activities: The Australian experience. Technol. Forecast. Soc. Chang. 2019, 146, 616–625. [Google Scholar] [CrossRef] [Green Version]
  31. Zukin, S. Seeing like a city: How tech became urban. Theory Soc. 2020, 49, 941–964. [Google Scholar] [CrossRef]
  32. McCann, E.J. ‘Best Places’: Interurban Competition, Quality of Life and Popular Media Discourse. Urban Stud. 2004, 41, 1909–1929. [Google Scholar] [CrossRef]
  33. Bereitschaft, B.; Cammack, R. Neighborhood diversity and the creative class in Chicago. Appl. Geogr. 2015, 63, 166–183. [Google Scholar] [CrossRef]
  34. Yigitcanlar, T.; Baum, S. Attracting and retaining knowledge workers in knowledge cities. J. Knowl. Manag. 2007, 11, 6–17. [Google Scholar] [CrossRef] [Green Version]
  35. Florida, R. Cities and the Creative Class. City Community 2003, 2, 3–19. [Google Scholar] [CrossRef]
  36. Esmaeilpoorarabi, N.; Yigitcanlar, T. Towards an urban quality framework: Determining critical measures for different geographical scales to attract and retain talent in cities. Int. J. Knowl.-Based Dev. 2016, 7, 290–312. [Google Scholar] [CrossRef]
  37. Asheim, B.; Hansen, H.K. Knowledge Bases, Talents, and Contexts: On the Usefulness of the Creative Class Approach in Sweden. Econ. Geogr. 2009, 85, 425–442. [Google Scholar] [CrossRef]
  38. Esmaeilpoorarabi, N.; Yigitcanlar, T. Place quality in innovation clusters: An empirical analysis of global best practices from Singapore, Helsinki, New York, and Sydney. Cities 2018, 74, 156–168. [Google Scholar] [CrossRef] [Green Version]
  39. Sun, C.C.; Lin, G.T.R.; Tzeng, G.H. The Evaluation of Cluster Policy by Fuzzy MCDM: Empirical Evidence from HsinChu Science Park. Expert Syst. Appl. 2009, 36, 11895–11906. [Google Scholar] [CrossRef]
  40. Xiao, L.; North, D. The role of Technological Business Incubators in supporting business innovation in China: A case of regional adaptability? Entrep. Reg. Dev. 2018, 30, 29–57. [Google Scholar] [CrossRef] [Green Version]
  41. Salvador, E. Are Science Parks and Incubators Good “Brand Names” for Spin-offs? The Case Study of Turin. J. Technol. Transf. 2011, 36, 203–232. [Google Scholar] [CrossRef]
  42. Yan, M.R.; Chien, K.M.; Hong, L.Y.; Yang, T.N. Evaluating the Collaborative Ecosystem for an Innovation-Driven Economy: A Systems Analysis and Case Study of Science Parks. Sustainability 2018, 10, 887. [Google Scholar] [CrossRef] [Green Version]
  43. Etzkowitz, H.; Zhou, C.Y. Innovation Incommensurability and the Science Park. R D Manag. 2018, 48, 73–87. [Google Scholar] [CrossRef]
  44. Wu, Y.; Xia, M. Research and Evaluation on the Open Space System in Hangzhou West Technology Innovation Corridor. Archit. Cult. 2020, 196, 207–210. [Google Scholar]
  45. Urban Digital Development Index Report in 2019. Available online: http://www.e-gov.org.cn/article-170143.html (accessed on 19 December 2019).
  46. Yue, Y.; Zhuang, Y. Measurements of POI-based Mixed Use and Their Relationships with Neighbourhood Vibrancy. Int. J. Geogr. Inf. Sci. 2017, 31, 658–675. [Google Scholar] [CrossRef] [Green Version]
  47. Jiang, S.; Alves, A. Mining Point-of-interest Data from Social Networks for Urban Land Use Classification and Disaggregation. Comput. Environ. Urban Syst. 2015, 53, 36–46. [Google Scholar] [CrossRef] [Green Version]
  48. Zhang, X.; Du, S. Hierarchical Semantic Cognition for Urban Functional Zones with VHR Satellite Images and POI Data. ISPRS J. Photogramm. Remote Sens. 2017, 132, 170–184. [Google Scholar] [CrossRef]
  49. Deng, Y.; Liu, J. Detecting Urban Polycentric Structure from POI Data. ISPRS Int. Geo-Inf. 2019, 8, 283. [Google Scholar] [CrossRef] [Green Version]
  50. Chen, S.; Tao, H. Detecting Urban Commercial Patterns Using a Latent Semantic Information Model: A Case Study of Spatial-temporal Evolution in Guangzhou, China. PLoS ONE 2018, 13, e0202162. [Google Scholar] [CrossRef] [PubMed]
  51. Report on the Construction of Hangzhou West High-Tech Corridor. Available online: https://z.hangzhou.com.cn/2021/rddsschy/content/content_8131092.html (accessed on 28 December 2021).
  52. Zhejiang Provincial Economic and Information Technology Commission; Zhejiang Provincial Bureau of Statistics. On the Issuance of “the Core Industries of the Digital Economy Statistical Classification Directory in Zhejiang Province” Notice. Available online: http://jxt.zj.gov.cn/art/2019/3/27/art_1657975_36849878.html (accessed on 27 March 2019).
  53. Hao, F.; Wang, S. Space-Time Accessibility of Commercial Centers in Changchun Urban Area Based on Internet Map Service. Econ. Geogr. 2017, 37, 68–75. [Google Scholar]
  54. Traffic Isochrones Division Tool Based on Gaode Map API. Available online: https://i.xdc.at/2016/10/30/transportation-contour-line-tbx/ (accessed on 30 October 2016).
  55. Rosenblatt, M. Remarks on Some Nonparametric Estimates of a Density-function. Ann. Math. Stat. 1956, 27, 832–837. [Google Scholar] [CrossRef]
  56. Borruso, G. Network Density Estimation: A GIS Approach for Analysing Point Patterns in a Network Space. Trans. GIS 2008, 12, 377–402. [Google Scholar] [CrossRef]
  57. Okabe, A.; Satoh, T. A Kernel Density Estimation Method for Networks, Its Computational Method and a GIS-based Tool. Int. J. Geogr. Inf. Sci. 2009, 23, 7–32. [Google Scholar] [CrossRef]
  58. De Valck, J.; Broekx, S. Contrasting Collective Preferences for Outdoor Recreation and Substitutability of Nature Areas Using Hot Spot Mapping. Landsc. Urban Plan. 2016, 151, 64–78. [Google Scholar] [CrossRef]
  59. Li, Y.; Zhang, L. Mapping the Hotspots and Coldspots of Ecosystem Services in Conservation Priority Setting. J. Geogr. Sci. 2017, 27, 681–696. [Google Scholar] [CrossRef]
  60. Anselin, L.; Rey, S. Modern Spatial Econometrics in Practice: A Guide to Geoda, Geodaspace and Pysal; GeoDa Press LLC: Chicago, IL, USA, 2014. [Google Scholar]
  61. Liu, Y.; Li, W. Research on Identification of Commercial Spatial Patterns and Commercial Center in Xi’an Based on POI Data. Urban. Archit. 2020, 17, 15–18. [Google Scholar]
  62. Zhang, X.; Zhong, E. Spatial Distribution and Clustering of Commercial Network in Beijing during 2004–2008. Prog. Geogr. 2013, 32, 1207–1215. [Google Scholar]
  63. Ma, L.; Sun, H. Research on the Choice of Online Consumer Behavior Choice Preference Based on the Data of Dianping.com: A Case Study of the Main City of Kunming. Mod. Urban Res. 2020, 6, 48–55. [Google Scholar]
  64. Liu, S.; Hou, P. Protection of Intellectual Property Right and Innovation Capacity of China’s Industry. J. Quant. Tech. Econ. 2015, 32, 40–57. [Google Scholar]
  65. Li, L.; Tan, L. On the Commonness and Difference of Intellectual Property Management between Software Enterprises and Production Enterprises. China Invent. Pat. 2020, 17, 24–28. [Google Scholar]
  66. Statistical Classification of Large, Medium, Small and Micro Enterprises in 2017. Available online: http://www.stats.gov.cn/xxgk/tjbz/gjtjbz/202008/t20200811_1782335.html (accessed on 28 December 2017).
  67. Wang, H.; Wu, Z.; Meng, J. Partial Least Squares Regression-Linear and Nonlinear Methods; National Defense Industry Press: Beijing, China, 2006; pp. 138–149. [Google Scholar]
Figure 1. Location of Hangzhou West High-Tech Corridor: (a) Hangzhou, China; (b) location and external transportation of the Corridor.
Land 11 02086 g001
Figure 2. Spatial structure of the Corridor and the distribution of corporate headquarters and corporate R&D centers. Logos of some world-renowned corporate headquarters and corporate R&D centers are annotated.
Land 11 02086 g002
Figure 3. Spatial distribution of commercial facilities.
Land 11 02086 g003
Figure 4. Spatial distribution of STEs.
Land 11 02086 g004
Figure 5. Commercial agglomeration areas. (a) Kernel density estimation. (b) Hotspots of commercial facilities with different confidence levels.
Land 11 02086 g005
Figure 6. Spatial distribution of UCNs.
Land 11 02086 g006
Figure 7. Flowchart of study methods.
Land 11 02086 g007
Figure 8. Spatial distribution of UCNs and agglomeration areas of STEs.
Land 11 02086 g008
Figure 9. Bivariate local Moran’s I map between UCNs and STEs.
Land 11 02086 g009
Figure 10. Distance relationship among STEs, employees in STEs, and UCNs.
Land 11 02086 g010
Figure 11. Standardized regression coefficients (The gray bar charts indicate that independent variables and dependent variables are not significantly correlated).
Land 11 02086 g011
Table 1. Information of commercial facilities data.
TypeCommercial
Service
Industries
ClassificationData
Dimension
Data SizeData Source
Inside the Corridor/Collection Area
Internet
Assessment
Data
Catering
Industry
Chinese food, Western food, Korean food, Japanese food, fast food, bar, café, bread and dessert, drinks shop, teahouse, hotpot, barbecue, crayfish, seafood, noodle, morning tea, buffet, fresh food, health care, etc.Location;
consumption
per person;
comprehensive score
11,430/64,688Dianping.
com
Hotel
Industry
Hotel, B&B, serviced apartment, youth hostel, villa, inn, agritainment, etc.Location;
star rating;
number of guest rooms;
comprehensive score
587/4519Ctrip.
com
Internet
Map
POI
Data
Retail
Industry
Shopping mall, department store, supermarket, convenience store, building material market, household appliances market, retail stores, etc.Location;
floor space of
commercial complex
4411/35,670Baidu Map
Resident
Service
Industry
Communication service hall, post office, courier service, ticket office, laundry, print shop, photo studio, real estate agency, maintenance station, household service, pet service, newsstand, beauty salon, barber shop, nail salon, etc.Location2817/20,947
Culture, Sports, and Entertainment
Industry
Art gallery, exhibition hall, cultural center, stadium, fitness center, resort, cinema, KTV, theater, opera house, ballroom, Internet bar, game center, bath center, massage, recreation club, etc.Location1029/7408
Finance and
Insurance Industry
Bank, ATM, credit cooperative, investment service, pawnshop, etc.Location314/3284
Table 2. Information of development data of STEs.
TypeSector
Classification
Digital
Economy
Industries
Data
Dimension
Data SizeData
Source
Inside the
Corridor
Enterprise Credit Information DataManufacturing SectorComputer, communications, and other
electronic equipment manufacturing
Location;
registered capital;
number of insured persons;
average salary;
number of intellectual
properties;
number of software
copyrights;
comprehensive score
307Qichacha;
Tianyancha;
Qixinbao;
Electronic information and electromechanical manufacturing
Special electronic equipment manufacturing
Service SectorThe telecom, radio and television, and
satellite transmission service industry
5377
Internet and related service industry
The software and information technology
service industry
The cultural digital content service industry
Table 3. Detailed information of UCNs.
CategoryName of UCNsExplanation
Built more than 20 years agoCuiyuanCuiyuan subdistrict. Close to the central business district of Hangzhou and the Yuquan Campus of Zhejiang University. The proportion of old residential areas is relatively high.
WenxinWenxin subdistrict, with the Xixi wetland on the west side. Mixed spatial forms of industry (including sci-tech parks, office buildings, etc.), residential functions (including newly built residences, old communities, urban villages, etc.), and commercial functions (including commercial complexes, commercial streets, etc.).
SandunSandun town. Rapid development in recent years due to the construction of Zijingang Campus, Zhejiang University, and the planning of Zijingang Sci-Tech City.
LiuxiaLiuxia subdistrict. A major transportation route connecting the east and west parts of Hangzhou, with residential areas as the main function. Enterprises are mostly concentrated in the Liuxia industrial district. Commercial facilities are mainly inside a giant commercial complex, namely, Xixi InCity.
XianlinXianlin subdistrict. The southwest part is a mix of traditional industrial areas and sci-tech parks, and the north and east parts are mainly residential areas.
YuhangYuhang old town, located at the westernmost end of the Future Sci-Tech City and the east of South Lake, with residential areas as the main function. Commercial facilities are mainly in the form of commercial streets.
Lin’anCenter of Lin’an old town. Commercial facilities are mainly in the form of commercial streets.
Built in the past 20 yearsShenhuaShenhua subdistrict. Located in the east of Zijingang Campus, Zhejiang University. Rapidly developed because of the construction of Zhejiang University. Almost all industrial, residential, and commercial facilities inside the node were newly built in the last 20 years.
ZijingangCore area of Zijingang Sci-Tech City. Close to Zijingang Campus, Zhejiang University, and Westlake University. Core industries: digital economy and intelligent manufacturing.
WuchangWuchang subdistrict. Traditional industrial parks, sci-tech parks, and residential areas are highly mixed.
XiaoheshanXiaoheshan higher education area. Many campuses of universities are located inside the node. Commercial facilities mainly serve these universities and surrounding sci-tech parks.
ZhongtaiThe industrial and residential areas formed with the construction of Zhongtai Industrial Park.
QingshanhuCore area of Qingshanhu Sci-Tech City. Core industries: advanced manufacturing, represented by core components of high-end equipment and new energy materials. The number of commercial facilities is significantly lower than in the eastern part of the Corridor.
A&F
University
Donghu Campus, Zhejiang A&F University. College student entrepreneurship parks, newly built high-rise residential areas, and urban villages are highly mixed. Commercial facilities are mainly in the form of commercial streets.
Built in the past 10 yearsJiangcunJiangcun commercial and residential district. Rapid development with the construction of the Zijingang Campus and Subway Line 5. A series of large commercial complexes such as Xixi Intime City and Xixi Paradise Walk were built in the past five years.
AlibabaAround Alibaba global headquarters. The Alibaba headquarters is a group of giant sci-tech parks for a single corporation. It is divided into three parks from south to north. Commercial facilities are distributed around these three parks.
EFCEuro-America Financial City is a landmark building in the core area of the Future Sci-Tech City. The main space form is a super high-rise office building and ground floor commercial center.
The Dream TownThe Dream Town is a model for the construction of a Chinese special town, with the main function of incubating small- and medium-sized Internet enterprises. Commercial facilities are mainly in the form of commercial streets.
Table 4. Independent variables.
CategoryIndependent
Variables
IndicatorExplanation
Scale of UCNX1Total Number of Commercial FacilitiesThe total number of all commercial facilities in each sample.
Catering
Industry
X2Number of Catering RestaurantsThe number of catering restaurants in each sample.
X3Consumption of Catering per PersonThe average consumption per person of all restaurants in each sample.
X4Comprehensive Score of Catering RestaurantsThe average comprehensive score of all restaurants in each sample.
Hotel
Industry
X5Number of HotelsThe number of hotels in each sample.
X6Average Star-Rating of HotelsThe average star-rating of all hotels in each sample.
X7Average Number of Guest RoomsThe average number of guest rooms of all hotels in each sample.
X8Comprehensive Score of HotelsThe average comprehensive score of all hotels in each sample.
Retail
Industry
X9Number of Retail StoresThe number of all retail stores in each sample.
X10Floor Space of Commercial ComplexThe total floor space of all commercial complexes in each sample.
Resident Service IndustryX11Number of Resident Service StoresThe number of all resident service stores in each sample.
Culture, Sports,
Entertainment Industry
X12Number of Culture, Sports, and Entertainment StoresThe number of all culture, sports, and entertainment stores in each sample.
Finance and Insurance IndustryX13Number of Finance and Insurance Business HallsThe number of all finance and insurance business halls in each sample.
Table 5. Dependent variables.
CategoryDependent
Variables
IndicatorExplanation
Agglomeration
Degree
Y1Number of EnterprisesThe total number of all commercial facilities in each sample.
Development
Scale
Y2Number of Insured PersonsThe average number of insured persons of all enterprises in each sample.
Y3Registered Capital of EnterprisesThe average amount of registered capital of all enterprises in each sample.
Innovation
Ability
Y4Number of Intellectual PropertiesThe average number of intellectual properties of enterprises in each sample.
Y5Number of Software CopyrightsThe average number of software copyrights of enterprises in each sample.
Salary
Package
Y6Average Salary of EmployeesThe average salary of employees in each sample.
Comprehensive
Development Level
Y7Comprehensive ScoreThe average comprehensive score of all enterprises in each sample. Published by the Tianyancha platform. This score involves more than 300 dimensions of the enterprises’ public information.
Table 6. Result of cross-validity analysis.
hY1Y2Y3Y4Y5Y6Y7
SSQh2SSQh2SSQh2SSQh2SSQh2SSQh2SSQh2
PRESSPRESSPRESSPRESSPRESSPRESSPRESS
11.96 × 10⁶
2.81 × 10⁶
19.31 × 10⁶
1.19 × 10⁷
12.59 × 10⁶
3.41 × 10⁶
14.47 × 10⁴
6.67 × 10⁴
16.91 × 10⁶
9.17 × 10⁶
13.71 × 10⁸
5.49 × 10⁸
17.83 × 10³
1.02 × 10⁴
1
27.30 × 10⁵
2.28 × 10⁶
−0.1635.57 × 106
1.05 × 10⁷
−0.1271.06 × 106
1.79 × 10⁶
0.3111.67 × 104
7.13 × 10⁴
−0.5934.34 × 106
8.73 × 10⁶
−0.2632.36 × 108
5.39 × 10⁸
−0.4535.50 × 103
1.22 × 10⁴
−0.562
32.96 × 10⁵
1.15 × 10⁶
−0.5812.70 × 106
1.44 × 10⁷
−1.5946.14 × 105
1.45 × 10⁶
−0.3771.12 × 104
6.03 × 10⁴
−2.6082.97 × 106
8.94 × 10⁶
−1.0581.82 × 108
5.02 × 10⁸
−1.1322.65 × 103
1.61 × 10⁴
−1.925
42.36 × 10⁵
9.65 × 10⁵
−2.2611.55 × 106
2.21 × 10⁷
−7.2174.62 × 105
1.85 × 10⁶
−2.0071.02 × 104
5.08 × 10⁴
−3.5382.44 × 106
8.28 × 10⁶
−1.7891.70 × 108
5.55 × 10⁸
−2.0451.89 × 103
1.23 × 10⁴
−3.629
51.85 × 10⁵
1.18 × 10⁶
−4.0029.34 × 105
2.25 × 10⁷
−13.563.73 × 105
2.86 × 10⁶
−5.1969.70 × 103
6.07 × 10⁴
−4.9642.26 × 106
8.83 × 10⁶
−2.6151.48 × 108
7.36 × 10⁸
−3.3371.68 × 103
9.80 × 10³
−4.192
61.45 × 10⁵
1.31 × 10⁶
−6.0866.55 × 105
2.12 × 10⁷
−21.712.68 × 105
3.19 × 10⁶
−7.5539.22 × 103
7.92 × 10⁴
−7.1732.14 × 106
9.36 × 10⁶
−3.1451.41 × 108
7.71 × 10⁸
−4.2191.55 × 103
1.12 × 10⁴
−5.641
71.22 × 10⁵
1.52 × 10⁶
−9.4875.92 × 105
2.05 × 10⁷
−30.262.52 × 105
3.10 × 10⁶
−10.557.90 × 103
1.25 × 10⁵
−12.552.10 × 106
9.76 × 10⁶
−3.5561.37 × 108
8.41 × 10⁸
−4.9681.52 × 103
1.22 × 10⁴
−6.872
81.15 × 10⁵
1.83 × 10⁶
−14.044.68 × 105
2.37 × 10⁷
−38.982.25 × 105
3.35 × 10⁶
−12.297.35 × 103
1.55 × 10⁵
−18.62.04 × 106
1.57 × 10⁷
−6.4711.31 × 108
9.94 × 10⁸
−6.261.52 × 103
2.28 × 10⁴
−13.99
99.98 × 10⁴
1.81 × 10⁶
−14.814.04 × 105
2.93 × 10⁷
−61.72.12 × 105
3.72 × 10⁶
−15.547.05 × 103
1.69 × 10⁵
−21.961.97 × 106
1.65 × 10⁷
−7.0621.27 × 108
1.49 × 10⁹
−10.361.49 × 103
2.83 × 10⁴
−17.68
109.58 × 10⁴
3.61 × 10⁶
−35.193.22 × 105
3.52 × 10⁷
−86.041.91 × 105
8.97 × 10⁶
−41.387.00 × 103
1.76 × 10⁵
−23.921.96 × 106
1.85 × 10⁷
−8.4091.17 × 108
2.09 × 10⁹
−15.431.49 × 103
6.11 × 10⁴
−40.06
118.65 × 10⁴
1.49 × 10⁷
−154.72.69 × 105
3.67 × 10⁷
−112.91.83 × 105
1.02 × 10⁷
−52.676.87 × 103
2.36 × 10⁵
−32.751.86 × 106
4.86 × 10⁷
−23.759.98 × 107
3.73 × 10⁹
−30.951.48 × 103
8.39 × 10⁴
−55.5
127.78 × 10⁴
1.54 × 10⁷
−177.31.58 × 105
2.44 × 10⁷
−89.631.79 × 105
1.32 × 10⁷
−71.266.77 × 103
3.24 × 10⁵
−46.11.83 × 106
5.16 × 10⁷
−26.837.11 × 107
5.64 × 10⁹
−55.481.48 × 103
1.04 × 10⁵
−68.82
138.40 × 10³
7.91 × 10⁶
−100.81.32 × 105
2.75 × 10⁷
−173.67.98 × 104
2.19 × 10⁷
−121.36.40 × 103
3.96 × 10⁵
−57.471.60 × 106
1.69 × 10⁸
−91.277.11 × 107
1.16 × 10¹⁰
−162.41.38 × 103
1.26 × 10⁵
−84.09
Table 7. Accuracy analysis of the principal component U1 and X.
XPrincipal Component U1
Y1Y2Y3Y4Y5Y6Y7
X10.9120.8270.6150.7110.7820.8400.905
X20.9470.8800.7350.7620.8600.9100.940
X30.0000.0160.0950.0090.0260.0040.000
X40.7260.7120.6890.7290.7380.7630.725
X50.9210.8830.8110.8620.8830.9290.913
X60.2050.2700.2820.2340.3130.2230.207
X70.4590.5710.6980.4980.5720.5170.481
X80.2000.2780.4760.3760.3020.2830.207
X90.4920.4070.2010.3150.3460.3930.486
X100.6940.6750.6400.4470.6570.6720.694
X110.8150.7280.4930.6090.6710.7250.810
X120.8440.8020.6650.7320.7860.8140.834
X130.6870.6440.4750.7560.6050.6610.687
Comprehensive result0.6080.5920.5290.5420.5800.5950.607
Table 8. Regression coefficients 1 and p-value 2 of PLSR.
Y1
Number of Enterprises
Y2
Number of Insured Persons
Y3
Registered Capital of Enterprises
Y4
Number of Intellectual Properties
Y5
Number of Software Copyrights
Y6
Average Salary of Employees
Y7
Comprehensive Score
Con.−1392.765−755.667−358.99752.9755.085−1505.271.811
X1Total Number of Commercial Facilities0.04 **0.029 **0.01 **0.0010.017 **0.1520.001 **
X2Number of Catering Restaurants0.081 **0.056 **0.03 *0.0010.039 *0.338 *0.002 **
X3Consumption of Catering per Person1.0397.317 *5.720.13.89711.9130.091
X4Comprehensive Score of Catering Restaurants148.746 **126.755 **74.326 *5.153102.349 **873.306 **4.854 **
X5Number of Hotels1.661 **1.236 **0.837 *0.050.927 *7.871 *0.046 **
X6Average Star-Rating of Hotel22.27633.204 *20.7281.17134.261 *127.5770.557
X7Average Number of Guest Rooms8.579 **12.057 **7.955 *0.2937.043 **45.835 *0.331 **
X8Comprehensive Score of Hotels53.799 **61.865 **69.596 *5.39444.529426.133 **1.387 *
X9Number of Retail Stores0.0920.063−0.0240.0010.0080.150.003 *
X10Floor Space of Commercial Complex4.615 **2.6351.754 *−0.1621.61615.5830.126 **
X11Number of Resident Service Stores0.214 **0.167 **0.0310.0040.078 *0.7450.007 **
X12Number of Culture, Sports, and Entertainment Stores0.628 **0.557 **0.267 *0.020.352 **2.853 *0.017 **
X13Number of Finance and Insurance Business Halls1.112 **1.102 **0.324 **0.1010.5485.3730.037 **
R-Squared0.8820.5320.5340.2160.3890.4450.627
1 Regression coefficient represents the influence of independent variable X on dependent variable Y. The larger the regression coefficient, the greater the influence of X on Y. A positive regression coefficient indicates that Y increases as X increases, while a negative regression coefficient indicates that Y decreases as X increases. 2 p-value is the probability of obtaining a result at least as extreme as the one that was actually observed or a more extreme result, given that the null hypothesis is true. The smaller the p-value is, the more significant the result will be (** significant at p = 0.01; * significant at p = 0.05).
Publisher’s Note: MDPI stays neutral with regard to jurisdictional claims in published maps and institutional affiliations.

