
Investigating the Impacts of Urbanization on Vegetation Net Primary Productivity: A Case Study of Chengdu–Chongqing Urban Agglomeration from the Perspective of Townships

Abstract
:1. Introduction
2. Study Area, Methods, and Data Sources
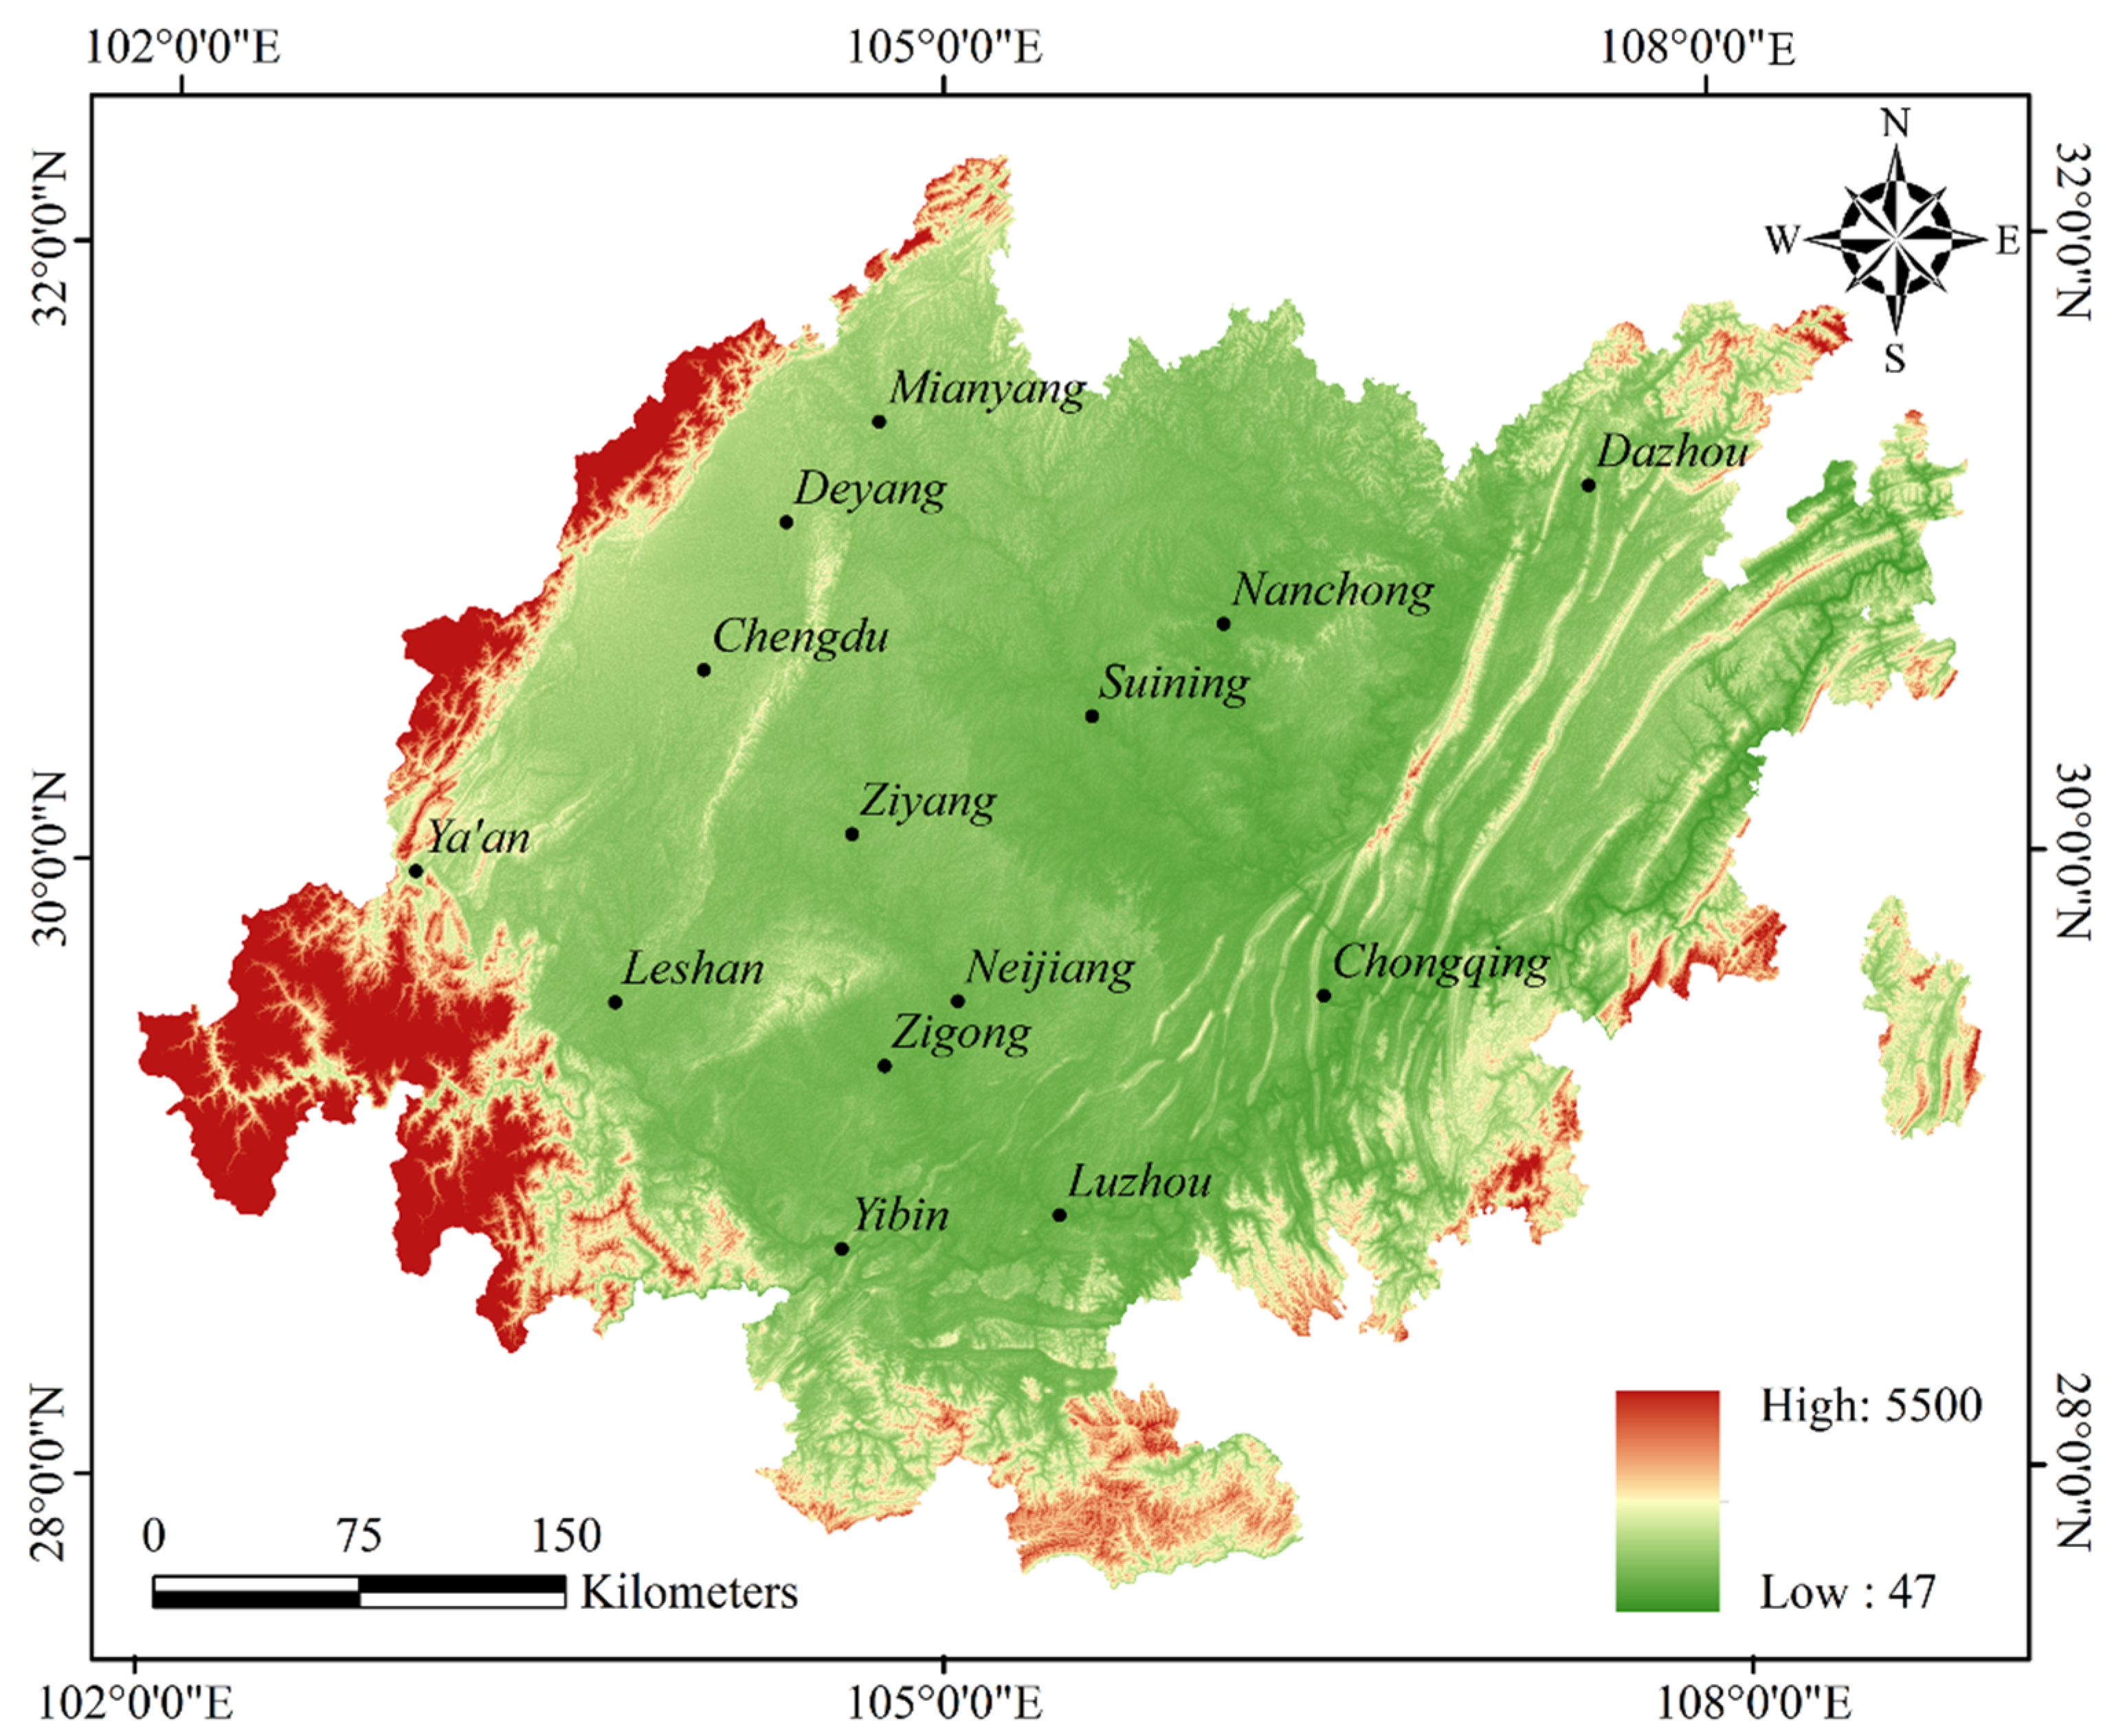
2.1. Study Area
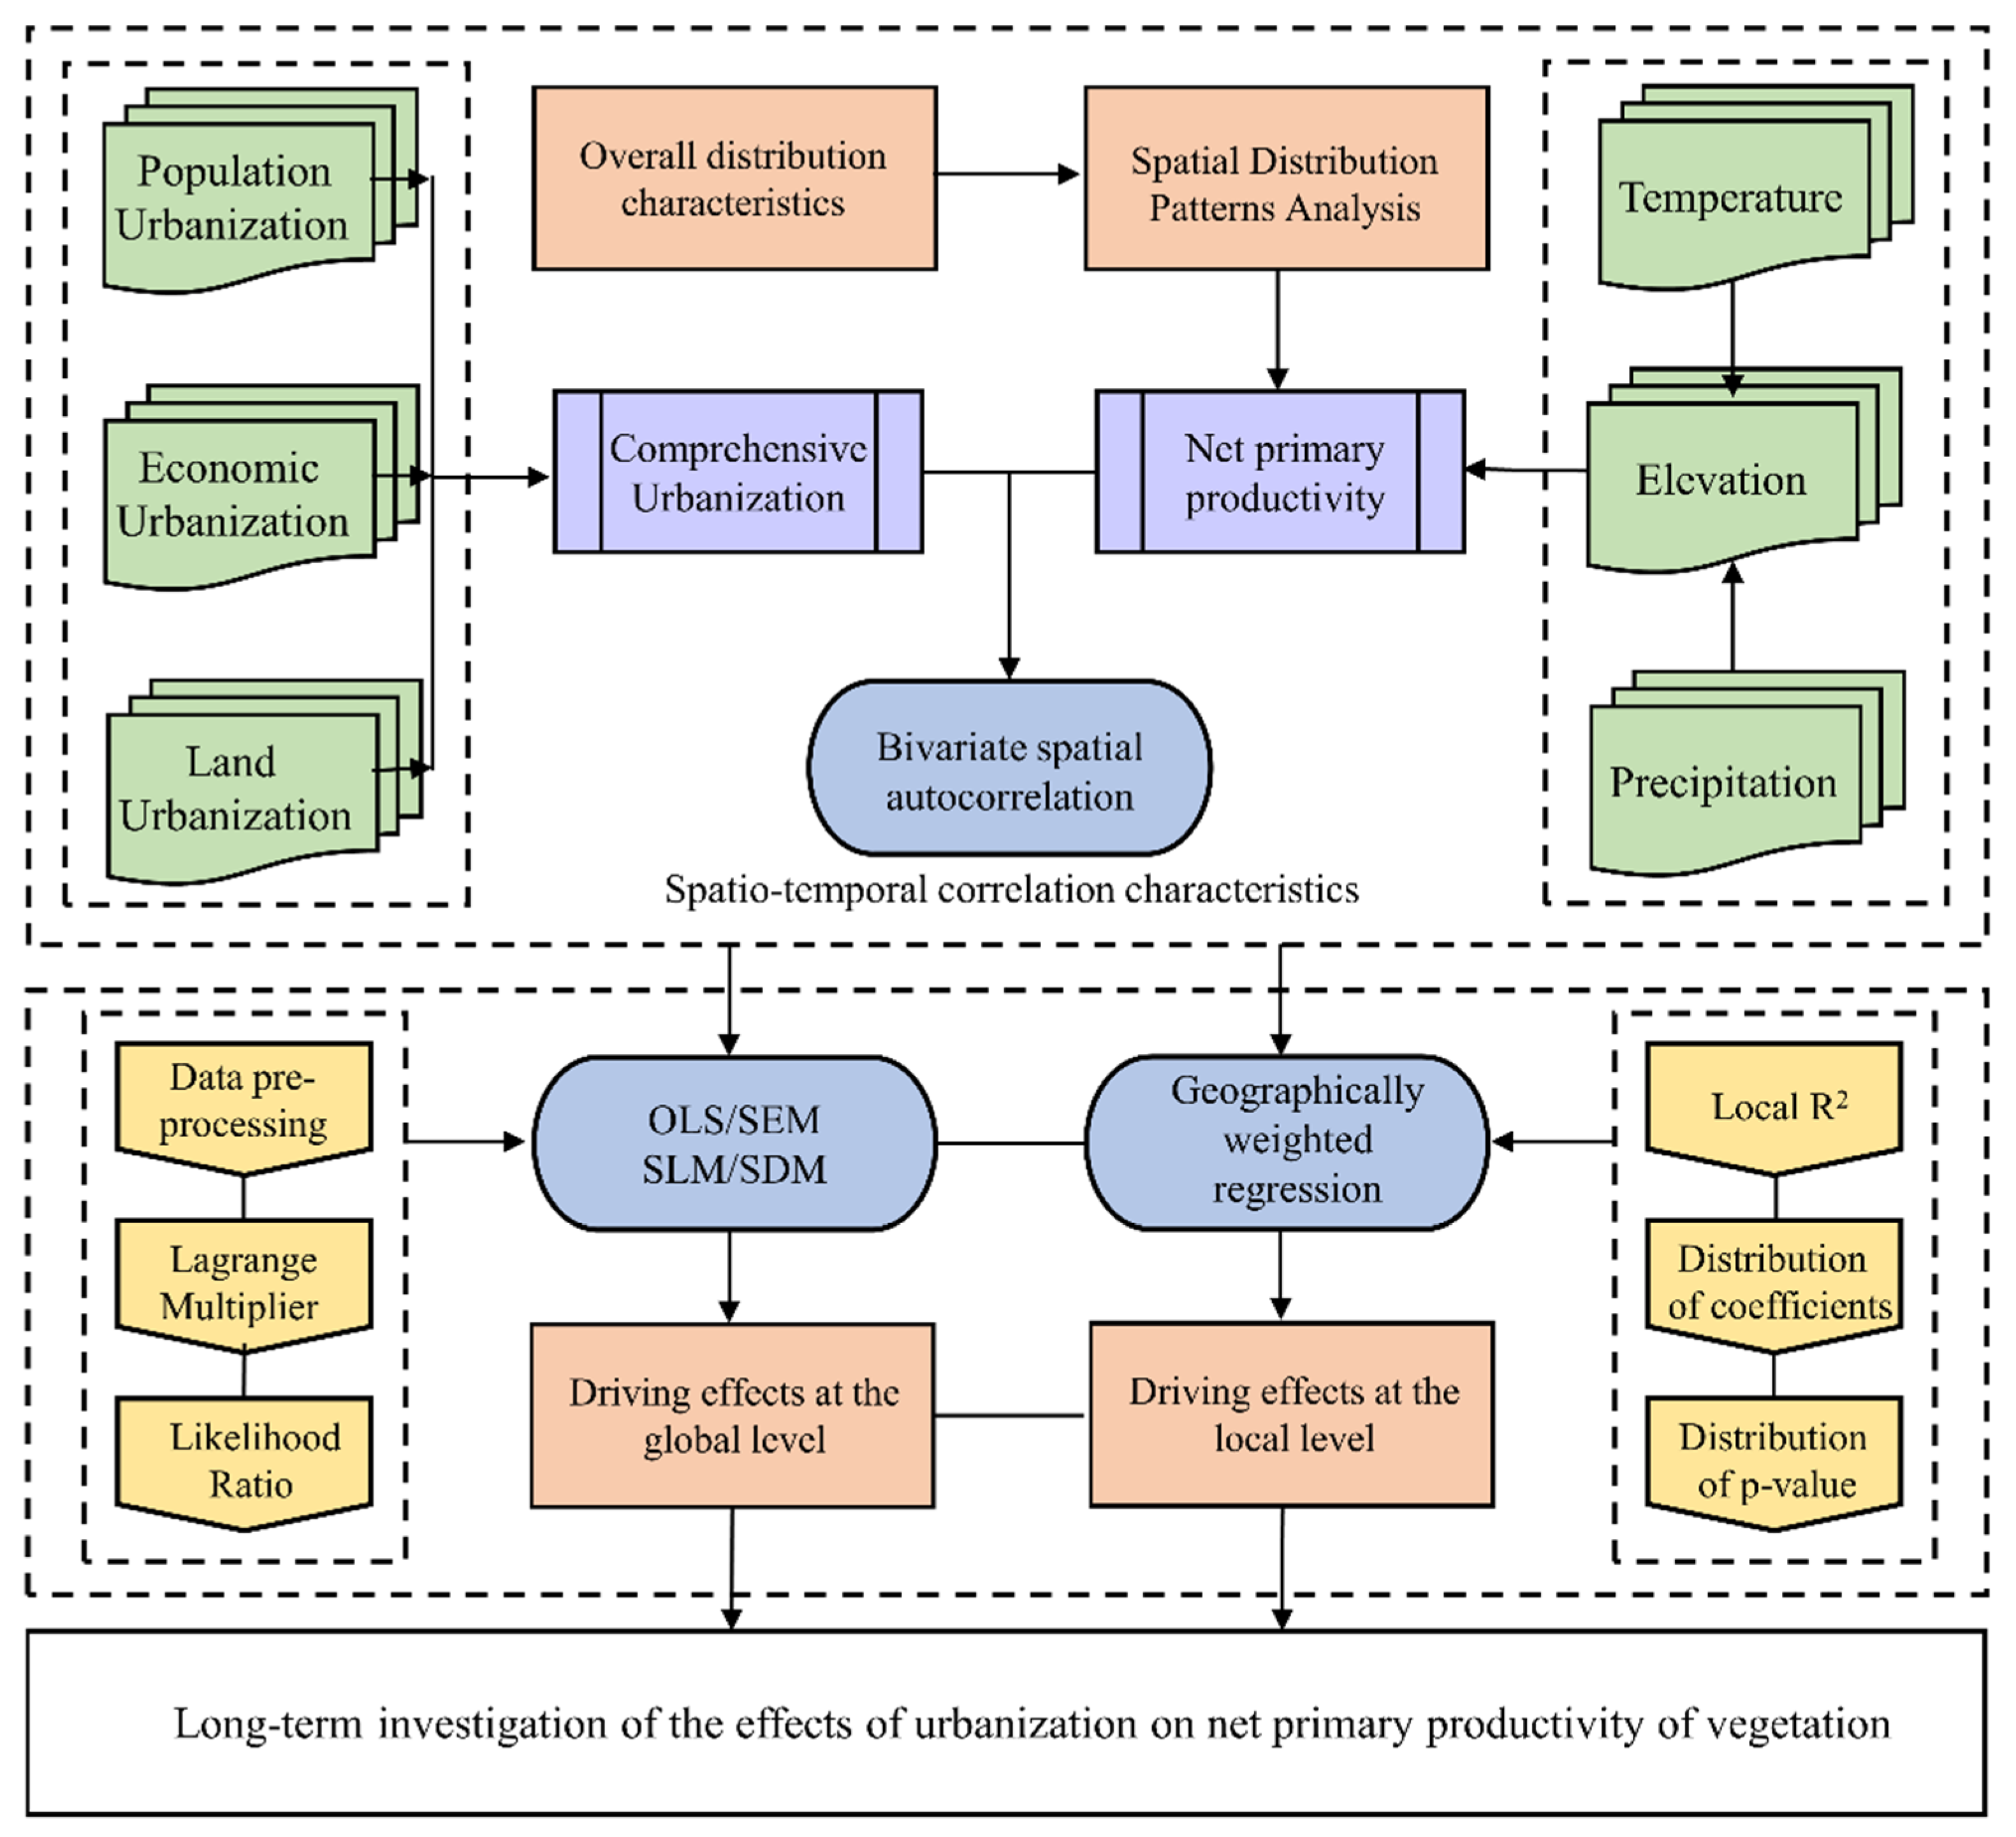
2.2. Methods
2.2.1. Comprehensive Urbanization Level (UL) Accounting
2.2.2. Bivariate Spatial Autocorrelation
2.2.3. Spatial Regression Analysis
2.3. Data Sources
3. Results
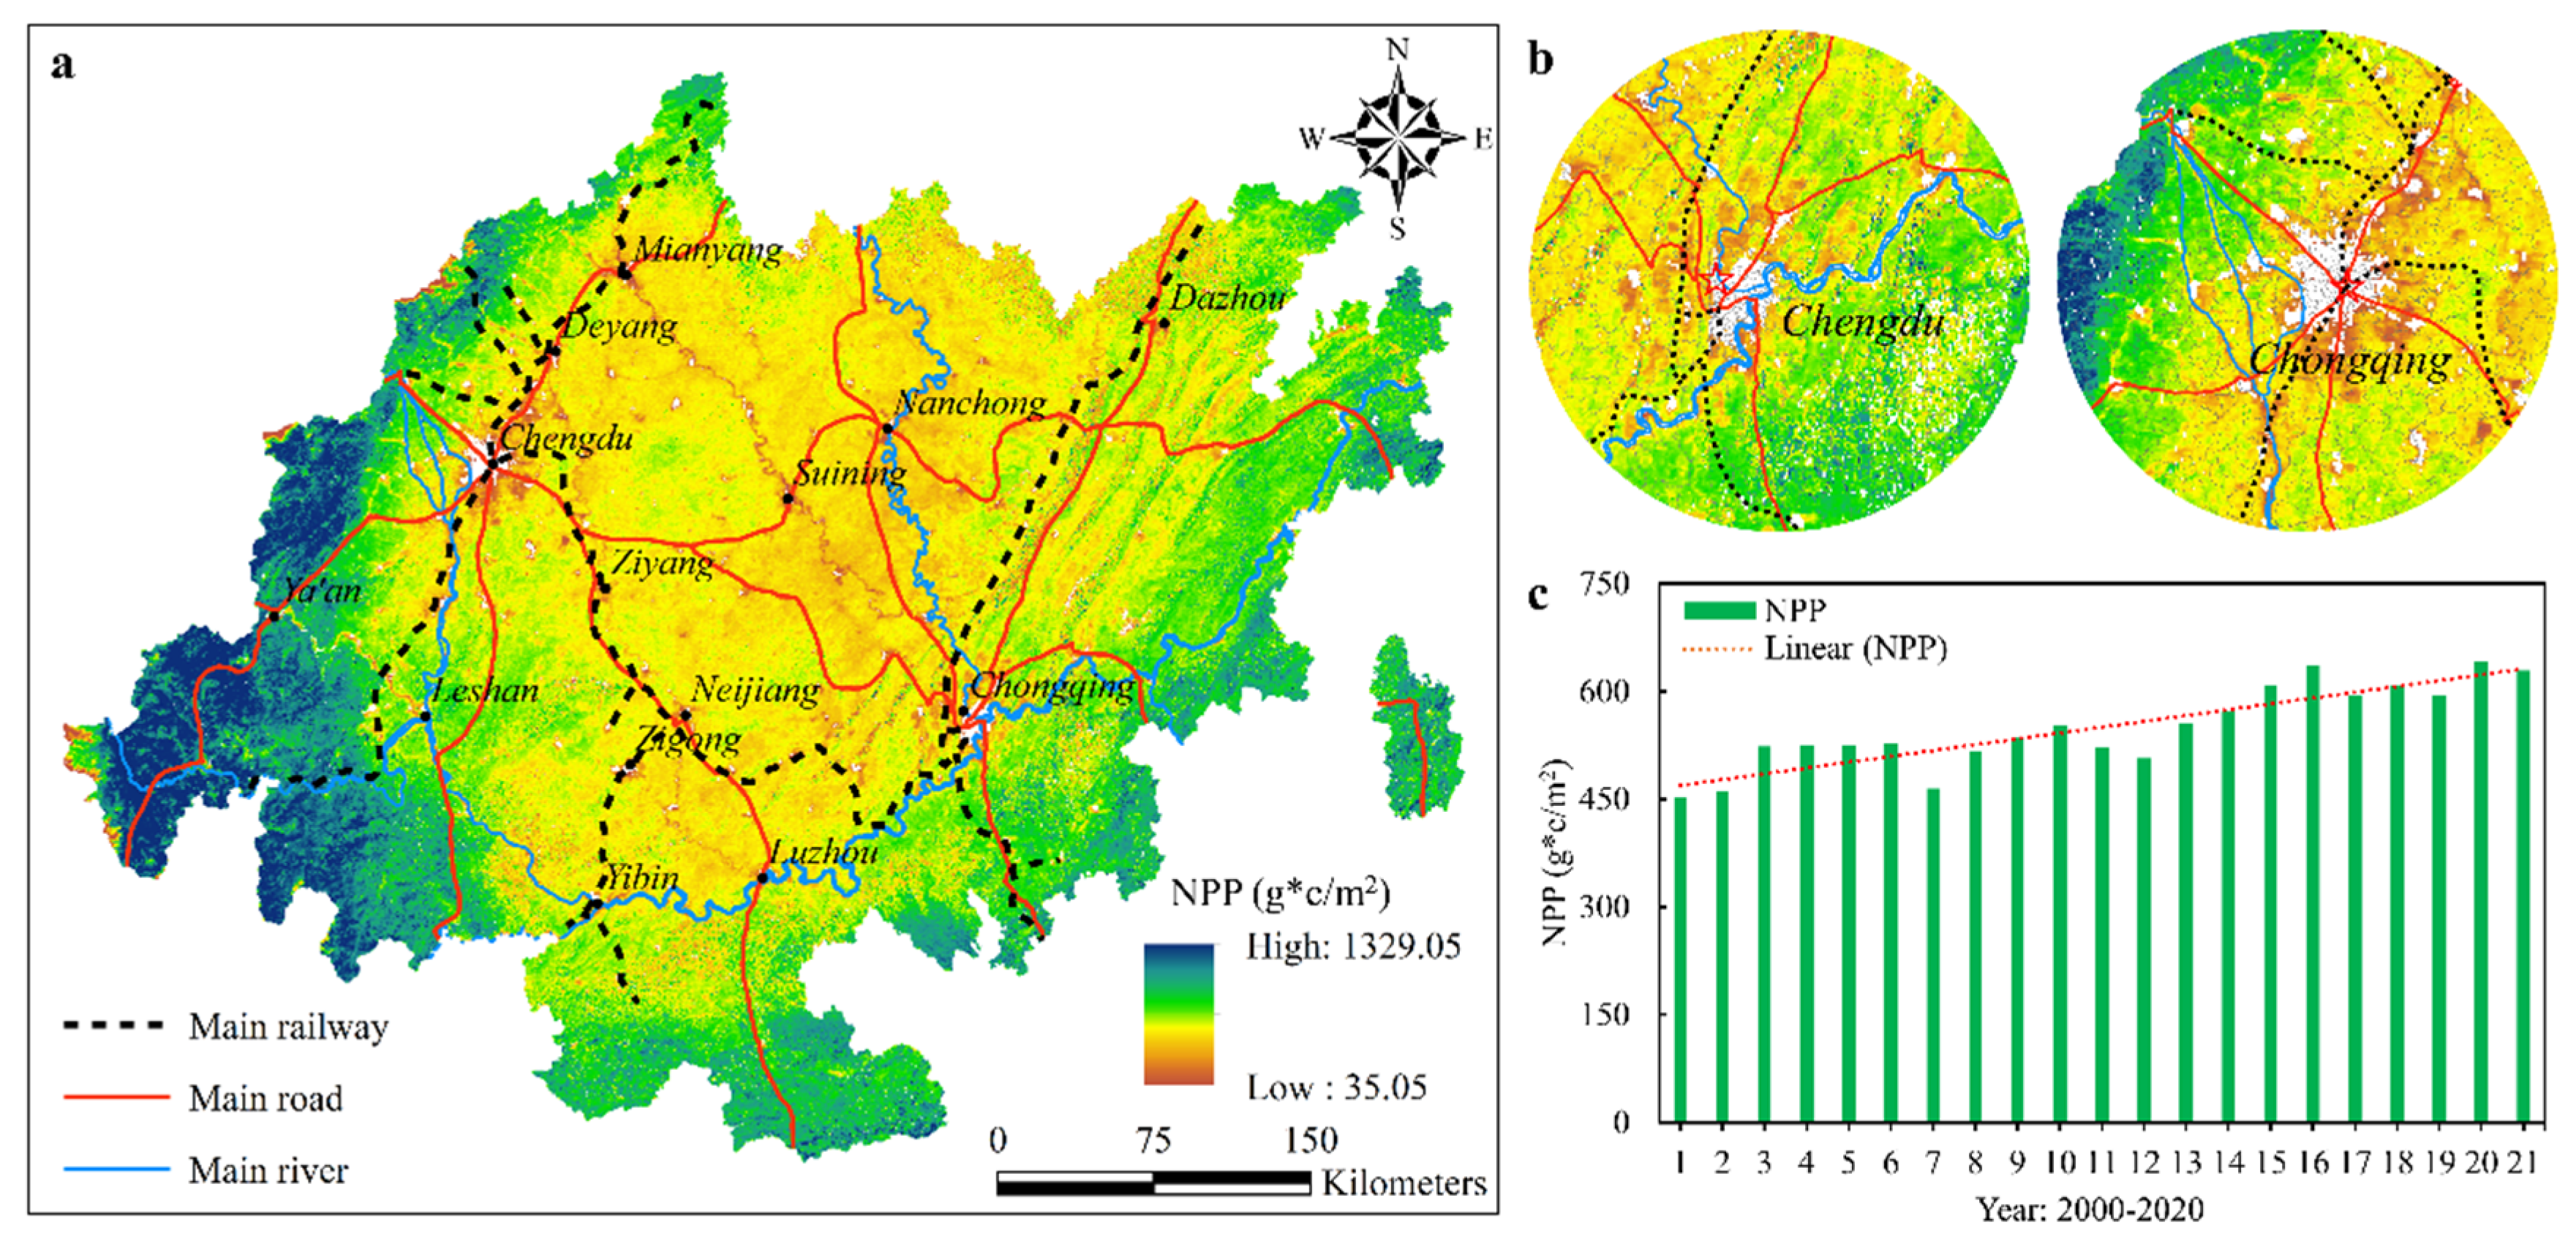
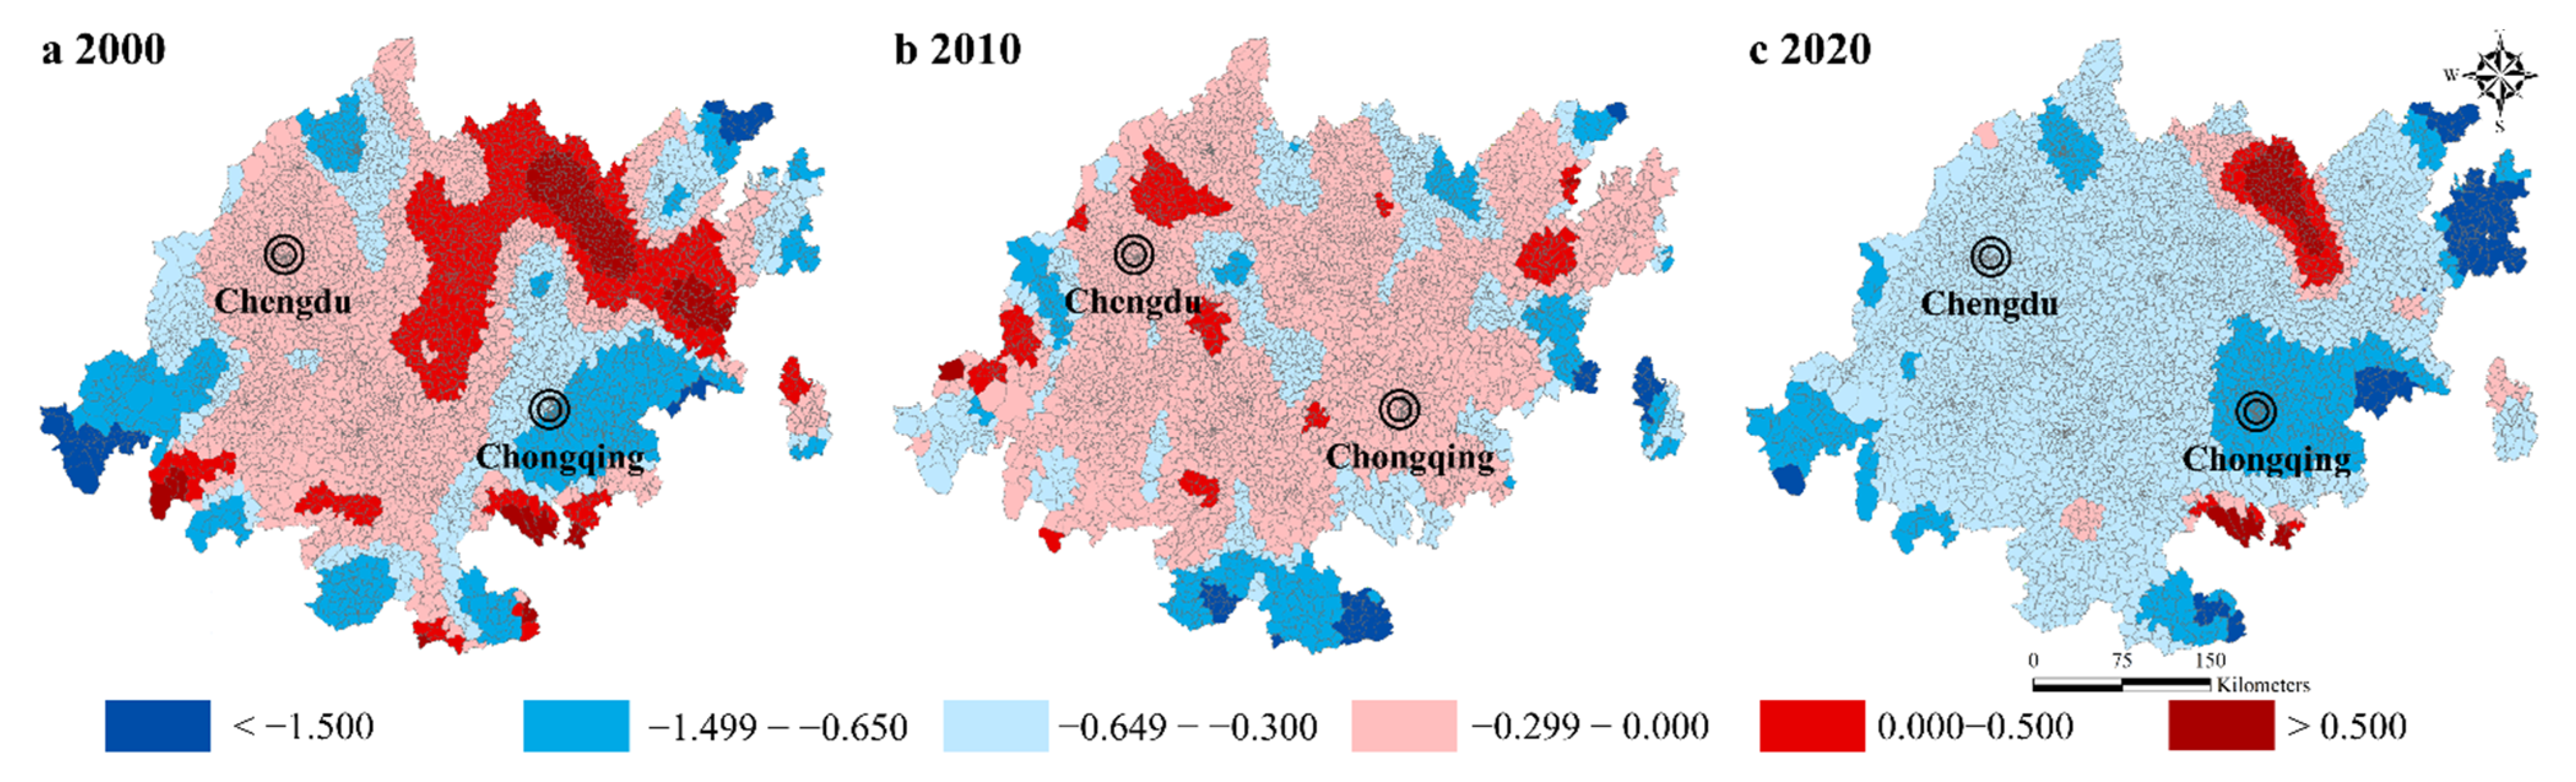
3.1. Spatio-Temporal Evolutionary Pattern of NPP
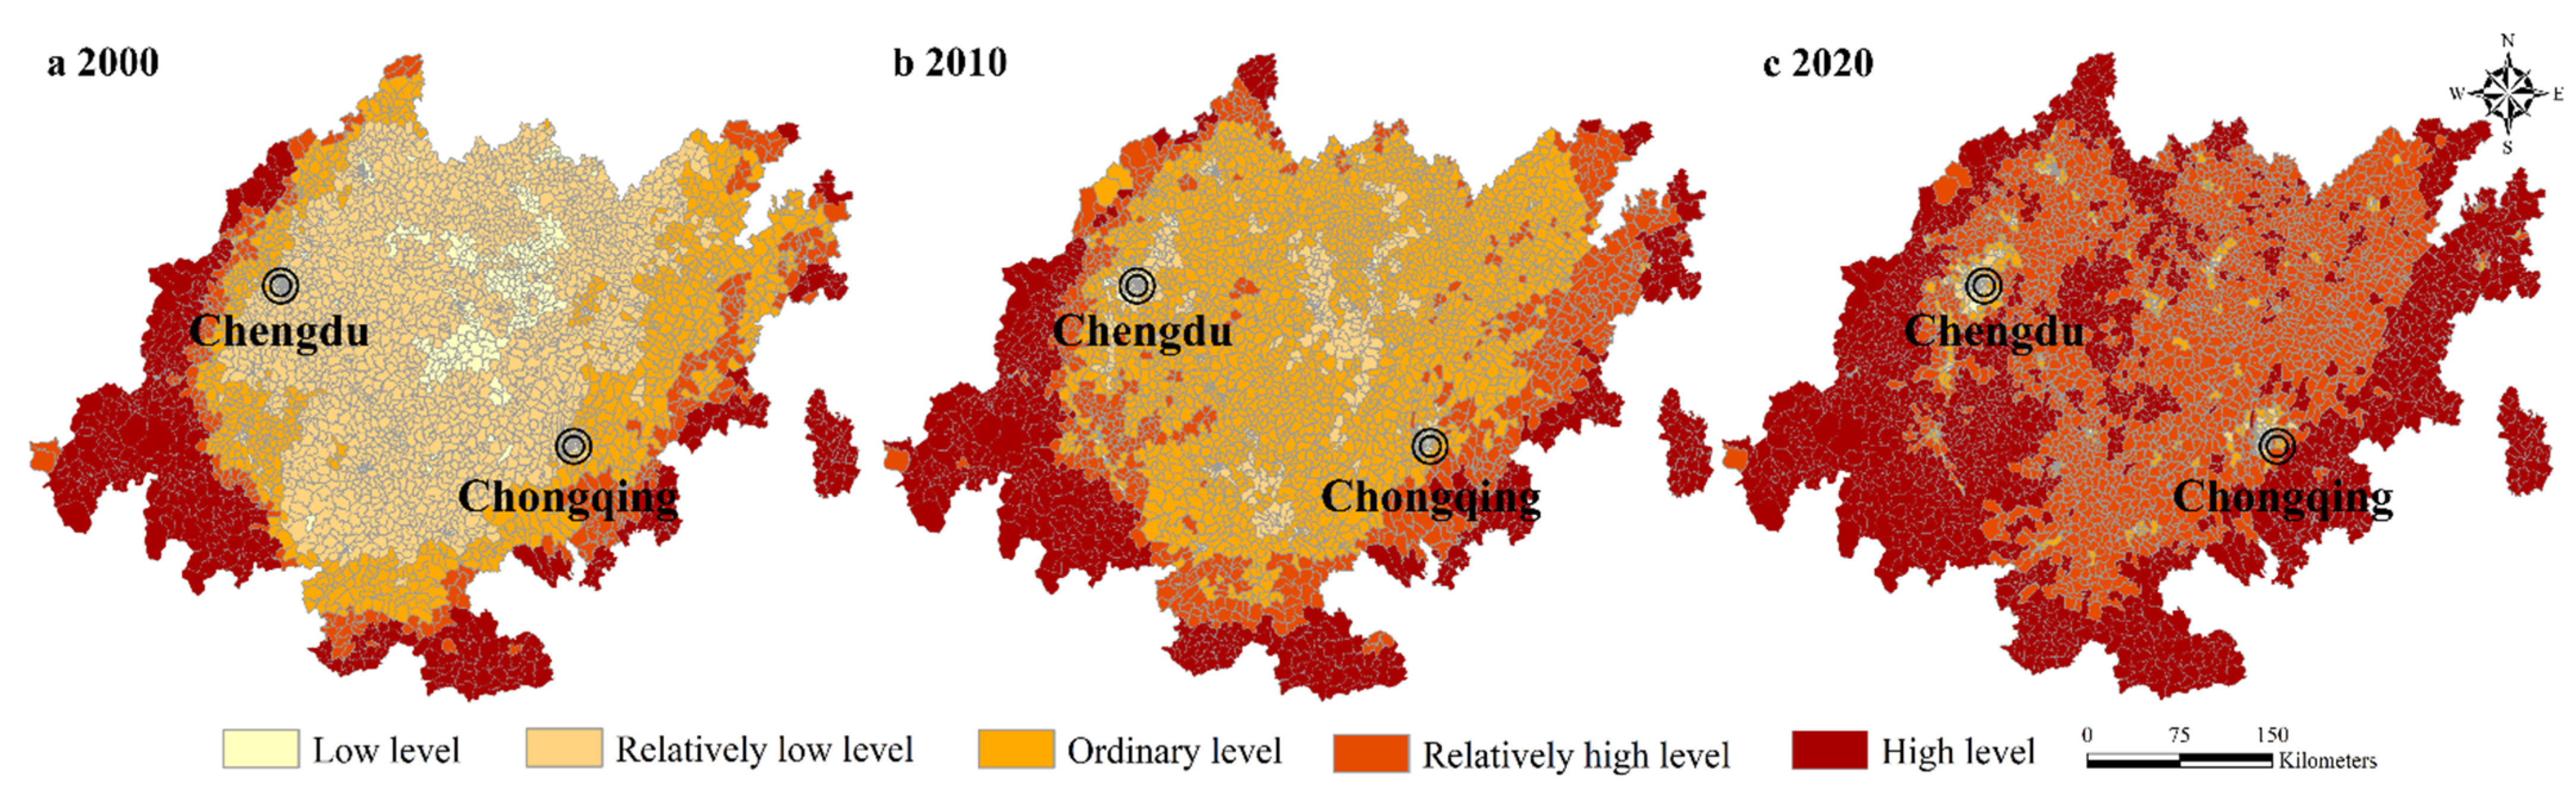
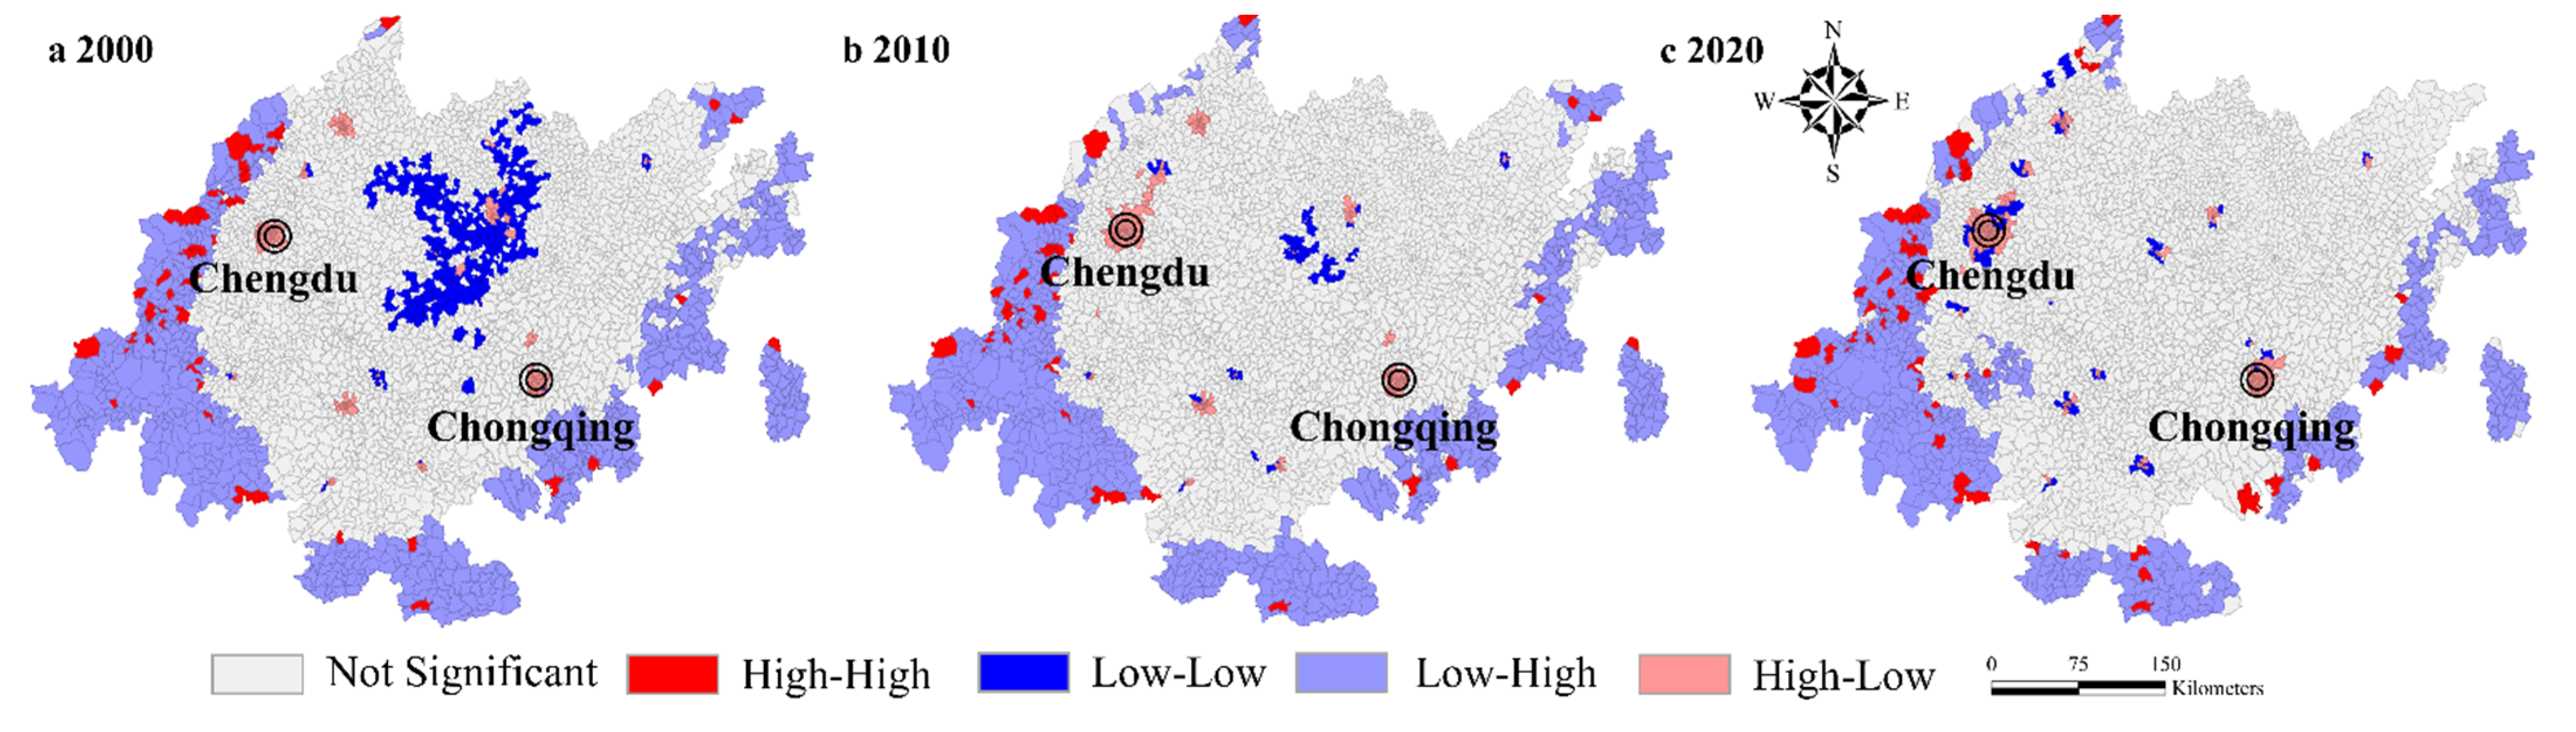
3.2. Spatio-Temporal Correlation Effects of UL and NPP
3.3. Global and Local Estimation of the Impact of UL on NPP
3.3.1. Spatial Regression Results on the Global Scale
3.3.2. Spatial Regression Results on the Local Scale
4. Discussion
4.1. Differences in Global Estimates and Local Effects of Urbanization Impact on NPP
4.2. Policy Implications, Study Limitations, and Future Research
5. Conclusions
Author Contributions
Funding
Data Availability Statement
Conflicts of Interest
References
- Liu, X.; Pei, F.; Wen, Y.; Li, X.; Wang, S.; Wu, C.; Cai, Y.; Wu, J.; Chen, J.; Feng, K.; et al. Global urban expansion offsets climate-driven increases in terrestrial net primary productivity. Nat. Commun. 2019, 10, 5558. [Google Scholar] [CrossRef] [Green Version]
- Liu, X.; Huang, Y.; Xu, X.; Li, X.; Li, X.; Ciais, P.; Lin, P.; Gong, K.; Ziegler, A.D.; Chen, A.; et al. High-spatiotemporal-resolution mapping of global urban change from 1985 to 2015. Nat. Sustain. 2020, 3, 564–570. [Google Scholar] [CrossRef]
- Hong, C.Q.; Jin, X.B.; Ren, J.; Gu, Z.M.; Zhou, Y.K. Satellite data indicates multidimensional variation of agricultural production in land consolidation area. Sci. Total Environ. 2019, 653, 735–747. [Google Scholar] [CrossRef]
- Zhang, X.; Brandt, M.; Tong, X.; Ciais, P.; Yue, Y.; Xiao, X.; Zhang, W.; Wang, K.; Fensholt, R. A large but transient carbon sink from urbanization and rural depopulation in China. Nat. Sustain. 2022, 5, 321–328. [Google Scholar] [CrossRef]
- Pei, F.; Li, X.; Liu, X.; Lao, C.; Xia, G. Exploring the response of net primary productivity variations to urban expansion and climate change: A scenario analysis for Guangdong Province in China. J. Environ. Manag. 2015, 150, 92–102. [Google Scholar] [CrossRef]
- Tian, G.; Qiao, Z. Assessing the impact of the urbanization process on net primary productivity in China in 1989–2000. Environ. Pollut. 2014, 184, 320–326. [Google Scholar] [CrossRef]
- Bren, D.A.C.; Reitsma, F.; Baiocchi, G.; Barthel, S.; Güneralp, B.; Erb, K.; Haberl, H.; Creutzig, F.; Seto, K.C. Future urban land expansion and implications for global croplands. Proc. Natl. Acad. Sci. USA 2017, 114, 8939–8944. [Google Scholar] [CrossRef] [PubMed] [Green Version]
- Jiao, C.; Yi, X.; Xing, L.; He, F.; Li, Q.; Luo, J. Identifying critical climate periods for temporal dynamics of aboveground net primary productivity in the Eurasian steppe region. Ecol. Indic. 2022, 142, 109163. [Google Scholar] [CrossRef]
- Li, S.; He, S. The variation of net primary productivity and underlying mechanisms vary under different drought stress in Central Asia from 1990 to 2020. Agric. For. Meteorol. 2022, 314, 108767. [Google Scholar] [CrossRef]
- Zhou, Y.; Yue, D.; Guo, J.; Chao, Z.; Meng, X. Assessing the impact of land conversion and management measures on the net primary productivity in the Bailong River Basin, in China. CATENA 2021, 207, 105672. [Google Scholar] [CrossRef]
- Guo, L.; Liu, R.; Shoaib, M.; Men, C.; Wang, Q.; Miao, Y.; Jiao, L.; Wang, Y.; Zhang, Y. Impacts of landscape change on net primary productivity by integrating remote sensing data and ecosystem model in a rapidly urbanizing region in China. J. Clean. Prod. 2021, 325, 129314. [Google Scholar] [CrossRef]
- Xue, P.; Liu, H.; Zhang, M.; Gong, H.; Cao, L. Nonlinear Characteristics of NPP Based on Ensemble Empirical Mode Decomposition from 1982 to 2015—A Case Study of Six Coastal Provinces in Southeast China. Remote Sens. 2021, 14, 15. [Google Scholar] [CrossRef]
- Shi, C.; Zhu, X.; Wu, H.; Li, Z. Assessment of Urban Ecological Resilience and Its Influencing Factors: A Case Study of the Beijing-Tianjin-Hebei Urban Agglomeration of China. Land 2022, 11, 921. [Google Scholar] [CrossRef]
- Chang, S.; Wang, J.; Zhang, F.; Niu, L.; Wang, Y. A study of the impacts of urban expansion on vegetation primary productivity levels in the Jing-Jin-Ji region, based on nighttime light data. J. Clean. Prod. 2020, 263, 121490. [Google Scholar] [CrossRef]
- Wang, S.; Xie, Z.; Wu, R.; Feng, K. How does urbanization affect the carbon intensity of human well-being? A global assessment. Appl. Energy 2022, 312, 118798. [Google Scholar] [CrossRef]
- Fan, J.S.; Zhou, L. Impact of urbanization and real estate investment on carbon emissions: Evidence from China’s provincial regions. J. Clean. Prod. 2019, 209, 309–323. [Google Scholar] [CrossRef]
- Wu, Y.; Shen, J.; Zhang, X.; Skitmore, M.; Lu, W. Reprint of: The impact of urbanization on carbon emissions in developing countries: A Chinese study based on the U-Kaya method. J. Clean. Prod. 2017, 163, S284–S298. [Google Scholar] [CrossRef]
- Wang, S.; Wang, Z.; Fang, C. Evolutionary characteristics and driving factors of carbon emission performance at the city level in China. Sci. China Earth Sci. 2022, 65, 1292–1307. [Google Scholar] [CrossRef]
- Sun, W.; Huang, C. How does urbanization affect carbon emission efficiency? Evidence from China. J. Clean. Prod. 2020, 272, 122828. [Google Scholar] [CrossRef]
- He, J.; Hu, S. Ecological efficiency and its determining factors in an urban agglomeration in China: The Chengdu-Chongqing urban agglomeration. Urban Clim. 2022, 41, 101071. [Google Scholar] [CrossRef]
- Zeng, H.; Shao, B.; Bian, G.; Dai, H.; Zhou, F. Analysis of Influencing Factors and Trend Forecast of CO2 Emission in Chengdu-Chongqing Urban Agglomeration. Sustainability 2022, 14, 1167. [Google Scholar] [CrossRef]
- Wang, S.; Sun, P.; Sun, F.; Jiang, S.; Zhang, Z.; Wei, G. The Direct and Spillover Effect of Multi-Dimensional Urbanization on PM2.5 Concentrations: A Case Study from the Chengdu-Chongqing Urban Agglomeration in China. Int. J. Environ. Res. Public Health 2021, 18, 10609. [Google Scholar] [CrossRef] [PubMed]
- Chen, W.; Gu, T.; Zeng, J. Urbanisation and ecosystem health in the Middle Reaches of the Yangtze River urban agglomerations, China: A U-curve relationship. J. Environ. Manag. 2022, 318, 115565. [Google Scholar] [CrossRef] [PubMed]
- Peng, J.; Wang, X.; Liu, Y.; Zhao, Y.; Xu, Z.; Zhao, M.; Qiu, S.; Wu, J. Urbanization impact on the supply-demand budget of ecosystem services: Decoupling analysis. Ecosyst. Serv. 2020, 44, 101139. [Google Scholar] [CrossRef]
- Wei, G.; Zhang, Z.; Ouyang, X.; Shen, Y.; Jiang, S.; Liu, B.; He, B.-J. Delineating the spatial-temporal variation of air pollution with urbanization in the Belt and Road Initiative area. Environ. Impact Assess. Rev. 2021, 91, 106646. [Google Scholar] [CrossRef]
- Qiao, W.; Huang, X. The impact of land urbanization on ecosystem health in the Yangtze River Delta urban agglomerations, China. Cities 2022, 130, 103981. [Google Scholar] [CrossRef]
- Wang, H.; Cui, H.; Zhao, Q. Effect of green technology innovation on green total factor productivity in China: Evidence from spatial durbin model analysis. J. Clean. Prod. 2020, 288, 125624. [Google Scholar] [CrossRef]
- Du, Y.; Wan, Q.; Liu, H.; Liu, H.; Kapsar, K.; Peng, J. How does urbanization influence PM2.5 concentrations? Perspective of spillover effect of multi-dimensional urbanization impact. J. Clean. Prod. 2019, 220, 974–983. [Google Scholar] [CrossRef]
- Wei, G.; Sun, P.; Jiang, S.; Shen, Y.; Liu, B.; Zhang, Z.; Ouyang, X. The Driving Influence of Multi-Dimensional Urbanization on PM2.5 Concentrations in Africa: New Evidence from Multi-Source Remote Sensing Data, 2000–2018. Int. J. Environ. Res. Public Health 2021, 18, 9389. [Google Scholar] [CrossRef]
- Oshan, T.M.; Smith, J.; Fotheringham, A.S. Targeting the spatial context of obesity determinants via multiscale geographically weighted regression. Int. J. Health Geogr. 2020, 19, 11. [Google Scholar] [CrossRef]
- Yue, D.; Zhou, Y.; Guo, J.; Chao, Z.; Guo, X. Relationship between net primary productivity and soil water content in the Shule River Basin. CATENA 2022, 208, 105770. [Google Scholar] [CrossRef]
- Wang, H.; Liu, G.; Li, Z.; Ye, X.; Wang, M.; Gong, L. Impacts of climate change on net primary productivity in arid and semiarid regions of China. Chin. Geogr. Sci. 2016, 26, 35–47. [Google Scholar] [CrossRef]
- Sun, B.; Zhao, H.; Wang, X. Effects of drought on net primary productivity: Roles of temperature, drought intensity, and duration. Chin. Geogr. Sci. 2016, 26, 270–282. [Google Scholar] [CrossRef] [Green Version]
- Yang, J.; Huang, X. The 30 m annual land cover dataset and its dynamics in China from 1990 to 2019. Earth Syst. Sci. Data 2021, 13, 3907–3925. [Google Scholar] [CrossRef]
- LeSage, J.; Pace, R.K. Introduction to Spatial Econometrics; Taylor and Francis: Abingdon, UK; CRC Press: Boca Raton, FL, USA, 2010. [Google Scholar]
- Dong, H.M.; Xue, M.G.; Xiao, Y.J. Do carbon emissions impact the health of residents? Considering China’s industrialization and urbanization. Sci. Total Environ. 2021, 758, 143688. [Google Scholar] [CrossRef]
- Qiao, X.; Yang, G.U.; Zou, C. The impact of urban expansion on net primary productivity in the Taihu Lake basin based on nighttime light images. Acta Ecol. Sin. 2018, 38, 5883–5893. [Google Scholar]
- Chen, J.; Wang, L.J.; Li, Y.Y. Research on the impact of multi-dimensional urbanization on China’s carbon emissions under the background of COP21. J. Environ. Manag. 2020, 273, 111123. [Google Scholar] [CrossRef]
- Li, J.; Huang, X.; Chuai, X.; Yang, H. The impact of land urbanization on carbon dioxide emissions in the Yangtze River Delta, China: A multiscale perspective. Cities 2021, 116, 103275. [Google Scholar] [CrossRef]
- Liu, Y.; Han, Y. Impacts of Urbanization and Technology on Carbon Dioxide Emissions of Yangtze River Economic Belt at Two Stages: Based on an Extended STIRPAT Model. Sustainability 2021, 13, 7022. [Google Scholar] [CrossRef]
- Sharma, S.; Joshi, P.; Fürst, C. Unravelling net primary productivity dynamics under urbanization and climate change in the western Himalaya. Ecol. Indic. 2022, 144, 109508. [Google Scholar] [CrossRef]
- Tian, Y.; Huang, W.; Wu, X.; Jim, C.; Wang, X.; Liu, Y. Dominant control of climate variations over land-use change on net primary productivity under different urbanization intensities in Beijing, China. Acta Ecol. Sin. 2019, 39, 416–424. [Google Scholar] [CrossRef]
- Zhong, J.; Liu, J.; Jiao, L.; Lian, X.; Xu, Z.; Zhou, Z. Assessing the comprehensive impacts of different urbanization process on vegetation net primary productivity in Wuhan, China, from 1990 to 2020. Sustain. Cities Soc. 2021, 75, 103295. [Google Scholar] [CrossRef]
- Song, L.; Li, M.; Xu, H.; Guo, Y.; Wang, Z.; Li, Y.; Wu, X.; Feng, L.; Chen, J.; Lu, X.; et al. Spatiotemporal variation and driving factors of vegetation net primary productivity in a typical karst area in China from 2000 to 2010. Ecol. Indic. 2021, 132, 108280. [Google Scholar] [CrossRef]
- Ge, W.; Deng, L.; Wang, F.; Han, J. Quantifying the contributions of human activities and climate change to vegetation net primary productivity dynamics in China from 2001 to 2016. Sci. Total. Environ. 2021, 773, 145648. [Google Scholar] [CrossRef] [PubMed]
- He, B.-J.; Zhao, D.; Dong, X.; Xiong, K.; Feng, C.; Qi, Q.; Darko, A.; Sharifi, A.; Pathak, M. Perception, physiological and psychological impacts, adaptive awareness and knowledge, and climate justice under urban heat: A study in extremely hot-humid Chongqing, China. Sustain. Cities Soc. 2022, 79, 103685. [Google Scholar] [CrossRef]
- Nicolas, R.; Thomas, K.; Karl, H.E.; Helmut, H. Does agricultural trade reduce pressure on land ecosystems? Decomposing drivers of the embodied human appropriation of net primary production. Ecol. Econ. 2021, 181, 106915. [Google Scholar]


| Data Type | Variable | Unit | Data Name | Data Source | Spatial Resolution |
|---|---|---|---|---|---|
| Socioeconomic | Population urbanization (PU) | % | LandScan spatial grid datasets for 2000, 2010, and 2020 | Data Center for Resources and Environmental Sciences of the Chinese Academy of Sciences (http://www.resdc.cn) (accessed on 7 February 2022) | 1 km |
| Land urbanization (LU) | % | Land use data for 2000, 2010, and 2020 | Data Center for Resources and Environmental Sciences of the Chinese Academy of Sciences (http://www.resdc.cn) (accessed on 7 February 2022) | 30 m | |
| Economic urbanization (EU) | CNY/km2 | GDP density grid datasets for 2000, 2010, and 2020 | Data Center for Resources and Environmental Sciences of the Chinese Academy of Sciences (http://www.resdc.cn) (accessed on 7 February 2022) | 1 km | |
| Natural | Elevation (ELE) | m | DEM digital elevation data | Geospatial Digital Cloud Platform of Chinese Academy of Sciences (http://www.gscloud.cn/sources/index) (accessed on 20 March 2022) | 90 m |
| Average annual precipitation (PRE) | mm | China’s monthly precipitation data for 2000, 2010, and 2020 | National Earth System Science data (http://www.geodata.cn/) (accessed on 20 March 2022) | 1 km | |
| Average annual temperature (TEM) | °C | China’s monthly temperature data for 2000, 2010, and 2020 | National Earth System Science data (http://www.geodata.cn/) (accessed on 20 March 2022) | 1 km | |
| Net primary productivity (NPP) | g*c/m2 | NPP data from MODIS-MOD17A3 | MODIS-17A3HF data products are available on the NASA website (https://modis.gsfc.nasa.gov/) (accessed on 20 March 2022) | 500 m |
| Cluster Type | 2000 | 2010 | 2020 |
|---|---|---|---|
| High–High | 1.56% | 1.17% | 1.70% |
| Low–Low | 6.27% | 1.34% | 2.12% |
| Low–High | 15.60% | 15.24% | 13.88% |
| High–Low | 6.21% | 6.74% | 6.46% |
| Variable | 2000 | 2010 | 2020 |
|---|---|---|---|
| UL | −0.045 *** (−8.980) | −0.056 *** (−19.478) | −0.066 ** (−2.179) |
| ELE | −0.003 (−0.385) | 0.204 *** (9.036) | 0.022 * (1.850) |
| TEM | −0.016 ** (−2.191) | −0.037 * (−1.751) | −0.070 ** (−2.594) |
| PRE | 0.002 (0.425) | 0.017 (0.936) | −0.013 (−1.372) |
| W*UL | −0.016 *** (−2.593) | −0.059 *** (−6.987) | −0.103 *** (−10.398) |
| W*ELE | 0.061 *** (6.003) | 0.045 *** (3.474) | 0.059 *** (3.750) |
| W*TEM | 0.011 (0.808) | −0.004 (−0.248) | 0.004 (0.257) |
| W*PRE | −0.003 (−0.256) | 0.009 (0.494) | 0.008 (0.422) |
| Direct effect (UL) | −0.068 ** (−1.707) | −0.073 *** (−13.259) | −0.118 *** (−2.673) |
| Spillover effect (UL) | −0.733 *** (−8.455) | −0.852 *** (−4.432) | −1.002 *** (−2.788) |
| R-suqared | 0.536 | 0.664 | 0.522 |
Publisher’s Note: MDPI stays neutral with regard to jurisdictional claims in published maps and institutional affiliations. |
© 2022 by the authors. Licensee MDPI, Basel, Switzerland. This article is an open access article distributed under the terms and conditions of the Creative Commons Attribution (CC BY) license (https://creativecommons.org/licenses/by/4.0/).
Share and Cite
Li, J.; Bi, M.; Wei, G. Investigating the Impacts of Urbanization on Vegetation Net Primary Productivity: A Case Study of Chengdu–Chongqing Urban Agglomeration from the Perspective of Townships. Land 2022, 11, 2077. https://doi.org/10.3390/land11112077
Li J, Bi M, Wei G. Investigating the Impacts of Urbanization on Vegetation Net Primary Productivity: A Case Study of Chengdu–Chongqing Urban Agglomeration from the Perspective of Townships. Land. 2022; 11(11):2077. https://doi.org/10.3390/land11112077
Chicago/Turabian StyleLi, Jianshu, Mo Bi, and Guoen Wei. 2022. "Investigating the Impacts of Urbanization on Vegetation Net Primary Productivity: A Case Study of Chengdu–Chongqing Urban Agglomeration from the Perspective of Townships" Land 11, no. 11: 2077. https://doi.org/10.3390/land11112077