Article

Hyperspectral PRISMA and Sentinel-2 Preliminary Assessment Comparison in Alba Fucens and Sinuessa Archaeological Sites (Italy)

1
DICEAA, Department of Civil, Construction-Architectural and Environmental Engineering, University of L’Aquila, 67100 L’Aquila, Italy
2
ENEA, Department for Sustainability, Division Models and Technologies for Risks Reduction, 40129 Bologna, Italy
3
Department of Physics and Astronomy “Augusto Righi”, University of Bologna, 40129 Bologna, Italy
*
Author to whom correspondence should be addressed.
Land 2022, 11(11), 2070; https://doi.org/10.3390/land11112070
Submission received: 3 October 2022 / Revised: 8 November 2022 / Accepted: 9 November 2022 / Published: 17 November 2022
(This article belongs to the Special Issue Landscape Archaeology by Using Remote Sensing Data)

Abstract

:
Over the last decades, remote sensing techniques have contributed to supporting cultural heritage studies and management, including archaeological sites as well as their territorial context and geographical surroundings. This paper aims to investigate the capabilities and limitations of the new hyperspectral sensor PRISMA (Precursore IperSpettrale della Missione Applicativa) by the Italian Space Agency (ASI), still little applied to archaeological studies. The PRISMA sensor was tested on Italian terrestrial (Alba Fucens, Massa D’Albe, L’Aquila) and marine (Sinuessa, Mondragone, Caserta) archaeological sites. A comparison between PRISMA hyperspectral imagery and the well-known Sentinel-2 Multi-Spectral Instrument (MSI) was performed in order to better understand features and outputs useful to investigate the aforementioned areas. At first, bad bands analysis and noise removal were performed, in order to delete the numerically corrupted bands. Principal component analysis (PCA) was carried out to highlight invisible details in the original image; then, spectral signatures of representative areas were extracted and compared to Sentinel-2 data. At last, a classification analysis (ML and SAM) was performed both on PRISMA and Sentinel-2 imagery. The results showed a full agreement between Sentinel and PRISMA data, enhancing the capability of PRISMA in extrapolating more spectral information and providing a better reliability in the extraction of the features.

1. Introduction

Over the last decades, the increasing development of ground, aerial, and space remote sensing has progressively allowed its use for cultural heritage studies, conservation, valorisation and management [1,2,3,4,5,6].
Nowadays, remote sensing has spread to many sectors allowing the development of numerous services and application systems [7,8]. In the archaeological field, the main challenges related to the crucial importance of integrating remote sensing analysis with traditional archaeological data and methods, such as aerial photos, field surveys, trials diagnostic measurements, excavation campaigns and historical documentation [9,10,11,12].
By the 1960s, research began to increasingly focus on the relationships between historical sites and their physical context, rather than considering the archaeological site as an isolated object. In this field, remote sensing data were used to ‘rebuild’ palaeoenvironmental contexts through the identification of palaeoforms by means of geomorphological features analysis, originating from natural or artificial phenomena, such as fluvial and marine action, aeolian morphogenesis or human activities [13,14].
Necessary features to be considered are hydrographic patterns (network, soils moisture), geomorphology (geology, lithology, slope, texture), vegetation (Normalized Difference Vegetation Index NDVI, vegetation kinds and features) and building materials. Multiscale and multitemporal data allow the analysis at different levels, from a synoptic to a more detailed view, studying both features and relationships in the morphological context during time [15,16,17,18].
On 22 March 2019, the Italian Space Agency launched the PRISMA (PRecursore IperSpettrale della Missione Applicativa) hyperspectral satellite mission for Earth Observation with an innovative electro-optical instrumentation that combines a hyperspectral sensor with a medium-resolution panchromatic camera [19,20].
In May 2020, open access to the PRISMA system was provided to the scientific, institutional and industrial worldwide community for research and development [21]. Hyperspectral sensors can contribute to assess the chemical-physical composition of the objects to be detected, thanks to their spectral signature [22,23,24]. The sensor has a total of around 240 bands with a spatial resolution of 30 m. A more detailed description of the sensor is reported in Section 2.3. PRISMA images have been tested in many fields, such as mineral alteration mapping [25], forest type discrimination and vegetation studies [26,27], water [28,29], snow [30] and agronomic applications [31], but few studies on archaeological sites have been performed and, in particular, on submarine sites, until now.
For this reason, in this paper, a preliminary archaeological application of PRISMA hyperspectral data to the Italian terrestrial Alba Fucens (Massa D’Albe, L’Aquila) and marine Sinuessa (Mondragone, Caserta) archaeological sites is presented. The study mainly aims to analyse the capabilities and the limitations of PRISMA hyperspectral images and understand their informative contribution. To validate the results obtained by PRISMA data analysis, Sentinel-2 images were used as comparison. Sentinel-2 is a multispectral sensor within the Copernicus mission [32], which has been widely used in the literature in many research works. Spectral signatures were extracted from chosen elements to identify physical characteristics associated with archaeological features. The recent advancements in geomatics offer a wide range of tools and instruments able to rapidly acquire innumerable cognitive and quantitative information useful for formulating conservative interventions for the archaeological areas [33,34,35,36,37,38]. Until now, the main limitation in the use of remote sensing data in archaeology has been the low geometric and spectral resolution of satellite images. Therefore, thanks to the high spectral resolution, PRISMA sensor represents a relevant innovation. Moreover, the possibility to obtain chemical and physical information of the investigated areas opens new scenarios; in particular, regarding archaeology, the analysis of the spectral features, in relation to soil, geological and plant cover characteristics, improves the identification of traces and anomalies, emphasizing the spectral response of satellite images [39,40,41].
The results can be used to improve the scientific knowledge of the archaeological areas, to manage environmental or anthropic risks, and to plan restoration and conservation actions, thanks to a multiscale monitoring, inspection, diagnosis and mapping.
The paper is structured as follows: in Section 2, materials and methods are described, including a brief description of the two archaeological sites; Section 3 contains the obtained results after the processing; in Section 4, the discussion of the results is presented and, then, the conclusions in Section 5 are reported.

2. Materials and Methods

The PRISMA hyperspectral dataset was tested in two areas of the Italian territory to analyse the spectral responses in relation to the coverage present in the two archaeological sites, Alba Fucens (Abruzzo Region) and Sinuessa (Campania Region), exploiting the satellite sensor high spectral definition. They have not been extensively studied yet and need to be detected for their conservation and maintenance. After previous studies [18,42], where UAV RGB sensor was used to detect the Alba Fucens site, the authors thought to expand the analysis to a different scale using a hyperspectral satellite sensor. Moreover, two completely different scenarios were taken into account for a better evaluation of the methods and for a broader discussion. The study mainly aims to analyse the capabilities of PRISMA hyperspectral images and understand their informative contribution.

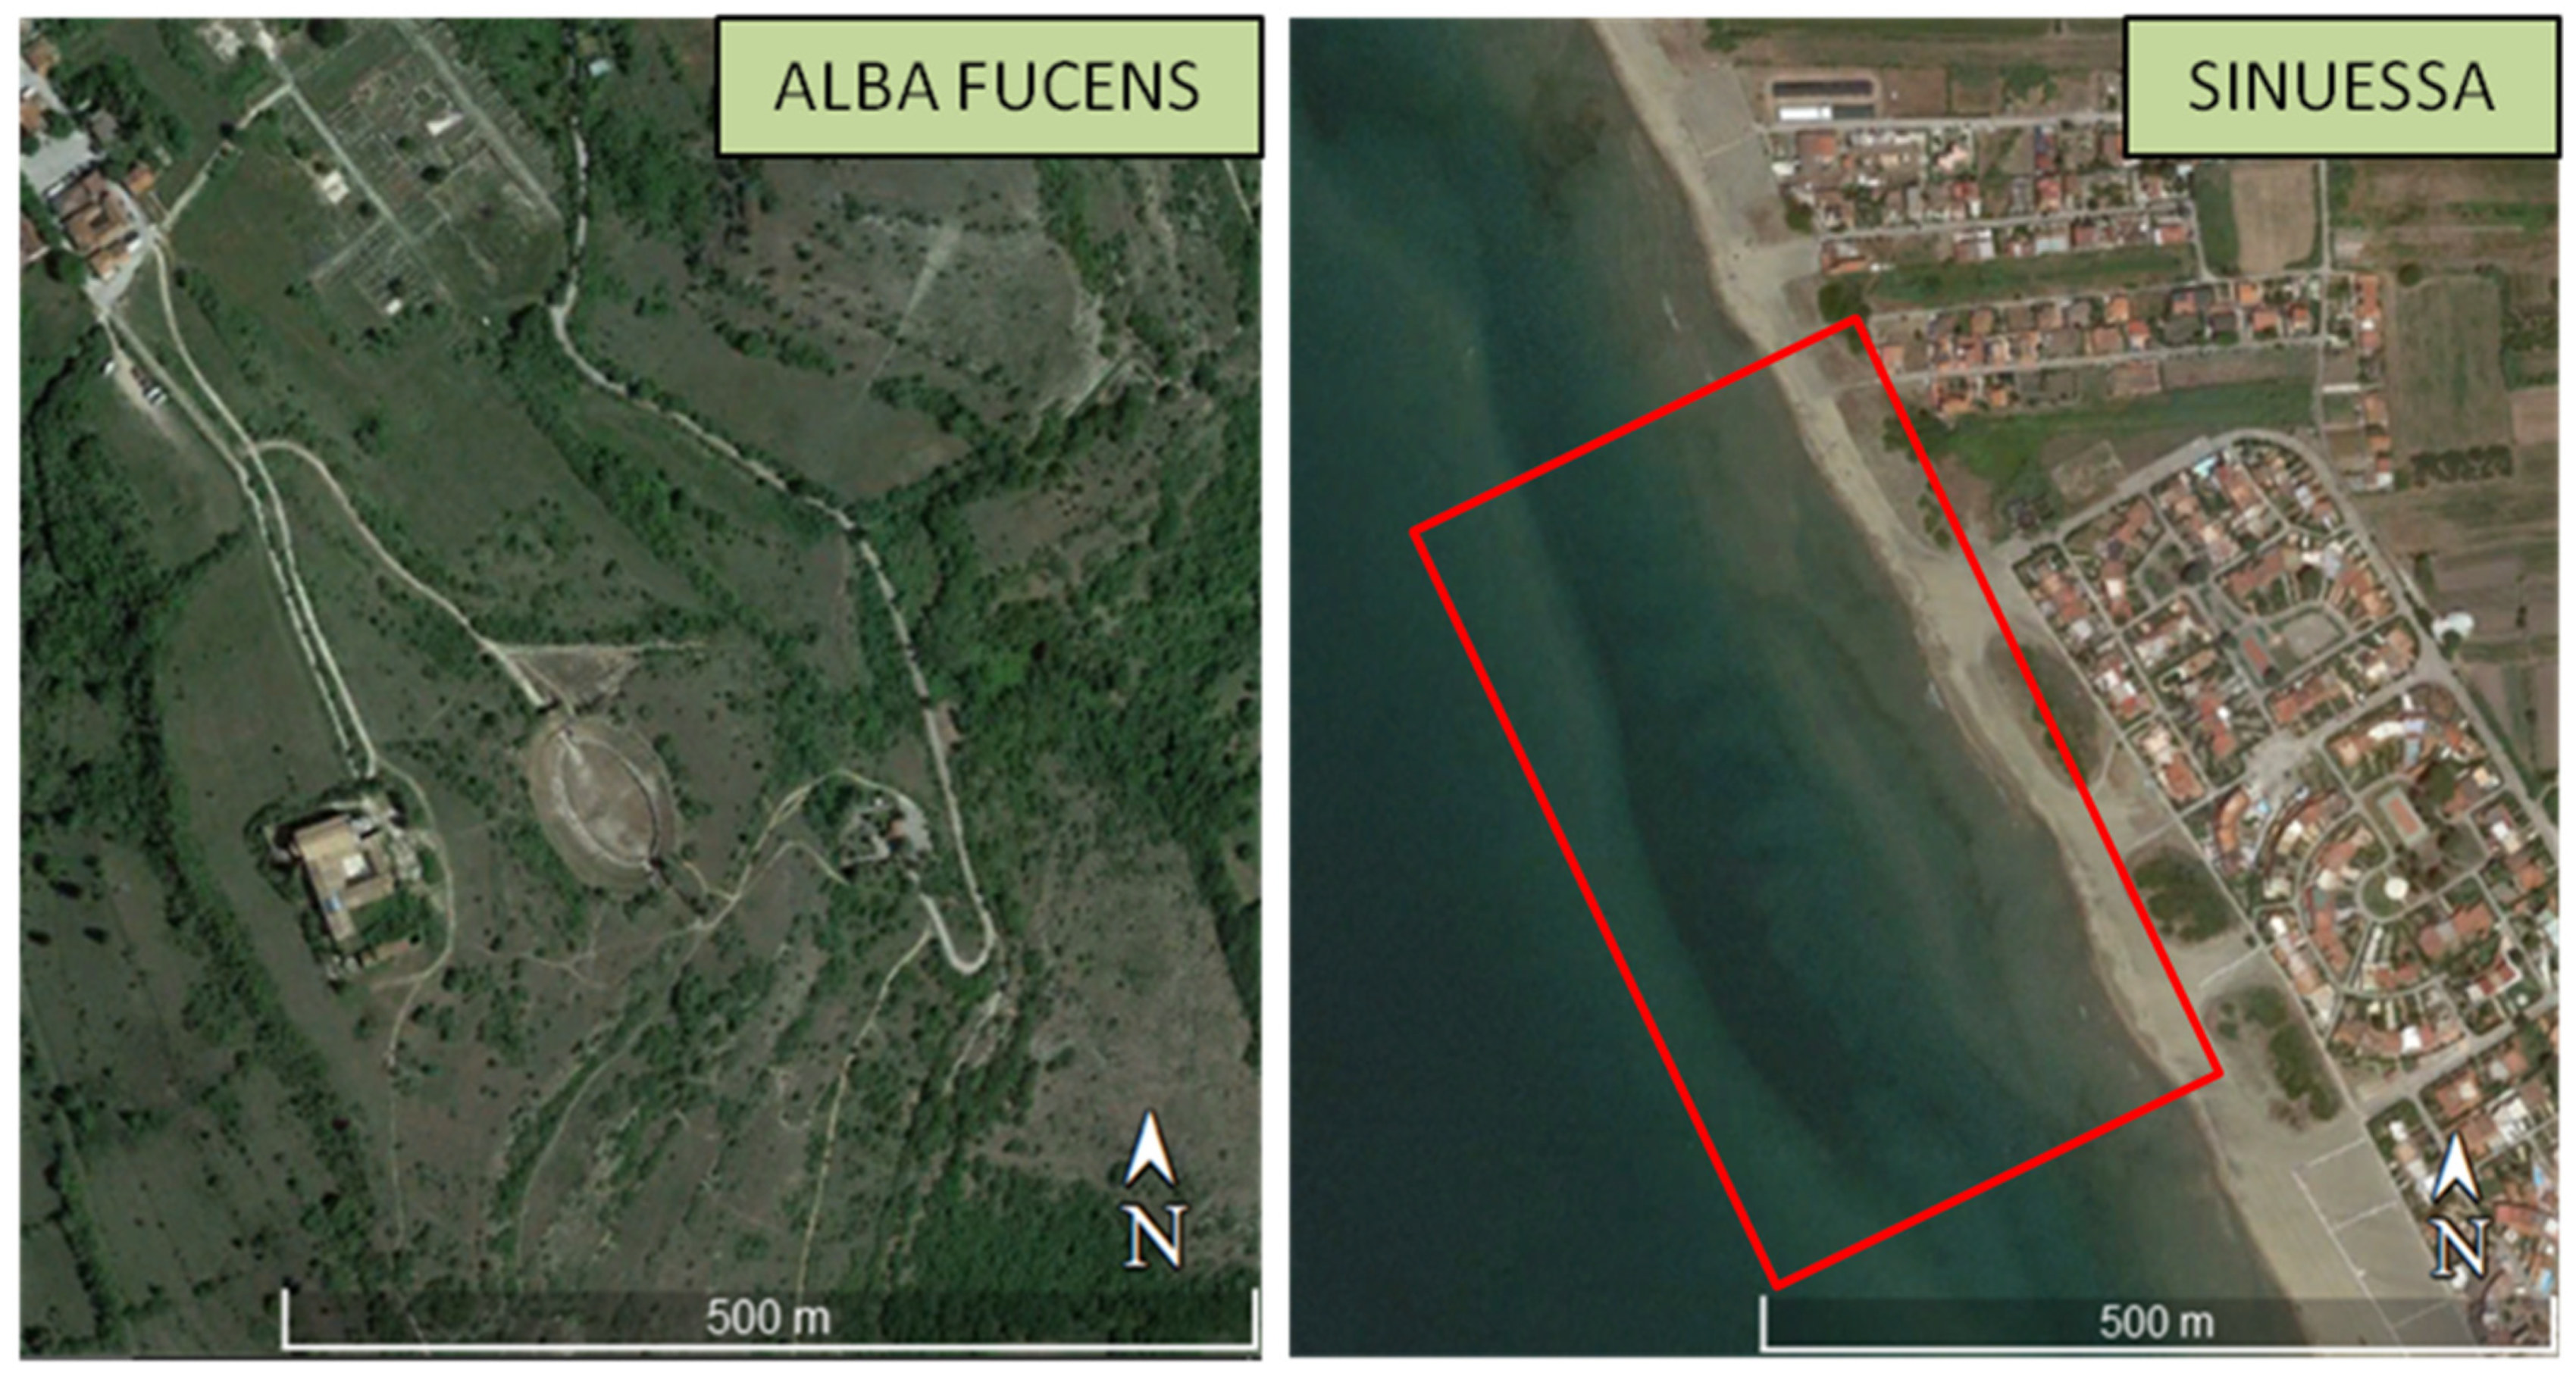
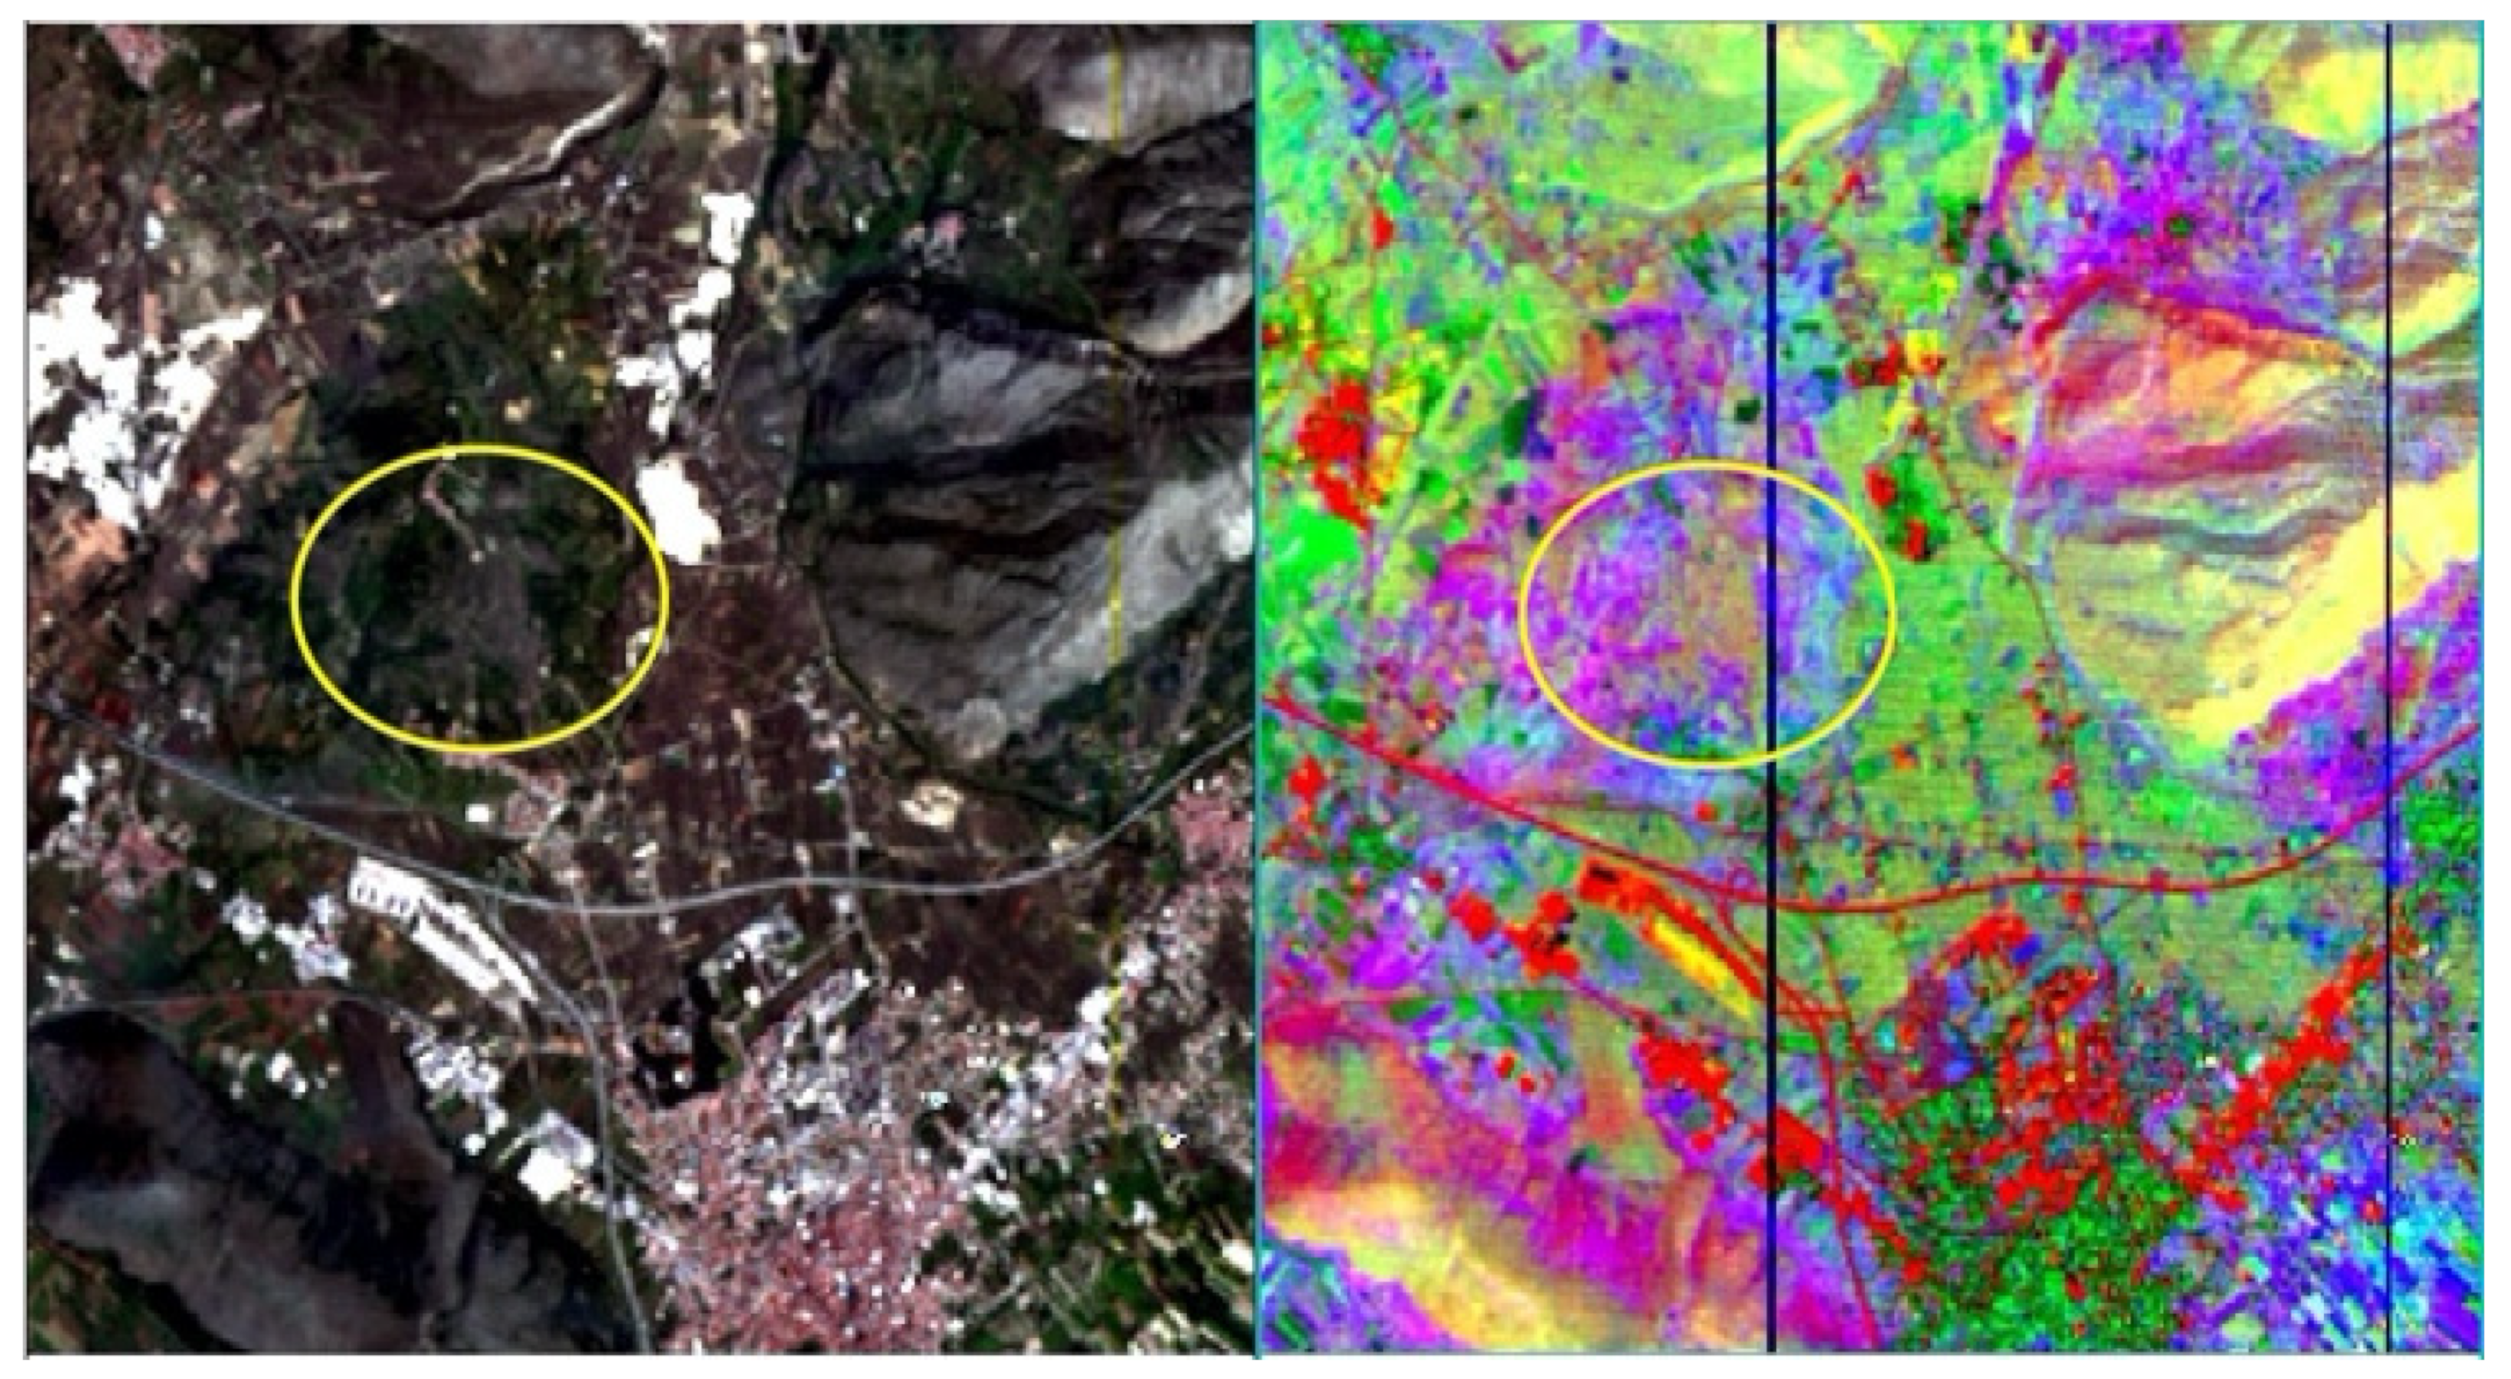
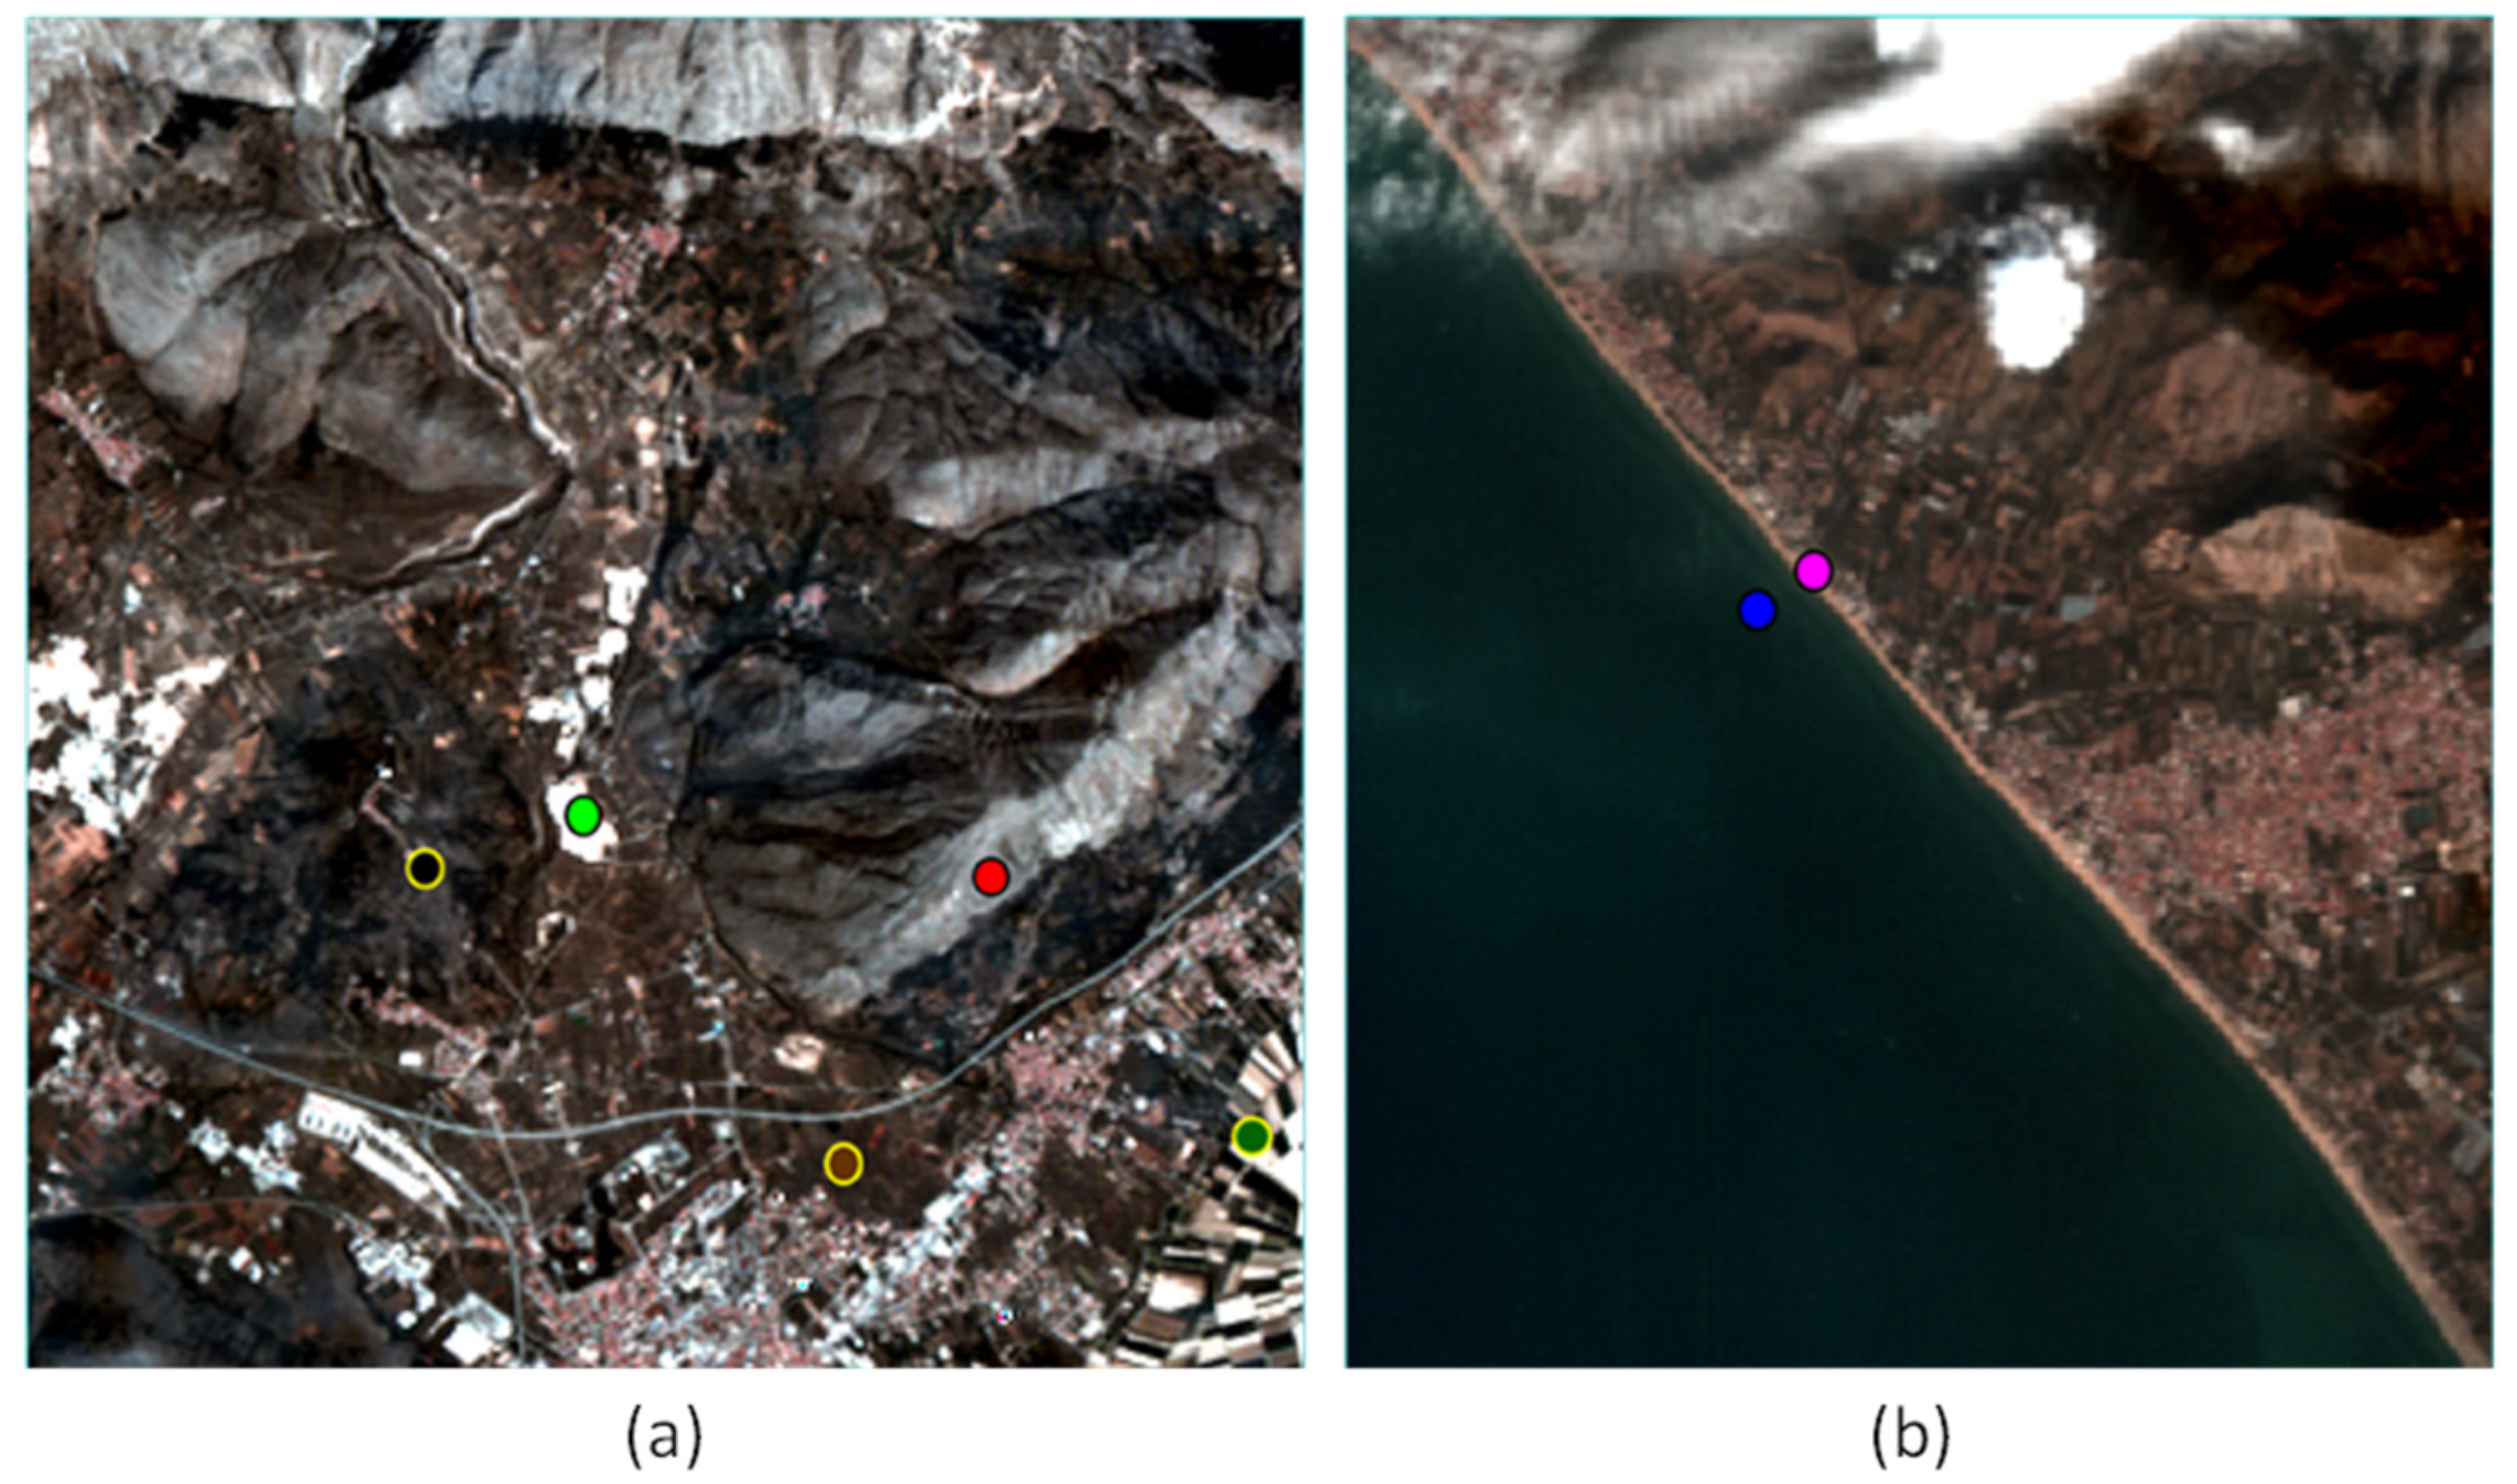
2.1. Alba Fucens Archaeological Site

The Latin colony of Alba Fucens (303 B.C.) (Figure 1) is the largest archaeological site (32,000 hectares) of the whole Apennines (Central Italy). According to the “Romanization process” of the Italic populations, the colony was settled in a strategic territorial position, called Aequi territory, centre of several Italic populations, close to Rome, at the northern boundary of the Fucino Lake and along the via Tiburtina Valeria. It regulated the access way between Tyrrhenian and Adriatic coasts.
The settlement, placed on a plateau (Plain of the Civita), encircled by three opposed hills (San Nicola, San Pietro and Pettorino), was surrounded by powerful and extensive megalithic walls. Even if it is mostly known for its iconographic landscape ruins inside of the megalithic walls, Alba Fucens’ jurisdiction concerned a neighbouring area of several hundreds of square kilometres. From the 346 B.C. earthquake, the city started to be progressively abandoned. During the Middle Ages, the settlement moved from the plain of the Civita to San Nicola hill where a small-fortified inhabited centre and a castle (Orsini castle) were built. Due to recurring earthquakes and hydrogeological issues [43,44], this settlement was definitively abandoned, too. Since 1950, the Academia Belgica mission and other excavation campaigns have mainly brought to light a part of the actual settlement of the Civita.
Most of the studies mainly concern the history and the development of the archaeological site, but with the recent geomatic multiscale approaches, its conservation and risk assessment can be also evaluated [18,42].
Due to its extension and its environmental and geographic characteristics the knowledge and the conservation of the Alba Fucens archaeological site is still a complex task.

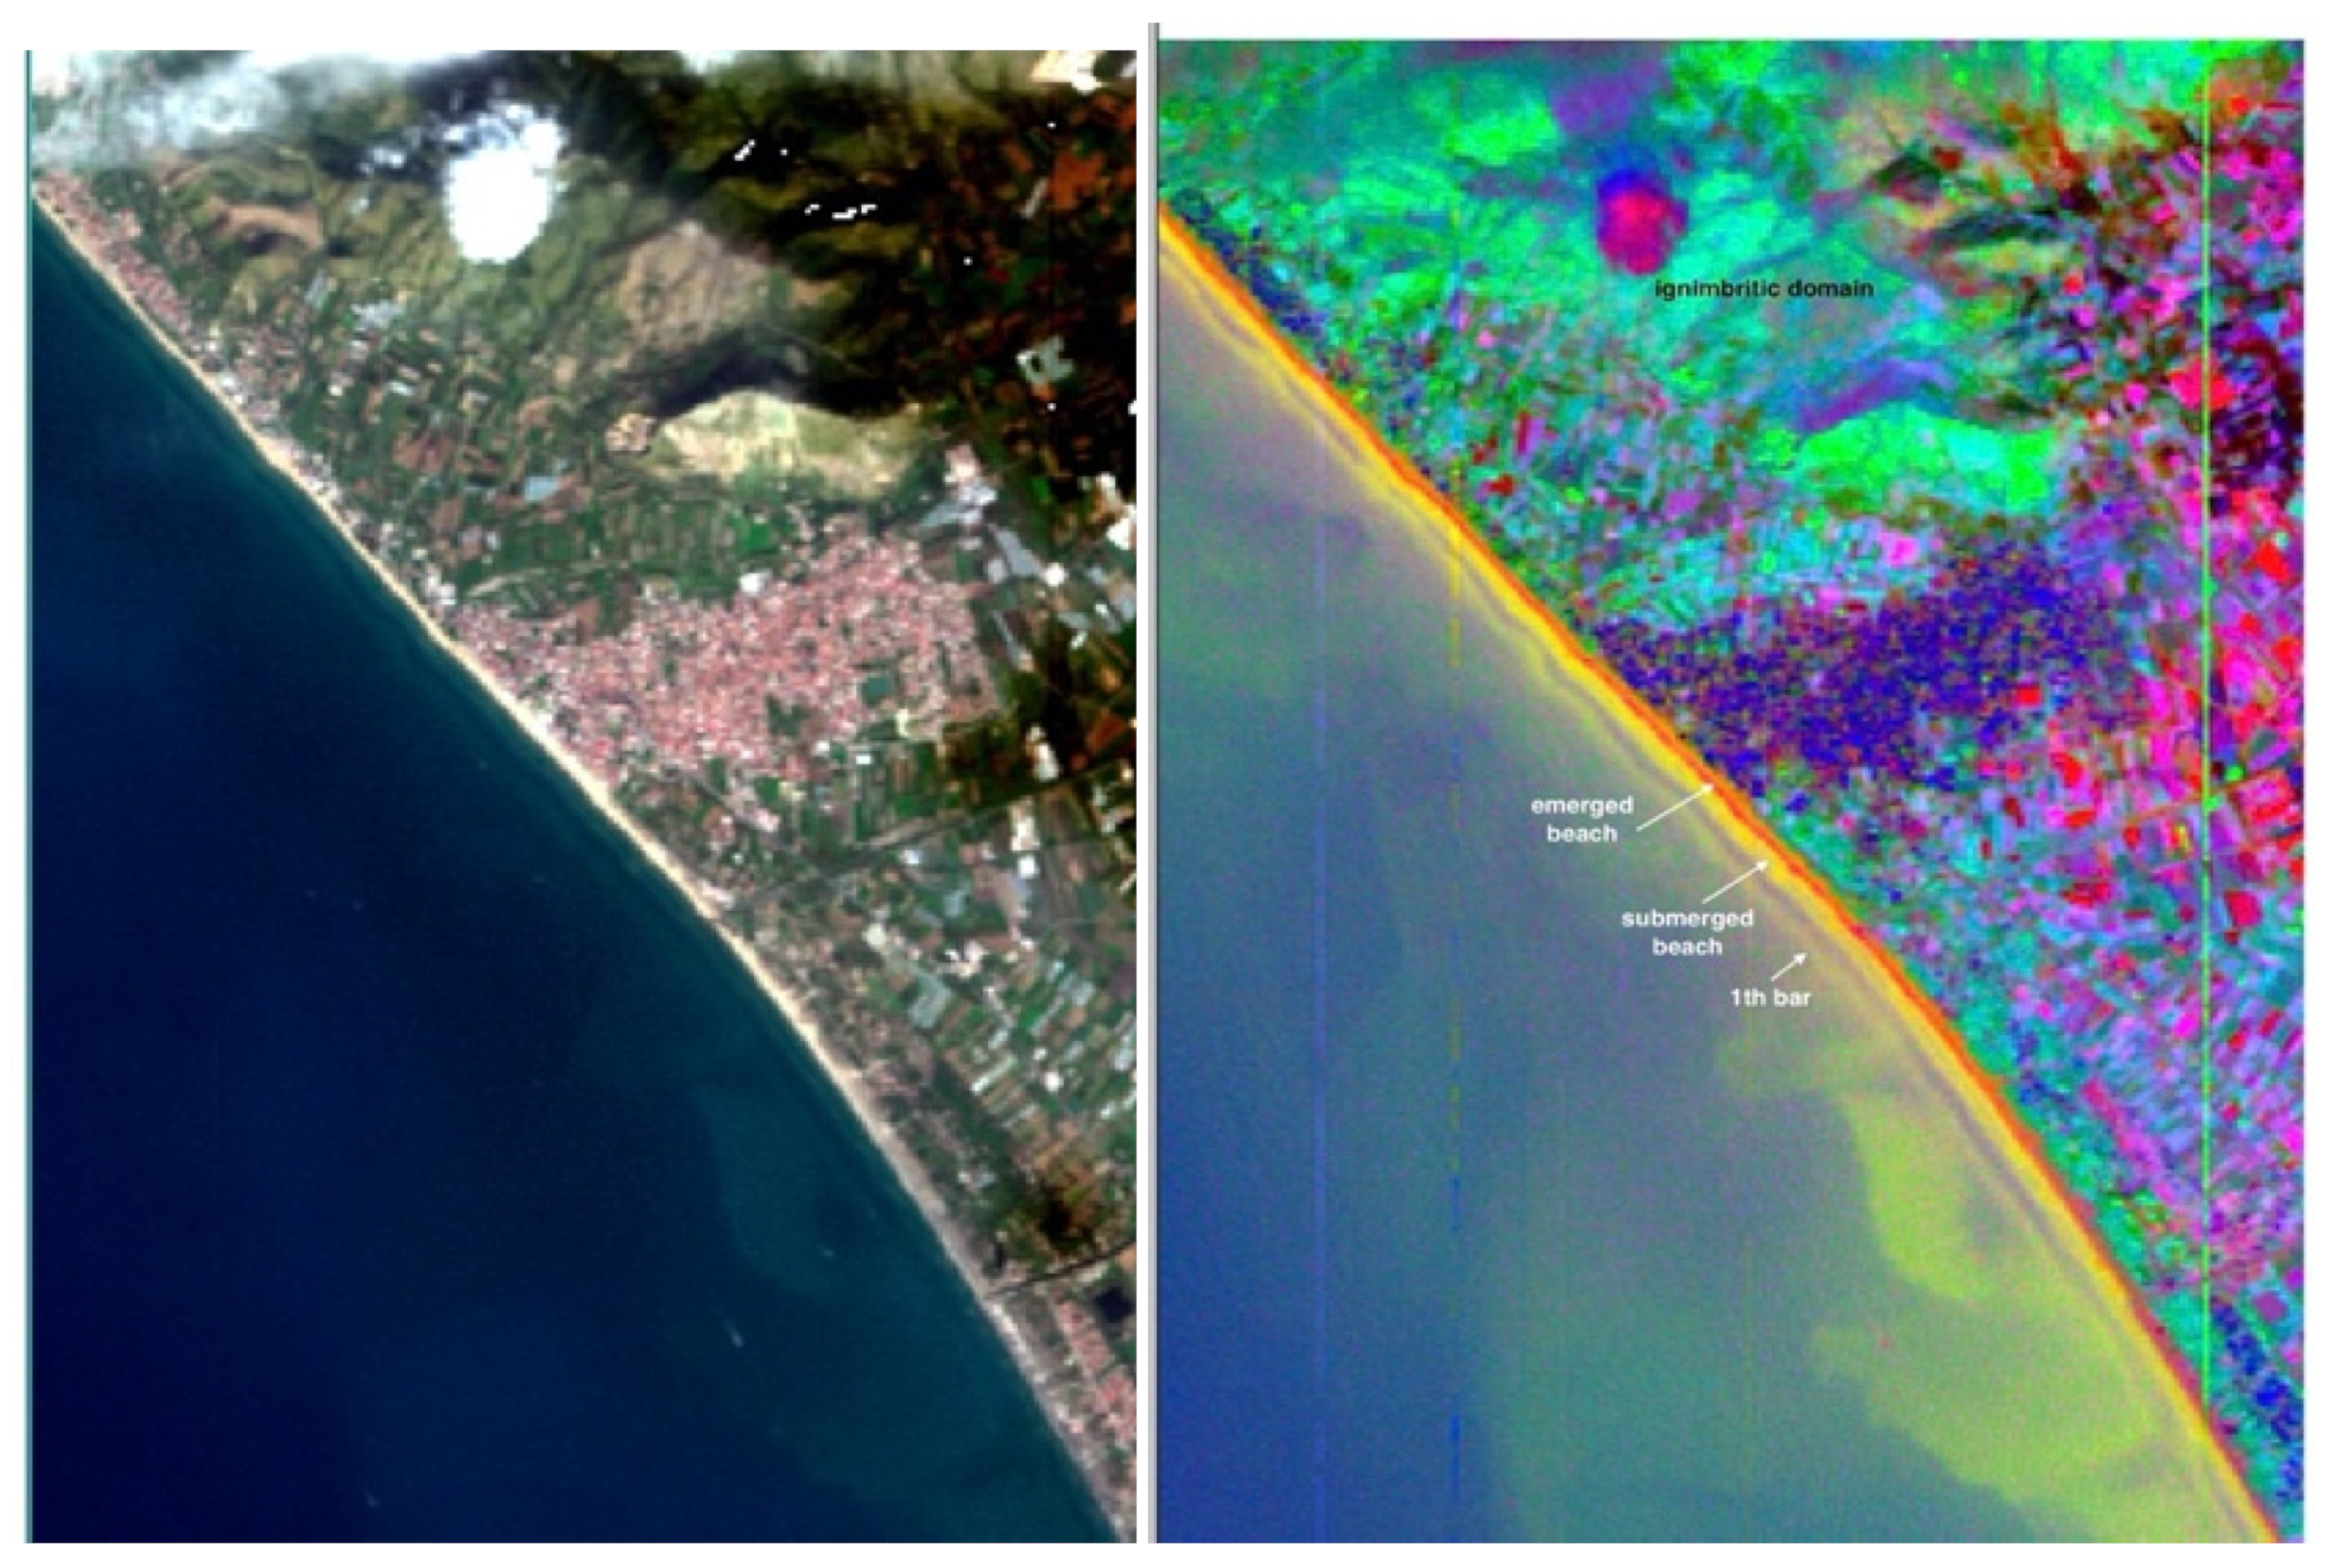
2.2. Sinuessa Archaeological Site

Sinuessa is a small Roman colony (54 hectares) founded in 296 B.C. in the South of Italy [45] (Figure 1) in Samnite territory, founded to control the coastal access to Campania Plain (Ager Campanus) [46,47]. Around 174 B.C., Sinuessa developed as a big city thanks to production and trade of wine throughout the Mediterranean and was probably destroyed by the earthquake in 375 A.D. The colony is nowadays the most significant underwater archaeological site along the northern coast of Campania, in the Tyrrhenian Sea. Morpho-bathymetric and submarine geological investigations have been carried out in the area between the Volturno river mouth and the mountain carbonatic Massico Group, in the northern town of Mondragone. The investigations highlighted the presence of a 6 km rocky bank parallel to the coast constituted by pyroclastic deposits attributed to Campanian Ignimbrite aged 39 ky B.P. [48], derived from the volcanic district of the Phlegrean Fields. The deposits are located with continuity between isobaths of depths ranging between −8 and −15 metres [46].
The existing roads and maritime Roman structures addressed geomorphological researches to the submerged area since the 90 s [46,47]. More recently, new investigations have been carried out where a stretch of Roman road was detected. Important archaeological findings (amphorae, anchors and even twenty-four 3 × 3 m Roman pilae at −8.5 m depth facing Sinuessa) were linked to the activities of the colony in the Roman imperial period [45,49].
Figure 1. The Italian terrestrial Alba Fucens and marine Sinuessa (in the red AOI) archaeological sites (orthophotos by Google Earth © 2022) [50,51,52].
Land 11 02070 g001

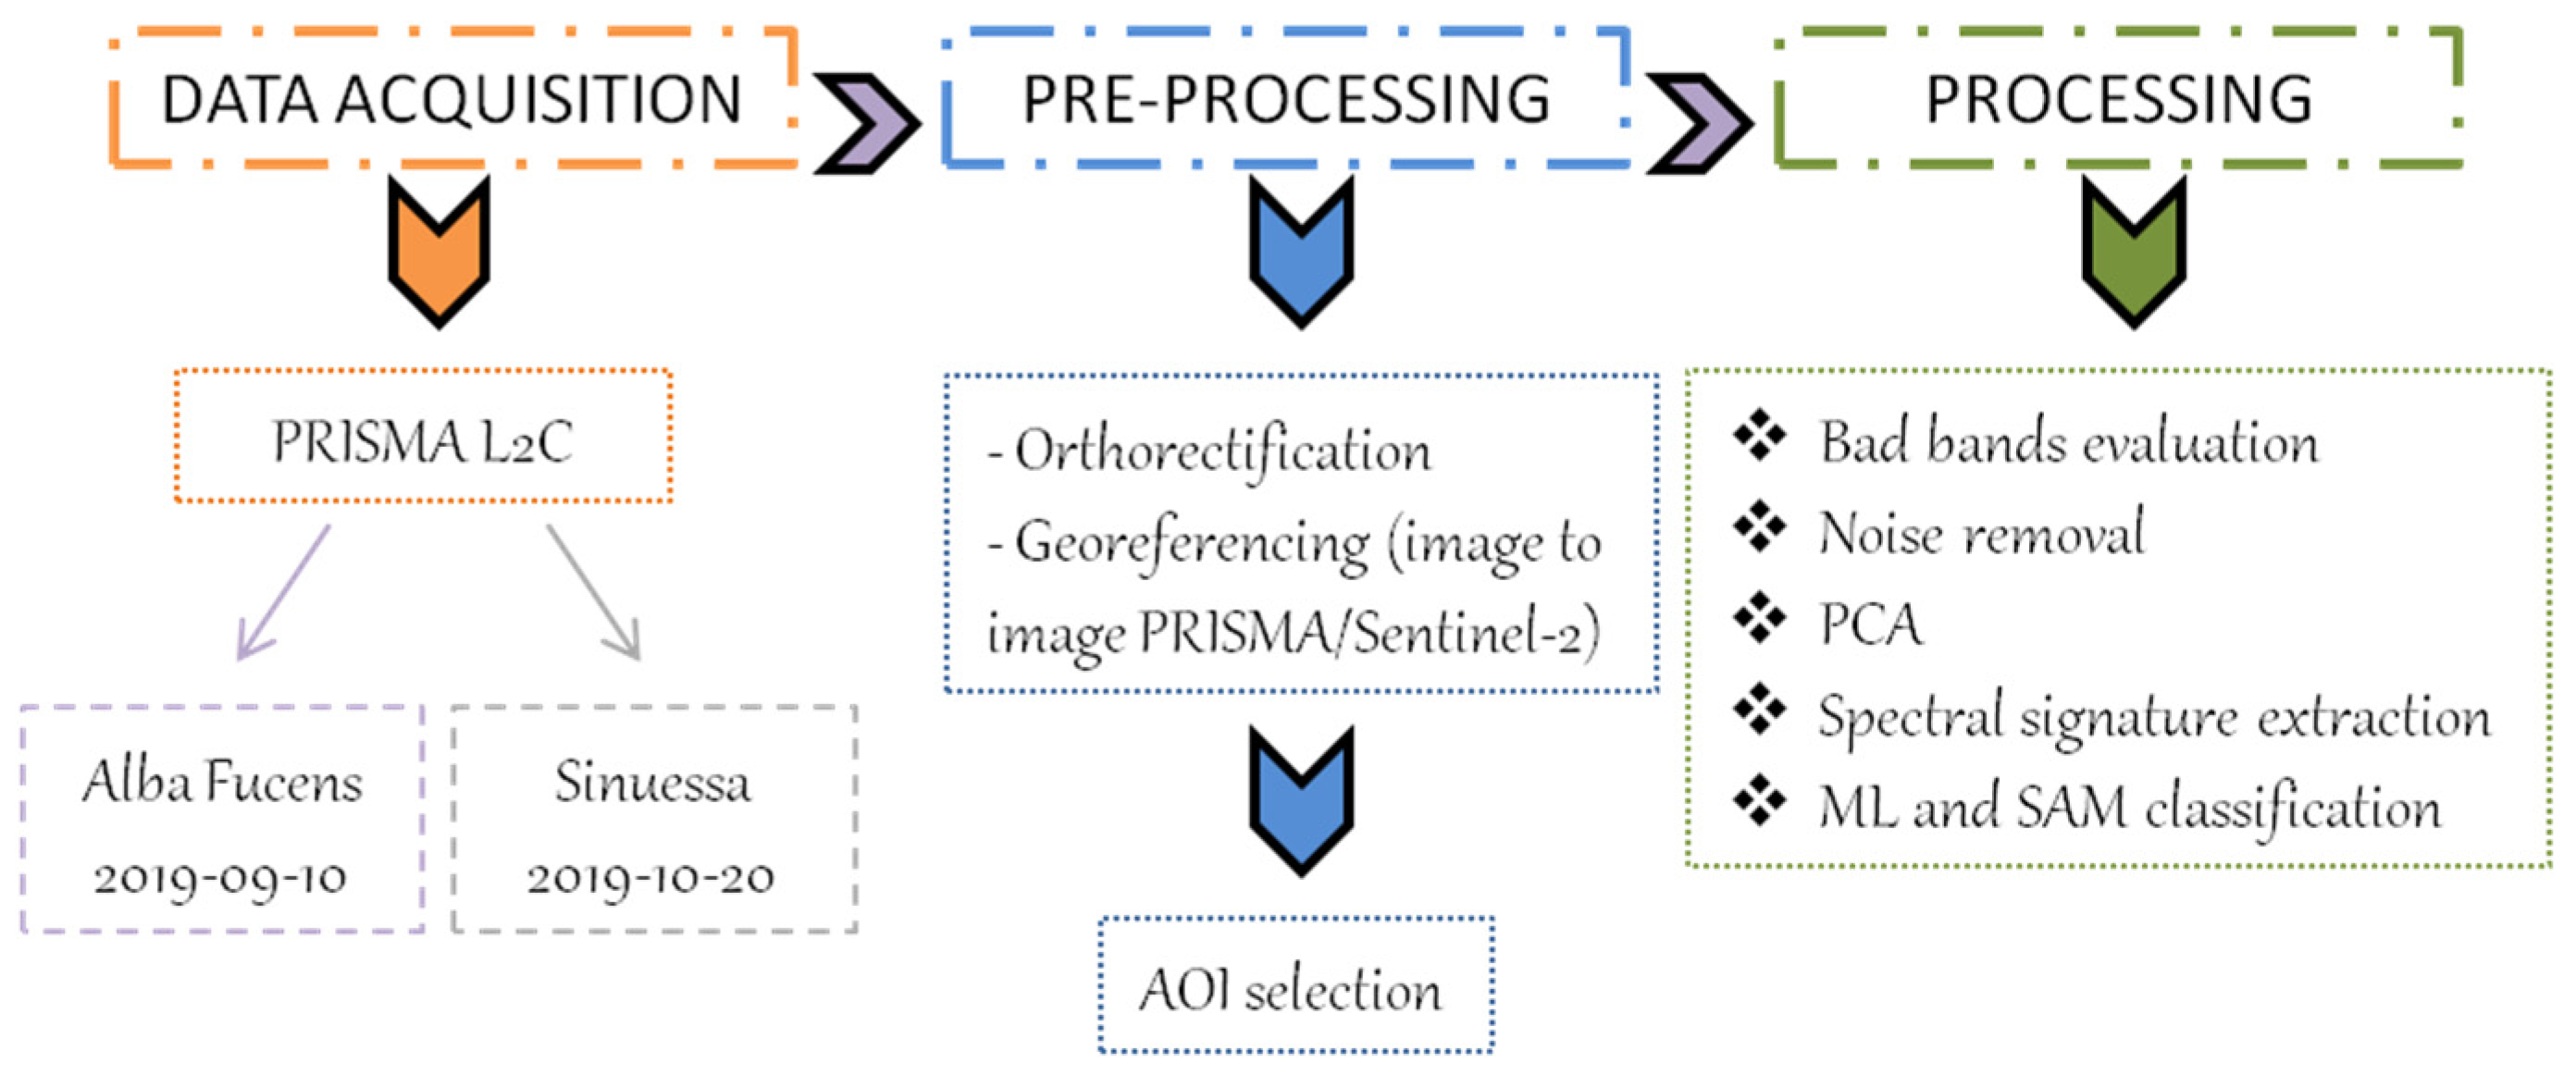
2.3. Satellite Images and Data Processing

PRISMA products are considered very performing and challenging. The sensor can capture images in a series of contiguous spectral bands covering the wavelength range from 400 to 2500 nm and it is also equipped with a panchromatic camera (400 to 700 nm). The hyperspectral and panchromatic cameras have a spatial resolution of 30 and 5 m, respectively [53,54]. The hyperspectral PRISMA spectrometer uses a prism to divide the wavelength and then, to define the bands. The acquisition mode is based on a pushbroom scanning technique, hence the image is acquired row by row in the along-track direction. The row is acquired simultaneously in all the bands thanks to the spectrometer. In this way, a 3D cube is created and the spectral signature can be extracted from each pixel. In particular, in PRISMA, two different cubes are created: the first one covers the wavelength range 400–1000 nm (VNIR, visible and near infrared) and generates 66 spectral bands, while the second one ranges between 940 and 2500 nm (SWIR, Short Wave InfraRed) and provides 173 spectral bands. PRISMA has a swath of 30 km and a revisiting time of 29 days.
Two level products are provided to users:
  • Level 1 (L1) considers the top-of-atmosphere signal, namely no atmospheric correction has been applied yet. It also contains cloud cover, sun-glint and land classification masks;
  • Level 2, divided into three sub-levels 2B, 2C and 2D, considers the atmospheric correction (BOA, bottom-of-atmosphere). In L2C in addition, water vapor, aerosols and cloud characterization maps are taken into account. The applied UTM projection in L2D provides geocoded data [55].
Both levels are disseminated as HDF-EOS (Hierarchical Data Format—Earth Observing System). The choice of the level depends, of course, on the purpose of the application.
The adopted methodology consisted of (Figure 2):
  • Data acquisition;
  • Pre-processing: orthorectification and georeferencing, AOI selection;
  • Processing: band bands evaluation and noise removal, PCA, spectral signatures extraction, ML and SAM classification.
Concerning data acquisition (the images are freely available on the ASI portal after user registration), the Alba Fucens PRISMA image was acquired on 10 September 2019. In PRISMA archive only one bordering image about Sinuessa, partially covered by cloud, is available (20 October 2019). However, in order to test PRISMA capabilities on an archaeological sub-marine area the image was anyway considered.
Regarding pre-processing, the L2C products were considered for both sites. The L2C images are radiometrically corrected but not orthorectified. An orthorectification on the hyperspectral images was performed with Envi 5.6.2 Software. Rational polynomial coefficients (RPCs) and a DEM (10 m of resolution) were used to correct the geometric distortions. In addition, some ground control points (GCPs) and check points (CPs), collected from a Sentinel 2 images, were used to improve the process.
In particular, for the Alba Fucens images, the morphologically more complex site, 29 GCPs and 12 CPs are used. The final RMSE was 8.56 m and 9.76 m, respectively, for GCPs and CPs. The reference system is WGS84/UTM Zone 33. Then, the AOI was selected in both the archaeological sites. VNIR and SWIR cubes were tested separately. Then, the AOI was selected in both the archaeological sites.
Among the processing analysis, where ENVI and ERDAS Imagine software were used, bad bands evaluation was performed. If hyperspectral data are useful to identify many features, thanks to their rich spectral response, a large number of bands leads to complex data analysis. As with other hyperspectral sensors [56,57], many bands contain “no data” pixels, i.e., no pixel information. The so called “bad bands” refer to specific data layers that are numerically corrupted and therefore not desirable for subsequent processing or analysis of the dataset [21]. Factors producing bad bands are related to not enlightened and overlap regions, water vapour which absorbs all the incident solar energy, low signal-to-noise (SNR) bands and error patches [56,57,58,59]. Moreover, the number and locations of the bad bands change in different scenes [60]. For the bad bands’ evaluation, the histograms’ comparison between good and bad bands was carried out. To improve the readability of a hyperspectral image, noise removal was performed. Denoising techniques are specifically tailored to hyperspectral images; in fact, conventional methods based on 2D modelling and convex techniques are not very efficient, as they ignore the spectral information [61,62,63].
Two different denoising algorithms were applied:
  • HyRes for line restoring [61] (a low-rank model-based approach which has proved to be very effective in the restoration of images in case of sparse noise [62]);
  • BM4D for the Gaussian denoising [63] (an evolution to volumetric data, such as a hyperspectral data cube, of the block matching 3D algorithm, a non-local means filtering approach considered to achieve the best performance in image denoising).
Then, PCA (principal component analysis) was performed [64,65,66]. The analysis in main components is absolutely necessary especially in hyperspectral data, due to the high spectral resolution, which means high number of spectral bands. As is well known from electromagnetic transmission theory, some bands may contain less discriminating information than others [67] and some spectral sequences may not highlight important information for some land applications [68,69]. For these reasons, the high number of hyperspectral bands can negatively affect the image processing due to the size, redundancy and autocorrelation of the datasets [26]. The PCA leads to the creation of new variables, called principal components, which are linear combinations of the original ones, and have the following two properties:
  • The new variables are uncorrelated (orthogonal);
  • They are listed in descending order of their variance.
This technique is used exclusively for quantitative and clear variables with some correlation degree. The PCA transforms the input bands into new components that should be able to make the identification of distinct features and surface types easier.
This is a direct result of: (i) the high correlation existing among channels for areas that do not change significantly over the space; and (ii) the expected low correlation associated with higher presence of noise.
The major portion of the variance in a multispectral data set is associated with homogeneous areas, whereas localised surface anomalies will be enhanced in later components. In particular, each successive component contains less of the total data set variance. So, PCA is used as application to highlight elements or details not visible in the original image [70,71,72] and it is particularly used in the archaeological field [73,74,75,76].
Another analysis to study PRISMA data was the extraction of spectral signatures from representative points and the comparison between Sentinel-2 and PRISMA was also performed. The chosen points include pit, rock and three different types of soil in Alba Fucens and sea and sand in Sinuessa. They were taken in extended areas, in order to ensure that the mean reflectance value of the chosen pixel was representative of the same feature.
At last, two supervised classifications (maximum likelihood (ML) and spectral angle mapper (SAM)) were performed in the Alba Fucens study area. Image classification is an important aspect in the field of remote sensing dataset analysis and pattern recognition. Digital image classification is the process of analysing all image pixels and assigning them to a false number of classes. Spectral ratings define areas that have similar characteristics of spectral reflectance.
The aim was to understand how PRISMA can detect archaeological information through classification analysis. The supervised classification starts from the creation of the “reading keys” of the chosen coverage classes (training site); an estimate of the spectral separability between the classes follows. The following step is the assignment of the defined classes through statistical approaches.
The ML classification considers the variance and the covariance in statistical analysis of different categories; the ML method, therefore, calculates the statistical probability that a pixel belongs to a given class [70]. This classification procedure is the most used and reliable, especially in high accuracy classifications. SAM is a physically based spectral classification that uses an n-D angle to match pixels to reference spectra. The algorithm determines the spectral similarity between two spectra by calculating the angle between the spectra and treating them as vectors in a space with dimensionality equal to the number of bands. This technique is relatively insensitive to illumination and albedo effects when used on calibrated reflectance data [77]. The classifications were compared with Sentinel-2 image.

3. Results

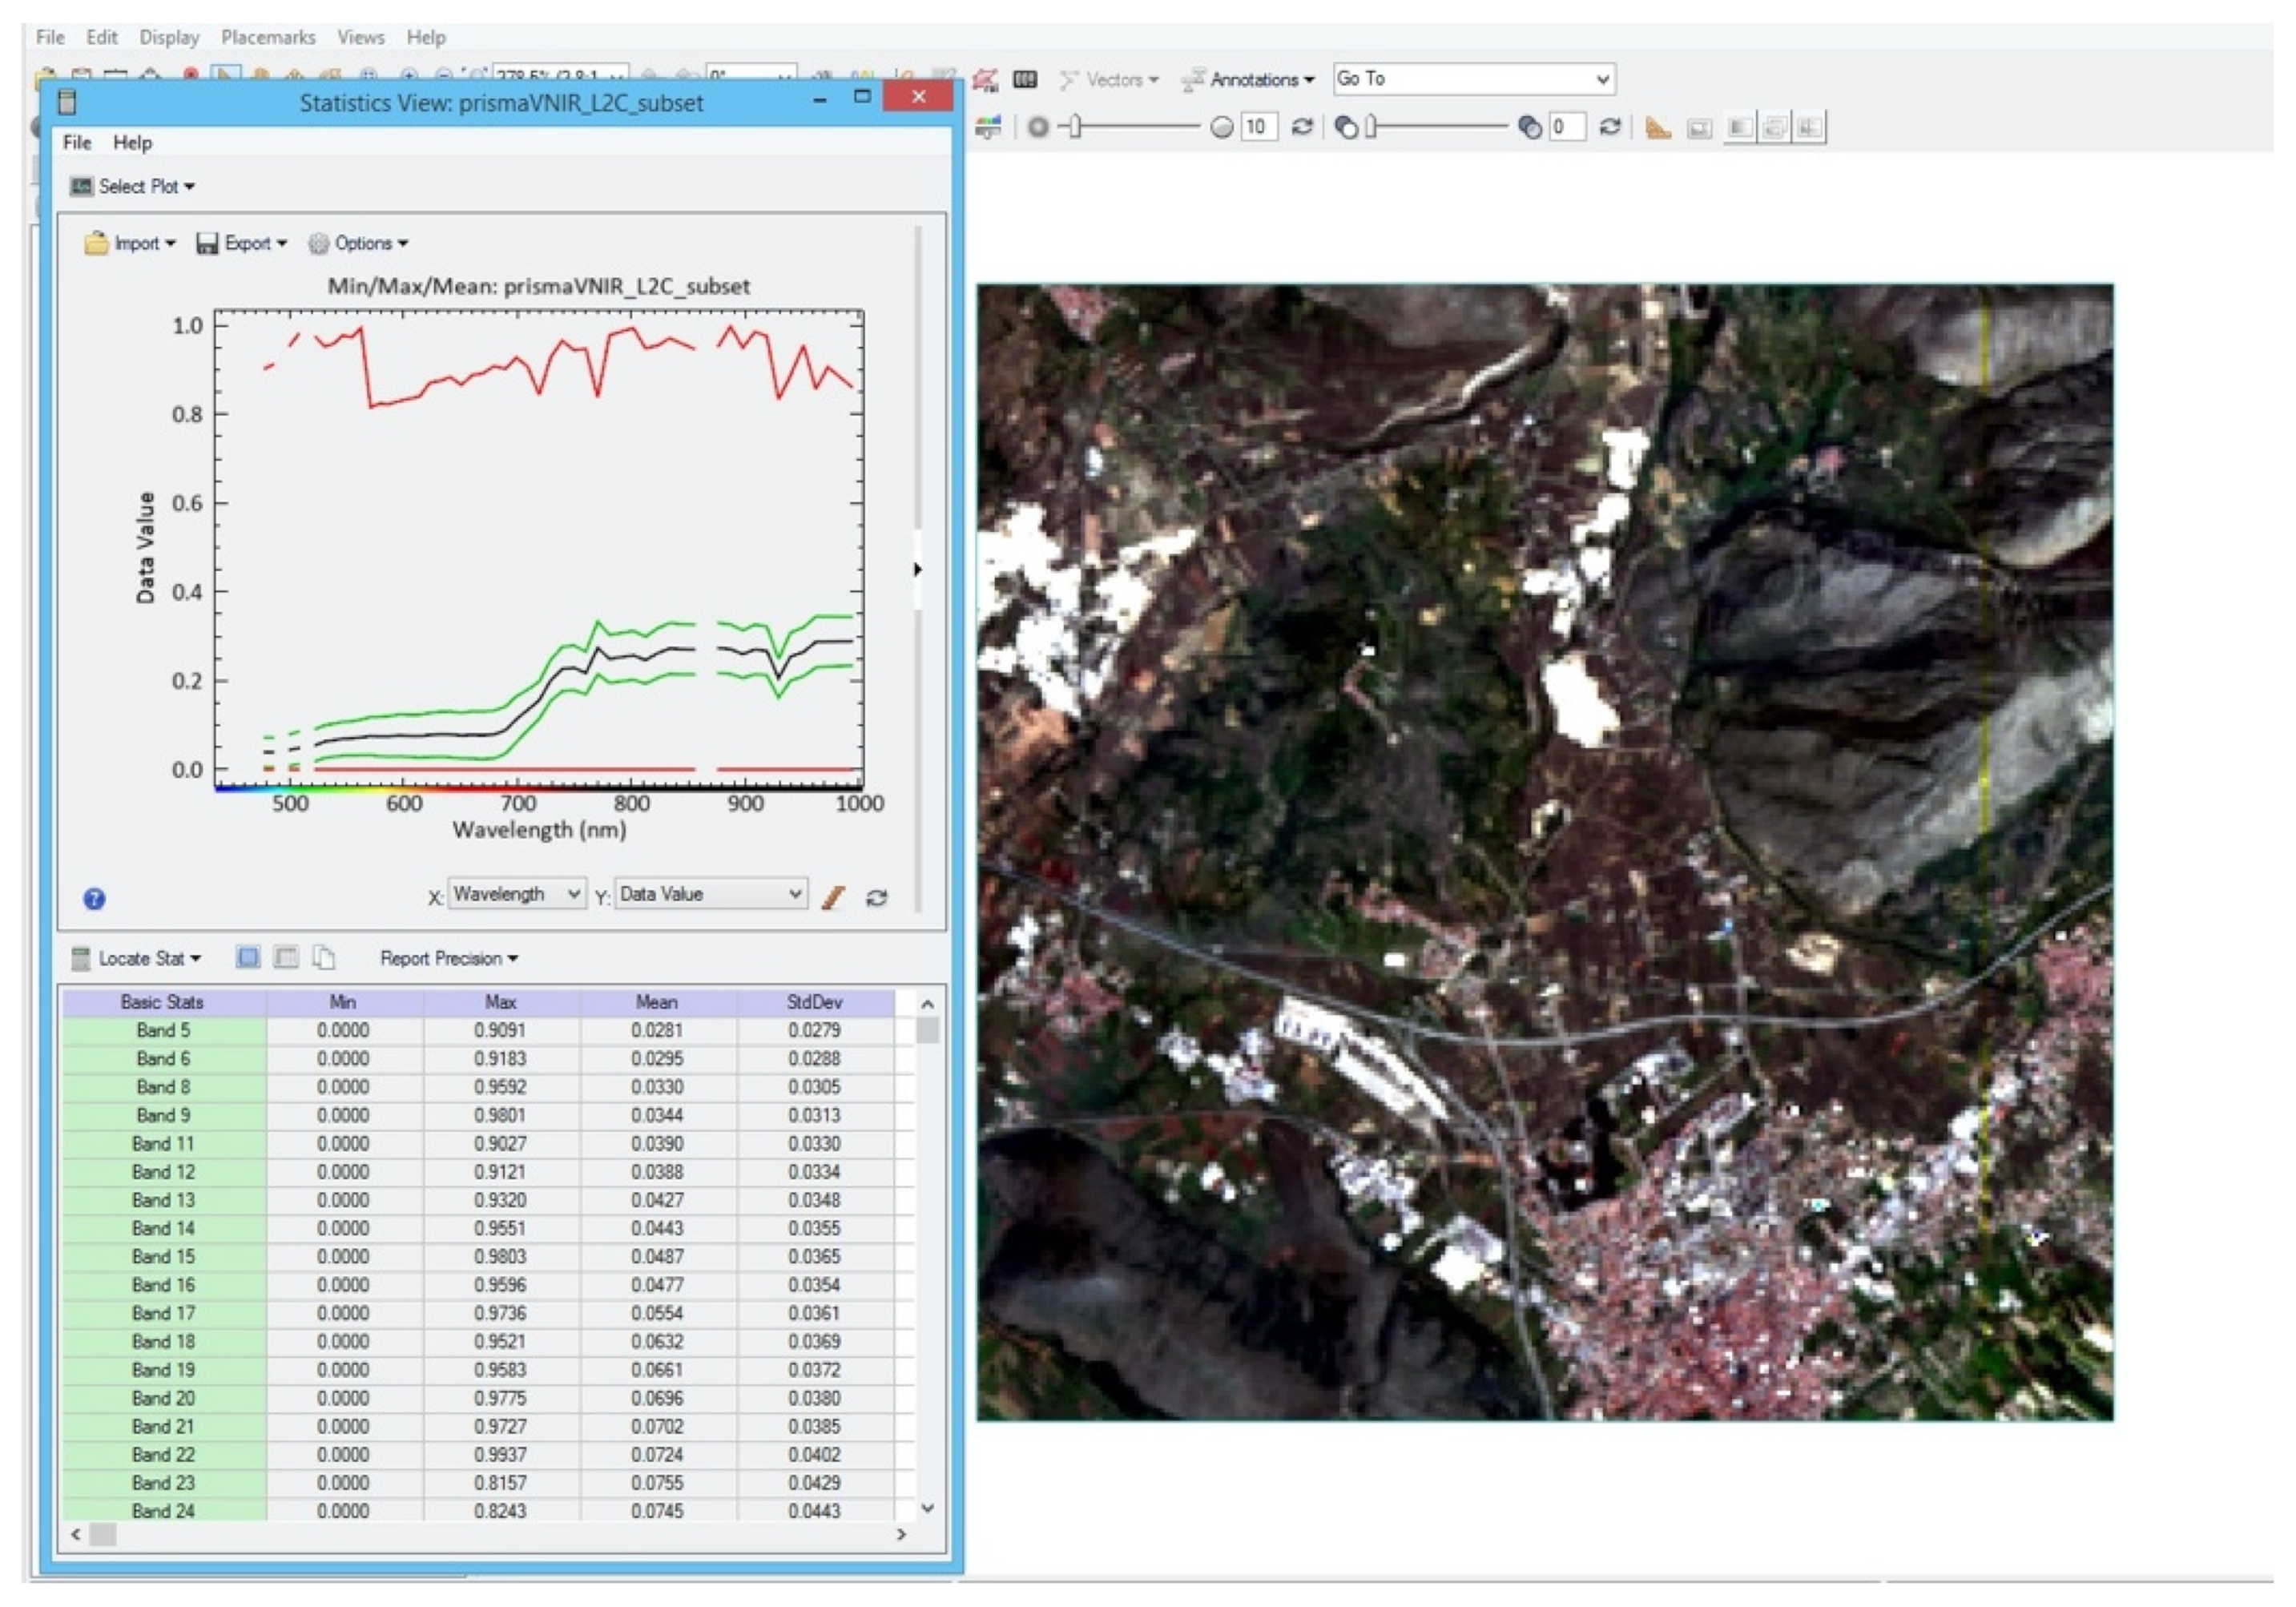
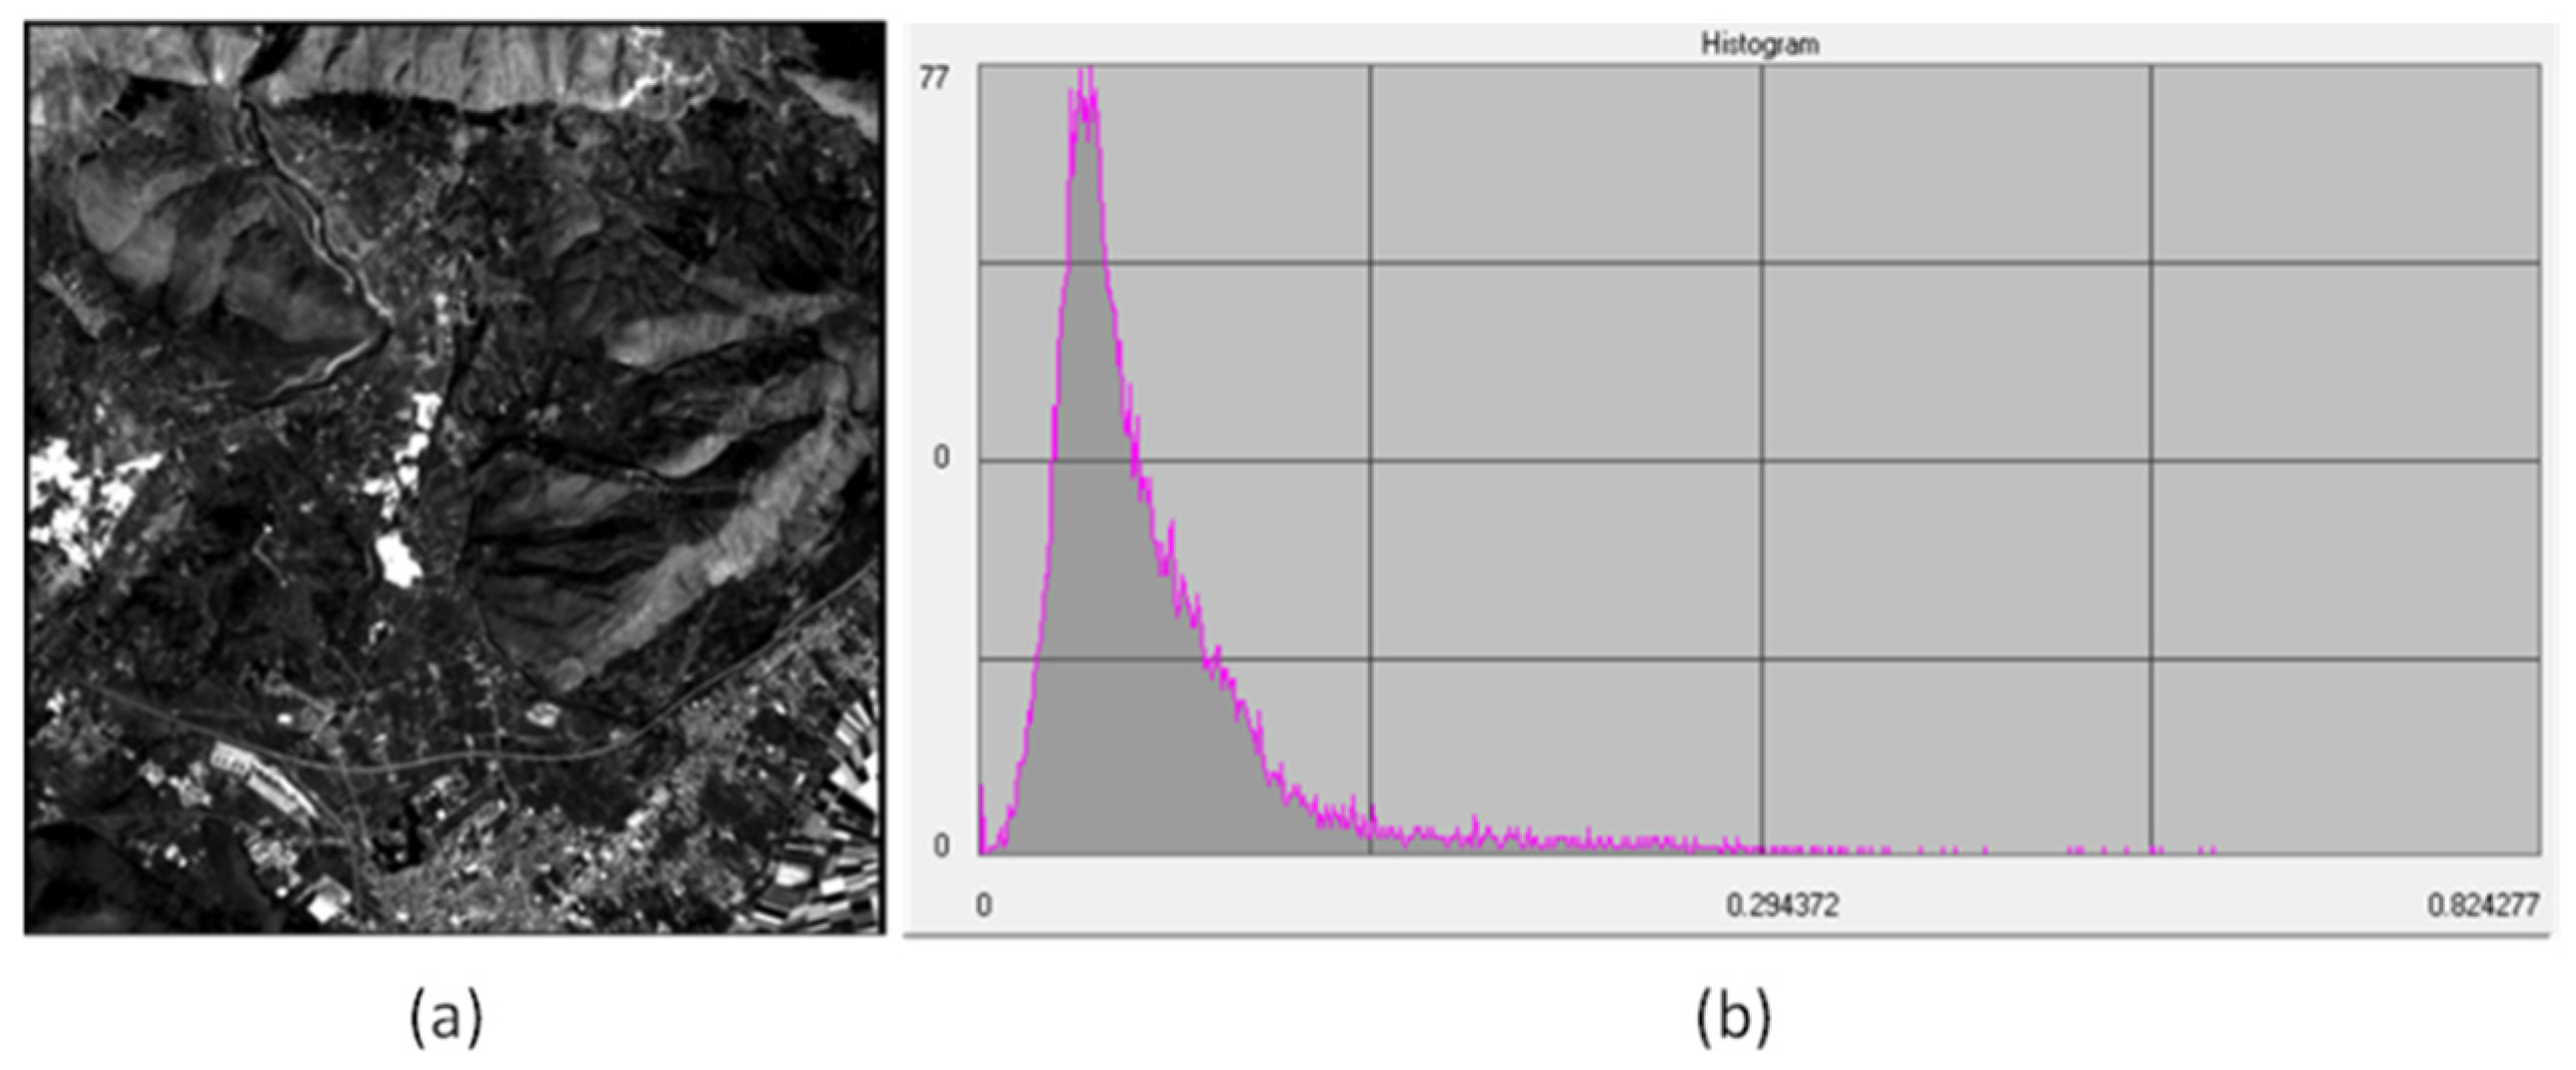
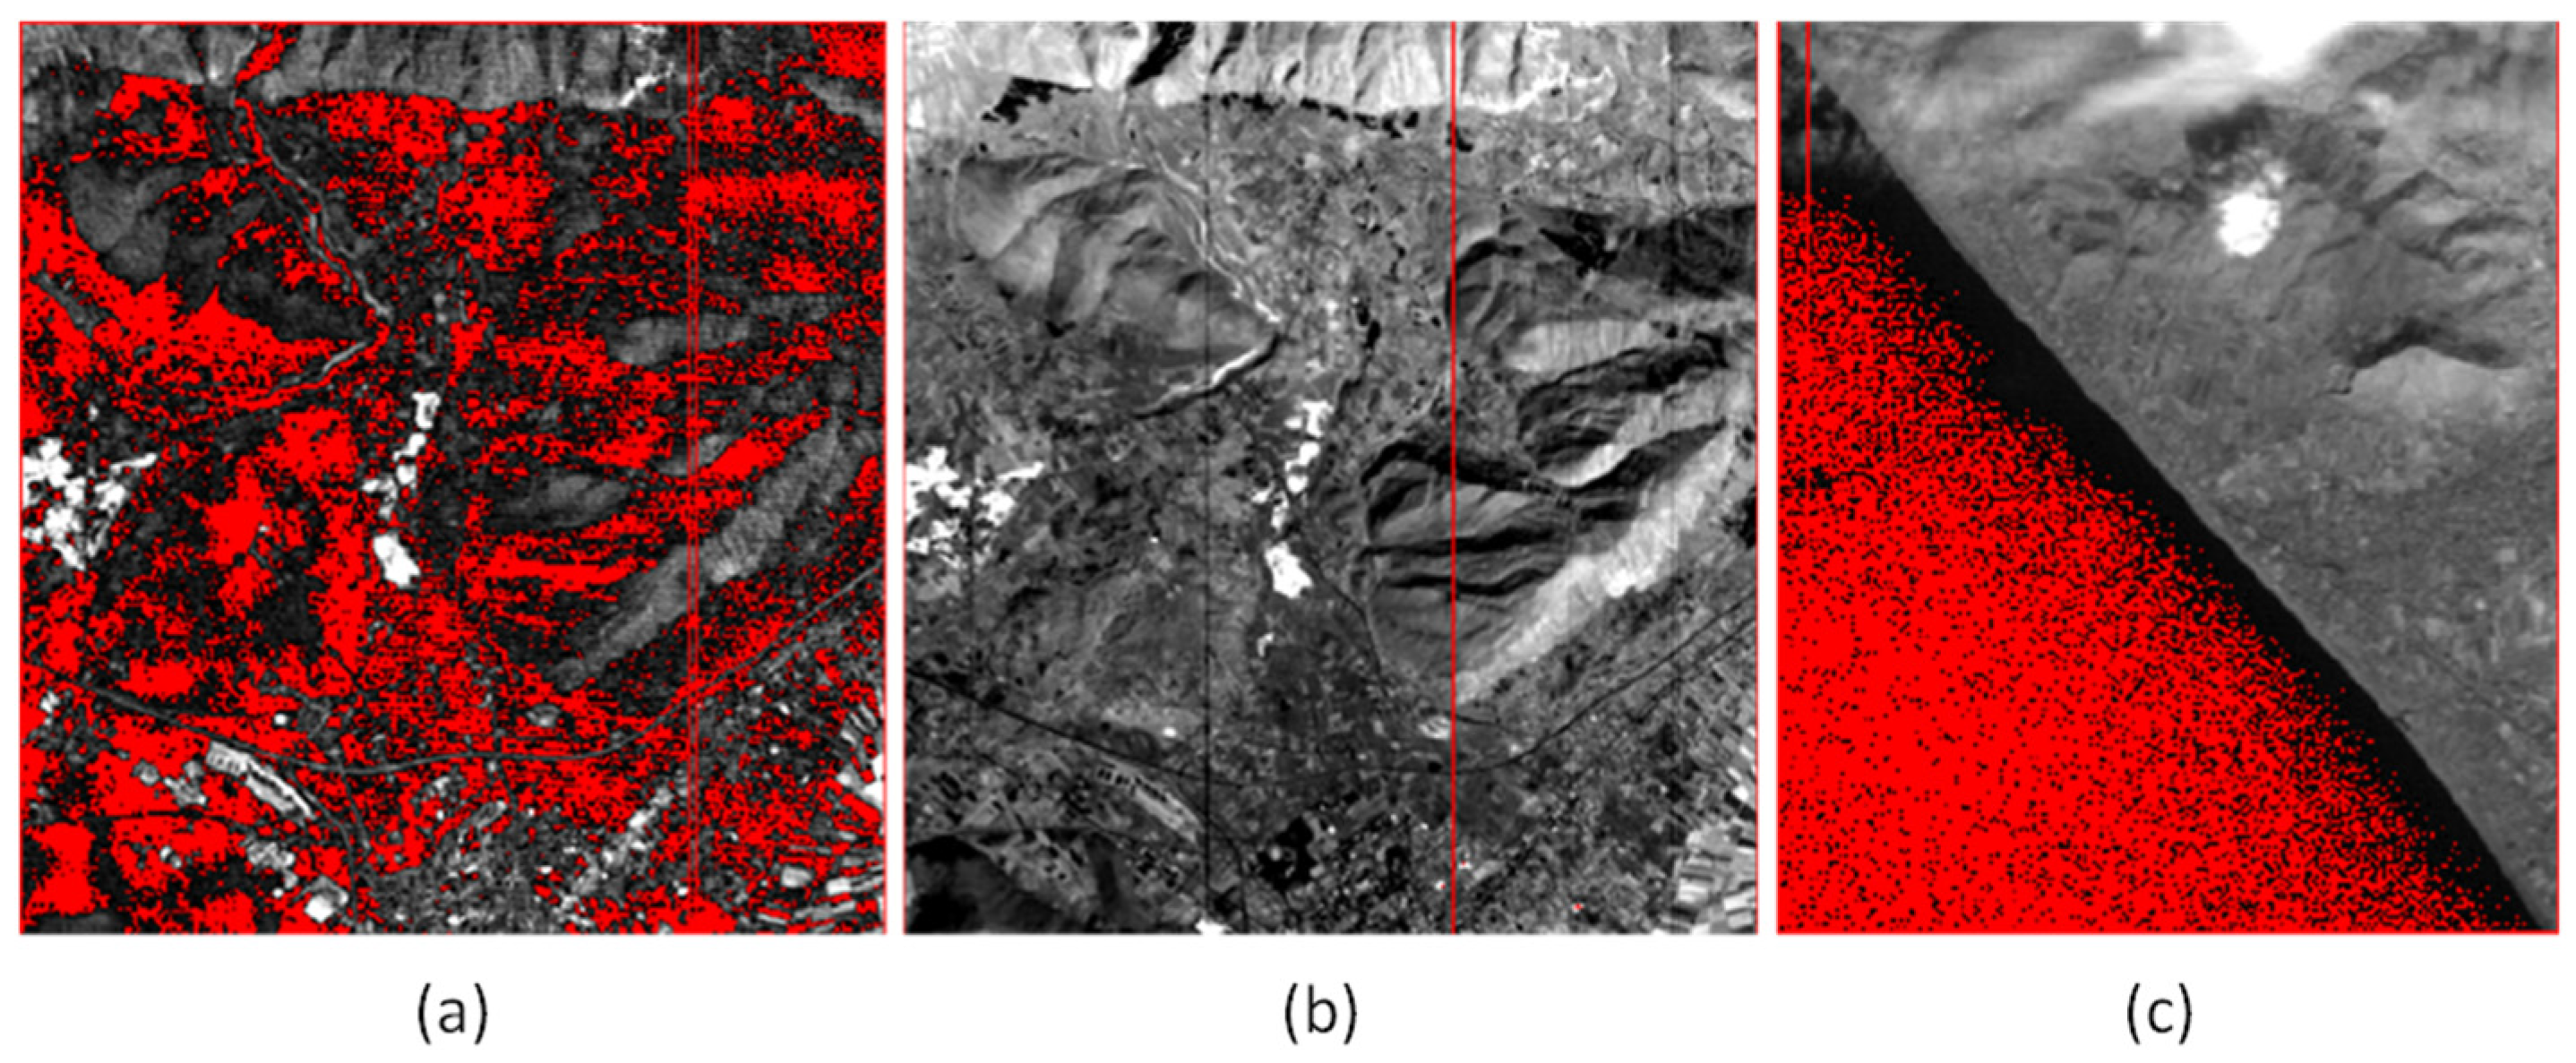
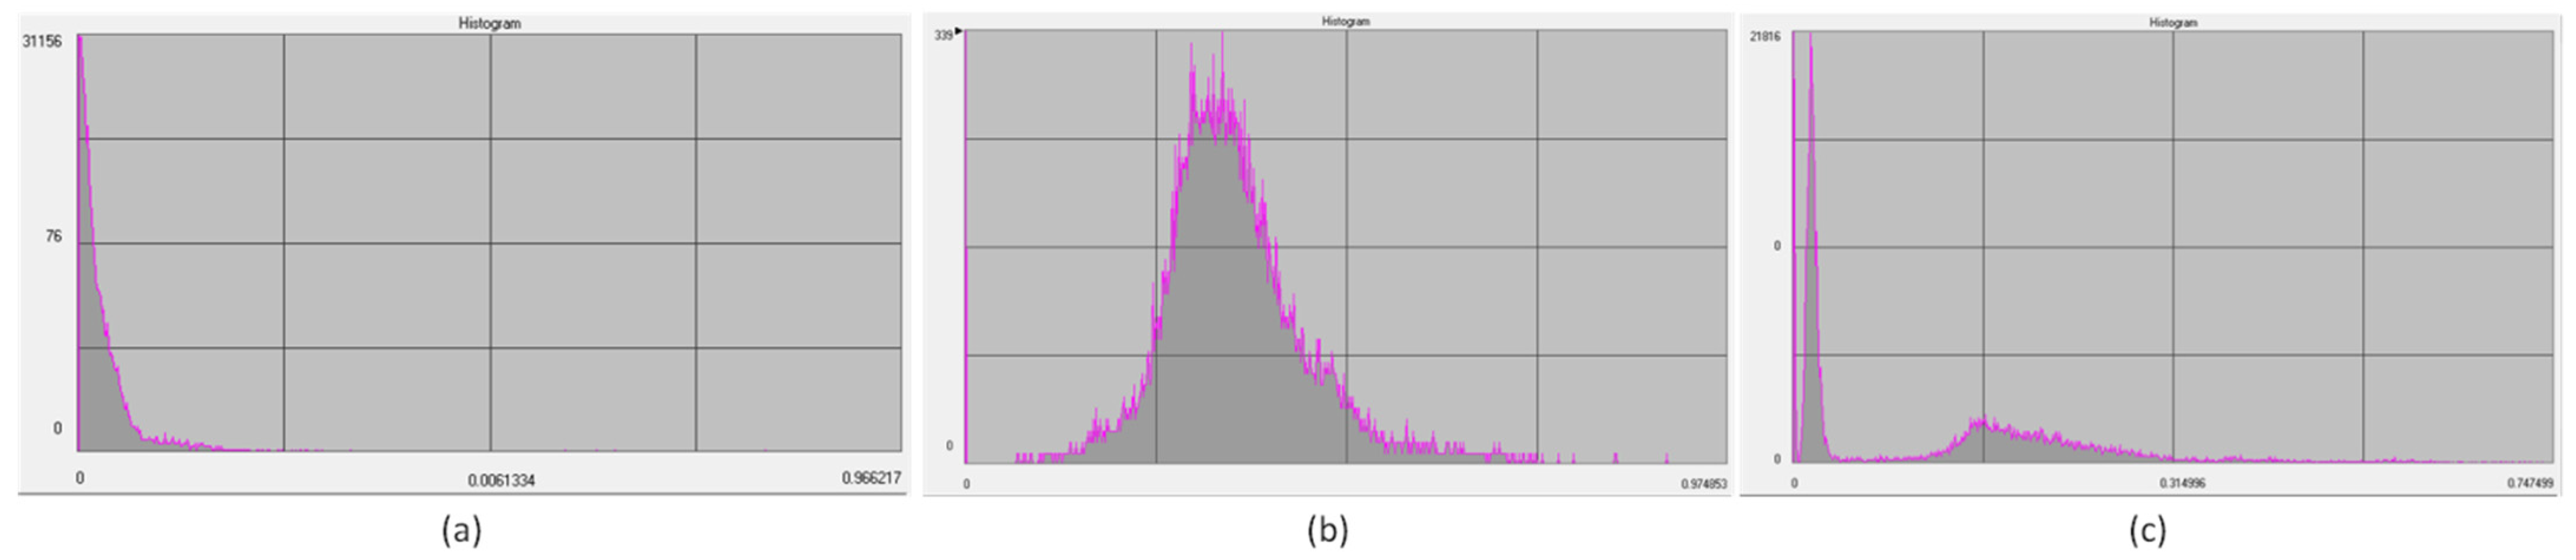
3.1. Bad Bands Evaluation and Noise Removal

Bad bands removal processing is a necessary procedure in the remote sensed data especially in hyperspectral datasets; currently, the most used procedures for removing these bands are related to visual inspections [78] and sensor characteristics [79]. This processing in hyperspectral datasets is complex because of the large bands number; for this reason, a function has been implemented through IDL in the ENVI software that allows for analysis of the hyperspectral cubes and then puts all the bands that have at least one line all at zero or at Not a Number as “bad band”.
In this context, the data cubes VNIR and SWIR have been processed for bad bands extraction (Figure 3).
In the terrestrial archaeological area of Alba Fucens, 9 bands in the VNIR and 52 in the SWIR cubes turned out to be “bad”, while in the Sinuessa marine one, the bad bands were 15 in the VNIR and 34 in the SWIR cube.
The analysis considers the images and the comparison of the histograms between bad and good bands (Figure 4, Figure 5 and Figure 6). The x-axis represents the BOA reflectance value and the y-axis the lowest and the highest number of pixels (frequency) containing the respective reflectance value. Considering Alba Fucens, a “good band” is reported in Figure 4, while a bad band may present many values close to zero or anomalies along the distribution (Figure 6).
In band 2 of VNIR cube, classified as a bad band, the “salt and pepper” effect of the red points shows the lack of data in most of the image (Figure 5a); the relative histogram presents an irregular shape (Figure 6a).
A similar feature can be observed for band 27 of SWIR cube in Alba Fucens (Figure 5b), where the image seems to be good, except for a few lines, but the relative histogram (Figure 6b) presents a lot of noise.
The band 61 of the Sinuessa VNIR cube is shown in Figure 5c. In this case, the characteristics of the coastal continental area can be discerned; in the sea the infrared does not penetrate and does not allow to study the submerged archaeological site which, moreover, remains invisible due to the presence of widespread turbidity in the coastal waters. The histogram shows an almost flattened graph with high dispersion (Figure 6c).
The red dots and lines in Figure 5 represent the bad bands, where pixels have one line all at zero or Not A Number.
To conclude, bands having extreme noise with the typical “salt and pepper” effect, irregular histogram and lack identifiable features, are present.
In order to improve some bands quality, an algorithm for noise removal was implemented (Figure 7).
The hyperspectral remote sensing is based on the measurement of the dispersion and reflection of the electromagnetic signals from the earth’s surface emitted by the sun. The radiance received at the sensor is usually degraded by atmospheric effects and instrumental noise.
In PRISMA datasets there are two main noise sources: the presence of missing lines in multiple bands and the presence of “Gaussian Noise like” strongly corrupting the far-end part of the SWIR data cube.
The effects of the noise and the denoising pre-processing on the images and on their histograms are reported in Figure 7 and Figure 8, respectively.
In Figure 8a the restoration of the missing line in the image of Figure 7a can be clearly appreciated. Comparing Figure 7b and Figure 8b, it can be noticed how much the noise corrupted the signal and how much the application of the denoising algorithms managed to enhance the useful information: the shape of the signal could be guessed in the pre-processed histogram, but it is covered by the strong noise, while in the post-processed one, it is clear. Reducing the effects of both the noise sources was critical for two main reasons:
  • The bad bands selection process automatically eliminates all the images with missing lines, but some bands were carrying good information despite of this. Line restoration allows us to use more bands with potentially useful information that would otherwise be discarded;
  • Most of the bands corrupted by the Gaussian Noise were placed in the far-SWIR part of the spectrum, making every band above SWIR 140 (2.27 um) unserviceable, cutting out a spectrum portion useful for soil characterization which is not frequently included in other multispectral or hyperspectral sensors.

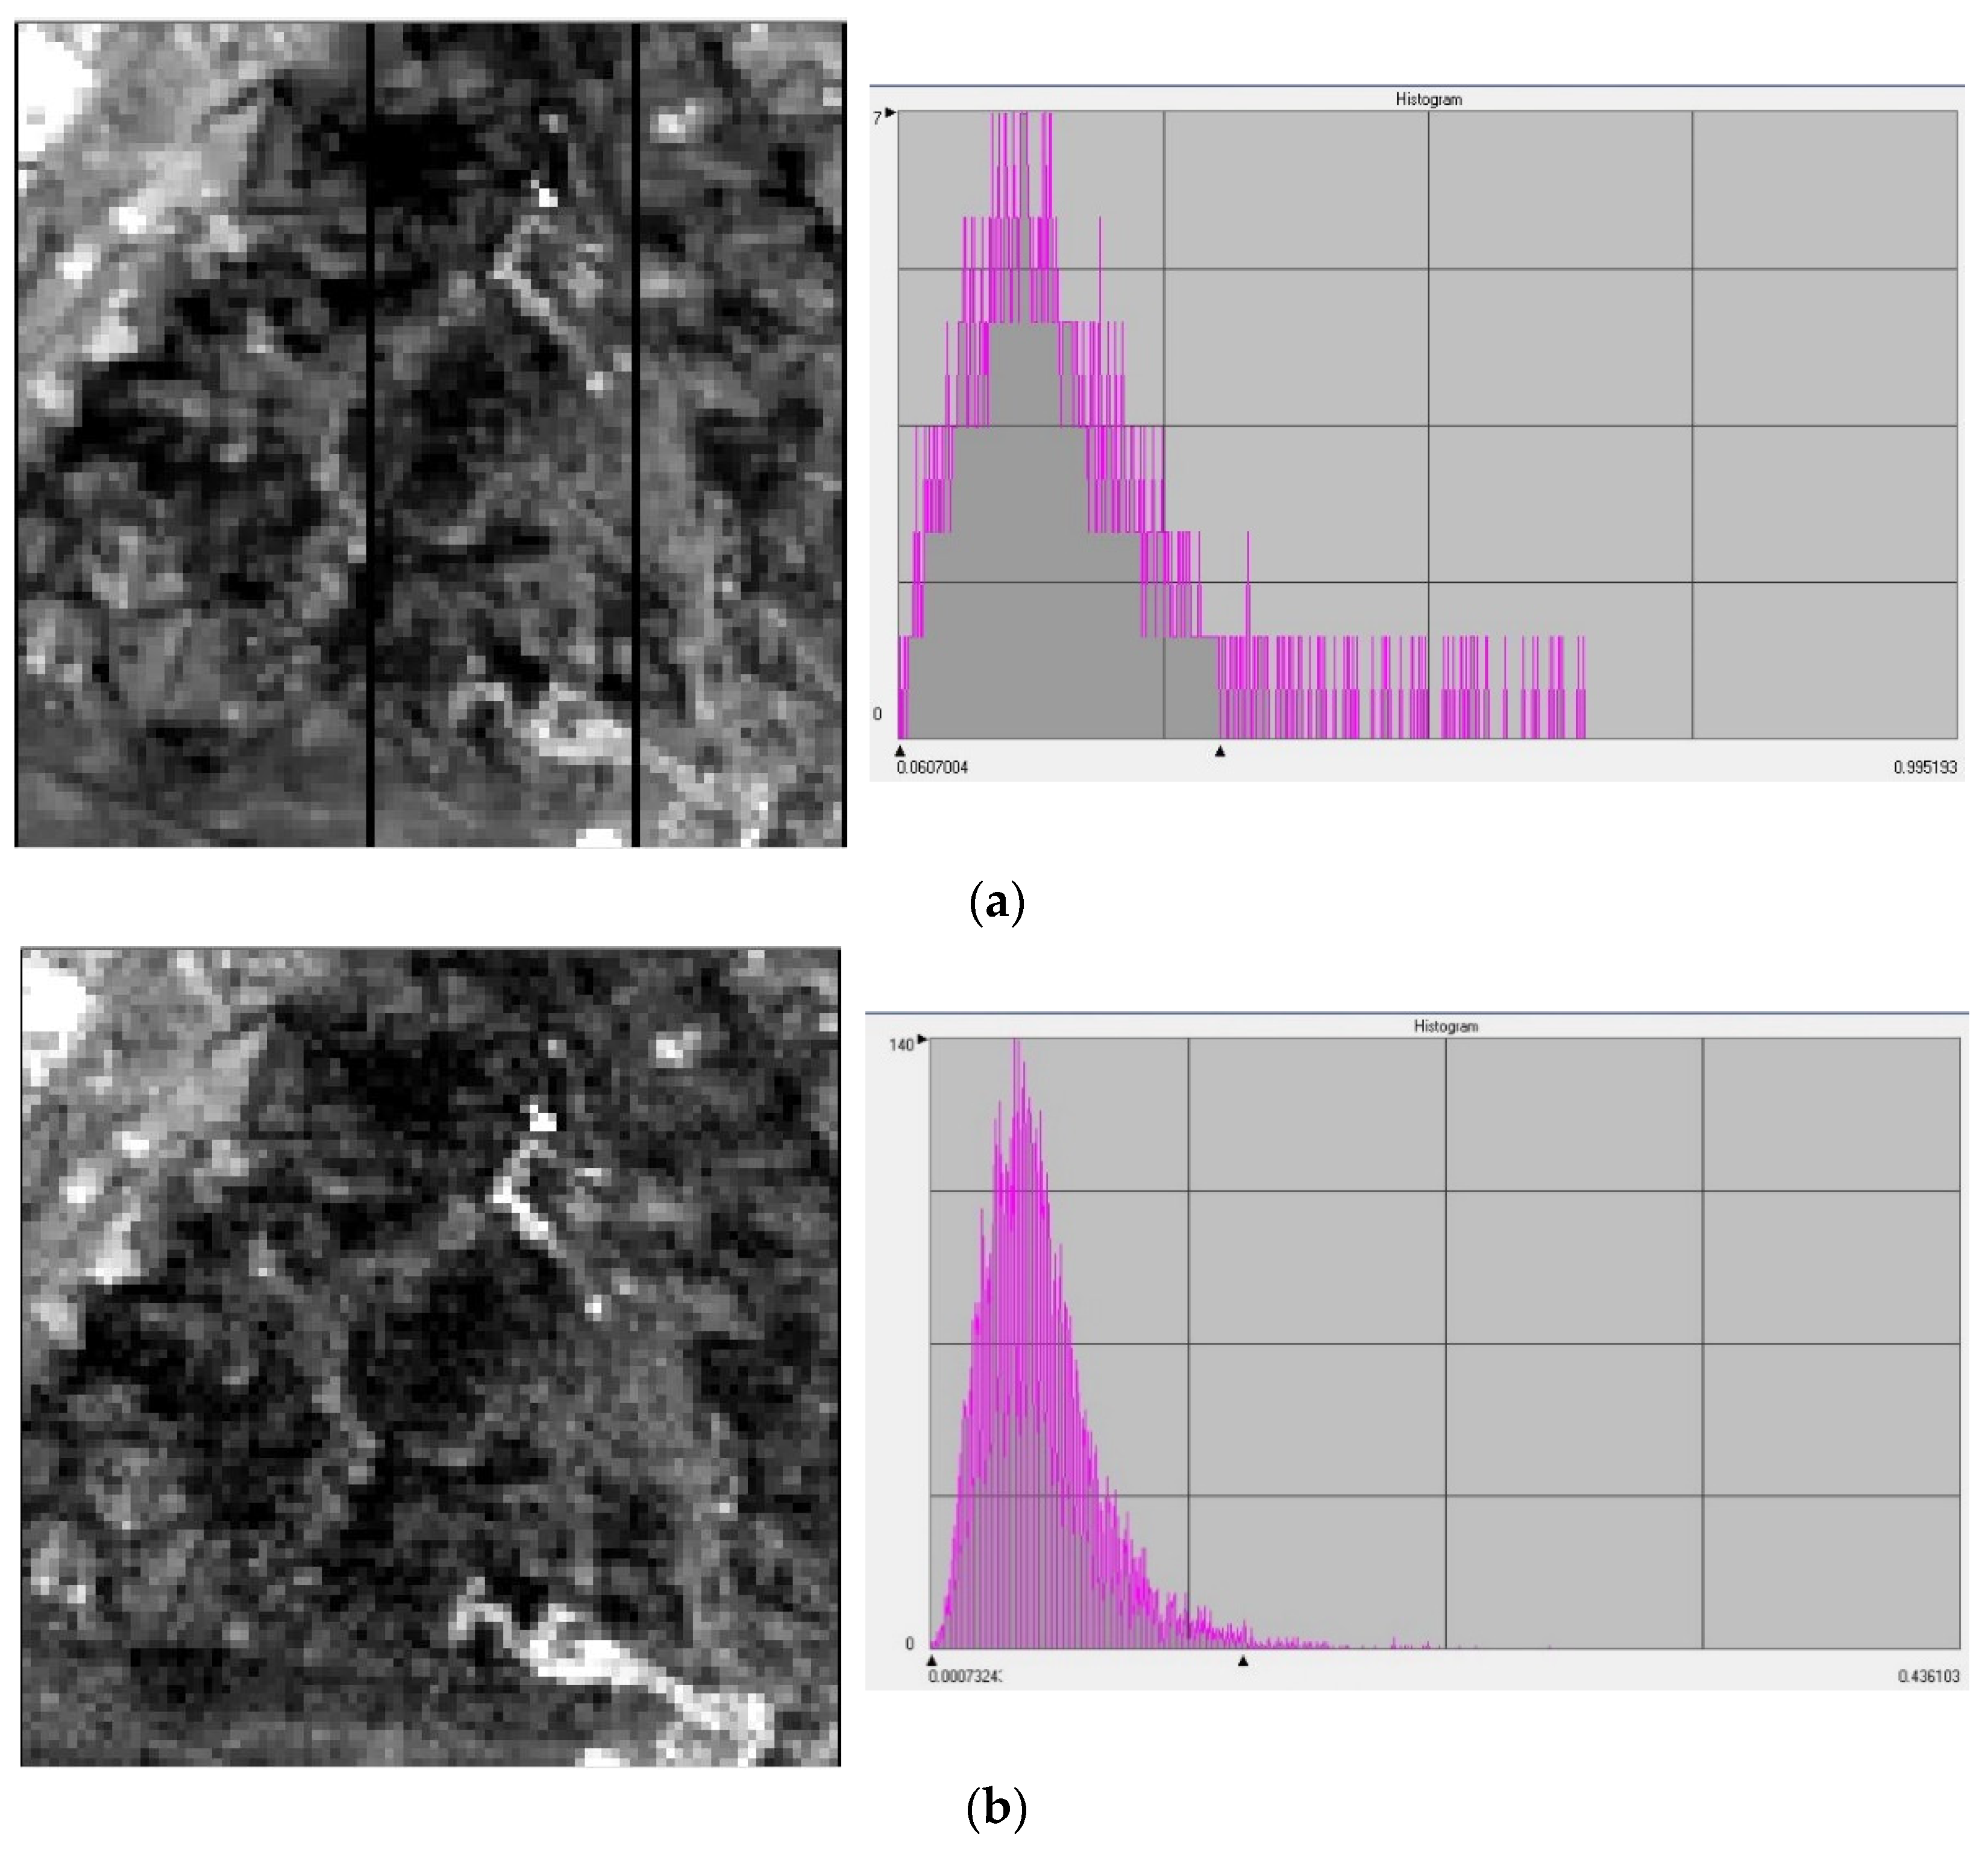
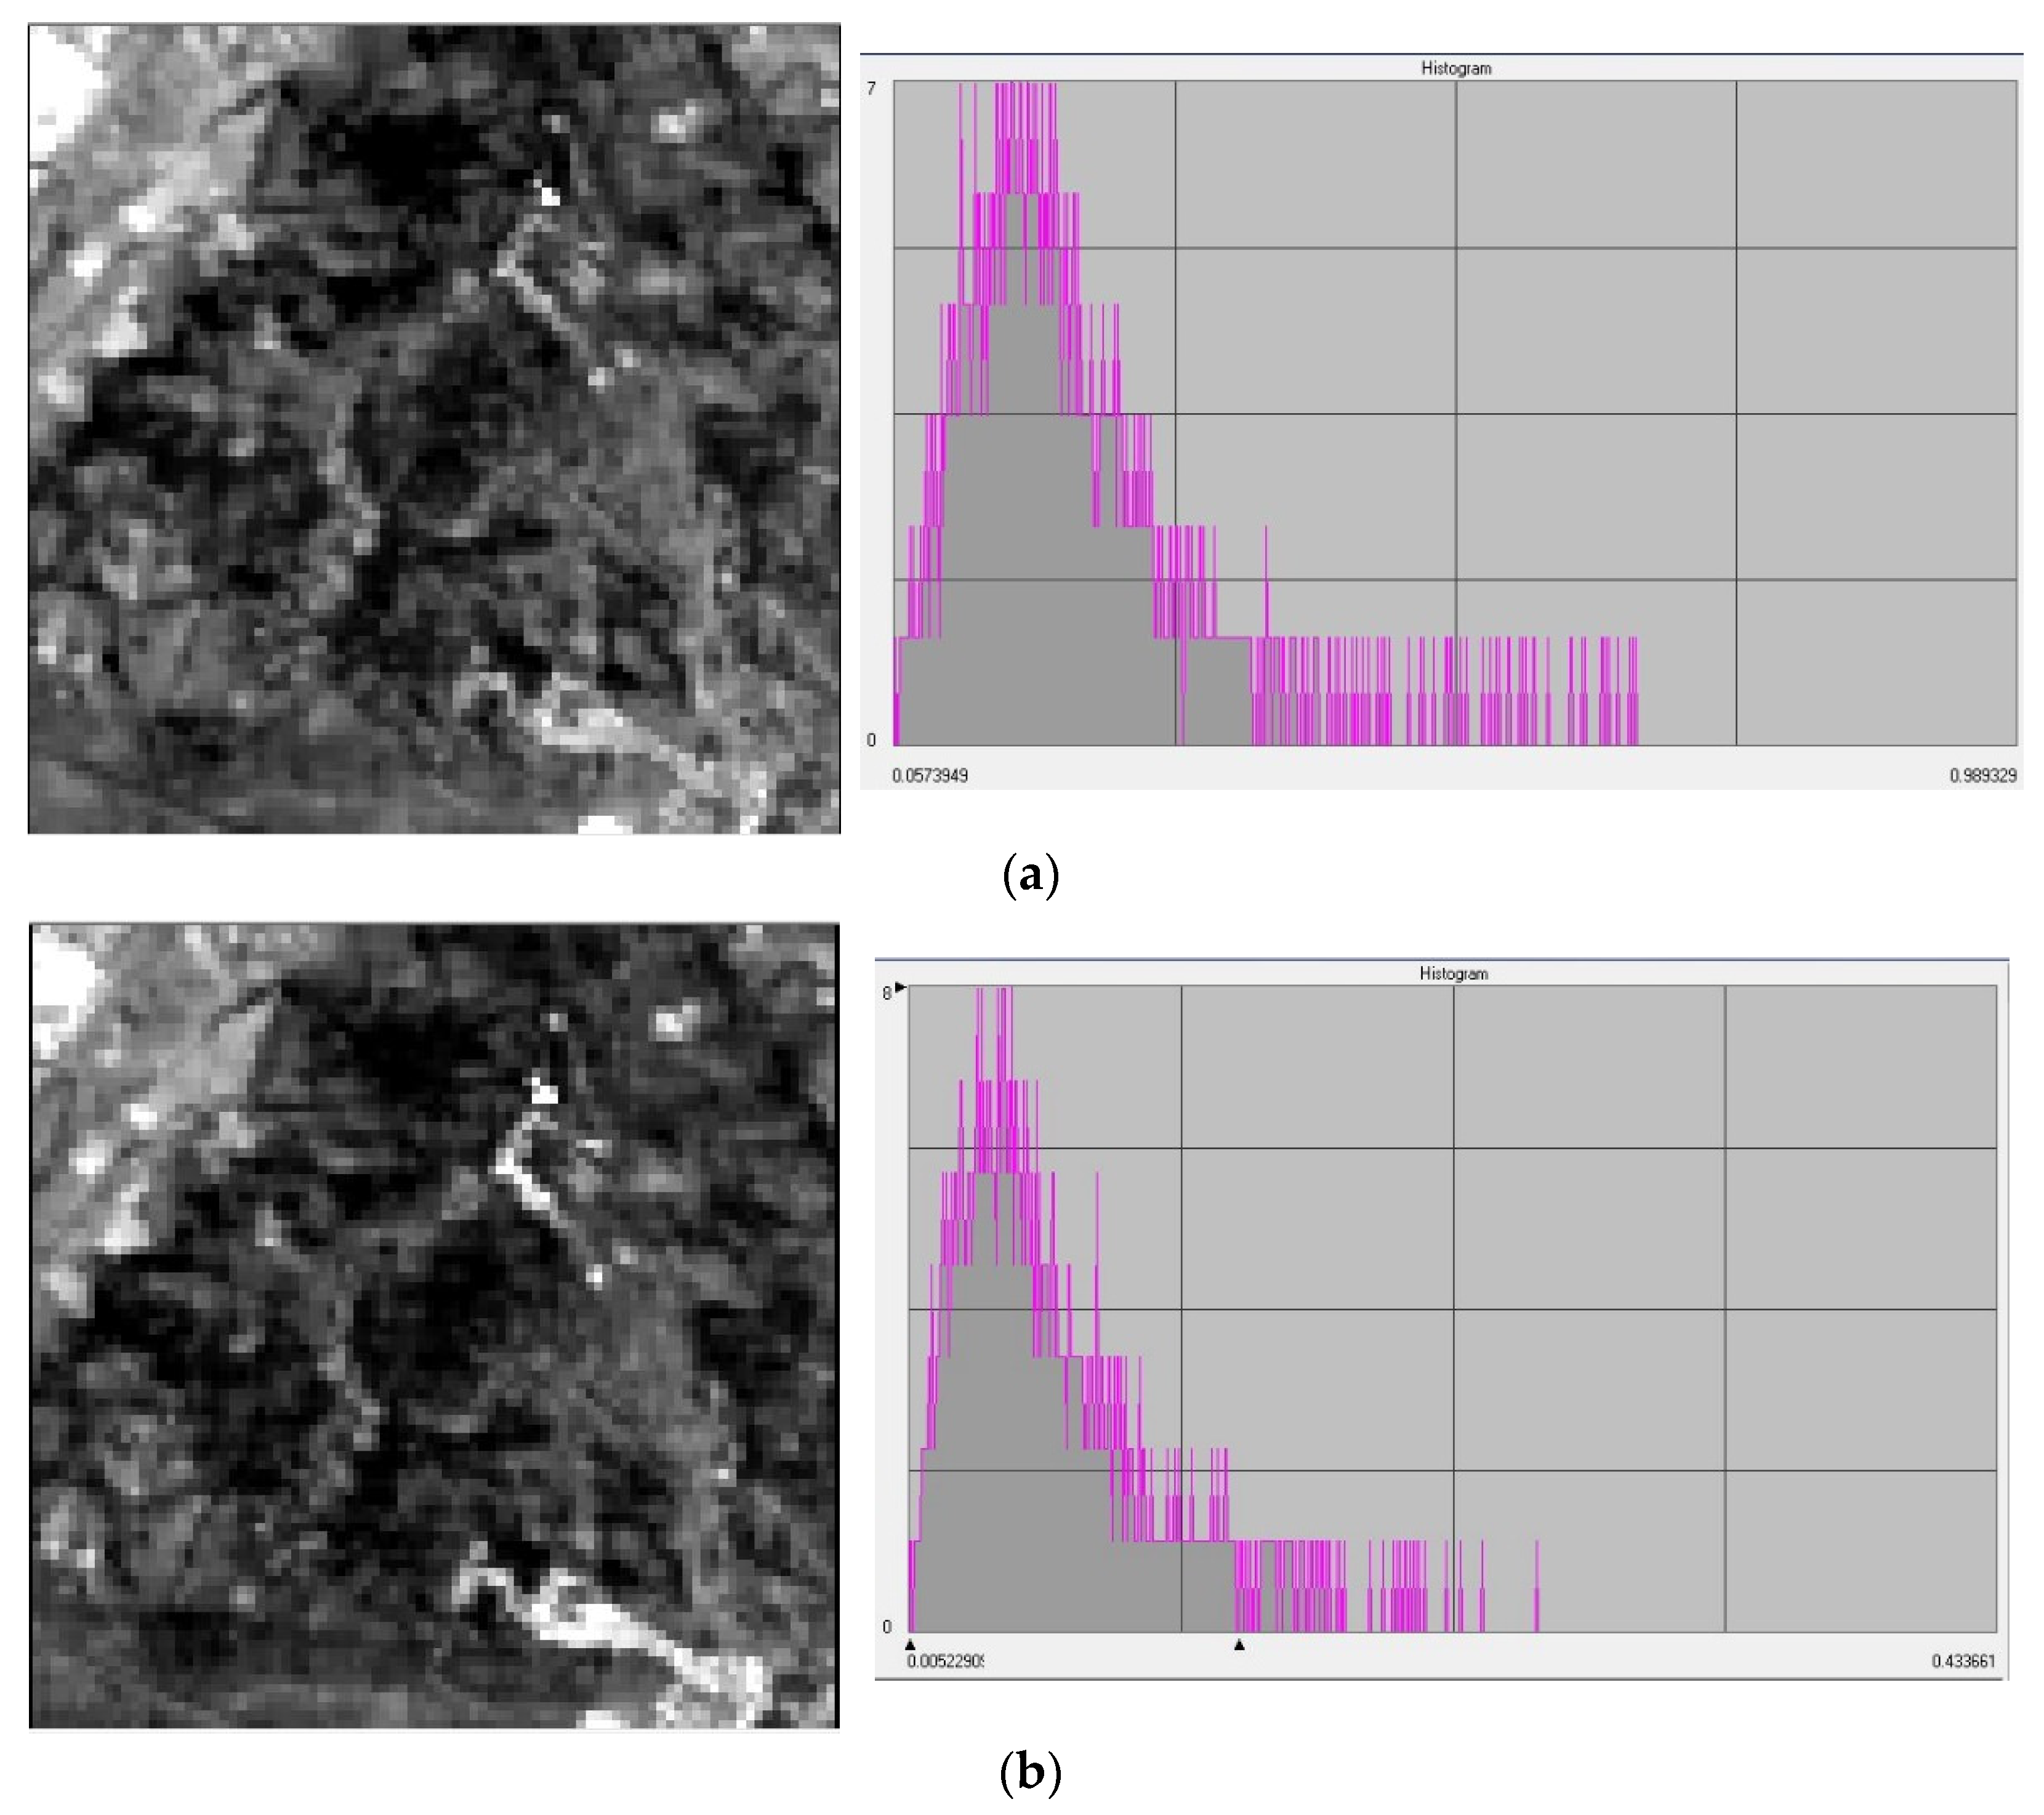
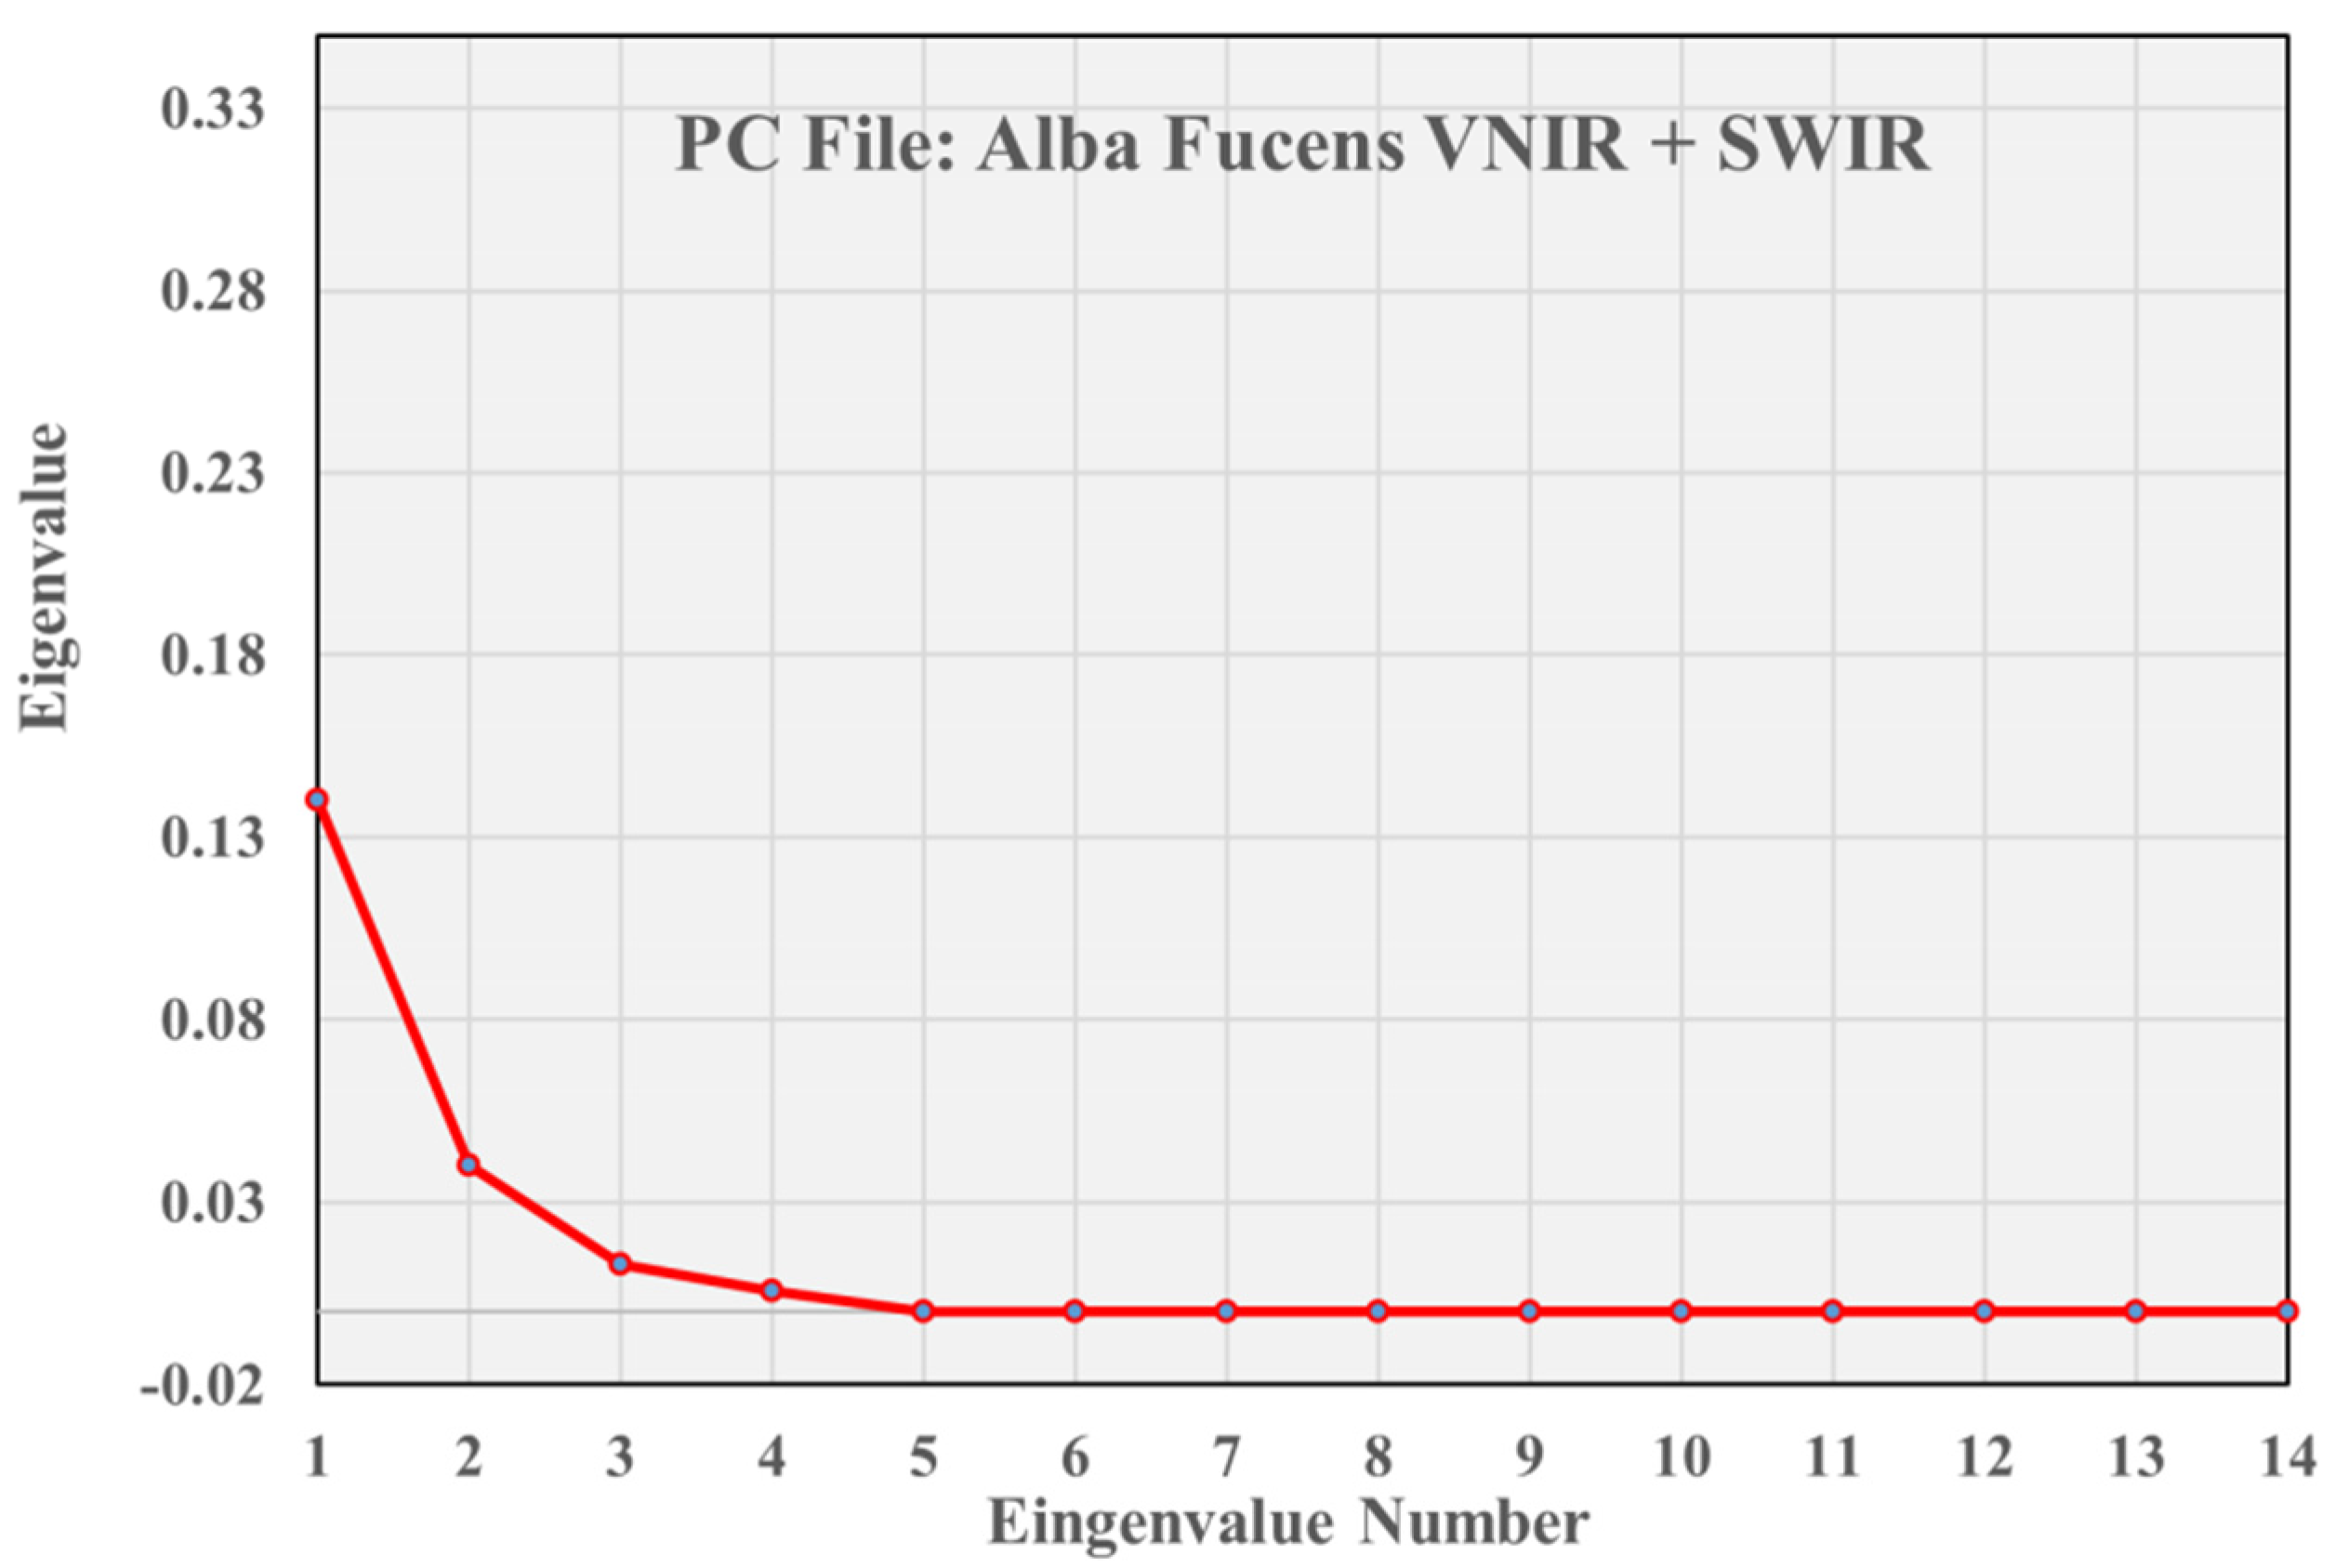
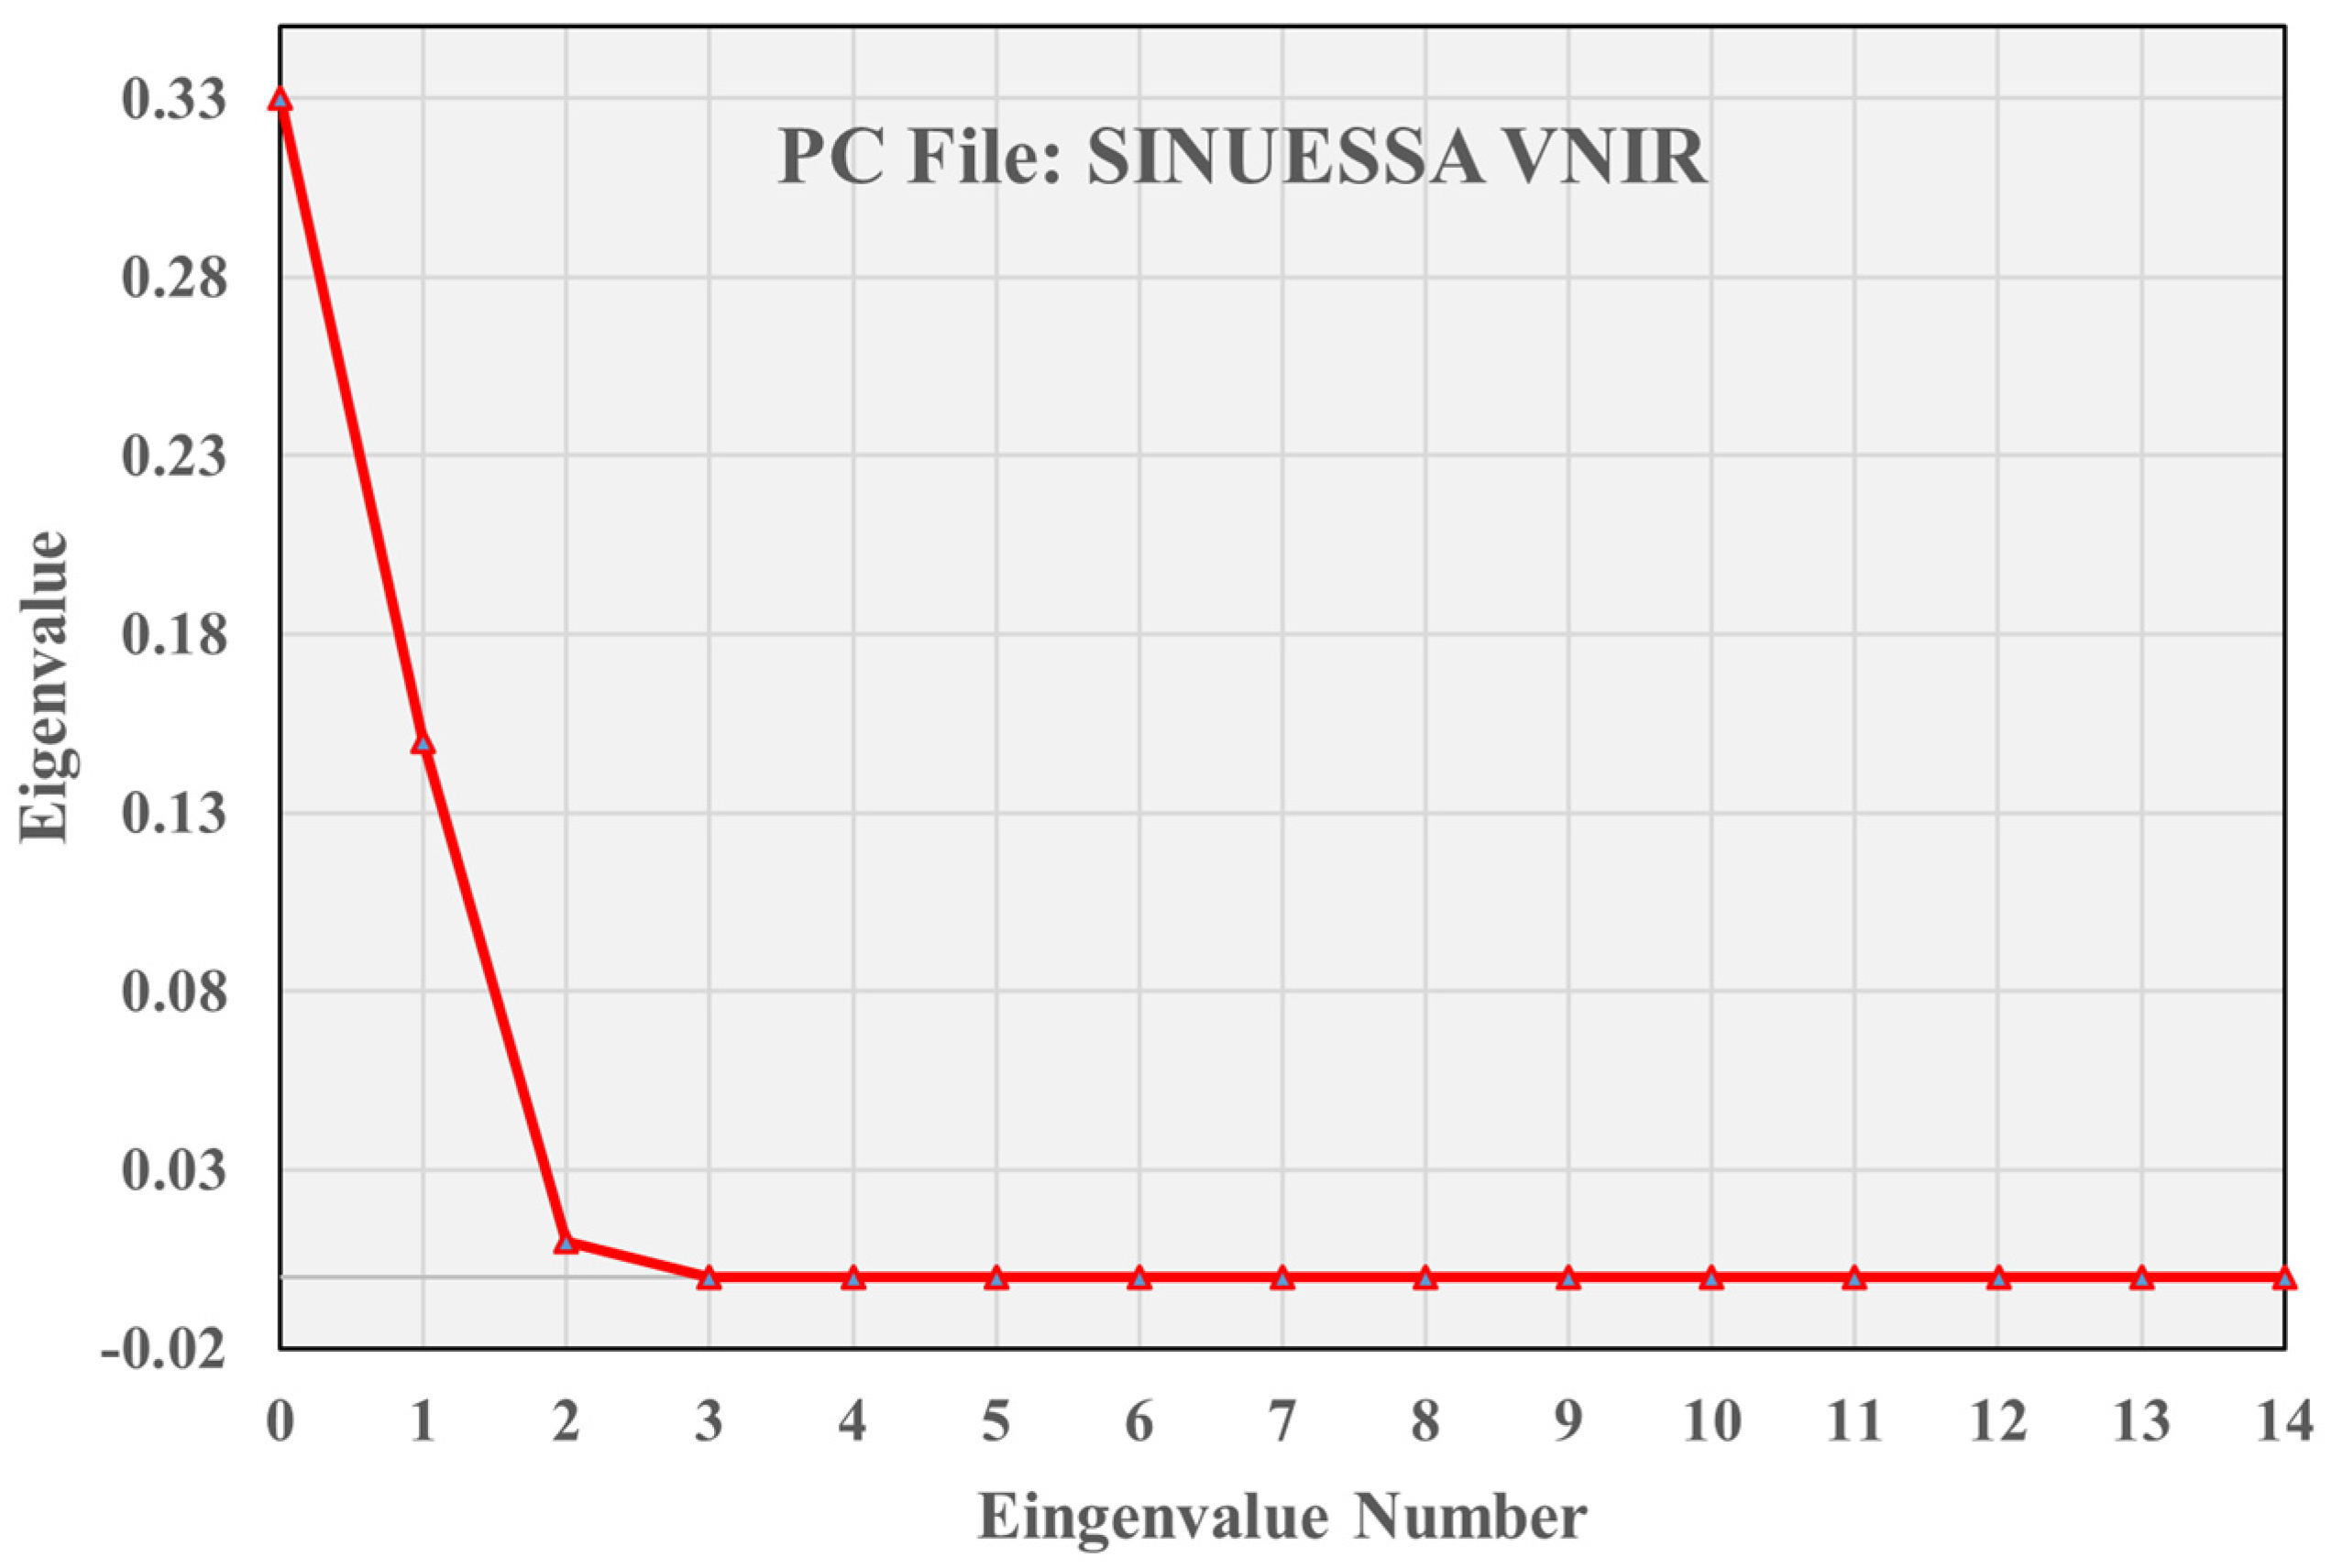
3.2. Principal Component Analysis

The new VNIR datasets obtained from the bad bands’ elimination procedure were subjected to PCA, in order to obtain a statistical distribution of the less correlated bands. The PCA plot of the Alba Fucens PRISMA dataset shows that the information is concentrated in the first four components (Figure 9). In the Sinuessa coastal area, the PCA analysis (Figure 10) shows the information concentrated in the first three components. Only the VNIR dataset was processed for both the test sites, as it provides most of the information in carbonatic areas and it contains the wavelengths that penetrate into the water column.
Alba Fucens’ results are reported in Figure 11, where the PCA highlighted how the transformed spectral information is concentrated in the first four PCs; moreover, the PCA shows how from the PC-5 (VNIR) the displayed information becomes difficult to be interpreted and after PC-10 it can be directly assimilated to noise.
In application contexts, the PCA highlight elements or details not visible in the original image; in this approach, the PC-1, PC-2 and PC-3 on PRISMA VNIR highlight, in the central area of Alba Fucens, a structurally different soil compared to the surrounding (Figure 12). This could be related to the presence of further buried structures.
Relatively to Sinuessa, the PCA in the VNIR PRISMA dataset highlighted the geo-morphological characteristics of the study area (Figure 13) in the continental zone, the whole northern ignimbritic domain; moreover, along the coast, emerged and submerged morphology are clearly distinguishable (in sequence: emerged beach, submerged beach, submerged bar).
The turbidity is well featured in the spectral processing and it is linked to the presence of channel outlets into the sea and relevant sediment input from Garigliano River (north of Sinuessa). At the moment, the dataset is not able to provide information on the submerged structures of Sinuessa, due to the presence of this turbidity which alters the clarity of the water and the penetration of the signal into the water column. Other comparisons are not actually possible because subsequent images in PRISMA Data Hub are not available. The PCA analysis, however, gave information on the turbidity and on the submerged and emerged sedimentary features (Figure 13).

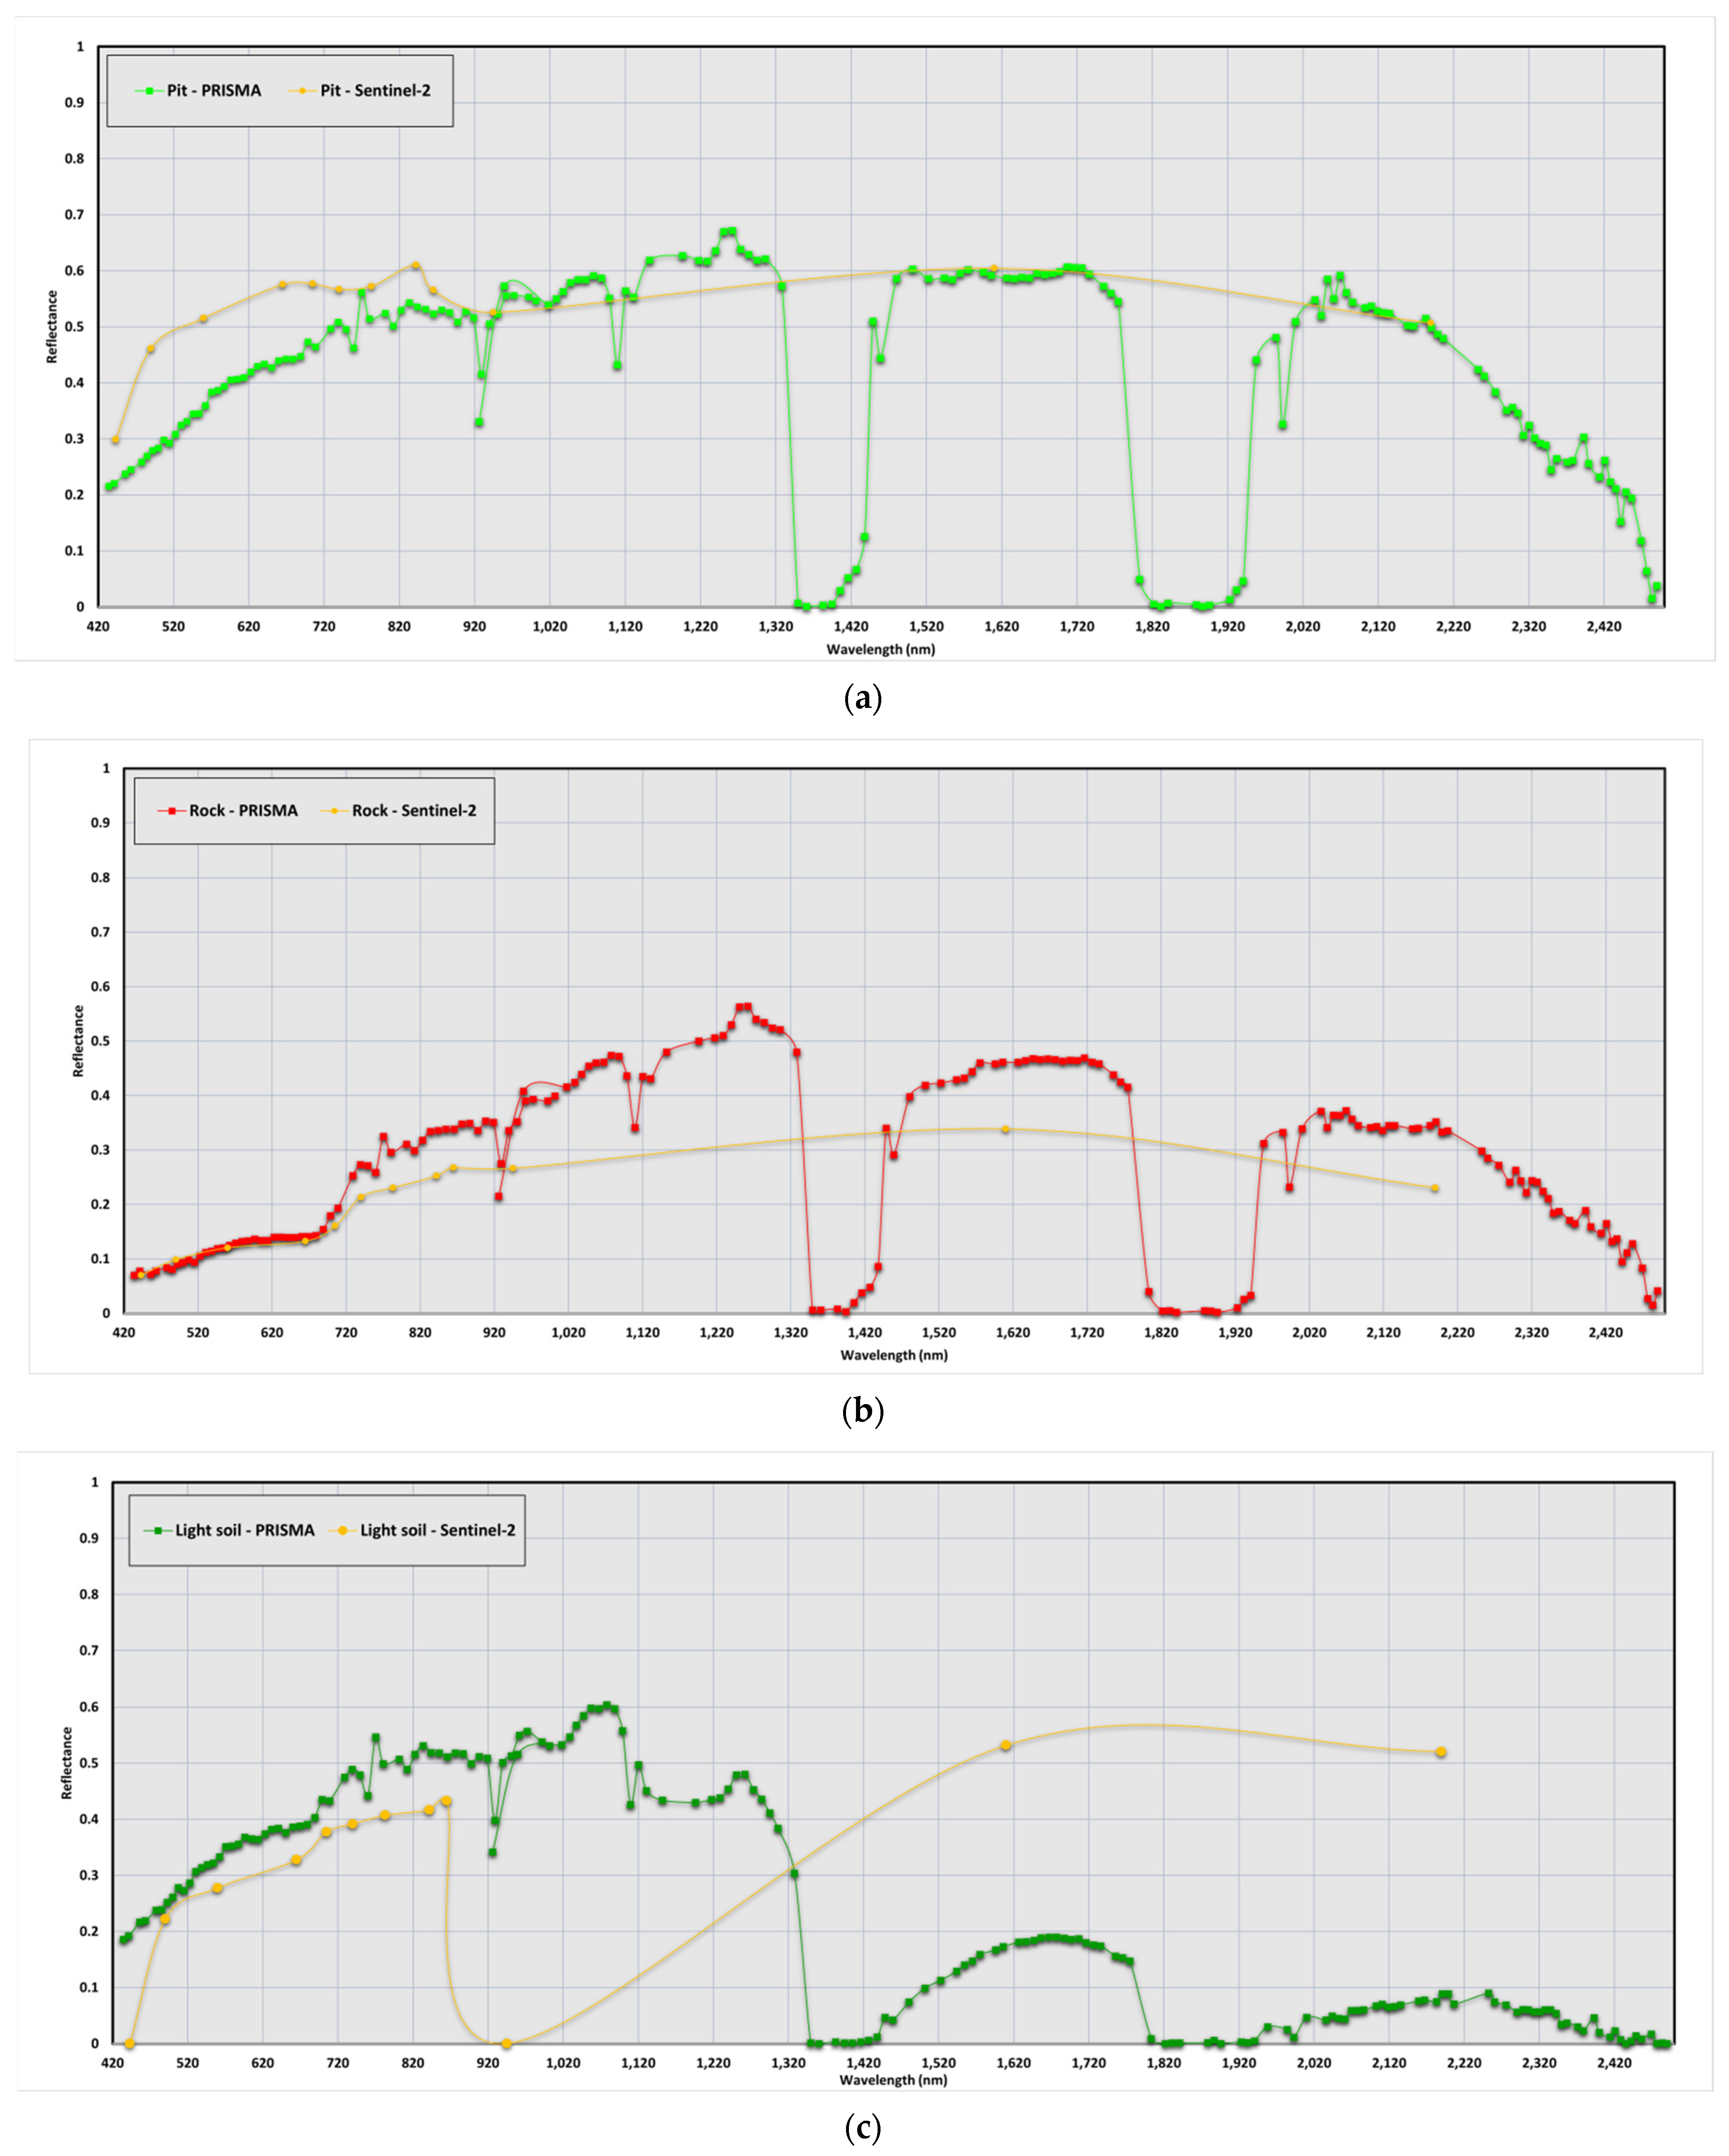
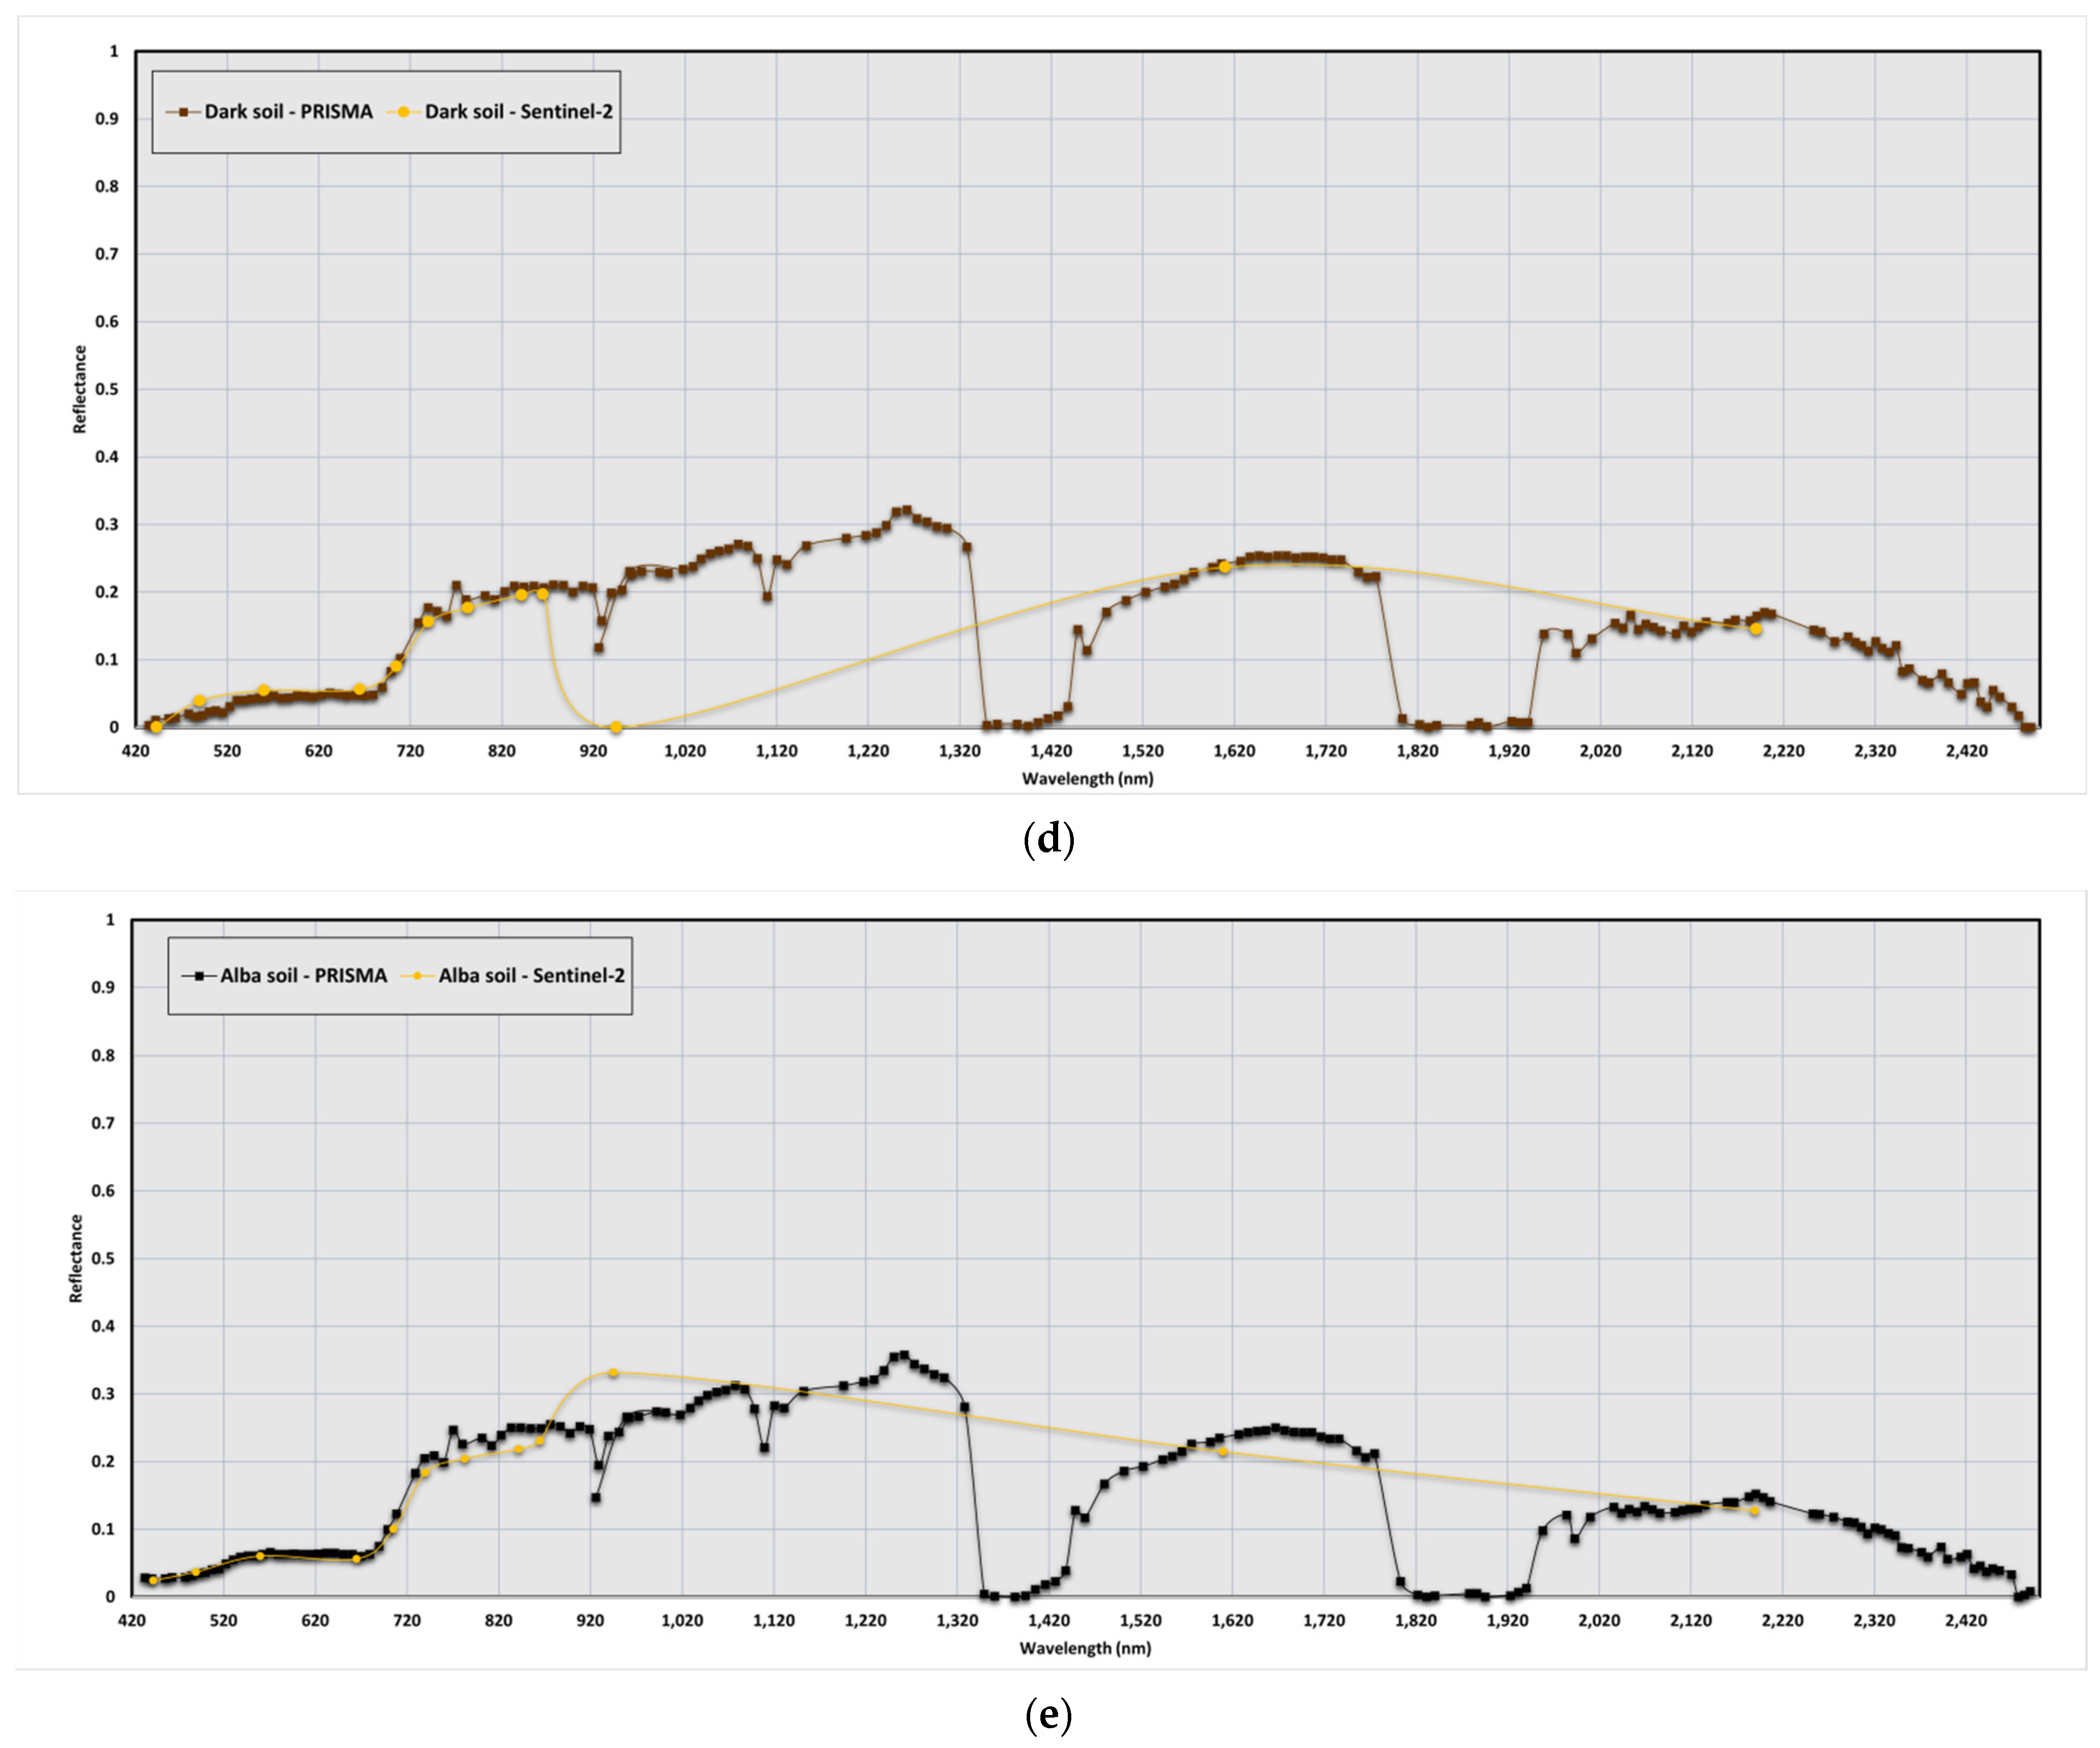
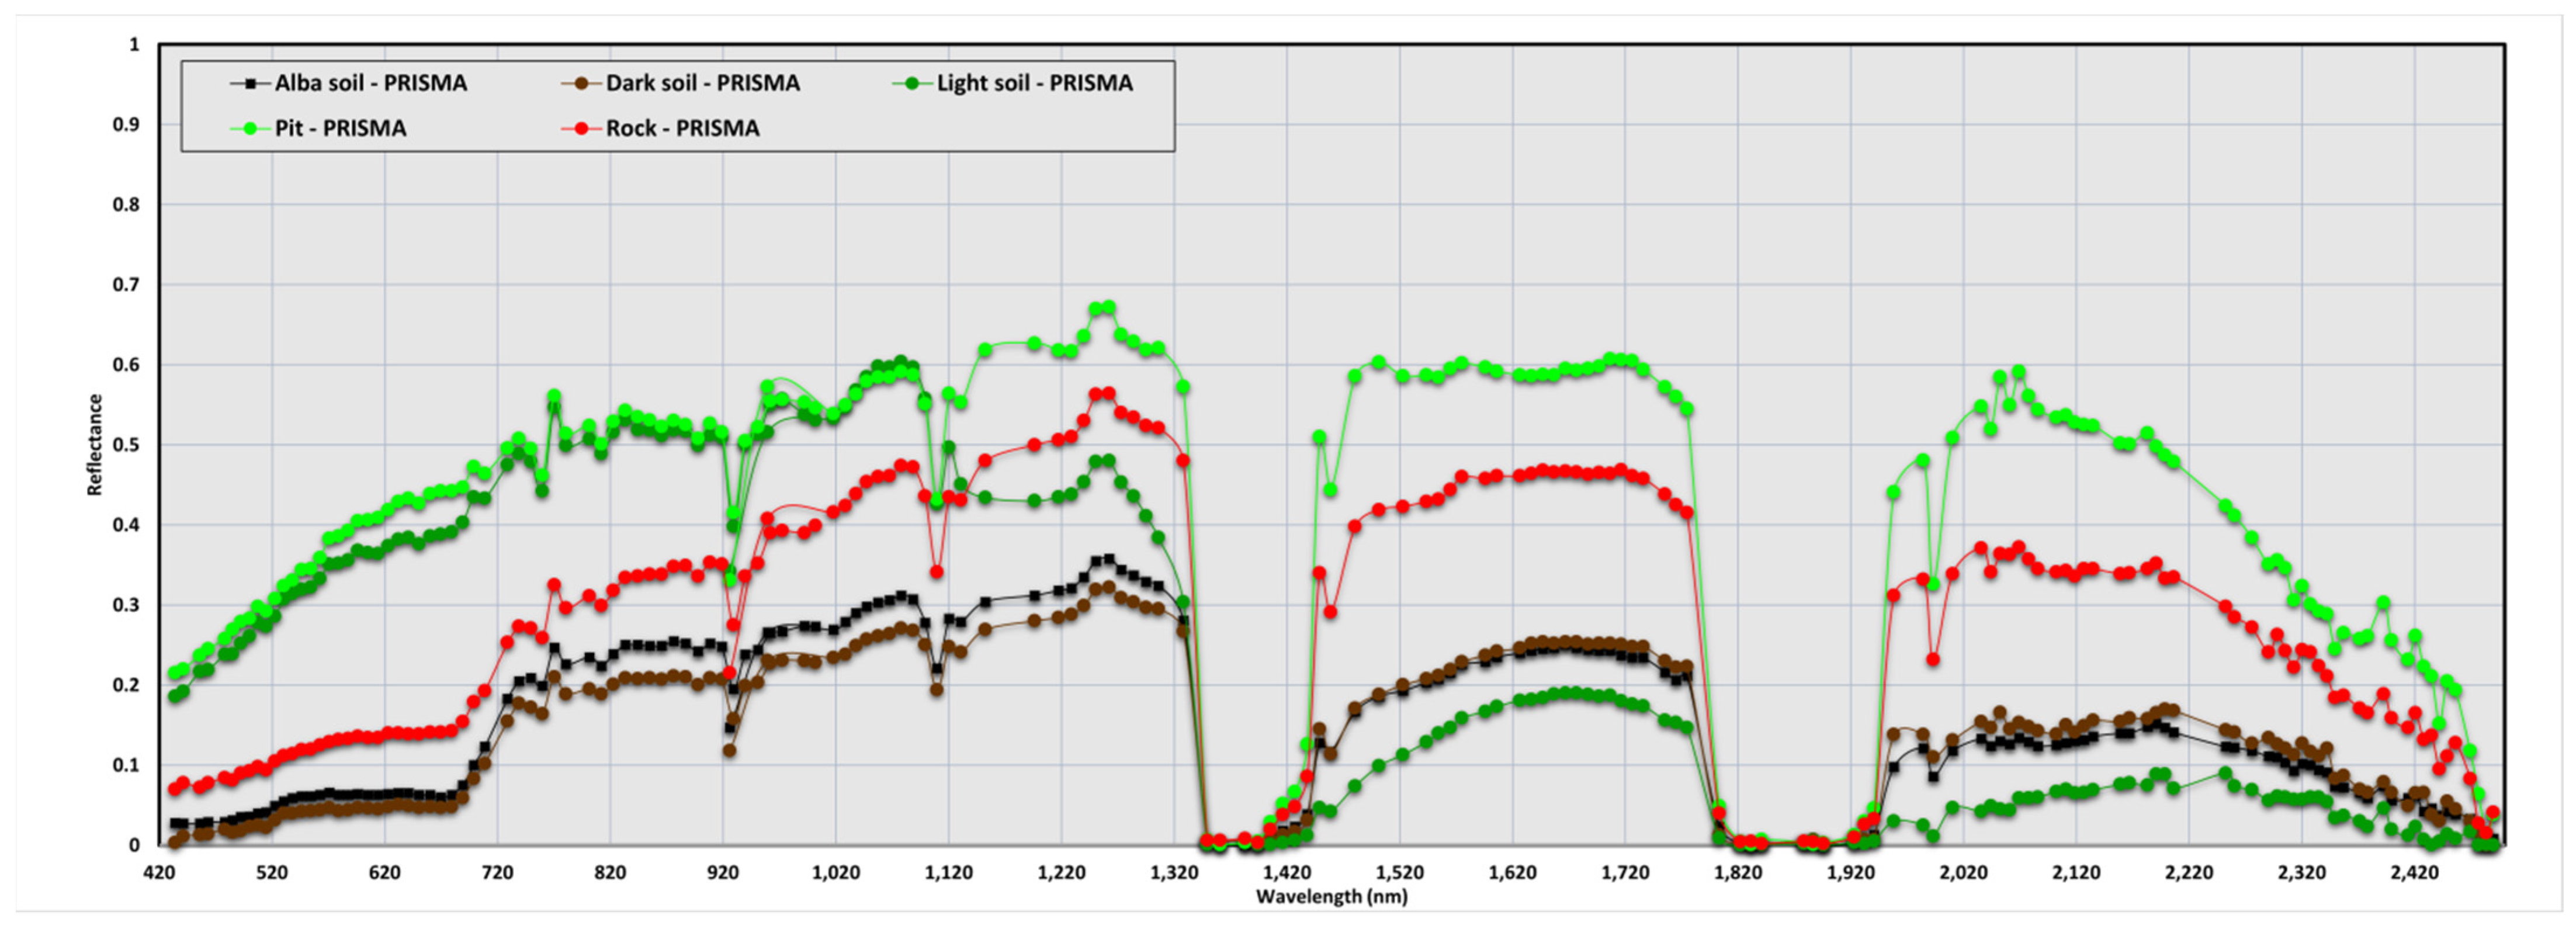
3.3. PRISMA and Sentinel-2 Spectral Signatures

Several spectral signatures from PRISMA and Sentinel-2 for Alba Fucens and Sinuessa, respectively, corresponding to pits, rocks or soils (Figure 14a), and sea and sand (Figure 14b), were compared. The Sentinel-2 images closest to PRISMA data were acquired on 13 September 2019 and on 20 October 2019 for Alba Fucens and Sinuessa, respectively. In Sinuessa, the selected points were chosen south of the actual area, but at the same bathymetry, because there are clouds over the AOI in the only available satellite image.
The Alba Fucens and Sinuessa spectral signatures are reported in Figure 15 and Figure 16.
The results show a full agreement between PRISMA and Sentinel-2 data. Thanks to the high spectral resolution of PRISMA data, it is possible to see the atmospheric absorption windows, especially in the wavelength ranges of 1360–1440 nm and 1820–1940 nm. Probably due to the atmospheric absorption, other peaks can be found at different rates in the wavelengths around 920, 1120 and 2020 nm. The water shows, as expected, a low backscattering in all bands, especially in the SWIR cube (Figure 16b).
With regard to soils, Sentinel-2 in the light and dark soil contains two “Not A Number” in the wavelengths of 443 and 945 nm (Figure 15c,d). Moreover, the light soil has a completely different response in the SWIR wavelengths (Figure 15c). The spectral signatures of soil in the Alba Fucens area (Figure 15e) has similar response to the dark soil, but with slightly higher values. This confirms the different trend observed in the PCA analysis. Moreover, the soil reflectance range values are in full agreement with the state-of-art spectral signatures [80,81,82]. The range is, indeed, between 0.1 and 0.5, except for 443 and 945 nm wavelengths, where sentinel-2 band has not been properly acquired.
Concerning the Sinuessa, coast the spectral signature must be attribute to a medium and fine sand (100–500 microns), primarily composed of quartz and, subordinately, of volcanic minerals (sanidine, K-Plagioclase, pyroxenes, magnetite).

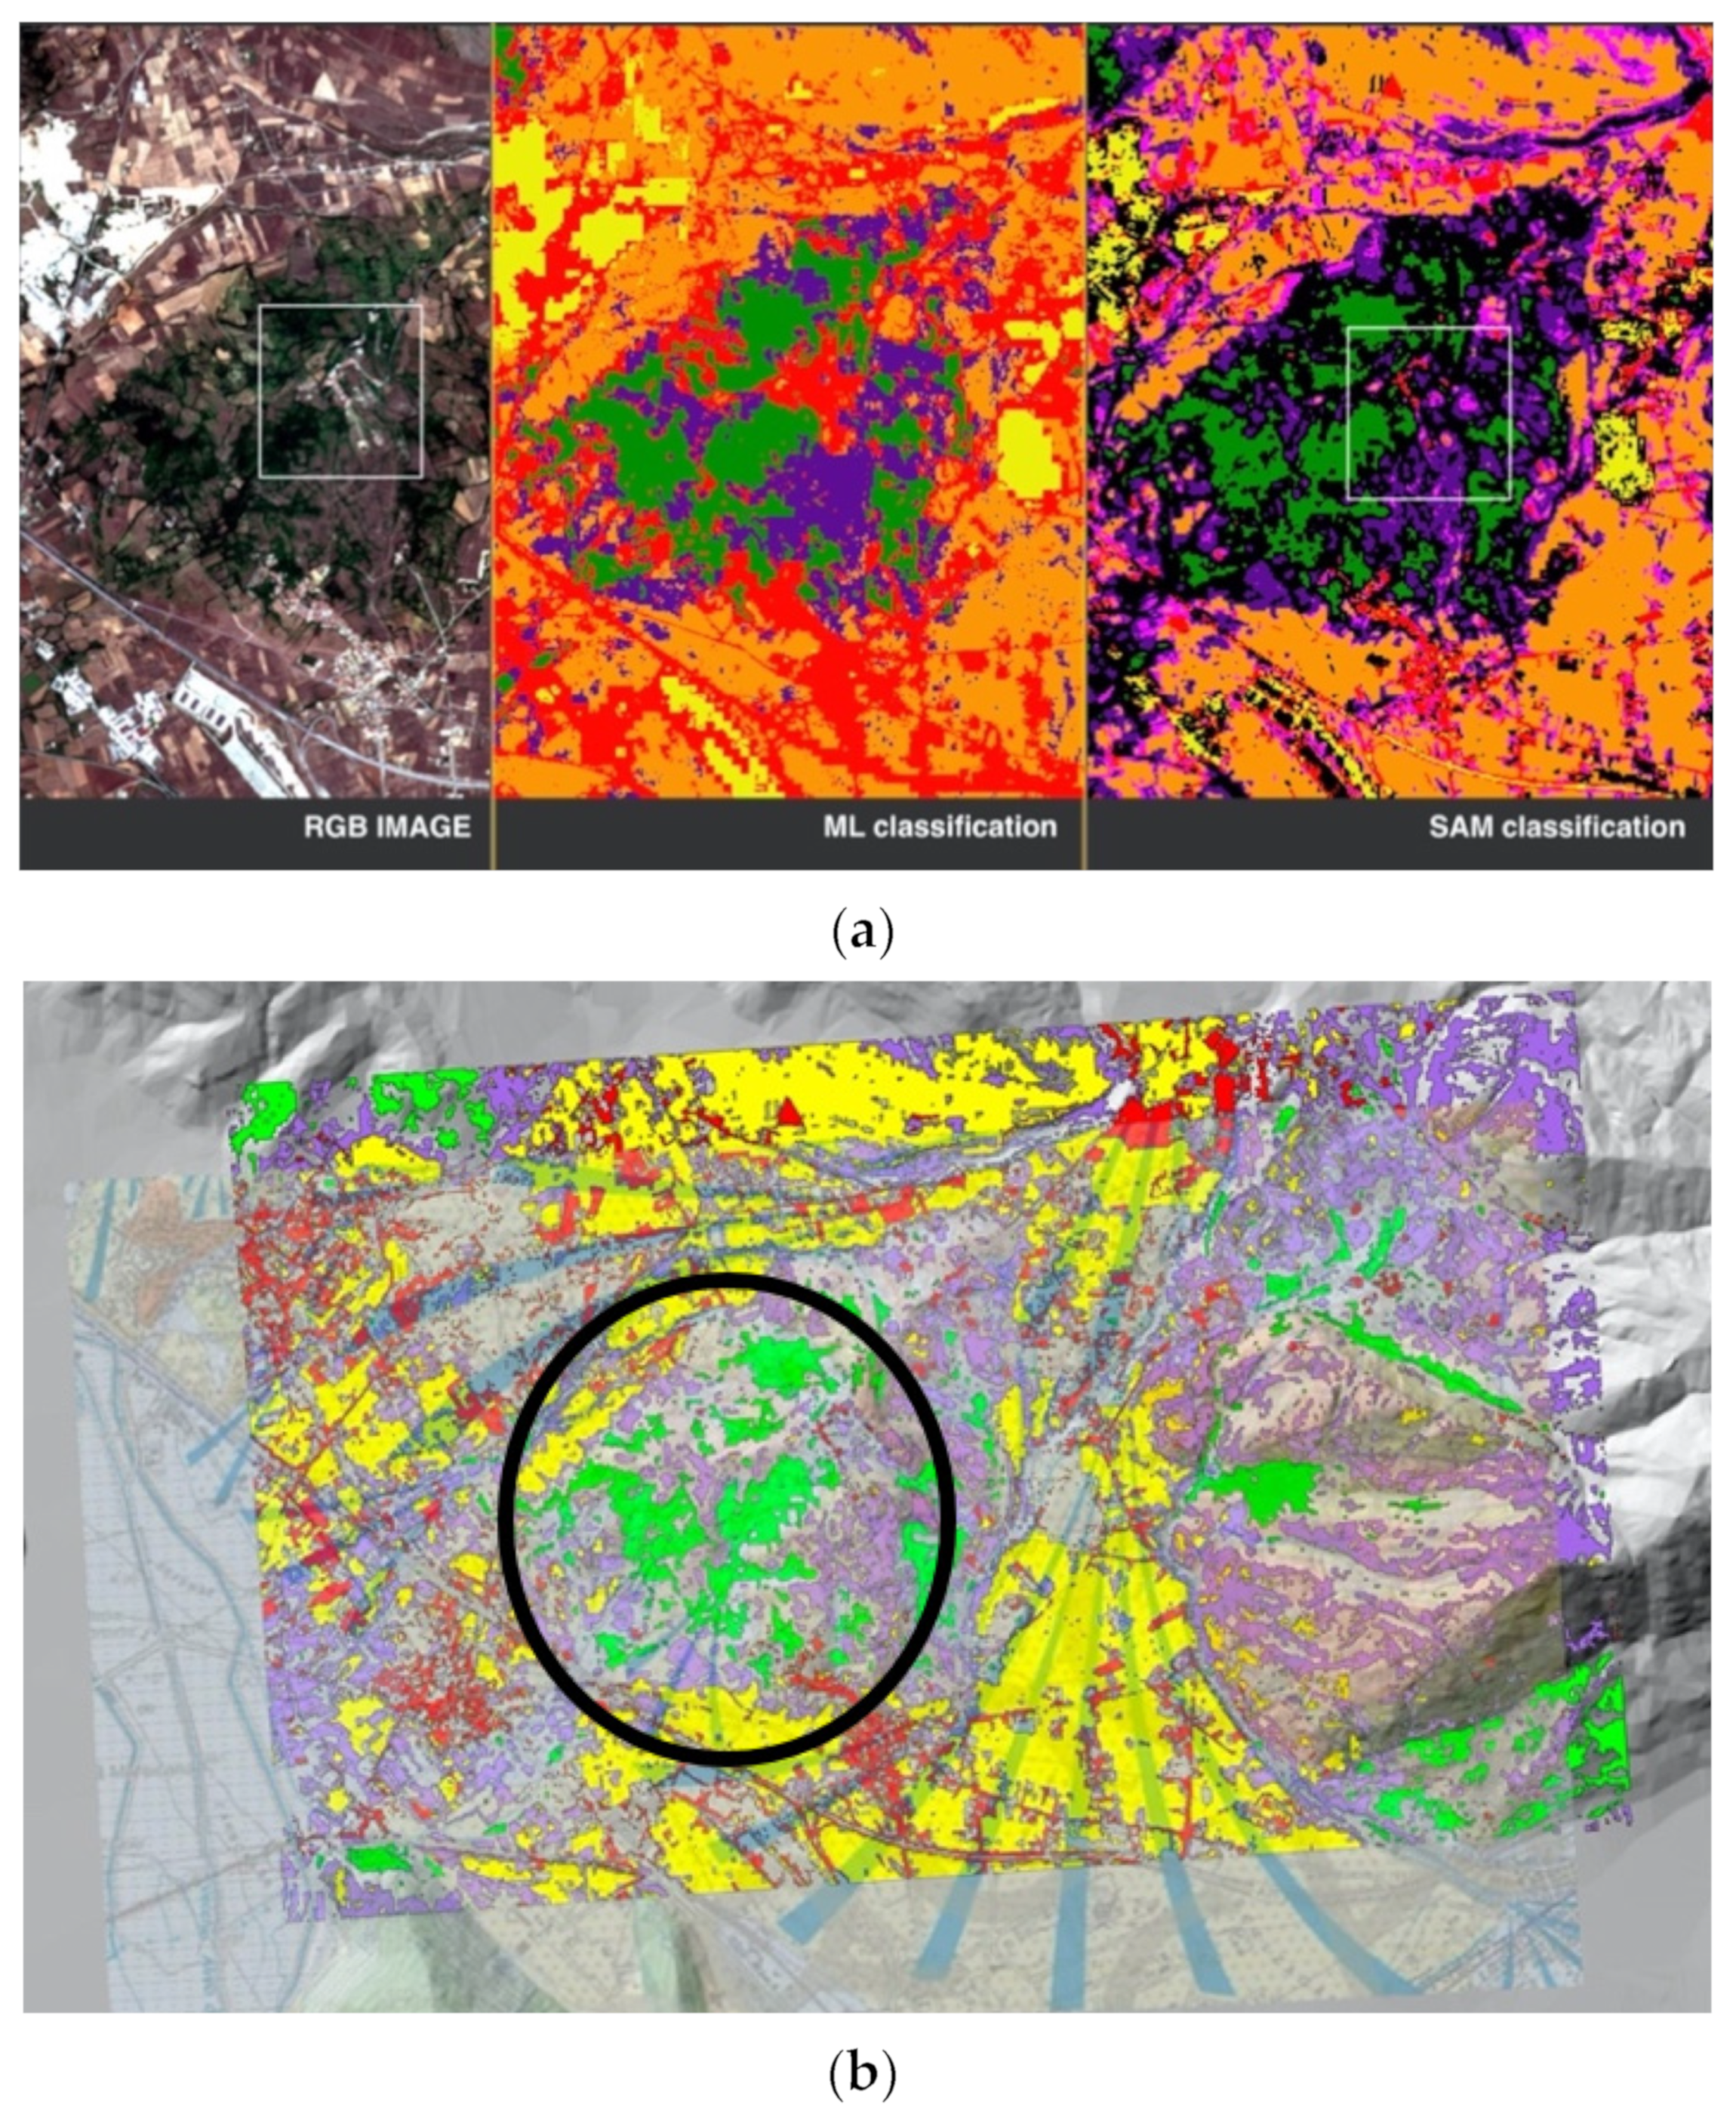
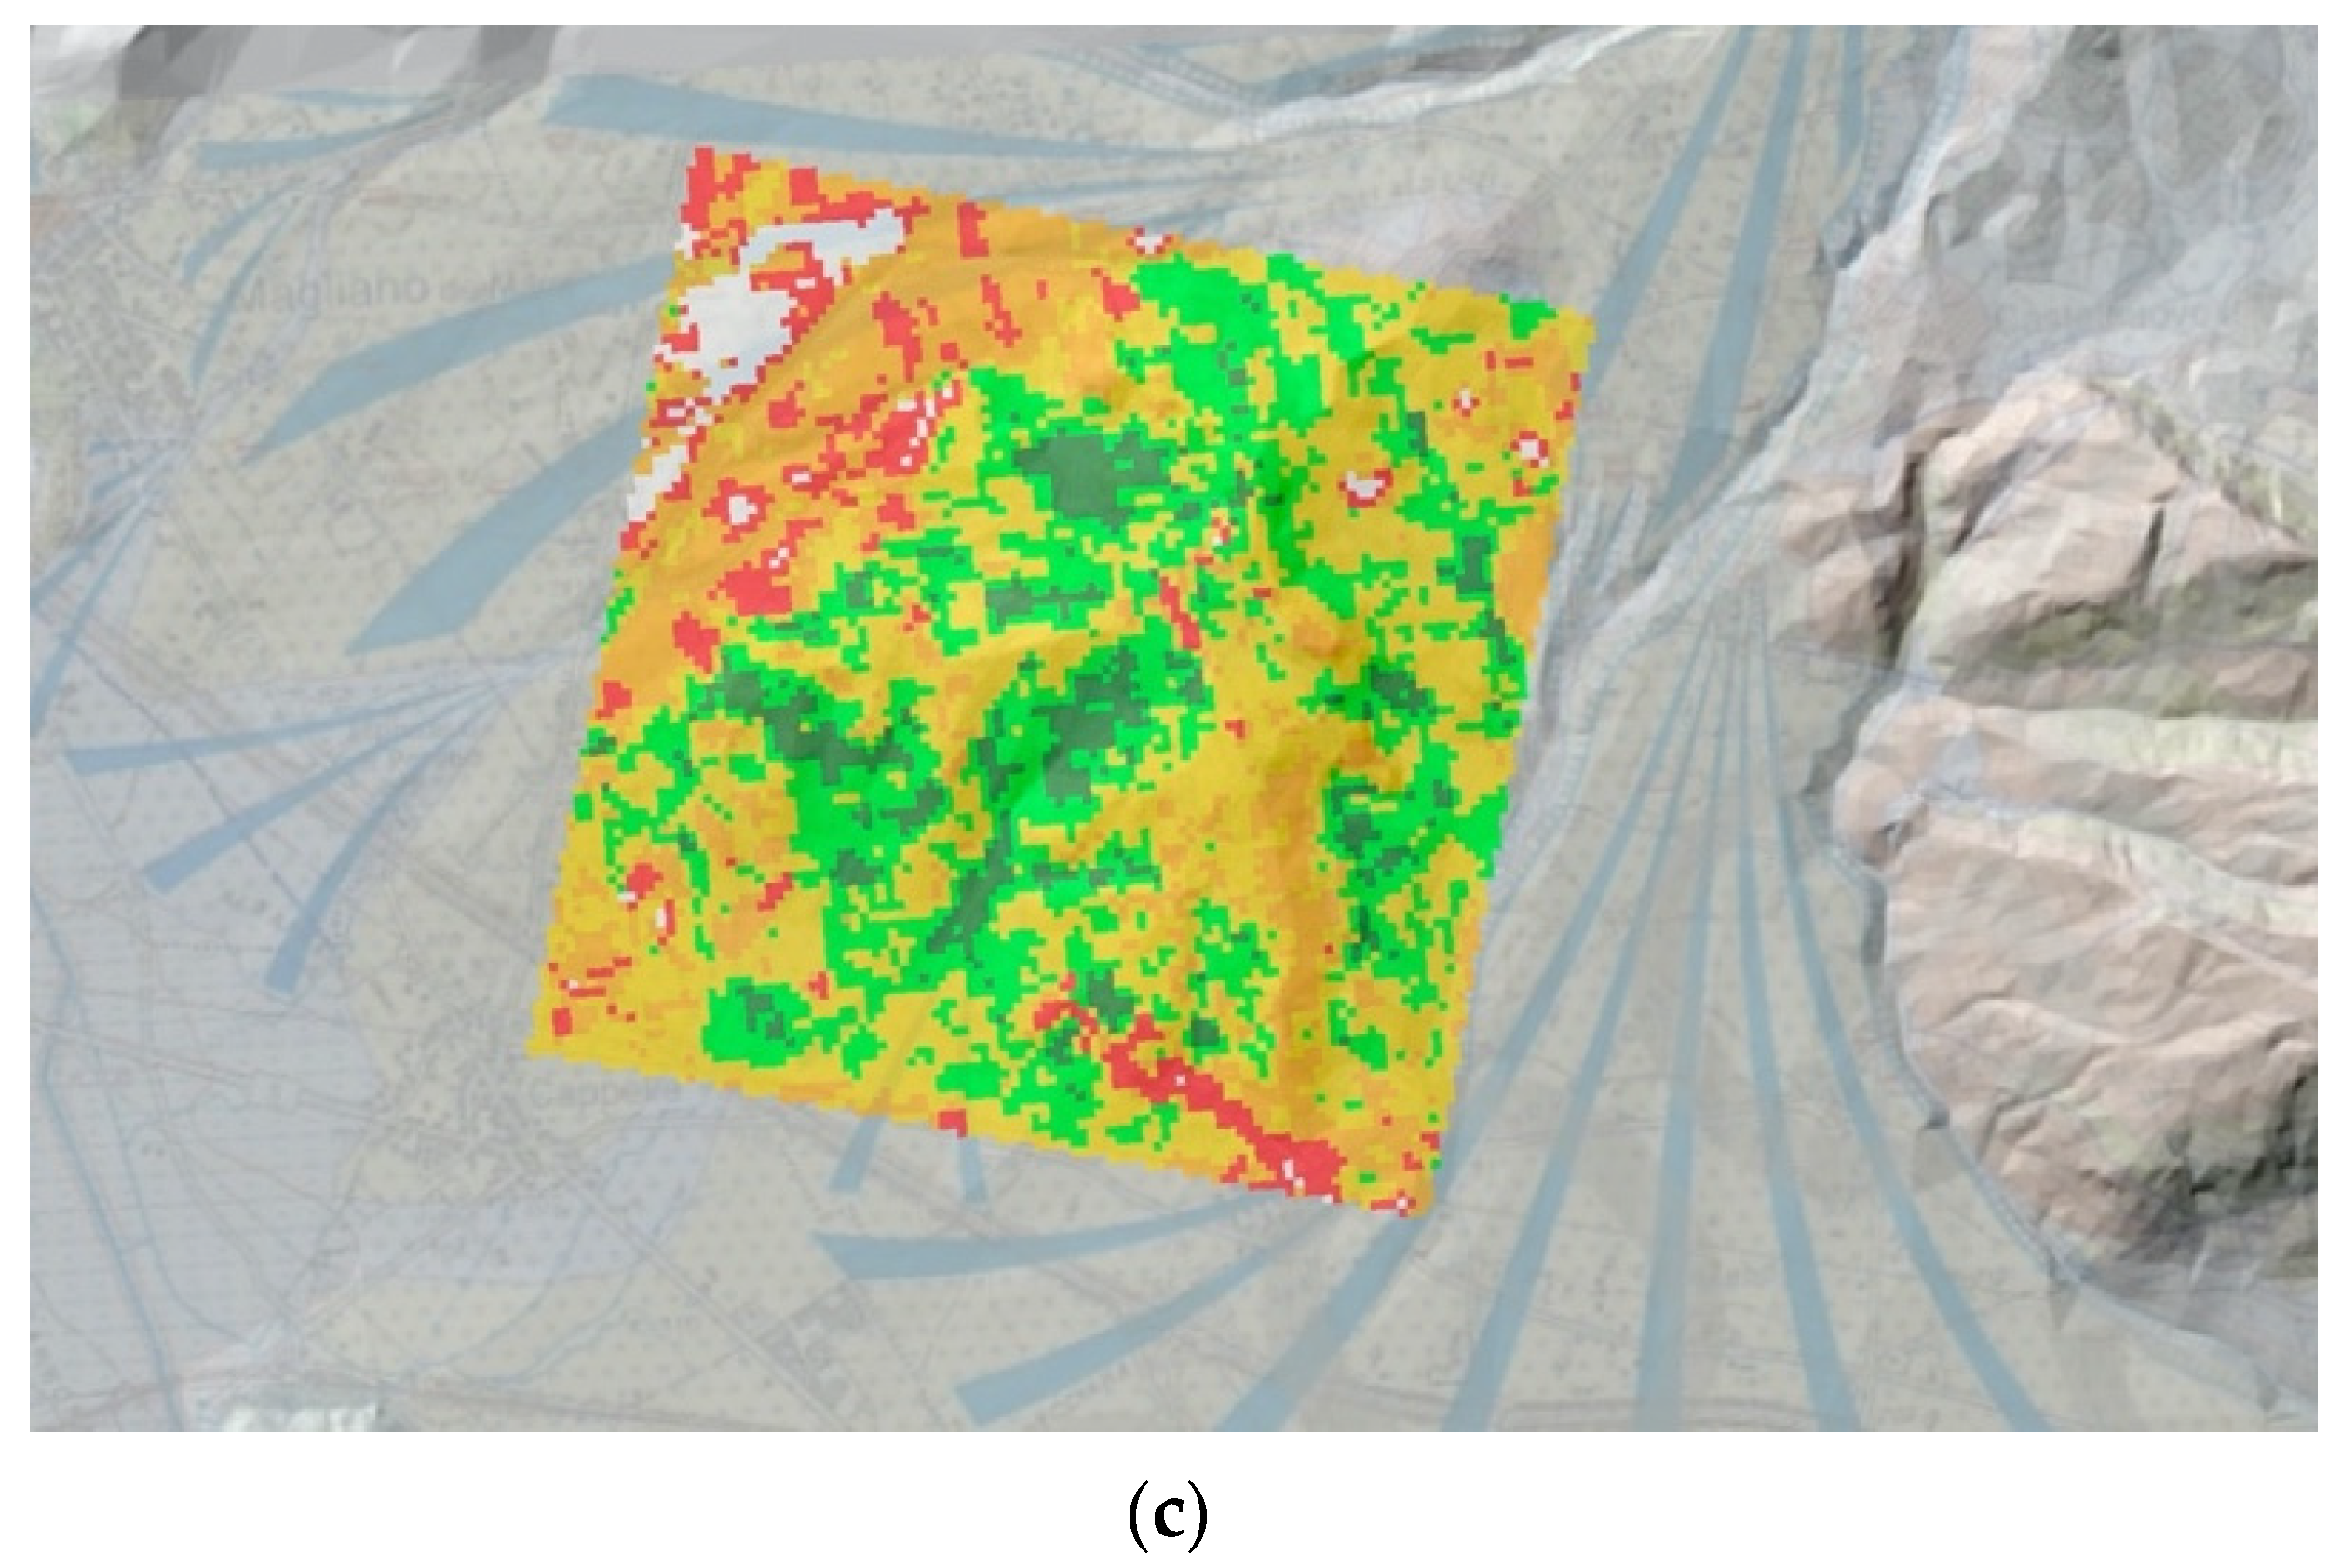
3.4. Spectral Angle Mapper (SAM) Classification

Considering the two supervised ML and SAM classifications, the SAM provided more reliable results both on the Sentinel-2 and PRISMA dataset, highlighting morphologies and morphostructures probably linked to buried anthropic structures (Figure 17). In fact, it was not possible to apply the ML algorithm on the processed PRISMA dataset, since the ML algorithm requires a number of training pixel elements at least equal to the number of features (the spectral bands) used in the classification for a correct creation of the distributions representing the various classes (in the creation of the variance and covariance matrices above mentioned). In the case of multispectral data, this is easy to obtain but in the studied dataset, 100 training pixels for each coverage class were impossible to be obtained. So, the SAM classification is generally more suitable for hyperspectral data as it does not have the limitation found in the ML classification.
The Sentinel-2 SAM classification has better distinguished the archaeological area and the two soil types: the first around the site; the second corresponding to the surrounding soils (Figure 17b).
The extracted thematic map clearly defines the morphological structure, distinguishing the soils of the Alba Fucens from the larger one in Avezzano (Figure 17c). This different soil spectral response is likely to be connected to the lithological characteristics represented by pebbly-sandy alluvial deposits, slopes debris deposits with the presence of archaeological remains [83]; the data are in agreement with the Sentinel-2 dataset (Figure 17b).

4. Discussion

On the basis of these first results, it appears that L2C are better than the L2D data, which are not adequate to carry on a sufficiently reliable study due to the wrong georeferencing. Once bad bands are deleted, few statistical analyses were performed in the AOI. The first PCA statistical analysis helps to highlight the not correlated variables and to identify the main features of multispectral images confirming relevant geological and archaeological information.
The results obtained on the Alba Fucens site, even if limited to few images that precluded detailed and accurate analyses, show that the first four PCs of the spectra described most of the information in the VNIR dataset, while in the Sinuessa coastal area, the first three PCs describe most of the information. Close to the plain of the Civita, along the slopes of the hill and in the surrounding of the base, PCA has highlighted at least four groups of interesting surface components (Figure 12) to be better investigated with in situ inspections as well as future geophysical prospections.
The comparison between the Alba Fucens spectral signatures is shown in Figure 18.
PRISMA hyperspectral signatures are able to detect and discern important characteristics of materials and soils. The detailed knowledge of the land context, as well as previous studies [18,42], allows for the attribution of the Alba Fucens spectral signature of the measured pits zone (Figure 15a) to calcium carbonate (420–920 nm). The signature matches with the spectral library signatures related to calcite [84]; the area is, indeed, well known for important extractive activities of high quality carbonatic gravels and concrete mixing. The hilly and mountainous surroundings are mainly characterized by carbonatic geological features [83] while the clay alluvial soils characteristics are correlated with the absence or presence of organic matter (light vs. dark soil). Comparing pits and light soil spectral signature (Figure 15a,c) it is possible to observe the overlap of the data in the VNIR and SWIR; the light soils are rich in calcite (skeleton) responsible for their hue.
On the contrary, the trend of the spectral signature of the dark soils within 420 and 1320 nm indicates a minor presence of calcite and a greater content of organic components, while the clay component for dark soils is major, ranging within 1420–2500 nm, as shown in the second part of the spectra (Figure 18).
The different soil characteristics of the Alba Fucens archaeological site have been differentiated by the PCA; in particular the Alba soil has a spectral signature similar to the dark soil but, with a slightly greater organic content, perhaps due to a reduced agricultural activity. The rock signature is more similar to the dark soils than that of the pits, maybe because the cover vegetation has a predominant reflectance component.
The results show the advantages of PRISMA spectral signatures compared to Sentinel-2 in terms of acquired bands (240 vs. 13), spectral resolution and the possibility of data interpretation. Much more information can be extrapolated, especially in the SWIR wavelength range, compared to Sentinel-2 data that contain only three bands.
Concerning the Sinuessa archaeological site, it is known that spaceborne or airborne spectral water response (reflectance) is a complex process due to scattering of particles—in water and water molecules, in air (aerosols) and air molecules—and to reflection process—at the air-water interface [85,86,87,88,89,90]. Water information is correlated only to scattering in water and is influenced by sunglint, sky reflection, water colour and transparency, while the other two processes must be avoided or corrected. Water colour depends on the concentration and optical properties of particles in suspension and on organic dissolved elements coming from biodegradation of plants. Transparency depends on the concentration and optical properties of total suspended particulate matter (SPM) and on dissolved organic matter [91,92,93].
The study of aquatic optics becomes easier if phenomena can be observed and measured using portable spectroradiometer, visual checks and simple optical equipment. Sunglint and sky reflection at the air-water interface and differences in water colour and transparency are related to different water constituents [94,95,96].
Within Sinuessa, spectral response complexity, the variability of water transparency during time is to be considered the most relevant issue. The morpho-sedimentary features of archaeological area (medium and fine silicate and volcanic clastic sands) show a highly hydrodynamic coastal environment, with longshore currents with a net longshore sediment transport directed from NW to SE, transporting sediments from Garigliano River and minor streams to the Sinuessa area towards SE [49].
Marine campaigns carried out in June–September 2012 and June–November 2013 [97] reported, respectively, average transparency values ranging between 1.8 and 3.6 and 1.8 and 2.8 metres; the highest values were measured in July and the lowest in November; moreover, during 2020 (22 August) extensive and unexpected brownish big stains, sampled by the Italian Coast Guard and analysed by the Regional Environmental Agency, were attribute to massive phytoplankton formation. The correction of atmospheric effects of the near-shore satellite images is complex and affected by the land proximity; moreover, high SPM concentrations produce high level of reflectance in the VNIR and NIR spectral regions [98]. By means of turbid coastal water algorithms [98] it is possible to assess the atmospheric correction through having high-resolution satellite imagery and in situ SPM concentration as well as water reflectance.
Regarding the interpretation of Sinuessa spectral signatures, the sure presence of quartz in the marine sands requires more data collection to be correlated to temporal satellite resolution, transparency and “ground truth campaign” for data interpretation. PRISMA data in marine areas are therefore heavily affected by complex phenomena and in particular by SPM and water transparency.

5. Conclusions

This research, by exploiting satellite remote sensing with a new hyperspectral sensor, tried to help the readability of archaeological sites, to understand the material composition and to detect object shapes. The more that can be explained in an archaeological site, the better is the eventual management and intervention aimed towards its conservation. The results could enhance information for a multiscale approach, both from the thematic and the metric point of view. In recent years, the processing of high and very high-resolution satellite images has strongly entered archaeological studies. Through new technologies, the reconstruction of material and cultural history of archaeological sites, as well as their resources, can be easily detected and illustrated. As an example, spectral bands in near and medium infrared allow the identification of shades of grey not visible to human eye, highlighting potential structures buried through anomalies in the distribution of moisture and/or vegetation in the soils. The analysis of the shapes helps to define the structures with their evolutions over time and their relationships with anthropic and paleo-anthropic systems.
This work analysed PRISMA capabilities in detecting the terrestrial and the marine archaeological areas of Alba Fucens and Sinuessa.
One of the challenges of the hyperspectral data are their large data quantity and their strong correlation within the spectral features. Bad bands analysis is strictly required in order to delete those bands which contain no data and are not useful for the test.
The PCA showed considerable information; in particular, the Alba Fucens soil shows characteristics different from the surrounding soils. This requires, in the future, in-depth and geophysics local inspections. Regarding Sinuessa, the investigations are strongly influenced by the low quality of the only spectral image available, due to the presence of clouds cover and imperfect focus. The PCA shows a significant influence of turbidity due to the presence of many watercourses and their sediment input.
The spectral signatures of the two sites acquired by PRISMA and Sentinel-2 show full agreement, but PRISMA spectral resolution is higher (240 vs. 13 bands), providing more details. Spectral analysis shows that it is possible to obtain important archaeological information regarding soils and constituent materials, especially if accurate “ground” data are available (archaeological and neighbouring area). Relevant comparisons between known and unknown areas for inspection and cognitive evaluations is, then, possible. The spectral study of marine archaeological areas is particularly complex and only through the evaluation of suitable, multitemporal and high-quality images they can be fully evaluated.
Remote sensing applications are mainly present in desert areas and/or with very sparse vegetation; in these areas the spectral response of the satellite sensors is not affected by the vegetation cover. In the study areas described in this paper, the PRISMA sensor gave reliable spectral responses, even if partially disturbed by the contribution of the vegetation; the processed dataset highlighted the morphological structures in the Alba Fucens area through photointerpretation and classification procedures. These procedures have allowed the identification of conoid structures, consisting mainly of detrital material with archaeological remains also described in the national geological cartography. With regard to Sinuessa, the PRISMA image highlighted the lithologies present in the continental coastal area; in the marine environment it was not possible to distinguish the submerged forms as the only recovery in the area showed widespread turbidity in the coastal waters.
To conclude, these first analyses, applied in landscape archaeology studies, highlight the great spectral operational capabilities of the PRISMA sensor. In future studies, a great advantage can be brought by performing a reliable pansharpening in order to increase the resolution of the final images (geometric resolution from pancromathic and spectral resolution from hyperspectral data), as well as a more stable multitemporal acquisition in the areas under investigation.
Finally, using an extremely high-resolution hyperspectral sensor mounted on a UAV could enhance the multiscale information in archaeological areas.

Author Contributions

Conceptualization, D.D., E.C., F.I. and R.Q.; methodology, M.A., D.D., F.I., F.M., N.P. and S.Z.; formal analysis, M.A., F.I., F.M. and S.Z.; resources, M.A., E.C., D.D., F.I., R.Q. and S.Z.; writing—original draft preparation, D.D., F.I., F.M., R.Q. and S.Z.; writing—review and editing, M.A., E.C., D.D., F.I., F.M., N.P., R.Q. and S.Z.; visualization, D.D., F.I., F.M., N.P., R.Q. and S.Z.; supervision, D.D. and F.I.; project administration, M.A. and S.Z. All authors have read and agreed to the published version of the manuscript.

Funding

This research received no external funding.

Data Availability Statement

Data available on request by e-mail to the corresponding author.

Acknowledgments

Project realised using PRISMA products, © of the Italian Space Agency (ASI), delivered with ASI user license. The authors would like to thank Alberto Meroni from L3Harris for the precious processing support in the PRISMA dataset.

Conflicts of Interest

The authors declare no conflict of interest.

References

  1. Fairclough, G. A New Landscape for Cultural Heritage Management: Characterisation as a Management Tool. In Landscapes Under Pressure: Theory and Practice of Cultural Heritage Research and Preservation; Lozny, L.R., Ed.; Springer US: Boston, MA, 2006; pp. 55–74. ISBN 978-0-387-28461-3. [Google Scholar]
  2. EBSCOhost|18549570|New Light on an Ancient Landscape: Lidar Survey in the Stonehenge World Heritage Site. Available online: https://www.cambridge.org/core/journals/antiquity/article/abs/new-light-on-an-ancient-landscape-lidar-survey-in-the-stonehenge-world-heritage-site/D65EA1D86301827E17559610FDA3460B (accessed on 21 May 2021).
  3. ‘The Long Chain’: Archaeology, Historical Landscape Characterization and Time Depth in the Landscape|SpringerLink. Available online: https://link.springer.com/chapter/10.1007/978-94-017-0189-1_16 (accessed on 21 May 2021).
  4. Turner, S. Ancient Country: The Historic Character of Rural Devon: No. 20, 1st ed.; Devon Archaeological Society: Exeter, UK, 2007; ISBN 978-0-9527899-8-7. [Google Scholar]
  5. Lasaponara, R.; Masini, N. Advances on Remote Sensing for Archaeology and Cultural Heritage Management Edited By; Aracne: New York, NY, USA, 2008; ISBN 978-88-548-2030-2. [Google Scholar]
  6. Tapete, D.; Cigna, F. Detection, Morphometric Analysis and Digital Surveying of Archaeological Mounds in Southern Iraq with CartoSat-1 and COSMO-SkyMed DEMs. Land 2022, 11, 1406. [Google Scholar] [CrossRef]
  7. Carella, E.; Orusa, T.; Viani, A.; Meloni, D.; Borgogno-Mondino, E.; Orusa, R. An Integrated, Tentative Remote-Sensing Approach Based on NDVI Entropy to Model Canine Distemper Virus in Wildlife and to Prompt Science-Based Management Policies. Animals 2022, 12, 1049. [Google Scholar] [CrossRef] [PubMed]
  8. Zavorotny, V.U.; Voronovich, A.G. Scattering of GPS Signals from the Ocean with Wind Remote Sensing Application. IEEE Trans. Geosci. Remote Sens. 2000, 38, 951–964. [Google Scholar] [CrossRef] [Green Version]
  9. Bauer, A.; Nicoll, K.; Park, L.; Matney, T. Archaeological Site Distribution by Geomorphic Setting in the Southern Lower Cuyahoga River Valley, Northeastern Ohio: Initial Observations from a GIS Database. Geoarchaeology 2004, 19, 711–729. [Google Scholar] [CrossRef]
  10. Conolly, J.; Lake, M. Geographical Information Systems in Archaeology; Cambridge University Press: Cambridge, UK, 2006; ISBN 978-1-139-93652-1. [Google Scholar]
  11. Zwertvaegher, A.; Werbrouck, I.; Finke, P.A.; Reu, J.D.; Crombé, P.; Bats, M.; Antrop, M.; Bourgeois, J.; Court-Picon, M.; Maeyer, P.D.; et al. On the Use of Integrated Process Models to Reconstruct Prehistoric Occupation, with Examples from Sandy Flanders, Belgium. Geoarchaeology 2010, 25, 784–814. [Google Scholar] [CrossRef] [Green Version]
  12. Conolly, J. Geographical Information Systems and Landscape Archaeology. In Handbook of Landscape Archaeology; Routledge: London, UK, 2016; pp. 583–595. [Google Scholar]
  13. Gyucha, A.; Duffy, P.R.; Frolking, T.A. The Körös Basin from the Neolithic to the Hapsburgs: Linking Settlement Distributions with Pre-Regulation Hydrology through Multiple Data Set Overlay. Geoarchaeology 2011, 26, 392–419. [Google Scholar] [CrossRef]
  14. Zwertvaegher, A.; Finke, P.; De Reu, J.; Vandenbohede, A.; Lebbe, L.; Bats, M.; De Clercq, W.; De Smedt, P.; Gelorini, V.; Sergant, J. Reconstructing Phreatic Palaeogroundwater Levels in a Geoarchaeological Context: A Case Study in Flanders, Belgium. Geoarchaeology 2013, 28, 170–189. [Google Scholar] [CrossRef]
  15. Hill, J.B. Land Use and an Archaeological Perspective on Socio-Natural Studies in the Wadi al-Hasa, West-Central Jordan. Am. Antiq. 2004, 389–412. [Google Scholar] [CrossRef]
  16. Savage, S.H.; Levy, T.E.; Jones, I.W. Prospects and Problems in the Use of Hyperspectral Imagery for Archaeological Remote Sensing: A Case Study from the Faynan Copper Mining District, Jordan. J. Archaeol. Sci. 2012, 39, 407–420. [Google Scholar] [CrossRef]
  17. Pozzo, A.D.; Immordino, F.; Candigliota, E. Remote Sensing Multitemporal Data for Geomorphological Analysis of the Murghab Alluvial Fan in Turkmenistan. J. Earth Sci. Eng. 2017, 7. [Google Scholar] [CrossRef]
  18. Alicandro, M.; Candigliota, E.; Dominici, D.; Immordino, F.; Quaresima, R.; Zollini, S. Alba Fucens Archaeological Site: Multiscale and Multidisciplinary Approach for Risk Assessment and Conservation. ISPRS Int. Arch. Photogramm. Remote Sens. Spat. Inf. Sci. 2019, XLII-2/W11, 47–53. [Google Scholar] [CrossRef] [Green Version]
  19. ASI (Italian Space Agency) PRISMA: Small Innovative Earth Observation Mission. Available online: http://prisma-i.it/index.php/en/ (accessed on 15 March 2021).
  20. Caporusso, G.; Lopinto, E.; Lorusso, R.; Loizzo, R.; Guarini, R.; Daraio, G.M.; Sacco, P. The Hyperspectral Prisma Mission in Operations. In Proceedings of the IGARSS 2020—2020 IEEE International Geoscience and Remote Sensing Symposium, Waikoloa, HI, USA, 26 September–2 October 2020; pp. 3282–3285. [Google Scholar]
  21. ASI (Italian Space Agency) La Missione PRISMA Apre al Pieno Utilizzo Della Comunità. Available online: https://www.asi.it/2020/05/la-missione-prisma-apre-al-pieno-utilizzo-della-comunita/ (accessed on 15 March 2021).
  22. Adão, T.; Hruška, J.; Pádua, L.; Bessa, J.; Peres, E.; Morais, R.; Sousa, J.J. Hyperspectral Imaging: A Review on UAV-Based Sensors, Data Processing and Applications for Agriculture and Forestry. Remote Sens. 2017, 9, 1110. [Google Scholar] [CrossRef] [Green Version]
  23. Alexakis, D.; Sarris, A.; Astaras, T.; Albanakis, K. Detection of Neolithic Settlements in Thessaly (Greece) Through Multispectral and Hyperspectral Satellite Imagery. Sensors 2009, 9, 1167–1187. [Google Scholar] [CrossRef] [Green Version]
  24. Manolakis, D.; Marden, D.; Shaw, G. Hyperspectral Image Processing for Automatic Target Detection Applications. Linc. Lab. J. 2003, 14, 79–116. [Google Scholar]
  25. Bedini, E.; Chen, J. Application of PRISMA Satellite Hyperspectral Imagery to Mineral Alteration Mapping at Cuprite, Nevada, USA. J. Hyperspectral Remote Sens. V 2020, 10, 87–94. [Google Scholar] [CrossRef]
  26. Vangi, E.; D’Amico, G.; Francini, S.; Giannetti, F.; Lasserre, B.; Marchetti, M.; Chirici, G. The New Hyperspectral Satellite PRISMA: Imagery for Forest Types Discrimination. Sensors 2021, 21, 1182. [Google Scholar] [CrossRef]
  27. Pepe, M.; Pompilio, L.; Gioli, B.; Busetto, L.; Boschetti, M. Detection and Classification of Non-Photosynthetic Vegetation from PRISMA Hyperspectral Data in Croplands. Remote Sens. 2020, 12, 3903. [Google Scholar] [CrossRef]
  28. Giardino, C.; Bresciani, M.; Braga, F.; Fabbretto, A.; Ghirardi, N.; Pepe, M.; Gianinetto, M.; Colombo, R.; Cogliati, S.; Ghebrehiwot, S.; et al. First Evaluation of PRISMA Level 1 Data for Water Applications. Sensors 2020, 20, 4553. [Google Scholar] [CrossRef]
  29. Niroumand-Jadidi, M.; Bovolo, F.; Bruzzone, L. Water Quality Retrieval from PRISMA Hyperspectral Images: First Experience in a Turbid Lake and Comparison with Sentinel-2. Remote Sens. 2020, 12, 3984. [Google Scholar] [CrossRef]
  30. Di Mauro, B.; Garzonio, R.; Bramati, G.; Cogliati, S.; Cremonese, E.; Julitta, T.; Panigada, C.; Rossini, M.; Colombo, R. PRISMA Hyperspectral Satellite Mission: First Data on Snow in the Alps. In Proceedings of the EGU General Assembly 2020, online, 4–8 May 2020; Volume 22, p. 19825. [Google Scholar]
  31. Casa, R.; Pignatti, S.; Pascucci, S.; Ionca, V.; Mzid, N.; Veretelnikova, I. Assessment of PRISMA Imaging Spectrometer Data for the Estimation of Topsoil Properties of Agronomic Interest at the Field Scale. In Proceedings of the EGU General Assembly 2020, online, 4–8 May 2020; Volume 22, p. 6728. [Google Scholar]
  32. Sentinel-2—Missions—Sentinel Online—Sentinel. Available online: https://sentinel.esa.int/web/sentinel/missions/sentinel-2 (accessed on 21 May 2021).
  33. Agudo, P.U.; Pajas, J.A.; Pérez-Cabello, F.; Redón, J.V.; Lebrón, B.E. The Potential of Drones and Sensors to Enhance Detection of Archaeological Cropmarks: A Comparative Study Between Multi-Spectral and Thermal Imagery. Drones 2018, 2, 29. [Google Scholar] [CrossRef] [Green Version]
  34. Salgado Carmona, J.Á.; Quirós, E.; Mayoral, V.; Charro, C. Assessing the Potential of Multispectral and Thermal UAV Imagery from Archaeological Sites. A Case Study from the Iron Age Hillfort of Villasviejas Del Tamuja (Cáceres, Spain). J. Archaeol. Sci. Rep. 2020, 31, 102312. [Google Scholar] [CrossRef]
  35. Cavalli, R.M.; Colosi, F.; Palombo, A.; Pignatti, S.; Poscolieri, M. Remote Hyperspectral Imagery as a Support to Archaeological Prospection. J. Cult. Herit. 2007, 8, 272–283. [Google Scholar] [CrossRef]
  36. Scianna, A.; Gaglio, G.F.; La Guardia, M. HBIM Data Management in Historical and Archaeological Buildings. Archeol. E Calcolatori 2020, 31, 231–252. [Google Scholar] [CrossRef]
  37. Deroin, J.-P.; Téreygeol, F.; Heckes, J. Remote Sensing Study of the Ancient Jabali Silver Mines (Yemen): From Past to Present. In Satellite Remote Sensing: A New Tool for Archaeology. In Proceedings of the 1st International EARSeL Workshop CNR, Rome, Italy, 30 September–4 October 2008. [Google Scholar]
  38. Deroin, J.-P.; Bou Kheir, R.; Abdallah, C. Geoarchaeological Remote Sensing Survey for Cultural Heritage Management. Case Study from Byblos (Jbail, Lebanon). J. Cult. Herit. 2017, 23, 37–43. [Google Scholar] [CrossRef] [Green Version]
  39. Chen, F.; Lasaponara, R.; Masini, N. An Overview of Satellite Synthetic Aperture Radar Remote Sensing in Archaeology: From Site Detection to Monitoring. J. Cult. Herit. 2017, 23, 5–11. [Google Scholar] [CrossRef]
  40. Cerra, D.; Agapiou, A.; Cavalli, R.M.; Sarris, A. An Objective Assessment of Hyperspectral Indicators for the Detection of Buried Archaeological Relics. Remote Sens. 2018, 10, 500. [Google Scholar] [CrossRef]
  41. Cucci, C.; Picollo, M.; Chiarantini, L.; Uda, G.; Fiori, L.; De Nigris, B.; Osanna, M. Remote-Sensing Hyperspectral Imaging for Applications in Archaeological Areas: Non-Invasive Investigations on Wall Paintings and on Mural Inscriptions in the Pompeii Site. Microchem. J. 2020, 158, 105082. [Google Scholar] [CrossRef]
  42. Alicandro, M.; Dominici, D.; Quaresima, R.; Zollini, S.; Luca, D.D.; Pietrangeli, S. Geomatic Multiscale Approach for the Conservation of Archeological Sites: The Case of Alba Fucens (L’Aquila-Italy). IOP Conf. Ser. Mater. Sci. Eng. 2020, 949, 012032. [Google Scholar] [CrossRef]
  43. Galadini, F.; Ceccaroni, E.; Falcucci, E. Archaeoseismological Evidence of a Disruptive Late Antique Earthquake at Alba Fucens (Central Italy). Boll. Geofis. Teor. Ed Appl. 2010, 51, 143–161. [Google Scholar]
  44. Galadini, F.; Ceccaroni, E.; Falcucci, E.; Gori, S. Le fasi di colluviamento tardoantiche nel Piano della Civita e la fine della frequentazione dell’abitato di Alba Fucens. In Proceedings of the Joseph Mertens Memory; Academia Belgica: Roma, Italy, 2012; pp. 187–199. [Google Scholar]
  45. Pennetta, M.; Stanislao, C.; D’Ambrosio, V.; Marchese, F.; Minopoli, C.; Trocciola, A.; Valente, R.; Donadio, C. Geomorphological Features of the Archaeological Marine Area of Sinuessa in Campania, Southern Italy. Quat. Int. 2016, 425, 198–213. [Google Scholar] [CrossRef]
  46. Cocco, E.; de Magistris, M.A.; Boscaino, F.; Iacono, Y.; Tarallo, F. Dati Preliminari Di Rilevamento Geomorfologico e Geolitologico Subacqueo Della Piattaforma Costiera Nell’area Di Mondragone (Piana Campana, Golfo Di Gaeta). Atti Convegno Internazionale Geosub 1996, 94, 105–114. [Google Scholar]
  47. Cocco, E.; Crimaco, L.; De Magistris, M.A.; Gasperetti, G. Primi Risultati Sulle Indagini Di Geoarcheologia Subacquea Nell’area Dell’antica Colonia Romana Di Sinuessa Presso Mondragone (Piana Campana, Golfo Di Gaeta). Mem. Descr. Della Carta Geol. D’Italia 1994, 52, 361–372. [Google Scholar]
  48. De Vivo, B.; Rolandi, G.; Gans, P.B.; Calvert, A.; Bohrson, W.A.; Spera, F.J.; Belkin, H.E. New Constraints on the Pyroclastic Eruptive History of the Campanian Volcanic Plain (Italy). Mineral. Petrol. 2001, 73, 47–65. [Google Scholar] [CrossRef]
  49. Trocciola, A. Sinuessa, Un Approdo Sommerso Di Epoca Romana. Archeologia, Geomorfologia Costiera, Strategie Sostenibili Di Valorizzazione; ENEA: Bologna, Italy, 2017. [Google Scholar]
  50. Pennetta, M.; Donadio, C.; Stanislao, C.; Valente, R.; Nappi, R. Assetto Geomorfologico Dell’area Marina Di Sinuessa Ed Ipotesi Di Fruizione Sostenibile. Energ. Ambiente Innov. 2016, 4, 48–53. [Google Scholar] [CrossRef]
  51. Cavinato, G.P.; Carusi, C.; Dall’Asta, M.; Miccadei, E.; Piacentini, T. Sedimentary and Tectonic Evolution of Plio–Pleistocene Alluvial and Lacustrine Deposits of Fucino Basin (Central Italy). Sediment. Geol. 2002, 148, 29–59. [Google Scholar] [CrossRef]
  52. Google Earth. Available online: https://www.google.it/intl/it/earth/ (accessed on 30 May 2021).
  53. Loizzo, R.; Daraio, M.; Guarini, R.; Longo, F.; Lorusso, R.; Dini, L.; Lopinto, E. Prisma Mission Status and Perspective. In Proceedings of the IGARSS 2019—2019 IEEE International Geoscience and Remote Sensing Symposium, Yokohama, Japan, 28 July–2 August 2019; pp. 4503–4506. [Google Scholar]
  54. Tripathi, P.; Garg, R.D. First Impressions from the PRISMA Hyperspectral Mission. Curr. Sci. 2020, 119, 1267–1281. [Google Scholar] [CrossRef]
  55. Lopinto, E.; Ananasso, C. The Prisma Hyperspectral Mission. In Proceedings of the 33rd EARSeL Symposium, Towards Horizon, Matera, Italy, 3–6 June 2013; p. 12. [Google Scholar]
  56. Kumar, M.V.; Yarrakula, K. Comparison of Efficient Techniques of Hyper-Spectral Image Preprocessing for Mineralogy and Vegetation Studies. IJMS 2017, 46, 1008–1021. [Google Scholar]
  57. Ganesh, B.P.; Aravindan, S.; Raja, S.; Thirunavukkarasu, A. Hyperspectral Satellite Data (Hyperion) Preprocessing—A Case Study on Banded Magnetite Quartzite in Godumalai Hill, Salem, Tamil Nadu, India. Arab. J. Geosci. 2013, 6, 3249–3256. [Google Scholar] [CrossRef]
  58. Processing of Hyperspectral Imagery. Available online: https://www.csr.utexas.edu/projects/rs/hrs/process.html (accessed on 19 December 2021).
  59. Ji, L.; Geng, X.; Zhao, Y.; Wang, F. An Automatic Bad Band Preremoval Algorithm for Hyperspectral Imagery. Available online: https://arxiv.org/abs/1610.05929 (accessed on 19 December 2021).
  60. Ji, L.; Wang, L.; Geng, X. An Automatic Bad Band Pre-Removal Method for Hyperspectral Imagery. IEEE J. Sel. Top. Appl. Earth Obs. Remote Sens. 2019, 12, 4985–4994. [Google Scholar] [CrossRef]
  61. Rasti, B.; Ulfarsson, M.O.; Ghamisi, P. Automatic Hyperspectral Image Restoration Using Sparse and Low-Rank Modeling. IEEE Geosci. Remote Sens. Lett. 2017, 14, 2335–2339. [Google Scholar] [CrossRef]
  62. Rasti, B.; Scheunders, P.; Ghamisi, P.; Licciardi, G.; Chanussot, J. Noise Reduction in Hyperspectral Imagery: Overview and Application. Remote Sens. 2018, 10, 482. [Google Scholar] [CrossRef] [Green Version]
  63. Maggioni, M.; Katkovnik, V.; Egiazarian, K.; Foi, A. Nonlocal Transform-Domain Filter for Volumetric Data Denoising and Reconstruction. IEEE Trans. Image Process. 2013, 22, 119–133. [Google Scholar] [CrossRef] [PubMed]
  64. Abdi, H.; Williams, L.J. Principal Component Analysis. WIREs Comput. Stat. 2010, 2, 433–459. [Google Scholar] [CrossRef]
  65. Johnson, R.A.; Wichern, D.W. Applied Multivariate Statistical Analysis, 6th ed.; Pearson Prentice Hall: Upper Saddle River, NJ, USA, 2007; ISBN 978-0-13-187715-3. [Google Scholar]
  66. Atkinson, P.M. Spatial Statistics. In Spatial Statistics for Remote Sensing; Springer: Berlin/Heidelberg, Germany, 1999; pp. 57–81. [Google Scholar]
  67. Guo, B.; Damper, R.I.; Gunn, S.R.; Nelson, J.D. A Fast Separability-Based Feature-Selection Method for High-Dimensional Remotely Sensed Image Classification. Pattern Recognit. 2008, 41, 1653–1662. [Google Scholar] [CrossRef] [Green Version]
  68. Staenz, K.; Held, A. Summary of Current and Future Terrestrial Civilian Hyperspectral Spaceborne Systems. In Proceedings of the 2012 IEEE International Geoscience and Remote Sensing Symposium, Munich, Germany, 22–27 July 2012; pp. 123–126. [Google Scholar]
  69. Van der Meer, F. Imaging Spectrometry for Geological Remote Sensing. Geol. En Mijnb. 1998, 77, 137–151. [Google Scholar] [CrossRef]
  70. Brivio, P.; Lechi-Lechi, G.; Zilioli, E. Principi e Metodi Di Telerilevamento; CittaStudi: Milano, Italy, 2006. [Google Scholar]
  71. Rodarmel, C.; Shan, J. Principal Component Analysis for Hyperspectral Image Classification. Surv. Land Inf. Sci. 2002, 62, 115–122. [Google Scholar]
  72. Loughlin, W.P. Principal Component Analysis for Alteration Mapping. Photogramm. Eng. Remote Sens. 1991, 57, 1163–1169. [Google Scholar]
  73. Abate, N.; Frisetti, A.; Marazzi, F.; Masini, N.; Lasaponara, R. Multitemporal–Multispectral UAS Surveys for Archaeological Research: The Case Study of San Vincenzo Al Volturno (Molise, Italy). Remote Sens. 2021, 13, 2719. [Google Scholar] [CrossRef]
  74. Lasaponara, A.R.; Masini, B.N. Improving Satellite Quickbird-Based Identification of Landscape Archaeological Features Through Tasseled Cap Transformation and Pca. June 2007. Available online: https://scholar.google.com.sg/scholar?q=Improving+Satellite+Quickbird-Based+Identification+of+Landscape+Archaeological+Features+Through+Tasseled+Cap+Transformation+and+Pca&hl=zh-CN&as_sdt=0&as_vis=1&oi=scholart (accessed on 21 May 2021).
  75. Agapiou, A.; Alexakis, D.D.; Sarris, A.; Hadjimitsis, D.G. Evaluating the Potentials of Sentinel-2 for Archaeological Perspective. Remote Sens. 2014, 6, 2176–2194. [Google Scholar] [CrossRef] [Green Version]
  76. Abate, N.; Elfadaly, A.; Masini, N.; Lasaponara, R. Multitemporal 2016–2018 Sentinel-2 Data Enhancement for Landscape Archaeology: The Case Study of the Foggia Province, Southern Italy. Remote Sens. 2020, 12, 1309. [Google Scholar] [CrossRef] [Green Version]
  77. Kruse, F.A.; Lefkoff, A.B.; Boardman, J.W.; Heidebrecht, K.B.; Shapiro, A.T.; Barloon, P.J.; Goetz, A.F.H. The Spectral Image Processing System (SIPS)—Interactive Visualization and Analysis of Imaging Spectrometer Data. Remote Sens. Environ. 1993, 44, 145–163. [Google Scholar] [CrossRef]
  78. Du, Q.; Yang, H. Similarity-Based Unsupervised Band Selection for Hyperspectral Image Analysis. IEEE Geosci. Remote Sens. Lett. 2008, 5, 564–568. [Google Scholar] [CrossRef]
  79. Sun, K.; Geng, X.; Ji, L. Exemplar Component Analysis: A Fast Band Selection Method for Hyperspectral Imagery. IEEE Geosci. Remote Sens. Lett. 2014, 12, 998–1002. [Google Scholar]
  80. Castaldi, F. Sentinel-2 and Landsat-8 Multi-Temporal Series to Estimate Topsoil Properties on Croplands. Remote Sens. 2021, 13, 3345. [Google Scholar] [CrossRef]
  81. Wang, J.; Ding, J.; Yu, D.; Ma, X.; Zhang, Z.; Ge, X.; Teng, D.; Li, X.; Liang, J.; Lizaga, I.; et al. Capability of Sentinel-2 MSI Data for Monitoring and Mapping of Soil Salinity in Dry and Wet Seasons in the Ebinur Lake Region, Xinjiang, China. Geoderma 2019, 353, 172–187. [Google Scholar] [CrossRef]
  82. Wang, J.; Peng, J.; Li, H.; Yin, C.; Liu, W.; Wang, T.; Zhang, H. Soil Salinity Mapping Using Machine Learning Algorithms with the Sentinel-2 MSI in Arid Areas, China. Remote Sens. 2021, 13, 305. [Google Scholar] [CrossRef]
  83. Centamore, E.; Crescenti, U.; Dramis, F. 368 Avezzano. Available online: https://www.isprambiente.gov.it/Media/carg/368_AVEZZANO/Foglio.html (accessed on 21 May 2021).
  84. Spectroscopy Lab. Available online: https://www.usgs.gov/labs/spec-lab (accessed on 21 May 2021).
  85. Hochberg, E.J.; Andréfouët, S.; Tyler, M.R. Sea Surface Correction of High Spatial Resolution Ikonos Images to Improve Bottom Mapping in Near-Shore Environments. IEEE Trans. Geosci. Remote Sens. 2003, 41, 1724–1729. [Google Scholar] [CrossRef]
  86. Zoffoli, M.L.; Frouin, R.; Kampel, M. Water Column Correction for Coral Reef Studies by Remote Sensing. Sensors 2014, 14, 16881–16931. [Google Scholar] [CrossRef]
  87. Lyons, M.B.; Roelfsema, C.M.; Kennedy, E.V.; Kovacs, E.M.; Borrego-Acevedo, R.; Markey, K.; Roe, M.; Yuwono, D.M.; Harris, D.L.; Phinn, S.R. Mapping the World’s Coral Reefs Using a Global Multiscale Earth Observation Framework. Remote Sens. Ecol. Conserv. 2020, 6, 557–568. [Google Scholar] [CrossRef] [Green Version]
  88. Roelfsema, C.; Kovacs, E.; Ortiz, J.C.; Wolff, N.H.; Callaghan, D.; Wettle, M.; Ronan, M.; Hamylton, S.M.; Mumby, P.J.; Phinn, S. Coral Reef Habitat Mapping: A Combination of Object-Based Image Analysis and Ecological Modelling. Remote Sens. Environ. 2018, 208, 27–41. [Google Scholar] [CrossRef]
  89. Roelfsema, C.M.; Kovacs, E.M.; Ortiz, J.C.; Callaghan, D.P.; Hock, K.; Mongin, M.; Johansen, K.; Mumby, P.J.; Wettle, M.; Ronan, M. Habitat Maps to Enhance Monitoring and Management of the Great Barrier Reef. Coral Reefs 2020, 39, 1039–1054. [Google Scholar] [CrossRef]
  90. Spalding, M.D.; Fox, H.E.; Allen, G.R.; Davidson, N.; Ferdaña, Z.A.; Finlayson, M.A.X.; Halpern, B.S.; Jorge, M.A.; Lombana, A.L.; Lourie, S.A. Marine Ecoregions of the World: A Bioregionalization of Coastal and Shelf Areas. BioScience 2007, 57, 573–583. [Google Scholar] [CrossRef] [Green Version]
  91. Lee, Z.; Carder, K.L.; Arnone, R.A. Deriving Inherent Optical Properties from Water Color: A Multiband Quasi-Analytical Algorithm for Optically Deep Waters. Appl. Opt. 2002, 41, 5755–5772. [Google Scholar] [CrossRef]
  92. Li, J.; Yu, Q.; Tian, Y.Q.; Becker, B.L. Remote Sensing Estimation of Colored Dissolved Organic Matter (CDOM) in Optically Shallow Waters. ISPRS J. Photogramm. Remote Sens. 2017, 128, 98–110. [Google Scholar] [CrossRef] [Green Version]
  93. Li, J.; Knapp, D.E.; Schill, S.R.; Roelfsema, C.; Phinn, S.; Silman, M.; Mascaro, J.; Asner, G.P. Adaptive Bathymetry Estimation for Shallow Coastal Waters Using Planet Dove Satellites. Remote Sens. Environ. 2019, 232, 111302. [Google Scholar] [CrossRef]
  94. Hedley, J.D.; Harborne, A.R.; Mumby, P.J. Simple and Robust Removal of Sun Glint for Mapping Shallow-Water Benthos. Int. J. Remote Sens. 2005, 26, 2107–2112. [Google Scholar] [CrossRef]
  95. Mumby, P.J.; Clark, C.D.; Green, E.P.; Edwards, A.J. Benefits of Water Column Correction and Contextual Editing for Mapping Coral Reefs. Int. J. Remote Sens. 1998, 19, 203–210. [Google Scholar] [CrossRef]
  96. Kay, S.; Hedley, J.D.; Lavender, S. Sun Glint Correction of High and Low Spatial Resolution Images of Aquatic Scenes: A Review of Methods for Visible and near-Infrared Wavelengths. Remote Sens. 2009, 1, 697–730. [Google Scholar] [CrossRef]
  97. Trocciola, A.; Minopoli, C.; Pica, R. Elaborazione di un itinerario subacqueo sul banco roccioso di Sinuessa. Energ. Ambiente Innov. 2017, 54–59. [Google Scholar] [CrossRef]
  98. Novoa, S.; Doxaran, D.; Ody, A.; Vanhellemont, Q.; Lafon, V.; Lubac, B.; Gernez, P. Atmospheric Corrections and Multi-Conditional Algorithm for Multi-Sensor Remote Sensing of Suspended Particulate Matter in Low-to-High Turbidity Levels Coastal Waters. Remote Sens. 2017, 9, 61. [Google Scholar] [CrossRef]
Figure 2. Methodological workflow followed to study capabilities and limits of PRISMA sensor.
Land 11 02070 g002
Figure 3. Display of bad bands in the Alba Fucens VNIR dataset: the trend of the statistical parameters (mean and standard deviation) with interruptions relating to bad bands can be observed.
Land 11 02070 g003
Figure 4. Alba Fucens “good band n. 24”: (a) VNIR image; and (b) histogram.
Land 11 02070 g004
Figure 5. Bad bands images. Alba Fucens: (a) VNIR cube, band 2; (b) SWIR cube, band 27; Sinuessa and (c) VNIR cube, band 61. The red dots and lines represent the pixels whose values are one line all at zero or Not A Number.
Land 11 02070 g005
Figure 6. Bad bands histograms. Alba Fucens: (a) VNIR cube, band 2; and (b) SWIR cube, band 27; Sinuessa: (c) VNIR cube, band 61.
Land 11 02070 g006
Figure 7. SWIR band (a) 57 (1.57 um) and (b) 163 (2.43 um) original images and histograms.
Land 11 02070 g007
Figure 8. SWIR band (a) 57 (1.57 um) (b) and 163 (2.43 um) images and histograms after denoising processing.
Land 11 02070 g008
Figure 9. Alba Fucens: PCA (eigenvalues) in the VNIR dataset; the PCA plot shows that the information is concentrated in the first four components, in particular the highest values are found in PC-1, PC-2 and PC-3.
Land 11 02070 g009
Figure 10. Sinuessa: PCA (eigenvalues) in the VNIR dataset; the PCA plot shows that the information is concentrated in the first three components; in particular the highest values are found in PC-1, PC-2.
Land 11 02070 g010
Figure 11. Alba Fucens’ principal component analysis: synthetic bands obtained by the hyperspectral PRISMA VNIR dataset. Notice that the information from the PC-10 can be assimilated to noise.
Land 11 02070 g011
Figure 12. Alba Fucens’ PRISMA VNIR particular comparison referred to RGB (left) and PCA (right) image: in the highlighted central area it can be noted that the soil features are structurally different compared to the surrounding soils.
Land 11 02070 g012
Figure 13. Sinuessa RGB (left) and PCA (right) images: the VNIR PRISMA dataset highlighted the geo-morphological characteristics of the study area in the continental and coastal area.
Land 11 02070 g013
Figure 14. Location of the selected points for spectral signature comparison: (a) Alba Fucens (green: pit; red: rock; dark green: light soil, brown: dark soil; black; Alba Fucens soil); (b) Sinuessa (blue: sea; pink: sand).
Land 11 02070 g014
Figure 15. Alba Fucens’ PRISMA and Sentinel-2 spectral signatures comparison: (a) pits, (b) rocks; (c) light soil, (d) dark soil, (e) archaeological site soil. At 443 nm and 945 nm Sentinel-2 has “Not A Number” for light and dark soils.
Land 11 02070 g015aLand 11 02070 g015b
Figure 16. Sinuessa PRISMA and Sentinel-2 spectral signatures comparison: (a) sand and (b) water. The y-axe, differently from the previous ones, is between 0 and 0.1, in order to better appreciate the two signatures.
Land 11 02070 g016
Figure 17. Sentinel-2 maximum likelihood (ML) and spectral angle mapper (SAM) classification in the Alba Fucens’ AOI: (a) the SAM classification distinguished the archaeological area and two soil types in more detail: around the site (purple class) and in the surrounding (orange class); (b) relationships classification/geology—light soils, dark soils (Red: antropic features, Yellow: light soils, Purple: dark soils, Green: vegetation); and (c) PRISMA SAM classification and geology relationships (Red: antropic features, Orange: dark soils, Light Orange: light soils, Light green: low vegetation, Dark Green: high vegetation; geology map: concession and use by ISPRA—Department for the Geological Survey of Italy).
Land 11 02070 g017aLand 11 02070 g017b
Figure 18. Comparison between the PRISMA spectral signatures in the Alba Fucens area.
Land 11 02070 g018
Publisher’s Note: MDPI stays neutral with regard to jurisdictional claims in published maps and institutional affiliations.

