Review

Performance Comparison of Different Particle Size Distribution Models in the Prediction of Soil Particle Size Characteristics

1
Key Laboratory of Mechanics on Disaster and Environment in Western China, The Ministry of Education of China and School of Civil Engineering and Mechanics, Lanzhou University, Lanzhou 730000, China
2
Engineering Center for Pollution Control and Ecological Restoration in Mining of Gansu Province, Lanzhou City University, Lanzhou 730070, China
3
School of Biological & Environmental Engineering, Xi’an University, Xi’an 710065, China
*
Authors to whom correspondence should be addressed.
Land 2022, 11(11), 2068; https://doi.org/10.3390/land11112068
Submission received: 24 October 2022 / Revised: 14 November 2022 / Accepted: 16 November 2022 / Published: 17 November 2022

Abstract

:
Particle size distribution (PSD) is a rich source of information about soil properties, including soil gradation and soil particle size characteristics. This paper compared the PSD prediction ability of three types of mathematical model. We selected nine models that have been proven to accurately predict sample points in previous studies, and we fit 144 pieces of experimental data on 12 texture classes of soil samples from the UNSODA database. We compared the models’ capability for predicting non-sample points, which is important for predicting soil particle size characteristics. Each model’s ability to predict non-sample points of different texture classes of soil was studied using a comprehensive ranking method. The relative differences in the models’ prediction of non-sample points of different texture classes of soil were analyzed using the relative error method. The results showed no considerable correlation between the number of model parameters and the prediction accuracy. For the various texture classes of soil, the Skaggs model and Weipeng model had the highest accuracy in predicting non-sample points, and the Skaggs model had the widest range of application. The Zhongling model and the Weibull model were better in predicting only one texture class of soil, respectively. The Fredlund model, Kolve model, Rosin model, Van Genuchten model and Best model were not as successful as other models. The Weipeng model overestimated the solid particle mass proportion, while the Skaggs model underestimated it when the clay particle content was greater than 20%. Both the Weipeng model and the Skaggs model demonstrated good prediction accuracy when the particle size was within the silt particle size range. The Skaggs model overestimated the particle mass proportion, while the Weipeng model underestimated it when the particle size was within the sand particle size range.

1. Introduction

Natural soil is typically a three-phase substance consisting of solid, liquid and gas phases. The solid phase contains mineral particles of different sizes, tightly bound to organic matter [1]. These solid particles are the building blocks of the soil skeleton. The size of soil particles in nature varies greatly, from boulders, with a particle size exceeding 200 mm, to silty clay particles, with a size less than 0.002 mm, representing a 100,000-fold difference in particle size [2]. The particle sizes of soil affect its properties. The soil particle size distribution (PSD) refers to the proportions of soil particles of varying sizes (coarse-grained and fine-grained) in the soil solid phase. It is often expressed as a cumulative percentage curve generated from particle diameter data. The PSD is one of the most fundamental soil physical characteristics, as it strongly influences multiple physical properties of soil, such as hydraulic and thermal properties, and is conventionally the focus of soil studies.
A complete PSD can be used to predict important soil properties that cannot be directly measured or are costly to measure [3]. For example, Gupta et al. estimated the soil–water characteristic curves, organic matter content and bulk density of soil using the PSD [4]. Arya and Paris used soil porosity to establish the relationship between soil particle size and soil pore size and then used the Young–Laplace equation to obtain the soil–water characteristic curve [5]. Satyanaga et al. estimated soil–water characteristic curves for gap-graded soil (with only one peak) by using the PSD [6]. Mercan et al. established an empirical expression linking D 10 (the particle size for which 10% of soil particles are finer than this size), density and medium sand ratio in a study of the soil permeability coefficient and PSD [7]. Hou et al. studied the relationship between the fractal characteristics of the PSD and soil permeability and found that the soil permeability increased as the fractal dimension increased [8]. Sahu constructed the ‘Sahu discriminant’ for determining the cause of sediment deposition using the characteristic value of particle size, which represents differences in soil particle size and homogeneity [9]. Later, Visher demonstrated that the PSD of soil is effective for determining the sediment deposition process [10]. Purkait et al. used the PSD to analyze dune formation in deserts [11]. Beke et al. probed the relationship between the PSD and soil erosion [12]. Wei et al. studied the relationship between the fractal dimension of the PSD and shrinkage of granitic soil by using multi-fractal theory, providing a new approach for the prevention of granitic soil shrinkage and erosion [13].
Since the 19th century, many scholars have proposed various models to indicate the PSD of soil. Most of these models can obtain the complete PSD from sample scatter data points created using linear regression. However, due to the distinct advantages and limitations of these numerous models, choosing the most suitable candidate model for a specific soil is difficult [14]. The choice of PSD model for different texture classes of soil can have a large impact on the results [15]. Therefore, the selection of an appropriate PSD model is crucial for the estimation of soil properties.
Several studies have addressed this problem. For example, Buchan et al. collected 79 sets of data from New Zealand soils at different depths and compared the fitting performance of the Jaky model and four lognormal models (Simple Lognormal Model, Shiozawa and Campbell model, Offset-Renormalized Lognormal (ORL) model and Offset-Nonrenormalized Lognormal (ONL) model) [15]. Following a test based on the coefficient of determination   R 2 and Mallows’ C p , they concluded that the ORL model had the broadest scope of application, whereas the Jaky model exhibited the best performance for some texture classes of soil. Bagarello et al. compared the Best model with the Fredlund model using 114 sets of soil data collected from Burundi and found that the Best model was more applicable when the clay content was high [16]. Hwang compared nine PSD models using 1385 sets of Korean soil data and found that the Fredlund model and Skaggs model showed the best fitting performance [17]. Zhao et al. compared the fitting performance of 14 PSD models by using 480 sets of silty soil data from the area around a dam on the Loess Plateau in China and found that increasing the number of parameters did not result in a better model fit and that the two-parameter Weibull model was the most suitable for Loess Plateau soil [18]. Bayat et al. collected 160 sets of Iranian soil data and compared the fitting performance of 36 PSD models in three particle size ranges (<0.002 mm, 0.002–0.05 mm, 0.05–2 mm), finding that the fitting performance of the models varied greatly in different particle size ranges [19]. Afrasiabi et al. evaluated the prediction accuracy of 19 PSD models based on 24 sets of Iranian soil data using 11 evaluation criteria, finding that six models were found to have provided the most accurate results and the modified logistic growth model had the best prediction effect [20].
One of the main purposes of building soil PSD models is to predict the particle size parameters, which reflect the soil characteristics, such as D 50 , which is required in studies of the strain and shear modulus of coarse-grained soil and the estimation of the efficiency of sandy soil–cement grouting; D 10 , D 20 , D 30 and D 90 , which are required for the prediction of the air inflow of sandy soil; the average particle size and coefficient of nonuniformity C u , which are commonly used to describe the soil gradation in soil studies; and D 10 , D 30 , D 50 and D 60 , which are required for calculating the coefficient of curvature C c [21,22,23,24]. These parameters, which are related to the soil particle size characteristics, are often not sample points in soil particle size data (points other than sample points in soil particle size data are hereinafter referred to as ‘non-sample points’). However, when comparing the fitting performance of different models, studies have only compared the models’ ability to fit the sample points and have not taken into account the ability of the models to ‘predict’ non-sample points relevant to the soil particle size characteristics [3,15,16,18,19,20]. These studies have evaluated the overall fitting performance of the models based on the entire PSD curves that they generate. However, a model that performs well at the global level (i.e., in generating the whole PSD curve) may locally fail to accurately predict some non-sample points. These local non-sample points are often particle size parameters, which reflect the soil characteristics.
The main objectives of this study are to (1) compare the fitting performance of nine PSD models that have demonstrated a good fit in previous studies for non-sample points of 12 texture classes of soil; (2) evaluate the function of the models using a comprehensive ranking system that combines four statistical evaluation criteria; and (3) select the PSD models that most accurately predict non-sample points in soil data and further compare their prediction accuracy in different particle size ranges.

2. Materials and Methods
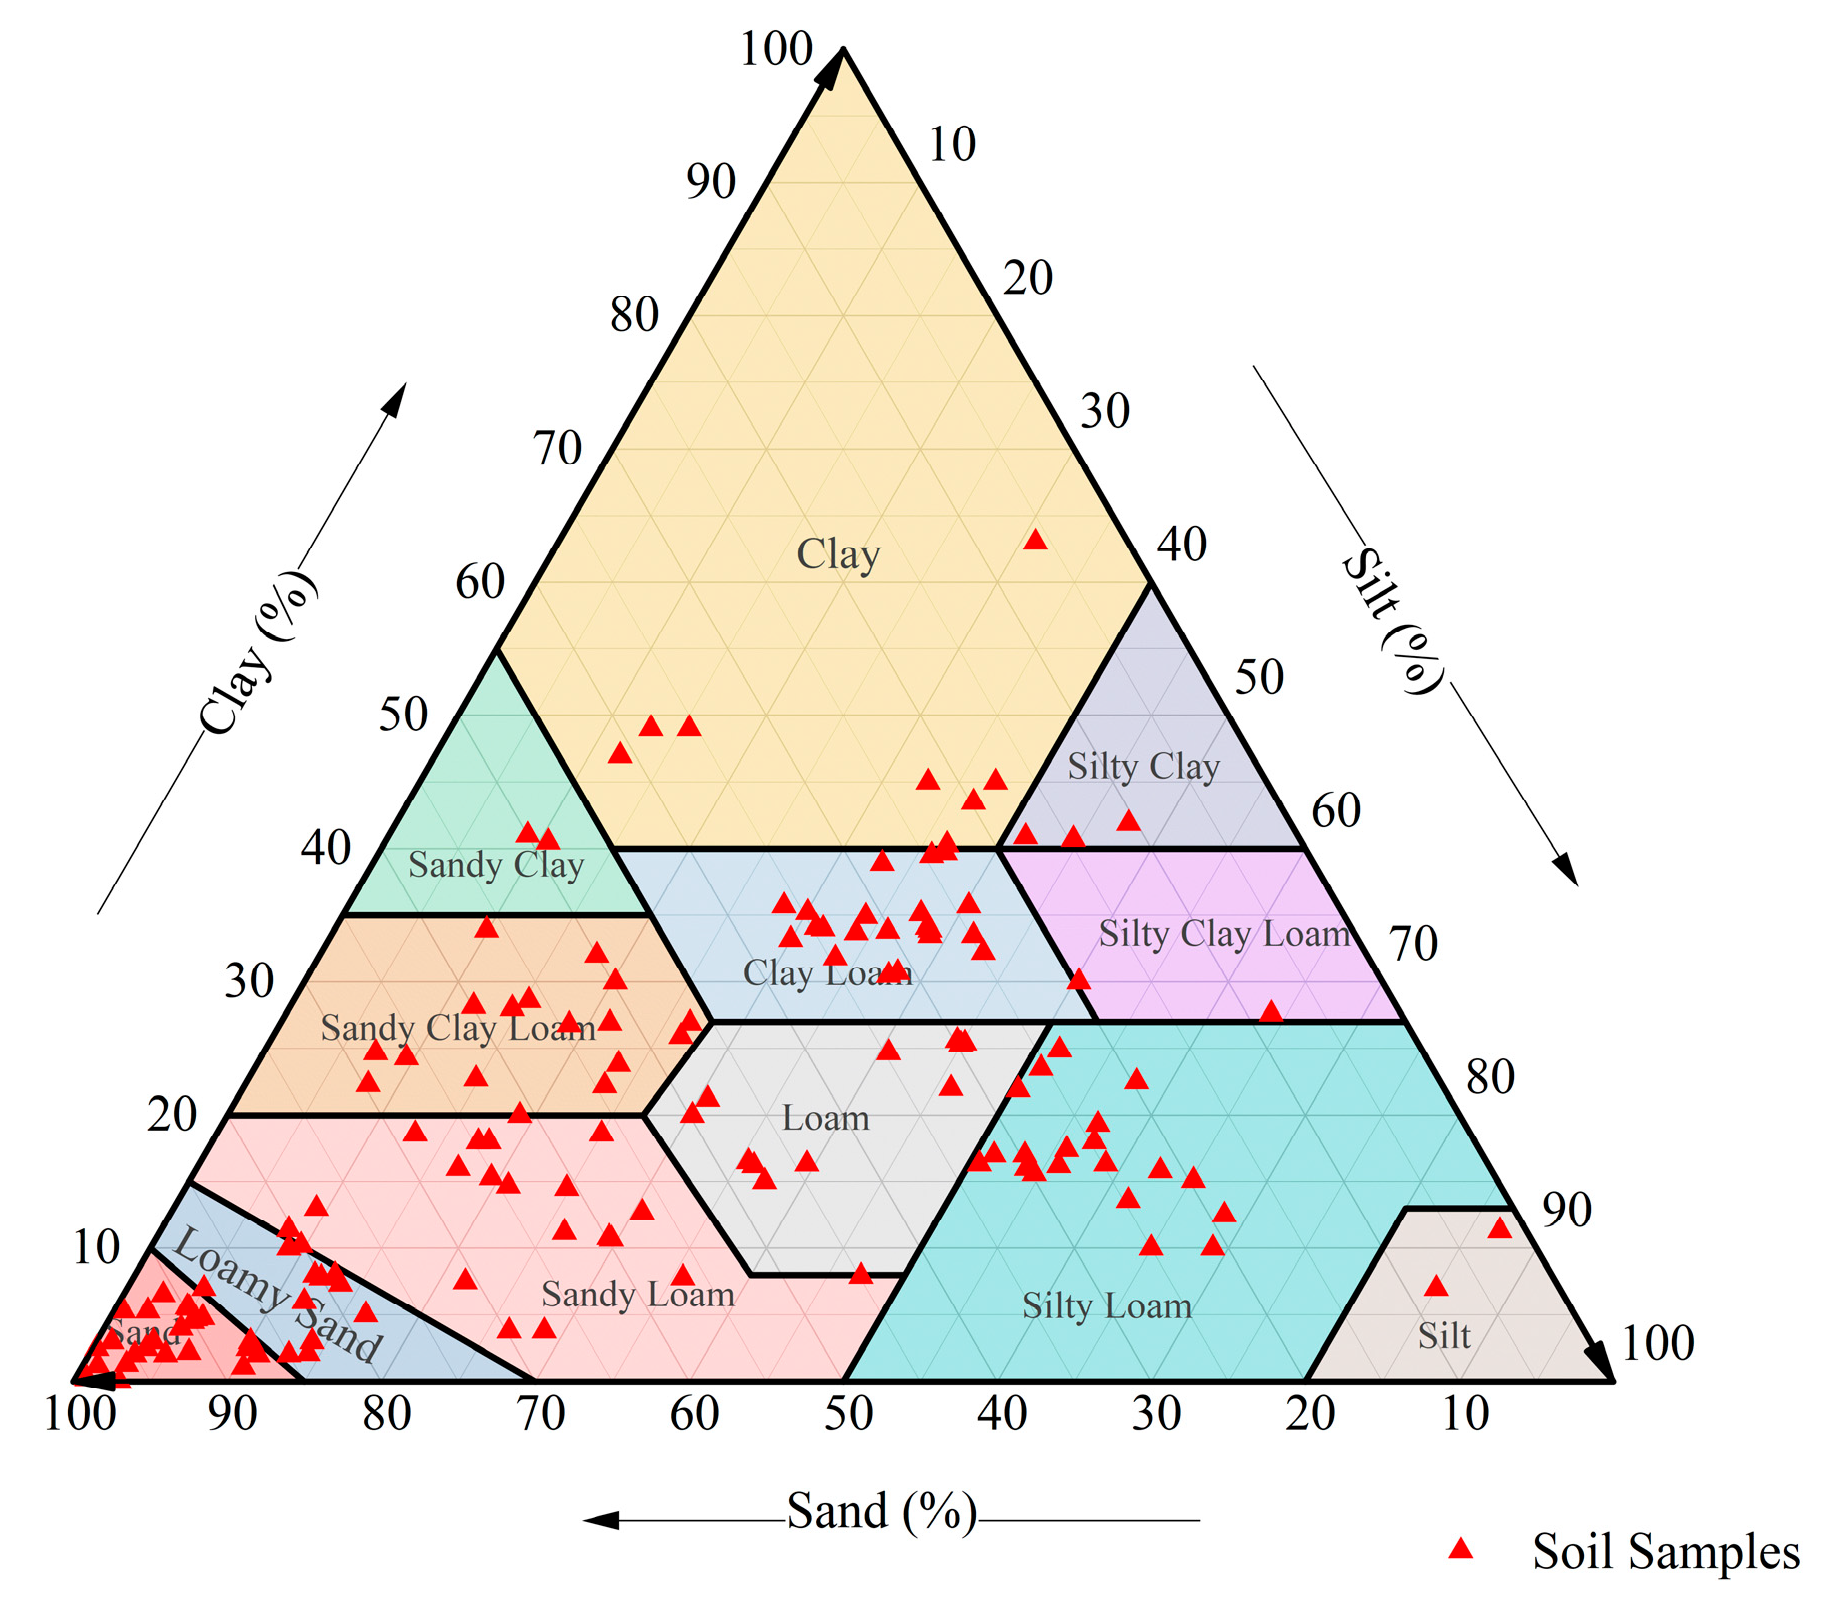
2.1. Soil Data

The data used in this study are from the Unsaturated Soil Hydraulic Database (UNSODA) [25]. UNSODA encompasses data on a wide range of soil texture classes and geographic conditions, such as plains, hills, mountains, deserts and forests. To include as comprehensive a range of soil texture classes as possible, 144 soil samples from different sources were carefully selected for this study, covering 12 soil texture classes in the soil texture triangle, as shown in Figure 1. Clay, silt and sand particles are defined in accordance with the particle size range defined by the United States Department of Agriculture, namely <0.002 mm for clay, 0.002–0.05 mm for silt and 0.05–2 mm for sand.
Most soil particle size data in UNSODA are collected using sieve analysis, hydrometer analysis and pipettes, which are also often used in experiments and ensure the reliability of data. Furthermore, the variety and abundance of soil particle size data in UNSODA minimize the impact of contingencies during sample collection and uncertainties arising from human operations on our study. Table 1 lists the specific numbers and texture classes of the 144 soil samples from UNSODA.

2.2. PSD Models

Most soil PSD models can be classified into three categories based on the form of their mathematical expressions as (1) lognormal models, (2) log-exponential models and (3) power function models.
The lognormal model was originally proposed by Gardner et al. [26]. After summarizing the distribution trends of more than 200 PSD types in the literature, the authors of the mentioned study found that soil particle sizes roughly followed a normal distribution. They also concluded that, considering the wide span of soil particle sizes, a logarithmic expression of particle size data was the most suitable for modelling. On this basis, the two-parameter lognormal model was proposed, and estimation methods for the arithmetic mean and variance of soil particle sizes were given. Buchan improved the fitting performance of the lognormal model by introducing an error function [27]. However, the improved lognormal model was applicable to only half of all soil texture classes in the soil texture triangle. Subsequently, Buchan et al. attempted to improve the applicability of the lognormal model to the remaining soil texture classes by shifting or scaling the model as a whole [15]. However, none of the modified models was satisfactory. The inaccuracies of lognormal models can be attributed to the basic assumption of a symmetric distribution of soil particle sizes, i.e., a symmetric soil PSD curve. In fact, not all soil particle sizes have a symmetric PSD [28].
The oldest log-exponential model, proposed by Jaky, contains only one parameter, in contrast to most PSD models [29]. In general, an increase in the number of fitting parameters improves the fitting performance of a model. However, it also increases the model complexity, which limits the practical use of these models, as more sample points are required to fit the parameters [30]. PSD curve models usually have only two or three parameters. The single-parameter Jaky model is only applicable to some soil texture classes and is less applicable to soil samples with a large gradation span or uneven gradation distribution. Other log-exponential models include the Kolev model, the Vipulanandan model and the Zhuang model [30,31,32]. The Compertz model, based on the logistic growth function, and the Fredlund model, based on the soil–water characteristic curve, are also log-exponential models in terms of mathematical form [28,33].
Power function models can be grouped into two types. The first type includes those obtained by modifying the Weibull distribution, such as the Rosin model, the Bennet model and the Li model [34,35,36]. The second type includes those obtained based on fractal theory, a theory focusing on self-similarity in porous media. On this basis, Tyler proposed the Tyler model of the soil PSD [37]. Later, Millan et al. improved upon the fractal model based on multi-fractal theory [38]. However, as shown by Bayat et al., the difficulty of determining the exact size of each soil sample (which is necessary for identifying self-similarity), and the variation among the sizes of soil samples in different databases, result in the poor fitting performance of the fractal model [19].
In this paper, we select nine PSD models, as shown in Table 2, and compare their prediction accuracies for non-sample points. Some of the models have been found to be the best-fitting models in previous studies, while others have been more recently proposed [16,17,18,19,20]. Among these models, the Fredlund model and the Kolve model are log-exponential models, and the rest are power function models (the initial assumptions of lognormal models are controversial, so this type of model was not selected [28]).

3. Fitting and Comparison of the Model

3.1. Comparison Criteria

We compare the capability of the nine chosen PSD models (Table 2) for predicting non-sample points in different particle size ranges. These models contain two to four fitting parameters. Models with more parameters require more sample points to fit the parameters. At least three soil sample points are required to predict a real soil sample [44]. Therefore, to reduce the error caused by differences in the number of soil sample points during comparison, we only selected soil data containing six or more sample points in the UNSODA.
To compare the fitting performance of each model for non-sample points, we removed one sample point from each set of soil data in the order of smallest to largest particle sizes firstly. Then, we used an iterative non-linear regression program to fit the parameters of each model to the soil data. Next, we compared the predicted points in the PSD curve that was obtained from model fitting with the previously removed sample points to assess their degree of coincidence. In this way, we obtained the fitting performance of each PSD model for the non-sample points. The non-linear least square method is used in this process.
Soil sample No. 3010 from UNSODA is taken as an example to illustrate the difference among the models in terms of the fitting of sample points and prediction of non-sample points. As shown in Figure 2, there are six sample points in the graph of soil sample No. 3010, with particle sizes of 1 μ m , 5 μ m , 10 μ m , 50 μ m , 250 μ m and 1000 μ m . Figure 2a shows the graph of each model fitted using these six sample points, and Figure 2b shows the graph of each model fitted using the five sample points except that with a particle size of 50 μ m . It can be seen that after the sample point with a particle size of 50 μ m is removed, the cumulative particle content predicted by the W (Weipeng) model and S (Skaggs) model for particle sizes from 100 μ m to 1000 μ m shows a significant reduction.
As shown in Table 3, after the sample point with a particle size of 50 μ m is removed, the Fred (Fredlund) model, W model, S model, and Z (Zhongling) model were used to predict the higher cumulative content of particle sizes of 50 μ m in the fitted curves, while the K (Kolve) model, Wb (Weibull) model, R (Rosin) model, VG (Van Genuchten) model and Best model were used to predict the lower cumulative content of these particles. Before the sample point with a particle size of 50 μ m is removed, the Fred model’s prediction is the closest to the sample point, whereas, after the removal, the S model achieves the closest prediction. Evidently, the fitting performance of all the models changes significantly after the sample point with a particle size of 50 μ m is removed. Each PSD model shows a considerable difference in its ability to predict sample points and non-sample points.

3.2. Evaluation Criteria

Regarding how to select the optimal model, the simplest and most intuitive criterion is the smallest difference between the sample data and the predicted data. In this study, three commonly used statistical metrics, namely the coefficient of determination ( R 2 ), root-mean-square error ( R M S E ) and mean absolute error ( M A E ), are used to evaluate each model’s non-sample point prediction accuracy.
To account for the risk of ‘over-fitting’ of models with a large number of parameters, the corrected Akaike information criterion ( A I C c ) is also used for evaluation. Specifically, when evaluating the fitting performance, the A I C c applies a ‘penalty’ to models with more parameters than others. This criterion has been widely used to evaluate the fitting performance of PSD models in previous studies [3,17,18,19,20,45]. We chose to use the formulation of the A I C c described by Bayat et al. [19].
For model comparison, a stronger PSD prediction ability is indicated by R M S E and M A E values closer to 0, R 2 values closer to 1 and A I C c values as small as possible. The detailed calculation methods of these four evaluation metrics are shown in Table 4.

4. Results and Discussion

Figure 3 displays the R 2 , R M S E , M A E and A I C c values of the nine PSD models that are used to predict the non-sample points among the 144 samples of different soil texture classes given in Table 1. In general, the prediction accuracy of each model for non-sample points, which is an important consideration for model selection, is lower than that for sample points reported in previous studies of these models, consistent with our expectation [17,19,20].
The Wb model, R model, W model, VG model and S model have good prediction effects on non-sample points. The K model has the largest R M S E and M A E , and the smallest R 2 , indicating unsatisfactory performance in fitting non-sample points. The Z model does not perform well enough among the nine models, but it does not seem to be the worst. The Fred model has the largest A I C c due to its four fitting parameters. In addition, the Fred model performs relatively poorly in terms of   R M S E , M A E and R 2 , indicating that the number of model parameters does not correlate significantly with the prediction accuracy. Therefore, in the following further comparison of the effect of each model, the model with the worst prediction effect under each of the four evaluation criteria is removed, so the K model and Fred model are no longer considered.
To comprehensively evaluate the performance of the remaining seven PSD models, the following ranking system is adopted [46,47,48]:
R a n k = 1 n i = 1 n Scor e i
where n is the number of metrics, and Scor e i is the ranking of each PSD model in terms of performance under metric i . Scor e i takes a value of 1 for the model with the best performance and 7 for the model with the worst performance. By summing the scores of all the metrics to obtain a comprehensive evaluation, the seven PSD models are ranked from 1 to 7. For this purpose, each metric is converted into a dimensionless value, similar to the normalization process.
The ranking of the seven PSD models on the basis of the above equation is shown in Figure 4. The S model outperforms all other models with respect to data fitting on the following soil texture classes: loamy sand, sandy loam, clay loam, loam, silt loam and silty clay. The W model has the best fitting performance for data on sand, sandy clay loam, sandy clay and silty clay loam. Although the Z model fits the soil data less well overall, it has the best fitting performance for data on silt. The Wb model has the best fitting performance for data on clay. Overall, the S model performs comparatively well for data on all 12 studied texture classes of soil, whereas the W model, the Z model and the Wb model perform well on only one soil texture class each, while the R model, the Best model and the VG model show poor performance.
To further determine the prediction errors of the seven remaining PSD models, we analyzed the relative differences among them in predicting the non-sample points of the 12 studied texture classes of soil. Figure 5 shows the relative differences (as unitless numbers) among the seven models, as calculated by the following equation [46]:
R e l a t i v e   d i f f e r e n c e = m o d e l m m o d e l n 1 ,
where m o d e l m is the error in the prediction of non-sample points by model m, and m o d e l n is the error in the prediction of non-sample points by model n.
The soil texture class for which the models showed the greatest differences in their ability to predict non-sample points is sandy clay. For this soil texture class, the largest relative difference in performance is between the Z model and the other models. Meanwhile, the Wb model and the W model differed most strongly in the prediction of sandy clay data. This indicated that there are large differences among models in predicting non-sample points of different texture classes of soil.
The results further showed that the nine PSD models exhibit great differences in the ability to fit sample points for soil with different particle size ranges (<0.002 mm for clay particles, 0.002–0.05 mm for silt particles and 0.05–2 mm for sand particles) [3,15,19,20,28]. Therefore, we further studied the prediction accuracy of the S model and the W model, which showed the best accuracy for non-sample points in all texture classes of soil.
We randomly selected 23 soil samples from the 144 samples. The prediction accuracies of the S model and the W model for the non-sample points in the particle size ranges of clay, silt and sand particles are shown in Figure 6. The horizontal coordinate represents the particle mass, as a proportion of the total mass of the soil sample, measured for soils with each particle size. The vertical coordinate represents the proportion of particle mass predicted by the model. The closer the predicted point to the straight line (slope = 1) that passes through the origin of the coordinates, the better the model’s prediction accuracy. In the size range of clay particles (Figure 6a), when the particle content is greater than 20%, the points predicted by the W model are mostly below the straight line, which means that the model generally underestimates the content of particles relative to the actual data. Conversely, the points predicted by the S model are mostly above the straight line, which means that this model generally overestimates the content of particles in the clay particle size range. In the size range of silt particles (Figure 6b), the W model and the S model had similar prediction accuracies. In the size range of sand particles (Figure 6c), the W model generally underestimated the content of particles, while the S model generally overestimated the content. As can be seen from R2, there is a significant decrease in the accuracy of the model in predicting non-sample points for different types of soil when compared to the Bayat study on sample points [19].

5. Summary

In this work, we evaluated the performance of nine PSD models in predicting non-sample points of different texture classes of soil. The flexibility, simplicity and practical applicability of the model parameters are all important considerations when selecting a suitable PSD model.
The results showed that the PSD models’ ability to predict non-sample points differed considerably from their ability to predict sample points; additionally, for non-sample points, the models showed significant differences in the accuracy of prediction of different texture classes of soil. Among the nine models, the S model, with two parameters, and the W model, with three parameters, are the most accurate in predicting non-sample points. The Fred model, with four parameters, does not have the best prediction accuracy, indicating that the number of model parameters does not correlate significantly with the prediction accuracy. Both the S model and the W model differ in their ability to predict non-sample points in different particle size ranges. When the clay particle content is greater than 20%, the S model overestimates the mass proportion of particles, and the W model underestimates it. Both the W model and the S model show good prediction accuracy when the particle size is within the silt range. When the particle size is within the sand range, the S model overestimates the particle mass proportion, and the W model underestimates it.
The results of this study provide a reference for selecting PSD models suitable for different texture classes of soil to facilitate further studies on specific physical and mechanical properties of soil.

Author Contributions

H.Z. wrote the original draft preparation and conducted data curation and formal analysis; T.G. and C.W. were responsible for the supervision; Z.C. was responsible for data curation; Q.K. was responsible for the review and conceptualization; X.X. was responsible for project administration. All authors have read and agreed to the published version of the manuscript.

Funding

This research was supported by the National Natural Science Foundation of China (Project Type: National; Project No.: 41902267; Project Sponsor: Chong Wang); the National Natural Science Foundation of China (Project Type: National; Project No.: 31860176; Project Sponsor: Tianpeng Gao; 31860176); the Distinguished Youth Foundation of Gansu Province (Project Type: Provincial; Project No.: 22JR5RA392; Project Sponsor: Chong Wang); the Construction of Science and Technology Project of Gansu Province (Project Type: Provincial; Project No.: JK2022-09; Project Sponsor: Chong Wang); the Fundamental Research Foundations for the Central Universities (Project Type: School-class; Project No.: lzujbky-2020-2; Project Sponsor: Chong Wang); the Foundation of State Key Laboratory of Frozen Soil Engineering (Project Type: Provincial; Project No.: SKLFSE201904; Project Sponsor: Chong Wang); the Key Research & Development Program of Gansu (Project Type: Provincial; Project No.: 20YF3FA037; Project Sponsor: Tianpeng Gao); and the Key Research & Development Program of Shaanxi (Project Type: Provincial; Project No.: 2020ZDLSF06-06; Project Sponsor: Tianpeng Gao).

Institutional Review Board Statement

Not applicable.

Informed Consent Statement

Not applicable.

Data Availability Statement

Not applicable.

Conflicts of Interest

The authors declare no conflict of interest.

References

  1. Wang, E.; Cruse, R.M.; Zhao, Y.; Chen, X. Quantifying soil physical condition based on soil solid, liquid and gaseous phases. Soil Till. Res. 2015, 146, 4–9. [Google Scholar] [CrossRef]
  2. Xu, Z.; Zhang, C.; Qiang, Y.; Wang, X.; Yan, X. Hydrodynamics and bed morphological characteristics around a boulder in a gravel stream. Water Sci. Tech-W. Sup. 2020, 20, 395–407. [Google Scholar]
  3. Hwang, S.I.; Lee, K.P.; Lee, D.S.; Powers, S.E.; Powers, S.E. Models for Estimating Soil Particle-Size Distributions. Soil Sci. Soc. Am. J. 2002, 66, 1143–1150. [Google Scholar] [CrossRef]
  4. Gupta, S.C.; Larson, W.E. Estimating soil water retention characteristics from particle size distribution, organic matter percent, and bulk density. Water Resour. Res. 1979, 15, 1633–1635. [Google Scholar] [CrossRef]
  5. Arya, L.M.; Paris, J.F. A physicoempirical model to predict the soil moisture characteristic from particle size distribution and bulk density data. Sci. Soc. Am. J. 1981, 45, 1023–1030. [Google Scholar] [CrossRef]
  6. Satyanaga, A.; Rahardjo, R.; Zhai, Q. Estimation of unimodal water characteristic curve for gap-graded soil. Soils Found. 2017, 57, 789–801. [Google Scholar] [CrossRef]
  7. Onur, E.M.; Shakoor, A. Relationships Between Grain Size Distribution Indexes and Permeability of Sands; Springer International Publishing: Berlin/Heidelberg, Germany, 2015; Volume 3, pp. 287–290. [Google Scholar]
  8. Hou, K.; Qian, H.; Zhang, Y.; Qu, W.; Ren, W.; Wang, H. Relationship between fractal characteristics of grain-size and physical properties: Insights from a typical loess profile of the loess Plateau. Catena 2021, 207, 105653. [Google Scholar] [CrossRef]
  9. Sahu, B.K. Depositional Mechanisms from the Size Analysis of Clastic Sediments. J. Sediment. Res. 1964, 34, 73–83. [Google Scholar]
  10. Visher, G.S. Grain Size Distributions and Depositional Processes. J. Sediment. Res. 1969, 39, 1074–1106. [Google Scholar]
  11. Purkait, B. The use of grain-size distribution patterns to elucidate aeolian processes on a transverse dune of Thar Desert. India Earth Surf. Proc. Land. 2010, 35, 525–530. [Google Scholar] [CrossRef]
  12. Beke, G.J.; Lindwall, C.W.; Entz, T.; Channappa, T.C. Sediment and runoff water characteristics as influenced by cropping and tillage practices. Can. J. Soil Sci. 1989, 69, 639–647. [Google Scholar] [CrossRef]
  13. Wei, Y.; Wu, X.; Xia, J.; Cai, C. Relationship between granitic soil particle-size distribution and shrinkage properties based on multifractal method. Pedosphere 2020, 30, 853–862. [Google Scholar] [CrossRef]
  14. Bayat, H.; Rastho, M.; Zadeh, M.M.; Vereecken, H. Particle size distribution models, their characteristics and fitting capability. J. Hydrol. 2015, 529, 872–889. [Google Scholar] [CrossRef]
  15. Buchan, G.D.; Grewal, K.S.; Robson, A.B. Improved Models of Particle-Size Distribution: An Illustration of Model Comparison Techniques. Soil Sci. Soc. Am. J. 1993, 57, 901–908. [Google Scholar] [CrossRef] [Green Version]
  16. Bagarello, V.; Provenzano, G.; Sgroi, A. Fitting particle size distribution models to data from Burundian soils for the BEST procedure and other purposes. Biosyst. Eng. 2009, 104, 435–441. [Google Scholar] [CrossRef]
  17. Hwang, S.I. Effect of texture on the performance of soil particle-size distribution models. Geoderma 2004, 123, 363–371. [Google Scholar] [CrossRef]
  18. Zhao, P.; Shao, M.; Horton, R. Performance of soil particle-size distribution models for describing deposited soils adjacent to constructed dams in the China Loess Plateau. Acta Geophys. 2011, 59, 124–138. [Google Scholar] [CrossRef]
  19. Bayat, H.; Rastgou, M.; Nemes, A.; Mansourizadehc, M.; Zamani, P. Mathematical models for soil particle-size distribution and their overall and fraction-wise fitting to measurements. Eur. J. Soil Sci. 2017, 68, 345–364. [Google Scholar] [CrossRef]
  20. Afrasiabi, F.; Khodaverdiloo, H.; Asadzadeh, F.; Genuchten, M.T. Comparison of alternative soil particle-size distribution models and their correlation with soil physical attributes. J. Hydrol. Hydromech. 2019, 67, 179–190. [Google Scholar] [CrossRef] [Green Version]
  21. Liu, X.; Zou, D.; Liu, J.; Zhou, C.; Zheng, B. Experimental study to evaluate the effect of particle size on the small strain shear modulus of coarse-grained soils. Measurement 2020, 163, 107954. [Google Scholar] [CrossRef]
  22. Sakaki, T.; Komatsu, M.; Takahashi, M. Rules-of-Thumb for Predicting Air-Entry Value of Disturbed Sands from Particle Size. Soil Sci. Soc. Am. J. 2014, 78, 454–464. [Google Scholar] [CrossRef]
  23. Mohammed, A.; Mahmood, W. Estimating the efficiency of the sandy soils-cement based grout interactions from Particle size distribution (PSD). Geomech. Geoengin. 2019, 16, 81–98. [Google Scholar] [CrossRef]
  24. Xu, Y.; Liu, J.; Chai, X.; Shi, S. Experimental Study on Measurement of Drag Coefficient of Sandy Soil Nonlinear Vadose. Adv. Civ. Eng. 2022. [Google Scholar] [CrossRef]
  25. Nemes, A.; Schaap, M.G.; Leij, F.J.; Wösten, J.H.M. Description of the unsaturated soil hydraulic database UNSODA version 2.0. J. Hydrol. 2001, 251, 151–162. [Google Scholar] [CrossRef]
  26. Gardner, W.R. Representation of Soil Aggregate-Size Distribution by a Logarithmic-Normal Distribution. Soil Sci. Soc. Am. J. 1956, 20, 151–153. [Google Scholar] [CrossRef]
  27. Buchan, G.D. Applicability of the simple lognormal model to particle-size distribution in soils. Soil Sci. 1989, 147, 155–161. [Google Scholar] [CrossRef]
  28. Fredlund, M.D.; Fredlund, D.G.; Wilson, G.W. An equation to represent grain-size distribution. Can. Geotech. J. 2000, 37, 817–827. [Google Scholar] [CrossRef]
  29. Jaky, J. Soil Mechanics; Egyetemi Nyomada: Budapest, Hungary, 1944. [Google Scholar]
  30. Vipulanandan, C.; Asce, M.; Ozgurel, H.G. Simplified Relationships for Particle-Size Distribution and Permeation Groutability Limits for Soils. J. Geotech. Geoenviron. 2009, 135, 1190–1197. [Google Scholar] [CrossRef]
  31. Kolev, B.; Rousseva, S.; Dimitrov, D. Derivation of soil water capacity parameters from standard soil texture information for Bulgarian soils. Ecol. Model. 1996, 84, 315–319. [Google Scholar] [CrossRef]
  32. Zhuang, J.; Jin, Y.; Miyazaki, T. Estimating water retention characteristic from soil particle-size distribution using a non-similar media concept. Soil Sci. 2001, 166, 308–321. [Google Scholar] [CrossRef]
  33. Nemes, A.; Wösten, J.H.M.; Lilly, A.; Voshaar, J.H.O. Evaluation of different procedures to interpolate particle-size distributions to achieve compatibility within soil databases. Geoderma 1999, 90, 187–202. [Google Scholar] [CrossRef]
  34. Rosin, P.; Rammler, E. The Laws Governing the Fineness of Powdered Coal. J. Inst. Fuel 1933, 7, 9–36. [Google Scholar]
  35. Bennet, J. Broken coal. J. Inst. Fuel 1936, 10, 22–39. [Google Scholar]
  36. Li, Y.; Huang, C.; Wang, B.; Tian, X.; Liu, J. A unified expression for grain size distribution of soils. Geoderma 2017, 288, 105–119. [Google Scholar]
  37. Tyler, S.W.; Wheatcraft, S.W. Fractal Scaling of Soil Particle-Size Distributions: Analysis and Limitations. Soil Sci. Soc. Am. J. 1992, 56, 362–369. [Google Scholar] [CrossRef]
  38. Millán, H.; González-Posada, M.; Aguilar, M.; Domínguez, J.; Céspedes, L. On the fractal scaling of soil data. Particle-size distributions. Geoderma 2003, 117, 117–128. [Google Scholar] [CrossRef]
  39. Wang, W.; Liu, J.; Zhao, B.; Zhang, J.; Li, X.; Yan, Y. Critical Evaluation of Particle Size Distribution Models Using Soil Data Obtained with a Laser Diffraction Method. PLoS ONE 2015, 10, 1–18. [Google Scholar]
  40. Haverkamp, R.; Parlange, J.Y. Predicting The Water-retention Curve From Particle-size Distribution: Sandy Soils without Organic Matter. Soil Sci. 1986, 142, 325–339. [Google Scholar] [CrossRef]
  41. Skaggs, T.H.; Arya, L.M.; Shouse, P.J.; Mohanty, B.P. Estimating particle-size distribution from limited soil texture data. Soil Sci. Soc. Am. J. 2001, 65, 1038–1044. [Google Scholar] [CrossRef]
  42. Lassabatère, L.; Angulo-Jaramillo, R.; Soria Ugalde, J.M.; Cuenca, R.; Braud, I.; Haverkamp, R. Beerkan Estimation of Soil Transfer Parameters through Infiltration Experiments—BEST. Soil Sci. Soc. Am. J. 2006, 70, 521–532. [Google Scholar] [CrossRef]
  43. Guo, Z.; Chang, C.; Zou, X.; Wang, R.; Li, J.; Li, Q. A model for characterizing dry soil aggregate size distribution. Catena 2020, 198, 105018. [Google Scholar] [CrossRef]
  44. Shirazi, M.A.; Boersma, L.; Hart, J.W. A Unifying Quantitative Analysis of Soil Texture: Improvement of Precision and Extension of Scale. Soil Sci. Soc. Am. J. 1988, 52, 181–190. [Google Scholar] [CrossRef]
  45. Rastgou, M.; Bayat, H.; Mansoorizadeh, M. Developing conceptual and empirical models for well- and gap-graded soil particle size distribution (PSD) curve. Arch. Agron. Soil Sci. 2021, 13, 1770–1782. [Google Scholar] [CrossRef]
  46. Yang, S.; Li, R.; Wu, T.; Wu, X.; Zhao, L.; Hu, G.; Zhu, X.; Du, Y.; Xiao, Y.; Zhang, Y.; et al. Evaluation of soil thermal conductivity schemes incorporated into CLM5.0 in permafrost regions on the Tibetan Plateau. Geoderma 2021, 401, 115330. [Google Scholar] [CrossRef]
  47. Brunke, M.A.; Fairall, C.W.; Zeng, X.; Eymard, L.; Curry, J. Which Bulk Aerodynamic Algorithms are Least Problematic in Computing Ocean Surface Turbulent Fluxes? J. Clim. 2003, 16, 619–635. [Google Scholar] [CrossRef]
  48. Wang, A.; Zeng, X. Evaluation of multireanalysis products with in situ observations over the Tibetan Plateau. J. Geophys. Res. 2012, 117, D05102. [Google Scholar] [CrossRef]
Figure 1. Textural distribution of the 144 soil samples.
Land 11 02068 g001
Figure 2. Comparison of the effect of sample point fitting and non-sample point prediction: (a) the graph of each model fitted using these six sample points, (b) the graph of each model fitted using the five sample points except that with a particle size of 50 μ m .
Land 11 02068 g002
Figure 3. Box plots of the statistical criteria used to describe the accuracy of 9 models in fitting the cumulative particle size distribution data of 144 soil samples. The box plots show medians, interquartile ranges and outliers.
Land 11 02068 g003
Figure 4. Comprehensive rank scores for the simulated soil non-sample points based on coefficient of determination (R2), root-mean-square error (RMSE), mean absolute error (MAE) and corrected Akaike’s information criterion (AICc) for different texture classes of soil. Each scheme is ranked from 1 (best) to 7 (worst).
Land 11 02068 g004
Figure 5. The absolute values of differences in seven soil particle size distribution models among twelve soil texture classes.
Land 11 02068 g005
Figure 6. Results of the fitting accuracy of the W model and the S model: (a) clay, (b) silt, (c) sand. R2: (a) clay W (0.8803), S (0.8932), (b) silt W (0.9707), S (0.9759), (c) sand W (0.9735), S (0.9758).
Land 11 02068 g006
Table 1. Code and texture classes of UNSODA soil dataset.
Texture ClassUNSODA Codes
loamy sand (LS)1010 1013 1015 1030 1031 1032 1051 1062 1090 1111 1143 1150 1160 1203 3130 3131 3160 3171 4050
sand (S)1014 1020 1024 1042 1052 1054 1060 1072 1075 1110 1142 1460 2342 3060 3070 3080 3140 4001 4021 4660
sandy loam (SL)1091 1101 1131 1161 1202 1204 1210 1213 1380 1381 1430 1440 1450 3010 3200 3290 3291
clay (C)1162 1163 2340 2360 2362
sandy clay loam (SCL)1092 1102 1116 1117 1122 1133 1152 1164 1166 1201 1382 2341 3202 4291
sandy clay (SC)1134 1135
clay loam (CL)1123 1191 1192 1193 1194 1200 3031 3032 3033
loam (L)1190 1212 1370 2320 2321 3190 3191 3192 3195 3293 3303 4574
silt (Si)3214 4670
silt loam (SiL)1280 1281 1282 1340 1341 1342 1350 1351 1352 1490 2000 2001 2002 2010
2011 2012 2351 2464 3090 3091 3210 3262 3360 4030 4040 4672
silty clay (SiC)1360 1361 1383 2350 3030
silty clay loam (SiCL)1362 1371 1372 2463 3100 3101 3102 3103 3110 3111 3112 3113 3212
Table 2. Particle size distribution models.
Model NameModelParameter
Fred [16]
(Fredlund et at., 2000)
P d = 1 l n e + a d n m 1 l n 1 + d r d l n 1 + d r d m 7 a ,   n , m , d r ,
d m = 0.001
K( Kolev) [31]
(Kolev et al., 1996)
P d = a × exp b × log d a ,             b
Wb (Weibull) [38]
(Millan et al., 2003)
P d = a e x p d b c a ,             b ,             c
R (Rosin) [34]
(Rosin et al., 1933)
P d = 1 e x p a d b a ,             b
W (Wang Weipeng) [39]
(Wang Weipeng et al., 2015)
P d = 1 1 + a e x p b d c a ,             b ,             c
VG [40]
(Haverkamp et al., 1986)
P d = 1 1 + a d b c a ,             b ,             c
S [41]
(Skaggs et al., 2001)
P d = 1 1 + 1 P r 0 1 e x p k d n k ,             n
r 0 = 0.002   mm
Best [42]
(Lassabatere et al., 2006)
P d = 1 + a d b 2 b 1 a ,             b
Z [43]
(Zhongling Guo et al., 2020)
P d = a d b 1 e x p d c a ,             b ,  
P d is the cumulative mass fraction of particles <   d and d is the particle diameter mm .
Table 3. Comparison of prediction effects between sample points and non-sample points of each model of soil sample 3010 in UNSODA soil database.
Model NameFredKWbRWVGSBestZSample
Point
Mass proportion0.5000.4100.4650.4600.4820.4830.4830.4260.5120.499
0.5420.3800.4240.4330.5130.3780.5110.3870.541
The first line of data is the prediction data of all points. The second line of data is the prediction data of the point with 50 µm removed.
Table 4. The evaluation criteria for model comparison.
CriteriaEquationsExplanation
Coefficient of Determination R 2 R 2 = 1 i N Θ i ( m ) Θ i ( p ) 2 i N Θ i ( m ) Θ ¯ ( m ) 2 Θ i m ,   measured data values.
Θ i p ,   predicted data values.
N , number of observed data points.
Θ ¯ m , average value of measured data.
P , the number of model parameters
S S E , sum of squared errors of prediction
Root-Mean-Square Error R M S E R M S E = 1 N i = 1 N Θ i ( m ) Θ i ( p ) 2
Mean Absolute Error M A E M A E = i = 1 N θ i ( m ) θ i ( p ) x N
Corrected Akaike’s Information Criterion A I C c A I C c = N l n S S E N + 2 P + 2 P P + 1 N P 1
Publisher’s Note: MDPI stays neutral with regard to jurisdictional claims in published maps and institutional affiliations.

