
Ecological Well-Being Performance Evaluation and Spatio-Temporal Evolution Characteristics of Urban Agglomerations in the Yellow River Basin
Abstract
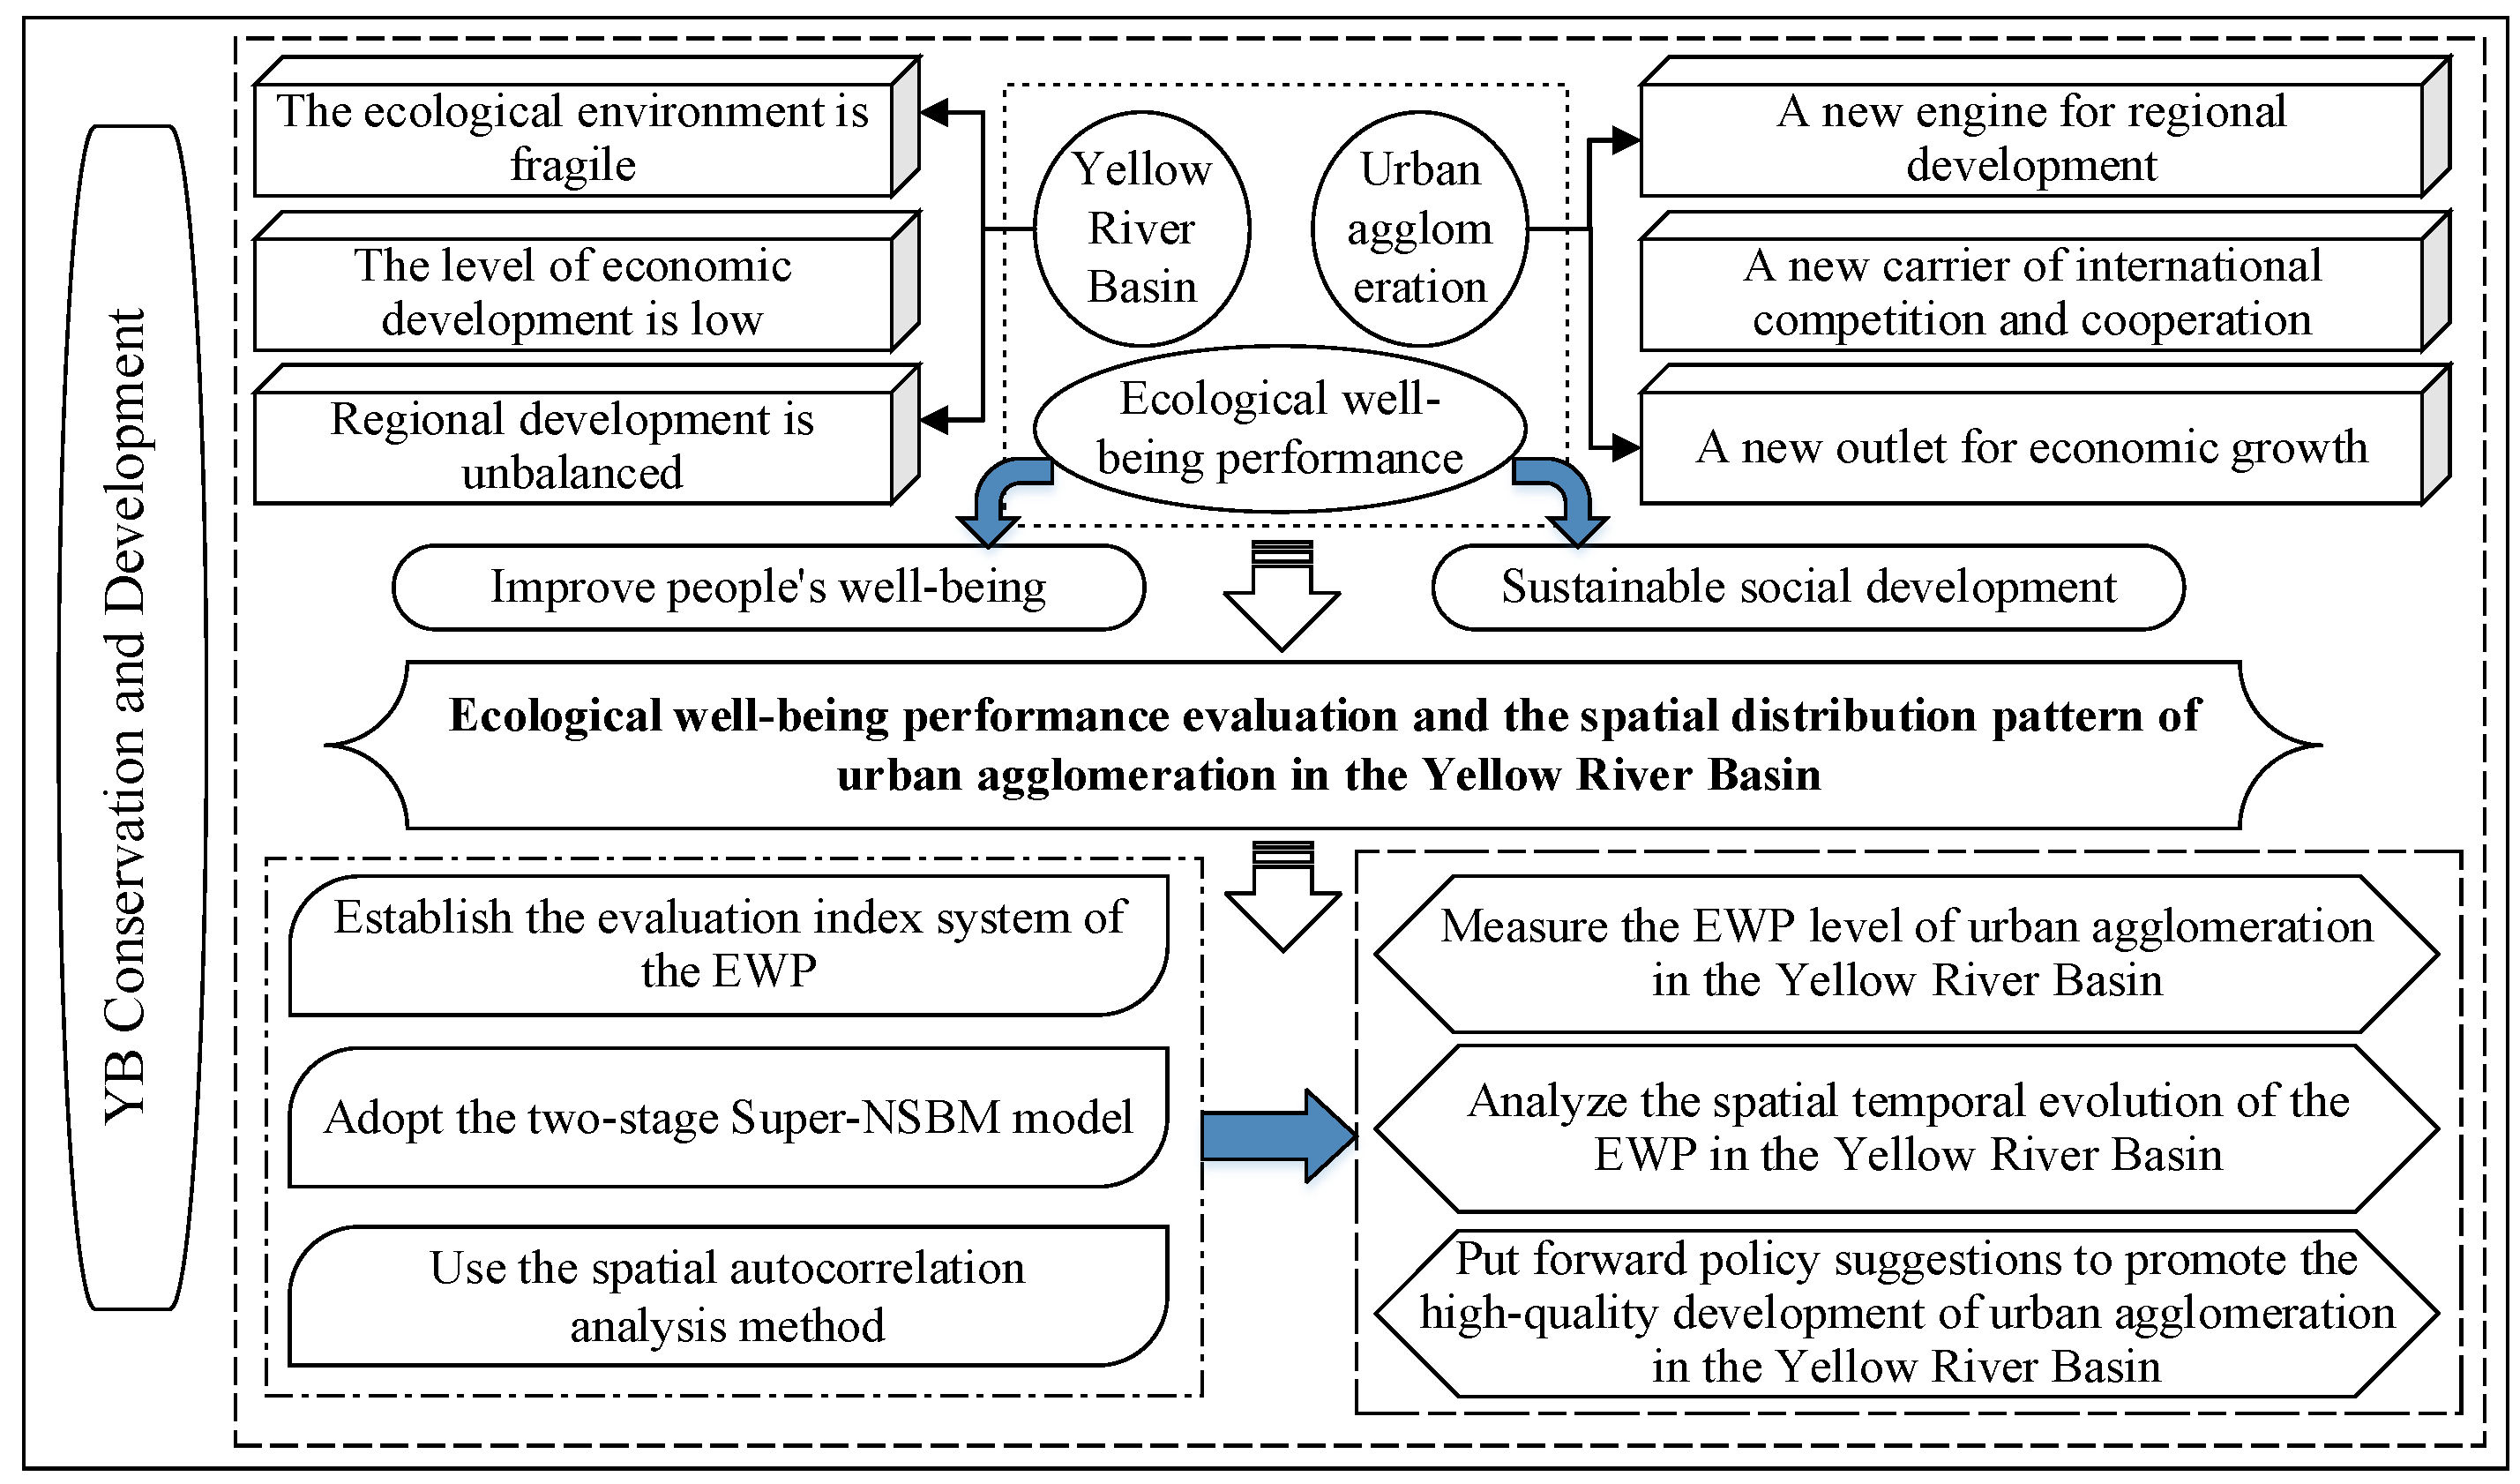
:1. Introduction
2. Method
2.1. Two-Stage Super-NSBM Model
2.2. Spatial Autocorrelation Analysis Method
2.3. Overall Research Method
3. Indicators and Data
3.1. Indicator System of the EWP
3.1.1. Resource Input Indicators
3.1.2. Intermediate Indicators
3.1.3. Well-Being Output Indicators
3.2. Data Sources
4. Results
4.1. Analysis Results of the EWP among the Urban Agglomerations in the Yellow River Basin
4.1.1. Comprehensive Level and Two-Stage Efficiency of the EWP
4.1.2. Temporal Distribution Characteristics of the EWP
4.1.3. Regional Distribution Characteristics of the EWP
4.2. The Spatial Correlation Analysis of the EWP
4.2.1. Moran Scatter Plot of the EWP
4.2.2. LISA Cluster Analysis of the EWP
5. Discussion
6. Conclusions and Policy Recommendations
6.1. Conclusions
6.2. Policy Recommendations
Author Contributions
Funding
Institutional Review Board Statement
Informed Consent Statement
Data Availability Statement
Conflicts of Interest
Appendix A

| Researchers | Research Scope | Indicator | Method |
|---|---|---|---|
| Dize [49] | 58 nations | HDI, EF | EWP = HDI/EF |
| Zhang et al. [50] | 82 countries | HDI, EF | EWP = HDI/EF |
| Behjat et al. [51] | Iran | HDI, EF | EWP = HDI/EF |
| Feng et al. [52] | 30 Chinese provinces | HDI, EF | EWP = HDI/EF |
| Hou et al. [53] | 30 Chinese provinces | Input: ecological capital, consumption of ecological resources Output: environmental pollution, economic development, social well-being | Two-stage SBM model |
| Yao et al. [54] | 30 Chinese provinces | Input: energy consumption, land consumption, water consumption, exhaust emissions, exhaust emissions, wastewater discharge, solid waste discharge Output: economic development level, education development level, health care development level | Super-efficiency SBM model, analysis of spatial correlation, spatial Markov Chain |
| Hu et al. [39] | 41 cities in Chinese Yangtze River Delt | Input: land resources, water resources, energy resources, and human resources Output: wastewater, waste gas, waste residue, economic well-being, social well-being, green well-being | Network DEA model, threshold panel regression model |
| Wang et al. [55] | 30 Chinese provinces | Input: technology, capital, labor, energy, land, water resource Output: economic, education, health care, environmental well-being level, wastewater, exhaust gas, solid waste, carbon emissions | Super-SBM model, Dagum Gini coefficient decomposition |
| Xiao et al. [56] | 79 Chinese cities along the Yellow River Basin | Inputs: investment in eco-environmental management infrastructure, change in eco-environmental management personnel, land consumption, energy consumption, water consumption, solid waste emission, wastewater emission, exhaust gas emission Outputs: economic growth, environmental friendliness, social inclusion | SFA model |
Appendix B
| Reaches | Urban Agglomeration | Cities in Urban Agglomerations |
|---|---|---|
| Upper reach | Lanxi Urban Agglomeration | Lanzhou, Baiyin, Dingxi, Xining |
| Ningxia Urban Agglomeration | Yinchuan, Shizuishan, Wuzhong, Zhongwei | |
| Hohhot-Baotou-Ordos-Yulin Urban Agglomeration | Hohhot, Baotou, Erdos, Yulin | |
| Middle reach | Guanzhong Urban Agglomeration | Xi’an, Tongchuan, Baoji, Xianyang, Weinan, Shangluo, Linfen, Tianshui, Pingliang, Qingyang, Yuncheng |
| Jinzhong Urban Agglomeration | Taiyuan, Yangquan, Jinzhong, Xinzhou, Lvliang, Changzhi | |
| Central Plains Urban Agglomeration | Zhumadian, Zhoukou, Bengbu, Nanyang, Suizhou, Huaibei, Bozhou, Xingtai, Puyang, Zhengzhou, Kaifeng, Luoyang, Pingdingshan, Anyang, Hebi, Xinxiang, Jiaozuo, Xuchang, Luohe, Sanmenxia, Fuyang, Xinyang, Shangqiu, Jincheng, Handan | |
| Lower reach | Shandong Peninsula Urban Agglomeration | Jinan, Qingdao, Zibo, Zaozhuang, Dongying, Yantai, Weifang, Jining, Taian, Weihai, Rizhao, Linyi, Dezhou, Binzhou, Liaocheng, Heze |
Appendix C
| Reaches | Urban Agglomeration | Cities | 2011 | 2012 | 2013 | 2014 | 2015 | 2016 | 2017 | 2011–2017 | ||||||||
|---|---|---|---|---|---|---|---|---|---|---|---|---|---|---|---|---|---|---|
| A | B | A | B | A | B | A | B | A | B | A | B | A | B | A | B | |||
| Upper reach | Hohhot-Baotou-Ordos-Yulin Urban Agglomeration | Hohhot | 1.175 | 1.194 | 1.157 | 1.128 | 1.121 | 1.12 | 1.071 | 1.138 | ||||||||
| 1.166 | 1.425 | 2.351 | 1.194 | 1.188 | 1.371 | 1.154 | 1.295 | 1.137 | 1.275 | 1.161 | 1.273 | 1.140 | 1.153 | 1.328 | 1.284 | |||
| Baotou | 0.540 | 0.585 | 0.604 | 0.997 | 0.636 | 0.686 | 1.050 | 0.728 | ||||||||||
| 0.711 | 0.473 | 1.76 | 0.585 | 0.758 | 0.569 | 1.031 | 0.998 | 0.748 | 0.641 | 0.891 | 0.619 | 1.136 | 1.105 | 1.005 | 0.713 | |||
| Yulin | 0.459 | 0.645 | 0.583 | 0.538 | 0.394 | 0.521 | 0.115 | 0.465 | ||||||||||
| 0.704 | 0.384 | 1.886 | 0.645 | 0.793 | 0.528 | 0.761 | 0.479 | 0.765 | 0.29 | 0.705 | 0.488 | 0.697 | 0.064 | 0.902 | 0.411 | |||
| Erdos | 1.139 | 1.145 | 1.090 | 1.093 | 1.062 | 1.059 | 0.230 | 0.974 | ||||||||||
| 1.274 | 1.324 | 5.913 | 1.145 | 1.223 | 1.197 | 1.237 | 1.205 | 1.226 | 1.133 | 1.231 | 1.125 | 0.845 | 0.137 | 1.850 | 1.038 | |||
| Ningxia Urban Agglomeration | Yinchuan | 0.886 | 1.188 | 1.662 | 1.021 | 1.025 | 1.03 | 1.176 | 1.141 | |||||||||
| 0.844 | 0.962 | 1.824 | 1.188 | 1.261 | 4.912 | 0.916 | 1.042 | 0.901 | 1.051 | 0.922 | 1.063 | 1.024 | 1.426 | 1.099 | 1.663 | |||
| Shizuishan | 1.060 | 1.043 | 1.070 | 1.073 | 1.07 | 1.068 | 1.094 | 1.068 | ||||||||||
| 0.857 | 1.128 | 0.594 | 1.043 | 0.879 | 1.15 | 0.946 | 1.157 | 0.921 | 1.15 | 0.959 | 1.147 | 1.040 | 1.208 | 0.885 | 1.140 | |||
| Wuzhong | 0.215 | 0.273 | 0.276 | 0.367 | 0.281 | 0.300 | 0.324 | 0.291 | ||||||||||
| 0.617 | 0.132 | 0.73 | 0.273 | 0.643 | 0.176 | 0.768 | 0.242 | 0.655 | 0.18 | 0.728 | 0.191 | 0.651 | 0.222 | 0.685 | 0.203 | |||
| Zhongwei | 1.025 | 1.026 | 1.044 | 1.050 | 1.040 | 1.050 | 0.331 | 0.938 | ||||||||||
| 1.037 | 1.052 | 0.77 | 1.026 | 0.925 | 1.091 | 0.941 | 1.104 | 0.982 | 1.083 | 0.962 | 1.105 | 0.570 | 0.230 | 0.884 | 0.956 | |||
| Lanxi Urban Agglomeration | Lanzhou | 1.024 | 1.040 | 1.062 | 1.056 | 1.026 | 1.058 | 1.070 | 1.048 | |||||||||
| 0.898 | 1.048 | 0.773 | 1.040 | 0.924 | 1.132 | 0.987 | 1.119 | 0.891 | 1.054 | 0.971 | 1.124 | 0.904 | 1.150 | 0.907 | 1.095 | |||
| Baiyin | 0.098 | 0.175 | 0.193 | 0.200 | 0.178 | 0.259 | 1.056 | 0.308 | ||||||||||
| 0.675 | 0.053 | 0.813 | 0.175 | 0.918 | 0.109 | 0.732 | 0.117 | 0.680 | 0.103 | 0.694 | 0.161 | 0.788 | 1.118 | 0.757 | 0.262 | |||
| Dingxi | 1.426 | 1.342 | 1.242 | 1.228 | 1.294 | 1.311 | 1.139 | 1.283 | ||||||||||
| 1.052 | 2.483 | 1.427 | 1.342 | 1.141 | 1.638 | 1.059 | 1.591 | 1.089 | 1.831 | 1.134 | 1.903 | 1.065 | 1.322 | 1.138 | 1.730 | |||
| Xining | 1.047 | 1.095 | 0.89 | 1.008 | 1.012 | 1.008 | 0.672 | 0.962 | ||||||||||
| 0.934 | 1.099 | 0.870 | 1.095 | 0.871 | 0.905 | 0.935 | 1.016 | 0.951 | 1.024 | 0.972 | 1.015 | 0.694 | 0.780 | 0.890 | 0.991 | |||
| Middle reach | Guanzhong Urban Agglomeration | Xi’an | 1.102 | 1.223 | 1.301 | 1.281 | 1.394 | 1.522 | 1.260 | 1.298 | ||||||||
| 0.883 | 1.227 | 0.684 | 1.223 | 1.213 | 1.511 | 1.015 | 1.634 | 1.123 | 2.301 | 1.141 | 3.180 | 1.209 | 1.590 | 1.038 | 1.810 | |||
| Tongchuan | 1.097 | 1.019 | 1.058 | 1.054 | 1.006 | 0.497 | 1.076 | 0.972 | ||||||||||
| 1.012 | 1.214 | 0.697 | 1.019 | 0.999 | 1.123 | 1.020 | 1.113 | 0.93 | 1.011 | 0.843 | 0.342 | 1.115 | 1.164 | 0.945 | 0.998 | |||
| Baoji | 1.016 | 0.645 | 0.642 | 0.641 | 0.597 | 0.567 | 0.676 | 0.683 | ||||||||||
| 1.025 | 1.033 | 1.196 | 0.645 | 0.858 | 0.547 | 0.887 | 0.538 | 0.736 | 0.563 | 0.781 | 0.493 | 0.806 | 0.629 | 0.899 | 0.635 | |||
| Xianyang | 1.138 | 1.16 | 1.091 | 1.204 | 1.08 | 1.086 | 1.091 | 1.121 | ||||||||||
| 1.135 | 1.319 | 1.446 | 1.16 | 1.102 | 1.199 | 1.052 | 1.511 | 1.082 | 1.175 | 1.121 | 1.188 | 1.080 | 1.200 | 1.145 | 1.250 | |||
| Weinan | 0.645 | 0.619 | 0.631 | 0.659 | 0.682 | 0.557 | 0.423 | 0.602 | ||||||||||
| 0.720 | 0.712 | 1.298 | 0.619 | 0.81 | 0.573 | 0.781 | 0.652 | 0.779 | 0.711 | 0.73 | 0.482 | 0.716 | 0.311 | 0.833 | 0.580 | |||
| Shangluo | 1.048 | 1.025 | 1.048 | 1.064 | 1.063 | 1.01 | 0.697 | 0.993 | ||||||||||
| 1.148 | 1.102 | 1.293 | 1.025 | 1.124 | 1.100 | 1.119 | 1.136 | 1.081 | 1.134 | 1.077 | 1.020 | 0.673 | 0.859 | 1.074 | 1.054 | |||
| Linfen | 1.033 | 0.741 | 0.838 | 0.799 | 0.86 | 1.025 | 0.672 | 0.853 | ||||||||||
| 0.985 | 1.069 | 0.898 | 0.741 | 0.776 | 1.000 | 0.763 | 1.000 | 0.838 | 0.995 | 1.045 | 1.051 | 0.605 | 0.922 | 0.844 | 0.968 | |||
| Tianshui | 1.138 | 1.654 | 1.115 | 1.110 | 1.100 | 1.076 | 1.176 | 1.196 | ||||||||||
| 1.091 | 1.321 | 6.55 | 1.654 | 1.093 | 1.201 | 1.042 | 1.247 | 1.022 | 1.222 | 1.022 | 1.164 | 1.093 | 1.426 | 1.845 | 1.319 | |||
| Pingliang | 0.602 | 0.528 | 0.533 | 0.493 | 0.395 | 0.508 | 0.457 | 0.502 | ||||||||||
| 0.727 | 0.567 | 0.865 | 0.528 | 0.611 | 0.484 | 0.732 | 0.379 | 0.795 | 0.259 | 0.805 | 0.369 | 0.664 | 0.337 | 0.743 | 0.418 | |||
| Qingyang | 1.063 | 1.069 | 1.038 | 1.050 | 1.120 | 1.095 | 0.892 | 1.047 | ||||||||||
| 1.201 | 1.135 | 2.713 | 1.069 | 1.157 | 1.08 | 1.166 | 1.106 | 1.191 | 1.273 | 1.174 | 1.209 | 1.078 | 0.86 | 1.383 | 1.105 | |||
| Yuncheng | 1.081 | 1.072 | 1.092 | 1.071 | 1.04 | 1.032 | 0.523 | 0.987 | ||||||||||
| 1.051 | 1.176 | 0.828 | 1.072 | 1.020 | 1.204 | 1.040 | 1.153 | 1.027 | 1.084 | 1.039 | 1.066 | 0.595 | 0.510 | 0.943 | 1.038 | |||
| Jinzhong Urban Agglomeration | Taiyuan | 1.232 | 1.057 | 1.109 | 1.142 | 1.158 | 1.154 | 1.054 | 1.129 | |||||||||
| 0.997 | 1.592 | 0.717 | 1.057 | 1.044 | 1.24 | 1.046 | 1.282 | 1.005 | 1.376 | 1.005 | 1.364 | 0.998 | 1.114 | 0.973 | 1.289 | |||
| Yangquan | 0.532 | 0.595 | 0.550 | 1.004 | 1.011 | 0.521 | 1.027 | 0.748 | ||||||||||
| 0.778 | 0.431 | 1.364 | 0.595 | 0.717 | 0.483 | 1.048 | 1.008 | 1.034 | 1.021 | 0.705 | 0.441 | 1.162 | 1.055 | 0.973 | 0.719 | |||
| Jinzhong | 1.037 | 1.015 | 1.079 | 1.101 | 1.141 | 1.075 | 1.081 | 1.076 | ||||||||||
| 0.982 | 1.077 | 0.808 | 1.015 | 0.952 | 1.171 | 0.949 | 1.224 | 1.003 | 1.328 | 0.985 | 1.162 | 0.791 | 1.176 | 0.924 | 1.165 | |||
| Xinzhou | 0.521 | 0.642 | 1.057 | 1.079 | 1.094 | 0.669 | 0.503 | 0.795 | ||||||||||
| 0.692 | 0.449 | 0.722 | 0.642 | 0.968 | 1.12 | 0.943 | 1.170 | 1.024 | 1.207 | 0.631 | 0.873 | 0.67 | 0.409 | 0.807 | 0.839 | |||
| Lvliang | 1.144 | 1.195 | 1.184 | 1.150 | 1.065 | 1.086 | 1.001 | 1.118 | ||||||||||
| 1.183 | 1.335 | 3.446 | 1.195 | 1.171 | 1.452 | 1.206 | 1.352 | 1.113 | 1.14 | 1.163 | 1.188 | 0.914 | 1.003 | 1.456 | 1.238 | |||
| Changzhi | 0.573 | 0.572 | 0.607 | 0.668 | 0.709 | 1.000 | 0.780 | 0.701 | ||||||||||
| 0.683 | 0.568 | 1.184 | 0.572 | 0.715 | 0.608 | 0.738 | 0.676 | 0.736 | 0.767 | 1.005 | 1.000 | 0.677 | 1.000 | 0.820 | 0.742 | |||
| Central Plains Urban Agglomeration | Zhumadian | 0.738 | 0.832 | 0.802 | 1.006 | 0.681 | 0.644 | 0.723 | 0.775 | |||||||||
| 0.945 | 0.661 | 1.070 | 0.832 | 0.941 | 0.727 | 1.061 | 1.012 | 0.862 | 0.581 | 0.773 | 0.578 | 0.810 | 0.590 | 0.923 | 0.711 | |||
| Zhoukou | 1.043 | 1.086 | 1.054 | 1.082 | 1.120 | 1.146 | 1.122 | 1.093 | ||||||||||
| 1.148 | 1.09 | 1.932 | 1.086 | 1.169 | 1.113 | 1.186 | 1.179 | 1.183 | 1.273 | 1.169 | 1.342 | 0.742 | 1.278 | 1.218 | 1.195 | |||
| Bengbu | 1.015 | 0.892 | 1.031 | 1.052 | 1.023 | 0.896 | 1.113 | 1.003 | ||||||||||
| 0.994 | 1.031 | 0.86 | 0.892 | 0.957 | 1.065 | 0.979 | 1.110 | 1.001 | 1.047 | 0.833 | 0.992 | 0.904 | 1.256 | 0.932 | 1.056 | |||
| Nanyang | 1.080 | 1.094 | 1.051 | 1.059 | 1.039 | 0.836 | 1.003 | 1.023 | ||||||||||
| 1.043 | 1.175 | 0.968 | 1.094 | 1.037 | 1.107 | 1.046 | 1.124 | 1.029 | 1.082 | 0.91 | 0.852 | 0.983 | 1.007 | 1.002 | 1.063 | |||
| Suizhou | 0.641 | 0.664 | 0.598 | 0.605 | 0.595 | 0.615 | 0.731 | 0.635 | ||||||||||
| 0.729 | 0.649 | 1.194 | 0.664 | 0.913 | 0.452 | 0.908 | 0.469 | 0.796 | 0.505 | 0.715 | 0.581 | 0.897 | 0.673 | 0.879 | 0.570 | |||
| Huaibei | 1.038 | 1.009 | 1.007 | 1.011 | 1.002 | 1.004 | 0.718 | 0.970 | ||||||||||
| 0.920 | 1.080 | 0.593 | 1.009 | 0.91 | 1.014 | 0.895 | 1.022 | 0.867 | 1.003 | 0.917 | 1.009 | 0.706 | 0.847 | 0.830 | 0.997 | |||
| Haozhou | 0.719 | 0.669 | 0.653 | 0.614 | 0.539 | 0.590 | 0.480 | 0.609 | ||||||||||
| 0.844 | 0.712 | 1.498 | 0.669 | 0.910 | 0.551 | 0.886 | 0.502 | 0.854 | 0.418 | 0.886 | 0.472 | 0.799 | 0.358 | 0.954 | 0.526 | |||
| Xingtai | 0.664 | 0.741 | 0.757 | 0.742 | 1.009 | 1.021 | 1.090 | 0.861 | ||||||||||
| 0.729 | 0.694 | 1.157 | 0.741 | 0.754 | 0.865 | 0.843 | 0.718 | 1.099 | 1.018 | 1.022 | 1.043 | 0.723 | 1.197 | 0.904 | 0.897 | |||
| Puyang | 0.434 | 0.413 | 1.000 | 0.44 | 0.428 | 1.027 | 1.008 | 0.679 | ||||||||||
| 0.833 | 0.303 | 1.098 | 0.413 | 1.003 | 1.000 | 0.844 | 0.308 | 0.904 | 0.284 | 1.016 | 1.056 | 0.966 | 1.016 | 0.952 | 0.626 | |||
| Zhengzhou | 1.014 | 1.010 | 1.027 | 1.051 | 1.039 | 1.053 | 1.053 | 1.035 | ||||||||||
| 1.042 | 1.029 | 1.158 | 1.010 | 1.041 | 1.055 | 1.03 | 1.108 | 1.064 | 1.081 | 1.095 | 1.112 | 1.050 | 1.113 | 1.069 | 1.072 | |||
| Kaifeng | 0.698 | 0.698 | 1.049 | 1.062 | 0.643 | 0.778 | 1.145 | 0.868 | ||||||||||
| 0.716 | 0.806 | 1.159 | 0.698 | 0.955 | 1.104 | 0.966 | 1.132 | 0.659 | 0.734 | 0.818 | 0.793 | 1.048 | 1.340 | 0.903 | 0.944 | |||
| Luoyang | 0.645 | 0.710 | 0.691 | 0.751 | 0.701 | 0.777 | 0.830 | 0.729 | ||||||||||
| 0.776 | 0.607 | 1.400 | 0.71 | 0.737 | 0.771 | 0.792 | 0.849 | 0.762 | 0.743 | 0.902 | 0.772 | 0.757 | 0.977 | 0.875 | 0.776 | |||
| Pingdingshan | 0.675 | 0.698 | 0.719 | 0.725 | 0.727 | 0.857 | 0.743 | 0.735 | ||||||||||
| 0.757 | 0.702 | 1.741 | 0.698 | 0.721 | 0.861 | 0.757 | 0.782 | 0.722 | 0.820 | 0.897 | 0.881 | 0.692 | 0.914 | 0.898 | 0.808 | |||
| Anyang | 0.668 | 0.641 | 0.693 | 0.674 | 0.716 | 0.754 | 1.027 | 0.739 | ||||||||||
| 0.723 | 0.728 | 1.403 | 0.641 | 0.689 | 0.848 | 0.665 | 0.827 | 0.706 | 0.851 | 0.733 | 0.929 | 1.022 | 1.057 | 0.849 | 0.840 | |||
| Hebi | 0.476 | 0.421 | 0.381 | 0.385 | 0.438 | 0.467 | 0.696 | 0.466 | ||||||||||
| 0.755 | 0.354 | 0.713 | 0.421 | 0.68 | 0.265 | 0.740 | 0.262 | 0.758 | 0.31 | 0.722 | 0.354 | 0.736 | 0.744 | 0.729 | 0.387 | |||
| Xinxiang | 1.002 | 0.832 | 0.758 | 0.732 | 0.671 | 1.04 | 1.043 | 0.868 | ||||||||||
| 0.998 | 1.004 | 0.977 | 0.832 | 0.740 | 0.892 | 0.750 | 0.807 | 0.655 | 0.809 | 1.005 | 1.083 | 0.938 | 1.090 | 0.866 | 0.931 | |||
| Jiaozuo | 0.671 | 0.659 | 0.652 | 0.702 | 0.686 | 0.651 | 0.845 | 0.695 | ||||||||||
| 0.812 | 0.622 | 1.287 | 0.659 | 0.690 | 0.709 | 0.712 | 0.822 | 0.707 | 0.801 | 0.707 | 0.665 | 0.701 | 0.926 | 0.802 | 0.743 | |||
| Xuchang | 0.685 | 0.737 | 0.656 | 0.656 | 0.619 | 0.655 | 0.733 | 0.677 | ||||||||||
| 0.870 | 0.648 | 2.073 | 0.737 | 0.788 | 0.654 | 0.829 | 0.617 | 0.808 | 0.569 | 0.742 | 0.672 | 0.676 | 0.87 | 0.969 | 0.681 | |||
| Luohe | 1.049 | 1.015 | 1.003 | 1.045 | 1.03 | 1.037 | 1.052 | 1.033 | ||||||||||
| 0.975 | 1.102 | 1.12 | 1.015 | 1.035 | 1.006 | 1.030 | 1.095 | 1.041 | 1.063 | 1.015 | 1.077 | 1.057 | 1.109 | 1.039 | 1.067 | |||
| Sanmenxia | 0.595 | 0.691 | 0.726 | 1.014 | 0.595 | 0.560 | 0.523 | 0.672 | ||||||||||
| 0.695 | 0.645 | 2.566 | 0.691 | 0.723 | 0.941 | 1.133 | 1.028 | 0.777 | 0.542 | 0.836 | 0.467 | 0.731 | 0.428 | 1.066 | 0.677 | |||
| Fuyang | 1.032 | 1.052 | 1.072 | 1.082 | 1.060 | 1.051 | 1.054 | 1.058 | ||||||||||
| 1.078 | 1.065 | 1.273 | 1.052 | 1.081 | 1.155 | 1.091 | 1.179 | 1.072 | 1.128 | 0.961 | 1.107 | 0.905 | 1.115 | 1.066 | 1.114 | |||
| Xinyang | 0.908 | 1.064 | 1.019 | 0.888 | 0.811 | 1.079 | 0.882 | 0.950 | ||||||||||
| 0.911 | 1.000 | 1.591 | 1.064 | 1.094 | 1.038 | 0.920 | 0.992 | 0.815 | 0.955 | 1.167 | 1.173 | 0.861 | 1.000 | 1.051 | 1.032 | |||
| Shangqiu | 0.770 | 1.035 | 1.074 | 1.041 | 1.046 | 1.083 | 1.005 | 1.008 | ||||||||||
| 0.838 | 0.831 | 1.216 | 1.035 | 1.103 | 1.160 | 1.065 | 1.086 | 1.058 | 1.096 | 1.123 | 1.182 | 0.756 | 1.011 | 1.023 | 1.057 | |||
| Jincheng | 0.395 | 0.456 | 0.444 | 0.370 | 0.372 | 0.311 | 0.370 | 0.389 | ||||||||||
| 0.668 | 0.310 | 0.942 | 0.456 | 0.738 | 0.334 | 0.851 | 0.244 | 0.87 | 0.241 | 0.727 | 0.205 | 0.635 | 0.270 | 0.776 | 0.294 | |||
| Handan | 1.044 | 1.043 | 1.058 | 1.045 | 1.045 | 1.041 | 1.048 | 1.046 | ||||||||||
| 1.001 | 1.091 | 1.169 | 1.043 | 1.059 | 1.123 | 1.083 | 1.095 | 1.087 | 1.095 | 1.055 | 1.085 | 1.026 | 1.100 | 1.069 | 1.090 | |||
| Lower reach | Shandong Peninsula Urban Agglomeration | Jinan | 1.053 | 1.048 | 1.054 | 1.072 | 1.086 | 1.051 | 1.091 | 1.065 | ||||||||
| 1.100 | 1.111 | 1.274 | 1.048 | 1.109 | 1.113 | 1.114 | 1.155 | 1.09 | 1.188 | 1.088 | 1.107 | 1.120 | 1.200 | 1.128 | 1.132 | |||
| Qingdao | 1.173 | 1.051 | 1.028 | 1.022 | 1.006 | 1.102 | 1.125 | 1.072 | ||||||||||
| 1.447 | 1.073 | 2.118 | 1.051 | 1.134 | 1.058 | 1.102 | 1.045 | 1.092 | 1.013 | 1.135 | 1.226 | 1.172 | 1.285 | 1.314 | 1.107 | |||
| Zibo | 0.541 | 0.549 | 0.497 | 0.516 | 0.560 | 0.543 | 1.067 | 0.610 | ||||||||||
| 0.740 | 0.466 | 1.262 | 0.549 | 0.773 | 0.391 | 0.788 | 0.411 | 0.691 | 0.547 | 0.697 | 0.5 | 1.079 | 1.145 | 0.861 | 0.573 | |||
| Zaozhuang | 0.436 | 0.412 | 0.409 | 0.435 | 0.447 | 0.471 | 0.653 | 0.466 | ||||||||||
| 0.805 | 0.310 | 1.074 | 0.412 | 0.816 | 0.274 | 0.805 | 0.306 | 0.769 | 0.324 | 0.833 | 0.347 | 0.923 | 0.535 | 0.861 | 0.358 | |||
| Dongying | 1.017 | 0.501 | 1.017 | 1.018 | 1.047 | 0.526 | 1.085 | 0.887 | ||||||||||
| 1.103 | 1.035 | 1.981 | 0.501 | 1.138 | 1.035 | 1.149 | 1.036 | 1.166 | 1.098 | 0.744 | 0.445 | 1.23 | 1.186 | 1.216 | 0.905 | |||
| Yantai | 1.021 | 0.865 | 1.005 | 0.892 | 1.015 | 0.812 | 0.841 | 0.922 | ||||||||||
| 1.107 | 1.042 | 1.822 | 0.865 | 1.093 | 1.010 | 0.899 | 1.000 | 1.059 | 1.030 | 0.834 | 0.936 | 0.800 | 1.000 | 1.088 | 0.983 | |||
| Weifang | 1.034 | 1.013 | 1.044 | 1.025 | 1.028 | 1.013 | 1.011 | 1.024 | ||||||||||
| 1.078 | 1.070 | 1.280 | 1.013 | 1.114 | 1.091 | 1.115 | 1.051 | 1.124 | 1.057 | 1.155 | 1.026 | 1.152 | 1.023 | 1.146 | 1.047 | |||
| Jining | 0.645 | 1.016 | 0.765 | 0.654 | 0.659 | 0.696 | 0.805 | 0.749 | ||||||||||
| 0.820 | 0.608 | 1.207 | 1.016 | 0.924 | 0.700 | 0.743 | 0.672 | 0.738 | 0.691 | 0.788 | 0.735 | 0.743 | 1.000 | 0.852 | 0.775 | |||
| Taian | 1.002 | 0.827 | 0.857 | 0.833 | 0.806 | 1.058 | 1.093 | 0.925 | ||||||||||
| 1.081 | 1.000 | 2.059 | 0.827 | 0.88 | 0.983 | 0.874 | 0.940 | 0.828 | 0.964 | 1.113 | 1.124 | 1.143 | 1.206 | 1.140 | 1.006 | |||
| Weihai | 1.007 | 1.048 | 1.022 | 1.068 | 1.048 | 1.006 | 1.058 | 1.037 | ||||||||||
| 1.084 | 1.014 | 2.168 | 1.048 | 1.143 | 1.045 | 1.126 | 1.146 | 1.077 | 1.102 | 1.035 | 1.013 | 1.126 | 1.123 | 1.251 | 1.070 | |||
| Rizhao | 0.546 | 0.580 | 1.036 | 0.610 | 0.650 | 1.004 | 0.498 | 0.703 | ||||||||||
| 0.792 | 0.432 | 1.108 | 0.580 | 1.034 | 1.074 | 0.784 | 0.537 | 0.785 | 0.590 | 1.015 | 1.008 | 0.857 | 0.380 | 0.911 | 0.657 | |||
| Linyi | 1.051 | 1.054 | 1.011 | 1.025 | 1.021 | 1.022 | 0.619 | 0.972 | ||||||||||
| 1.092 | 1.107 | 1.087 | 1.054 | 1.033 | 1.022 | 1.022 | 1.050 | 1.023 | 1.043 | 1.043 | 1.044 | 0.837 | 0.529 | 1.020 | 0.978 | |||
| Dezhou | 1.002 | 1.074 | 1.116 | 0.767 | 0.732 | 0.688 | 0.671 | 0.864 | ||||||||||
| 1.114 | 1.004 | 2.695 | 1.074 | 1.161 | 1.263 | 1.006 | 0.628 | 0.879 | 0.685 | 0.838 | 0.631 | 0.727 | 0.695 | 1.203 | 0.854 | |||
| Binzhou | 0.659 | 0.682 | 0.744 | 0.610 | 0.654 | 0.520 | 0.449 | 0.617 | ||||||||||
| 0.799 | 0.625 | 1.647 | 0.682 | 0.719 | 0.952 | 0.863 | 0.500 | 0.704 | 0.702 | 0.730 | 0.442 | 0.601 | 0.347 | 0.866 | 0.607 | |||
| Liaocheng | 0.698 | 0.717 | 1.629 | 0.717 | 0.656 | 0.642 | 0.708 | 0.824 | ||||||||||
| 0.831 | 0.702 | 1.909 | 0.717 | 1.309 | 4.393 | 0.825 | 0.741 | 0.765 | 0.683 | 0.746 | 0.675 | 0.744 | 0.705 | 1.018 | 1.231 | |||
| Heze | 1.038 | 1.033 | 1.057 | 1.044 | 1.062 | 1.065 | 1.021 | 1.046 | ||||||||||
| 1.104 | 1.08 | 1.862 | 1.033 | 1.139 | 1.12 | 1.136 | 1.093 | 1.140 | 1.131 | 1.132 | 1.140 | 1.133 | 1.044 | 1.235 | 1.092 | |||
| Average value | National | 0.928 | 0.893 | 1.502 | 0.86 | 0.955 | 1.032 | 0.949 | 0.918 | 0.922 | 0.904 | 0.932 | 0.91 | 0.884 | 0.902 | 1.010 | 0.917 | |
| Upper reach | 0.897 | 0.964 | 1.643 | 0.896 | 0.96 | 1.232 | 0.956 | 0.947 | 0.912 | 0.901 | 0.944 | 0.934 | 0.879 | 0.826 | 1.055 | 0.929 | ||
| Middle reach | 0.907 | 0.887 | 1.402 | 0.857 | 0.924 | 0.926 | 0.943 | 0.942 | 0.921 | 0.919 | 0.929 | 0.930 | 0.856 | 0.925 | 0.983 | 0.912 | ||
| Lower reach | 1.006 | 0.855 | 1.660 | 0.842 | 1.033 | 1.158 | 0.959 | 0.832 | 0.933 | 0.865 | 0.933 | 0.837 | 0.962 | 0.900 | 1.069 | 0.899 | ||
References
- Xi, J.P. Speech at the symposium on ecological protection and high quality development of the Yellow River basin. Seek Truth 2019, 32, 1–5. [Google Scholar]
- Outline of the Yellow River Basin Ecological Protection and High Quality Development Plan. Available online: https://www.gov.cn/zhengce/2021-10/08/content_5641438.htm (accessed on 8 October 2021).
- Costanza, R.; Daly, L.; Fioramonti, L.; Giovannini, E.; Kubiszewski, I.; Mortensen, L.F.; Pickett, K.E.; Ragnarsdottir, K.V.; De Vogli, R.; Wilkinson, R. Modelling and measuring sustainable wellbeing in connection with the UN Sustainable Development Goals. Ecol. Econ. 2016, 130, 350–355. [Google Scholar] [CrossRef]
- Common, M. Measuring national economic performance without using prices. Ecol. Econ. 2007, 64, 92–102. [Google Scholar] [CrossRef]
- Daly, H.E. The World Dynamics of Economic Growth:The Economics of the Steady State. Am. Econ. Rev. 1974, 64, 15–23. [Google Scholar]
- Daly, H.E. The economic growth debate: What some economists have learned but many have not. J. Environ. Econ. Manag. 2006, 14, 323–336. [Google Scholar] [CrossRef]
- Max-Neef, M. Economic growth and quality of life: A threshold hypothesis. Ecol. Econ. 1995, 15, 115–118. [Google Scholar] [CrossRef]
- Daly, H.E. Towards an Environmental Macroeconomics. Land Econ. 1991, 67, 255. [Google Scholar] [CrossRef]
- Pearce, D.W.; Atkinson, G.D. Capital theory and the measurement of sustainable development: An indicator of “weak” sustainability. Ecol. Econ. 1993, 8, 103–108. [Google Scholar] [CrossRef]
- Rees, W.E. Ecological Footprints and Appropriated Carrying Capacity: What Urban Economics Leaves Out. Focus 1992, 4, 121–130. [Google Scholar]
- Zhu, D.J.; Zhang, S. Ecological well-being performance and further research on sustainable development. J. Tongji Univ. Soc. Sci. Ed. 2014, 25, 106–115. [Google Scholar]
- Huo, T.; Xu, L.; Liu, B.; Cai, W.; Feng, W. China’s commercial building carbon emissions toward 2060: An integrated dynamic emission assessment model. Appl. Energy 2022, 325, 119828. [Google Scholar] [CrossRef]
- Long, L.J.; Wang, X.; Guo, B. Evaluation of urban ecological well-being performance based on revised DEA model: A case study of 35 major cities in China. J. Nat. Resour. 2017, 32, 595–605. [Google Scholar]
- Dietz, T.; Rosa, E.A.; York, R. Environmentally Efficient Well-Being: Rethinking Sustainability as the Relationship between Human Well-being and Environmental Impacts. Hum. Ecol. Rev. 2009, 16, 114–123. [Google Scholar]
- Altıntaş, H.; Kassouri, Y. Is the environmental Kuznets Curve in Europe related to the per-capita ecological footprint or CO2 emissions? Ecol. Indic. 2020, 113, 106187. [Google Scholar] [CrossRef]
- Coluccia, B.; Valente, D.; Fusco, G.; De Leo, F.; Porrini, D. Assessing agricultural eco-efficiency in Italian Regions. Ecol. Indic. 2020, 116, 106483. [Google Scholar] [CrossRef]
- Rice, J. Material consumption and social well-being within the periphery of the world economy: An ecological analysis of maternal mortality. Soc. Sci. Res. 2008, 37, 1292–1309. [Google Scholar] [CrossRef]
- Du, H.B.; Huang, L.J.; Zhang, C.; He, J.J. A study on the decomposition and convergence of regional differences in China’s Provincial Ecological Well-being performance. Ecol. Econ. 2019, 35, 187–193. [Google Scholar]
- Li, C.Y.; Zhang, S.Q.; Zhang, W.; Liao, X.C. A study on the performance measurement and influencing factors of inter provincial Ecological Well-being in China. Geogr. Sci. 2019, 39, 1875–1883. [Google Scholar]
- Xu, Y.D.; Qi, P.; Tong, L.F. A study on the spatial-temporal differentiation pattern of ecological well-being performance in China’s provincial areas. Reg. Econ. Rev. 2017, 4, 123–131. [Google Scholar] [CrossRef]
- Fang, S.J.; Xiao, Q. Study on the performance level and spatial effect of Regional Ecological well-being in China. China’s Popul. Resour. Environ. 2019, 29, 1–10. [Google Scholar]
- Huo, T.; Ma, Y.; Xu, L.; Feng, W.; Cai, W. Carbon emissions in China’s urban residential building sector through 2060: A dynamic scenario simulation. Energy 2022, 254, 124395. [Google Scholar] [CrossRef]
- Xiao, L.M.; Ji, H.R. Spatiotemporal evolution and influencing factors of China’s Ecological Well-being performance in the perspective of green technology innovation—A data test based on provincial scale. Res. Sci. Technol. Manag. 2018, 38, 243–251. [Google Scholar]
- Wang, X.P.; Luo, J.F. Study on the ecological well-being performance and time-space evolution of Beijing Tianjin Hebei. Res. Sci. Technol. Manag. 2020, 40, 249–255. [Google Scholar]
- Lo Storto, C. Ecological efficiency based ranking of cities: A combined DEA cross-efficiency and Shannon’s entropy method. Sustainability 2016, 8, 124. [Google Scholar] [CrossRef] [Green Version]
- Bianchi, M.; Del Valle, I.; Tapia, C. Measuring eco-efficiency in European regions: Evidence from a territorial perspective. J. Clean. Prod. 2020, 276, 123246. [Google Scholar] [CrossRef]
- Sun, H.; Kporsu, A.K.; Taghizadeh-Hesary, F.; Edziah, B.K. Estimating environmental efficiency and convergence: 1980 to 2016. Energy 2020, 208, 118224. [Google Scholar] [CrossRef]
- Dagiliūtė, R.; Juknys, R. Eco-efficiency: Trends, goals and their implementation in Lithuania. J. Environ. Eng. Landsc. Manag. 2012, 20, 265–272. [Google Scholar] [CrossRef]
- Charnes, A.; Cooper, W.W.; Rhodes, E. Measuring the efficiency of decision making units. Eur. J. Oper. Res. 1978, 2, 429–444. [Google Scholar] [CrossRef]
- Tone, K. A slacks-based measure of efficiency in data envelopment analysis. Eur. J. Oper. Res. 2001, 130, 498–509. [Google Scholar] [CrossRef] [Green Version]
- Song, M.; Zhang, L.; An, Q.; Wang, Z.; Li, Z. Statistical analysis and combination forecasting of environmental efficiency and its influential factors since China entered the WTO: 2002–2010–2012. J. Clean. Prod. 2013, 42, 42–51. [Google Scholar] [CrossRef]
- Zhang, H.; Yang, H.M. Efficiency of China’s commercial banks based on super efficiency network SBM model considering unexpected output. Syst. Eng. 2017, 35, 17–24. [Google Scholar]
- Tone, K.; Tsutsui, M. Dynamic DEA: A slacks-based measure approach. Omega 2010, 38, 145–156. [Google Scholar] [CrossRef]
- Sokal, R.R.; Thomson, J.D. Applications of spatial autocorrelation in ecology. In Develoments in Numerical Ecology; Springer: Berlin/Heidelberg, Germany, 1987; pp. 431–466. [Google Scholar]
- Anselin, L. Local indicators of spatial association—LISA. Geogr. Anal. 1995, 27, 93–115. [Google Scholar] [CrossRef]
- Anselin, L. Spatial Econometrics: Methods and Models. J. Am. Stat. Assoc. 1990, 85, 160. [Google Scholar]
- Long, L.J. Research on Urban Ecological Welfare performance evaluation based on two-stage super NSBM model. China Popul. Resour. Environ. 2019, 29, 1–10. [Google Scholar]
- Bian, J.; Zhang, Y.; Shuai, C.; Shen, L.; Ren, H.; Wang, Y. Have cities effectively improved ecological well-being performance? Empirical analysis of 278 Chinese cities. J. Clean. Prod. 2020, 245, 118913. [Google Scholar] [CrossRef]
- Hu, M.; Sarwar, S.; Li, Z. Spatio-temporal differentiation mode and threshold effect of yangtze river delta urban ecological well-being performance based on network DEA. Sustainability 2021, 13, 4550. [Google Scholar] [CrossRef]
- Bian, J.; Lan, F.; Hui, Z.; Bai, J.; Wang, Y. Ecological Well-Being Performance Evaluation of Chinese Major Node Cities Along the Belt and Road. Land 2022, 11, 1928. [Google Scholar] [CrossRef]
- Bian, J.; Ren, H.; Liu, P. Evaluation of urban ecological well-being performance in China: A case study of 30 provincial capital cities. J. Clean. Prod. 2020, 254, 120109. [Google Scholar] [CrossRef]
- Li, Z.; Ouyang, X.; Du, K.; Zhao, Y. Does government transparency contribute to improved eco-efficiency performance? An empirical study of 262 cities in China. Energy Policy 2017, 110, 79–89. [Google Scholar] [CrossRef]
- Zhang, H.; Xu, Y. Adhere to and strengthen the leadership of the party to promote the construction of ecological civilization to achieve historical turning points and overall changes. Manag. World 2022, 38, 1–11. [Google Scholar] [CrossRef]
- Liu, R.; Wang, Y.; He, C. Study on the comprehensive carrying capacity of urban agglomeration in the Yellow River Basin from the perspective of high-quality development. Ecol. Econ. 2022, 38, 89–97. [Google Scholar]
- Qin, H.; Ren, B. The goal of high-quality development of urban agglomeration in the Yellow River Basin and its realization path. Econ. Manag. Rev. 2021, 37, 26–37. [Google Scholar]
- Sun, J.; Cui, Y.; Zhang, H. Spatial and temporal pattern and mechanism analysis of the coupling between ecological protection and economic development of urban agglomeration in the Yellow River Basin. J. Nat. Resour. 2022, 37, 1673–1690. [Google Scholar]
- Wang, Q.; Zhao, Z.; Shen, N.; Liu, T. Have Chinese cities achieved the win-win between environmental protection and economic development? From the perspective of environmental efficiency. Ecol. Indic. 2015, 51, 151–158. [Google Scholar] [CrossRef]
- Dong, Y.H.; Xie, B. Effect of environmental regulation on green total factor productivity of China’s thermal power industry—An Empirical Study Based on Provincial Panel Data. Ecol. Econ. 2022, 38, 51–58. [Google Scholar]
- Dietz, T.; Rosa, E.A.; York, R. Environmentally efficient well-being: Is there a Kuznets curve? Appl. Geogr. 2012, 32, 21–28. [Google Scholar] [CrossRef]
- Zhang, S.; Zhu, D.J.; Shi, Q.H.; Cheng, M.W. Which countries are more ecologically efficient in improving human well-being? An application of the Index of Ecological Well-being Performance. Resour. Conserv. Recycl. 2018, 129, 112–119. [Google Scholar] [CrossRef]
- Behjat, A.; Tarazkar, M.H. Investigating the factors affecting the ecological well-being performance in Iran from 1994 to 2014. Environ. Dev. Sustain. 2021, 23, 13871–13889. [Google Scholar] [CrossRef]
- Feng, Y.; Zhong, S.; Li, Q.; Zhao, X.; Dong, X. Ecological well-being performance growth in China (1994–2014): From perspectives of industrial structure green adjustment and green total factor productivity. J. Clean. Prod. 2019, 236, 117556. [Google Scholar] [CrossRef]
- Hou, J.; Ruan, X.; Lv, J.; Guo, H. Two-Stage Super-Efficiency Slacks-Based Model to Assess China’s Ecological Wellbeing. Int. J. Environ. Res. Public Health 2020, 17, 7045. [Google Scholar] [CrossRef] [PubMed]
- Yao, L.; Yu, Z.; Wu, M.; Ning, J.; Lv, T. The Spatiotemporal Evolution and Trend Prediction of Ecological Wellbeing Performance in China. Land 2020, 10, 12. [Google Scholar] [CrossRef]
- Wang, S.; Zhang, Y.; Yao, X. Research on Spatial Unbalance and Influencing Factors of Ecological Well-Being Performance in China. Int. J. Environ. Res. Public Health 2021, 18, 9299. [Google Scholar] [CrossRef] [PubMed]
- Xiao, L.; Xiao, Q. Analysis on pattern differentiation and spatial convergence of urban ecological well-being performance in the Yellow River Basin. Soft Sci. 2021, 35, 46–53. [Google Scholar]


| Stage | Category | Dimension | Secondary Indicators | Unit |
|---|---|---|---|---|
| Input indicators | Capital input | Workforce | Labor force per 104 persons | Person |
| Fixed assets | Per capita fixed assets investment | Yuan | ||
| Resource input | Water consumption | Per capita water consumption | Ton | |
| Energy consumption | Per capita energy consumption | Kw·h | ||
| Land consumption | Per capita urban construction land area | m2 | ||
| Intermediate indicators | Undesirable outputs | Wastewater emission | Per capita wastewater | Ton |
| Exhaust gas emission | Per capita SO2 | kg | ||
| Waste emission | Per capita Soot/dust | kg | ||
| Desirable output | Economic development | Per capita GDP | Yuan | |
| Output indicators | Well-being level | Education level | The number of students enrollment per 104 persons () | Person |
| Health care level | The number of doctors per 104 persons () | Person | ||
| Environmental level | Per capita green area () | m2 |
| Year | Moran’s I | p Value | z Value |
|---|---|---|---|
| 2011 | −0.180 | 0.008 | −2.096 |
| 2012 | −0.145 | 0.034 | −1.753 |
| 2013 | −0.073 | 0.198 | −0.808 |
| 2014 | −0.027 | 0.431 | −0.229 |
| 2015 | −0.096 | 0.140 | −1.058 |
| 2016 | −0.147 | 0.028 | −1.733 |
| 2017 | 0.034 | 0.243 | 0.658 |
Publisher’s Note: MDPI stays neutral with regard to jurisdictional claims in published maps and institutional affiliations. |
© 2022 by the authors. Licensee MDPI, Basel, Switzerland. This article is an open access article distributed under the terms and conditions of the Creative Commons Attribution (CC BY) license (https://creativecommons.org/licenses/by/4.0/).
Share and Cite
Lan, F.; Hui, Z.; Bian, J.; Wang, Y.; Shen, W. Ecological Well-Being Performance Evaluation and Spatio-Temporal Evolution Characteristics of Urban Agglomerations in the Yellow River Basin. Land 2022, 11, 2044. https://doi.org/10.3390/land11112044
Lan F, Hui Z, Bian J, Wang Y, Shen W. Ecological Well-Being Performance Evaluation and Spatio-Temporal Evolution Characteristics of Urban Agglomerations in the Yellow River Basin. Land. 2022; 11(11):2044. https://doi.org/10.3390/land11112044
Chicago/Turabian StyleLan, Feng, Zhao Hui, Jing Bian, Ying Wang, and Wenxin Shen. 2022. "Ecological Well-Being Performance Evaluation and Spatio-Temporal Evolution Characteristics of Urban Agglomerations in the Yellow River Basin" Land 11, no. 11: 2044. https://doi.org/10.3390/land11112044