Article

Territorial Inequalities, Ecological and Material Footprints of the Energy Transition: Case Study of the Cantabrian-Mediterranean Bioregion

Research Centre for Energy Resources and Consumption (CIRCE Institute), Universidad de Zaragoza, CIRCE Building, Campus Río Ebro, Mariano Esquillor Gómez, 15, 50018 Zaragoza, Spain
*
Author to whom correspondence should be addressed.
Land 2022, 11(11), 1891; https://doi.org/10.3390/land11111891
Submission received: 2 August 2022 / Revised: 19 September 2022 / Accepted: 2 October 2022 / Published: 25 October 2022

Abstract

:
This study develops a methodology to assess the energy transition’s territorial, ecological and material impacts on regions. As a case study, the methodology is applied to the Cantabrian-Mediterranean Bioregion, a geographical area constituting eight autonomous communities located in the north of Spain. Two energy demand scenarios for 2030 and 2050 were assessed. The 2030 scenario is based on the Spanish government’s planning, and the 2050 scenario constitutes a net-zero emission economy based on electrification. Energy dependence between autonomous communities, energy and raw material needs, and availability are obtained for both scenarios. Results show a high imbalance between energy producer–consumer autonomous communities and an ecological and critical material deficit for the Bioregion. Two alternative scenarios are proposed, one based on self-sufficiency to ensure a balanced energy transition and another based on energy and material efficiency seeking that the ecological and critical material footprints do not surpass the planet’s carrying capacity. The indicators and methodology proposed can be easily replicated elsewhere and help develop more equitable and sustainable territorial planning strategies.

1. Introduction

During the 21st United Nations Framework Convention on Climate Change in Paris it was internationally agreed to keep global warming well below 2 °C [1]. In this respect, the European Union aims to be climate-neutral by 2050, with net-zero greenhouse gas emissions [2]. This means a shift from fossil fuels, which are greenhouse gas emitters, toward less polluting renewable energy sources (RES), where electrification plays a key role [3]. This shift is also called decarbonization as it reduces the carbon dioxide equivalent emissions which is the metric for greenhouse gases [4].
The way to achieve economic decarbonization with 100% renewables systems is being extensively studied (i.e., at a global [5], regional [6], national [7], territorial [8], or city level [9]). In general terms, such studies mainly focus on the associated feasibility, reliability, and costs. Social aspects that may arise from this transition are usually omitted, and environmental ones rarely go beyond reducing the carbon footprint through the shift from fossil fuels to clean technologies. Indeed, there is a lack of studies that jointly analyze the energy transition and the other impacts it may entail, both locally and globally, in a holistic way.
It is a fact that RES technologies imply large occupation space, impacting rural areas and biodiversity [10], highlighting the importance of linking spatial planning to energy planning [11]. Furthermore, decarbonization implies the requirement of vast amounts of raw materials used to produce clean technologies [12,13,14,15,16,17]. Raw material security of supply raises global and European concerns [18] as mineral shortages may put at risk the very development of the energy transition.
For these reasons, there is a need to use alternative indicators and in-depth local studies to assess such usually unconsidered aspects regarding the sustainability of the energy transition.
This paper tries to fill that gap by proposing indicators to evaluate energy unbalances, environmental and material footprints associated with energy transition scenarios. The main aim is to provide local and global decision-making tools to reduce social, ecological, and material impacts.
The methodology is applied to the case study of the so-called Cantabrian-Mediterranean Bioregion, hereafter referred to as the Bioregion, comprising eight autonomous communities located in the north-east of Spain. The Bioregion is an optimal case study to show the proposed methodology. This is because the Bioregion includes highly populated and unpopulated territories, highly industrialized autonomous communities and others mainly dependent on the tertiary or primary sectors, territories blessed with considerable wind resources and others richer in solar energy.
The paper is structured as follows. Section 2 presents three indicators to assess the sustainability of a given energy transition scenario. The first is the energy self-sufficiency indicator, evaluating the potential social impacts associated with the space consumption of clean technologies and extra-territorial energy dependence. The second is the well-known ecological footprint. The third is the critical global equivalent mineral footprint, which evaluates the limits of an energy transition due to potential material shortages and supply risks. The first and third indicators show foreign dependence and exposure to geopolitical instabilities, which are vulnerabilities with negative consequences. This has become evident in Ukraine’s war, in which Europe’s gas dependence on Russia is provoking severe economic consequences in Europe [19] and the world [20].
Section 3 describes the case study, scenarios and data used to apply the methodology for the Cantabrian-Mediterranean Bioregion. There are three temporary scenarios, 2030, 2050, and 2050 efficient. The first is based on the National Integrated Energy and Climate Plan (PNIEC) [21], which proposes to produce 74% of electricity with renewable generation and a 4% increase in electricity demand compared to the current energy situation due to the electrification of part of the energy demands. The 2050 scenario is based on replacing fossil energy sources with renewables, mainly through electrification in a 100% renewable electricity system. In the efficient scenario we consider additionally a reduction of energy and material demands trying to ensure that the ecological and global equivalent mineral footprints do not surpass the planet’s carrying capacity. Finally, we present two technical scenarios: the trend scenario is based on the current trend of installing renewable nameplate capacity, and the balanced scenario is based on electricity self-sufficiency.
Section 4 presents the results, where we compare the proposed indicators for each main scenario and discuss the results, analyzing the implications, possible consequences, and solutions.
Finally, in Section 5, we show the main conclusions derived from the paper.

2. Methodology

The energy transition goal is to reduce fossil fuel consumption and greenhouse gas (GHG) emissions drastically using clean technologies. Therefore, the associated carbon footprint, expressed in tons of CO2 equivalent, will significantly decrease since, at least in the use phase, clean technologies, including renewables or electric mobility, do not emit GHGs.
That said, clean technologies generate other impacts that cannot be measured through the carbon footprint alone. Important amounts of water, raw materials, and energy (most of which obtained from fossil fuels) are required to produce them. Moreover, the amount of surface used per MW produced is many times greater than their conventional counterparts, since renewable energies have a much lower power density than fossil technologies. According to [22], the power density of photovoltaics and wind are 50 and 200 times lower than of natural gas, respectively. The result is that vast amounts of land are expected to be used for power generation, modifying landscapes, and intensifying global competition for land, thereby creating social tensions.
Strategies to implement clean technologies in the territories cannot forget these other aspects that go beyond accounting for direct CO2 emissions. This is why we propose to evaluate additional criteria considering the environmental impact of technologies, their intensity in the use of materials and territory, and energy-dependence. To that end, we propose using three indicators: renewable energy self-sufficiency, ecological footprint, and what we call “global equivalent mineral footprint”, as explained below.

2.1. Renewable Energy Self-Sufficiency

The first indicator is renewable energy self-sufficiency. We obtain it from the ratio between renewable energy generation and energy demand, as Equation (1) shows.
Renewable   energy   self sufficiency = Renewable   energy   generation Energy   demand × 100
This indicator aims to show the degree of energy self-sufficiency of a territory with renewable sources. It has some interesting connotations since by comparing regions that form a unit, the interdependence between them can be seen. “Sacrifice regions”, meaning net energy exporter territories making available more RES-devoted land than they need domestically, can be easily detected. This, in turn, is an indication of potential social conflicts. Moreover, it is an indicator of external energy dependency and consequential vulnerabilities in a 100% renewable system.
The ideal result would be a value slightly higher than 100%, with enough surplus to cover losses.

2.2. Ecological Footprint

The ecological footprint is an internationally recognized sustainability indicator used as a standardized measure of demand for natural capital. It compares how fast resources are consumed and waste is generated with the speed of nature to generate new resources and absorb waste measured in areas [23]. The calculation consists of converting the equivalent global biologically productive hectares to the direct and indirect consumption of energy, biomass, building materials, water, and other resources on a population basis. The per capita biological capacity available on Earth was estimated to be 1.6 gha in 2019, and the ratio of the humanity footprint to the per capita biological capacity was 1.75 [23], which implies humanity’s total ecological footprint of 1.75 planet Earths.
Results are shown with the concept of “Planet Equivalent” [24]. However, instead of the ratio of an individual’s (or country’s per capita) footprint to the per capita biological capacity available on Earth, we used the ratio of the territory’s ecological footprint to the territory’s biocapacity. We named the result “Territory Equivalent”. A value of 2 means that the Bioregion needs 2 times its territory biocapacity to compensate for its ecological footprint.
The ecological footprint is a powerful tool for explaining the demand for the regenerative capacity of biotic systems. However, it provides insufficient information when dealing with abiotic resources [25]. Indeed, the environmental impact of mining is hardly measurable in biologically productive areas, and this indicator is consequently insensitive to depletion problems. Therefore, the ecological footprint alone cannot assess the material impact of clean technologies and we need to resort to other indicators, such as the global equivalent mineral footprint as explained below.

2.3. Global Equivalent Mineral Footprint

In 1993, Schmidt-Bleek presented the Material Input Per unit of Service (MIPS), which aims to account for all materials moved to produce goods or a service from cradle to grave [26]. MIPS preceded the Planetary pressures–adjusted Human Development Index (PHDI), which considers the society’s material footprint (defined as the global allocation of used raw material extraction to the final demand of an economy) and the ecological footprint in order to develop indicators of sustainability and wellbeing [27]. A drawback of MIPS or the PHDI is that as the materials are measured in kg or tonnes of material input, there is no discrimination in terms of quality and the problem of adding apples with pears arises [25,28]. For instance, they do not take into account the scarcity of these materials in the Earth’s crust.
A thermodynamic approach to account for the mineral capital loss through extraction was proposed by Valero et al. [25,28] and applied to several case studies such as Latin America [29,30], Europe [15], or the USA [31]. In this same line, the concept of material debt is currently under development, unifying all materials into a single indicator, considering their respective qualities based on thermodynamic aspects of the resource [32].
Even if a rigorous thermodynamic assessment of raw material use is advisable, alternative indicators can be used to account for at least their individual scarcity degree in the crust. We propose the global equivalent mineral footprint where the material needs for the energy transition are compared to global mineral reserves for each material, which can be easily obtained from the United States Geological Survey (USGS) statistics [33]. Reserves refer to the known economically viable resources to be extracted.
As shown in Equation (2), the mineral requirements per capita associated with the material needs to deploy the clean technologies of a given region, multiplied by the ratio between the world’s population and the world mineral reserves.
Global   equivalent   mineral   reserves   footprint = Mineral   requirement   per   capita × World   population World   mineral   reserves
The result shows the planet Earth’s reserves that would be required to meet a global energy transition for each mineral if the same strategy were implemented worldwide. A result of 1 means that all currently available reserves would be required to meet the material demands if the same energy transition were to be performed globally. It is, therefore, a matter of extrapolating the requirements of a territory to the world as a whole and determining the scenario’s viability by considering global justice. If resources are considered the result is the Global equivalent mineral reserves footprint.

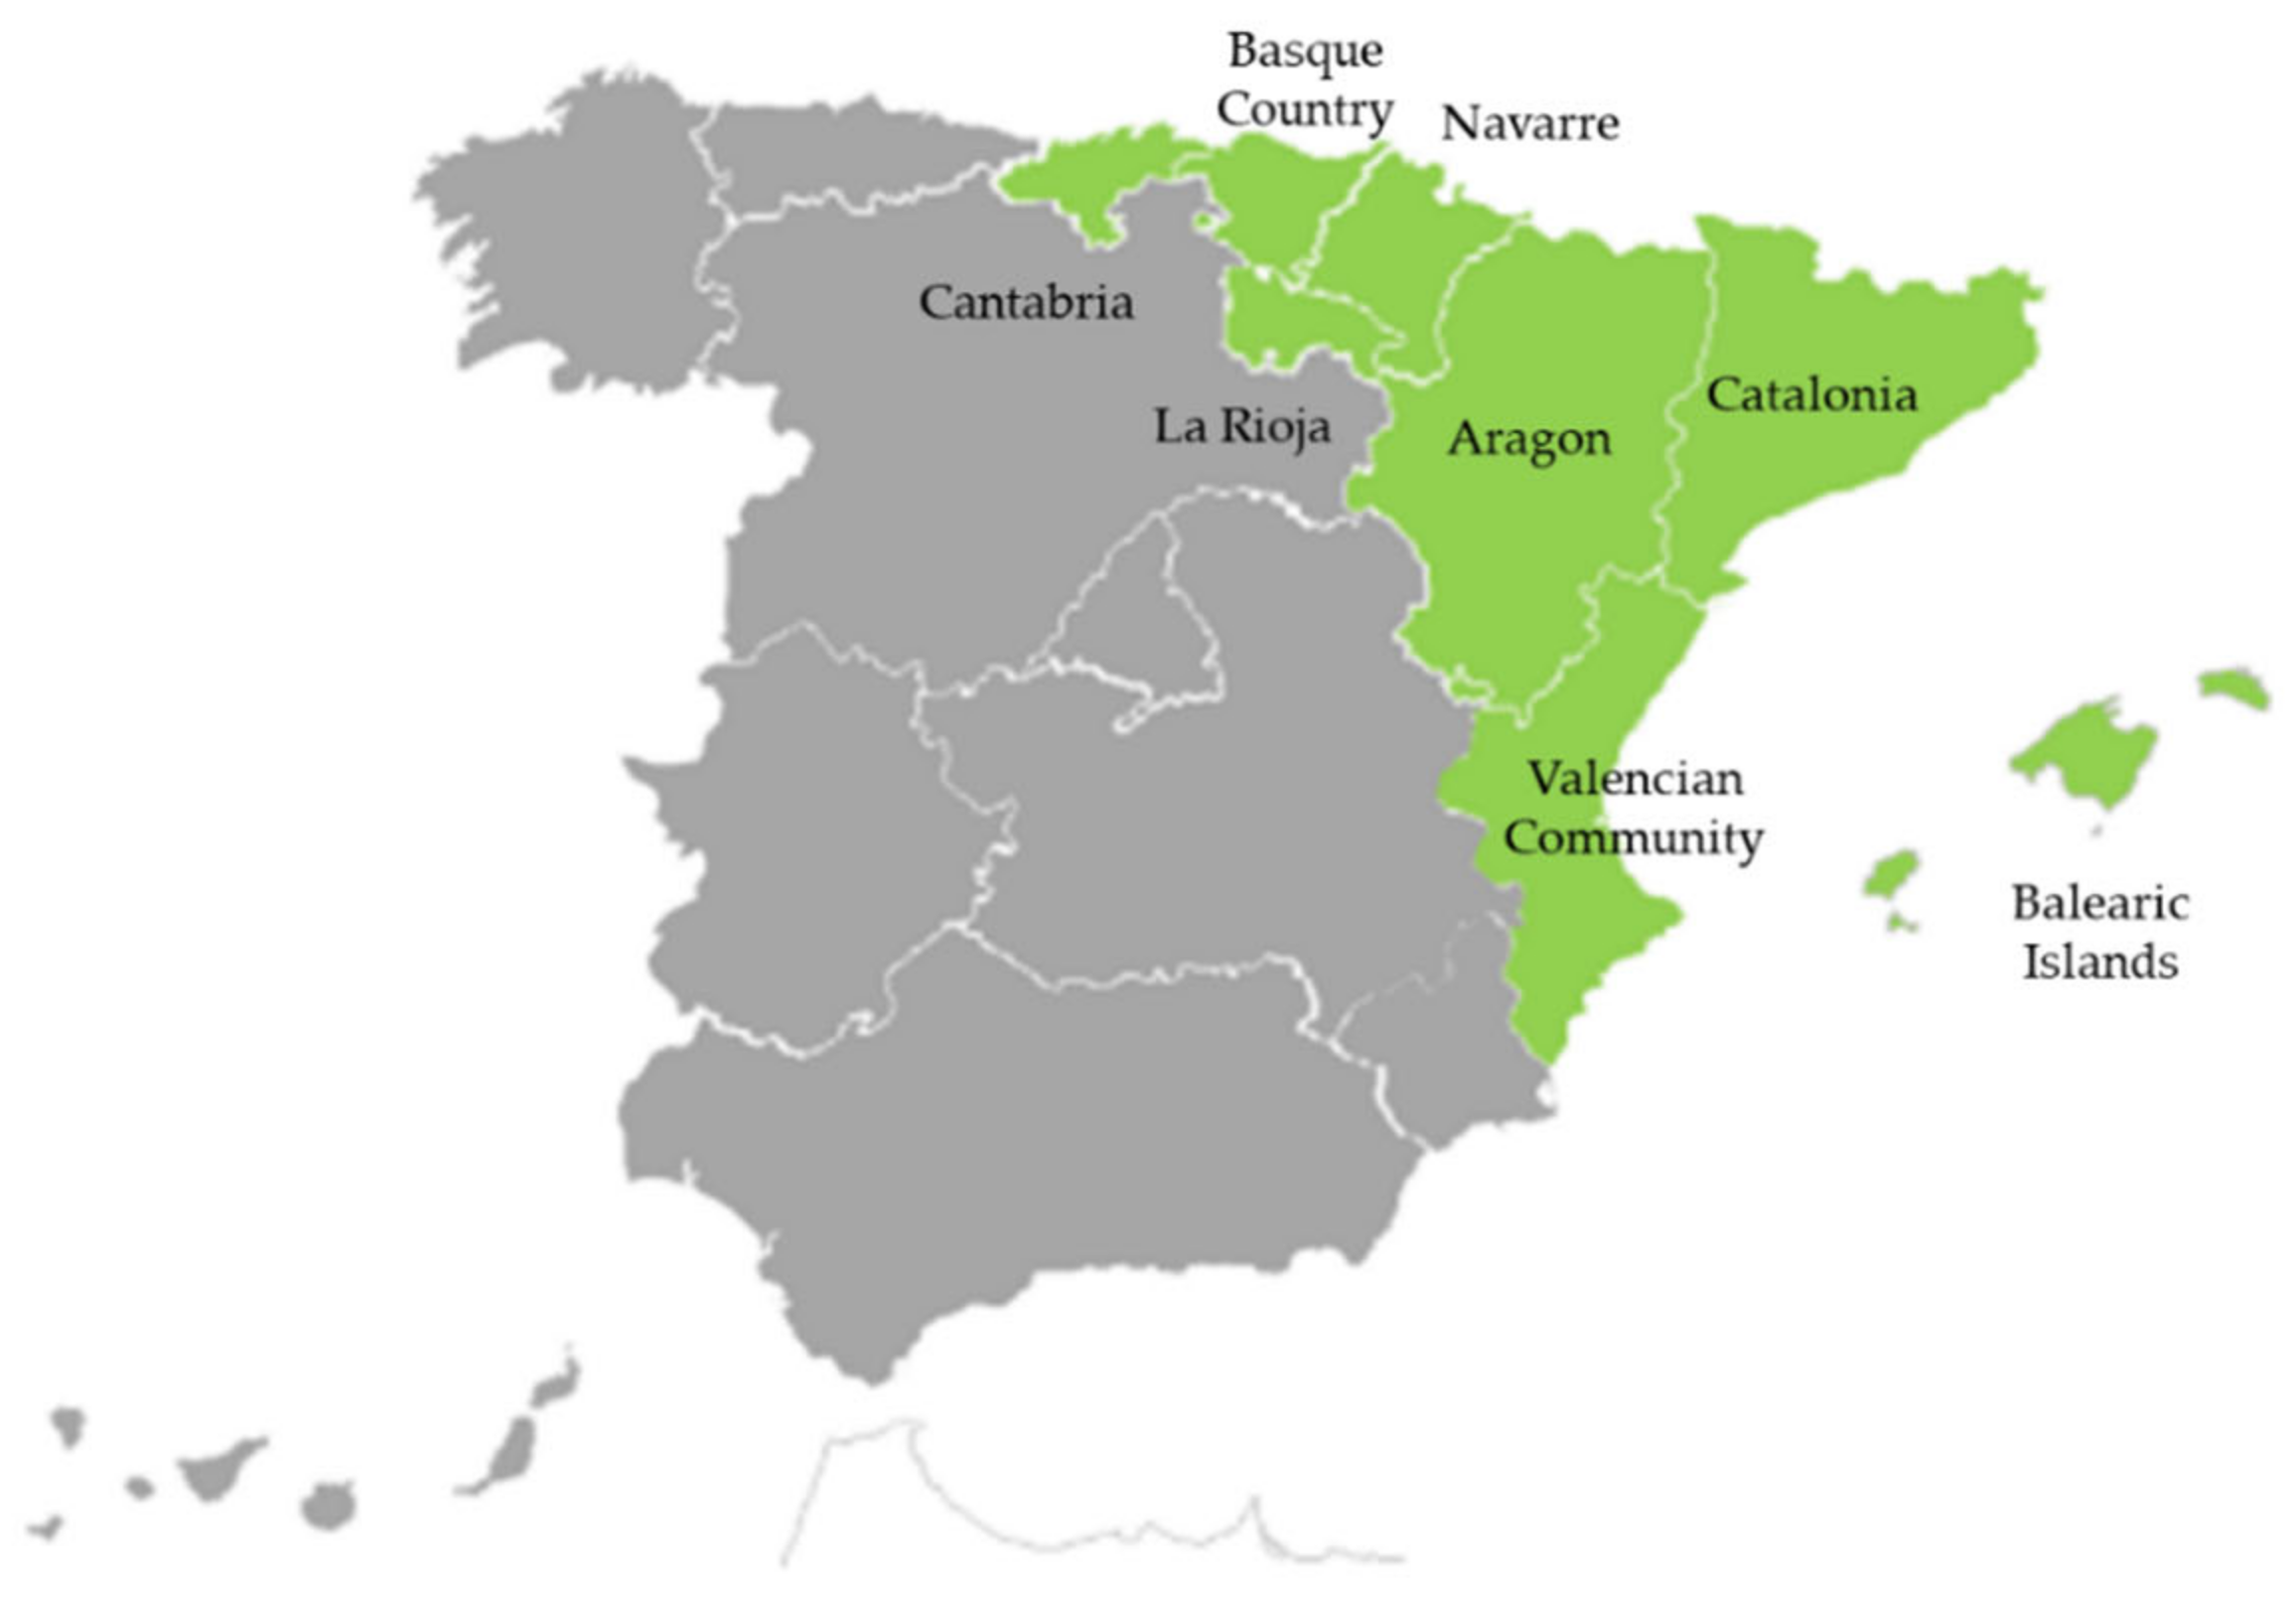
3. The case of the Cantabrian-Mediterranean Bioregion

3.1. Description of the Bioregion

The Cantabrian-Mediterranean Bioregion is a natural geographical space with sufficient resources to constitute a unit of resilience that addresses, with a global vision in the medium and long term, the challenges posed by adaptation to the climate emergency, as well as the planning of a harmonious and sustainable balanced development [34]. The idea of the Bioregion is to agree on fundamental values that foster human dignity, respect for nature, and the protection of common goods beyond current generations [35]. The objectives should be achieved by promoting harmony between the ecosystem communities to reduce their joint ecological footprint, proposing organizational structures adapted to the territory’s ecological, economic, and social environment, thereby maintaining the cohesion and harmony of its inhabitants [35]. The autonomous communities of Cantabria, the Basque Country, La Rioja, Navarre, Aragon, Catalonia, the Valencian Community, and the Balearic Islands satisfy the characteristics mentioned above and hence can be considered as a Bioregion. The so-called Cantabrian-Mediterranean Bioregion is shown in Figure 1, marked in green. It covers a surface area of 136 thousand km2, 27% of the Spanish territory. It has 18.9 million inhabitants, 40% of the Spanish population, with a gross domestic product (GDP) of 543 million euros, 43.7% of the Spanish GDP [36].
The Bioregion current final energy consumption (energy consumed by end users) is shown in Figure 2 for 2018. This year has been considered as the reference scenario as it is the year with the most recent available data for most communities. The reference year for electricity demands corresponds to 2020 due to its low variation compared to 2018 and because the data is more recent. If energy sources for electricity production are considered, fossil fuels represent 78% of the final energy consumption, a strong energy dependence on fossil fuels, which is in line with the world’s average [37]. This fact makes the Cantabrian-Mediterranean Bioregion a good case study whose conclusions may be globally generalized.
Table 1 shows other interesting data about the Bioregion in the reference scenario. It is highlighted that low-populated autonomous communities export electricity to high-populated ones.
The Spanish electrical grid operator (REE) expects that by 2026 [38], most of the new renewable nameplate capacity will be installed in low-populated areas. Figure 3 represents renewable power generation capacity per inhabitant over population density. The most significant difference among communities can be found between the case of Aragon and the Basque Country. Aragon, with a population density 11 times lower than the Basque Country (27.75 to 301.62 inhabitants per km2), has installed 92 times more renewable energy capacity per inhabitant than the Basque Country (8.7 to 0.1 kW/inhabitant). We used the same installation trend for the trend scenario explained below.

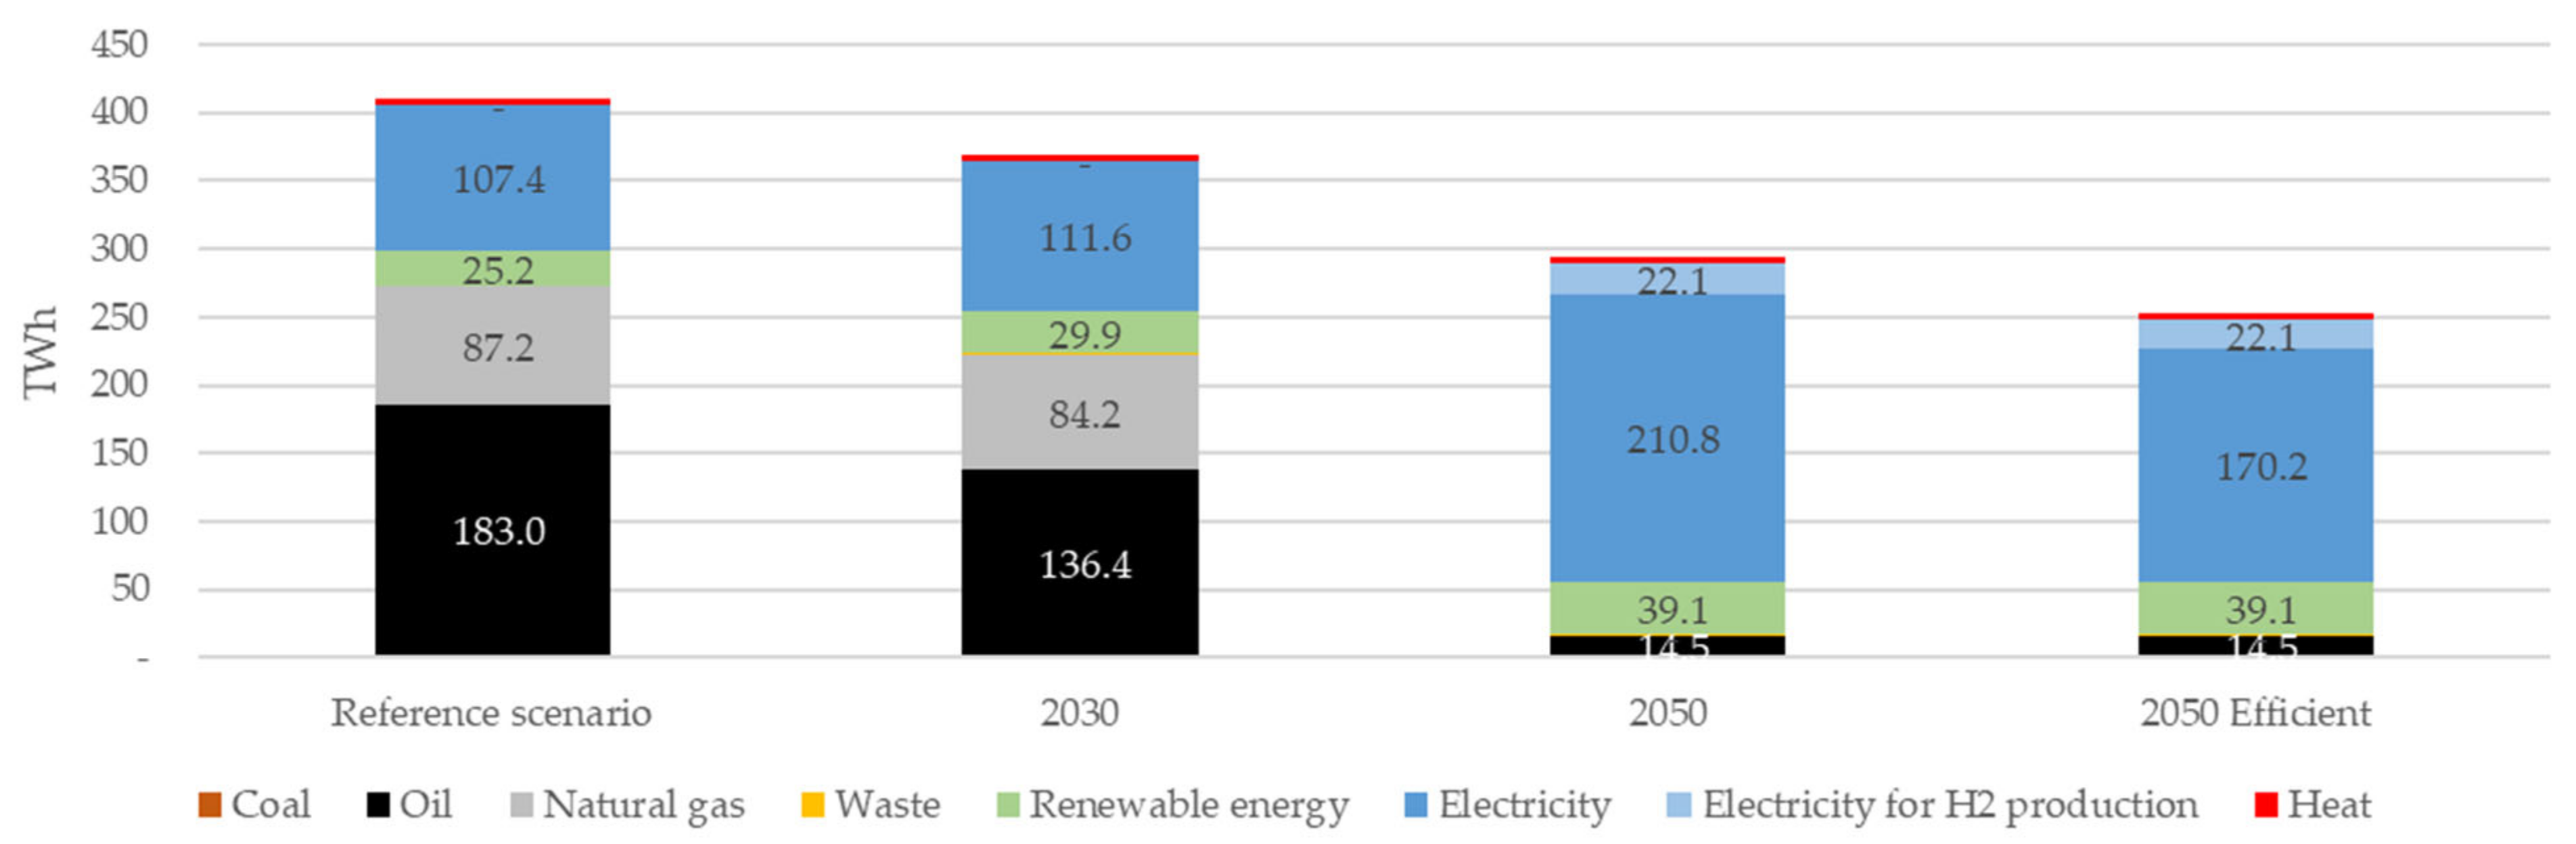
3.2. Energy Transition Scenarios for the Bioregion

The methodology described in Section 2 is applied to the following main energy transition scenarios for the Cantabrian-Mediterranean Bioregion. Results are compared with the reference scenario that represents the current situation in the Bioregion.
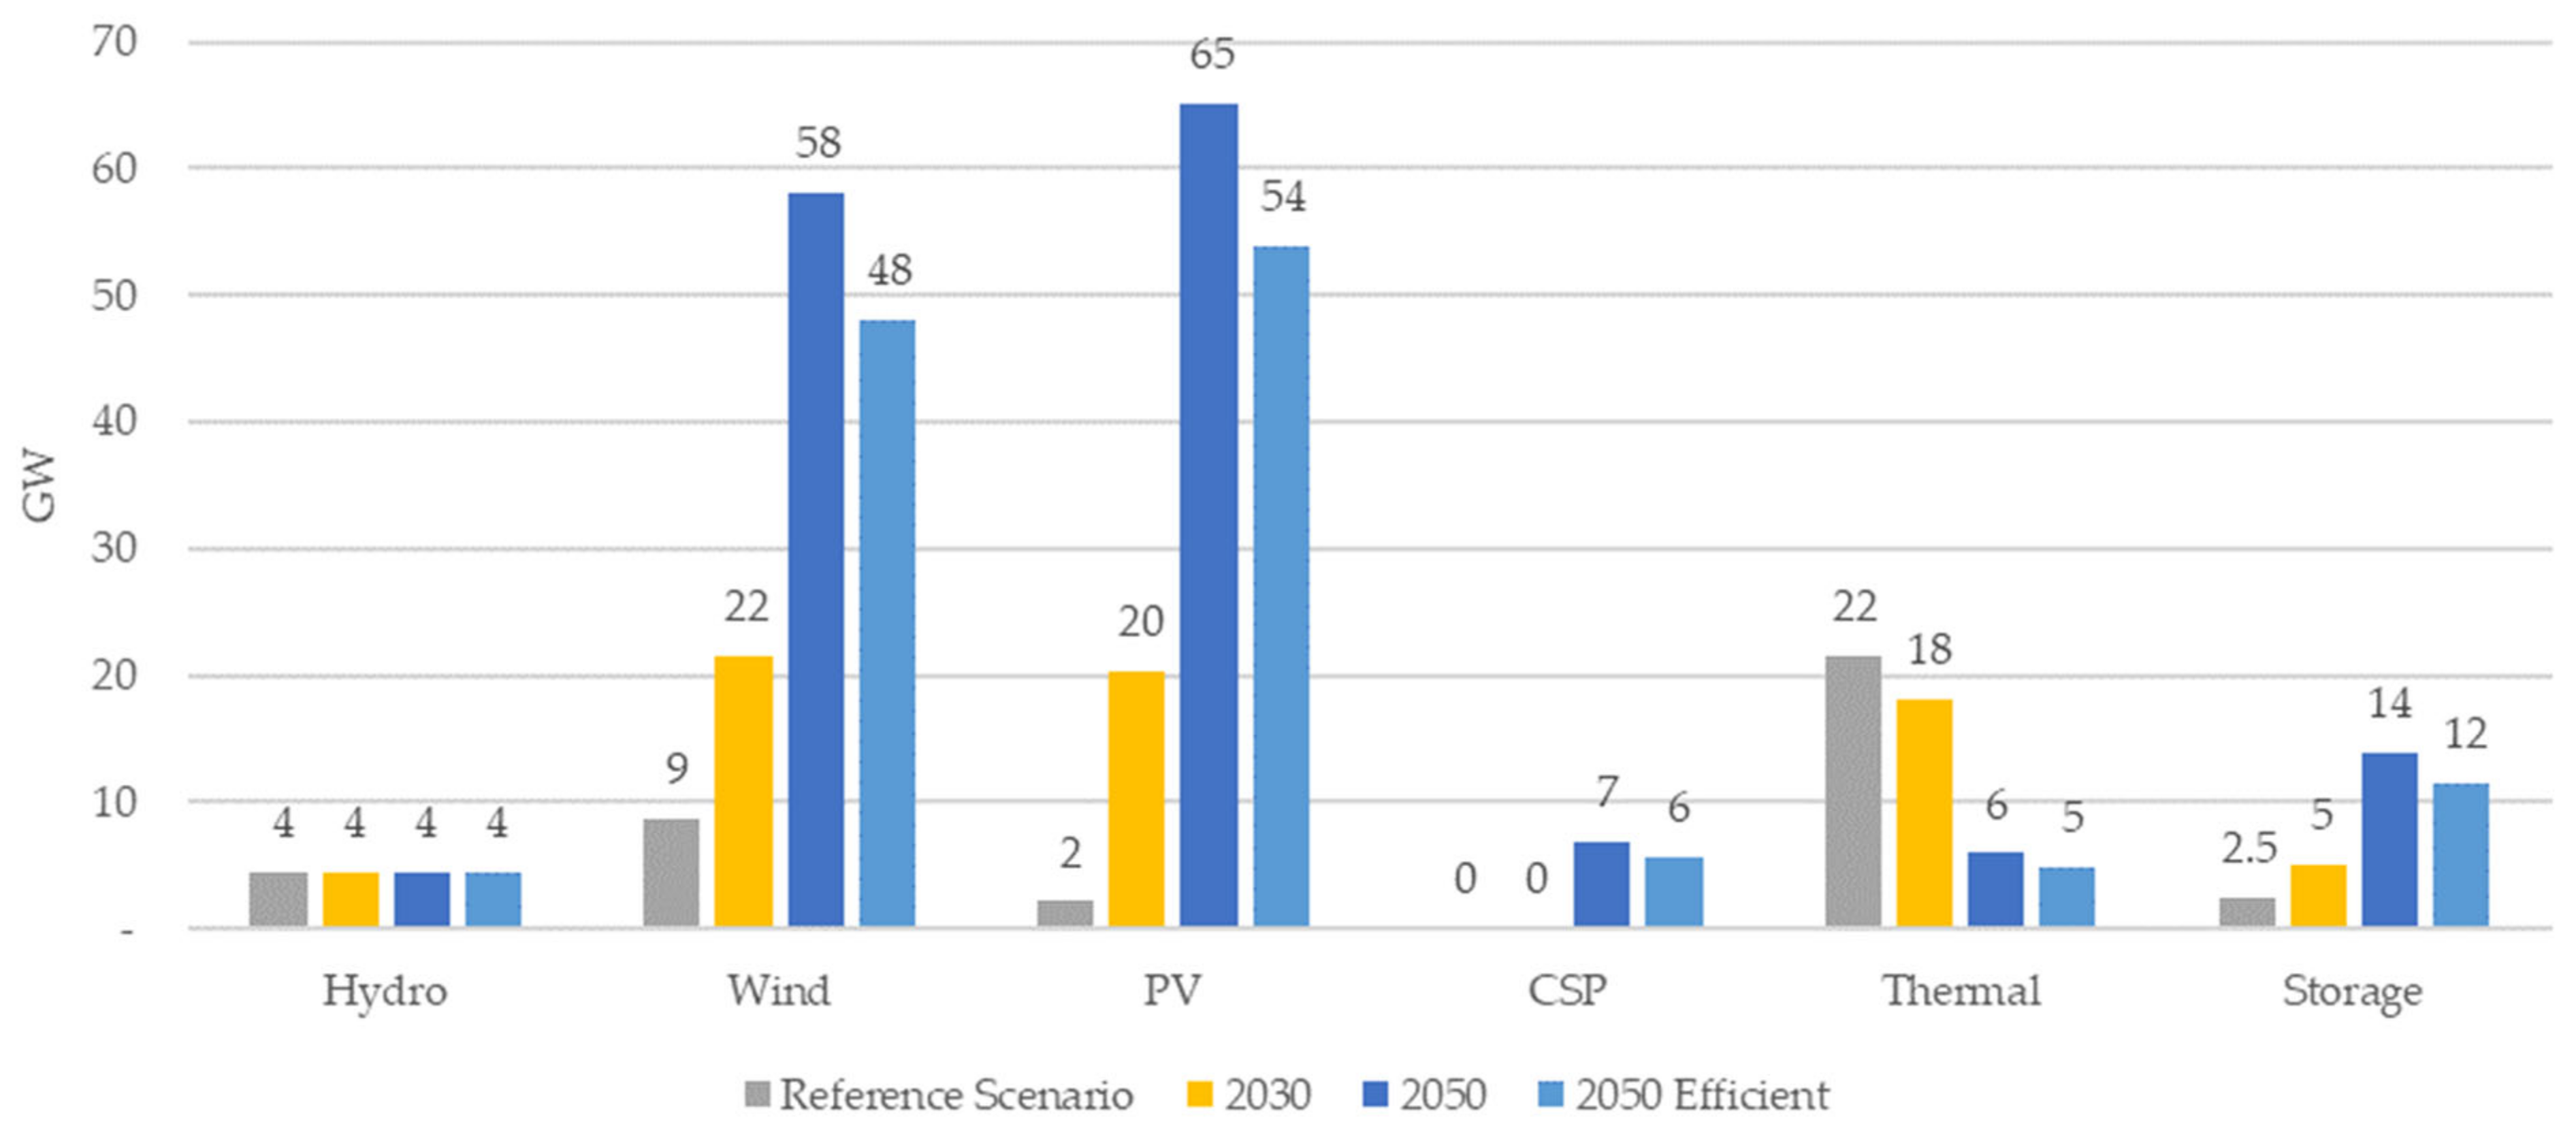
  • The 2030 scenario is based on the National Integrated Energy and Climate Plan (PNIEC) [21], which proposes to produce 74% of electricity with renewable generation and a 4% increase in electricity demand. This should be achieved by replacing conventional boilers with heat pumps and by electrifying combustion vehicles. With additional energy efficiency measures, a reduction of 15% in the final energy consumption is expected. Furthermore, PNIEC plans to install 57 GW of renewable nameplate capacity and deinstall 16 GW nameplate capacity of conventional power plants in Spain.
  • The 2050 scenario is a zero-emission economy, based on replacing fossil energy sources with RES, mainly through electrification, in a 100% renewable electricity system.
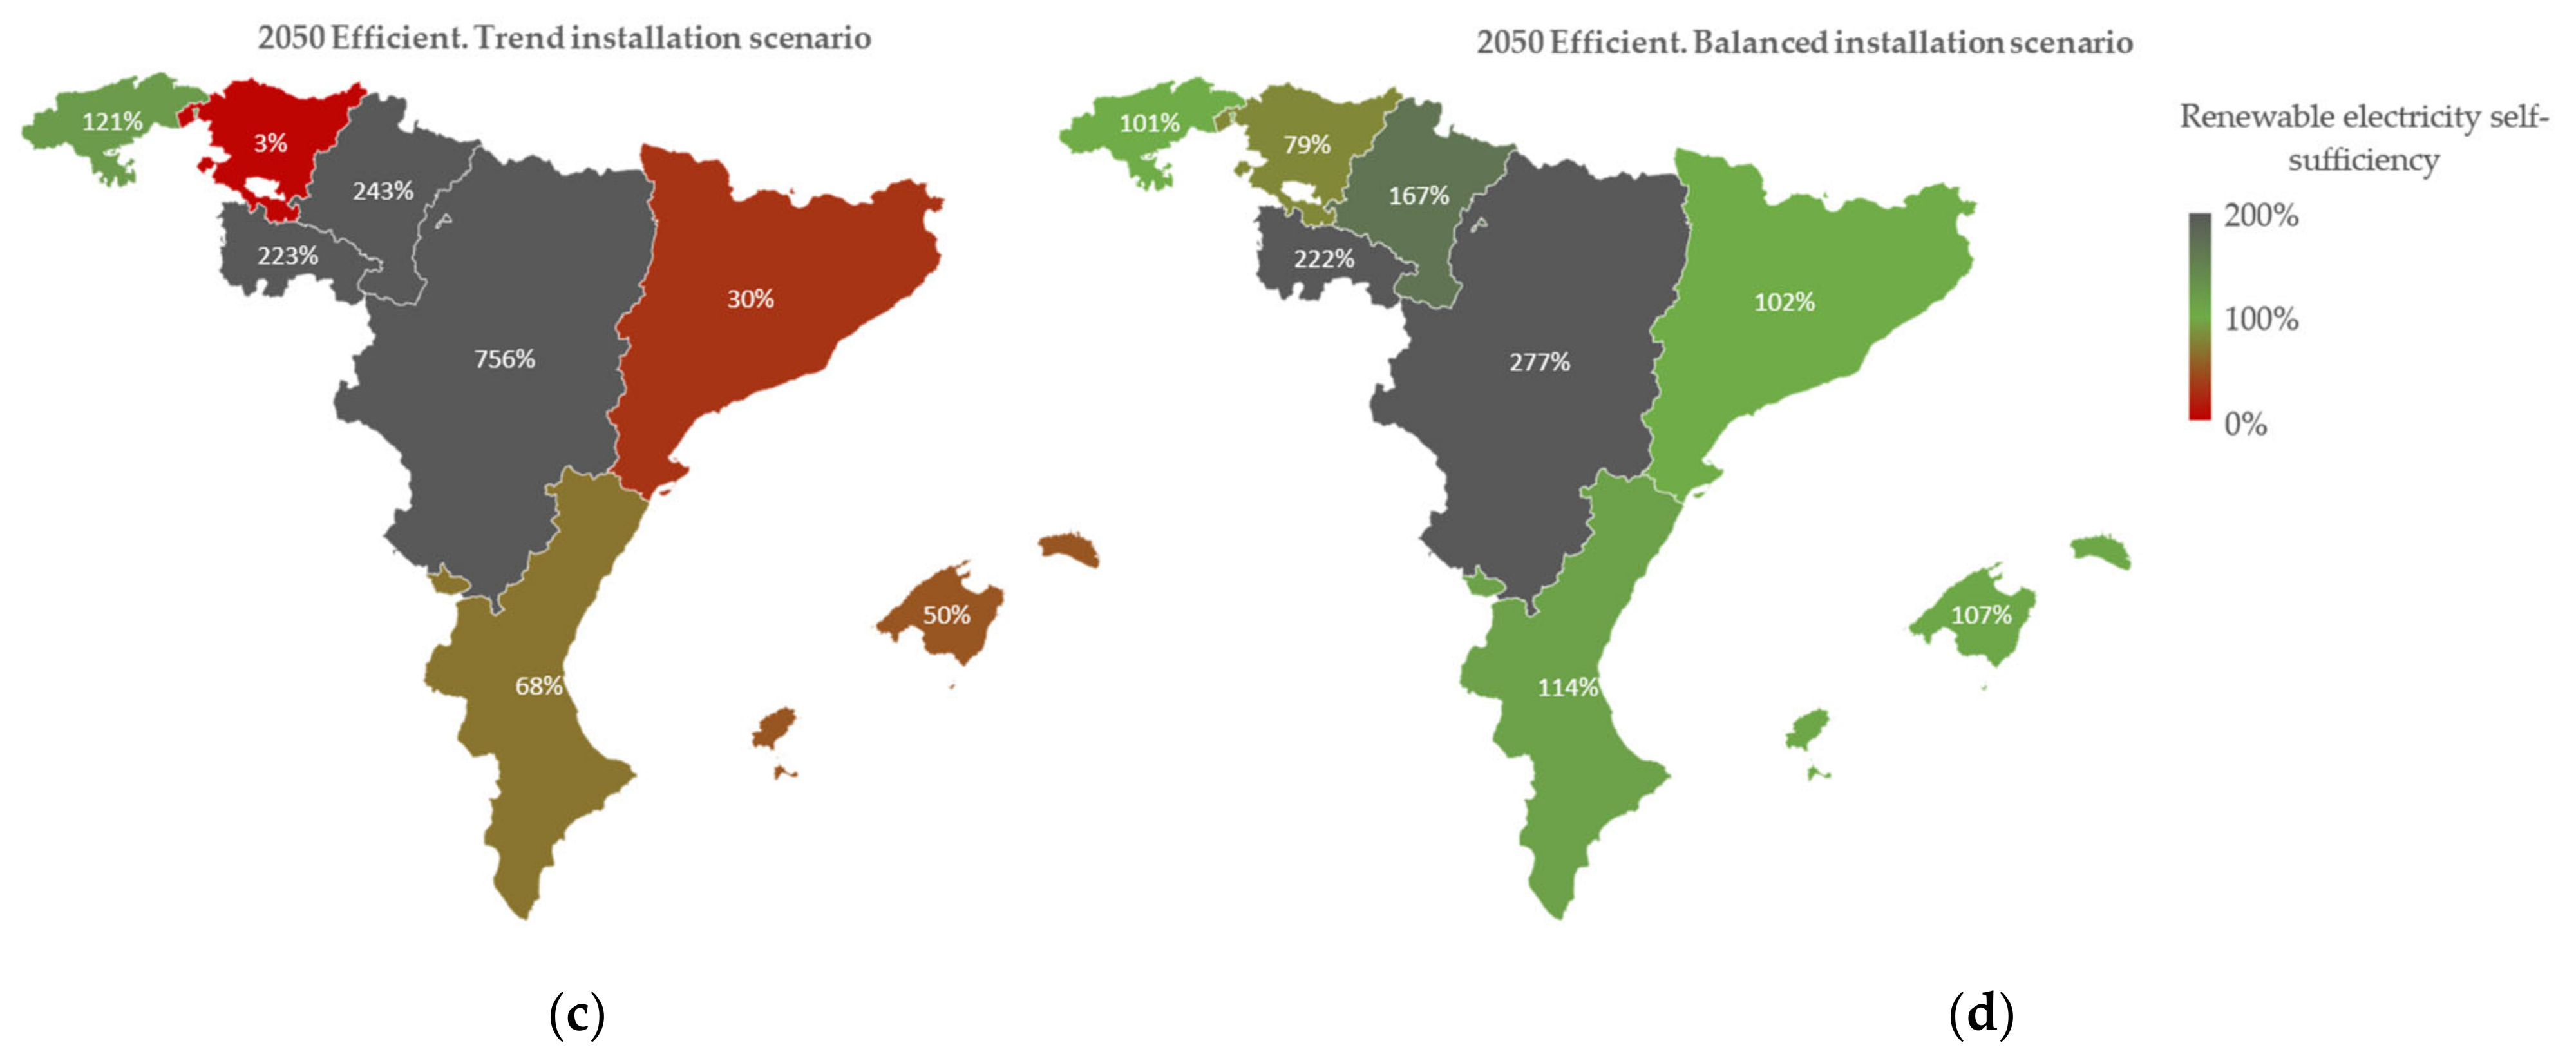
  • The 2050 efficient scenario considers a reduction in energy and material demands but maintains the predictions of increased activity thanks to greater use of public transport, shared mobility [39], shared road freight transport [40], and train transportation instead of road freight transportation [41]. In addition, greater energy efficiency in buildings due to isolation is considered (20% energy demand reduction for heating).
The main scenarios explained above are complemented with the following technical scenarios:
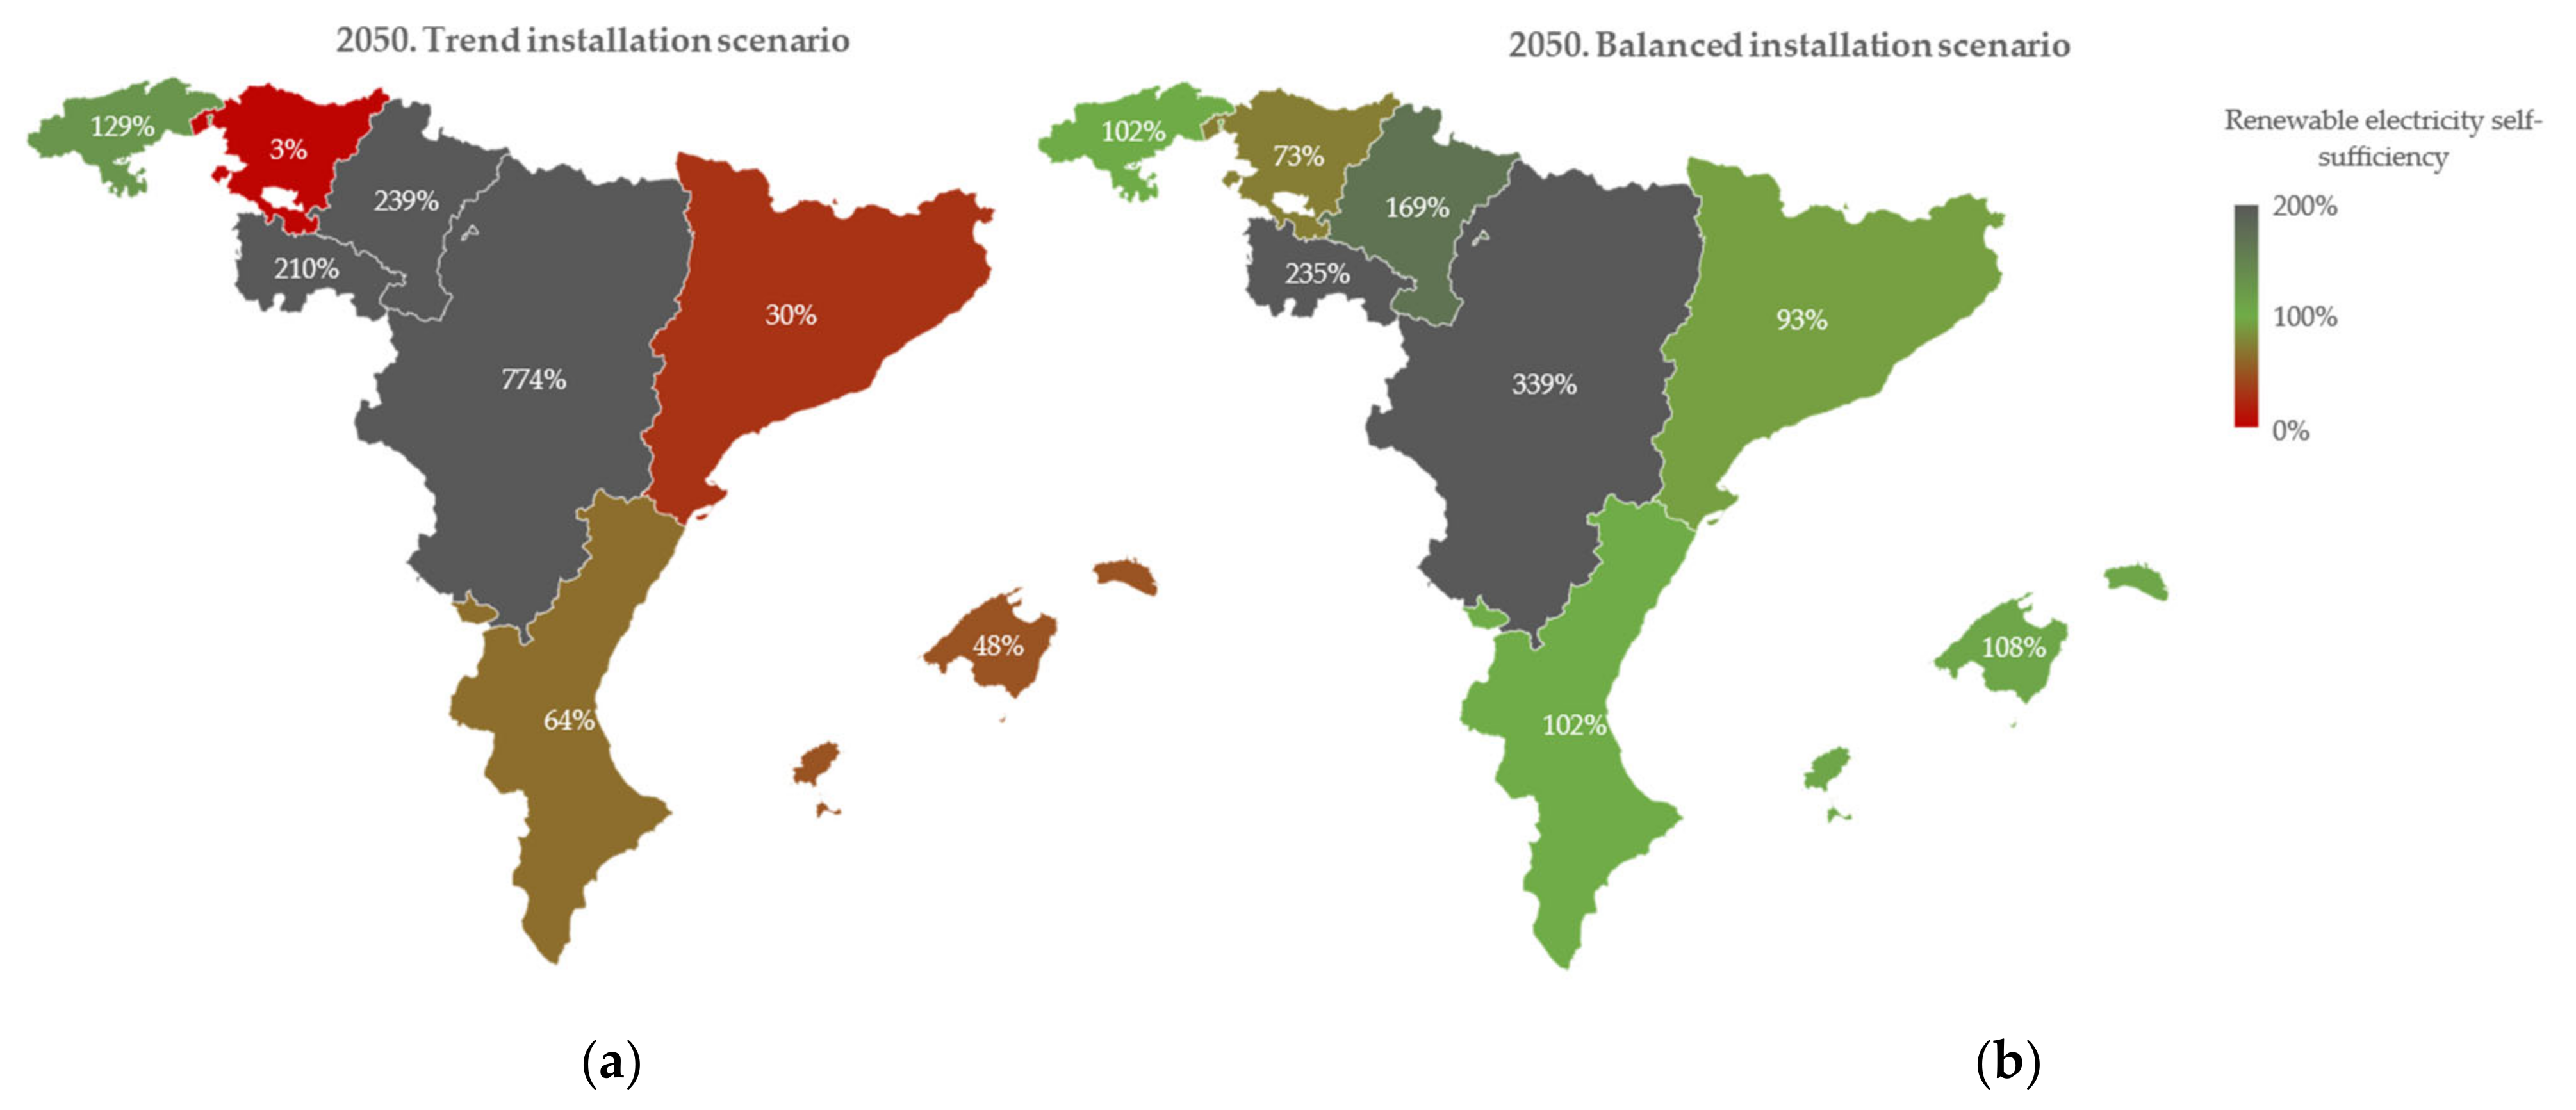
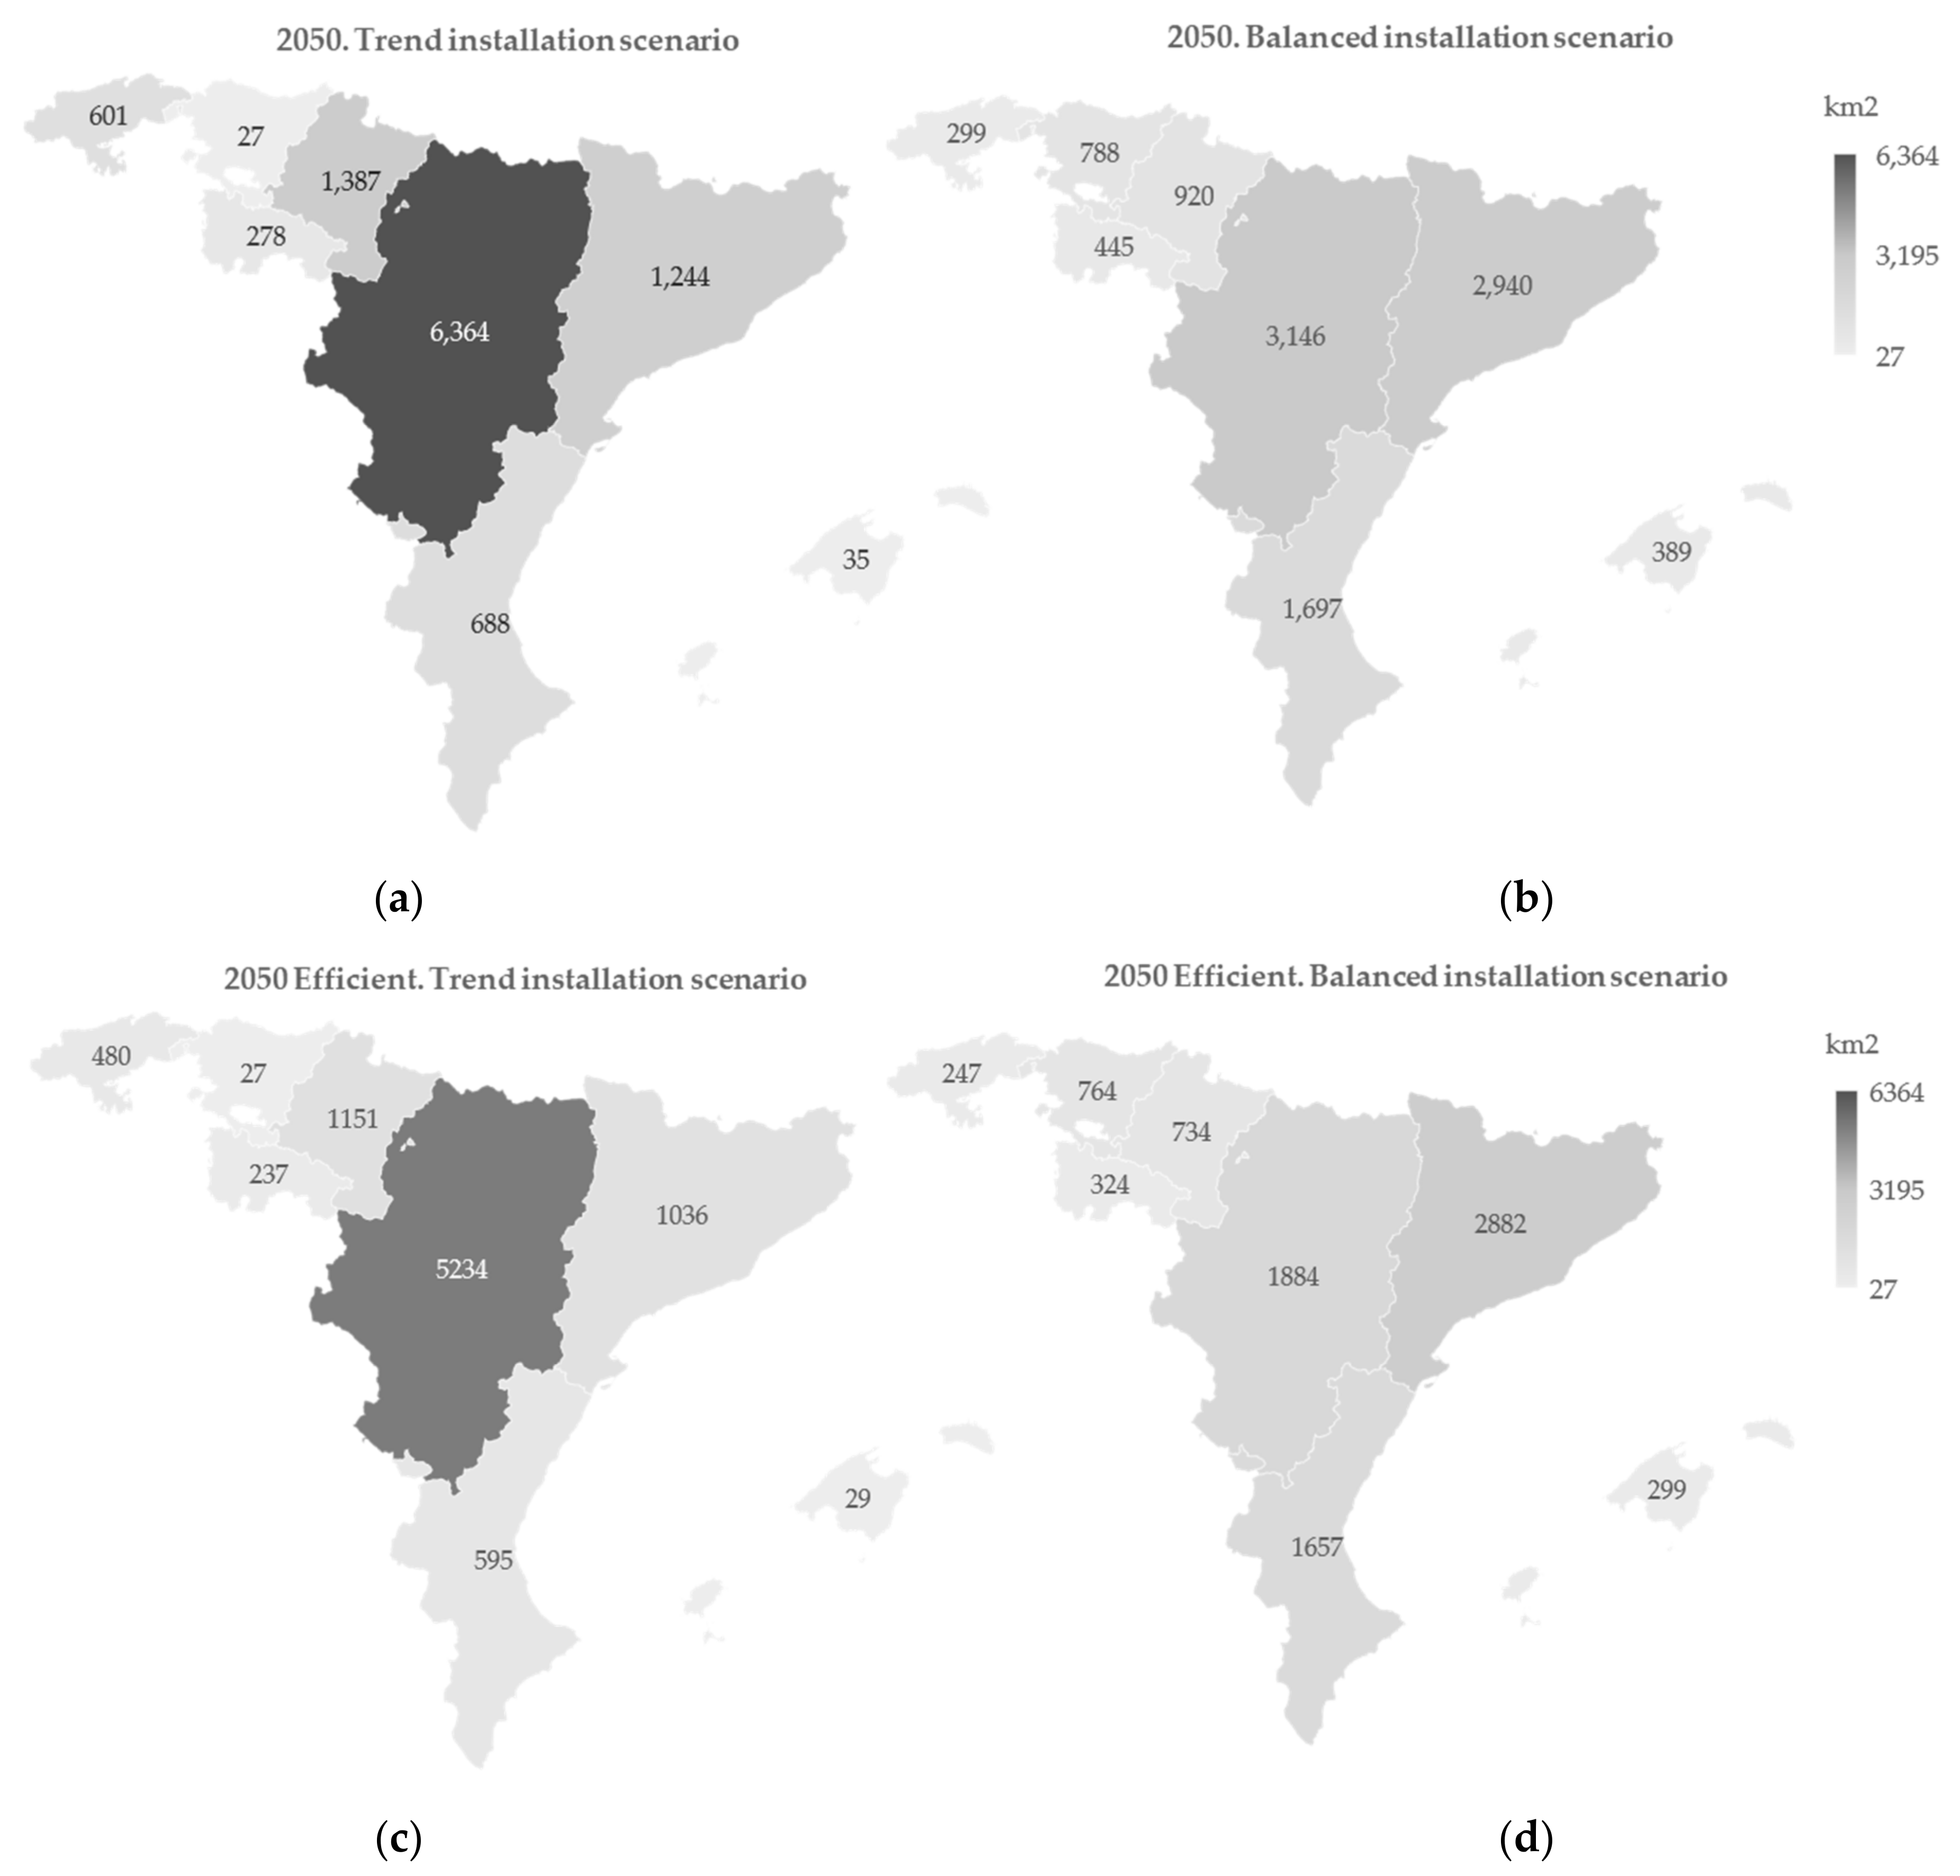
  • The trend scenario considers the current new renewable nameplate capacity installation trend by territory.
  • The balanced scenario is an alternative option in which the renewable nameplate capacity installation by autonomous communities is estimated according to their domestic energy needs. When an autonomous community does not have enough renewable resources, the neighboring autonomous communities provide the necessary renewable resources. The installed nameplate capacity is equivalent to the trend scenario but differs in the distribution among autonomous communities.
For all the scenarios, we evaluated the availability of renewable natural resources to satisfy demands. The model assumptions are explained in the following section.

3.3. Model Assumptions

The electrical system model is based on an energy balance to meet energy demands. We considered full load hours for each technology and territory. We considered a power density installation between 4 to 8 MW/km2 to estimate the polygonal surface area occupied by wind farms based on [42,43]. There is no resource scarcity for ground photovoltaics (PV) in any scenario, considering the polygonal area occupied by PV of 70 MW/km2 [44].
We modelled the 100% renewable electrical system with a constant monthly overproduction of 38%. The model is mainly based on wind and solar photovoltaics considering global technological trends [3], with support from concentrated solar power as well as hydro, biomass, and biogas power plants, in line with the studies of Jacobson [5] and the European Commission [45], but with a higher overproduction together with storage. Storage needs have been estimated at 11% of installed renewable power due to interconnections [5].
Table 2 shows the assumptions for the sectorial transformation for the 2050 scenarios. We considered an increase in consumption linked to the expected population and GDP growth [46].
Cost constraints have not been considered because we would incorporate considerable uncertainty in the model due to the recent high price volatilities of raw materials [54] and renewable technologies [13].
It is necessary to point out some limitations of our simulations. We assume a perfect electricity transmission with no congestion or frequency regulations and perfect matching between energy generation, energy storage, and energy demand. Furthermore, there are uncertainties in extreme weather events where energy demands and production may vary. Obviously, this is a best case scenario because such aspects may worsen the system requirements in terms of more renewable power installations, storage capacity, grid infrastructure, etc. To address this uncertainty, we assume an energy overproduction to guarantee that energy demand can always be supplied. We also considered distribution and transmission line material requirements that guarantee an appropriate interconnection and electricity distribution.
We assume that these limitations do not change the results significantly, since we compared the electrical power system of the Bioregion for the 2050 scenario with others already proven for Spain. More detailed information is shown in the Supplementary Material.
Disruptive technological changes, which were not considered in our model, can occur during the energy transition, requiring fewer materials or space resources. In this respect, it is not our goal to predict the future but to guide future policies based on the available technologies and existing global plan trends.
We gathered the data with the most recent available reports, there may be some data uncertainties or recent changes in activity or demand predictions, but these uncertainties do not change the conclusions of this paper.

3.4. Data Gathering

We analyzed the energy balance reports disaggregated by each autonomous community’s economic sector and energy source. Table 3 and the Supplementary Material show the data gathered with the corresponding information sources.
As no report was available for the autonomous communities of Cantabria and La Rioja, we estimated their final energy consumptions for oil and coal according to their contribution to national GDP, considering the link between GDP and energy consumption [78,79].
We obtained the material requirements for the evaluated technologies. For electric mobility, estimations for heavy and light trucks, motorbikes, and electric bikes were obtained from [80]. Data for battery storage technologies, electric mobility, and market forecasts for 2050 were obtained from [13]. The material demand for each technology is presented in the Supplementary Material based on [12,13,38,80,81,82,83,84,85]. We considered two material intensity ranges. The lower range assumes the minimal material requirements found in the bibliography for each technology and a 1% annual improvement in using critical materials in electromobility and batteries. The upper range assumes the maximum material requirement found in the bibliography. Results show the mean value of both ranges, but more detailed data are shown in the Supplementary Material.
We did not consider technology lifetimes and recyclability, so the results show the minimum material requirements for an energy transition.

4. Results

Based on the model assumptions and data provided in the previous section, we first estimated the energy demands and consequences of economic electrification for the 2030 and 2050 scenarios, as shown in Figure 4.
Total energy demand decreases in all scenarios without reducing economic activity thanks to electrification, which is more efficient. Due to partial transport electrification, 2030 oil demands decrease, increasing electricity demand.
By 2050, as most of the economy is electrified, electrical energy represents 79.37% of the final energy consumption, 233 TWh, doubling the current electricity demand. Electricity demand for hydrogen production accounts for 22 TWh. A small oil-dependent fraction (4.75%) is still considered for difficult to decarbonize sectors, such as primary sector and part of the industry sector. The 2050 efficient scenario achieves a greater electricity demand reduction of 40 TWh thanks to land transport efficient measures and building insulation.
Figure 5 shows the Bioregion’s renewable nameplate capacity for the reference, 2030 and 2050 scenarios. Thermal represents the conventional thermal power plants fueled with conventional fuels in 2020 and 2030. In 2050 thermal refers to biogas and biomass power plants. Comparing energy demands with renewable resources for the 2050 scenarios, the Bioregion has sufficient energy resources, except oil, to be self-sufficient.

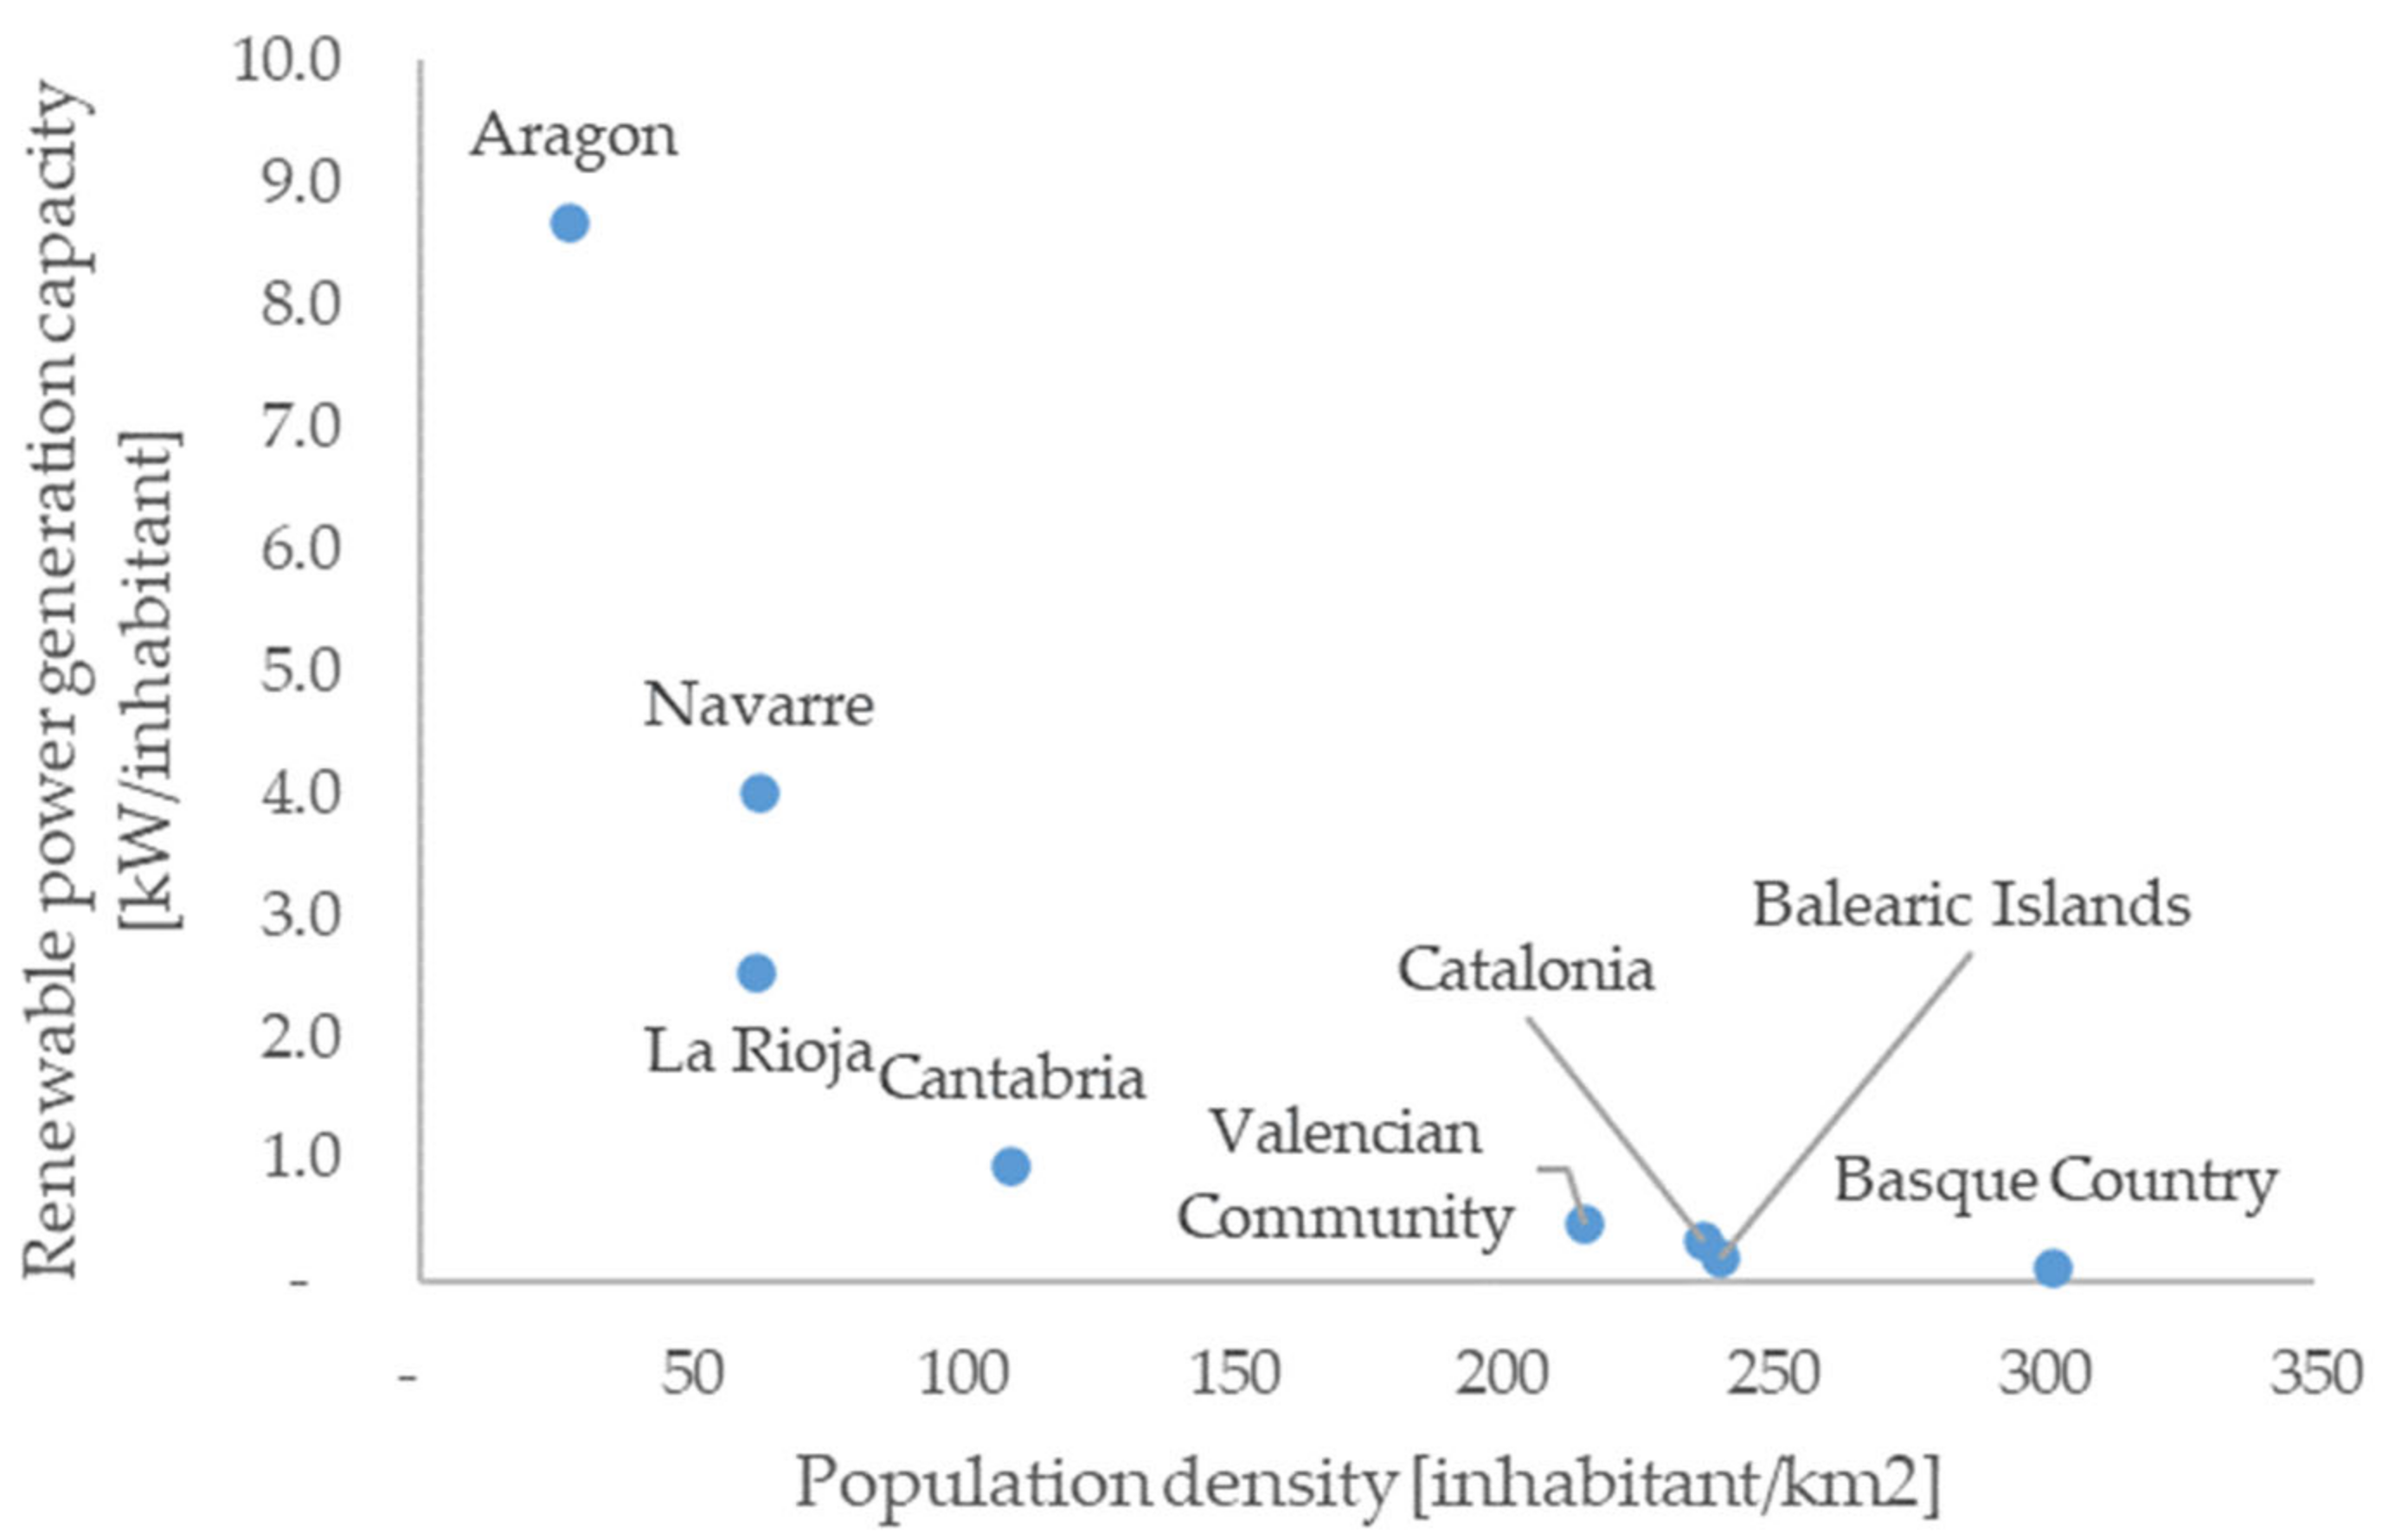
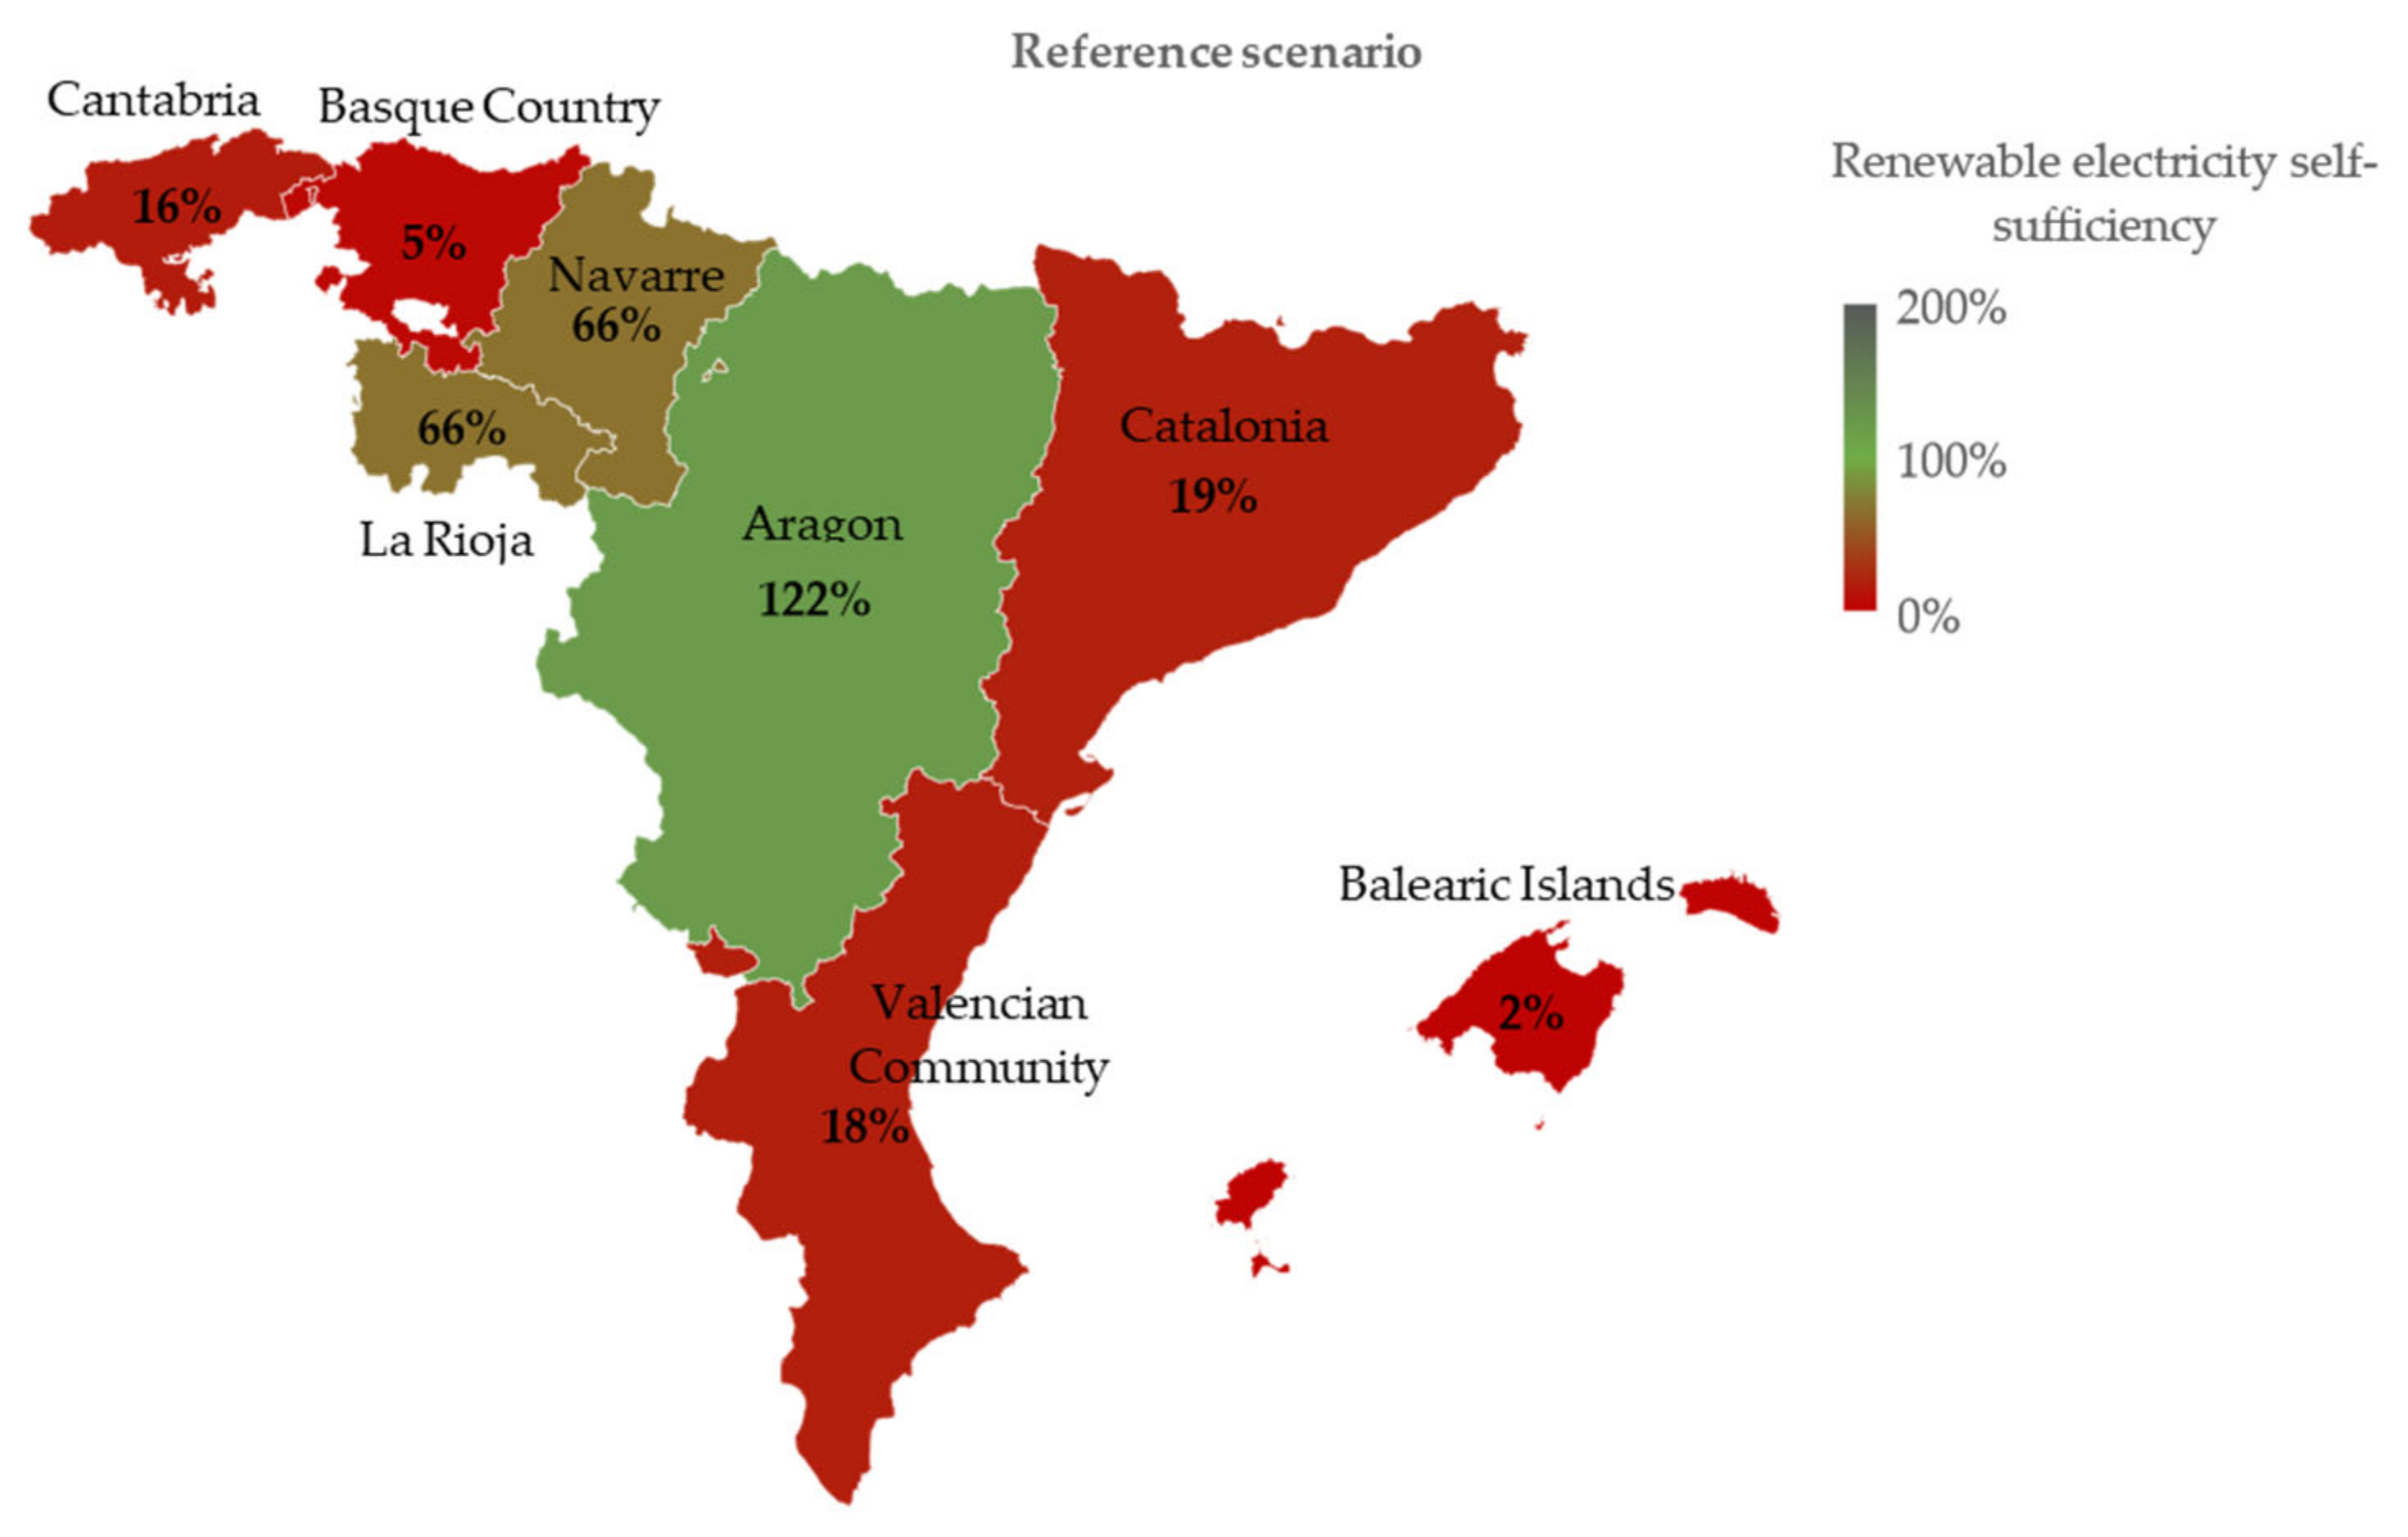
4.1. Renewable Energy Self-Sufficiency

We evaluated the renewable electricity self-sufficiency as explained in 2.1 for every autonomous community of the Bioregion 2030 and 2050 scenarios, considering the trend and the balanced scenarios.
Figure 6 shows the renewable electricity self-sufficiency in the reference scenario. The low-populated autonomous communities have the highest share of renewable production, which indicates that low-populated autonomous communities are closer to energy transition targets than high-populated ones.
Figure 7 shows the renewable electricity self-sufficiency of each autonomous community versus their electrical demand in 2030 for trend and balanced scenarios.
The trend scenario for 2030, based on the current nameplate capacity installation trend and PNIEC goals, expects that the Bioregion imports 11.5 TWh of electricity by 2030, 9% of its demand, showing unbalances between electricity production and consumption. These unbalances are beginning to provoke protests in Spanish autonomous communities to defend their territory [86,87]. In addition, renewable generation concentrated in the same autonomous community is less stable and requires more storage than a distributed renewable generation.
On the other hand, the balanced scenario presents a Bioregion which does not import electricity and satisfies its electrical demand with 74% renewable electricity, avoiding the electricity generation concentrated in the same autonomous communities. The Valencian Community is the only autonomous community with a renewable generation-demand ratio lower than 60% due to its nuclear power capacity.
All autonomous communities have enough onshore wind resources and photovoltaic potential in the balanced scenario by 2030. The total polygonal surface area required for the new renewable installations in the Bioregion is between 1600 and 3200 km2, around 2% of the Bioregion area. Adding the power already installed requires between 2500 and 5000 km2 polygonal surface area. Energy planning and spatial planning are considered essential to reach a balanced scenario due to the following reasons:
  • Renewable energies require large surface areas. Even if they are polygonal areas, the territory is conditioned over an extended period of at least 30 to 100 years. Its installation must seek compatibility with traditional land uses and the maintenance of vital ecosystem services [88].
  • An emerging imbalance between electricity production and consumption in autonomous communities could lead to increased inequalities. The least populated autonomous communities would generate energy for the most populated ones, allowing its higher development and attracting more population.
  • To avoid renewable installation bubbles. By June 2022, the PNIEC targets for 2030 were doubled, adding together the power in service and the power with access permits [89].
Figure 8 presents the trend scenario and balanced scenario evaluated for the 2050 and the 2050 efficient scenarios; it shows the renewable electricity generation of each autonomous community versus its electrical demand.
In the 2050 trend installation scenario, the largest renewable power installation occurs in Aragon, 62.5 kW/inhabitant, which is a mainly exporting energy community, as it has the highest ratio of renewable power installation compared to its demand, 3.69 MW/GWh, producing seven times its electricity demand. The second highest renewable power installation occurs in Navarre (20 kW/inhabitant or 1 MW/GWh, producing two times its electricity demand. On the contrary, there is hardly any renewable power installation in communities with a higher population density, which are mainly importing energy communities, such as the Basque Country (0.2 kW/inhabitant or 0.01 MW/GWh), and Catalonia (1.5 kW/inhabitant or 0.13 MW/GWh). The most significant imbalance occurs between the autonomous community of Aragon, with a renewable installation per inhabitant 314 times greater than the Basque Country. Furthermore, in the trend scenario, the power system is unstable as most renewable installations are concentrated in the same areas with the same full load hours, requiring more storage capacity than planned.
In the proposed 2050 balanced installation scenario, all autonomous communities range between 24 kW/inhabitant to 5 kW/inhabitant or 1.42 MW/GWh to 0.39 MW/GWh. There are communities that cannot meet their demands as they do not have enough wind resources. Accordingly, the missing power is installed in the autonomous communities with spare wind resources. Another alternative is the development of offshore wind power. On the other hand, there is no shortage of photovoltaic resources. Moreover, PV potential installation on building roofs is between 30% [77] and 51% [76] of all PV power capacity needed in the 2050 scenarios.
Efficient scenarios show similar results to their non-efficient versions in the trend installation scenario. However, the balanced scenario shows that all autonomous communities may be self-sufficient (with the exception of the Basque Country), reducing unbalances among them. All the autonomous communities range between 17 to 4.3 kW/inhabitant and 1 MW/GWh to 0.34 MW/GWh.
Figure 9 represents the polygonal area required to install wind and PV renewable power for all the considered scenarios. We considered a power density of 6 MW/km2 to obtain the polygonal surface area occupied by wind farms and 70 MW/km2 for PV. The 2050 scenario requires 11,554 km2 of surface area (8.49% of its territory) to decarbonize the economy through electrification, while the 2050 efficient scenario requires 8791 km2 (6.46% of the territory).
In the trend scenarios, most of the area occupied is in unpopulated autonomous communities. It implies that Aragon, the most depopulated autonomous community, has an area occupied by renewable energy installations equivalent to the size of autonomous communities such as the Basque Country, Navarre, Cantabria, or the Balearic Islands, to meet foreign electrical demands.
Suppose this installation trend is replicated elsewhere, with rural and unpopulated regions supplying energy necessities of urban and populated regions. In that case, it may cause significant imbalances between autonomous communities or territories, with serious social problems, as has already occurred in the mining case described in the Global Atlas of Environmental Justice [90], raising a global concern about energy colonialism in the energy transition [91]. On the other hand, these extreme energy dependences may lead to vulnerabilities and supply risks.
Should these populations be compensated in some way? Will the populations allow the occupation of the territory? Will the renewable energy protests limit the energy transition?
The proposed balanced scenario has lower regional imbalances, which may facilitate the population’s acceptance of the energy transition. It should be highlighted that the lower space requirement in the 2050 efficient balanced scenario allows all autonomous communities to require below 3000 km2. As mentioned before, energy planning policies linked to land use planning are necessary for this scenario. For that, the physical linking of demand with production is necessary, moving energy consumption points to energy production points thanks to different incentives, e.g., energy price. It may lead to industry movement to depopulate autonomous communities, thus improving population balance.
Some questions arise in the energy transition planning. Should unpopulated regions supply the total energy needs of populated regions? Or should a balanced energy transition be performed? At the same time, the same questions arise regarding the ecological footprint and biocapacity concepts. Is a society with a unitary territory equivalent but unbalanced between autonomous communities sustainable?

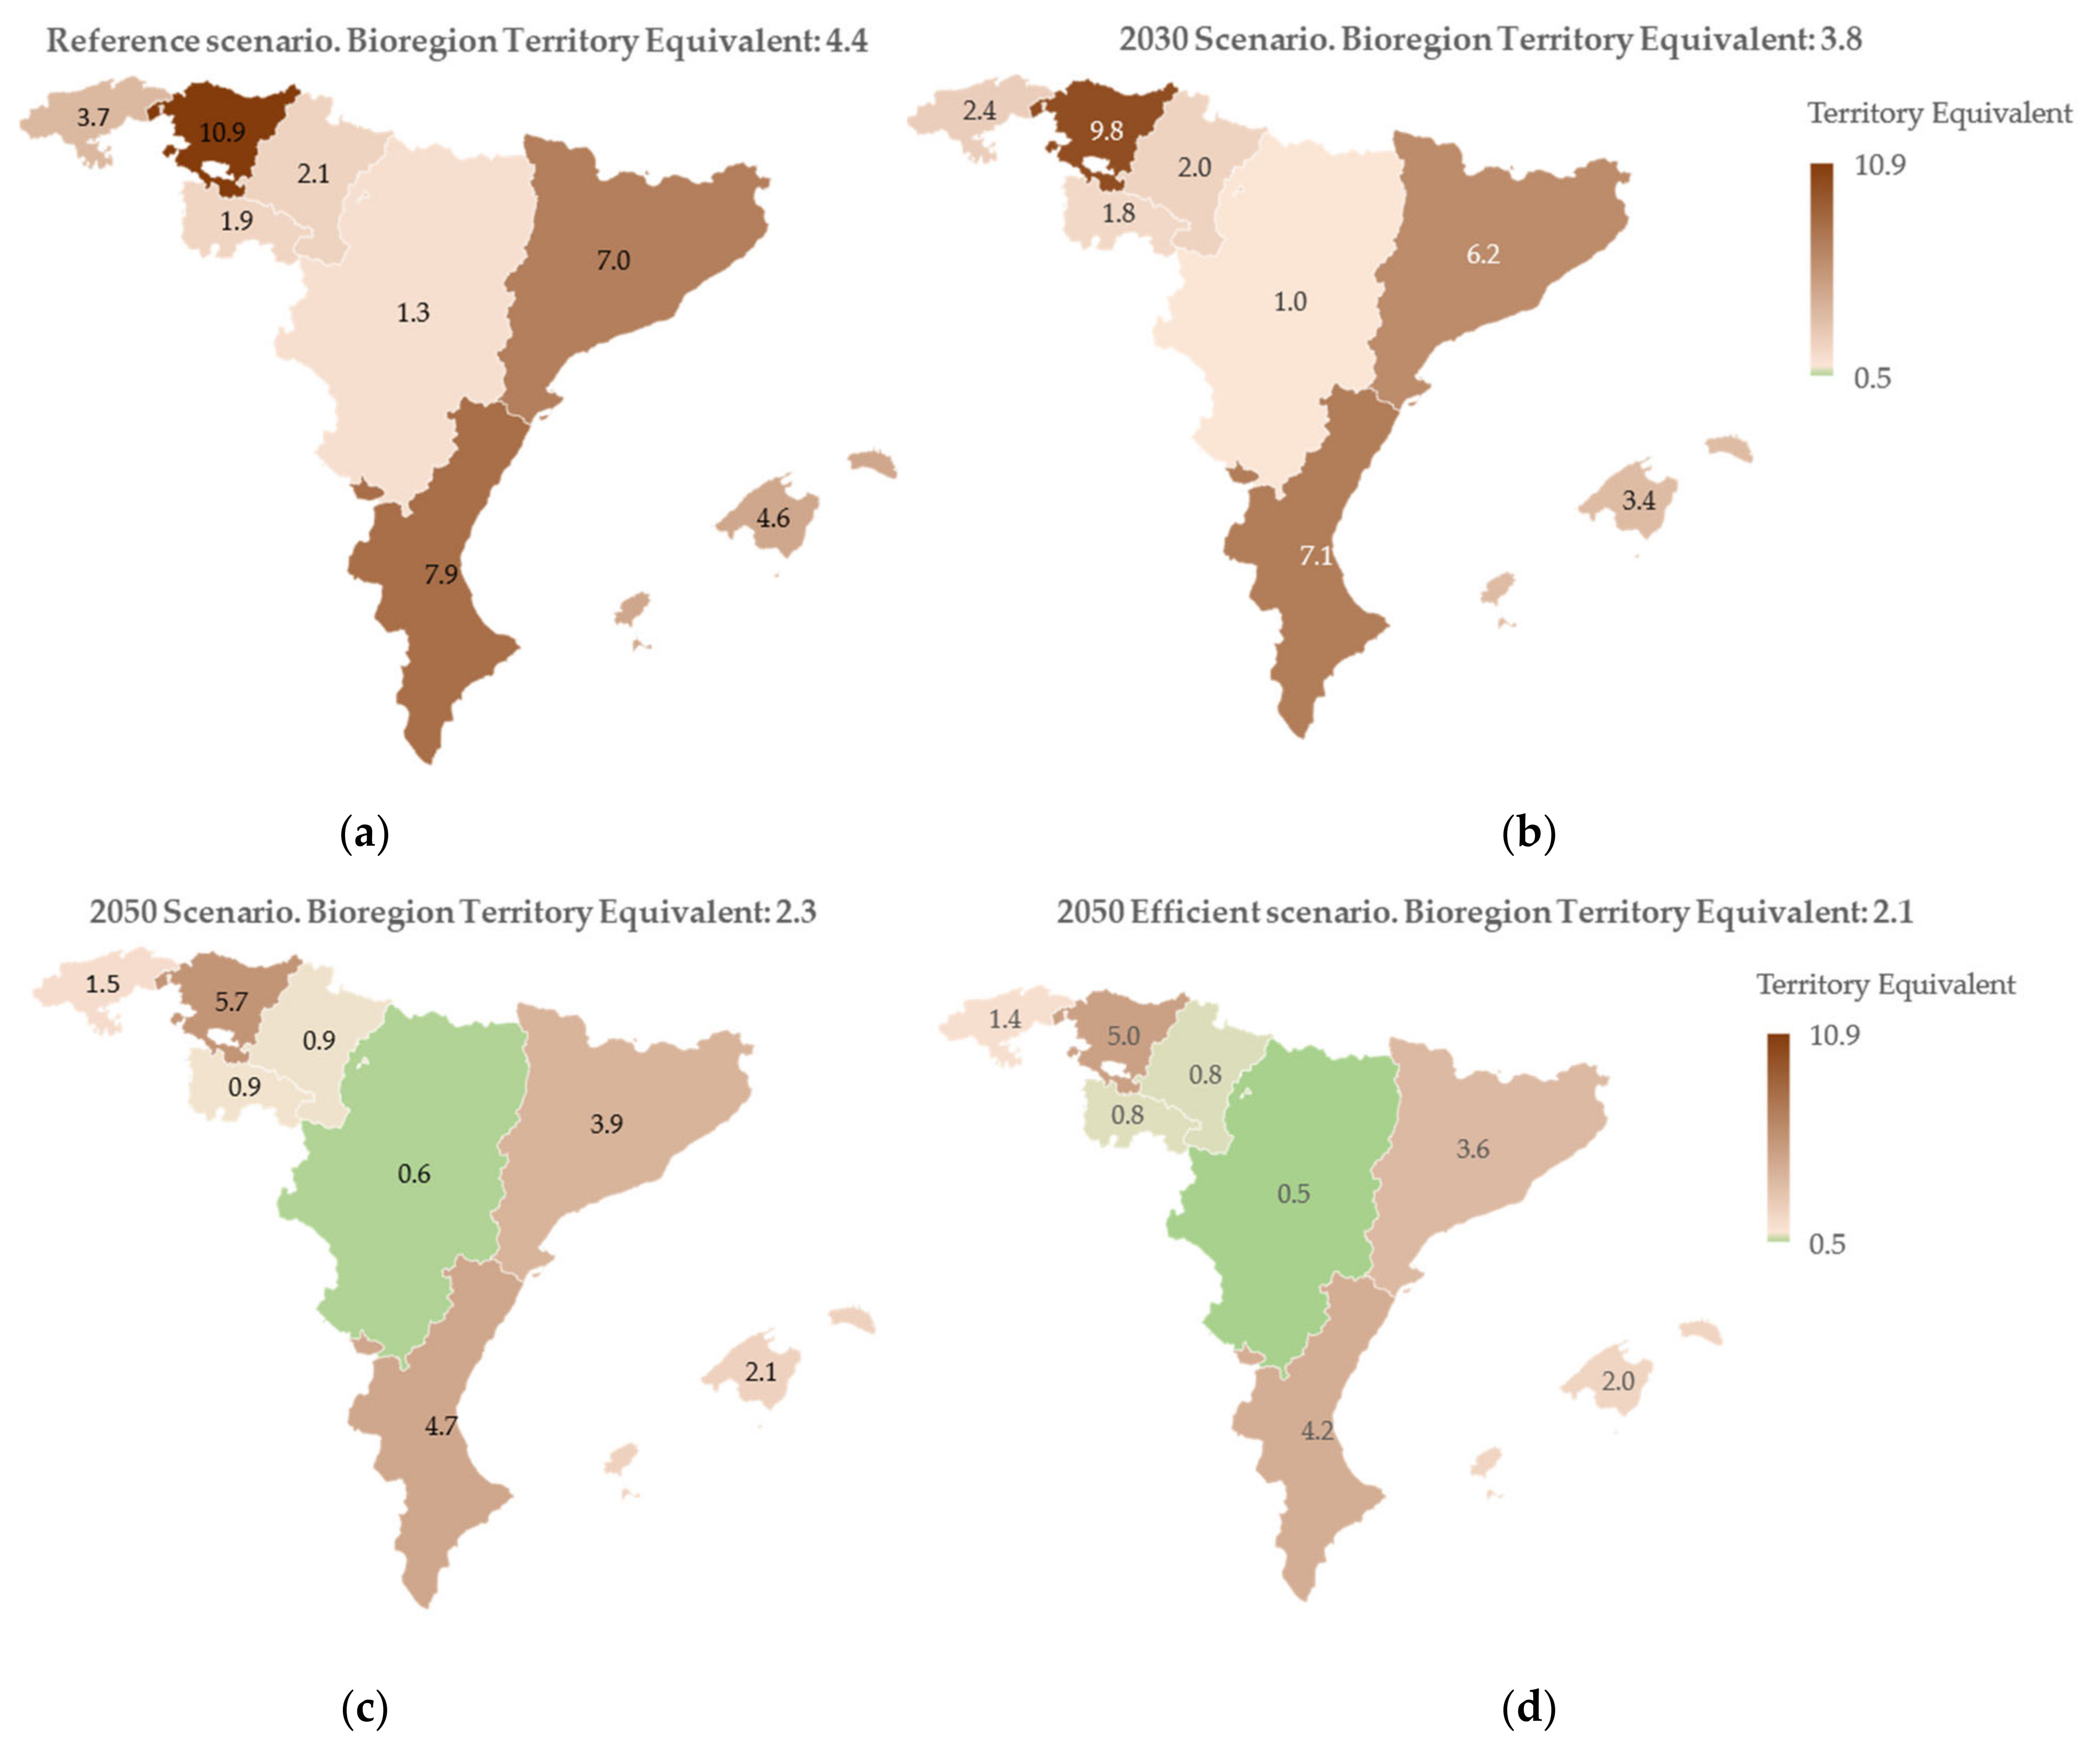
4.2. Ecological Footprint—Territory Equivalent

Based on the previous work performed by Valero and Torrubia [92], where the Bioregion’s ecological footprint for the reference scenario was obtained, we estimated the Bioregion’s ecological footprint for the proposed scenarios, considering the CO2 emission reductions for energy sources and the emissions from the life cycle of renewable technologies [93], electric light duty vehicles [94], high duty vehicles [95], and motorbikes [96]. All other sectors and biocapacity were considered constant for the 2050 scenario.
As mentioned in the methodology, results are related to the concept “Planet Equivalent”. However, instead of the ratio of a territory footprint to the per capita biological capacity available on Earth, we used the ratio of the territory’s ecological footprint to the territory’s biocapacity.
Figure 10 presents the Bioregion Territory Equivalent comparing all scenario results. No autonomous community is sustainable in the Bioregion in terms of ecological footprint in the reference scenario, but the ecological footprint of unpopulated autonomous communities is considerably lower than that of populated autonomous communities. As a whole the Bioregion needs more than four times of its territory biocapacity to compensate for its ecological footprint.
The CO2 emission reduction of energy sources in the proposed scenarios shows how the ecological footprint decreases thanks to decarbonization. The 2050 scenarios indicate that some autonomous communities can be seen as “ecological reserves”. This means that their biocapacity exceeds their footprint, absorbing more CO2 than they produce. These autonomous communities are Aragon, La Rioja, and Navarre, the unpopulated autonomous communities. However, it is not enough to offset the ecological footprint of the populated autonomous communities: 2.3 times of the Bioregion territory’s biocapacity is still needed to offset the total ecological footprint in the 2050 scenario and 2.1 times in the efficient scenario.
An energy transition is insufficient to match the Bioregion’s ecological footprint to its biocapacity. It indicates the need for changes in the rest of the sectors and consumption patterns, mainly in the agriculture sector and food consumption as has been highlighted recently in Spain [97].

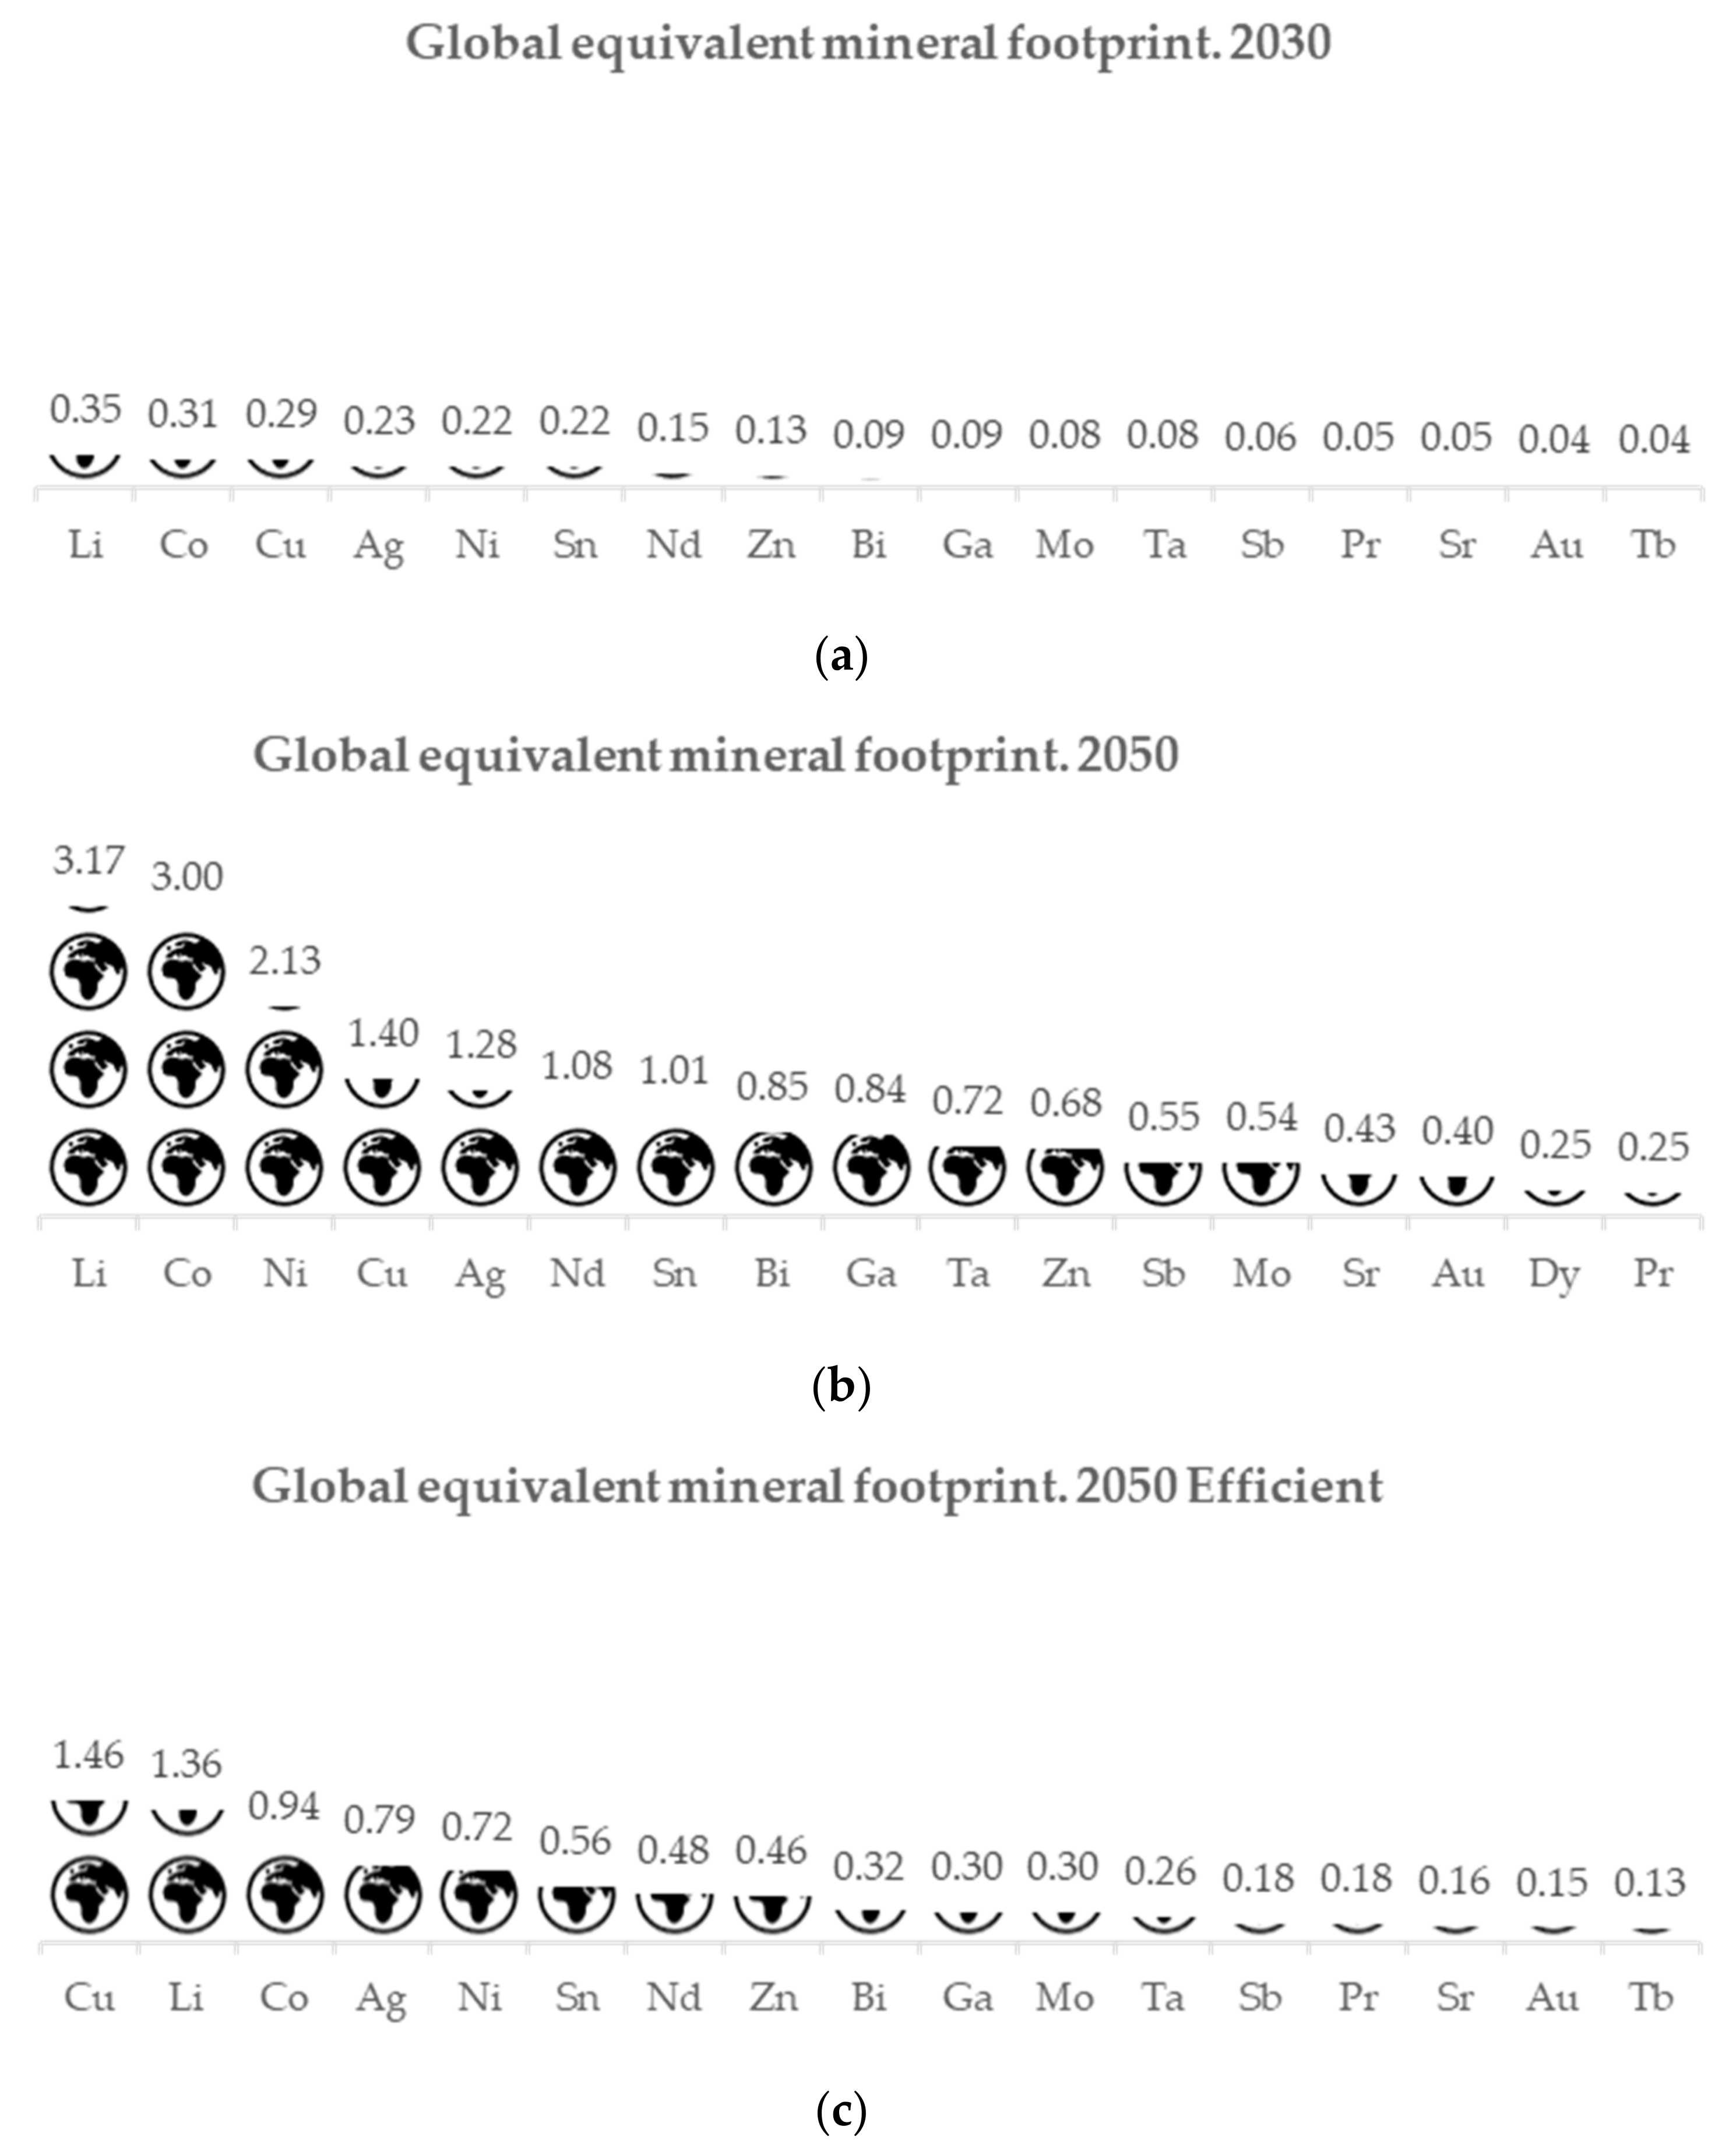
4.3. Global Equivalent Mineral Footprint

Material footprint results show that 37 million to 45 million tonnes of materials are needed to decarbonize the economy, representing a material footprint between 2.25 and 2.76 tonnes per capita.
What if the whole world were to make the same energy transition? We recalculated the material demand, assuming that the entire planet makes an equivalent energy transition, and then compared the figure with planetary resources and reserves to answer the question. We performed the comparison to understand the impact of a global energy transition with globally accepted technologies and current Bioregion lifestyles, considering the scenarios of world population [98] and bioregion population.
Figure 11 shows the global equivalent mineral reserves footprint for each temporary scenario. As the energy transition is at its beginning and there are no high material demands yet, the reference scenario is not shown.
The global equivalent mineral reserves footprint for 2030 shows how the energy transition starts to demand materials requiring more than a third of global lithium reserves. However, in the 2050 scenario, 3.17 times the known lithium reserves are required, with more materials exceeding the planetary known reserves such as cobalt, nickel, copper, silver, and tin. On the other hand, the 2050 efficient scenario decreases the global pressure over mineral reserves, but there is still room for improvement, as 1.36 times the known lithium reserves are still required. Supplementary Material shows the results of the rest of the materials.
If we consider resources, the global equivalent mineral resources footprint shows that a high amount of the known resources of lithium (79%), nickel (68%), and neodymium (56.5%) among others are required to perform a global energy transition.
Suppose almost all resources of some materials and several times the planet’s known reserves are required to meet a global energy transition. In that case, significant inequalities are expected between countries in achieving the energy transition due to the lack of access to materials. Together with the context of global warming, it can lead to severe geopolitical conflicts [99].
The results indicate the criticality of mineral materials, their scarcity relative to their consumption and the local supply risks they may entail. These supply risks may constrain the technological development necessary to achieve an energy transition at regional and global levels. The high pressure on critical materials also indicates the need to consider scenarios with a more significant reduction in consumption [100] and more efficient use of the mineral materials necessary for an energy transition. Furthermore, the global equivalent reserves footprint shows the minimum mineral requirements for an energy transition as the life cycle of the products and subsequent recycling rate are not taken into account. This also indicates the need to find more deposits that guarantee a global energy transition and a circular economy that minimizes waste materials.
The result of the global equivalent mineral footprint if everyone performs the same energy transition indicates the unsustainability of current lifestyles in the Bioregion. However, similar results are obtained compared with global north lifestyles. The result for European citizens performing the same energy transition indicates that one-third of lithium and cobalt reserves are needed, in addition to one-sixth of silver, nickel, neodymium, and copper reserves when Europe represents a tenth of the world’s population.

5. Conclusions

This work is based on the novelty of analyzing the ecological, territorial, and critical materials footprint alongside energy dependencies in a case study of a Bioregion. Energy self-sufficiency, ecological footprint, and global equivalent mineral footprint analysis are proposed as additional indicators for the assessment of energy transition models and so to help in territorial planning. The analysis identifies social and energy imbalances, ecological, and material issues, facilitating the achievement of more balanced energy and territorial strategies at regional and global levels through successive iterations, thus reducing social, ecological, and material impacts.
The methodology was applied to the Cantabrian-Mediterranean bioregion transition scenarios for 2030 and 2050 as a case study. Both scenarios reduce consumption due to electrification without reducing activity. In a balanced scenario, by 2030, all the autonomous communities have sufficient wind and photovoltaic resources to cover their demands. In the 2050 scenario, final consumption is reduced by 29%, thanks to electrification, which accounts for 80% of final consumption in an electrified economy and has sufficient energy resources to achieve energy self-sufficiency, except oil. However, there is a lack of onshore wind resources to meet 2050 demands in the Basque Country, Catalonia, the Valencian Community, and the Balearic Islands. Thus, offshore wind, or energy imports from Aragon and Navarra are necessary and required. On the other hand, roofs may accommodate between 30% and 51% of the installation of photovoltaic power. The required surface area of a 100% electrical power system is between 7300 and 14,600 km2.
According to the current trend, new renewable power will be installed in depopulated autonomous communities, increasing inequalities between energy-producing and energy-consuming autonomous communities, and aggravating rural depopulation and imbalances. This trend may worsen reaching imbalances in renewable installation of 62.48 kW/inhabitant in the most depopulated autonomous community versus 0.2 kW/inhabitant in the most populated autonomous community by 2050. The same trend observed in the Bioregion can serve as a global example of what happens when energy planning is not linked to the territory. These results serve to plan territories that have not yet begun to carry out an energy transition in other parts in a balanced way.
Therefore, adequate energy and land use planning are necessary to give renewable power installation in the Bioregion together with the high space requirements for renewable energies. First, we need to avoid falling into speculative bubbles fueled by the climate emergency, which could generate a negative opinion of renewable energies, as may be happening at present with recent demonstrations in rural areas. Second, we need to achieve a robust and resilient system with distributed renewable generation. Third, we need to achieve a balanced transition by avoiding imbalances between autonomous communities. For this reason, this work proposes installing renewable power in accordance with the energy demand of each territory, seeking self-sufficiency as far as possible and avoiding energy colonialism practices or extreme energy dependences. When it is not achieved, the autonomous communities with high renewable resources will provide the remaining energy. The question arises as to whether energy-producing autonomous communities should be compensated with mechanisms that encourage their development, thus avoiding imbalances accentuated by a massive installation of renewables; for example, by incentives such as lower energy prices for the industry. A lower energy price would allow industry relocation to autonomous energy production communities, thus avoiding population loss.
Reducing the ecological footprint by decarbonizing the energy sources is insufficient to ensure the Bioregion’s ecological sustainability, although it reduces the excess over its biocapacity by half. To achieve an ecological sustainable footprint, the energy transition should be accompanied by a modal shift in the agriculture sector with changing food diets to reduce consumption.
Regarding the material footprint, material demands of lithium, cobalt, nickel, silver, copper, neodymium, and tin are in some scenarios greater than the planet’s reserves to guarantee an energy transition for the whole world. The pressure over the reserves is high in other materials such as bismuth, gallium, tantalum, zinc, antimony, molybdenum, strontium, gold, praseodymium, and dysprosium. The energy global equivalent mineral footprint raises the question of whether there will be enough materials at current prices to meet the entire demand or whether this energy transition is sustainable. Therefore, an efficient scenario has been proposed, reducing energy and material demands without reducing activity and growth. Although this scenario may reduce the material footprint and space requirement, it is not sufficient to guarantee a sustainable scenario in either its material or ecological footprint. It indicates the need to propose more efficient scenarios, find new mineral deposits that guarantee a global energy transition, a greater efficiency in using materials in each technology, and the establishment of a true circular economy linked to the recovery of the materials used.
Results obtained in this case study may be replicated for the entire planet, as the methodology developed has international use regardless of the specificities of the Bioregion. Future work is oriented towards analyzing the Bioregion water footprint and introducing the thermodynamic rarity indicator in the global equivalent mineral reserves footprint.

Supplementary Materials

Information regarding material intensity for each technology and reserves and resources considered can be downloaded at: https://www.mdpi.com/article/10.3390/land11111891/s1.

Author Contributions

Conceptualization, methodology, investigation, simulation, and writing original draft preparation, J.F.-A.; conceptualization, methodology, investigation, writing-review, supervision, A.V. (Antonio Valero); conceptualization, methodology, writing-review supervision, funding acquisition, A.V. (Alicia Valero). All authors have read and agreed to the published version of the manuscript.

Funding

This research was funded by the Spanish Ministry of Science and Innovation through RESET project PID2020-116851RB-I00 and ENSURE project TED2021-131397B-I00.

Data Availability Statement

Not applicable.

Acknowledgments

To Rafael Moliner and Jorge Torrubia for their valuable comments. In addition, to “Foros de la Concordia Foundation” and the Spanish Chapter of the Club of Rome.

Conflicts of Interest

The authors declare no conflict of interest.

References

  1. United Nations. Paris Agreement. In Proceedings of the 21st Conference Parties, Paris, France, 11 December 2015. [Google Scholar]
  2. EU Commission. Long-Term Strategy for 2050. 2022. Available online: https://ec.europa.eu/clima/eu-action/climate-strategies-targets/2050-long-term-strategy_es (accessed on 15 June 2022).
  3. IEA. Net Zero by 2050, A Roadmap for the Global Energy Sector; International Energy Agency: Paris, France, 2021. [Google Scholar]
  4. EC Comission. Glosary: Carbon Dioxide Equivalent. 2022. Available online: https://ec.europa.eu/eurostat/statistics-explained/index.php?title=Glossary:Carbon_dioxide_equivalent#:~:text=A%20carbon%20dioxide%20equivalent%20or,with%20the%20same%20global%20warming (accessed on 15 September 2022).
  5. Jacobson, M.Z.; Delucchi, M.A.; Cameron, M.A.; Manogaran, I.P.; Shu, Y.; von Krauland, A.-K. Impacts of Green New Deal Energy Plans on Grid Stability, Costs, Jobs, Health, and Climate in 143 countries. One Earth 2019, 1, 449–463. [Google Scholar] [CrossRef]
  6. Child, M.; Bogdanov, D.; Breyer, C. The role of storage technologies for the transition to a 100% renewable energy system in Europe. Energy Procedia 2018, 155, 44–60. [Google Scholar] [CrossRef]
  7. MITECO. Estrategia de Descarbonización a Largo Plazo 2050. In Estrategia a Largo Plazo Para una Economía Española, Moderna, Competitiva y Climáticamente Neutra a 2050; Ministerio para la Transición Ecológica y el Reto Demográfico: Madrid, Spain, 2020; Available online: https://www.miteco.gob.es/es/prensa/ultimas-noticias/el-gobierno-aprueba-la-estrategia-de-descarbonizaci%C3%B3n-a-largo-plazo-que-marca-la-senda-para-alcanzar-la-neutralidad-clim%C3%A1tica-a-2050/tcm:30-516141 (accessed on 29 July 2022).
  8. Hussain, A.; Perwez, U.; Ullah, K.; Kim, C.; Asghar, N. Long-term scenario pathways to assess the potential of best available technologies and cost reduction of avoided carbon emissions in an existing 100% renewable regional power system: A case study of Gilgit-Baltistan (GB), Pakistan. Energy 2021, 221, 119855. [Google Scholar] [CrossRef]
  9. Felipe Andreu, J.; Schneider, D.; Krajačić, G. Evaluation of integration of solar energy into the district heating system of the city of Velika Gorica. Ther. Sci. 2016, 20, 1049–1060. [Google Scholar] [CrossRef] [Green Version]
  10. Poggi, F.; Firmino, A.; Amado, M. Planning renewable energy in rural areas: Impacts on occupation and land use. Energy 2018, 155, 630–640. [Google Scholar] [CrossRef]
  11. De Pascali, P.; Bagaini, A. Energy Transition and Urban Planning for Local Development. A Critical Review of the Evolution of Integrated Spatial and Energy Planning. Energies 2019, 12, 35. [Google Scholar] [CrossRef] [Green Version]
  12. Valero, A.; Valero, A.; Calvo, G.; Ortego, A. Material bottlenecks in the future development of green technologies. Renew. Sustain. Energy Rev. 2018, 93, 178–200. [Google Scholar] [CrossRef]
  13. IEA. The Role of Critical Minerals in Clean Energy Transitions, World Energy Outlook Special Report; International Energy Agency: Paris, France, 2021. [Google Scholar]
  14. Calvo, G.; Valero, A. Strategic mineral resources: Availability and future estimations for the renewable energy sector. Environ. Dev. 2022, 41, 100640. [Google Scholar] [CrossRef]
  15. Calvo, G.; Valero, A.; Valero, A. Thermodynamic Approach to Evaluate the Criticality of Raw Materials and Its Application through a Material Flow Analysis in Europe. J. Ind. Ecol. 2017, 22, 839–852. [Google Scholar] [CrossRef] [Green Version]
  16. Calvo, G.; Valero, A.; Valero, A. Assessing maximum production peak and resource availability of non-fuel mineral resources: Analyzing the influence of extractable global resources. Res. Conserv. Recycl. 2017, 125, 208–217. [Google Scholar] [CrossRef]
  17. Ortego, A.; Calvo, G.; Valero, A.; Iglesias-Émbil, M.; Valero, A.; Villacampa, M. Assessment of strategic raw materials in the automobile sector. Res. Conserv. Recycl. 2020, 161, 104968. [Google Scholar] [CrossRef]
  18. EU Commission. Critical Raw Material List. 2022. Available online: https://rmis.jrc.ec.europa.eu/?page=crm-list-2020-e294f6. (accessed on 10 July 2022).
  19. Partington, R. Inflation in Eurozone Hits Record 8.6% as Ukraine War Continues. The Guardian. 1 July 2022. Available online: https://www.theguardian.com/business/2022/jul/01/inflation-in-eurozone-hits-record-86-as-ukraine-war-continues (accessed on 6 September 2022).
  20. Caldara, D.; Conlisk, S.; Iacoviello, M.; Penn, M. The Effect of the War in Ukraine on Global Activity and Inflation; FEDS Notes; Board of Governors of the Federal Reserve System: Washington, DC, USA, 27 May 2022. [Google Scholar] [CrossRef]
  21. IDAE; MITECO. Plan Nacional Integrado de Energía y Clima; Ministerio Para la Transición Ecológica y el Reto Demográfico: Madrid, Spain, 2020. [Google Scholar]
  22. Zalk, J.; Behrens, P. The spatial extent of renewable and non-renewable power generation: A review and meta-analysis of power densities and their application in the U.S. Energy Policy 2018, 123, 83–91. [Google Scholar] [CrossRef]
  23. Global Footprint Network. Ecological Footprint. 2021. Available online: https://www.footprintnetwork.org/our-work/ecological-footprint/ (accessed on 1 October 2021).
  24. Global Footprint Network. Glossary. 2022. Available online: https://www.footprintnetwork.org/resources/glossary/ (accessed on 5 June 2022).
  25. Valero, A.; Valero, A. Thanatia, The Destiny of the Earth’s Mineral Resources: A Cradle-to-Cradle Assessment; World Sci. Publ. Co.: Hackensack, NJ, USA, 2014; ISBN 978-981-4273-93-0. [Google Scholar]
  26. Schmidt-Bleek, F. MIPS—A universal ecological measure? Fresenius Environ. Bull. 1993, 2, 306–311. [Google Scholar]
  27. UNDP. Planetary Pressures—Adjusted Human Development Index (PHDI). 2022. Available online: https://hdr.undp.org/planetary-pressures-adjusted-human-development-index#/indicies/PHDI (accessed on 30 July 2022).
  28. Valero, A.; Valero, A.; Calvo, G. The Material Limits of Energy Transition: Thanatia; Springer Nature: Cham, Switzerland, 2021; ISBN 978-3-03078532-1. [Google Scholar]
  29. Palacios, J.-L.; Calvo, G.; Valero, A.; Valero, A. The cost of mineral depletion in Latin America: An exergoecology view. Resour. Policy 2018, 59, 117–124. [Google Scholar] [CrossRef]
  30. Palacios, J.-L.; Calvo, G.; Valero, A.; Valero, A. Exergoecology Assessment of Mineral Exports from Latin America: Beyond a Tonnage Perspective. Sustainability 2018, 10, 723. [Google Scholar] [CrossRef] [Green Version]
  31. Valero, A.; Valero, A.; Arauzo, I. Evolution of the decrease in mineral exergy throughout the 20th century. The case of copper in the US. Energy 2008, 33, 107–115. [Google Scholar] [CrossRef]
  32. Valero, A.; Valero, A. Es la Entropía, Estúpido! In Bioeconomía Para el Siglo XXI. Actualidad de Nicholas Georgescu-Roegen; Arenas, L., Naredo, J.M., Riechmann, J., Eds.; Libros de la Catarata Publ.: Madrid, Spain, 2022; pp. 185–227. ISBN 978-84-1352-500-6. [Google Scholar]
  33. United States Geological Survey USGS. USGS Online Publications Directory. 2022. Available online: https://pubs.usgs.gov/periodicals/mcs2022/ (accessed on 25 February 2022).
  34. Grupo Aragonés del Capítulo Español del Club de Roma. Reunión 22 de Septiembre Biorregión Cantábrico-Mediterránea (Meeting September 22 Cantabrian-Mediterranean Bioregion). 2021. Available online: https://www.clubderoma-aragon.org/eventos/reunion-22-de-septiembre-biorregion-cantabrico-mediterranea/ (accessed on 6 July 2021).
  35. Fundación Foros de la Concordia. La Biorregión Cantábrico-Mediterránea (BCM) Constituye un Espacio Geográfico con Raíces Naturales, Sociales e Históricas Comunes, Que Encuentra en el Río EBRO su Gran Eje Vertebrador (The Cantabrian-Mediterranean bioregion (BCM) Constitutes a Geographical Space with Common Natural, Social and Historical Roots, which Finds Its Great Backbone in the Ebro River). 2021. Available online: https://www.bioebro.org/la-biorregion/ (accessed on 25 August 2021).
  36. Expansión/Datosmacro.com. El PIB de las Comunidades Autónomas (The GDP of the Autonomous Communities). 2021. Available online: https://datosmacro.expansion.com/pib/espana-comunidades-autonomas (accessed on 6 July 2021).
  37. The World Bank. Consumo de Energía Procedente de Combustibles Fósiles (Energy Consumption from Fossil Fuels). 2022. Available online: https://datos.bancomundial.org/indicator/EG.USE.COMM.FO.ZS (accessed on 20 June 2022).
  38. REE; MITECO. Plan de Desarrollo de la Red de Transporte de Energía Eléctrica Período 2021–2026; Red Eléctrica de España: Madrid, Spain, 2021. [Google Scholar]
  39. Bistaffa, F.; Blum, C.; Cerquides, J.; Farinelli, A.; Rodríguez-Aguilar, J. A Computational Approach to Quantify the Benefits of Ridesharing for Policy Makers and Travellers. IEEE Trans. Intell. Transp. Syst. 2021, 22, 119–130. [Google Scholar] [CrossRef]
  40. Jonge, D.D.; Bistaffa, F.; Levy, J. A Heuristic Algorithm for Multi-Agent Vehicle Routing with Automated Negotiation. In Proceedings of the 20th International Conference on Autonomous Agents and Multiagent Systems (AAMAS), Virtual Event. London, UK, 3–7 May 2021; pp. 404–412. Available online: http://hdl.handle.net/10261/257887 (accessed on 6 August 2022).
  41. García-Álvarez, A.; Pérez-Martínez, P.J.; González-Franco, I. Energy Consumption and Carbon Dioxide Emissions in Rail and Road Freight Transport in Spain: A Case Study of Car Carriers and Bulk Petrochemicals. J. Intell. Transp. Syst. 2013, 17, 233–244. [Google Scholar] [CrossRef] [Green Version]
  42. IDAE. Análisis del Recurso. Atlas Eólico de España. Estudio Técnico PER 2011–2020; Ministerio Para la Transición Ecológica y el Reto Demográfico: Madrid, Spain, 2011. [Google Scholar]
  43. Enevoldsen, P.; Jacobson, M. Data investigation of installed and output power densities of onshore and offshore wind turbines worldwide. Energy Sustain. Dev. 2021, 60, 40–51. [Google Scholar] [CrossRef]
  44. Álvarez, C.; Zafra, M. Cuánto Ocupan las Megacentrales Solares: Investigadores Alertan del Impacto del ‘Boom’ Fotovoltaico. El País. 23 January 2021. Available online: https://elpais.com/clima-y-medio-ambiente/2021-01-23/cuanto-ocupan-las-megacentrales-solares-investigadores-alertan-del-impacto-del-boom-fotovoltaico.html (accessed on 5 August 2021).
  45. EC. EU Reference Scenario 2020, Energy, Transport and GHG Emissions—Trends 2050; European Commission: Brussels, Belgium, 2021. [Google Scholar]
  46. Paula-Elena, D.; Liviu-George, M. The relationship between Income, Consumption and GDP: A Time Series, Cross-Country Analysis. Procedia Econ. Financ. 2015, 23, 1535–1543. [Google Scholar] [CrossRef]
  47. Nguyen, T.-V.; Schnidrig, J.; Maréchal, F. An Analysis of the Impacts of Green Mobility Strategies and Technologies on Different European Energy Systems. In Proceedings of the ECOS 2021—The 34th International Conference on Efficiency, Cost, Optimization, Simulation and Environmental Impact of Energy Systems, Sicily, Italy, 28 June 2021. [Google Scholar]
  48. Schnidrig, J.; Nguyen, T.-V.; Li, X.; Maréchal, F. A Modelling Framework for Assessing the Impact of Green Mobility Technologies on Energy Systems. In Proceedings of the ECOS 2021—The 34th International Conference on Efficiency, Cost, Optimization, Simulation and Environmental Impact of Energy Systems, Sicily, Italy, 28 June 2021. [Google Scholar]
  49. García Álvarez, A.; Martín Cañizares, M.D.P. Metodología de Cálculo del Consumo de Energía de Los Trenes de Viajeros y Actuaciones en el Diseño del Material Rodante Para su Reducción; ElecRail: Madrid, Spain, 2010. [Google Scholar]
  50. EU Commission. EU Reference Scenario 2020. 2021. Available online: https://ec.europa.eu/energy/data-analysis/energy-modelling/eu-reference-scenario-2020_en (accessed on 27 July 2021).
  51. Hager, T.J.; Morawicki, R. Energy consumption during cooking in the residential sector of developed nations: A review. Food Policy 2013, 40, 54–63. [Google Scholar] [CrossRef]
  52. Economics for Energy. Escenarios Para el Sector Energético en España 2030–2050; Economics for Energy: Vigo, Spain, 2017. [Google Scholar]
  53. MITECO. Estrategia a Largo Plazo Para Una Economía Española Moderna, Competitiva y Climáticamente Neutra en 2050; Anexos; Ministerio Para la Transición Ecológica y el Reto Demográfico: Madrid, Spain, 2020; Available online: https://ec.europa.eu/clima/sites/lts/lts_es_es.pdf (accessed on 29 July 2022).
  54. Magdalena, R.; Calvo, G.; Valero, A. The Energy Cost of Extracting Critical Raw Materials from Tailings: The Case of Coltan. Geosciences 2022, 12, 214. [Google Scholar] [CrossRef]
  55. Gobierno de Aragón. Boletín de Coyuntura Energética en Aragón 2018; Gobierno de Aragón: Zaragoza, Spain, 2019. [Google Scholar]
  56. Govern Illes Balears. Portal Energètic (Energy Portal). 2021. Available online: http://www.caib.es/sites/energia/ca/publicacions_estadistiques_i_preus_de_lenergia-7491/ (accessed on 6 July 2021).
  57. Instituto Catalán de Energía. Balance Energético de Cataluña (Catalonian Energy Balance). 2021. Available online: http://icaen.gencat.cat/es/energia/estadistiques/resultats/anuals/balanc_energetic/ (accessed on 6 July 2021).
  58. Ivace Energía. Datos Energéticos de la Comunitat Valenciana; Generalitat Valenciana: Valencia, Spain, 2019. [Google Scholar]
  59. Área de Estudios y Planificación. Euskadi Energía 2018, Datos Energéticos; Ente Vasco de la Energía: Bilbao, Spain, 2020. [Google Scholar]
  60. Eustat. Datos Energéticos de la C.A. de Euskadi (Energy Data of Basque Country Autonomous Community). 2021. Available online: https://www.eustat.eus/estadisticas/tema_552/opt_1/tipo_1/ti_datos-energeticos-de-la-c-a/temas.html#el (accessed on 6 July 2021).
  61. Gobierno de Navarra. Balance Energético de Navarra; Gobierno de Navarra: Pamplona, Spain, 2018. [Google Scholar]
  62. MITECO. La energía en España 2018; Ministerio Para la Transición Ecológica y el Reto Demográfico: Madrid, Spain, 2020. [Google Scholar]
  63. IDAE. Informe Sintético de Indicadores de Eficiencia Energética en España. Año 2018; Ministerio para la transición ecológica y el reto demográfico: Madrid, Spain, 2020. [Google Scholar]
  64. IDAE; MITECO. Consumo de Energía Final (Final Energy Consumption). 2021. Available online: http://sieeweb.idae.es/consumofinal/ (accessed on 6 July 2021).
  65. REE. El Sistema Eléctrico Español 2018; Red Eléctrica de España: Madrid, Spain, 2019. [Google Scholar]
  66. REE. El Sistema Eléctrico Español Informe 2020, Producción de Energía Eléctrica; Red Eléctrica de España: Madrid, Spain, 2021. [Google Scholar]
  67. Ministerio de Transportes, Movilidad y Agenda Urbana. Consumo Energético en el Transporte por Modo, Tipo de Combustible y Tipo de Tráfico (Energy Consumption in Transport by Mode, Type of Fuel and Type of Traffic). 2021. Available online: https://apps.fomento.gob.es/BDOTLE/visorBDpop.aspx?i=314 (accessed on 14 July 2021).
  68. Dirección General de Tráfico. Series Históricas del Parque de Vehículos. 2021. Available online: https://www.dgt.es/es/seguridad-vial/estadisticas-e-indicadores/parque-vehiculos/series-historicas/ (accessed on 15 July 2021).
  69. DGT. Análisis Sobre los Kilómetros Anotados en las ITV; Dirección General de Tráfico: Madrid, Spain, 2018. [Google Scholar]
  70. IDAE; MITECO. Informe Anual del Consumo Energético Año 2019; Ministerio para la transición ecológica y el reto demográfico: Madrid, Spain, 2020. [Google Scholar]
  71. Economics for Energy. Estrategias Para la Descarbonización del Transporte Terrestre en España, Un Análisis de Escenarios; Economics for Energy: Vigo, Spain, 2020. [Google Scholar]
  72. INE. Proyecciones de Población 2020–2070; Instituto Nacional de Estadística: Madrid, Spain, 2020. [Google Scholar]
  73. JRC. Photovoltaic Geographical Information System. 2021. Available online: https://re.jrc.ec.europa.eu/pvg_tools/en/ (accessed on 20 July 2021).
  74. IDAE. Situación y Potencial de Generación de Biogás; Ministerio Para la Transición Ecológica y el Reto Demográfico: Madrid, Spain, 2011. [Google Scholar]
  75. IDAE. Evaluación del Potencial de Energía de la Biomasa, Estudio Técnico PER 2011–2020; Ministerio Para la Transición Ecológica y el Reto Demográfico: Madrid, Spain, 2011. [Google Scholar]
  76. Observatorio Sostenibilidad. 1 millón de Tejados Solares en 2025: Energía Rentable y Accesible Para los Ciudadanos; Observatorio Sostenibilidad: Madrid, Spain, 2021. [Google Scholar]
  77. Bódis, K.; Kougias, I.; Jäger-Waldau, A.; Taylor, N.; Szabó, S. A high-resolution geospatial assessment of the rooftop solar photovoltaic potential in the European Union. Renew. Sustain. Energy Rev. 2019, 114, 109309. [Google Scholar] [CrossRef]
  78. Azam, A.; Rafiq, M.; Shafique, M.; Zhang, H.; Yuan, J. Analyzing the effect of natural gas, nuclear energy and renewable energy on GDP and carbon emissions: A multi-variate panel data analysis. Energy 2021, 219, 119592. [Google Scholar] [CrossRef]
  79. KumarNarayan, P.; Narayan, S.; Popp, S. A note on the long-run elasticities from the energy consumption—GDP relationship. Appl. Energy 2010, 87, 1054–1057. [Google Scholar] [CrossRef]
  80. Iglesias-Émbil, M.; Valero, A.; Ortego, A.; Villacampa, M.; Vilaró, J.; Villalba, G. Raw material use in a battery electric car—A thermodynamic rarity assessment. Resour. Conserv. Recycl. 2020, 158, 104820. [Google Scholar] [CrossRef]
  81. Carrara, S.; Dias, P.A.; Plazzotta, B.; Pavel, C. Raw Materials Demand for Wind and Solar PV Technologies in the Transition Towards a Decarbonized Energy System; EUR 30095 EN; Publications Office of the European Union: Luxembourg, 2020; Available online: https://data.europa.eu/doi/10.2760/160859 (accessed on 5 September 2021)ISBN 978-92-76-16225-4. [CrossRef]
  82. Ashby, M.; Attwood, J.; Lord, F. Materials for Low-Carbon Power—A White Paper, 2nd ed.; Granta Teaching Resources; Granta Design: Cambridge, UK, 2012. [Google Scholar]
  83. García-Olivares, A.; Ballabrera-Poy, J.; García-Ladona, E.; Turiel, A. A global renewable mix with proven technologies and common materials. Energy Policy 2012, 41, 561–574. [Google Scholar] [CrossRef] [Green Version]
  84. Jones, H.; Moura, F.; Domingos, T. Life cycle assessment of high-speed rail: A case study in Portugal. Int. J. Life Cycle Assess. 2017, 22, 410–422. [Google Scholar] [CrossRef]
  85. Verdejo, E.Z. Requerimientos Materiales de la Transmisión y Distribución de la Electricidad Para la Transición Energética. Master’s Thesis, Universidad de Valladolid, Escuela de Ingenierías Industriales, Valladolid, Spain, 2021. [Google Scholar]
  86. ALIENTE. Manifestaciones ALIENTE (ALIENTE Protests). 2022. Available online: https://aliente.org/category/campanas/manifestaciones-aliente (accessed on 30 June 2022).
  87. Hernández, A. Renovable sí, Pero no así. La razón. 11 October 2021. Available online: https://www.larazon.es/opinion/20211012/jeiekwh5xfbjxcut4lc7ltglsi.html (accessed on 1 May 2022).
  88. Pérez, B.P.; Díaz-Cuevas, P. Connections between Water, Energy and Landscape: The Social Acceptance in the Monachil River Valley (South of Spain). Land 2022, 11, 1203. [Google Scholar] [CrossRef]
  89. REE. Estado del Acceso y Conexión de la Generación Renovable Eólica y Solar Fotovoltaica. 2022. Available online: https://www.ree.es/es/clientes/datos-acumulados-generacion-renovable (accessed on 25 June 2022).
  90. Temper, L.; del Bene, D.; Martinez-Alier, J. Mapping the frontiers and front lines of global environmental justice: The EJAtlas. J. Polit. Ecol. 2015, 22, 255–278. [Google Scholar] [CrossRef] [Green Version]
  91. Mavhunga, C.C.; Trischler, H. Energy (and) Colonialism, Energy (In)Dependence: Africa, Europe, Greenland, North America. RCC Perspect. 2014, 5, 264–266. [Google Scholar] [CrossRef]
  92. Valero, A.; Torrubia, J. Libro Blanco de la Biorregión Cantábrico-Mediterránea. Cap 4. Fundación Foros de la Concordia y Capitulo Español del Club de Roma; Fundación Foros de la Concordia: Alcañiz, Spain, 2020. [Google Scholar]
  93. Bruckner, T.; Bashmakov, I.; Mulugetta, Y.; Chum, H.; Navarro, A.D.L.V.; Edmonds, J.; Faaij, A.; Fungtammasan, B.; Garg, A.; Hertwich, E.; et al. Climate Change 2014: Mitigation of Climate Change. Contribution of Working Group III to the Fifth Assessment Report of the Intergovernmental Panel on Climate Change; Cambridge University Press: Cambridge, UK; New York, NY, USA, 2014. [Google Scholar]
  94. Ambrose, H.; Kendall, A.; Lozano, M.; Wachche, S.; Fulton, L. Trends in life cycle greenhouse gas emissions of future light duty electric vehicles. Transp. Res. Part D Transp. Environ. 2020, 18, 102287. [Google Scholar] [CrossRef] [Green Version]
  95. Lee, D.; Thomas, V.M.; Brown, M.A. Electric Urban Delivery Trucks: Energy Use, Greenhouse Gas Emissions, and Cost-Effectiveness. Environ. Sci. Technol. 2013, 47, 8022–8030. [Google Scholar] [CrossRef] [PubMed]
  96. Carranza, G.; Nascimiento, M.D.; Fanals, J.; Febrer, J.; Valderrama, C. Life cycle assessment and economic analysis of the electric motorcycle in the city of Barcelona and the impact on air pollution. Sci. Total Environ. 2022, 821, 153419. [Google Scholar] [CrossRef]
  97. Ministerio de Consumo/EC-JRC. Sostenibilidad del Consumo en España. Evaluación del Impacto Ambiental Asociado a los Patrones de Consumo Mediante Análisis del Ciclo de Vida; Ministerio de Consumo: Madrid, Spain, 2022. [Google Scholar]
  98. UN. Una Población en Crecimiento. 2022. Available online: https://www.un.org/es/global-issues/population (accessed on 2 February 2022).
  99. Carnegie Europe; Open Society European Policy Institute. The EU and Climate Security: Toward Ecological Diplomacy; Carnegie Endowment for International Peace: Washington, DC, USA, 2021. [Google Scholar]
  100. Lallana, M.; Almazán, A.; Valero, A.; Lareo, Á. Assessing Energy Descent Scenarios for the Ecological Transition in Spain 2020–2030. Sustainability 2021, 13, 11867. [Google Scholar] [CrossRef]
Figure 1. Cantabrian-Mediterranean Bioregion in the Spanish map (in green).
Land 11 01891 g001
Figure 2. Energy sources in final consumption in reference scenario.
Land 11 01891 g002
Figure 3. Renewable power generation capacity and population density relationship by 2026, elaborated with data from [38].
Land 11 01891 g003
Figure 4. Bioregion final energy consumption in TWh.
Land 11 01891 g004
Figure 5. Power capacity in the Bioregion for the electricity system.
Land 11 01891 g005
Figure 6. Renewable electricity self-sufficiency in the reference scenario.
Land 11 01891 g006
Figure 7. Renewable electricity self-sufficiency in 2030. (a) Trend scenario; (b) balanced scenario.
Land 11 01891 g007
Figure 8. Renewable electricity self-sufficiency in 2050; (a) 2050, Trend scenario; (b) 2050, Balanced scenario; (c) 2050 Efficient, trend scenario; (d) 2050 Efficient, balanced scenario.
Land 11 01891 g008aLand 11 01891 g008b
Figure 9. Wind and PV polygonal area occupation in km2. (a) 2050, Trend scenario; (b) 2050, Balanced scenario; (c) 2050 Efficient, trend scenario; (d) 2050 Efficient, balanced scenario.
Land 11 01891 g009
Figure 10. Bioregion Territory Equivalent. (a) Reference scenario. Data obtained from [92]; (b) 2030 Scenario; (c) 2050 Scenario; (d) 2050 Efficient scenario.
Land 11 01891 g010
Figure 11. Global equivalent mineral reserves footprint. (a) 2030 Scenario; (b) 2050 Scenario; (c) 2050 Efficient scenario.
Land 11 01891 g011
Table 1. Bioregion characteristics.
IndicatorAragonBalearic IslandsValencian CommunityCantabriaCataloniaLa RiojaNavarreBasque Country
Population density (people/km2)282402151092376263302
Area (km2)47,720499223,255532132,113504510,3917234
GDP per capita28,727 €23,206 €23,206 €24,383 €31,119 €28,200 €32,141 €34,142 €
Electricity demand (GWh)10,109494225,457390643,8401621484414,955
Electricity imports (GWh)−7997142763472100888−171−17678788
Table 2. Assumptions for 2050 scenarios.
Sectorial
Transformations
Assumptions
Transport electrificationCombustion cars replacement by battery electric vehicles as this is the lowest cost solution [3,47,48]. Electrification of existing diesel railroads [49]. Maritime and air transport have not been assessed.
Zero-emission industryReplacement of fossil fuel energy sources considered on the 2050 European Commission Reference Scenario for industry [50] by biofuels (mainly biogas) and hydrogen. An 80% electrolysis efficiency for hydrogen production.
Electrification of household and service sectorsElectrification of heating, domestic hot water, and cooking [51] as it is the highest efficiency solution [3]. Residential consumption increases linearly to population growth, choosing an income elasticity value of 0.2 between GDP and consumption increase [52].
Primary sectorEnergy consumption in the primary sector does not change in 2050. Consumption reduction offsets the primary sector growth thanks to efficiency [45]. On the other hand, there is a greater need for a modal shift to reduce its emissions [53].
Table 3. Data gathering.
ScenarioInformation GatheredAutonomous Community
or State
Reference
Reference scenarioEnergy balance reports and sectorial energy demand.Aragon[55]
Balearic Islands[56]
Catalonia[57]
Valencian Community[58]
Basque Country[59,60]
Navarre[61]
Spain[62,63,64]
Reference scenarioElectricity mix, electricity demand, and nameplate capacityAll autonomous communities[65,66]
Reference scenarioRenewable capacity trend installationAll autonomous communities[38]
Reference scenarioFinal energy consumption by mode of transportAll autonomous communities[63,67]
Reference scenarioVehicle fleetAll autonomous communities[68]
Reference scenarioKm travelled by mode of transport and activity forecastAll autonomous communities[50,69]
Reference scenarioFinal energy consumption by uses in residential and service sectorsAll autonomous communities[70]
2030 ScenarioEnergy demandsAll autonomous communities[21]
2030 ScenarioDe-installation of conventional thermal plantsAll autonomous communities[21]
2050 ScenarioSectoral decarbonizationAll autonomous communities[3,53,71]
2050 Scenario2050 zero-emission industry demands forecastAll autonomous communities[45,50]
2050 ScenarioGrowth and activity forecastAll autonomous communities[45,50,72]
All scenariosRenewable technologies capacity factorAll autonomous communities[42,66,73]
All scenariosRenewable resources (biomass, wind, biogas…)All autonomous communities[42,74,75,76,77]
Publisher’s Note: MDPI stays neutral with regard to jurisdictional claims in published maps and institutional affiliations.

