1. Introduction
Water is indispensable and irreplaceable for human well-being and socio-economic sustainability. Among the 17 Sustainable Development Goals (SDGs) published by the United Nations General Assembly in 2015, at least 4 goals are related to the sustainable utilization and management of water resources, namely, SDG-6, SDG-7, SGD-12, and SDG-13 [
1]. However, due to the rising water demands associated with population growth and economic development, coupled with diminishing water supplies caused by climate change and contamination, water is becoming scarce in most regions of the world [
2,
3]. The recent literature demonstrates that nearly half of the global population faces severe water scarcity, which directly conflicts with the above SDGs [
4]. The agriculture sector is the largest water user globally, accounting for approximately 70% of global water withdrawal due to irrigation [
5]. Insufficient water resources have posed a substantial threat to agricultural production and food security [
6]. In addition, backward agricultural irrigation technology, extensive water use patterns, and low water use efficiency have further intensified water scarcity [
7]. Thus, sustainable agricultural water resource management is related to regional food security and closely linked to economic development, ecological security, and quality of life [
8,
9]. When water supplies are limited, agricultural production should maximize net income per unit of water used rather than per land unit [
10]. Evaluating and improving agricultural water use efficiency (AWUE) are also the basis for promoting regional water resource management [
11,
12].
Widening water demand and supply gaps have been a significant challenge for China. China has been suffering from water scarcity for a long time [
13], whose per capita water supply is less than 2200 m
3, only one quarter of the world average [
14]. Since 1998, agricultural water use in China has consumed over 60% of the total national water consumption [
15], and this figure is as high as 80–90% in some arid regions, such as Ningxia and Xinjiang. Meanwhile, there has been severe conflict between water availability and food production in China, feeding 21% of the world’s population needs with only 6% of the global freshwater resources [
16]. As one of the largest agricultural countries, the improvement in AWUE in China could contribute to global sustainable water utilization and food security [
17].
Generally, AWUE refers to the ratio of physical and economic output to water resource input during agricultural production, a broad concept of physiological, agronomic, and engineering processes, and management practice [
18]. Many studies evaluated AWUE with a single-factor index. They focused on the ratio between crop biomass or grain production and the amount of water consumed by crops, including rainfall, the irrigation water applied, and crop transpiration [
19,
20,
21]. Thus, AWUE also reflects the production ability of water resources, such as crop water productivity, irrigation water productivity, and generalized water productivity [
22]. It was later recognized that water alone as the only input could not produce the necessary outputs in the production process. Other inputs are also essential in AWUE assessment [
23]. Therefore, the total factor water use efficiency measured by multiple input models has entered the mainstream. The frequently used assessment methods are stochastic frontier analysis (SFA) and data envelopment analysis (DEA) [
24,
25]. Compared with SFA, DEA is a non-parametric evaluation model and does not require any distributional assumptions about efficiency [
26], avoiding the influences of subjective factors on water resource efficiency assessment. In addition, improved DEA models can even deal with both desirable and undesirable outputs simultaneously, significantly improving the accuracy of resource use efficiency evaluation [
27]. At present, DEA models have been widely used globally to assess the water use efficiency of a decision-making unit (e.g., farm, enterprise/company, irrigation district, industrial/agricultural sector) [
25,
28,
29].
The spatial difference and correlation of water use efficiency have attracted significant attention in recent years. On the one hand, water use efficiency exhibits noticeable regional variation. The literature has shown that water use efficiency is sensitive to meteorological factors, such as temperature, precipitation, and moisture [
30]. Water use efficiency increases with atmospheric CO
2 but declines with increasing atmospheric evaporative demand [
31]. Water use efficiency is also influenced by socio-economic factors. The value of AWUE is higher in developed areas than in undeveloped areas in China [
13]. On the other hand, water use efficiency has demonstrated a significant spatial correlation. The AWUE of one region is related to the geographical conditions and the economic development level, which is likely to be influenced by the neighboring regions [
32]. The adjacent regions’ agricultural production behaviors also affect the local region’s AWUE, resulting in spatial spillover effects on the local region [
13]. Awareness of spatial correlation among regional AWUE is essential for improving water utilization efficiency.
The temporal and spatial patterns of AWUE are related to various natural and socio-economic elements, which are types of agricultural ecosystems, agricultural production factors, and agricultural water resource management measures [
3,
25]. Agricultural production factors will flow spontaneously from the area with a low factor return rate to a high factor return rate [
33]. In contrast, the management departments will actively guide the cross-region transfer of technology, information, talents, and goods to promote sustainable water use and regional synergy development [
34,
35]. Due to the cross-regional mobility of the agricultural production factors, various regions’ agricultural water resource utilization may present close connections. As the scope of factors’ mobility continues to expand, an increasing number of regions have shown relevance in AWUE, and the spatial correlation of AWUE shows a network characteristic [
36,
37]. Meanwhile, the spatial correlation network of AWUE could reflect the distribution pattern of spillover effects related to certain factors [
38], which could guide the improvement in AWUE. However, this important feature is often ignored in AWUE studies. Utilizing this information on the spatial correlation of AWUE may help implement effective measures to improve AWUE.
In the spatial correlation of AWUE, different nodes (regions) have various resource (such as information, technology, knowledge, and talents related to water saving) control capabilities, resulting in diverse network structures [
39]. Due to the spillover effects, the nodes with strong power may influence various other nodes and be in the central position of the network. Creating solid links among regions can enhance mutual learning and sharing of resources and advice [
40]. Moreover, nodes similar to one another are better able to communicate information and apply the same governance [
41]. For the whole network, centralization helps form groups and build support for collective action, such as the fast spread of particular water-saving technologies [
42]. In contrast, over-centralization may not be conducive to long-term planning and problem solutions [
43]. Thus, it is necessary to investigate the spatial network structure related to AWUE and propose appropriate strategies to improve AWUE.
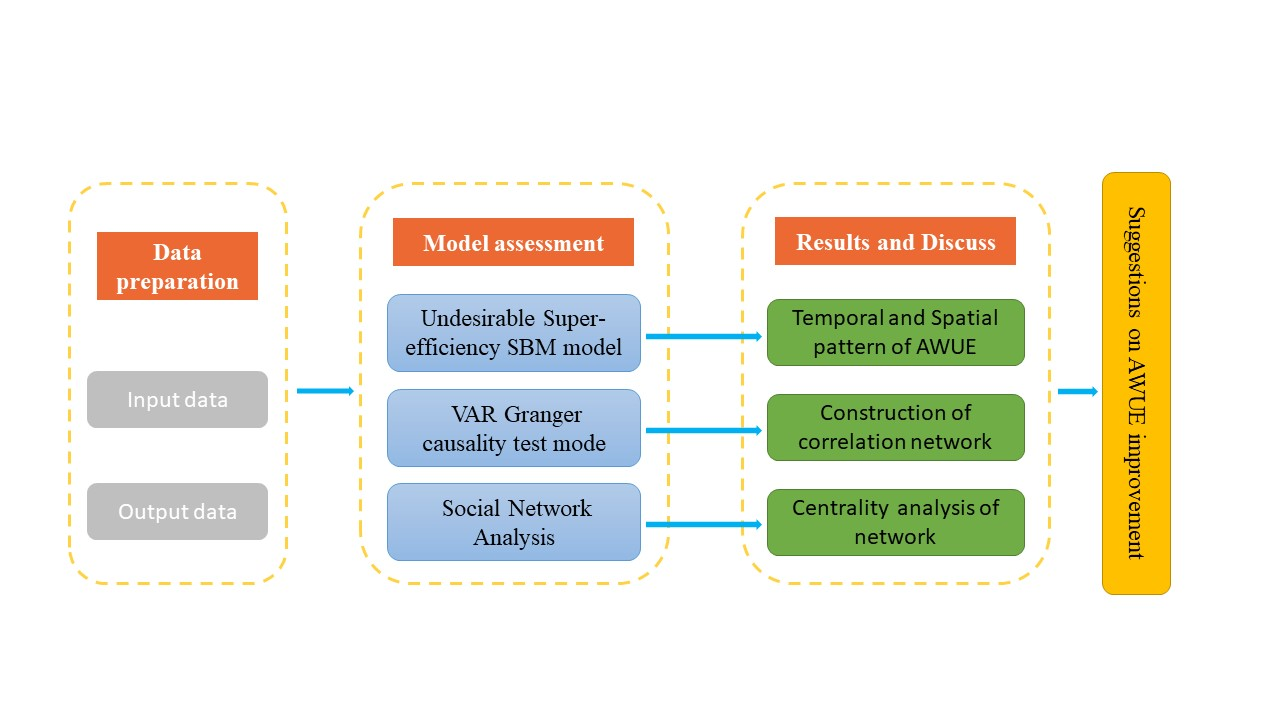
This study aimed to explore the spatial correlation of AWUE between different provinces in China and provide support for the designation of agricultural water resource management strategies. In this study, AWUE is defined as a total factor water efficiency index. The super-efficiency slack-based model (SBM) with undesirable outputs and the social network analysis (SNA) method were used to: (1) evaluate AWUE at the province level within and beyond China, and (2) investigate the characteristics of the spatial correlation network of AWUE.
2. Materials and Methods
The analysis process for the spatial correlation of AWUE is illustrated in
Figure 1.
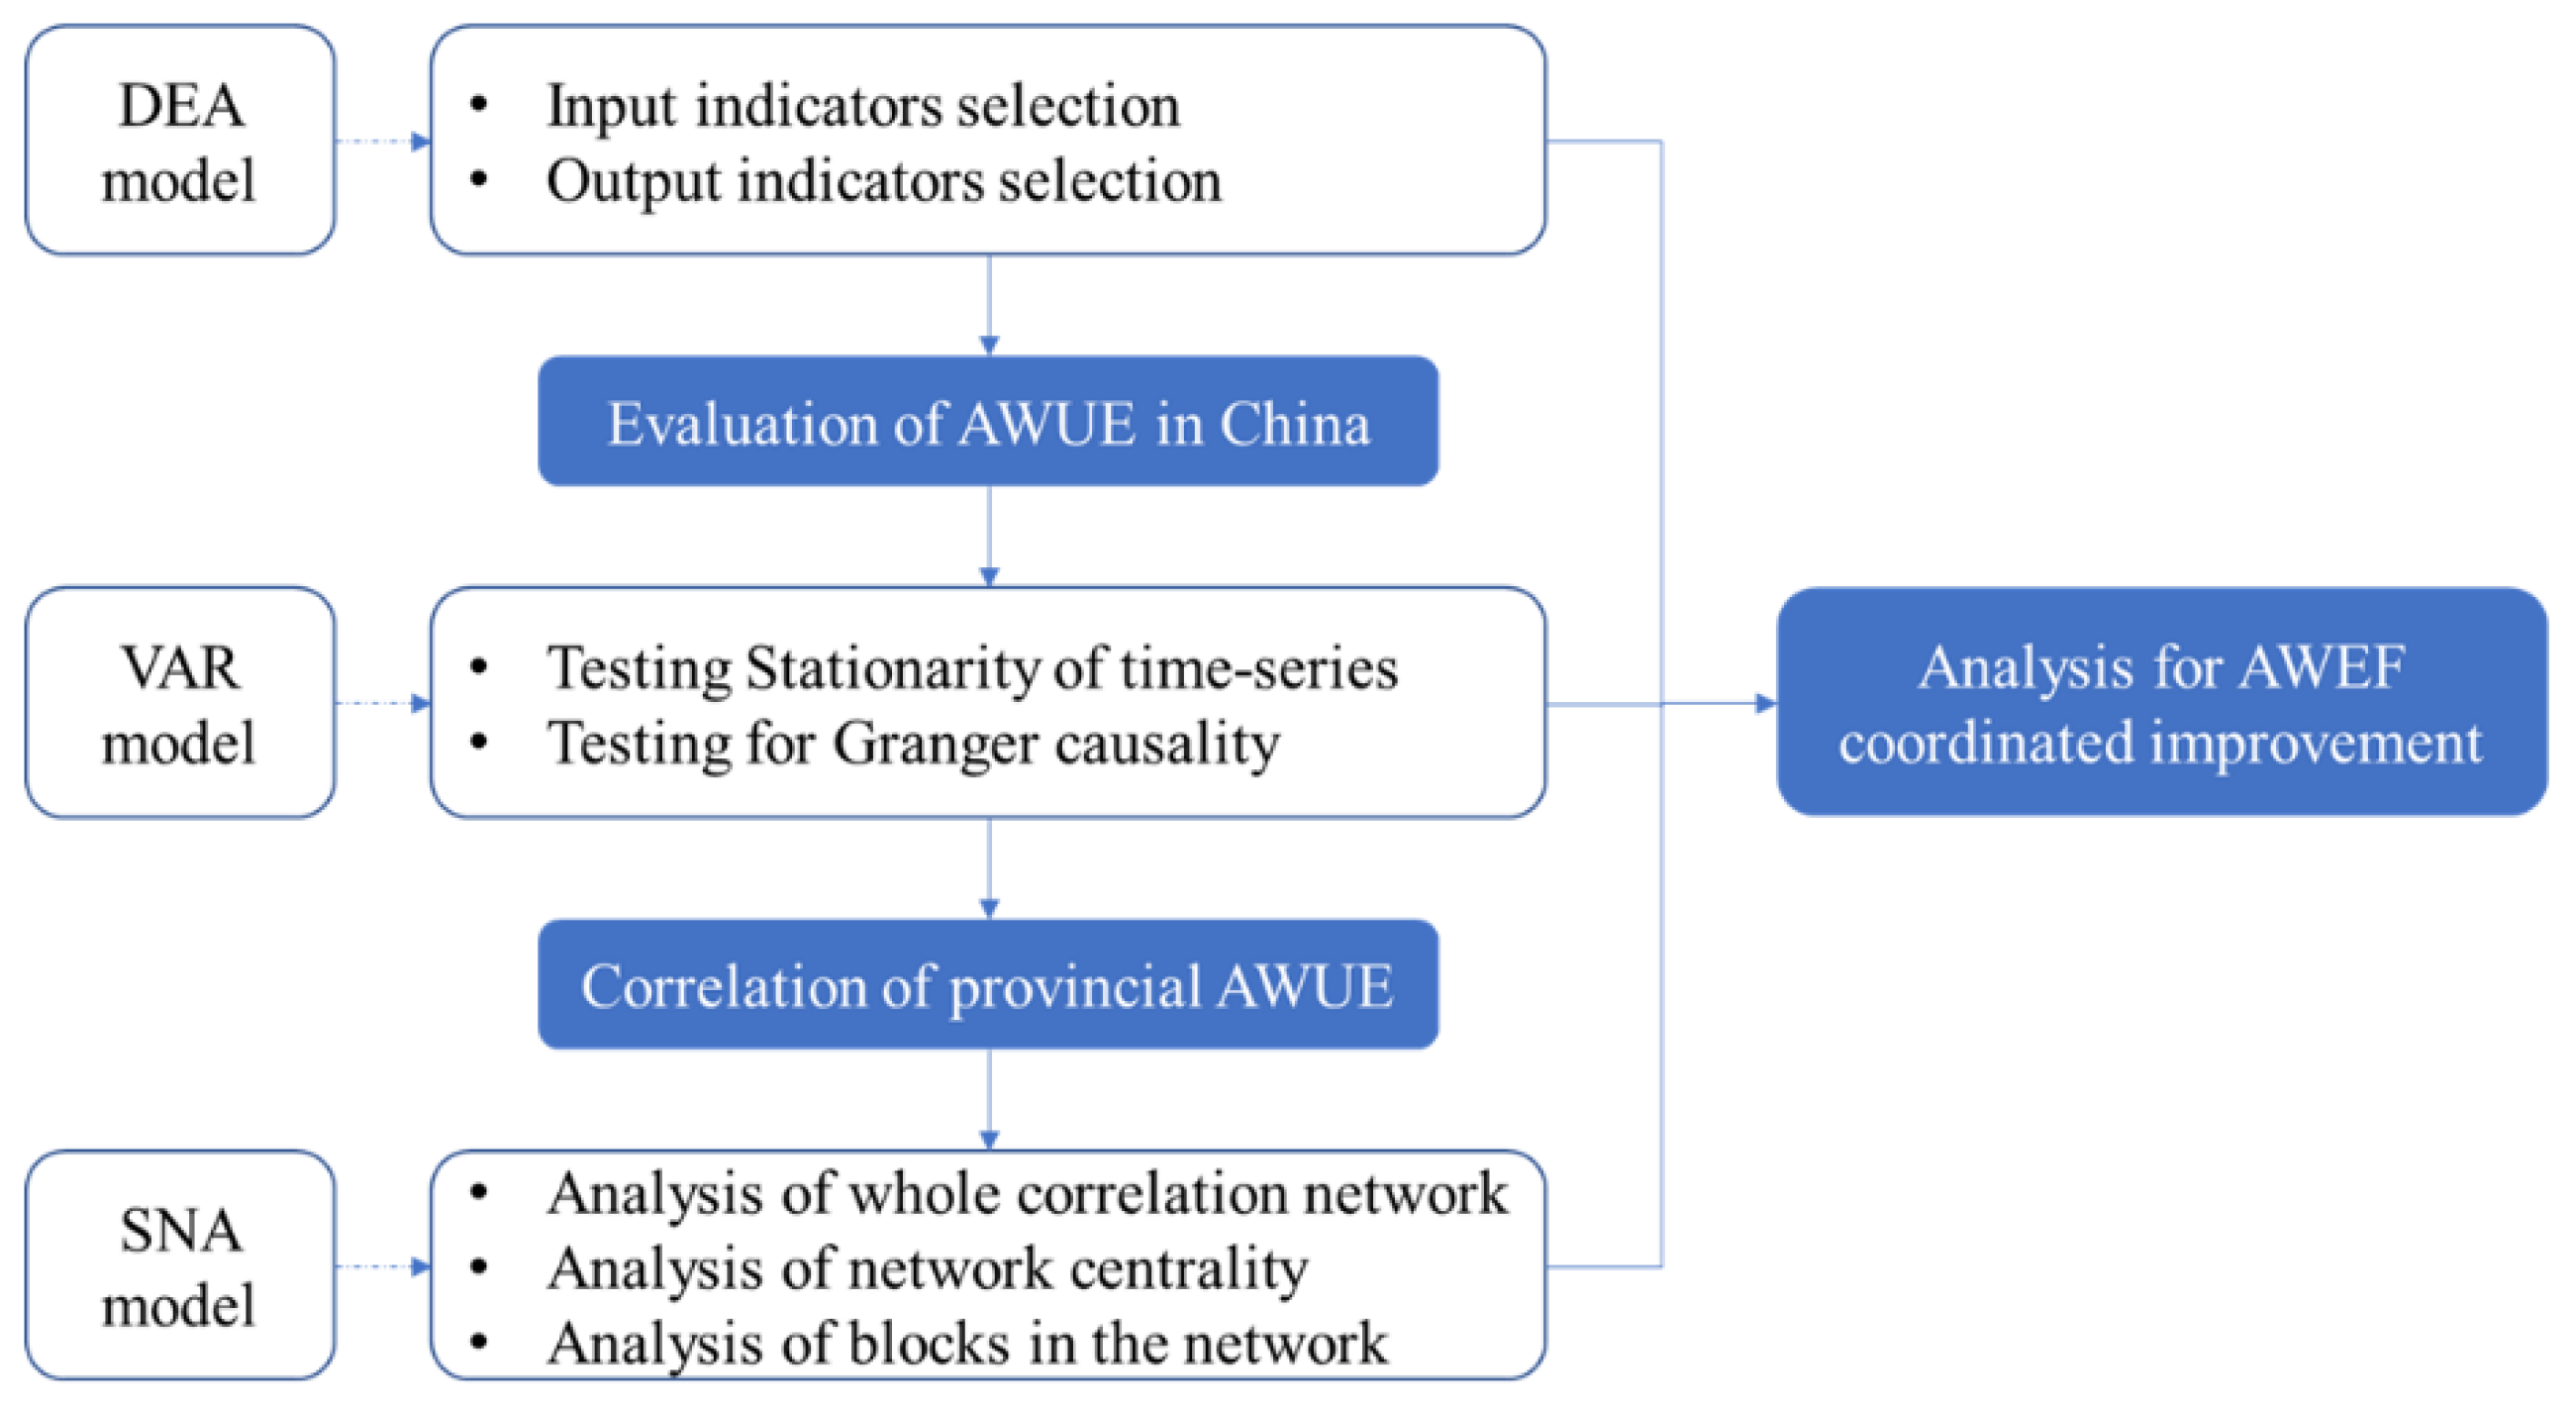
Firstly, to assess the AWUE of provinces in China, the super-efficiency SBM with undesirable outputs was used. This model is an improved DEA method and needs to select the appropriate input and output indicators for the production efficiency evaluation.
Secondly, the vector autoregression (VAR) Granger causality test model was used to analyze the dynamic connections between different provinces in China.
Thirdly, to investigate the characteristics of the spatial correlation network of AWUE, the SNA model was used. In particular, the centrality and block analysis can reveal the core provinces which influence the coordinated improvement in AWUE.
2.1. Undesirable Super-Efficiency SBM Model
DEA is a non-parametric evaluation method for measuring the relative efficiency of units where they have multiple inputs and outputs [
44]. The primary analysis unit is defined as the decision-making unit (DMU). The efficiency value of a DMU is the distance from the DMU to the best-practice frontier. The frontier shows the maximum of diverse outputs with different input combinations or views the minimum combination of necessary inputs for diverse outputs. DMUs below the frontier are considered inefficient, while DMUs on the frontier are regarded as efficient. The traditional radial and angle DEA models calculate the efficiency according to a certain input–output proportion, ignoring the excess in inputs and shortfalls in outputs, which are likely to deviate from the efficiency measurement. The slack-based model (SBM) [
45] was applied to avoid the slack problem of inputs and outputs, which belongs to a non-radial and non-angle DEA model. Moreover, when using conventional SBM-DEA models, the efficiency values of all DMUs are within the range of zero to one. This means that we fail to rank the DMUs with an efficiency value of one. Then, the super-efficiency model in DEA was proposed to exclude each observation from its own reference set, making it possible to obtain efficiency scores that exceed one [
46]. Thus, the super-efficiency SBM model with undesirable outputs is suitable for the AUWE assessment in this study, which is defined as follows:
where
represents the AWUE value,
is the number of evaluation units,
is the input elements,
and
are the number of desirable and undesirable outputs,
,
, and
are slack variables for inputs, desirable outputs, and undesirable outputs, and
is the envelope multiplier. If
, the DMU is on the agricultural production frontier and DEA effective. If
, it means the DMU is not DEA effective, and there is still potential to improve the agricultural water use efficiency in the evaluation unit.
2.2. Social Network Analysis
SNA is a sociological research method used to investigate the relationships of actors, which consists of a set of nodes (actors) and ties (relationships between actors) [
47]. SNA has also invented graph-theoretic properties to characterize structures, positions, links, and dyadic properties of the overall “shape” [
39]. The AWUE of provinces is embedded in a social network by formal or informal relationships, and their changes are affected by the social network [
48]. In the spatial correlation network of AWUE, the “nodes” are provinces, which present the AWUE of a particular region, and “ties” are the connection between these provinces, which show the spillover effects of factors related to AWUE. This section contains two parts: firstly, establishing the correlations in the AWUE in different provinces using the VAR Granger causality test; secondly, constructing the spatial correlation network of provincial AWUE with the method of SNA.
2.2.1. Vector Autoregression (VAR) Granger Causality Test
This step addresses the correlation among variables, which discusses a relationship between two nodes. In general, the influence of AWUE in different provinces has a lag, which means that the WUE information during a specific period in one area can predict the changing trend of WUE in the other regions [
37]. Therefore, this paper used the VAR Granger causality test to build the dynamic correlation between provincial AWUE in China and construct a spatial correlation network matrix.
Firstly, the time series of AWUE in any given two provinces
x,
y were defined as {
} and {
}, respectively. Secondly, two VAR models were constructed to test whether there is an interaction between the AWUE of the two regions.
where
,
, and
(
are the parameters to be estimated,
(
) represents the residual terms, which obeys the standard normal distribution,
,
,
, and
are the lag orders of the autoregressive terms. Through Equation (3), we can test whether the AWUE in region
is affected with a lag by its AWUE and the AWUE in region
. If the test result rejects the null hypothesis, the historical information of sequence {
} is helpful to explain the variable change of sequence {
}, which means that {
} is the Granger cause of {
}, and then create a directed link from region
to region
. According to this method, the links between all pairs of two regions in the study area are tested, and the spatial correlation network map of provincial AWUE is obtained. It should be noted that the stationarity test of time series was carried out by a unit root test model, the ultimate hysteresis order was set to an order of 2, and 1% was used as the significance test standard.
2.2.2. Spatial Correlation Network Characteristics
This step analyzes the spatial correlation network structure of provincial AWUE with two indicators: overall network characteristics and network centrality analysis [
38,
49,
50]. This paper used the software UCINET (v 6.659) to obtain them.
- (1)
Overall network characteristic analysis
Four items were used to describe the overall network characteristics: network affinity, network density, network efficiency, and network hierarchy.
Network affinity describes the sum of all the actual connections in the network, which reflect the overall scale of the network. It is represented by .
Network density measures the degree of cohesion in the network. The more connections there are in the provincial AWUE, the greater the network density. It is expressed as Equation (5).
represents the network density,
is the number of nodes in the network, and
is the maximum potential connection.
Network efficiency refers to the connection efficiency between nodes in the network. The lower the network efficiency, the more redundant lines and overflow channels there are, and the more stable the whole network.
Network hierarchy reflects the asymmetric accessibility in the network. The higher the network hierarchy, the more rigid the network. The network hierarchy is calculated by Equation (6).
represents the network hierarchy,
is the group number of symmetric reachable points in the network, and
is the number of groups of maximum possible reachable points.
- (2)
Network centrality analysis
Three parameters are used to describe the power of the nodes: point centrality, betweenness centrality, and closeness centrality. In a network, power means influence [
47], and there is a positive relationship between centrality and power [
51].
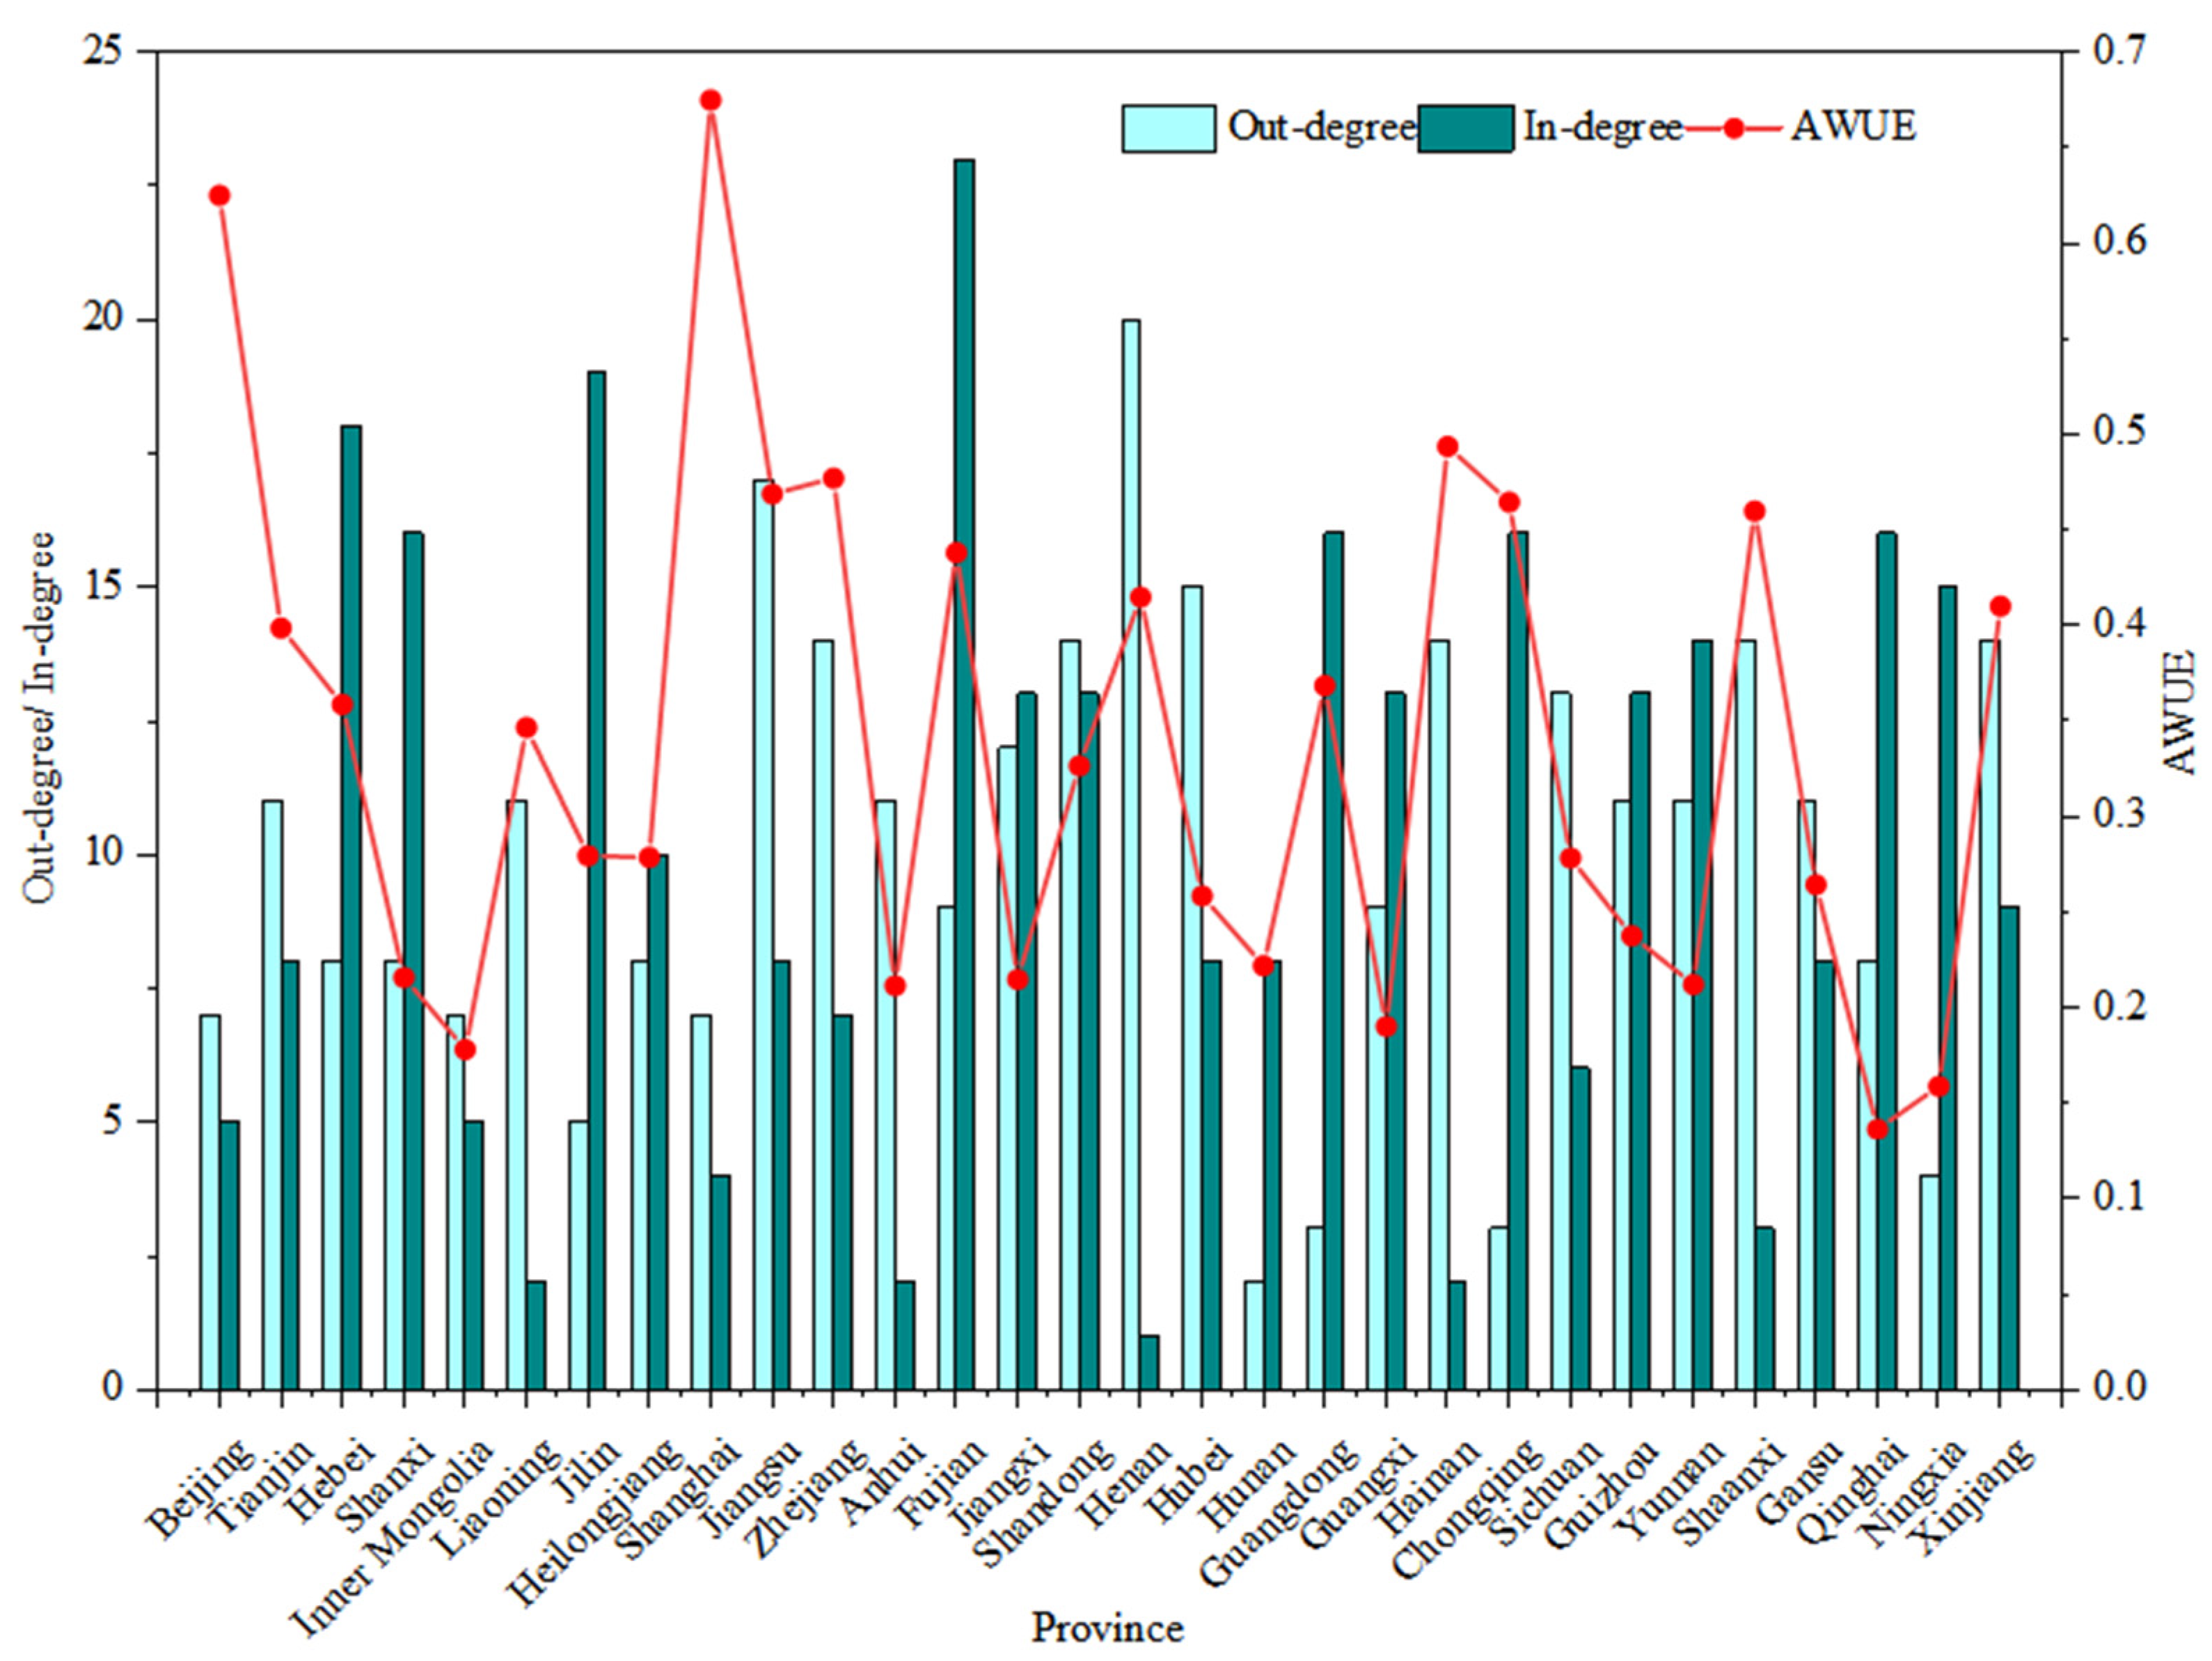
Point centrality measures the degree of association between a node and other nodes, indicating the degree to which a node is in the center of the network. The province with a higher point centrality has more connections with other provinces in the AWUE network and is likely to be the center node of the network. Point centrality (
) is calculated by Equation (7).
where
stands for the number of provinces directly connected to the other; this centrality has two types in directed graphs: in-degree and out-degree. The former refers to the incoming spillover effects of factors related to AWUE from other provinces. In contrast, the latter is the outgoing spillover effects to other provinces.
Betweenness centrality indicates the mediation and bridge function, investigating how a node can control the communication between other nodes. It evaluates the number of times a node acts as a bridge along the shortest path between two other nodes, indicating the node’s control ability of the overall network [
52]. It is represented by
and is calculated by Equation (8).
Closeness centrality refers to the closeness of a node to all other nodes in the network, which reflects the ability of a node to not be controlled by other nodes in the entire network.
2.2.3. Block Model Analysis
The block model is a primary social, spatial clustering analysis method [
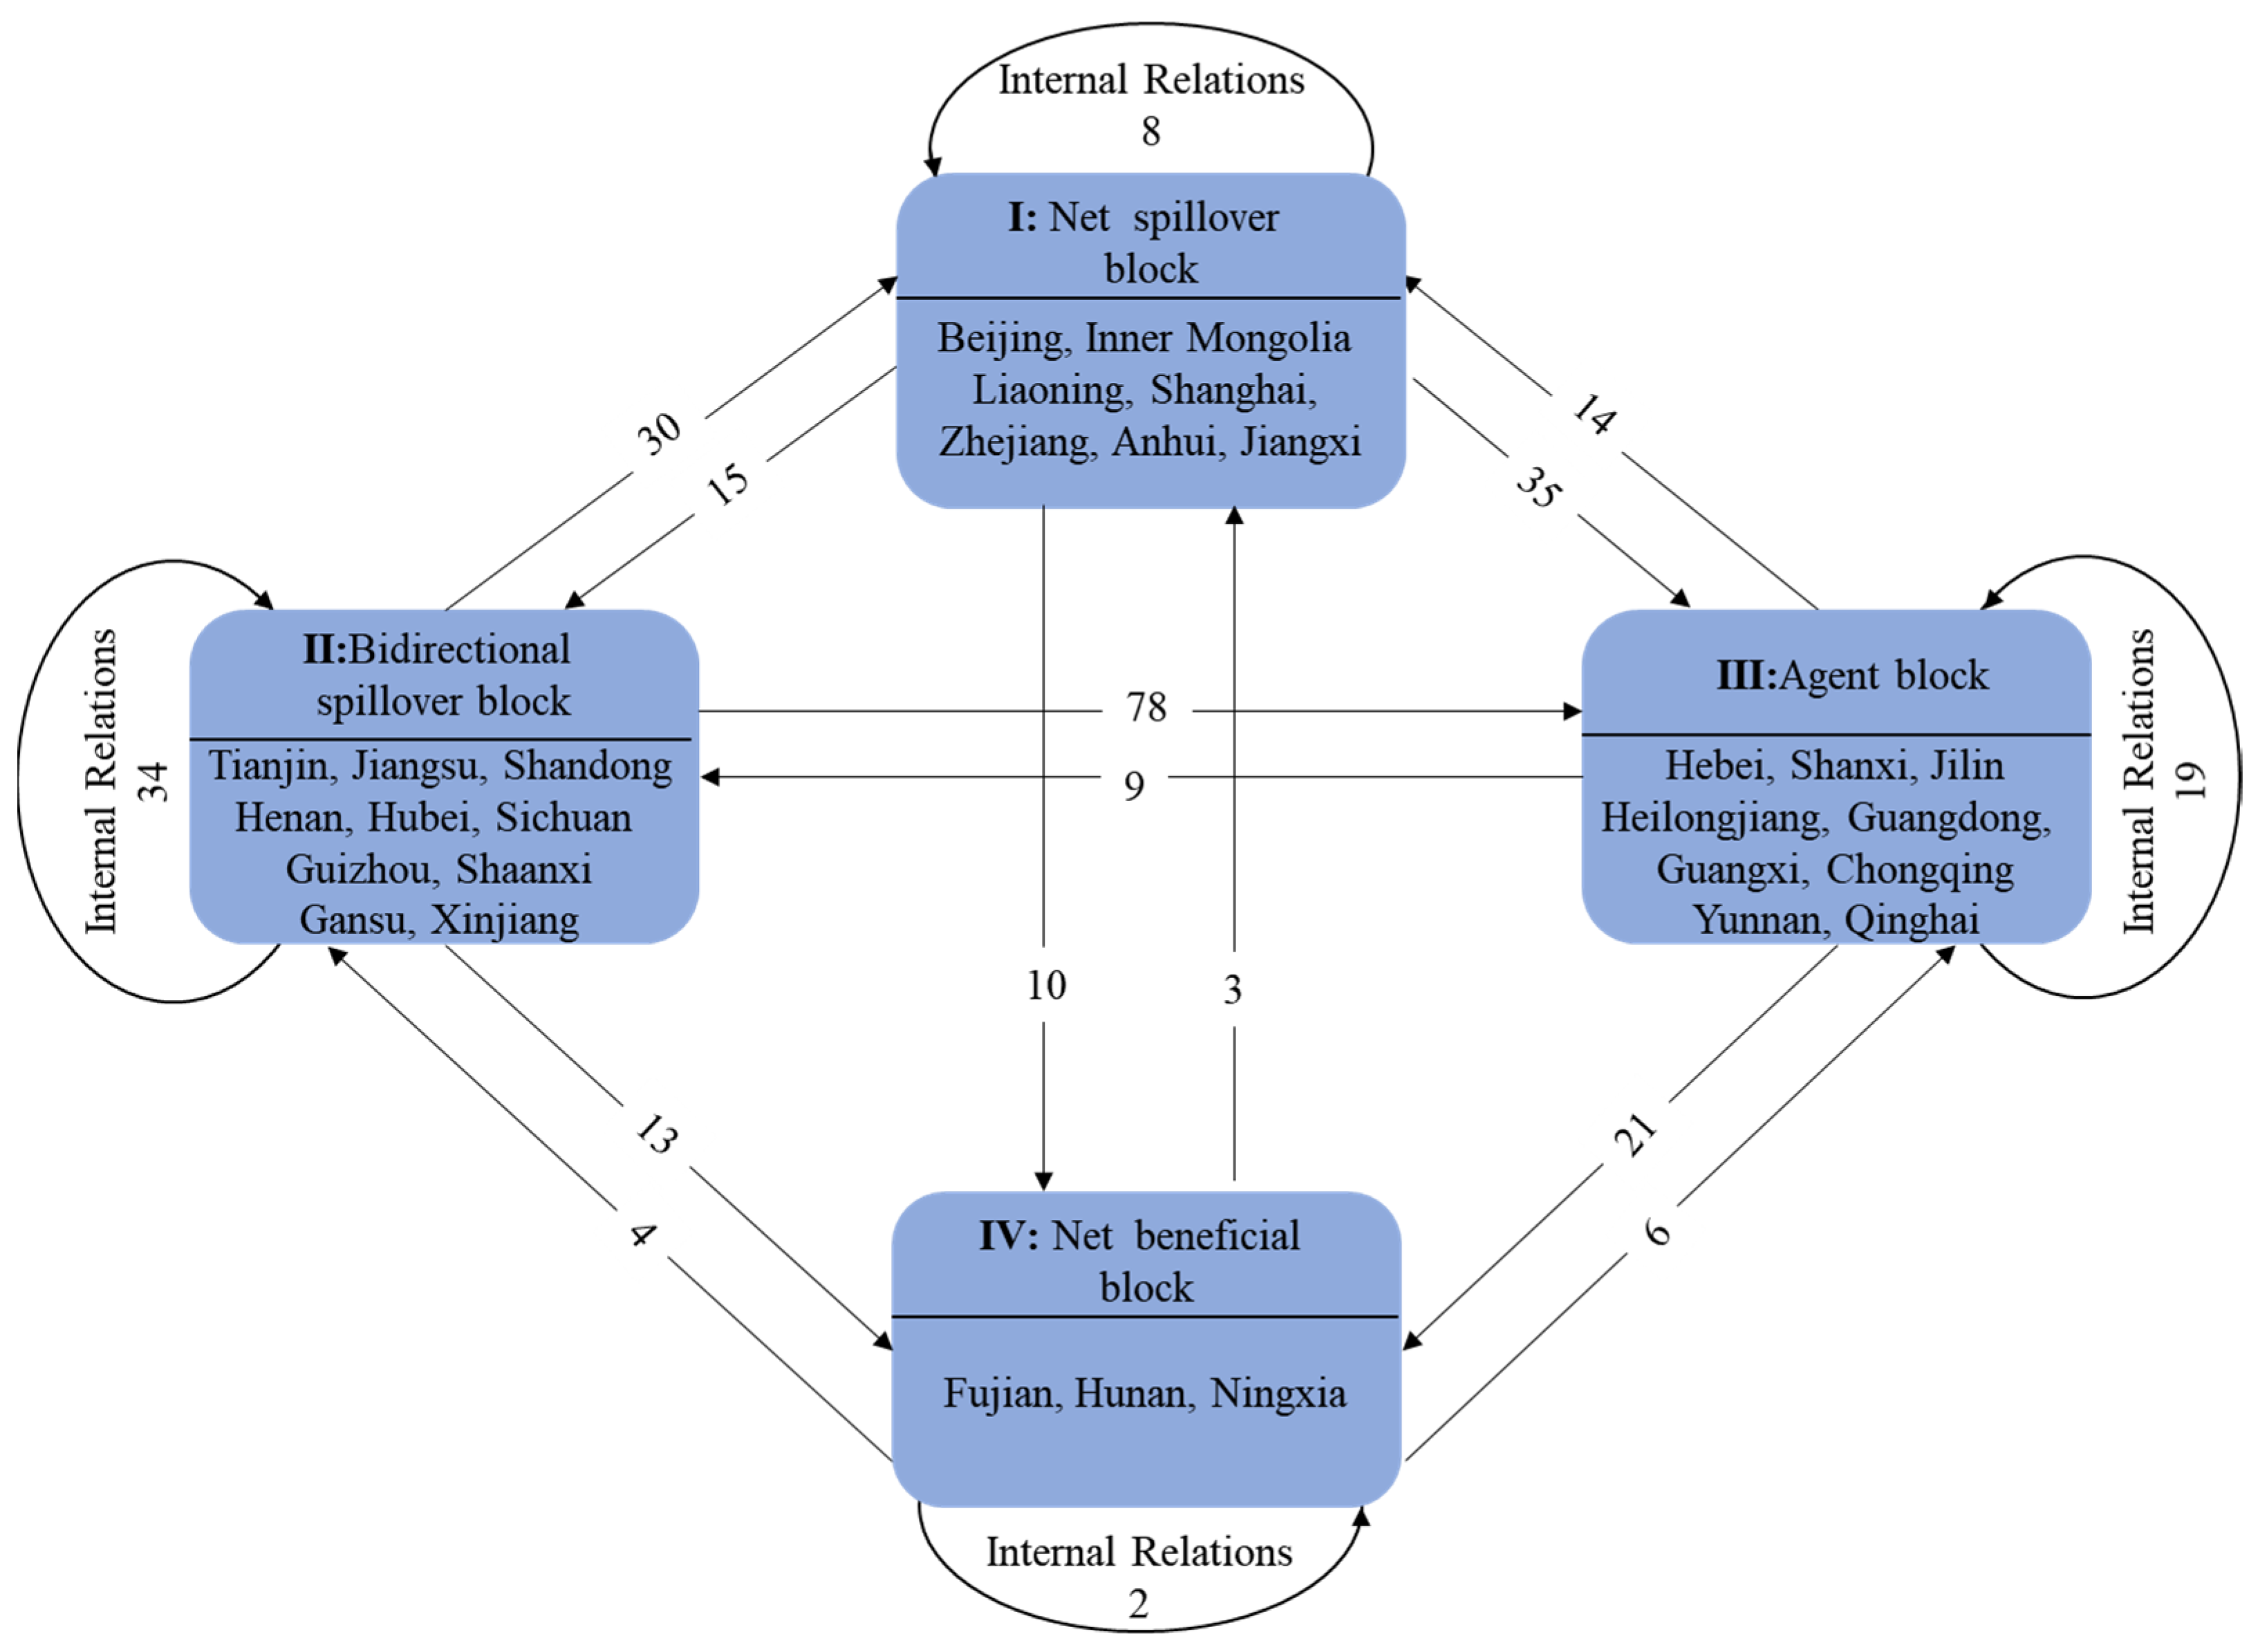
53]. It can explore the network’s internal structure, investigate the position and role of each node in the block, evaluate the path of sending and receiving information between blocks, and conduct descriptive analysis. According to the block model, the social network is divided into four sections: bidirectional block, agent block, net beneficial block, and net spillover block. We used the CONCOR module in UCINET to finish the block model analysis. The maximum depth was set to 2. The focus on the standard was set to 0.2, dividing the 30 provinces into 4 blocks.
2.3. Data Source
In terms of the measurement of AWUE, five variables related to agricultural production were selected as input indicators, and the output indicators were from two aspects of desirable outputs and undesirable outputs, as shown in
Table 1. For the availability and validity of the data, this research selected 30 provinces in China as the study area, excluding Hong Kong, Macao, Taiwan, and Tibet, and chose 2000 to 2019 as the research period.
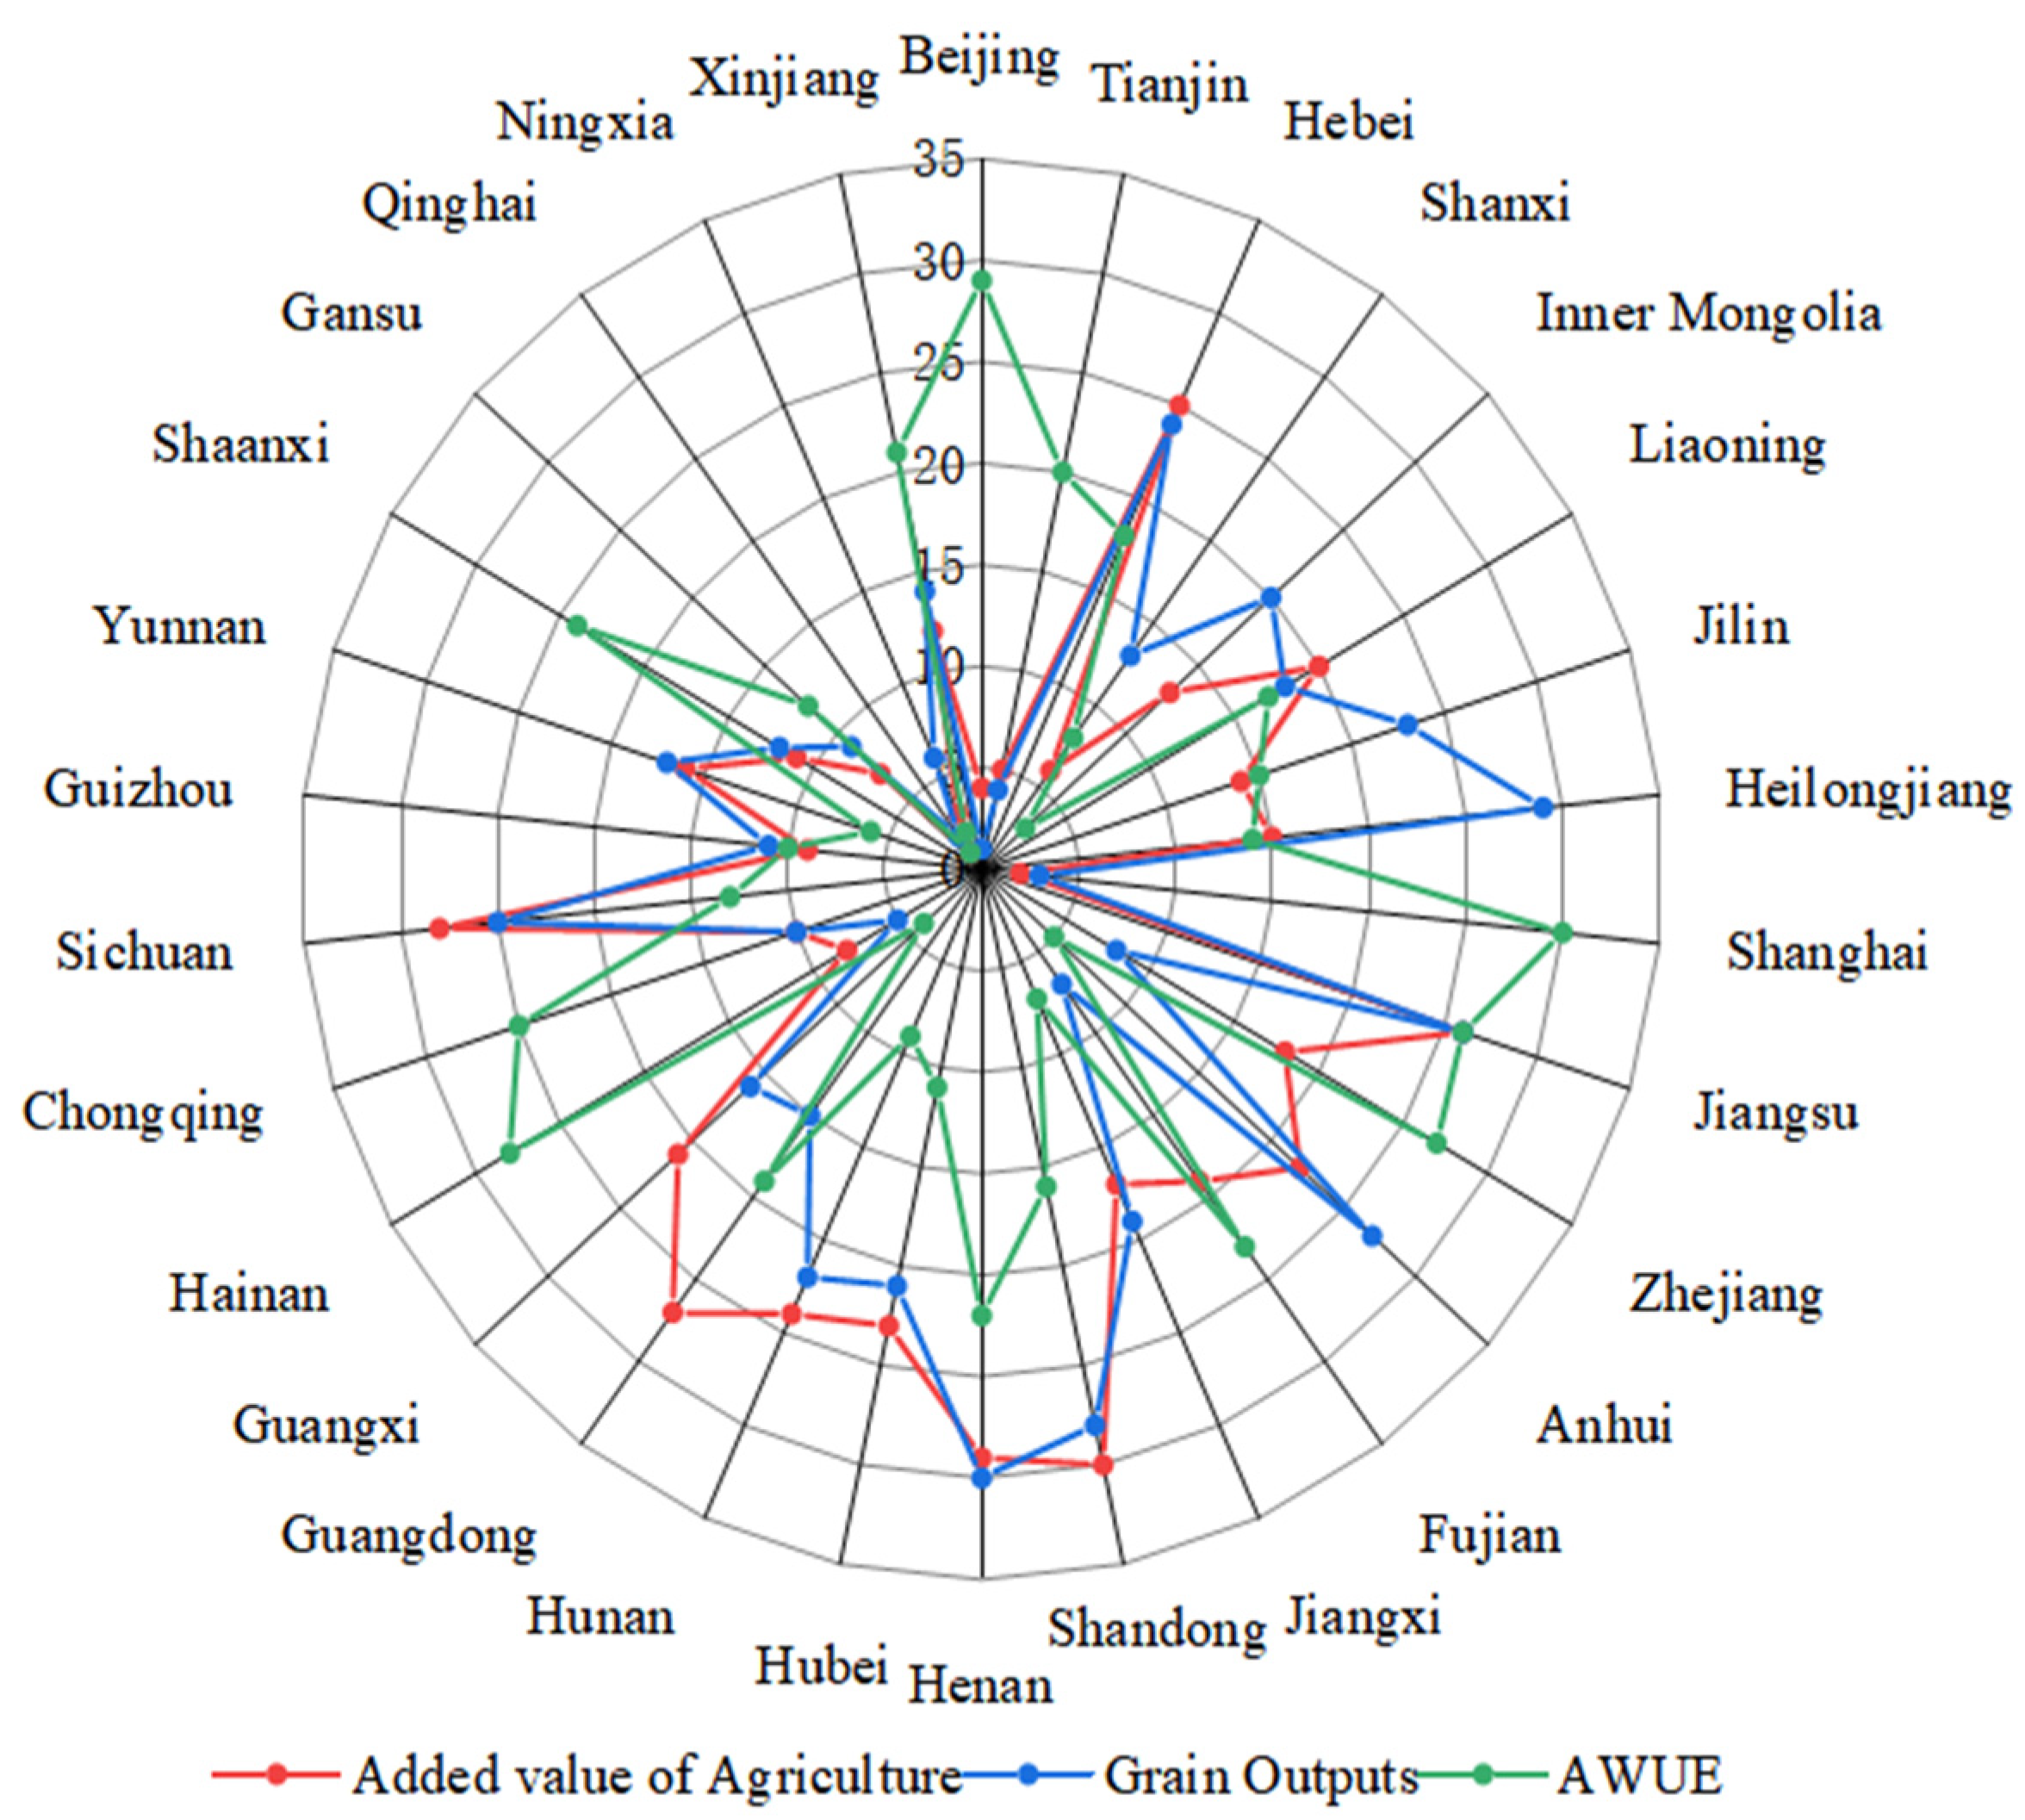
Since this paper evaluated agricultural water use efficiency, water withdrawal in the agricultural sector (irrigation, forestry, farming, and fishery) was the primary input indicator. As irrigation accounts for most of the agricultural water, this article prioritized the production factors related to the planting industry, such as crop sown area, agricultural machinery power, and fertilizer. In addition, the labor force was also included as an input element. Corresponding to the water use in the agricultural sector, we selected added value of agriculture as a desirable output indicator. To eliminate the influence of interannual price changes, we used the comparable price index to re-calculate the price based on the year 2000. Meanwhile, the undesirable output was mainly considered the non-point source pollution caused by agricultural production.
The data relating to the AWUE assessment were obtained from the
China Water Resources Bulletin,
China Rural Statistical Yearbook, and
China Statistical Yearbook, covering 2000–2019. The discharges of agricultural non-point source pollution mainly come from crop fertilization, livestock breeding, and straw burning, which are estimated through the discharge of the pollution loads of chemical oxygen demand (COD), total nitrogen (TN), and total phosphorus (TP). The inventory analysis method was used to assess the above three indicators [
54].
5. Conclusions
Affected by global climate change and water shortages, food security continues to be challenged. Improving agricultural water use efficiency and increasing the outputs of per unit water usage are essential to guarantee global food security. This article used the undesirable super-efficiency SBM model to measure the AWUE of 30 provinces in China from 2000 to 2019. Then, we investigated the spatial correlation of provincial AWUE with the social network analysis (SNA) method. The results found that:
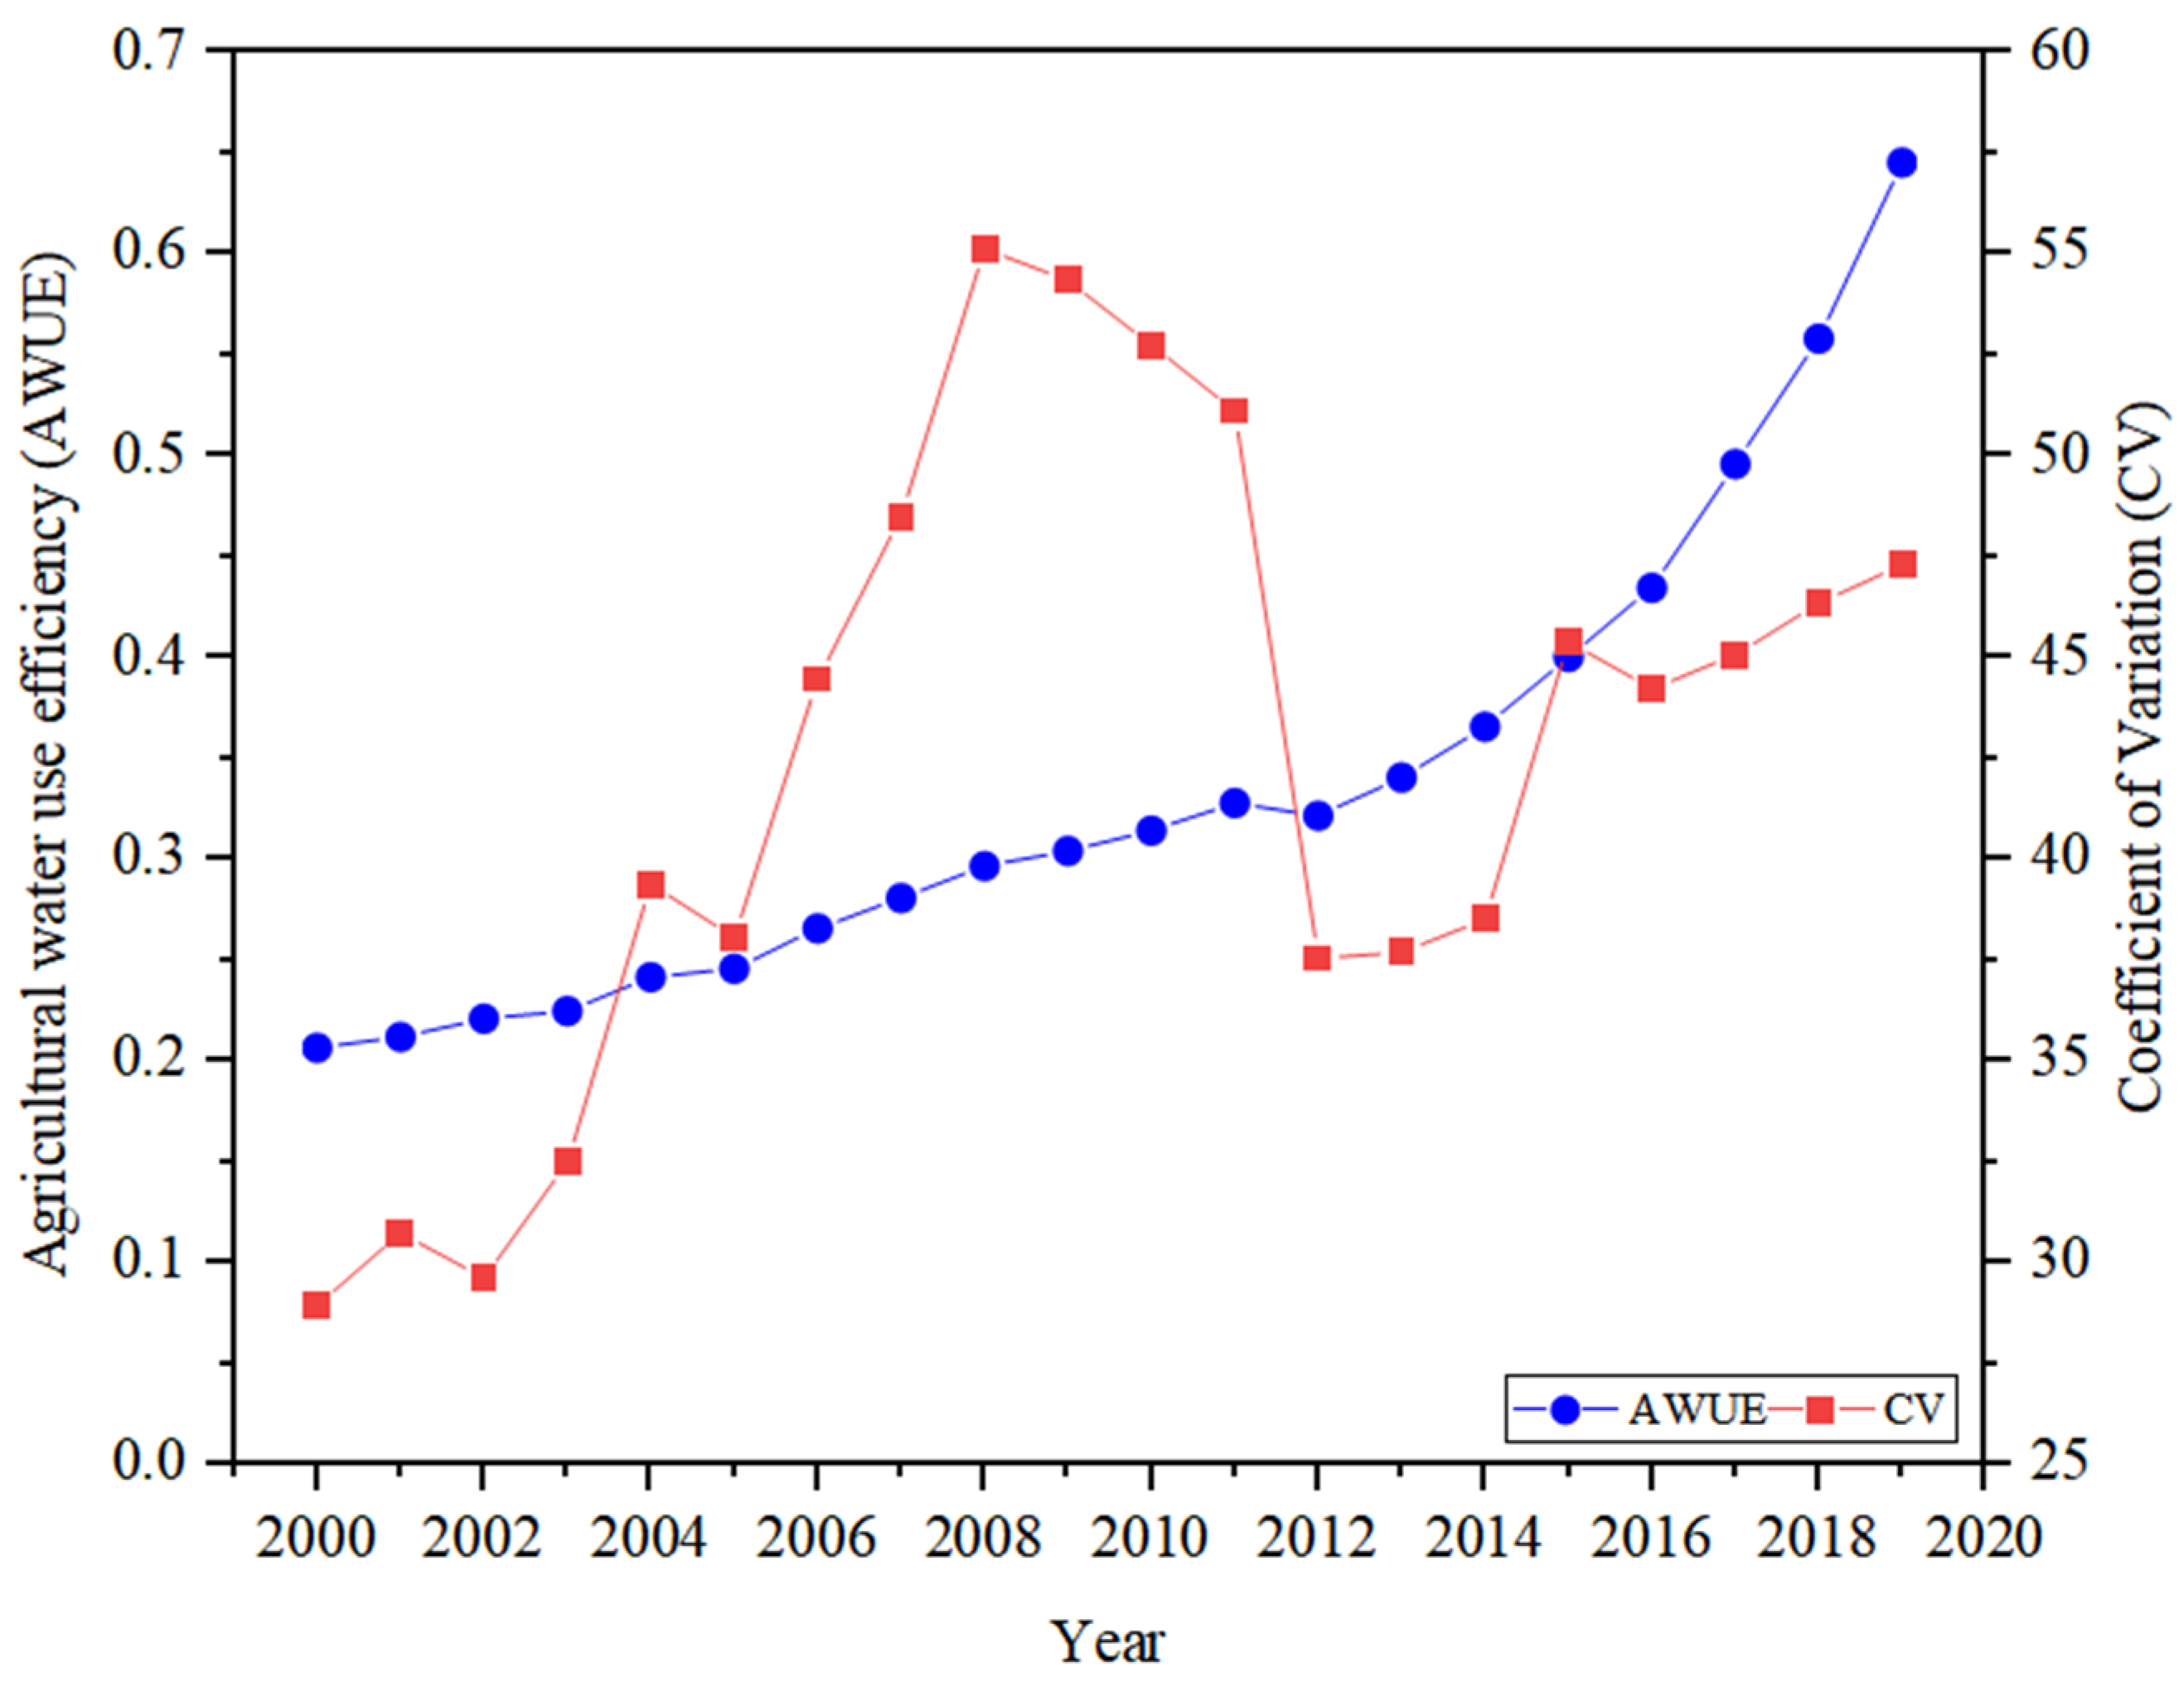
(1) The overall agricultural water use efficiency in China was inefficient, and there is still great potential to improve it. The focus of sustainable agricultural water resource management included the broad application of water-saving technology and strict control of water pollution.
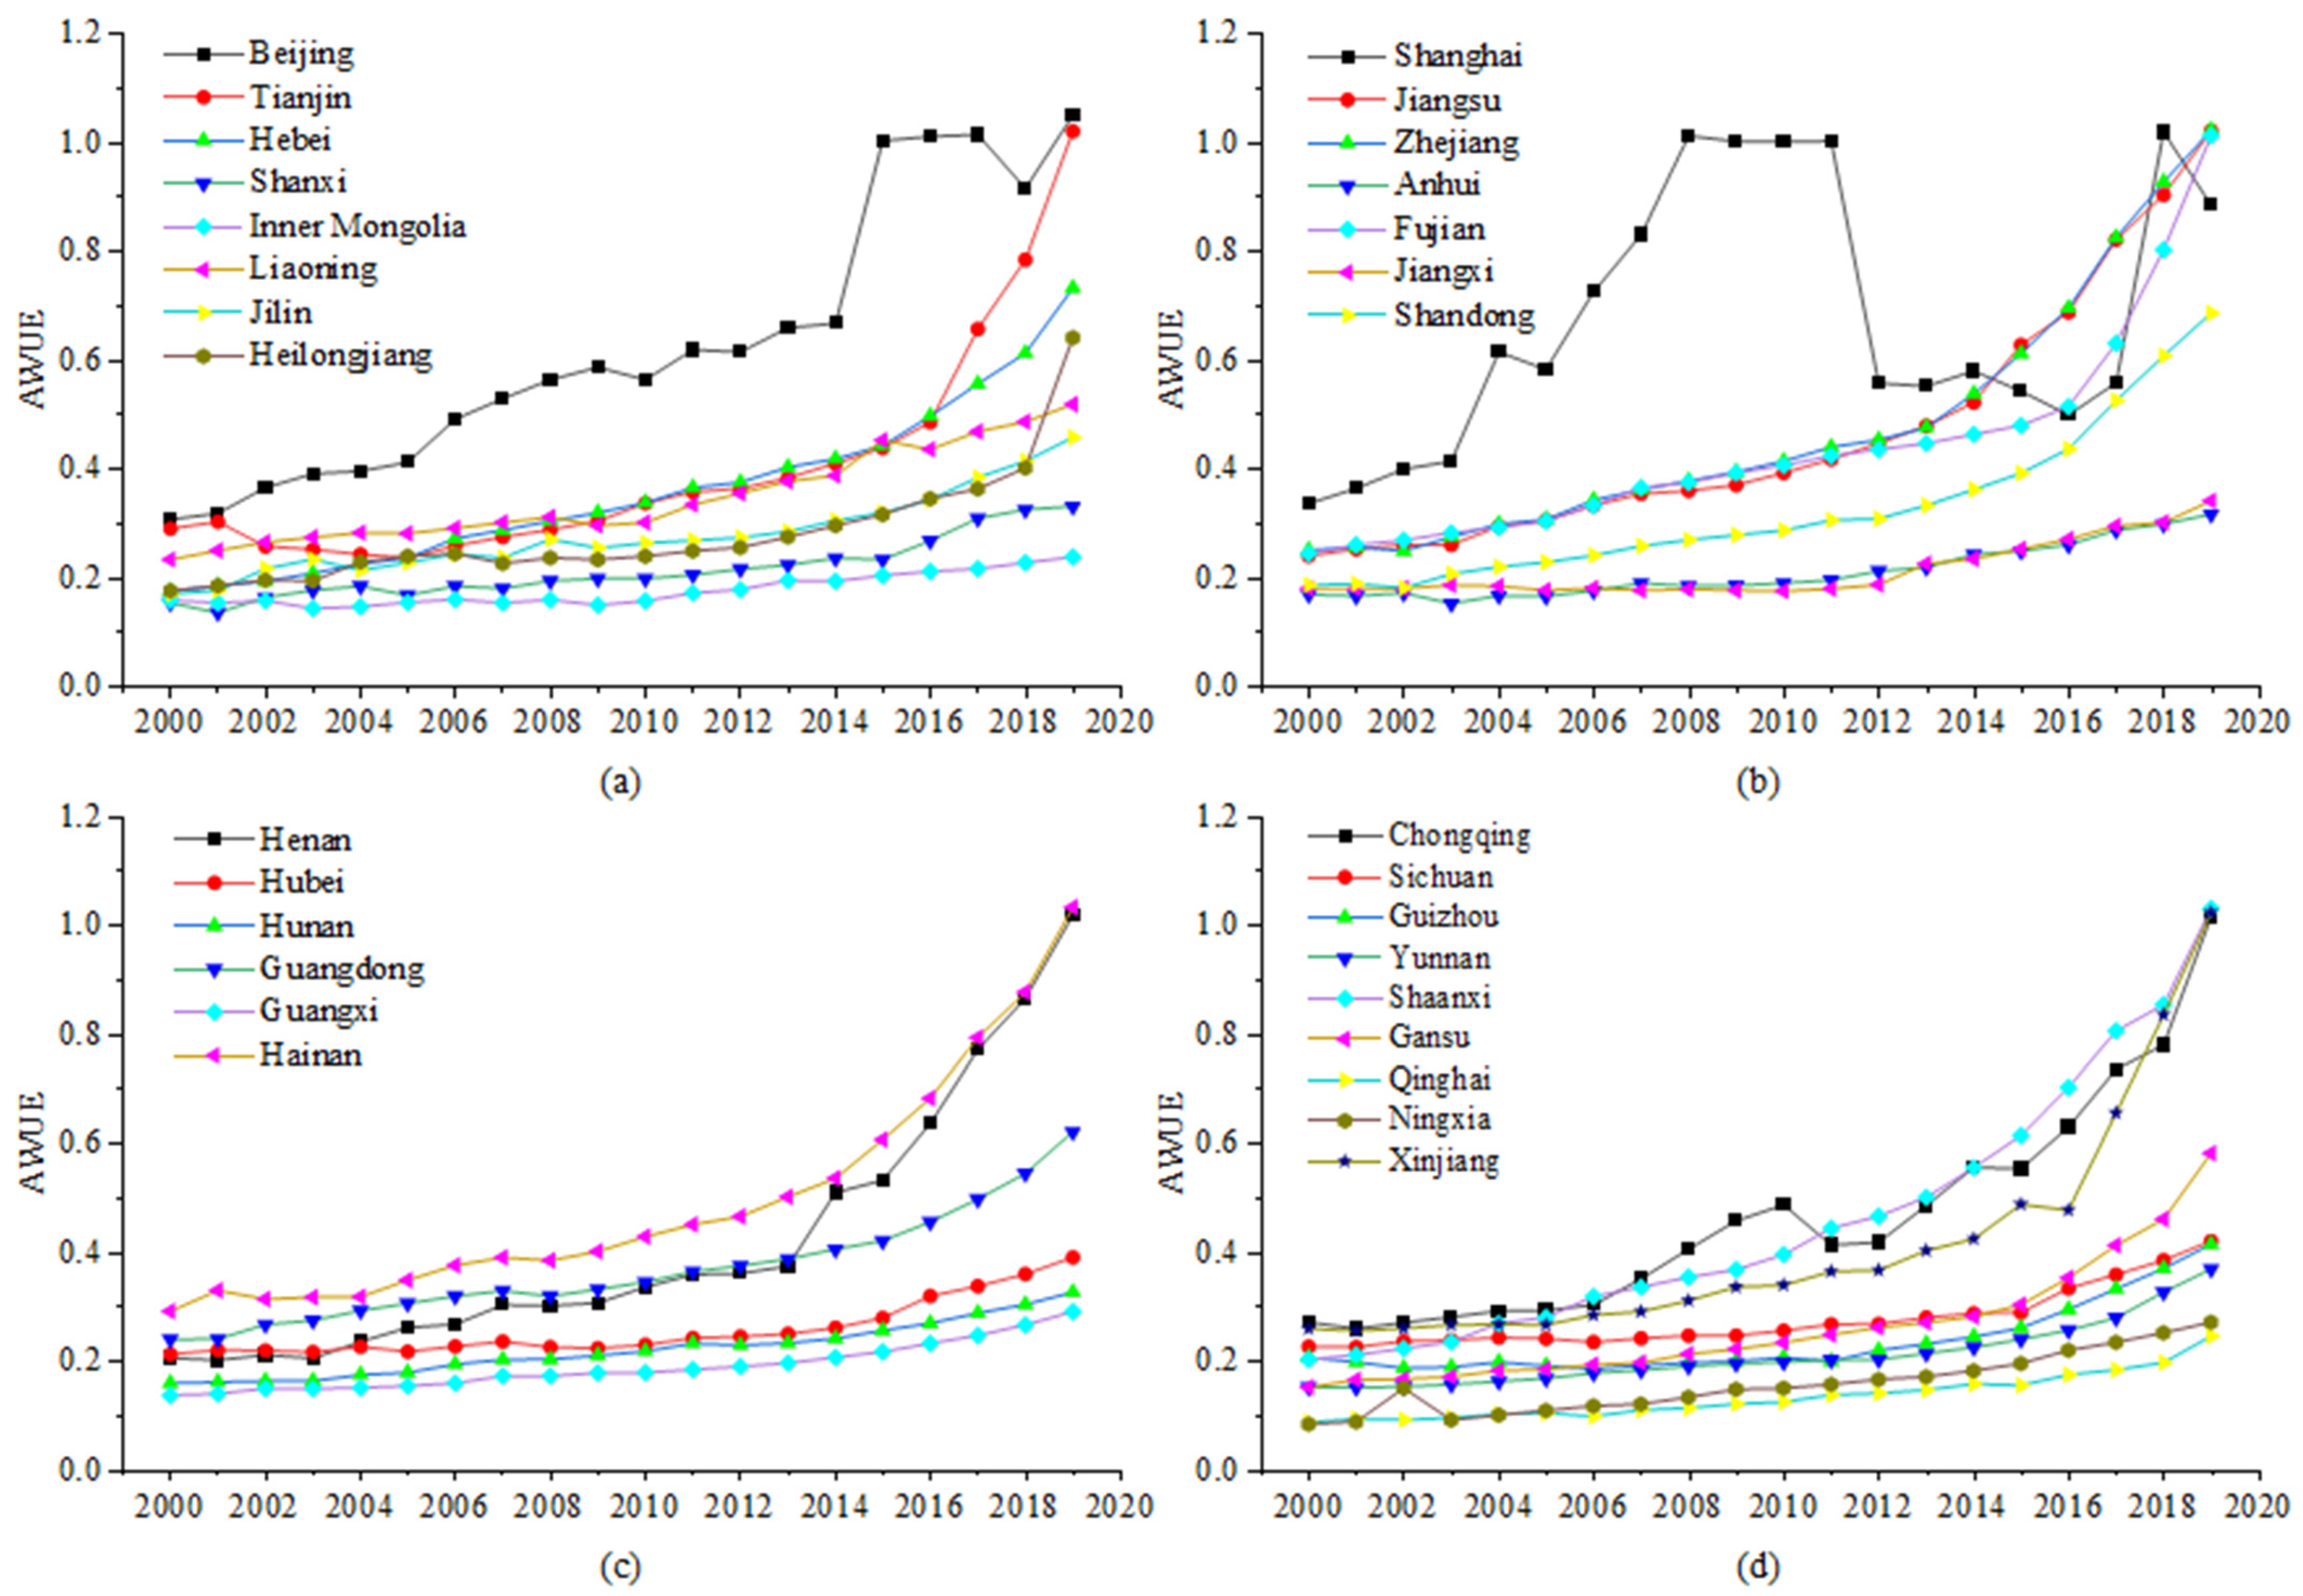
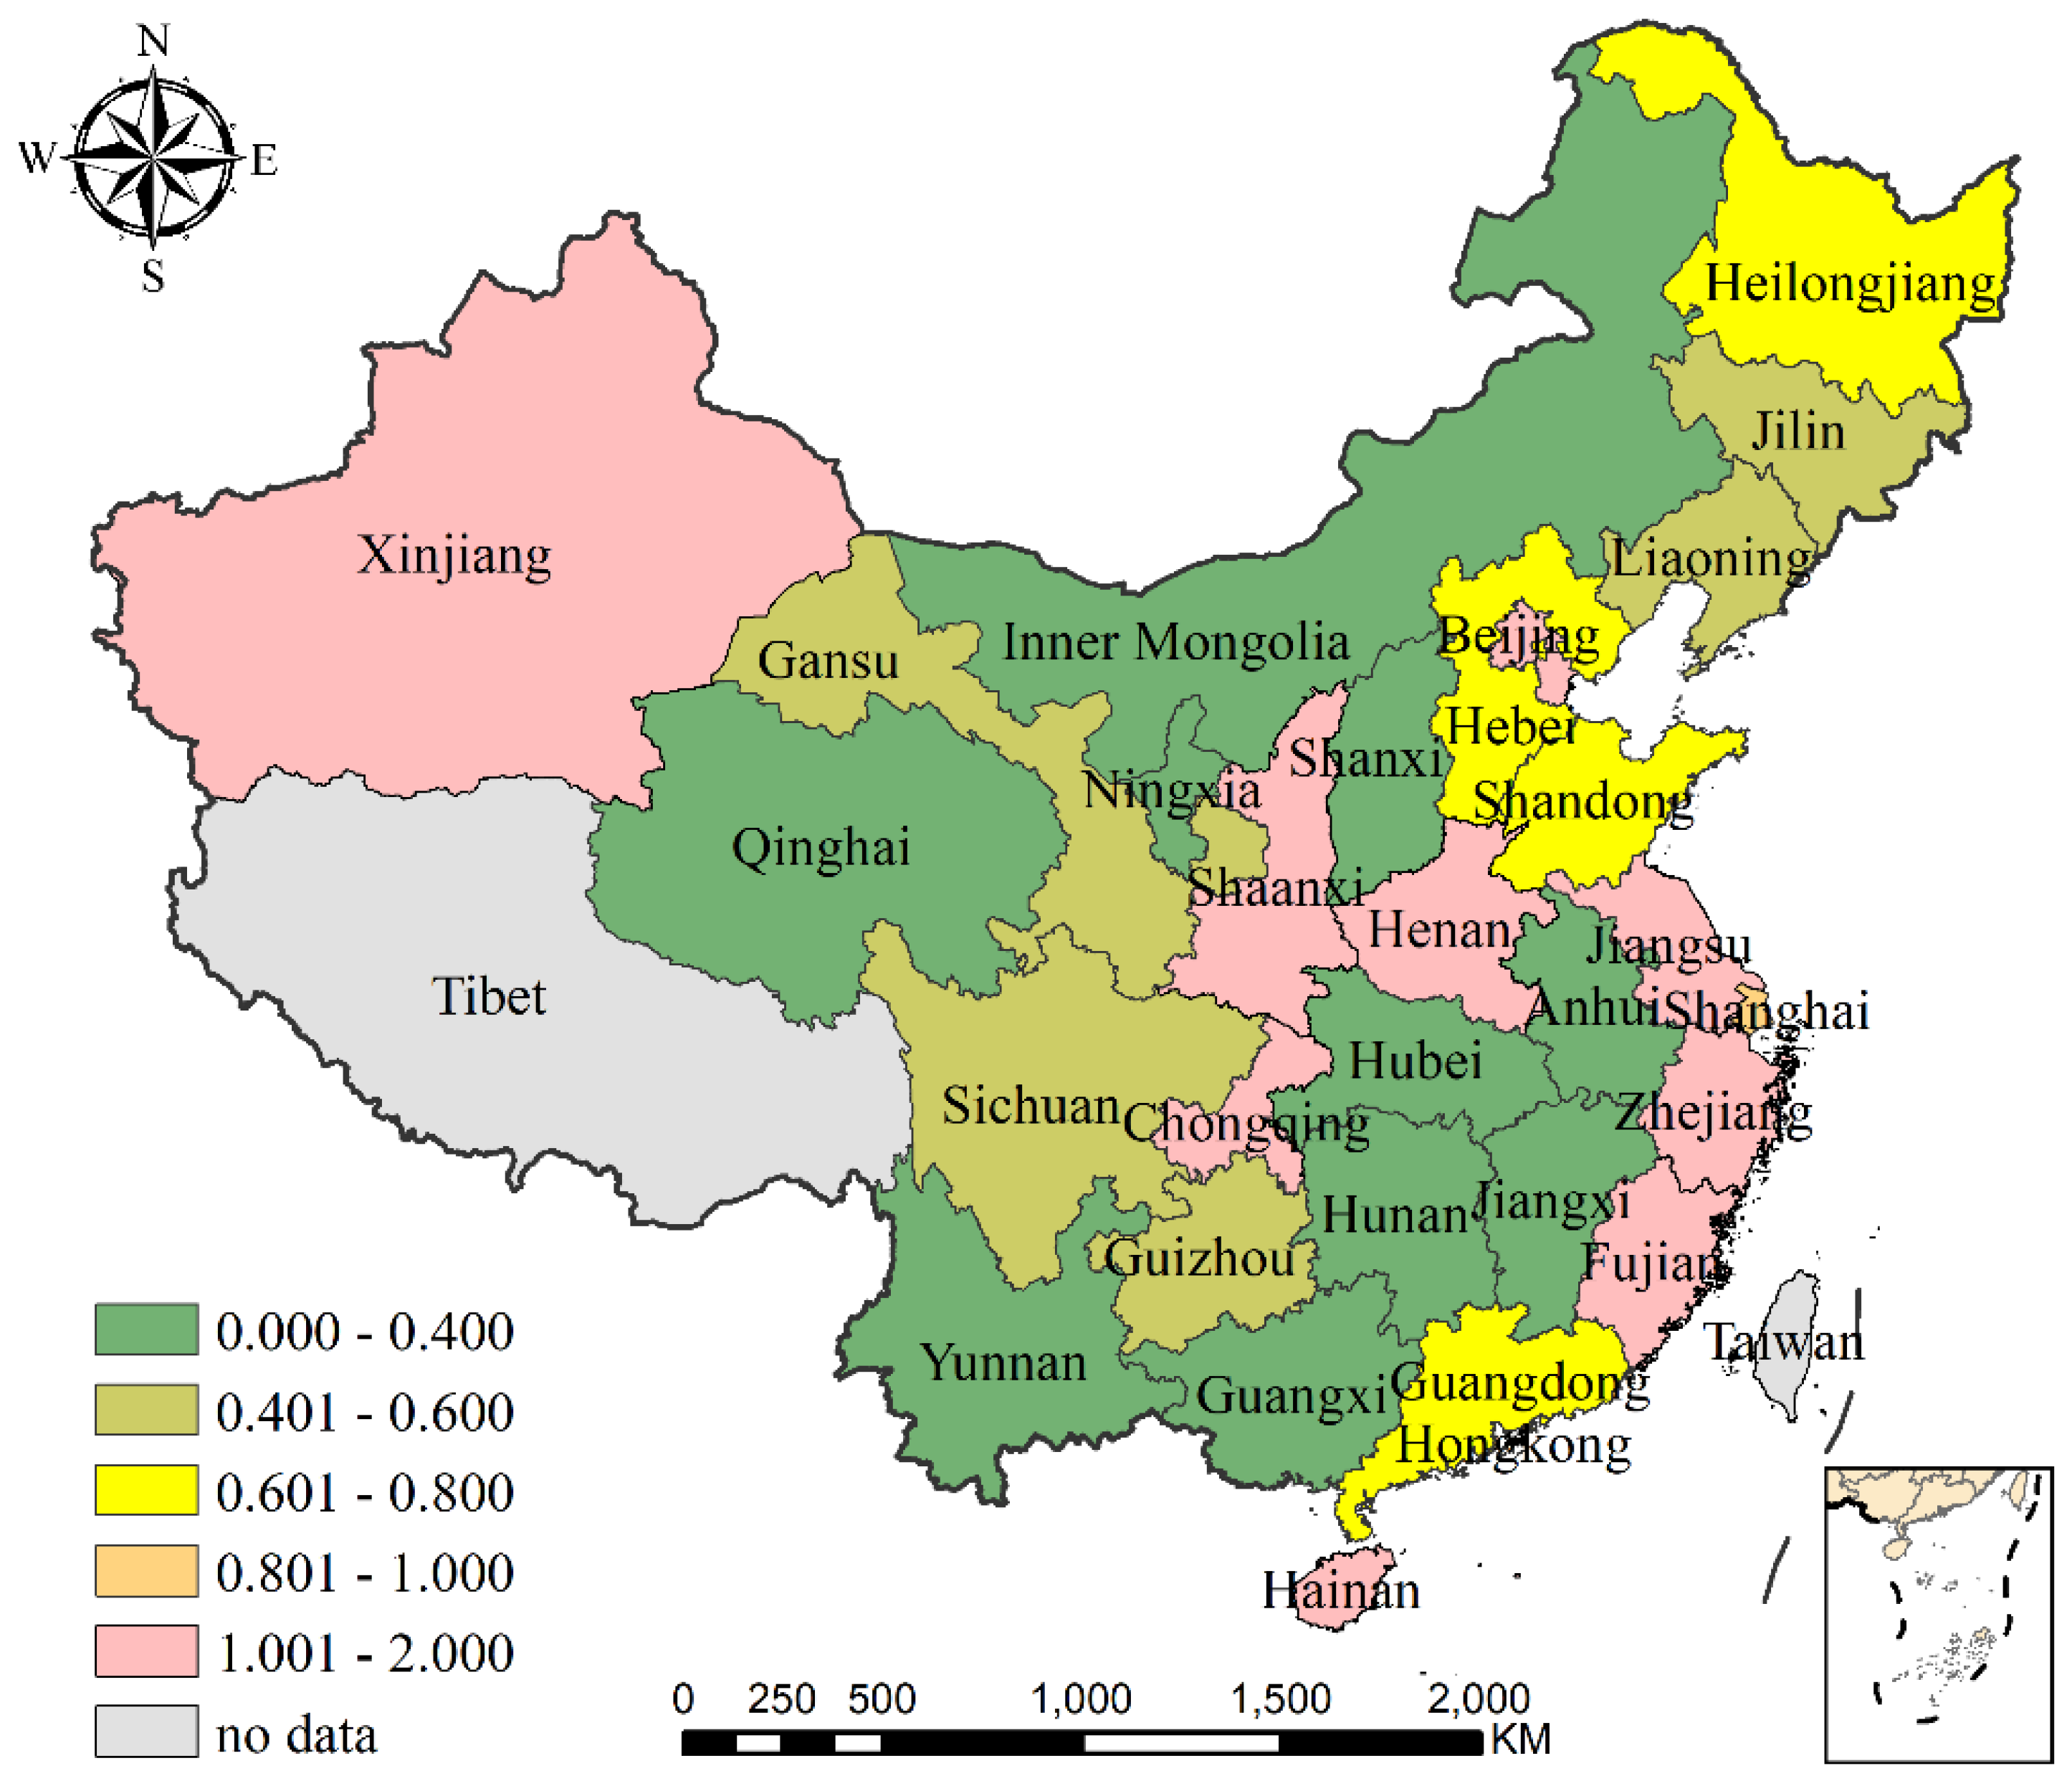
(2) All the provinces had experienced increasing AWUE in the past 20 years, but with apparent gaps. The growth rate of AWUE experienced a slight increase first and then a substantial increase. Provinces with higher AWUE were primarily located in the east, while the lower-AWUE areas were located in central and western China.
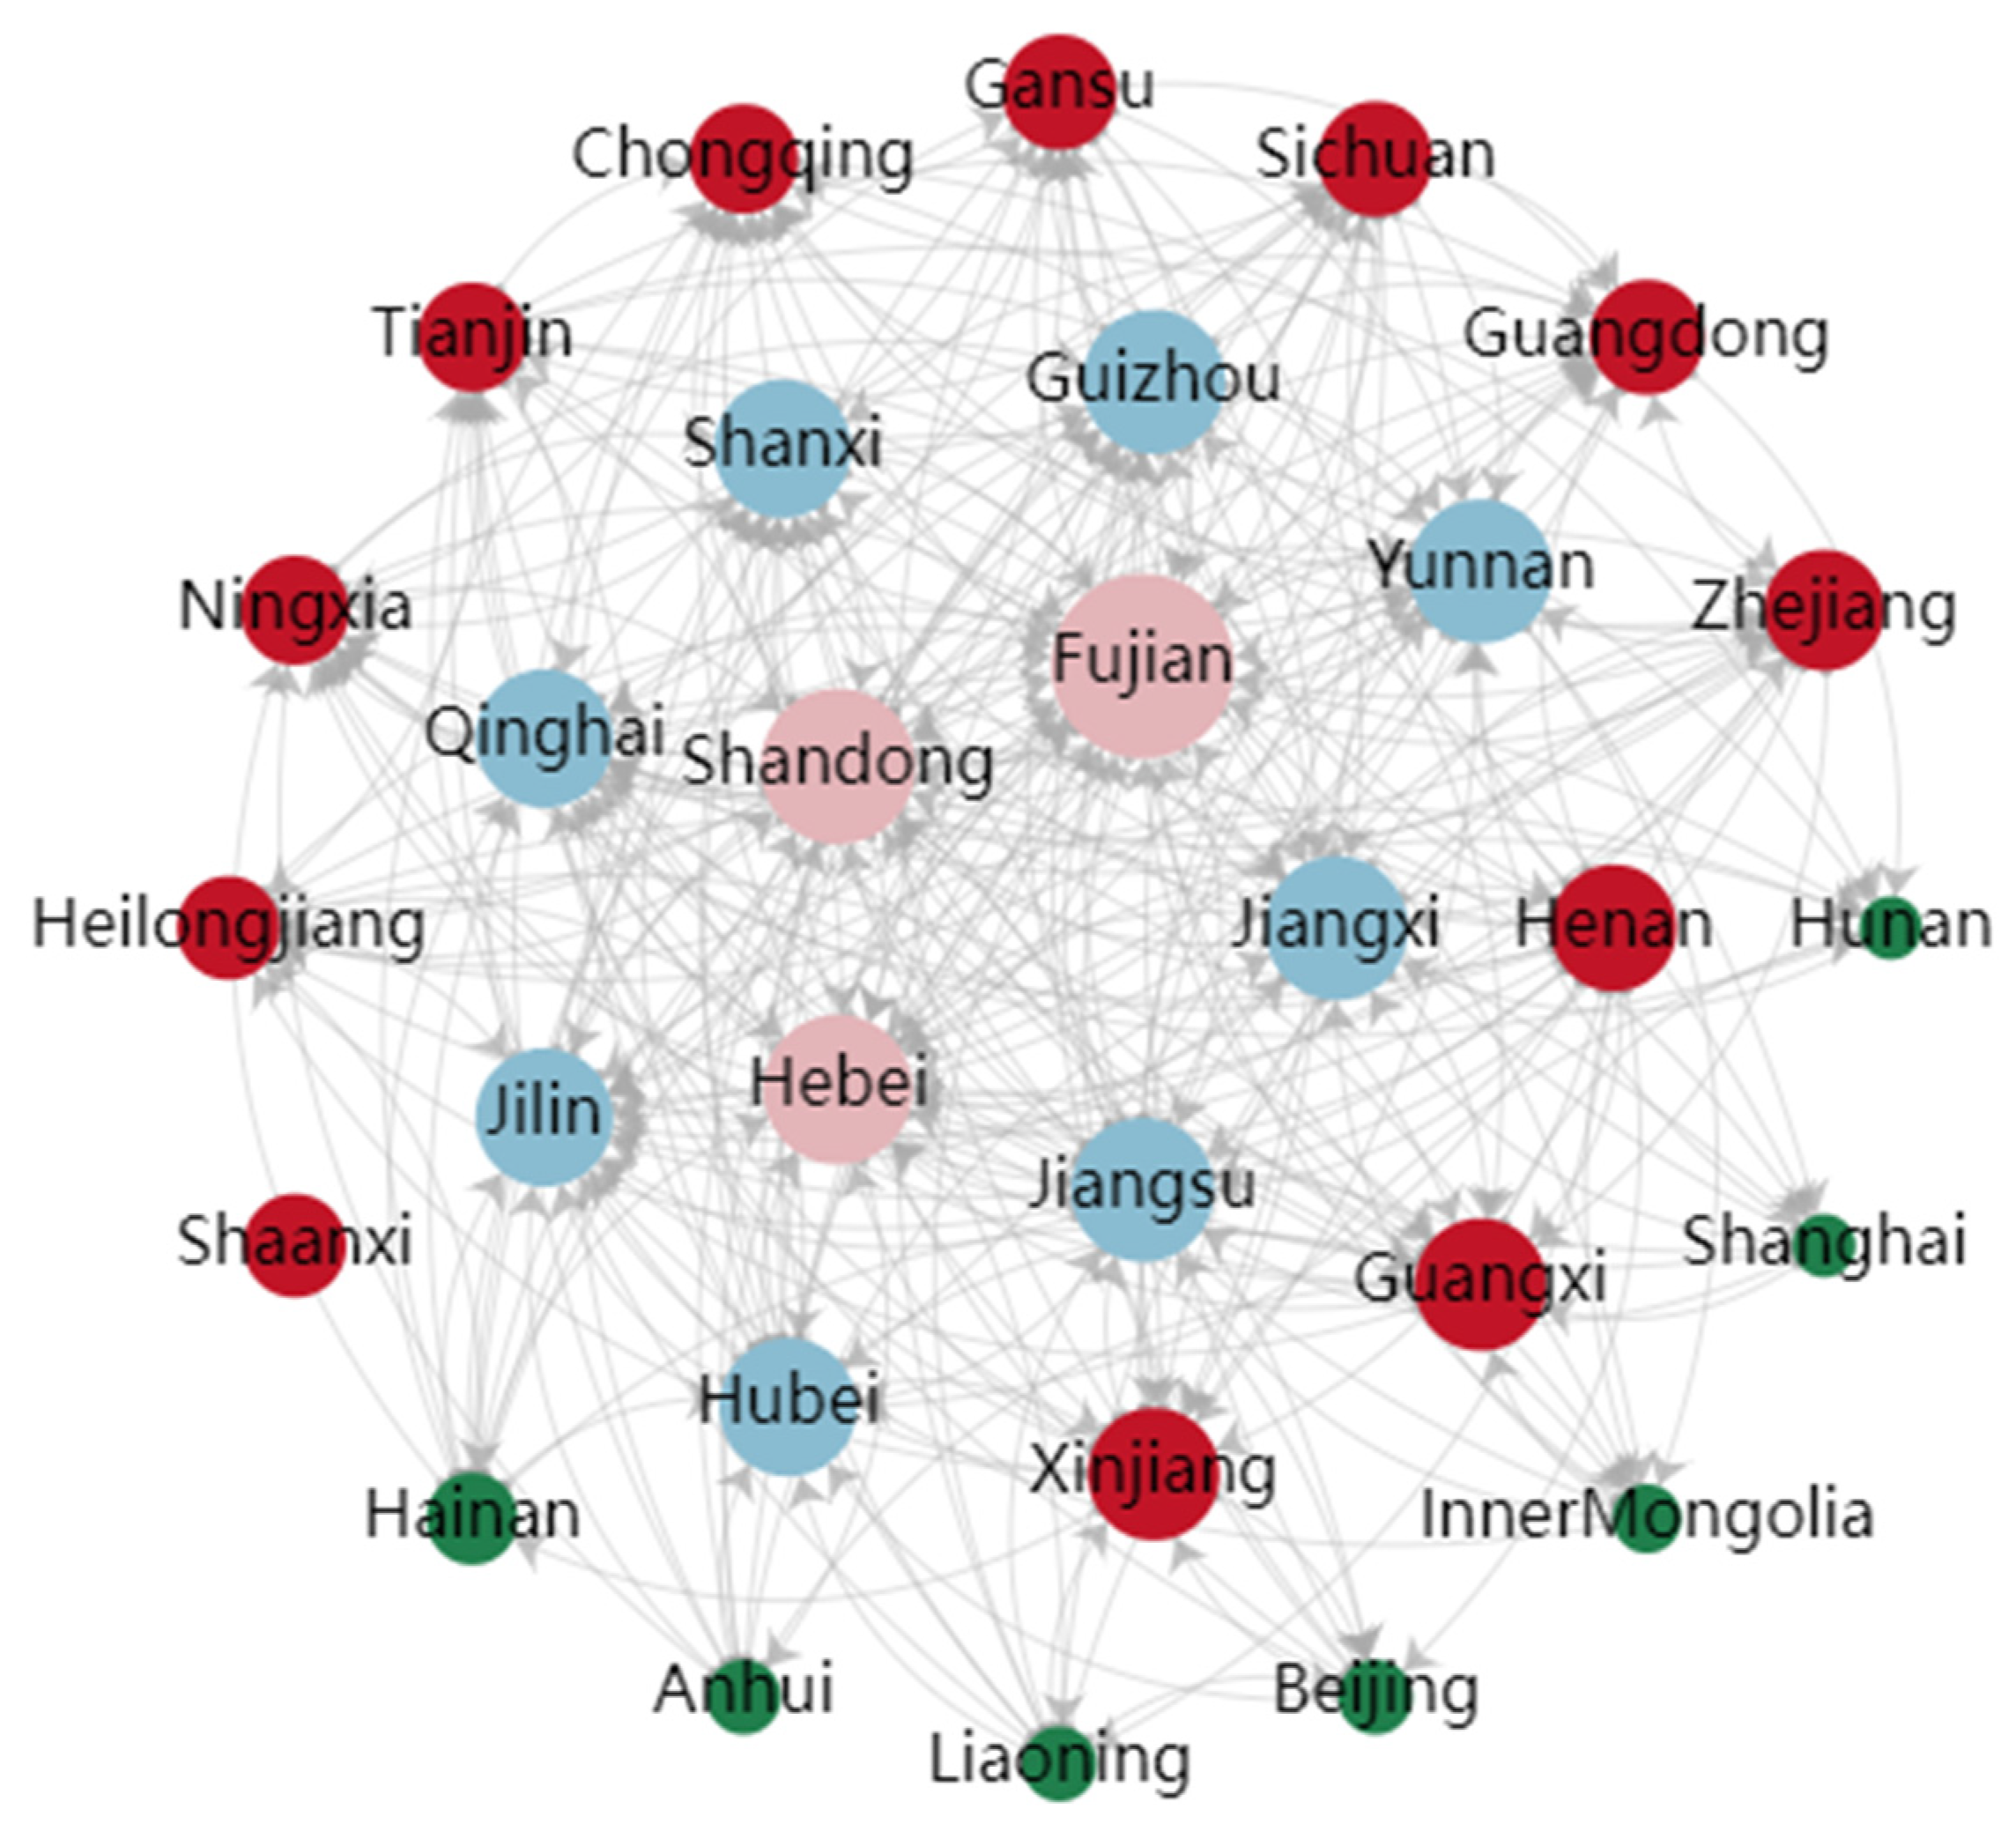
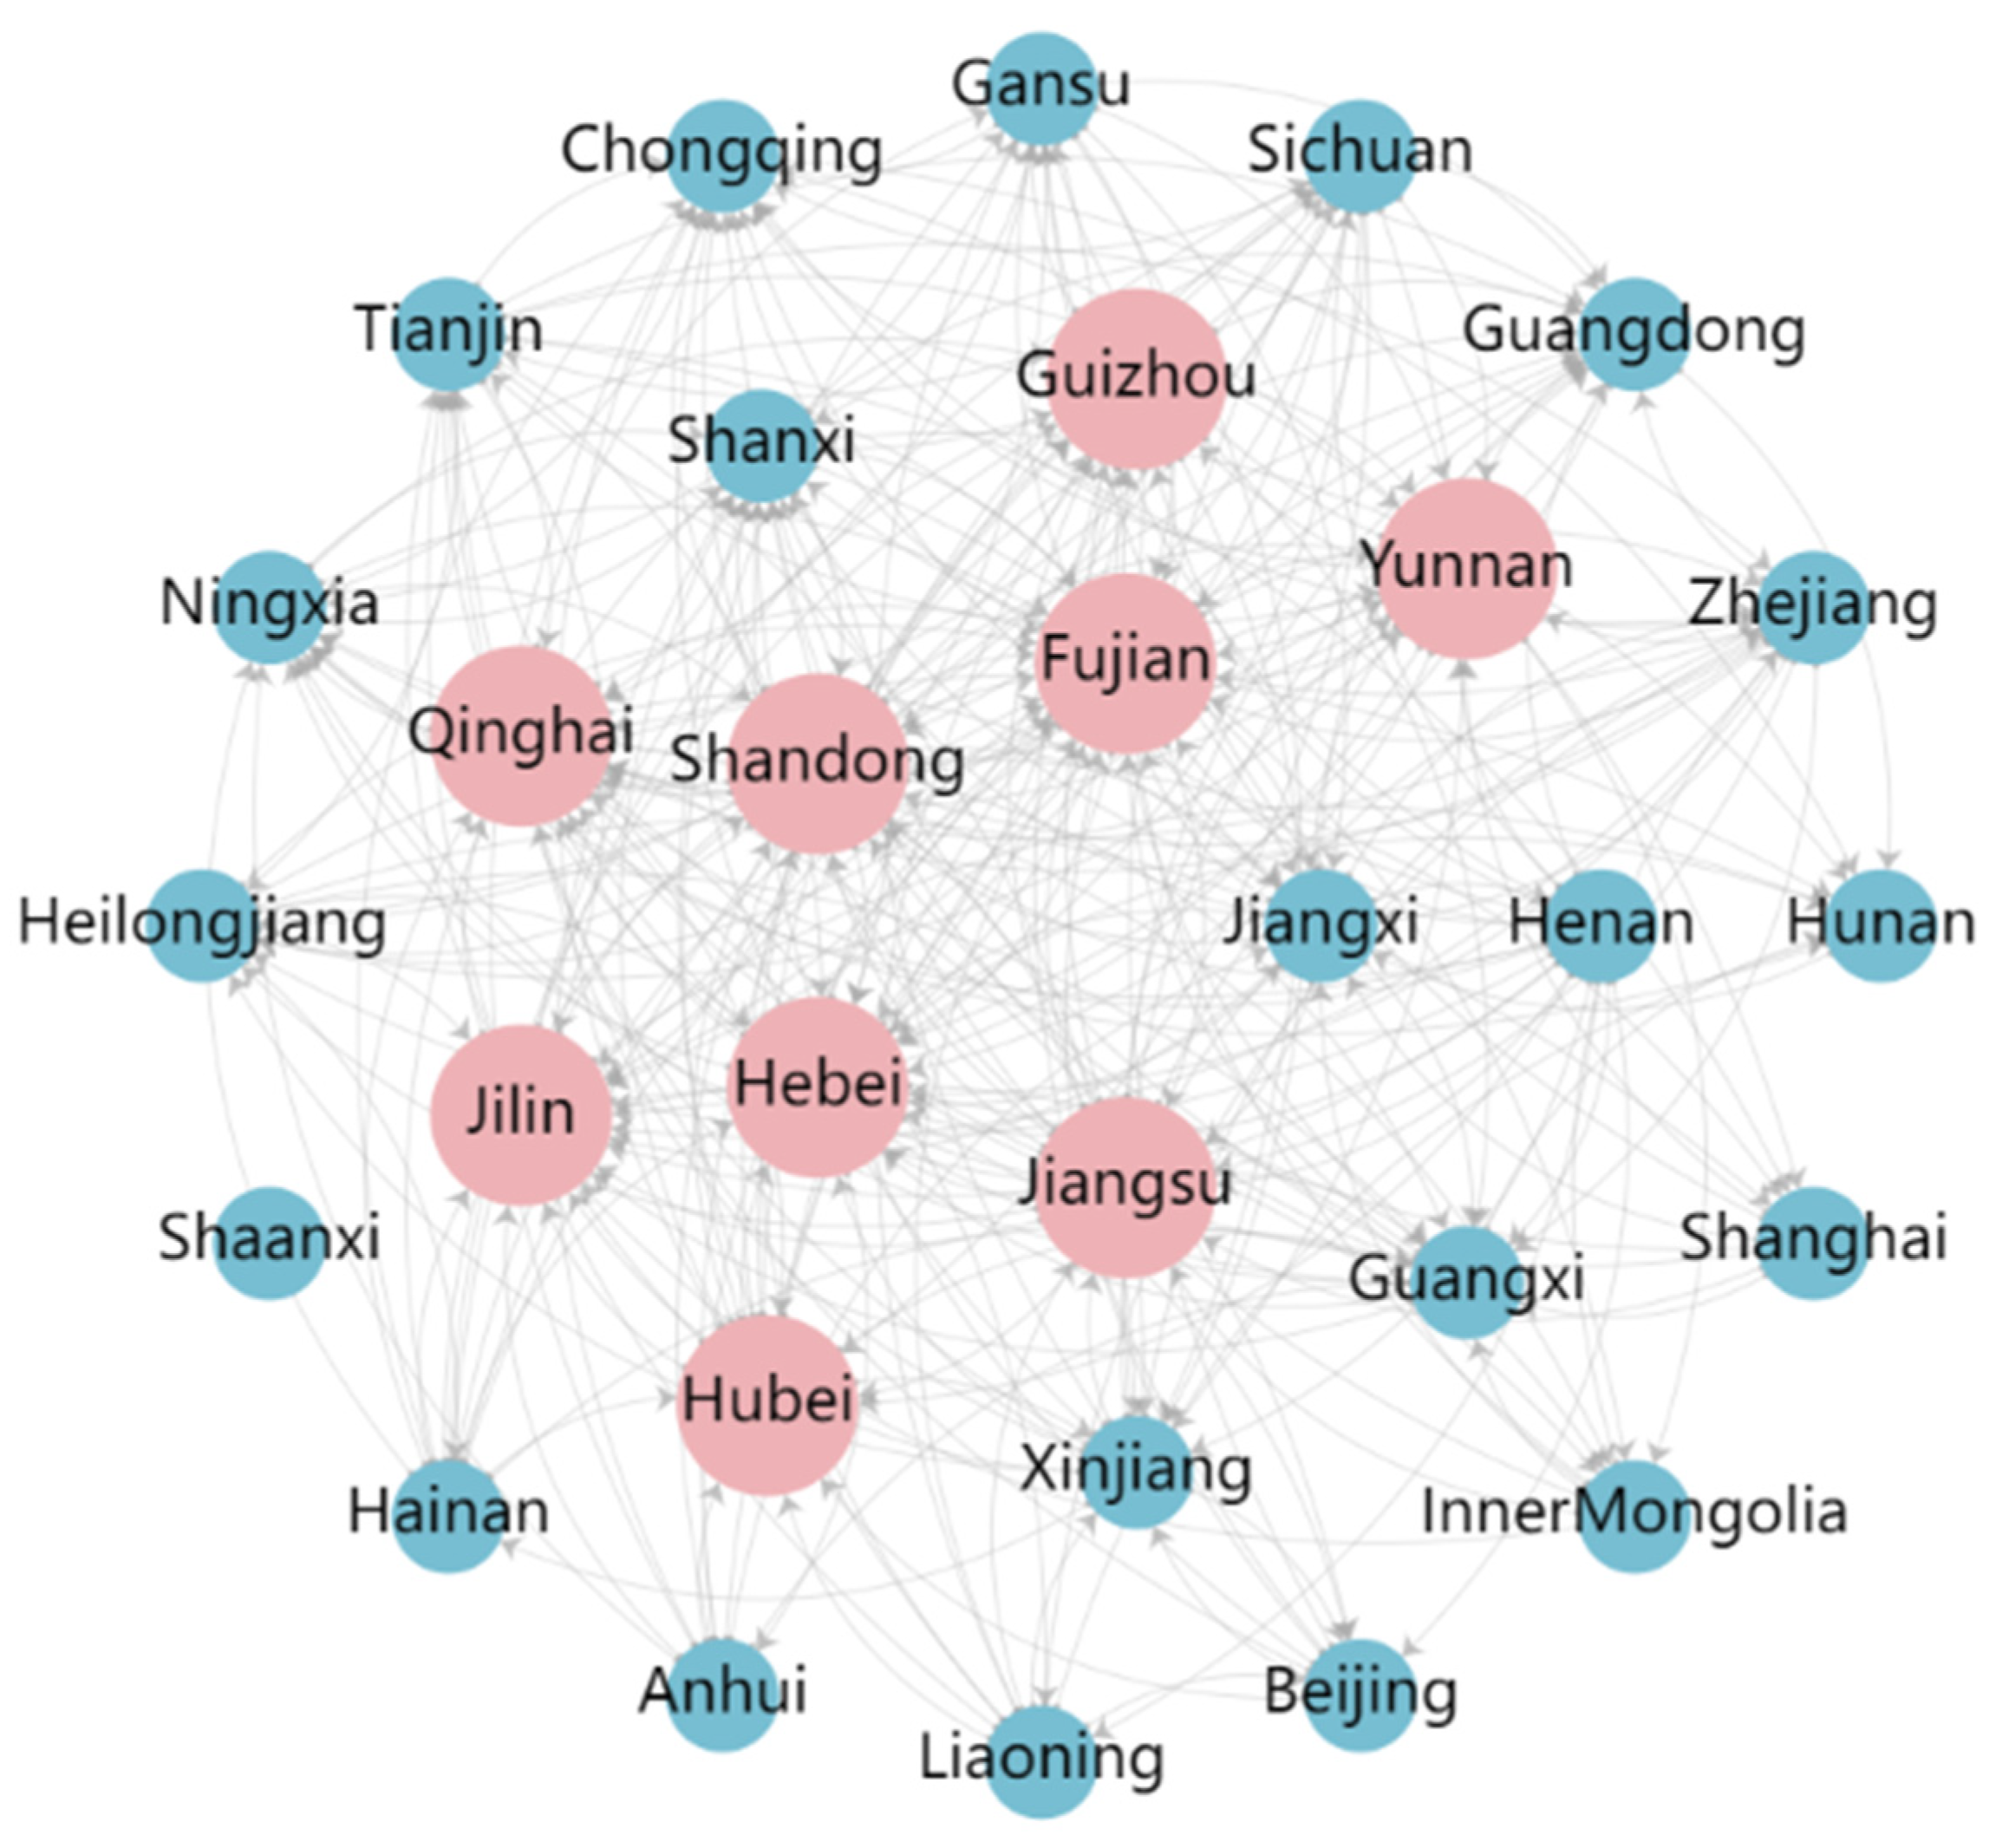
(3) There was a strong spatial correlation in provincial AWUE in China, presenting a typical network structure. It was necessary to manage water resources from a system and network perspective and improve coordinated agricultural water use efficiency.
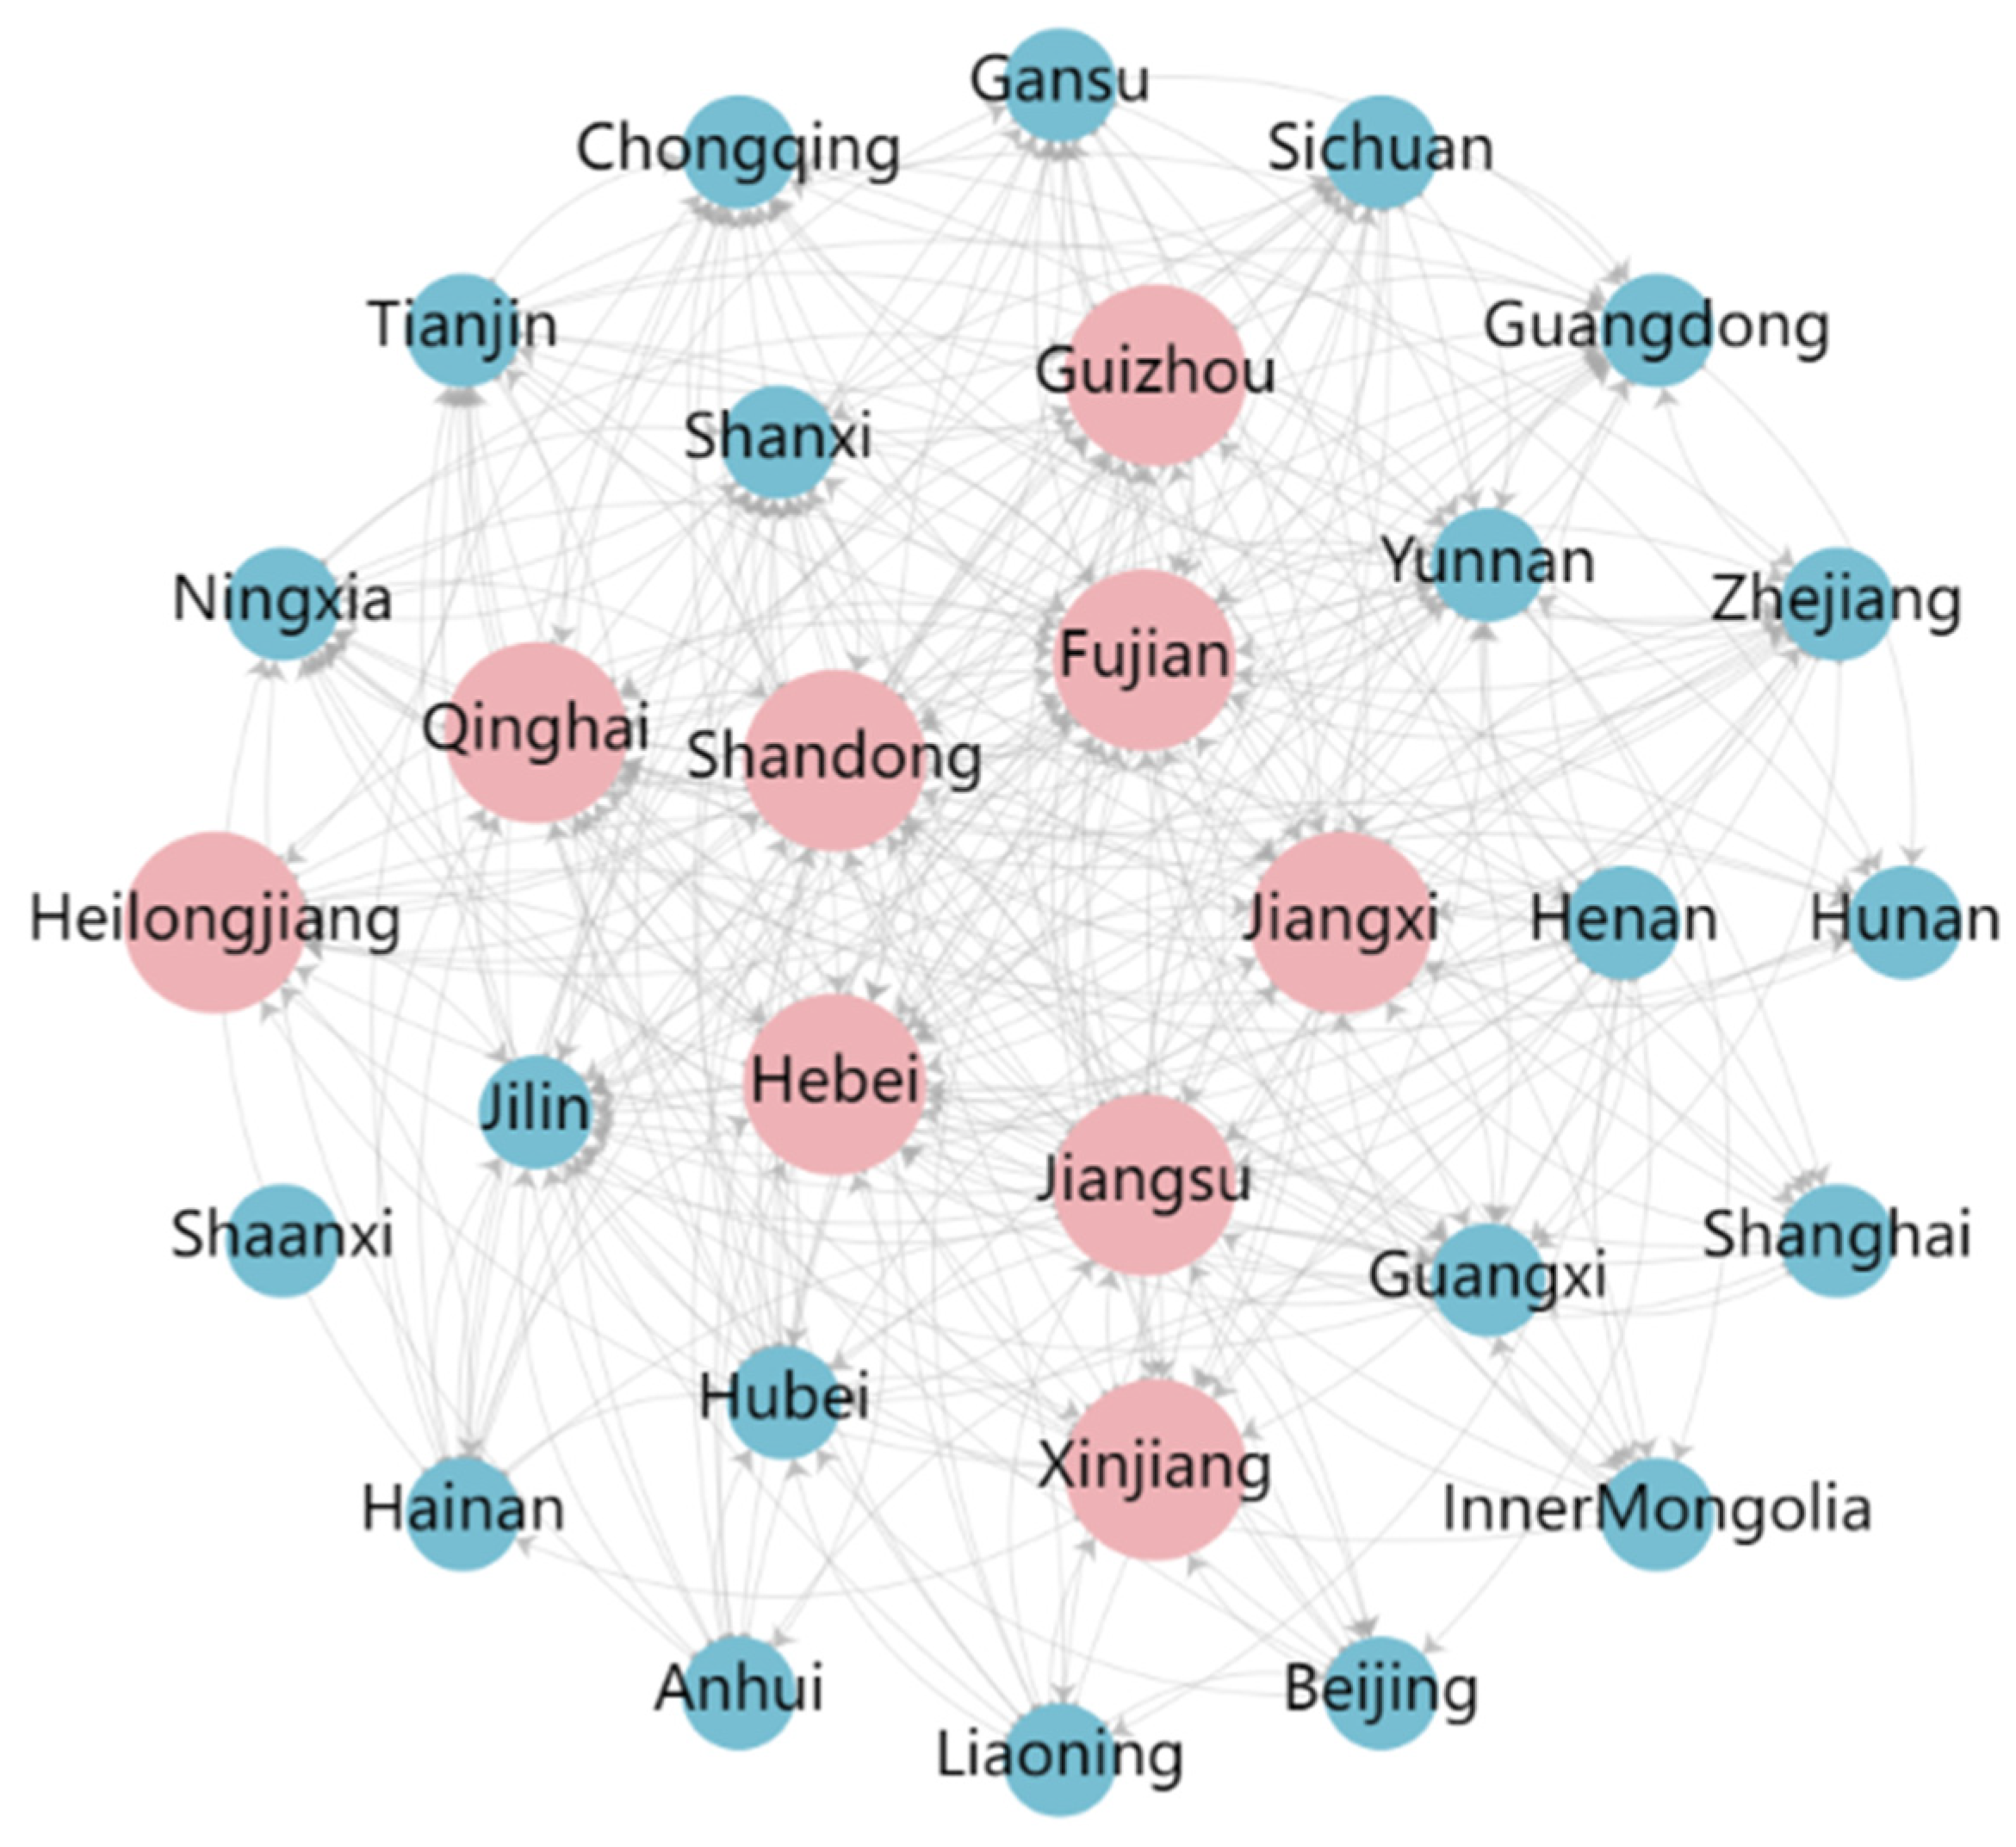
(4) Fujian, Hebei, Jiangsu, Jilin, Shandong, Hubei, Guizhou, Yunnan, and Qinghai had high centrality in the network. Improvement in AWUE should pay more attention to the province with high centrality in the network and promote the spillover effects of agricultural water utilization between different regions.
(5) The nodes and links in the network were highly concentrated in the net spillover block, bidirectional spillover block, and agent block. We should focus on the driving role of the net spillover block, which is the power source of the improvement in AWUE in the whole network. Moreover, it is needed to strengthen the transmission of the bidirectional spillover block and agent block to promote the coordinated development of AWUE.
Therefore, when formulating relevant measures and policies to improve agricultural water use efficiency, they must pay attention to the spatial correlation of water resource utilization in different provinces to promote the common improvement in water use efficiency in all provinces.


 ,
, 


