
Value and Quality in the Dialectics between Human and Urban Capital of the City Networks on the Land District Scale


Abstract
:1. Introduction
- Section 2 presents the case study, starting from an overview of the general status of the overall land district of Enna as a whole and an in-depth analysis of the main territorial, societal, economic etc. characteristics of the municipalities;
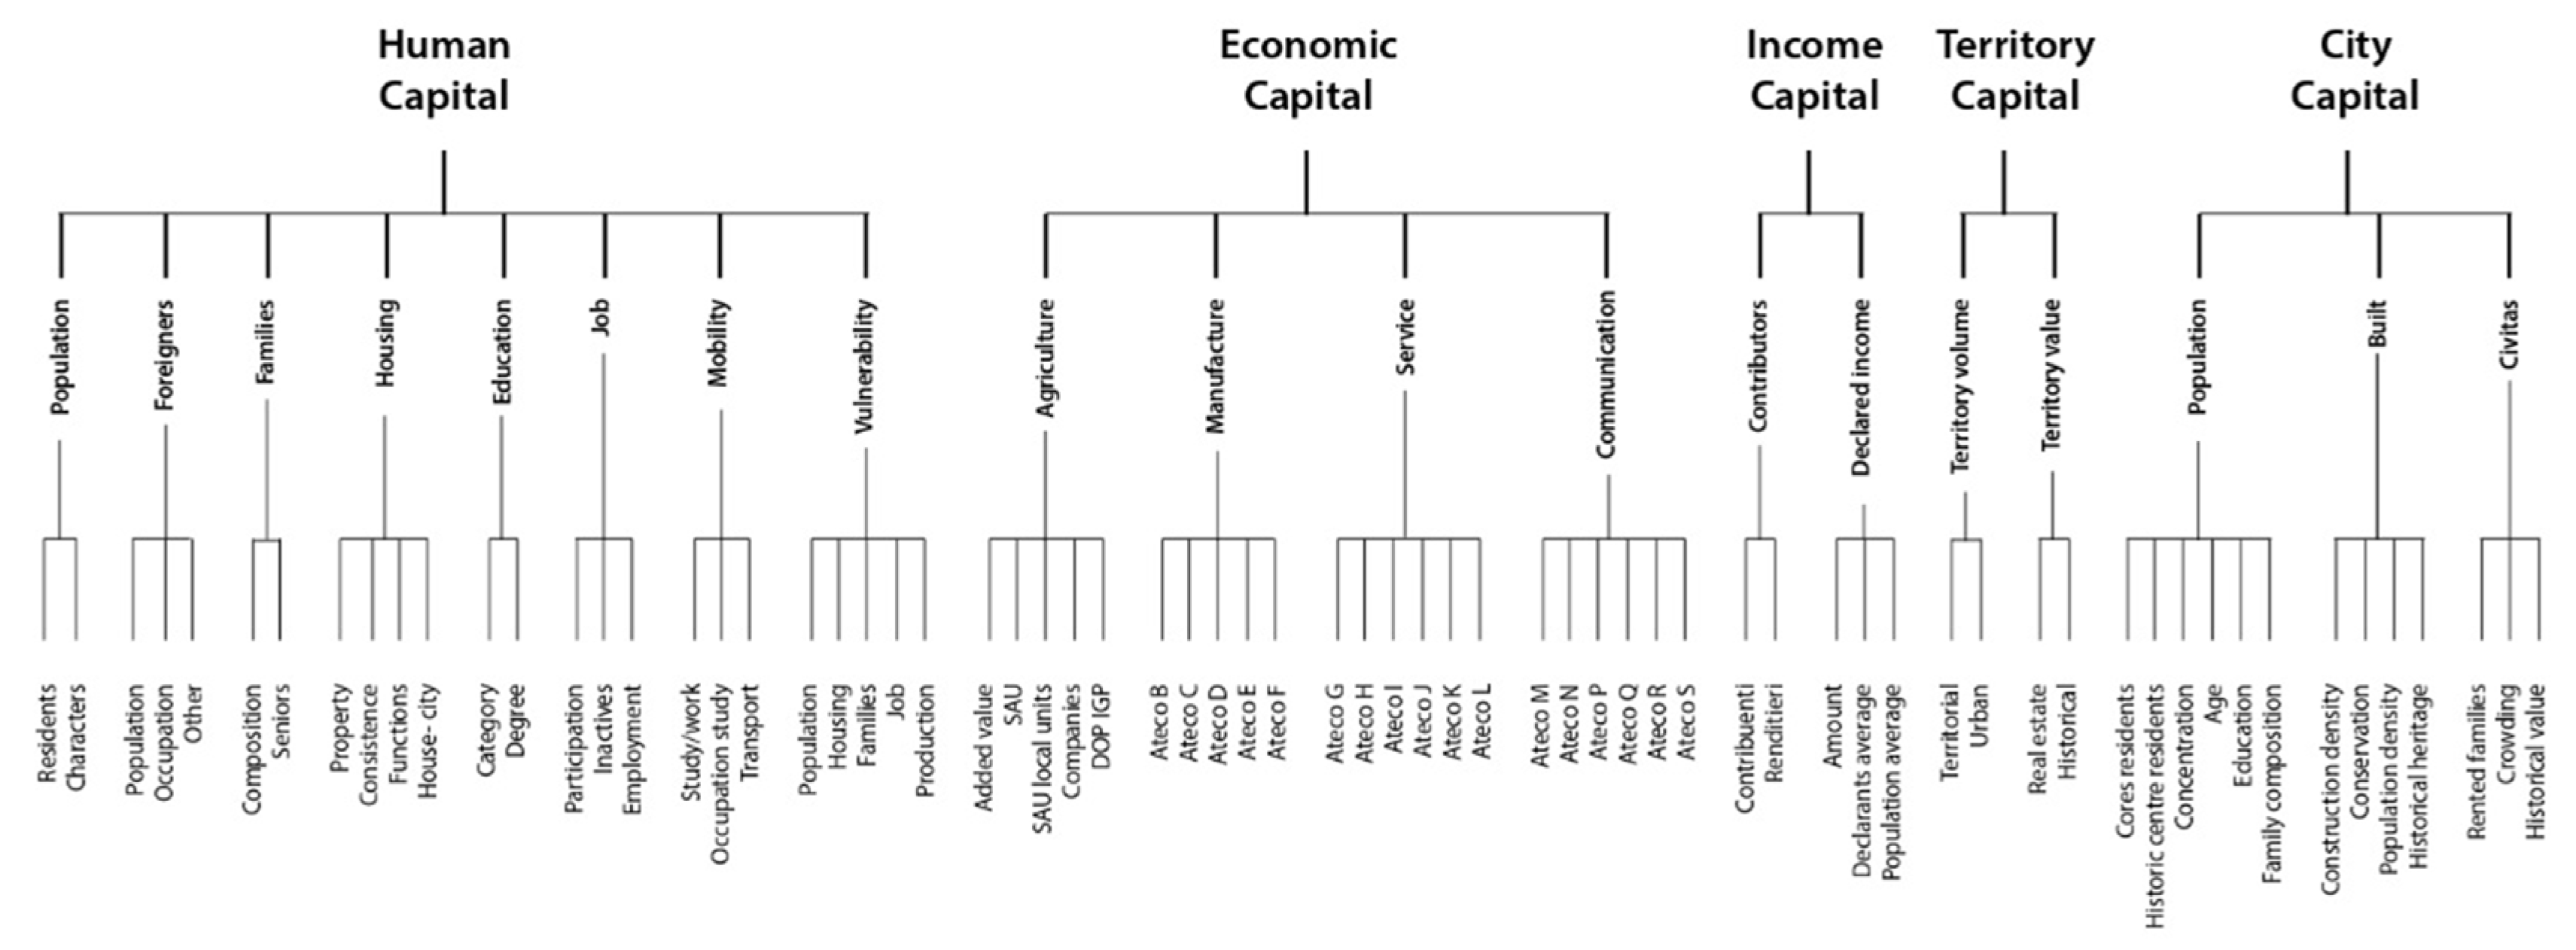
- Section 3 introduces the methodological approach, proposing a hierarchical multidimensional model coordinating the five forms of the social-territorial capital asset;
- Section 4 describes the application in its double articulation: firstly on the scale of the cities network, and secondly on the scale of the city-territory relationship;
2. Materials
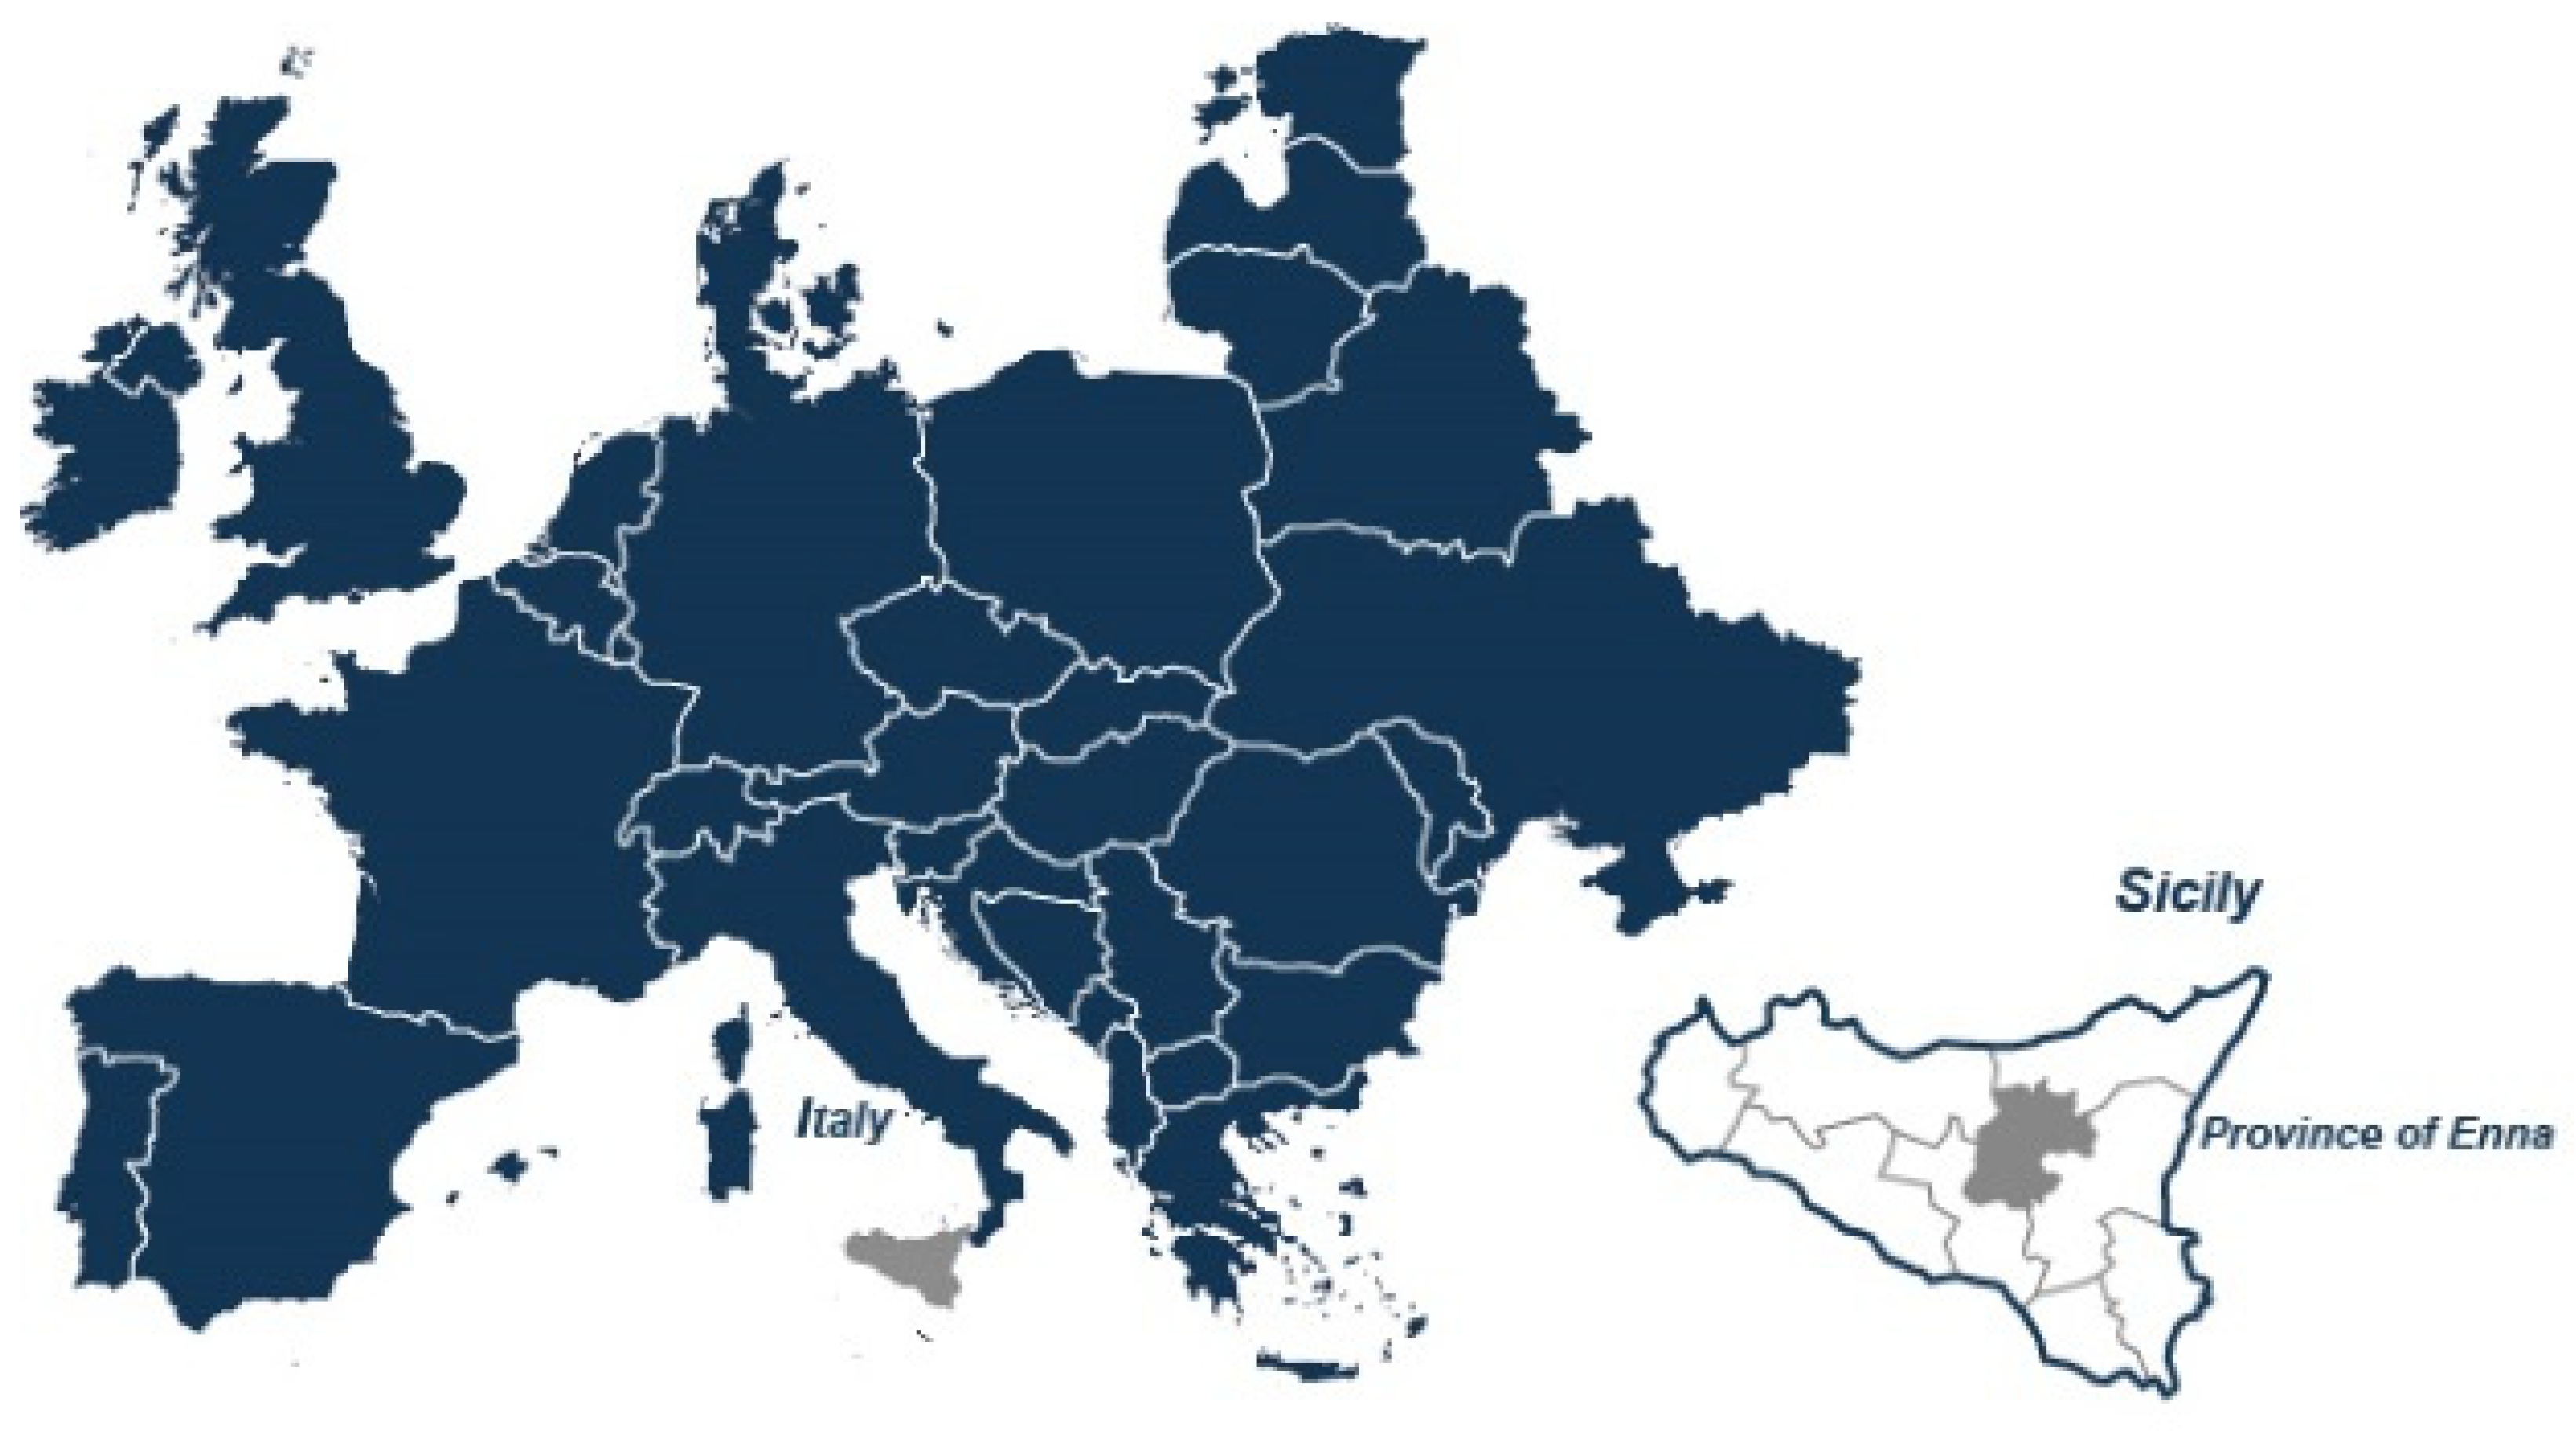
2.1. The Study Area: General Issues
2.2. Early Overview of The Data Source
- Complementary on the one hand, if the local inhabitants tend to move from CS to the more preferable life quality of the PA; in such a case, the discomfort attributable to the conditions of life in the HC as well as new opportunities in the PA converge, supporting an internal re-location pattern;
- Converging on the other hand, if the whole local and extra-local area is affected by a structural abandonment trend due to a deeper socio-economic discomfort, a general disaffection with traditional lifestyles, poor prospects for individual promotion and the desire for a relational space with a metropolitan imprint.
2.3. Territory and Vulnerability
2.4. The Forms of the Land Capital Asset
2.4.1. Human Capital Asset
2.4.2. Economic Capital Asset
2.4.3. Income Capital
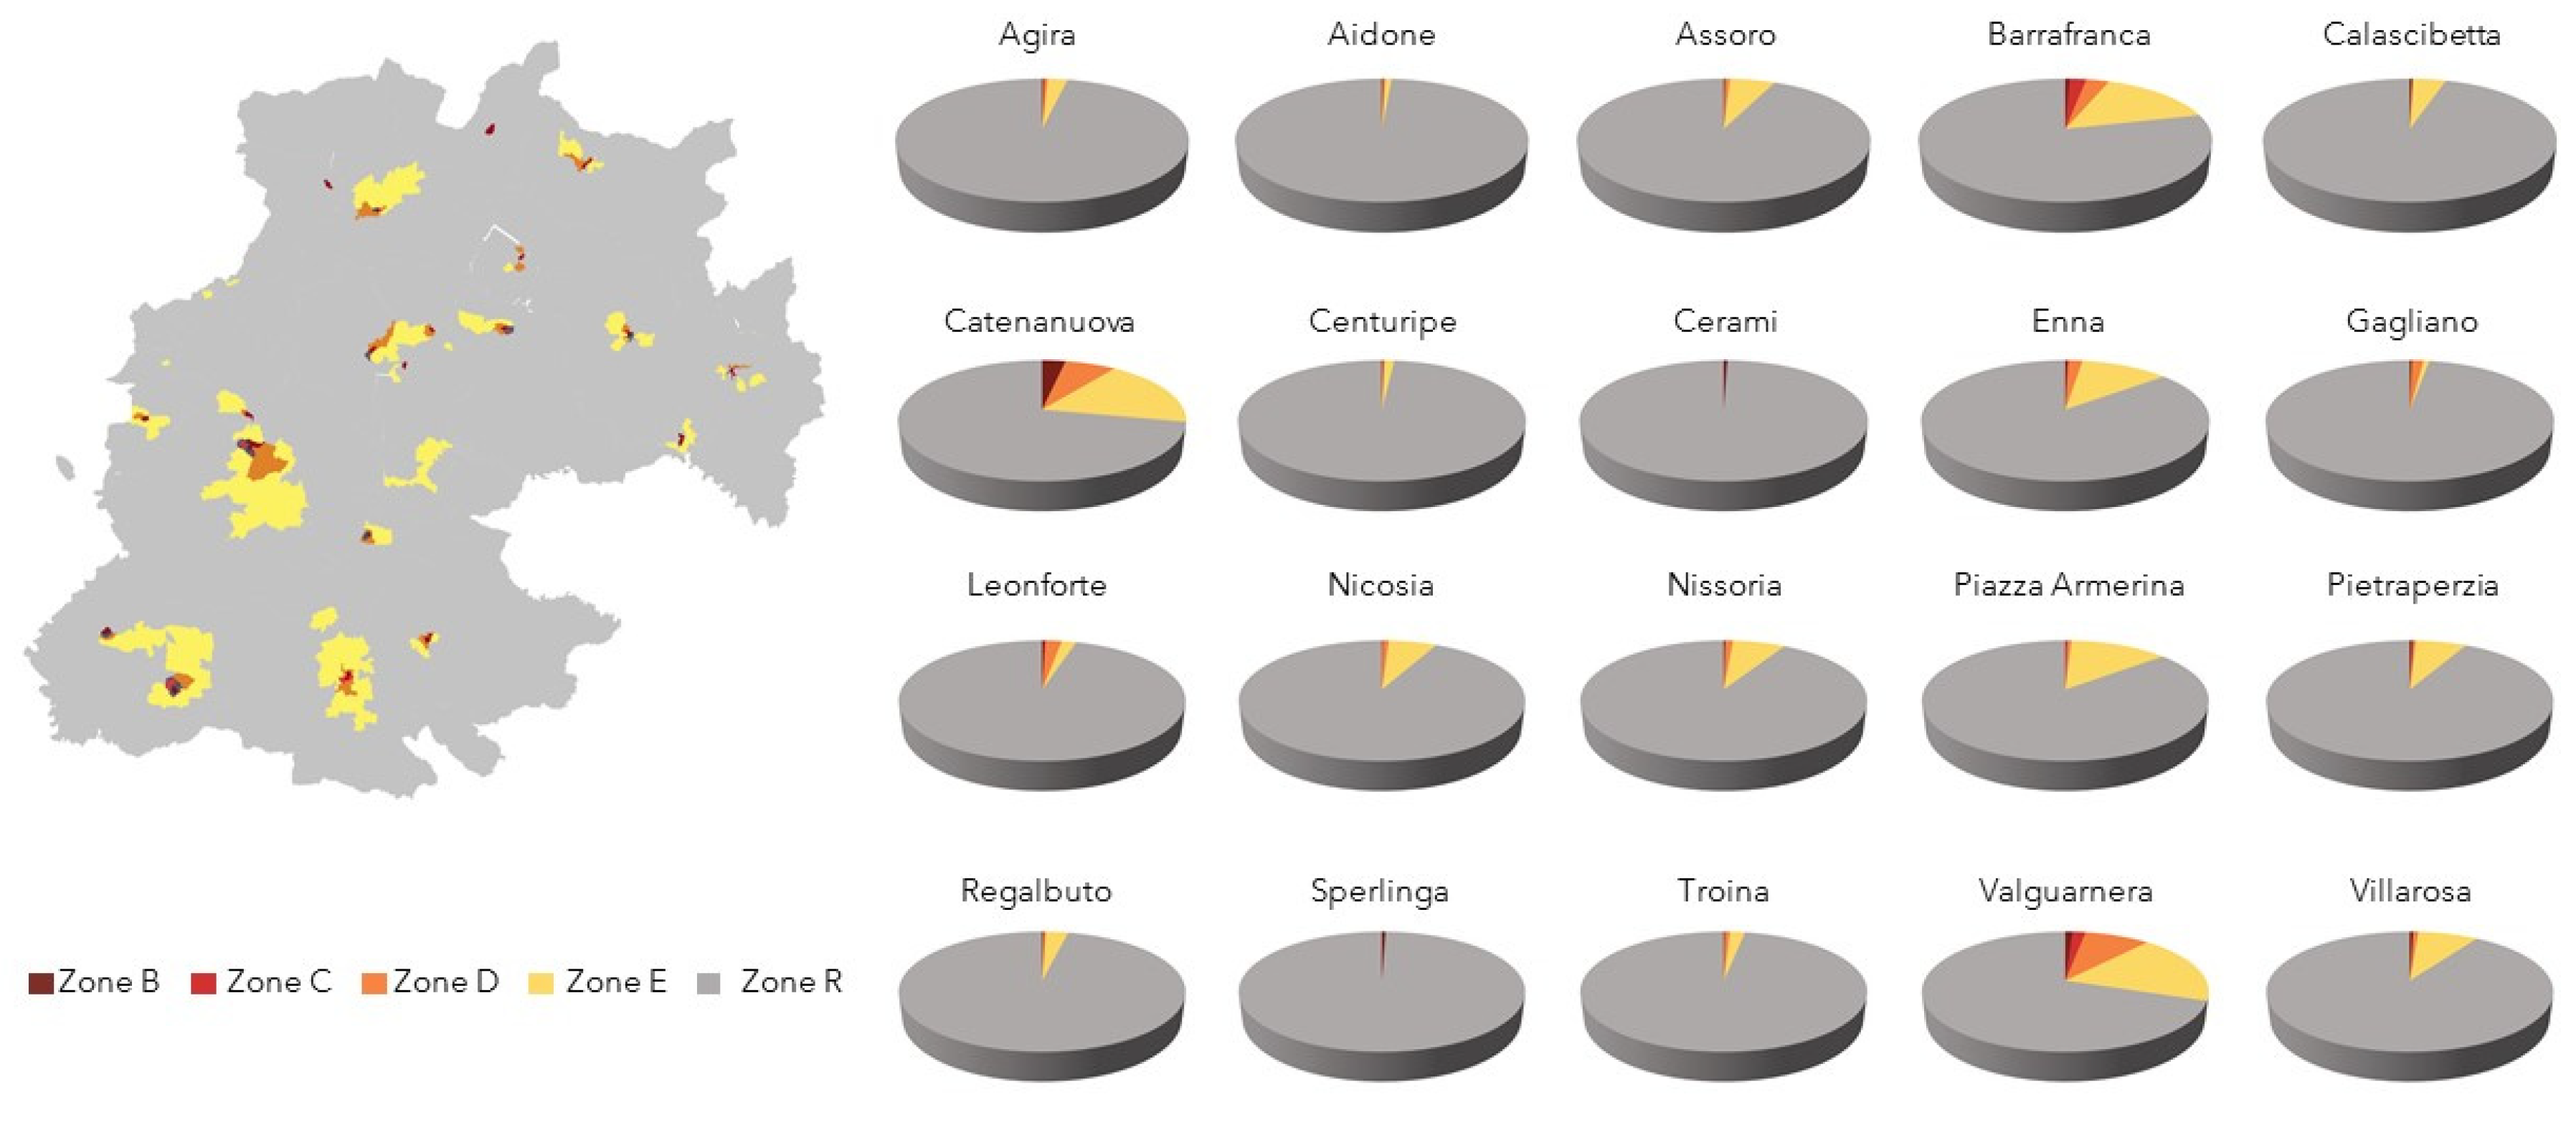
2.4.4. An In-Depth on Territorial Capital: The Real Estate Capital Asset
- Microzones: B, C, D, E, R;
- Typology: Civil dwellings, Economic dwellings, Boxes, Industrial warehouses, Typical warehouses, Laboratories, Warehouses, Shops, Offices, Structured offices, Villas and cottages;
- State of conservation
- Unit prices and rents;
- Minimum, average and maximum quotations returned with reference to the normal or excellent state of maintenance.
3. Methods
- The level of “raw data”, i.e., the measures of each phenomenon in itself ordered by groups;
- The level of “information”, connecting the elementary measures to the value of the territorial capital based on the form to which they refer.
- From top to bottom—through a process of progressive disaggregation of general forms of capital in terms of particular value—generates an orderly knowledge and places the detailed information term in a coherent taxonomy;
- From bottom to top, progressively turning indices into evaluations and aggregating [138] them into scores which step by step become more meaningful. The descriptive model turns data into information.
- Aggregation by groups does not identify any relationship between the indices other than by nature (population, work, housing, income, real estate values); these indices, taken individually, have a quantitative significance at a low informative level. Many of them use others of the same group and therefore not all of them are independent from each other; consequently, the significance of their simple aggregation by weighted averages could be affected by the “weight” they assume, as they are also indirectly involved in the formation of other indices.
- The nature of the data, and therefore the contents of the measures;
- The unit of measurement;
- The reference, i.e., if it concerns:
- -
- “stocks”, i.e., indices in a broad sense, i.e., absolute magnitudes (territorial surface, resident population, number of employees, total income);
- -
- “ratios”, i.e., indices in the proper sense, quantities referring to a specific delimitation;
- -
- “temporal values”, i.e., stocks or relationships referring to a specific period;
- -
- “monetary values”, different from the previous ones as abstract entities, ultimate consequences of concrete circumstances—the corresponding socio-economic drivers—and furthermore capable in turn of influencing the same premises, therefore of retroacting the causes.
- In itself, if it refers to the same index characterizing the other study units;
- Beyond itself, if referred to other indices, therefore having relevance with respect to the other study units, but by means of a multiplicity of attributes.
- The first one normalizes the different measures in an interval of scores defined between 0 and 2; in this case, 0 refers to the lowest value, and 2 to the highest recorded among the different study units, the municipalities; the defect of this representation consists in not taking into account the effects of the distribution of the measurements among the study units;
- The second, also linear, called “normalization Z” or “standardization”, is a procedure “which leads a random variable distributed according to a mean μ and variance σ2, to a random variable with a “standard” distribution, i.e., a mean zero and variance equal to 1”. Consequently, the minimum and maximum values, respectively negative and positive, are not fixed as in the previous case, but only the average one (0);
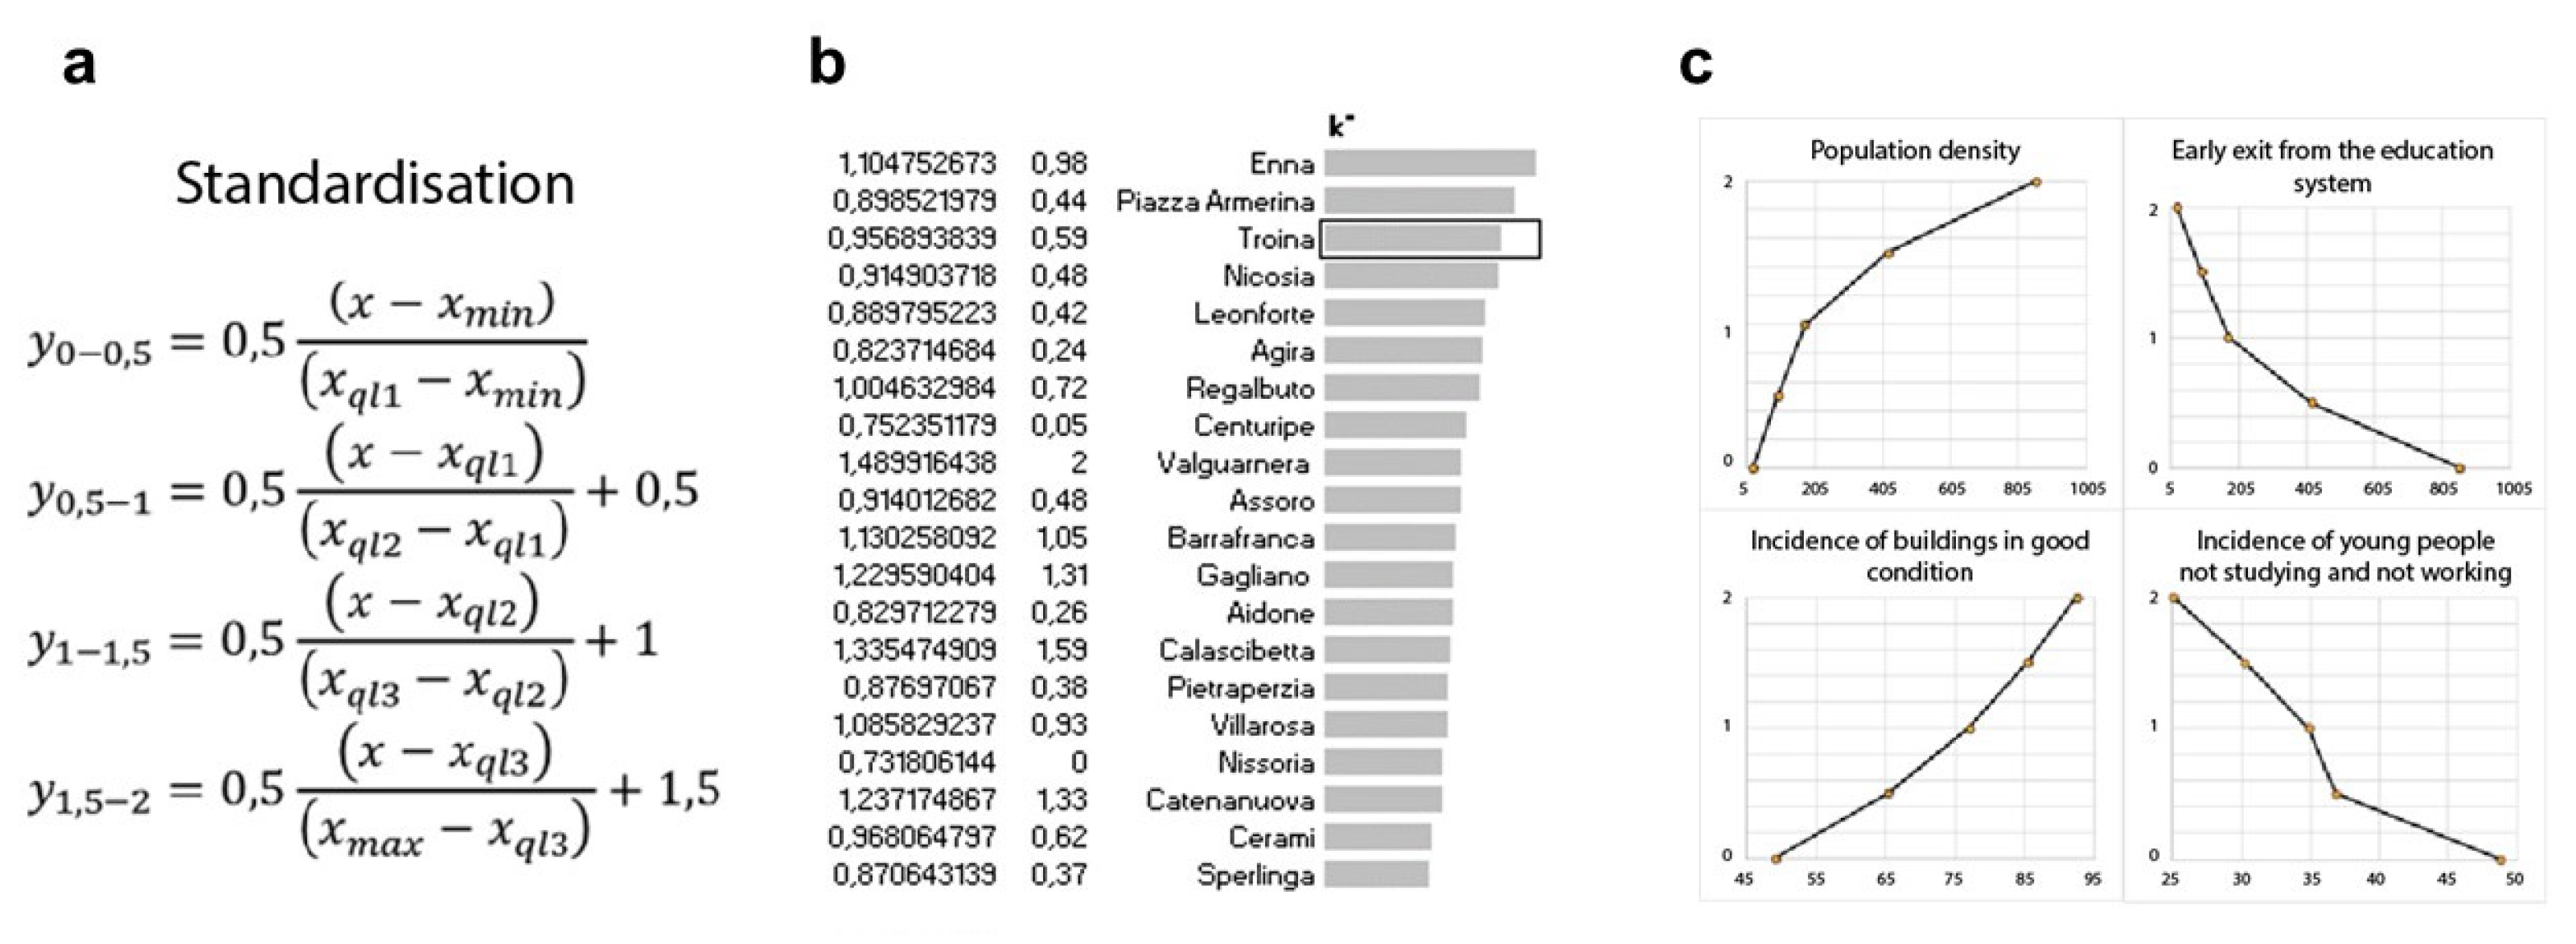
- The third normalizes the different measures in an interval of scores defined in this case, as in the first one, defined between 0 and 2, but according to a polylinear relation, according to which the score varies within intervals defined by five thresholds referred case by case to the values of the indices recorded for all municipalities:
- 0.0 is associated with the minimum value;
- 0.5 is associated with the value of the first quartile;
- 1.0 is associated with the value of the second quartile (median);
- 1.5 is associated with the value of the third quartile;
- 2.0 is associated with the maximum value.
3.1. Cardinal Approach
- Definition and structuring of the main objectives and associated criteria;
- Identification of alternatives;
- Attribution of scores to each alternative from the point of view of each criterion;
- Modelling of preferences and evaluation of substitution ratios (trade-off): elicitation of the value functions associated with each criterion and attribution of weighting factors;
- Ordering of alternatives: an aggregate score is calculated for each alternative.
- Representation of the identities of the main study units, i.e., the municipalities, instead of alternatives;
- Arrangement of the criteria dendrogram, having as root criteria the five forms of capital: Human, Economic, Territorial, Income, City, and as leaf criteria the indices coming from the different sources, connected at the root by their specifications (branches) consistent with the aforementioned forms of capital;
- Attribution of the leaf scores to each territorial unit by means of the polarized polylinear normalization of the indices referring to their variation ranges of these within the municipal territory, by means of comparison with the values of all municipalities of the entire provincial territory;
- Attribution of the weighting factors to the root criteria;
- Calculation of the scores at the level of the root-criteria by aggregation of the leaf-points;
- Calculation of the overall score attributed to each municipality by aggregation of the scores attributed at the level of the root criteria;
- Ordering of the territorial units based on the overall score attributed with the scalar product between the vector of the aggregated scores and the vector of weights: a total score is calculated for each alternative by means of the overall score.
3.2. Ordinal Approach
4. Application and Results
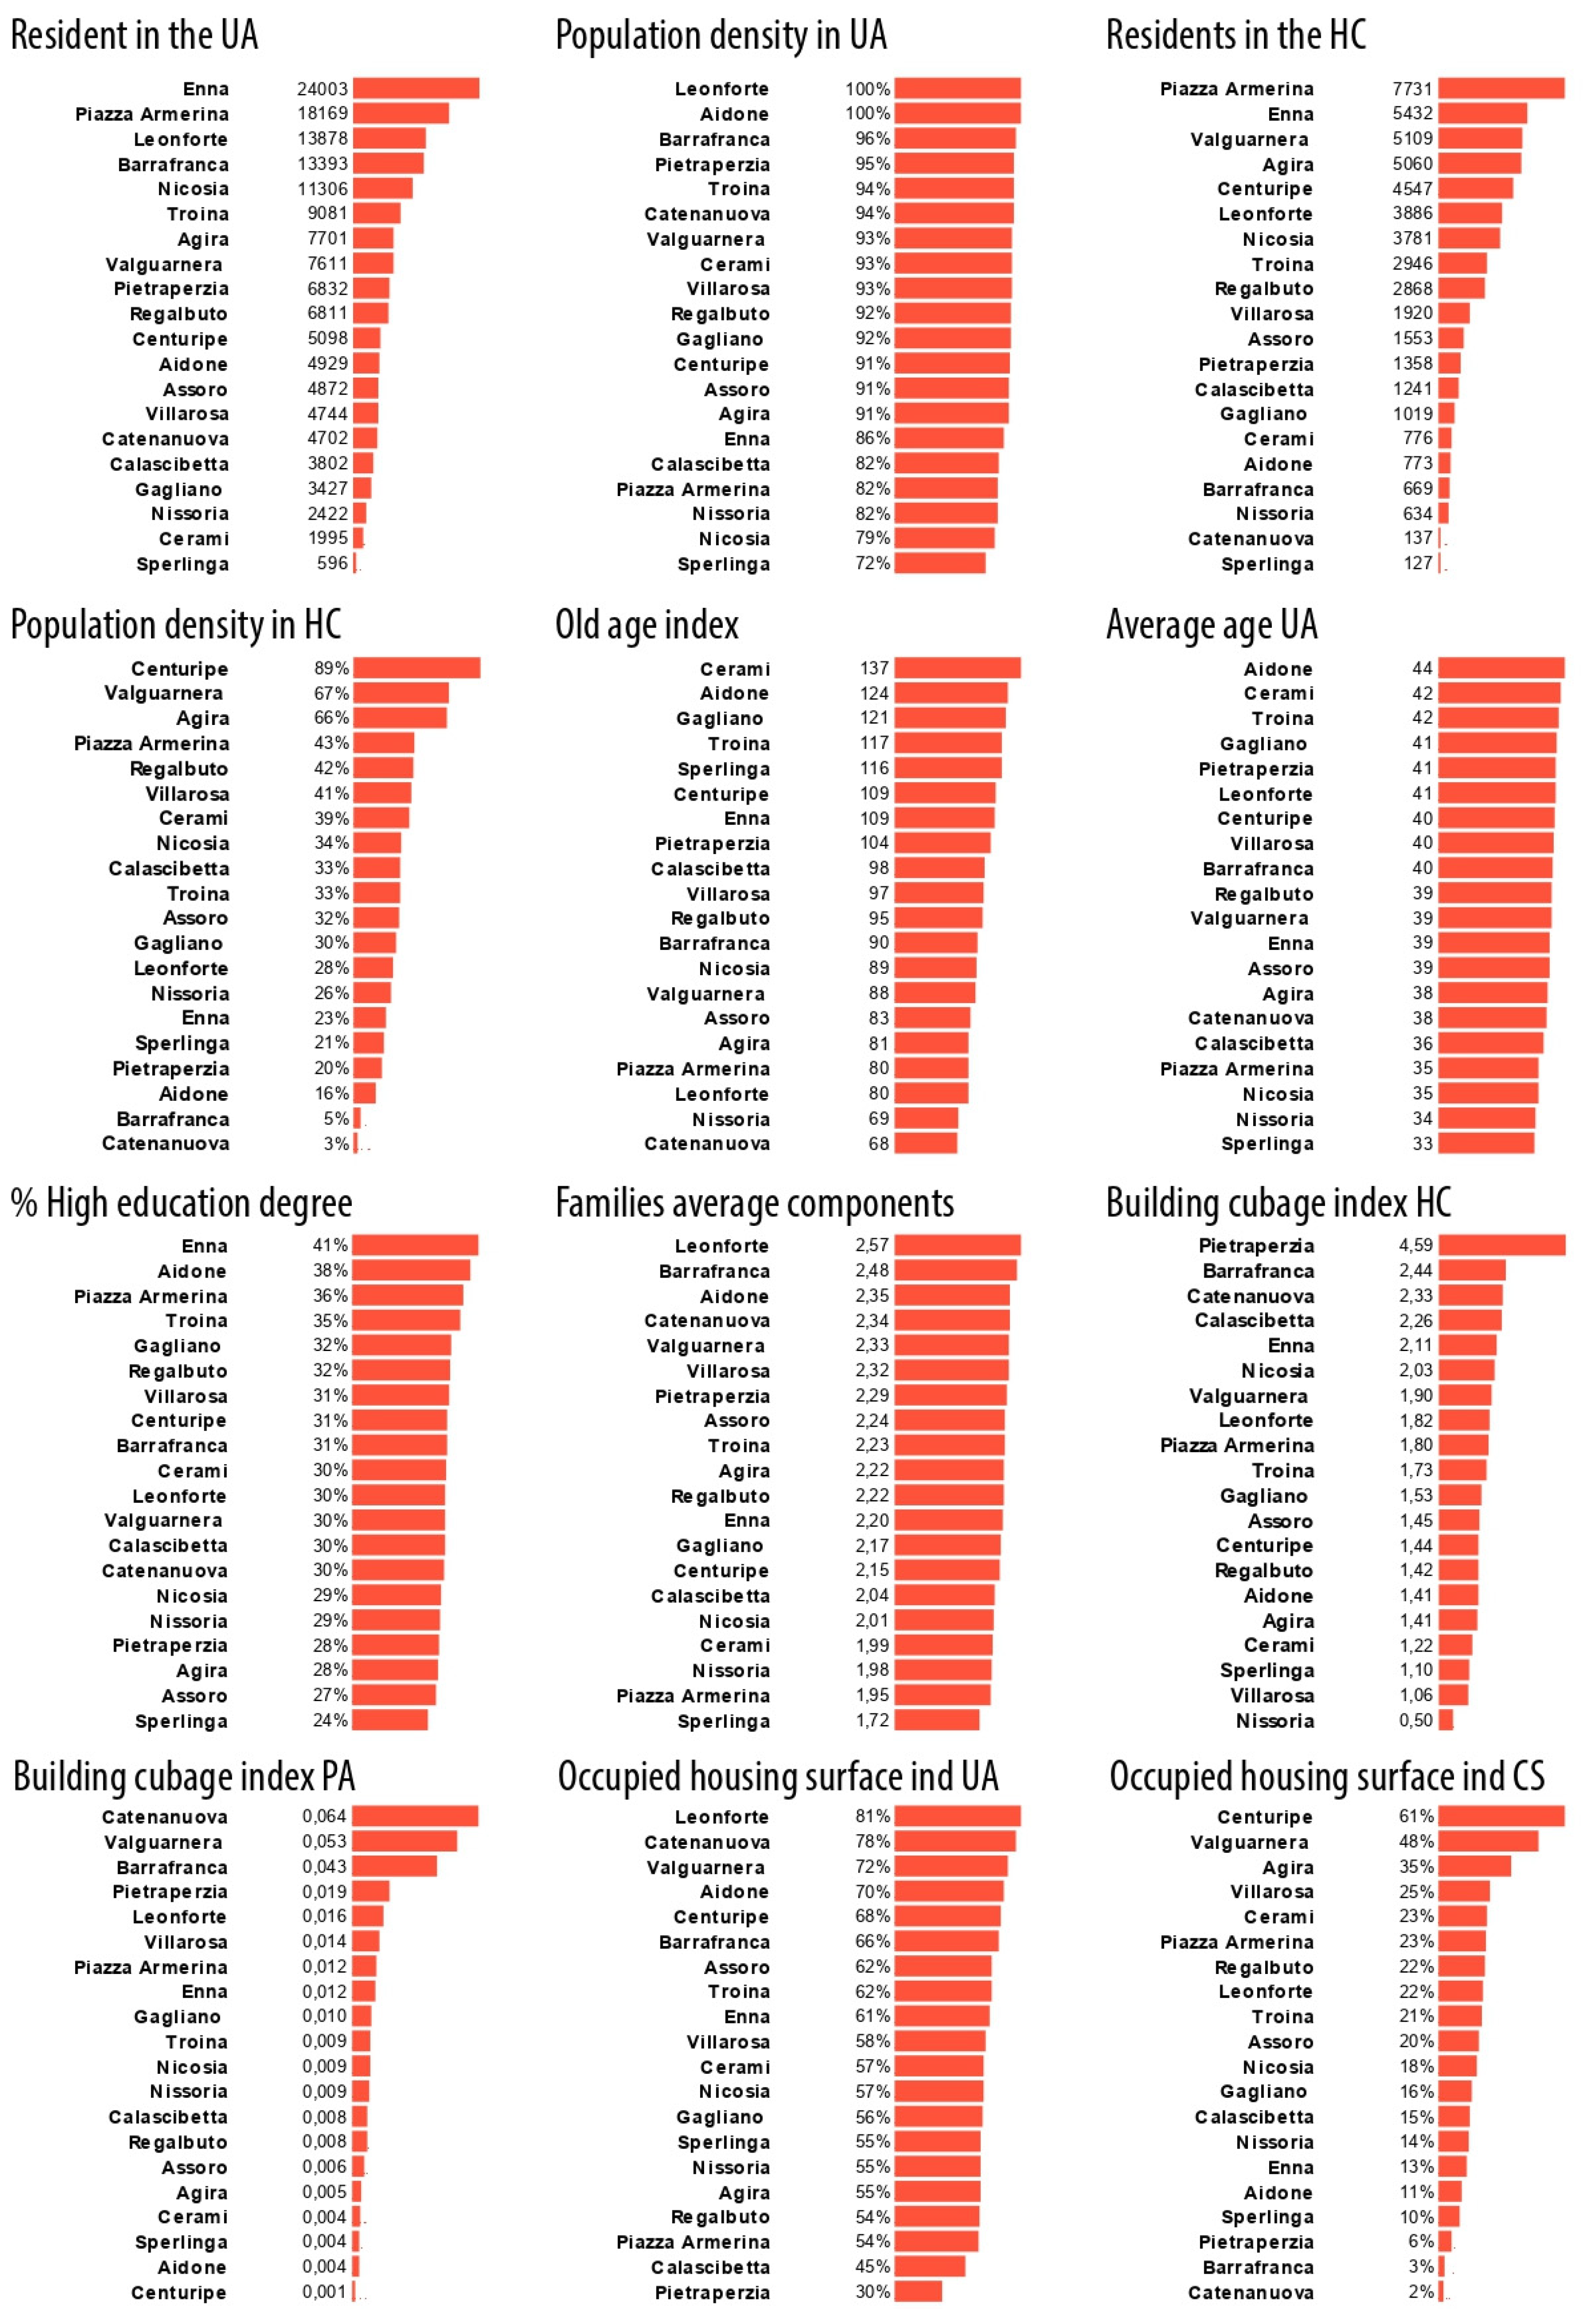
4.1. Urban Network Quality Indices of the Civil Capital
- The latter form of Share Capital includes clusters of indices referable to the population (Human Capital), the buildings—the housing complex only (Urban Capital)-, and finally the relationship between these two entities (Civil Capital).
- The Human Capital includes aspects of the entity, concentration and qualification (Age, Education, Composition of families) of the residents, distinguished by:
- -
- Residents in the Historic Center;
- -
- Residents in Urban Areas;
- -
- Residents in the remaining part of the municipality;
- The Urban Capital, with reference to the size, density, state of conservation, population density and age of:
- -
- Urban nuclei;
- -
- Historic centers;
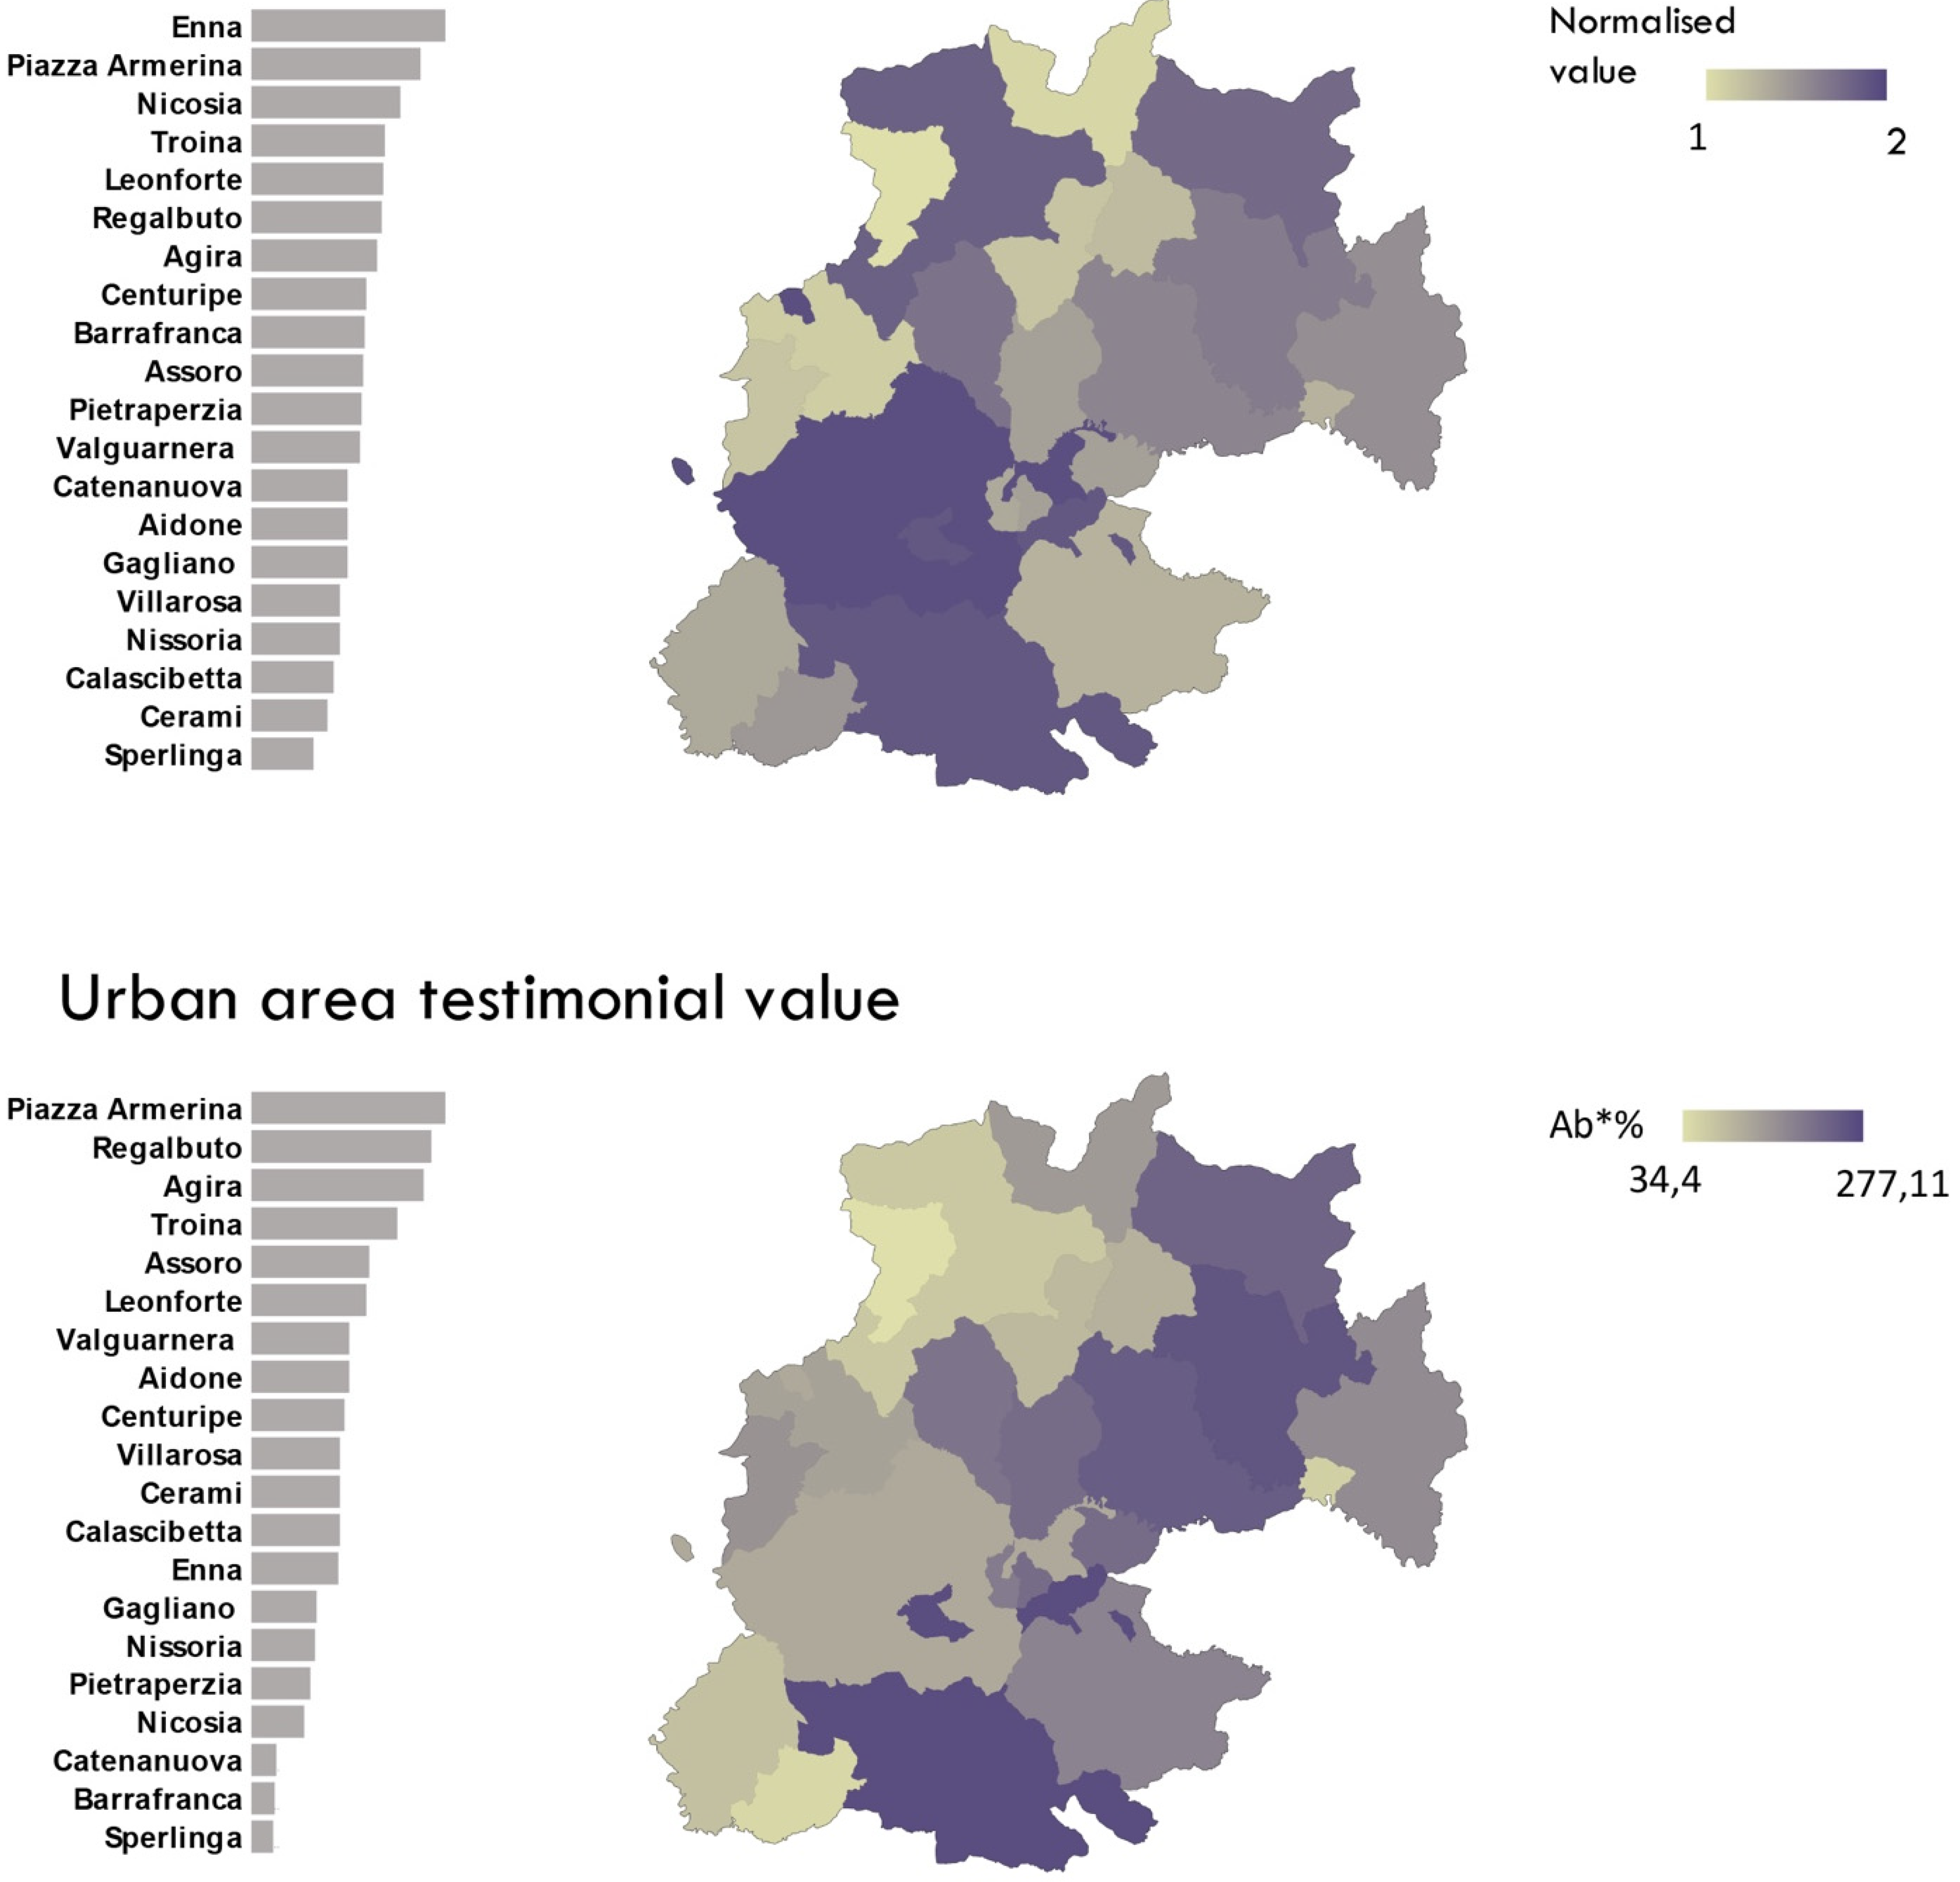
- The Civil Capital, with reference to the ownership of houses, to the degree of crowding and to the testimonial value, that is, to the degree of preference of location in:
- -
- Urban Areas;
- -
- Historic Centers
- The calculated indices have been listed as follows:
- IV1—Old age index 1—is the ratio between +65-years-old and -20years-old residents. IV1 is also calculated for the UA only;
- EM—Average age—is the weighted average of each age group (terms) based on the number of residents (weights), divided by the total number of resident;
- CMf—Average composition of families—is the weighted average of the members (1,2, …, 6 and more) of households (terms) based on the number of families in each section (weights), divided by the number of families of each Census Section;
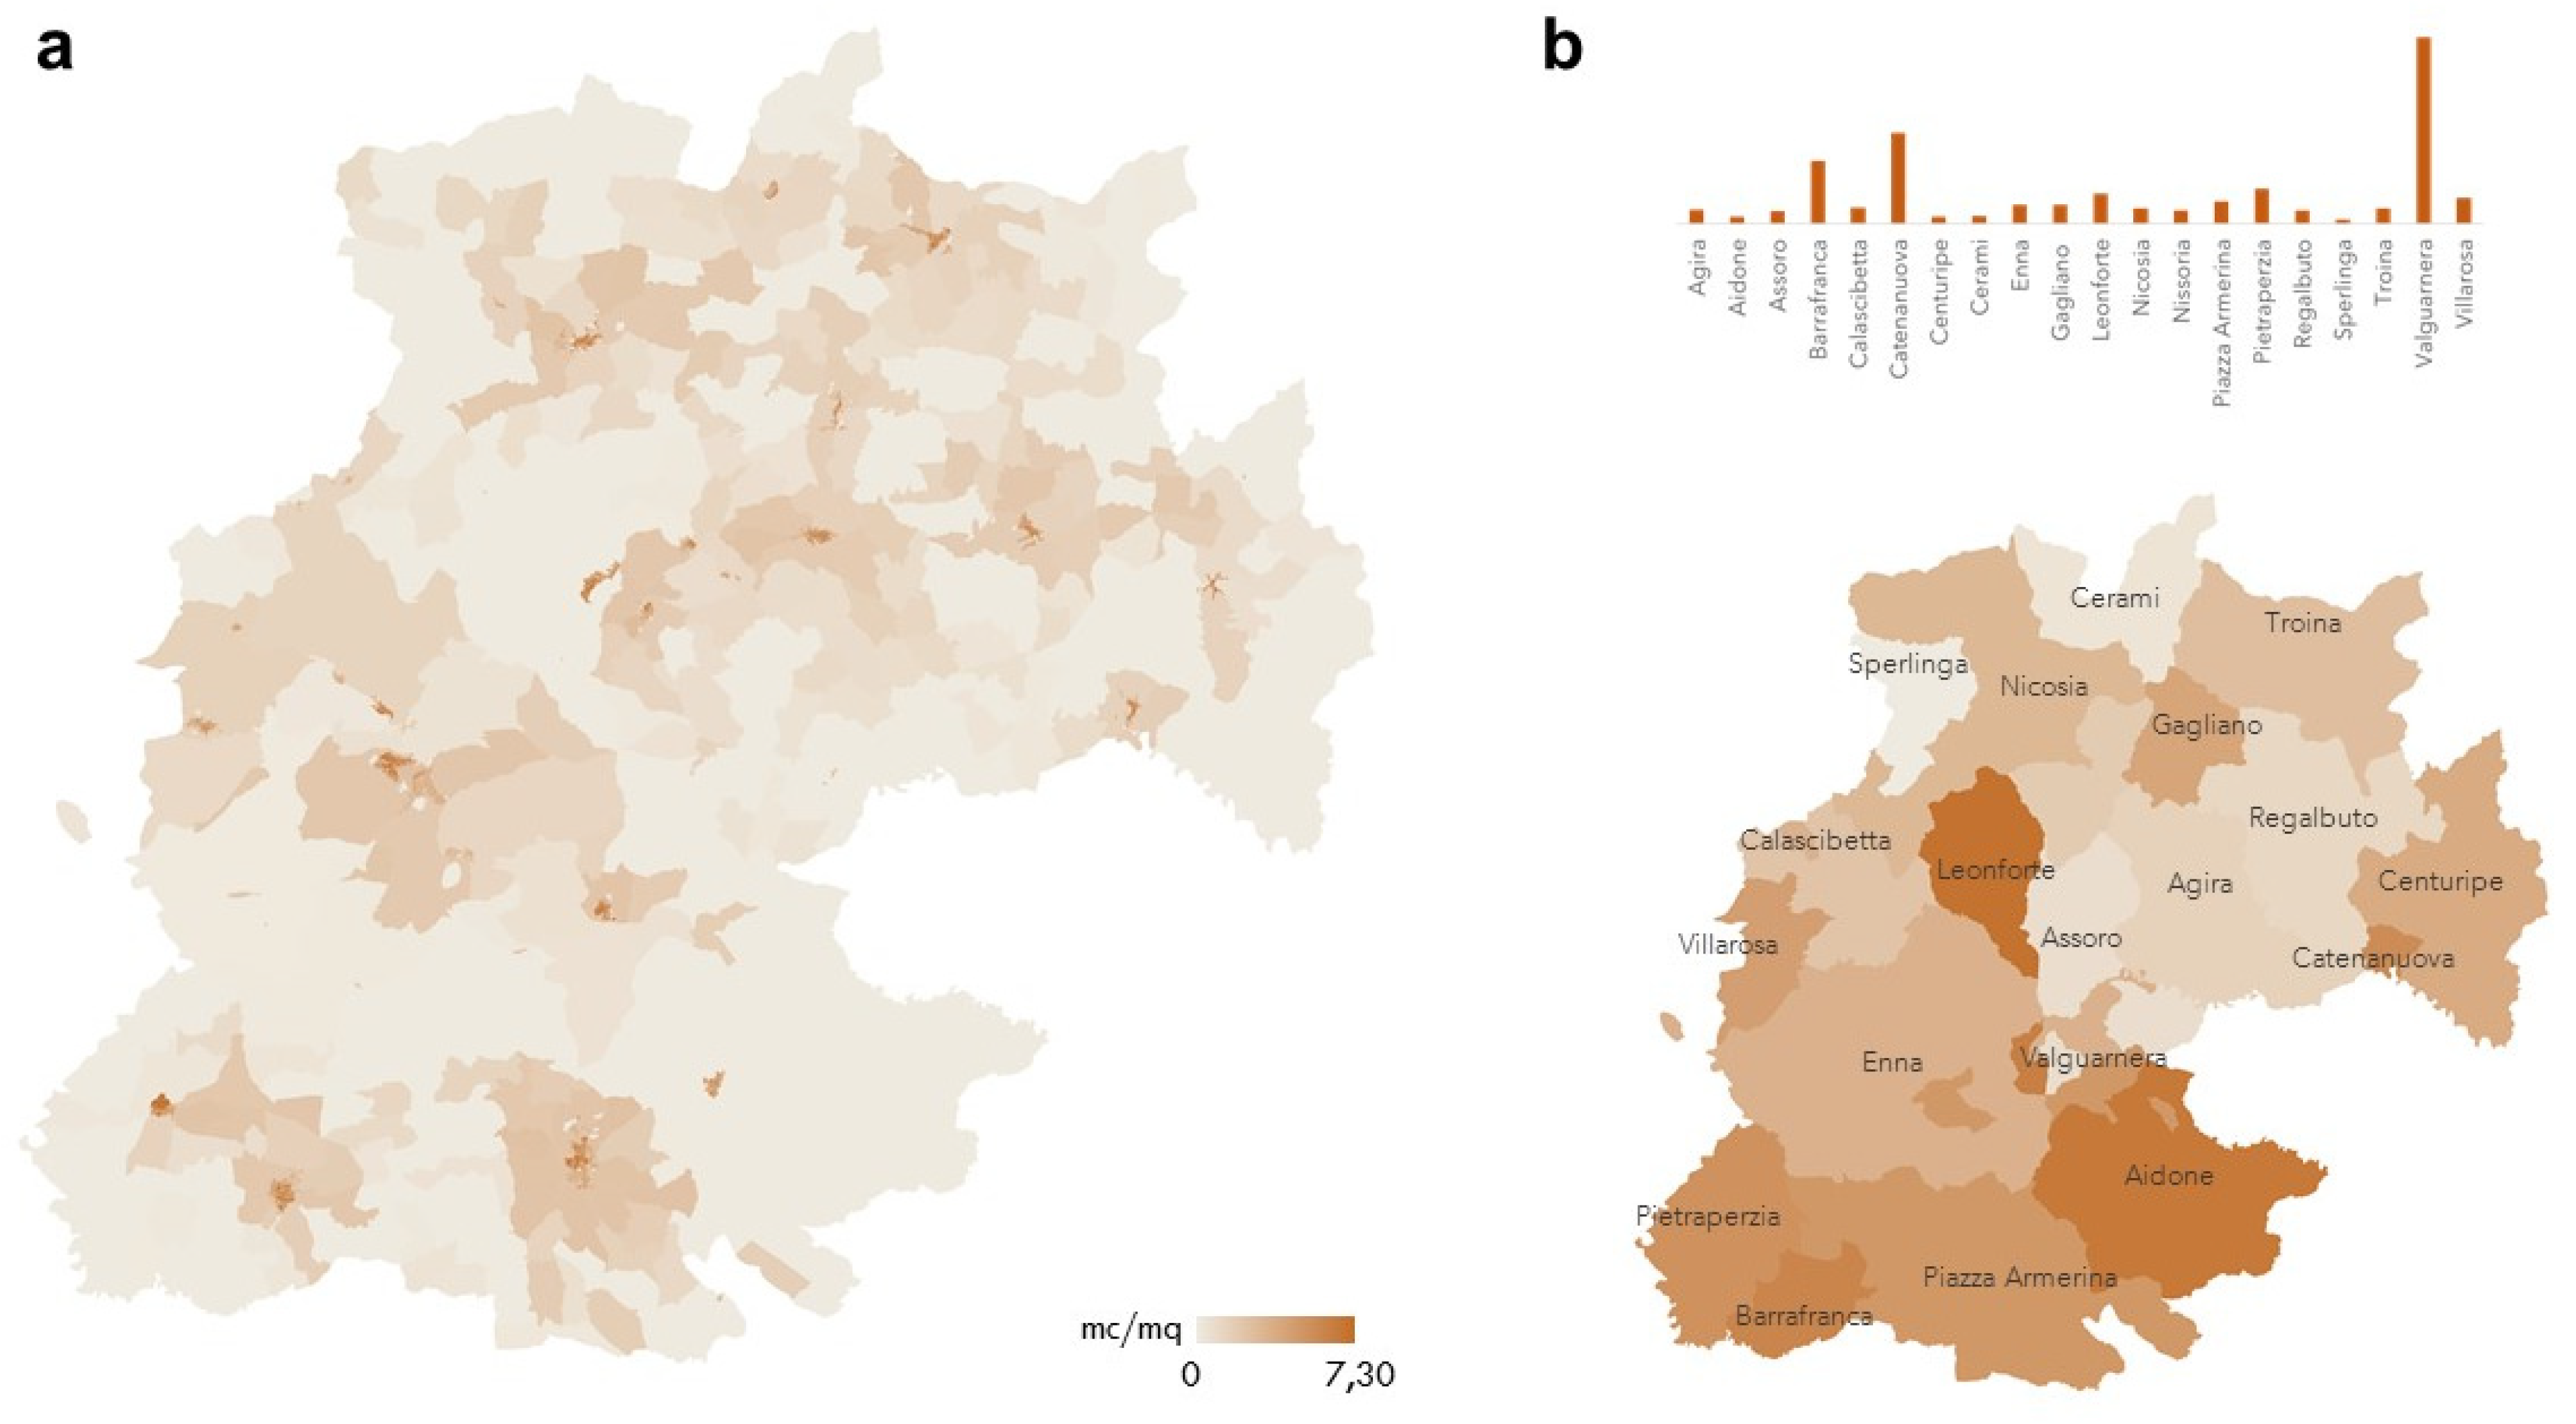
- AbOccS *—Average occupied dwelling area—is the ratio between the surface area of dwellings occupied by at least one resident and their number;
- AbOccS%—Percentage of occupied housing surface area;
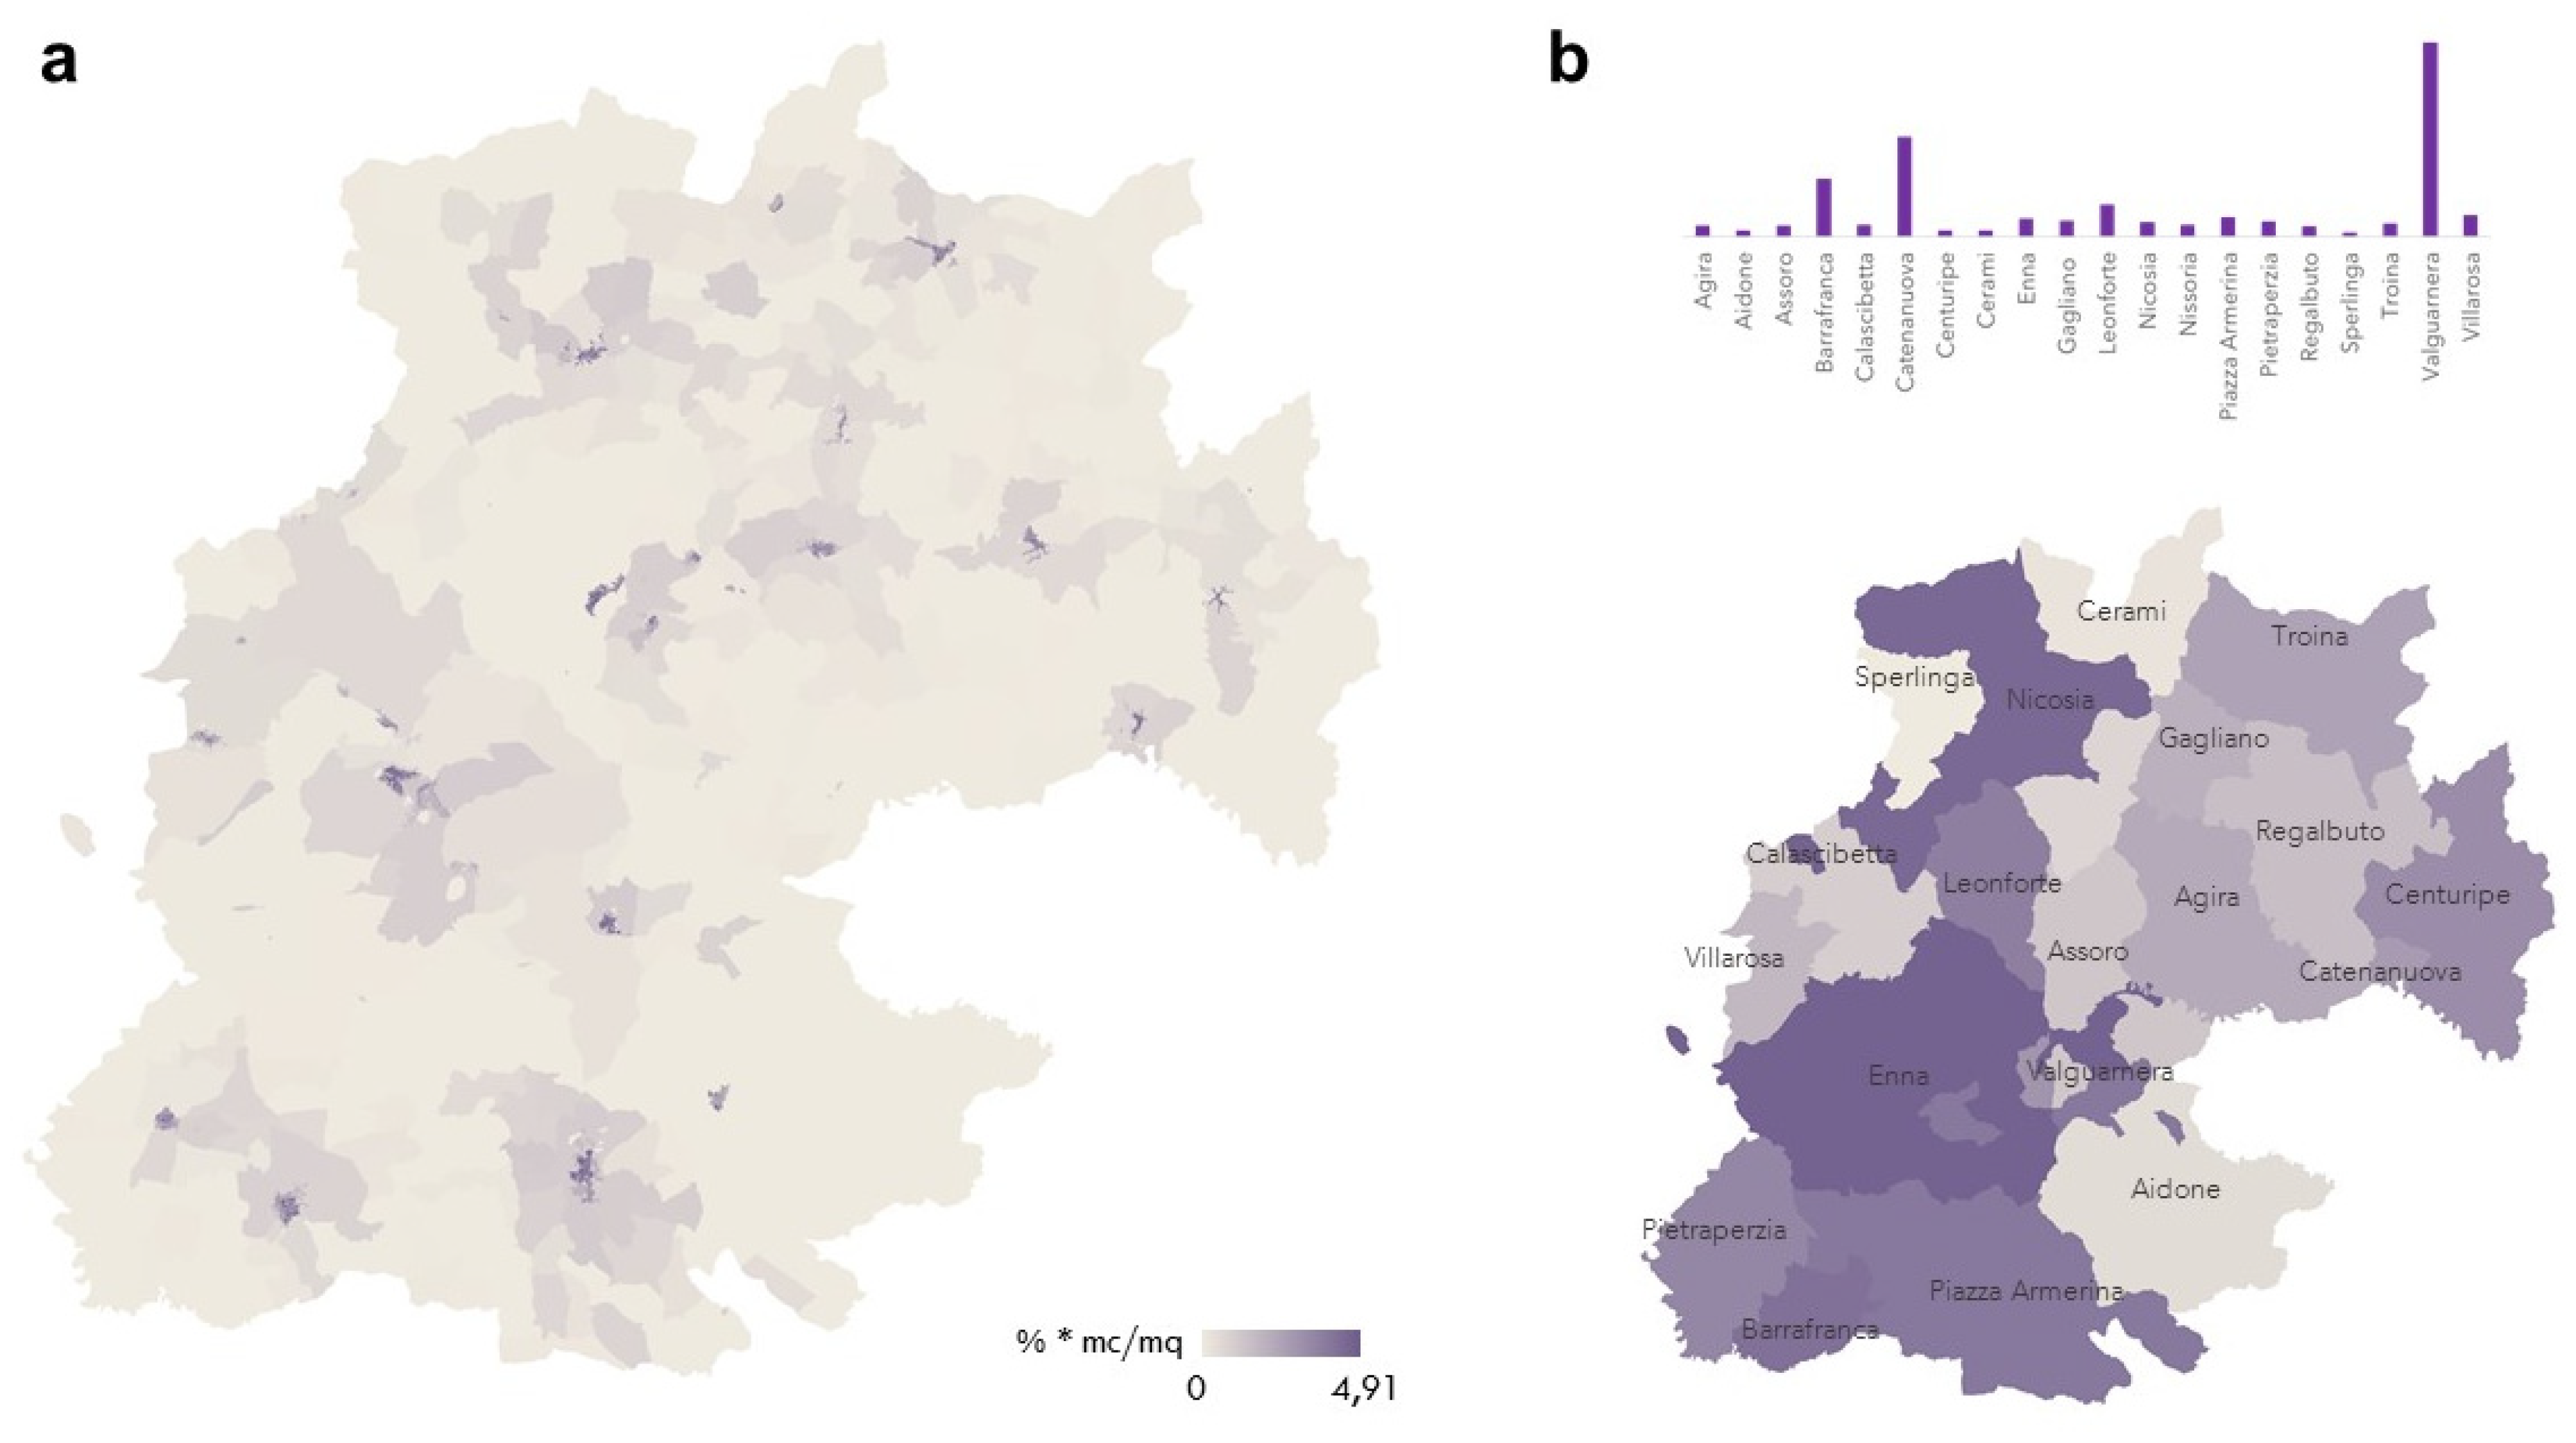
- EdVol—Building volume—is the product of the housing area by 3.2 m height;
- 2EdVal—Value of the urban landscape—is the index resulting from the aggregation of the third level indicators concerning the building types (in this case, traditional building types are valued in comparison to contemporary ones); number of floors of the buildings (a higher weight is associated with one storey buildings); building dating (the number of buildings constructed prior to 1960 is valued);
- EdDens—Building density—is the building volume divided by the surface of the Census Section;
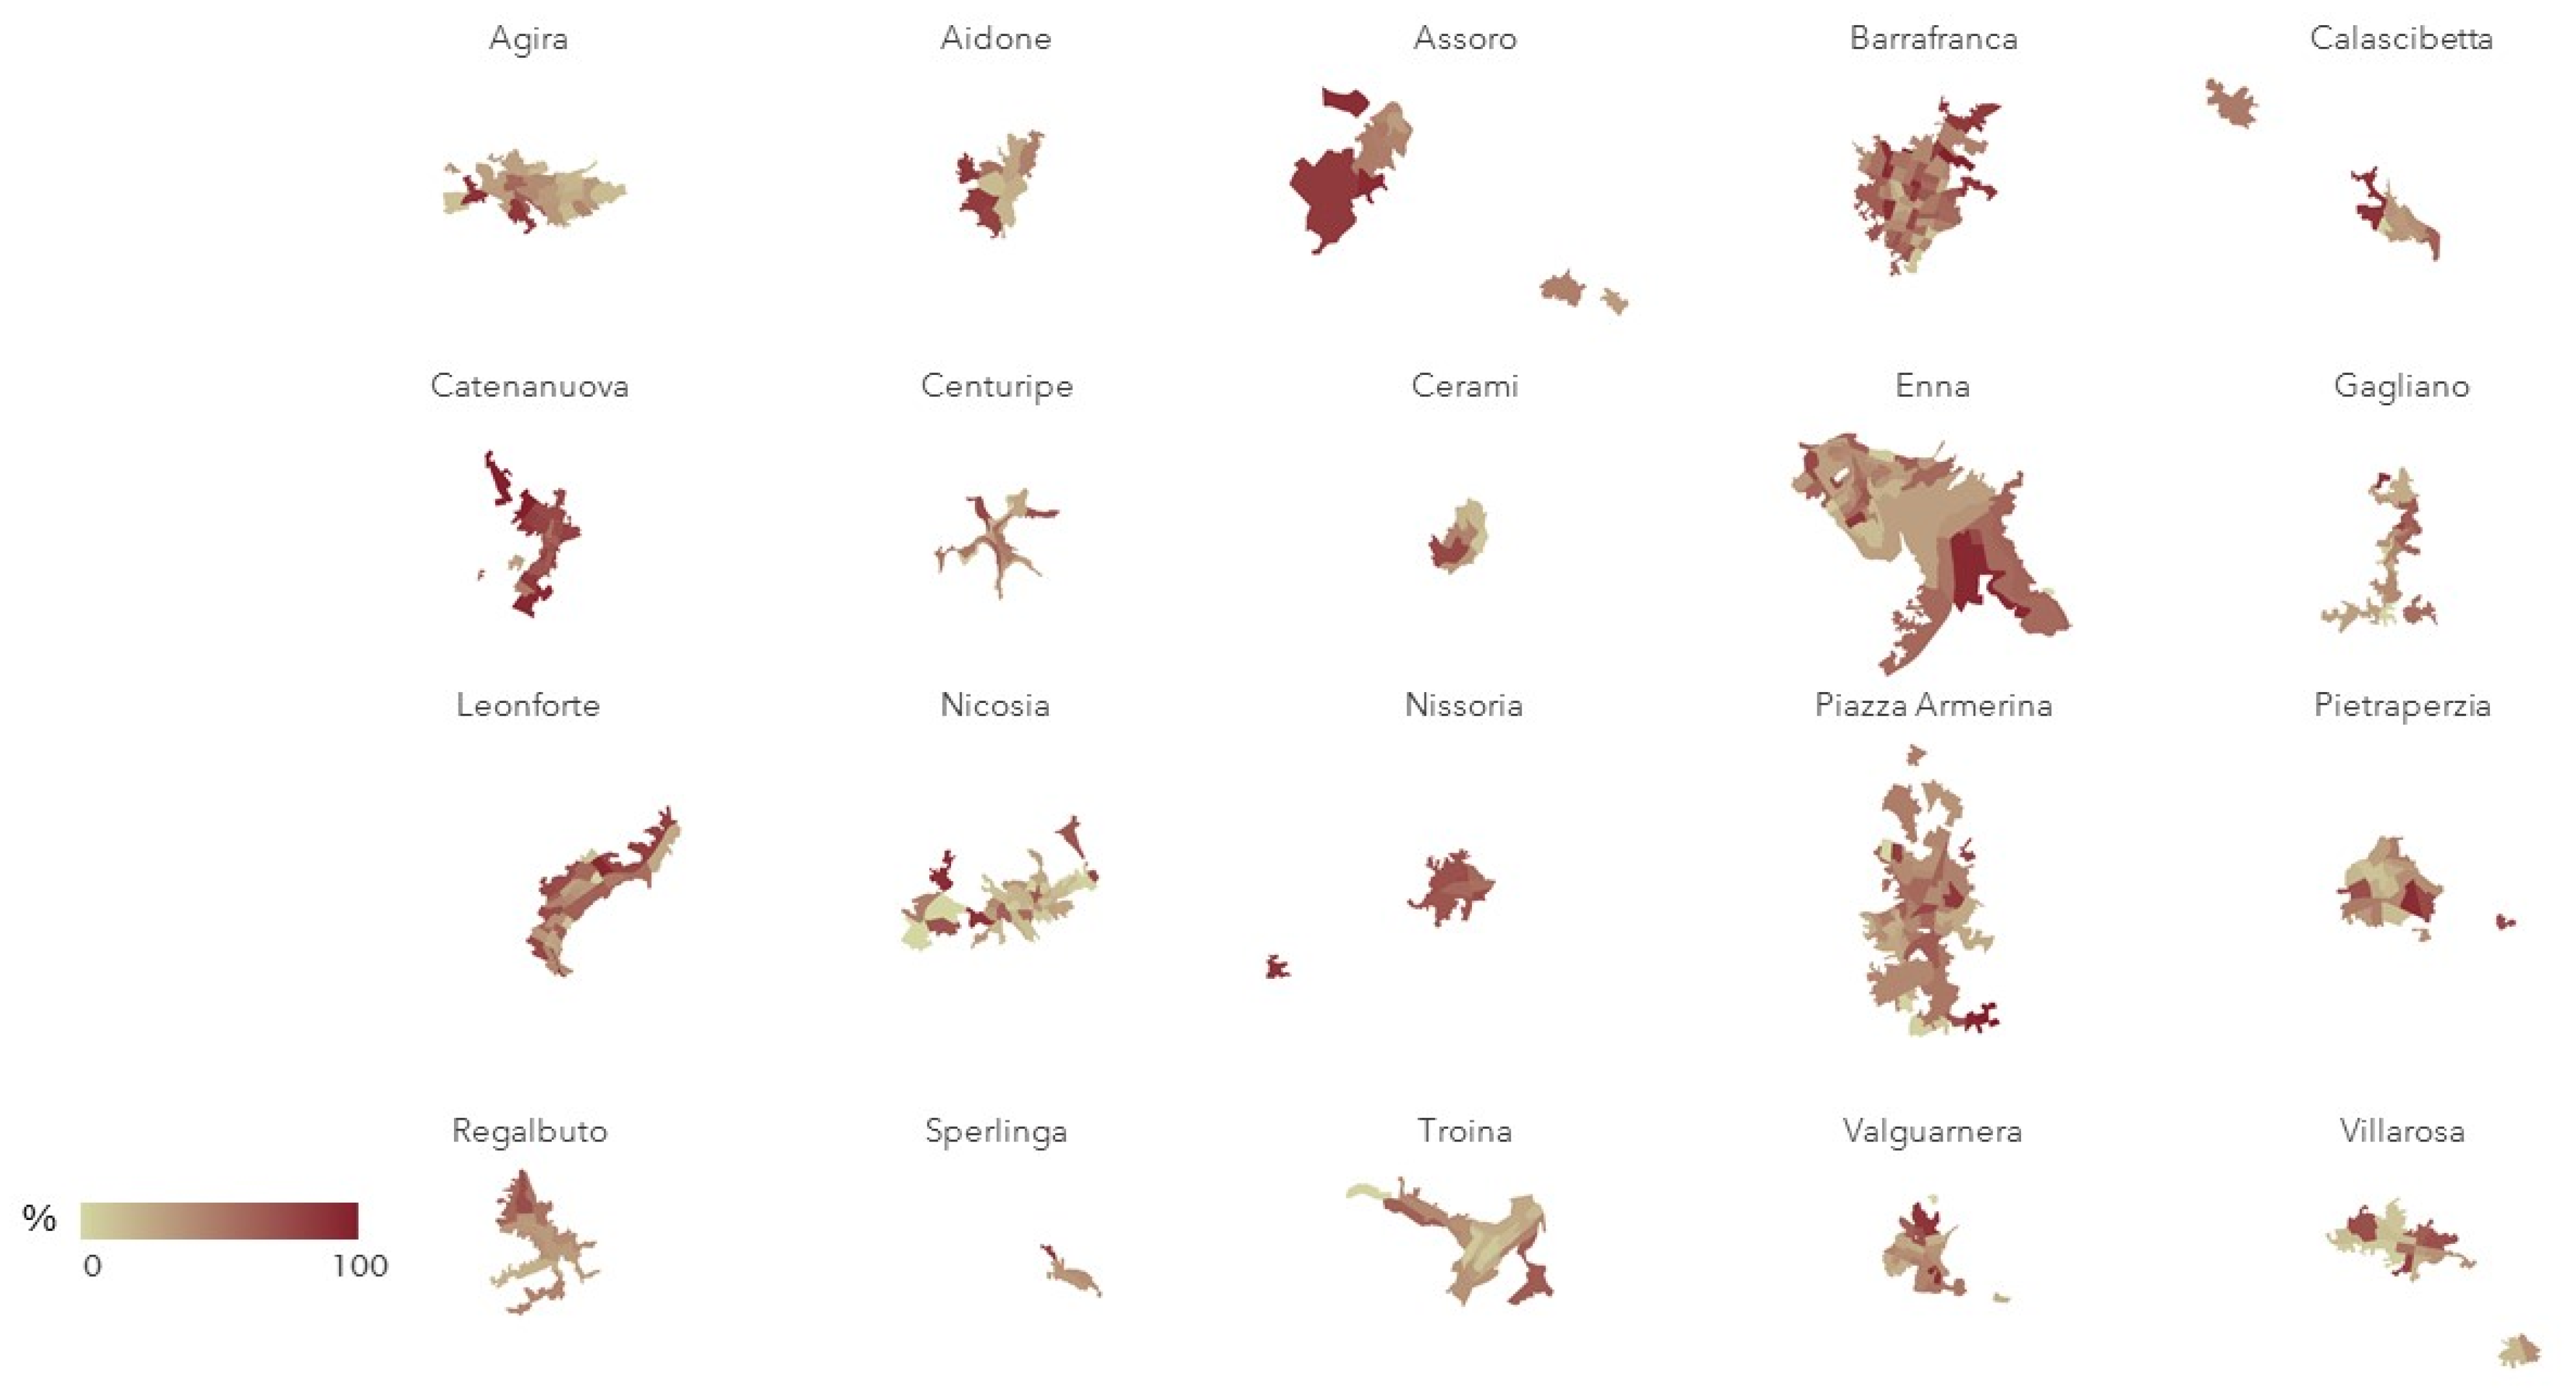
- EdData < 1945%—is the percentage of residential buildings prior to 1945;
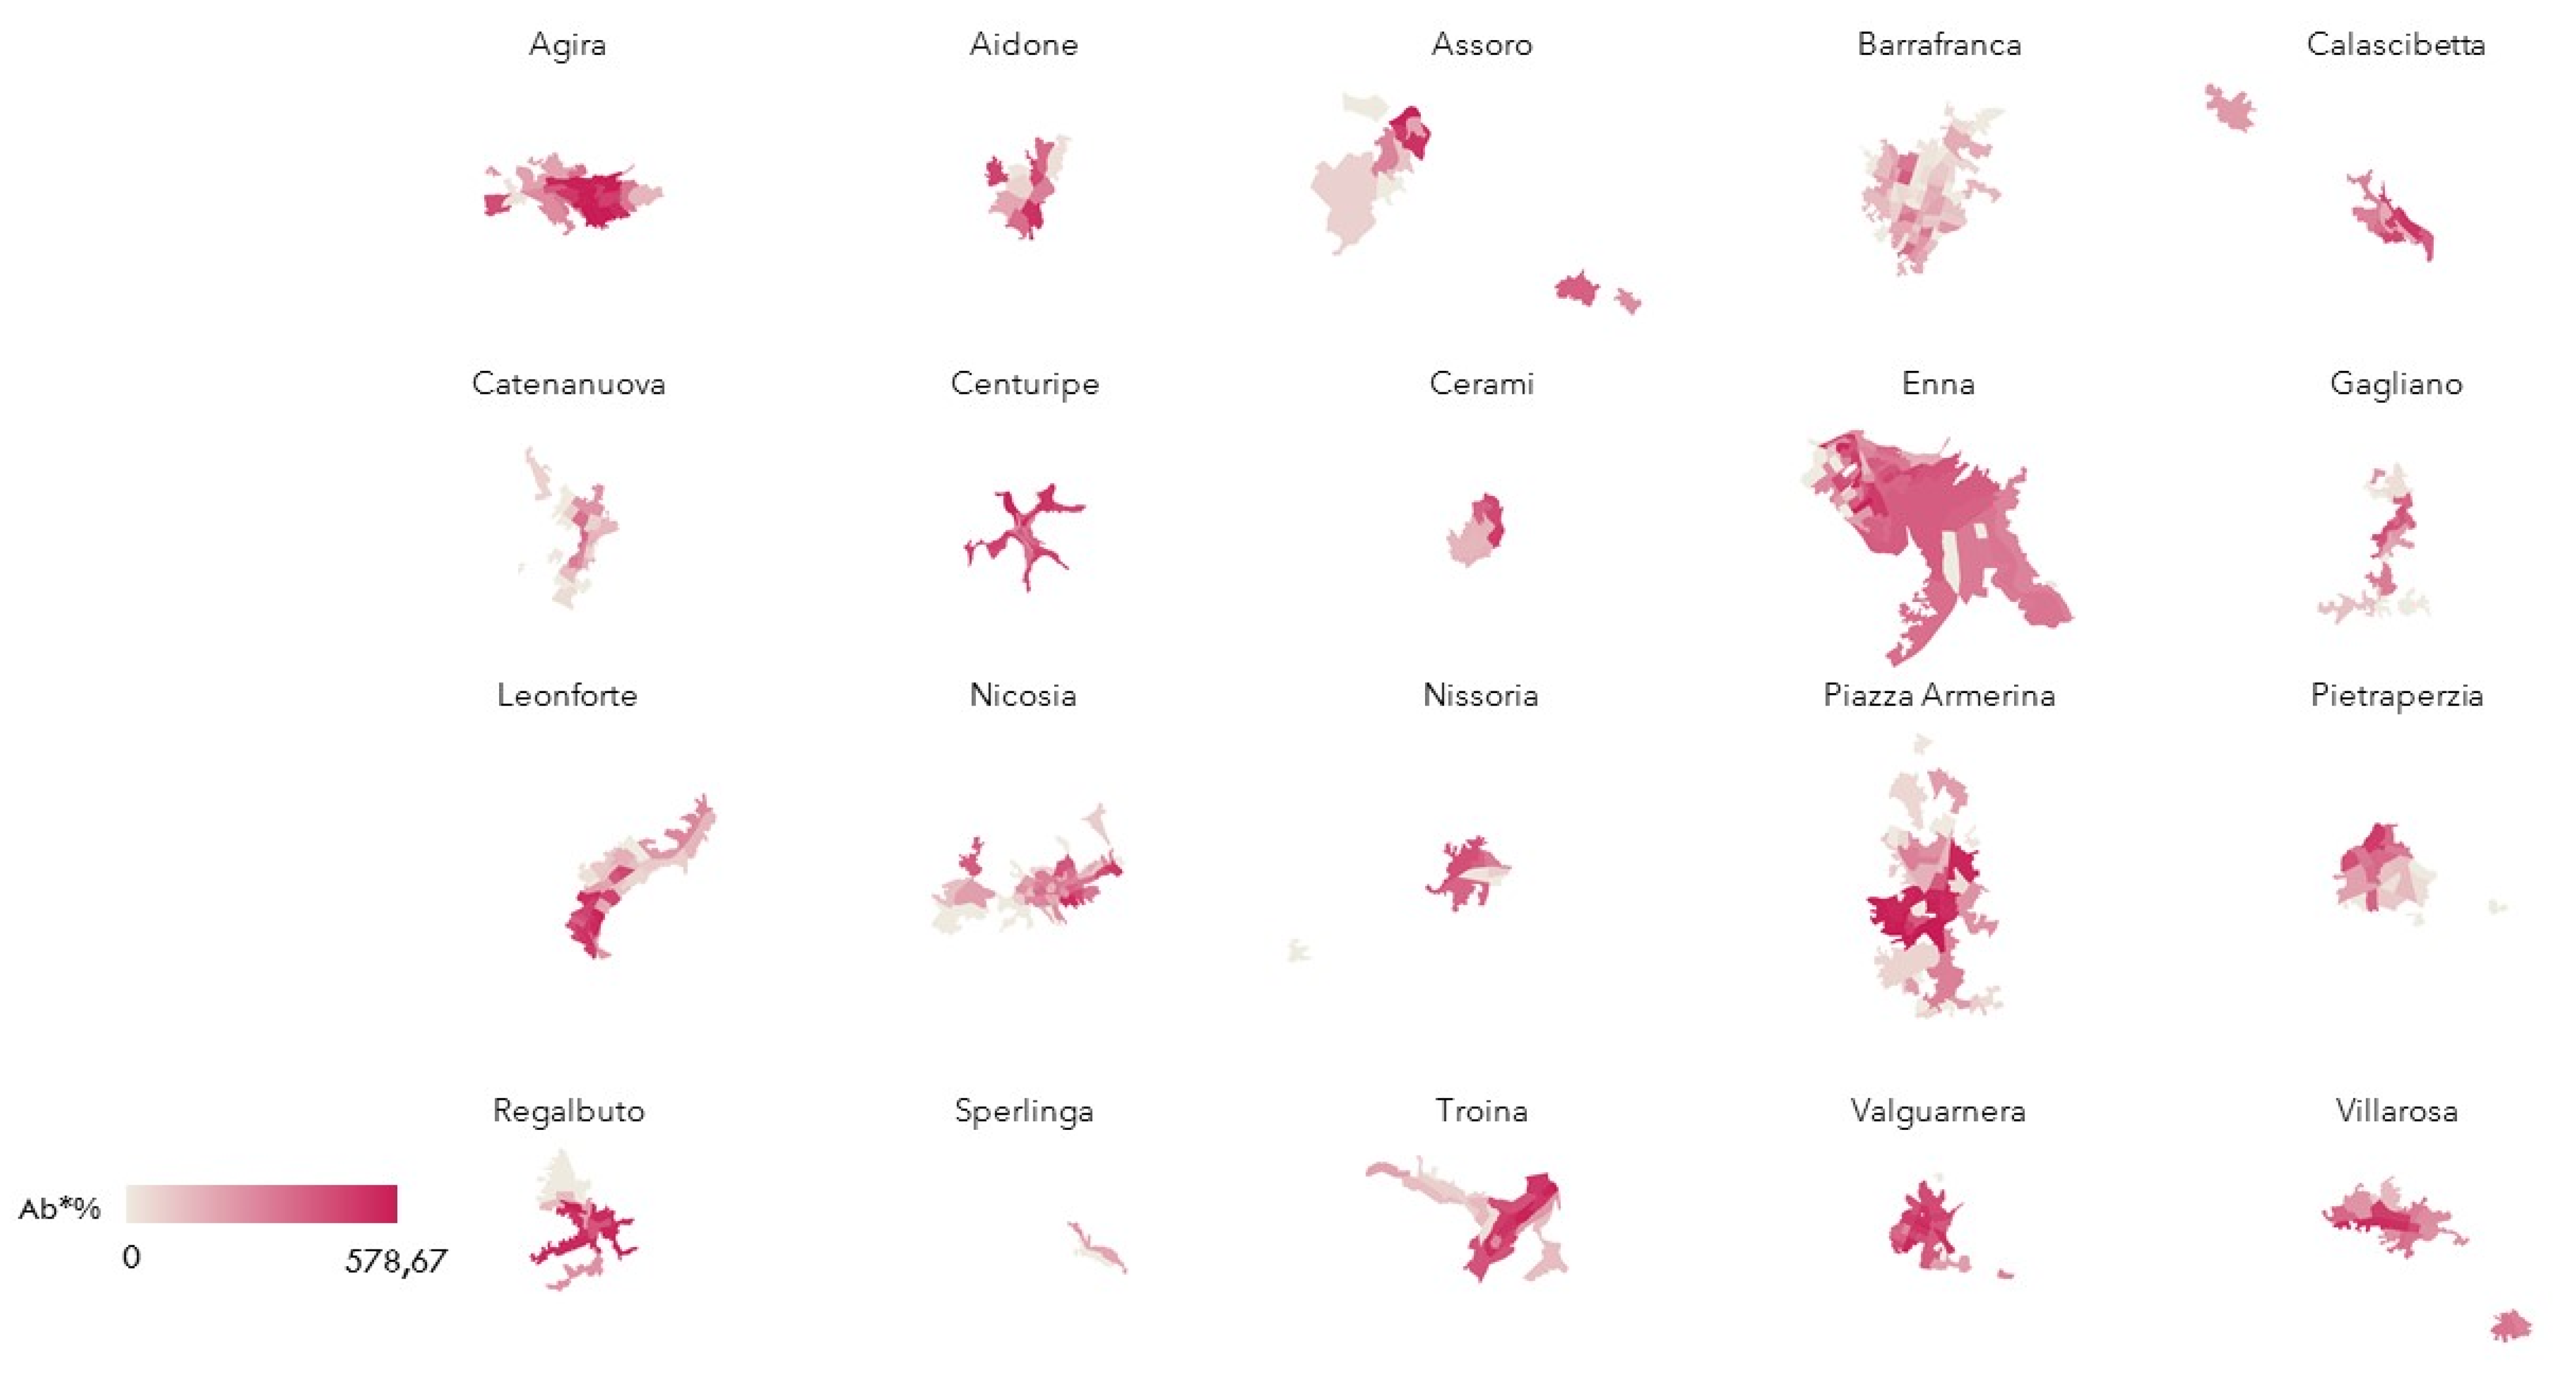
- P * CS—Population/historic center: Testimonial value, which is the product of residents by the percentage of residential buildings prior to 1945;
- Sezcensval HS—this index measures the degree of preference for the historic center based on the following relations: if the population of the section is high and the number of buildings prior to 1945 is low, it is likely that the majority of residents located in this section prefer new buildings because there are fewer old buildings; if, on the other hand, the population is small and the buildings constructed prior to 1945 are many, it means that in that section the old buildings have been abandoned; if the population is large and the buildings constructed prior to 1945 are many, it means that the population prefers to settle in the historic center; if, on the other hand, the population is small and the buildings constructed before 1945 are a small number as well, it means that residents do not like to settle in areas where contemporary buildings prevail. Ultimately, in both cases, a low index indicates a low preference for the historic center, whereas a high index indicates a high preference for a location in the historic center.
- EdStConsB is the ratio between buildings in a good and excellent state of maintenance and the total building number (edbuono/TOT);
- EdStConsC is the ratio between buildings in a poor and mediocre state of conservation and the total building number (edCAT/TOT);
- Pistr% is the ratio between residents with a degree and a high school diploma and the total number of residents.
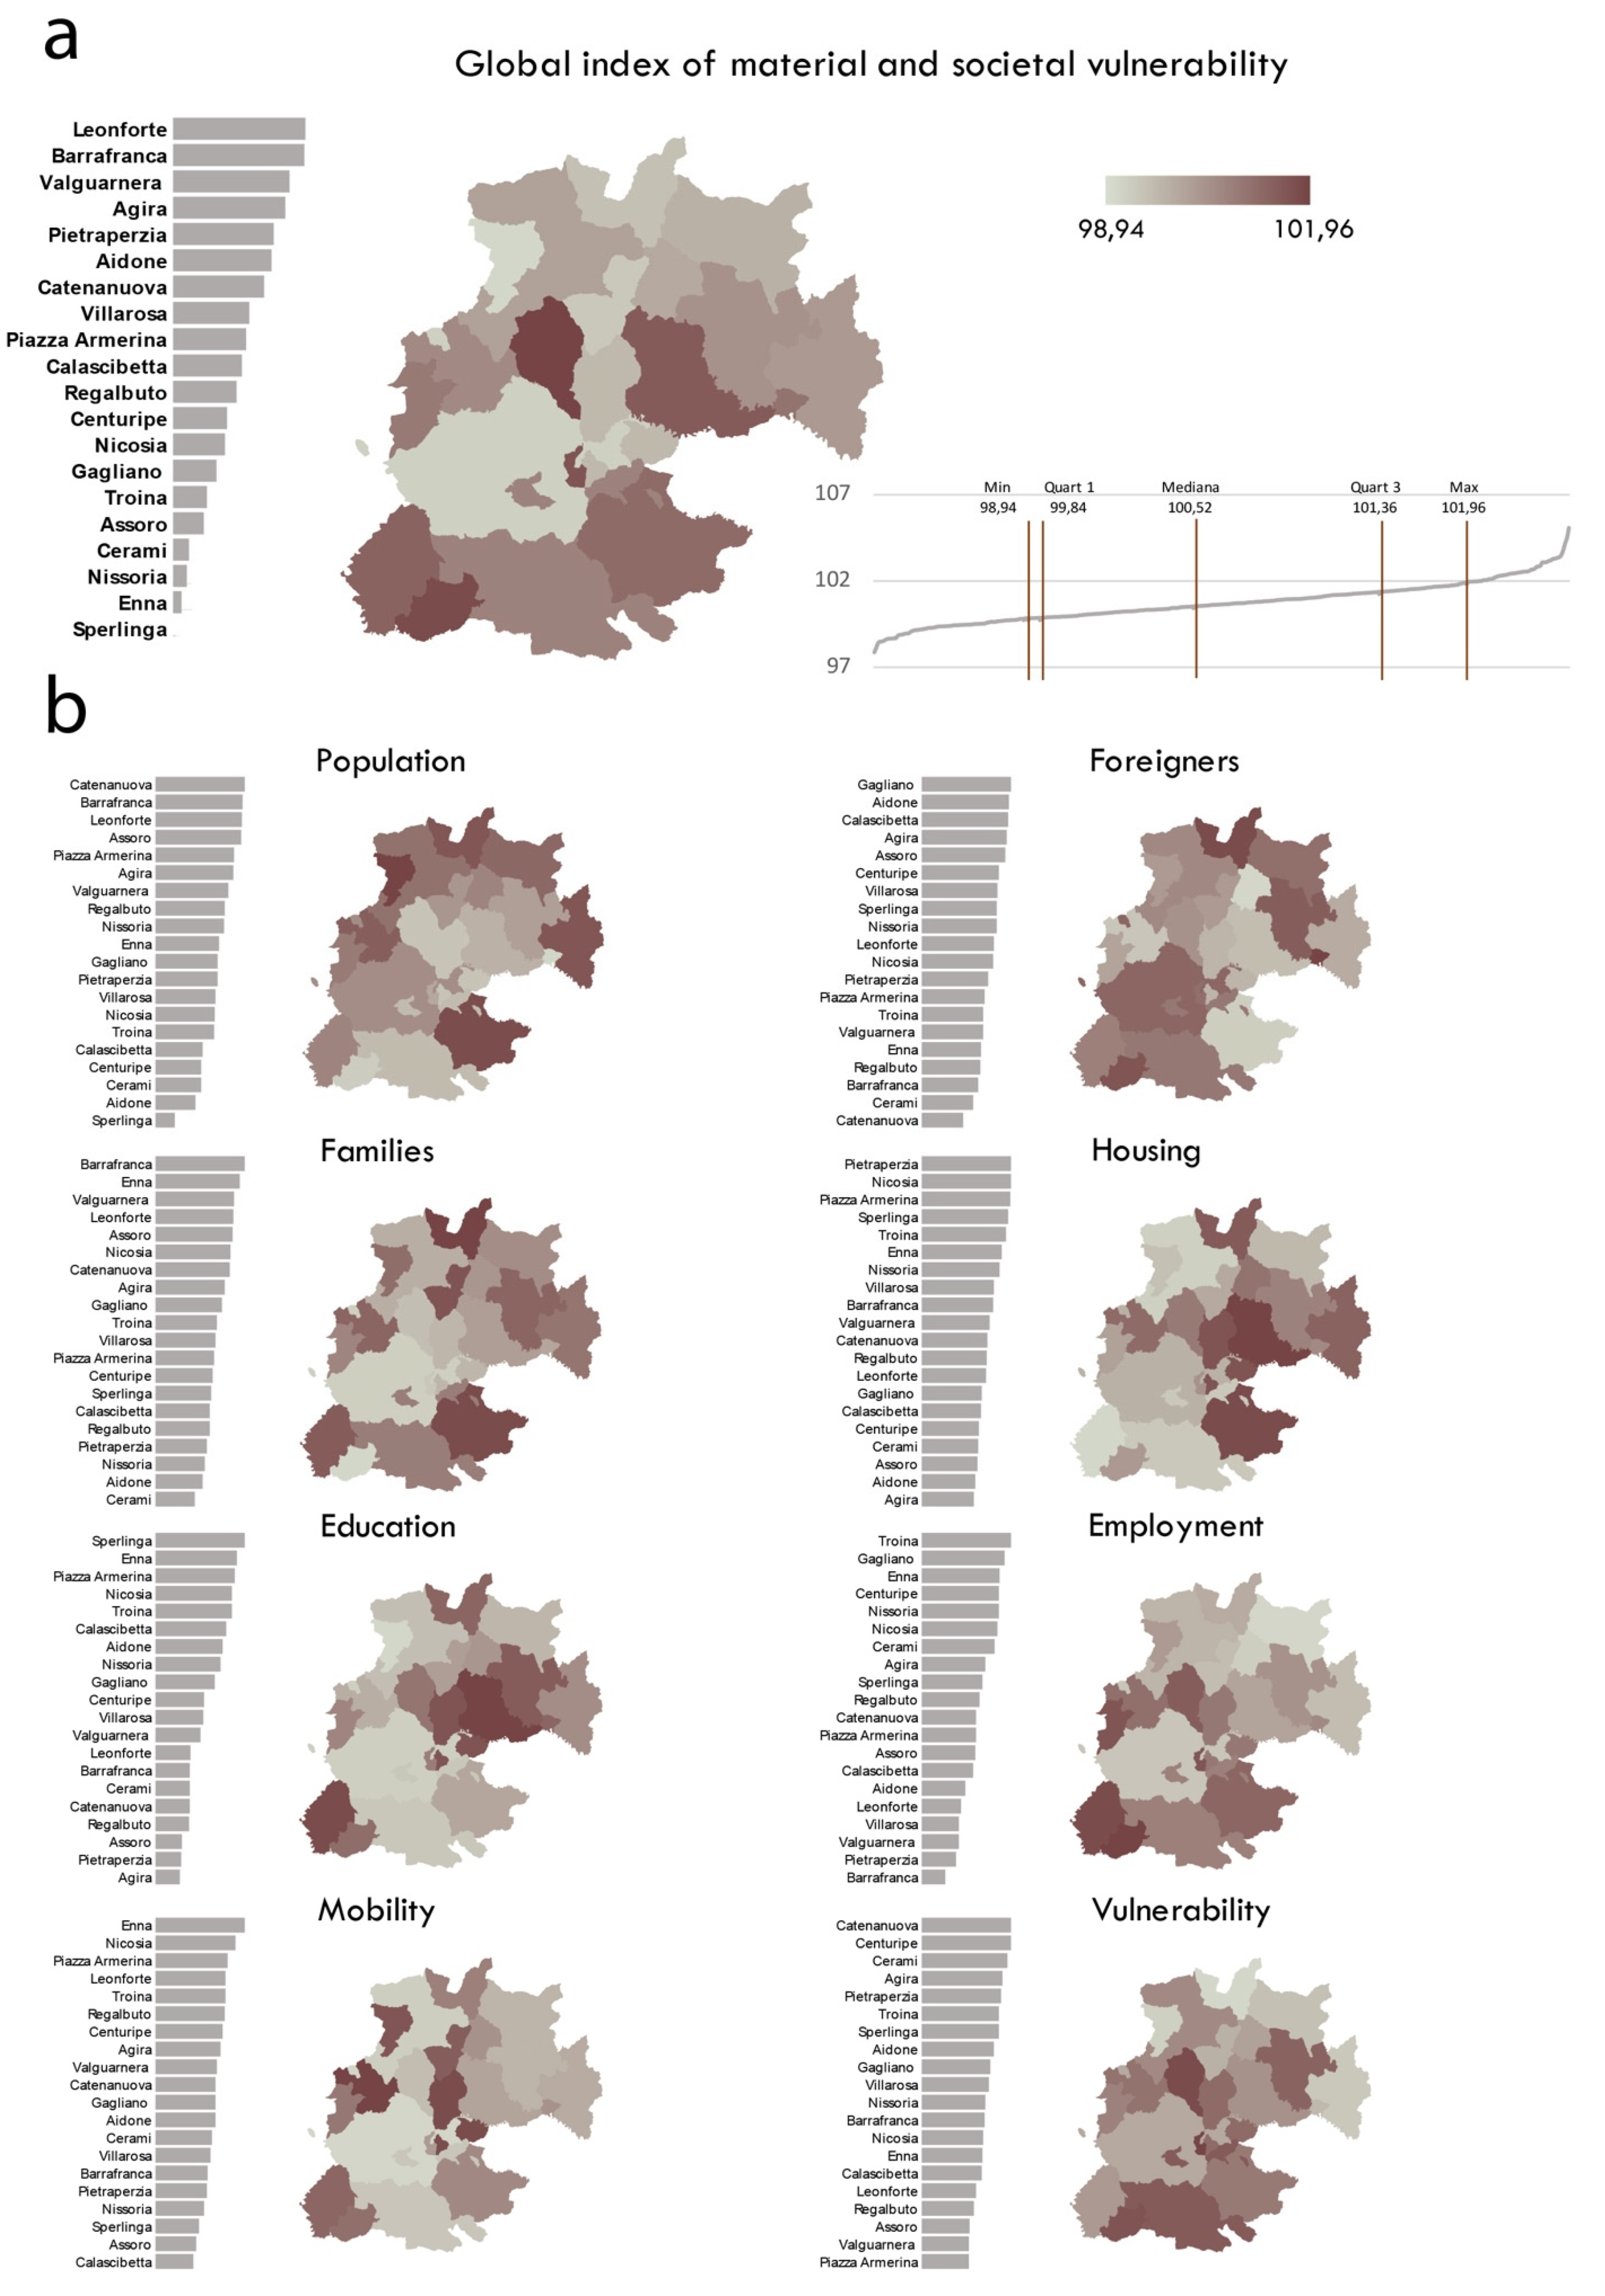
4.2. The City-Capital: Human and Urban Capital
4.3. Cities and the Territory
5. Discussion
6. Conclusions
- -
- The origin is the natural tendency towards long-term thermodynamic equilibrium, which consists in the cancellation of differences, therefore in a condition of non-usability of the energy existing in the system, that means in a condition of molecular disorder;
- -
- The cause is the transformation of the energy existing in the system into mechanical work that produces entropy flows, which accelerate the degradation process that must be compensated for by incoming neg-entropy flows.
- -
- “being form”—in this case with reference to the five forms of capital studied and mapped—concerns organization, that is, neg-entropic or anabolic tension; capital is an economic category capable of self-reproducing and therefore of maintaining constant volume and value, or increasing these through the creation of income flows (neg-entropy), i.e., flows of wealth whose surplus is above costs (for subsistence), accumulate in capital value;
- -
- “being shapeless”, that is, not having the necessary tension to trigger dissipative processes capable of creating forms even if at an increasing entropic level.
- -
- -
- Enna, on the other hand, records the maximum values of being form and minimum values of being shapeless; this is consistent with the third law of thermodynamics, which explains the functioning of closed systems, referred to above, and clarifies how to keep the value of capital high in all its forms. It is necessary to trigger and keep alive dissipative processes whose governance—that is, the maintenance structures that allow the transformation of energy to produce mechanical work with a high degree of energy efficiency—guarantees the maintenance of the imbalance between system and environment.
Author Contributions
Funding
Conflicts of Interest
References
- Colavitti, A.M.; Usai, N.; Bonfiglioli, S. Urban Planning in Italy: The Future of Urban General Plan and Governance. Eur. Plan. Stud. 2013, 21, 167–186. [Google Scholar] [CrossRef]
- Esposito, P.; Patriarca, F.; Salvati, L. Tertiarization and land use change: The case of Italy. Econ. Model. 2018, 71, 80–86. [Google Scholar] [CrossRef]
- Champion, T. Urbanization, Suburbanisation, Counterurbani-Sation and Reurbanisation; Paddison, R., Ed.; Handbook of Urban Studies; Sage: London, UK, 2001; pp. 143–161. [Google Scholar]
- Adger, W.N.; Kelly, P.M. Social Vulnerability to Climate Change and the Architecture of Entitlements. Mitig. Adapt. Strat. Glob. Chang. 1999, 4, 253–266. [Google Scholar] [CrossRef]
- Eakin, H.; Luers, A.L. Assessing the Vulnerability of Social-Environmental Systems. Annu. Rev. Environ. Resour. 2006, 31, 365–394. [Google Scholar] [CrossRef] [Green Version]
- Didkovskyi, O.; Azzone, G.; Menafoglio, A.; Secchi, P. Social and material vulnerability in the face of seismic hazard: An analysis of the Italian case. J. R. Stat. Soc. Ser. A Stat. Soc. 2021, 184, 1549–1577. [Google Scholar] [CrossRef]
- Trovato, M.R.; Giuffrida, S. The Monetary Measurement of Flood Damage and the Valuation of the Proactive Policies in Sicily. Geosciences 2018, 8, 141. [Google Scholar] [CrossRef] [Green Version]
- Birkmann, J. Measuring vulnerability to promote disaster resilient societies: Conceptual frameworks and definitions. In Measuring Vulnerability to Natural Hazards: Towards Disaster Resilient Societies; Birkmann, J., Ed.; United Nations University Press: Tokyo, Japan, 2006; pp. 9–54. [Google Scholar]
- Chakraborty, L.; Rus, H.; Henstra, D.; Thistlethwaite, J.; Scott, D. A place-based socioeconomic status index: Measuring social vulnerability to flood hazards in the context of environmental justice. Int. J. Disaster Risk Reduct. 2019, 43, 101394. [Google Scholar] [CrossRef]
- Frigerio, I.; Carnelli, F.; Cabinio, M.; De Amicis, M. Spatiotemporal Pattern of Social Vulnerability in Italy. Int. J. Disaster Risk Sci. 2018, 9, 249–262. [Google Scholar] [CrossRef] [Green Version]
- Naselli, F.; Trovato, M.R.; Castello, G. An Evaluation Model for the Actions in Supporting of the Environmental and Landscaping Rehabilitation of the Pasquasia’s Site Mining (EN). In Computational Science and Its Applications—ICCSA 2014; Lecture Notes in Computer Science Book Series; Murgante, B., Misra, S., Rocha, A.M.A.C., Torre, C.M., Rocha, J.G., Falcão, M.I., Taniar, D., Apduhan, B.O., Gervasi, O., Eds.; Springer International Publishing: Cham, Switzerland, 2014; pp. 26–41. [Google Scholar] [CrossRef]
- Holand, I.S.; Lujala, P. Replicating and Adapting an Index of Social Vulnerability to a New Context: A Comparison Study for Norway. Prof. Geogr. 2013, 65, 312–328. [Google Scholar] [CrossRef]
- Trovato, M.R.; Giuffrida, S. The Protection of Territory from the Perspective of the Intergenerational Equity. In Green Energy and Technology; Springer: Berlin/Heidelberg, Germany, 2018; Volume F8, pp. 469–485. [Google Scholar] [CrossRef]
- ISTAT. Index of Social and Material Vulnerability. 2011. Available online: http://ottomilacensus.istat.it/fileadmin/download/Indice\_di\_vulnerabilit\%C3\%A0\_sociale\_e\_materiale.pdf (accessed on 1 August 2021).
- Vincent, K. Creating an Index of Social Vulnerability to Climate Change for Africa; Working Paper; Tyndall Center for Climate Change Research: Norwich, UK, 2004; Volume 56, pp. 1–50. [Google Scholar]
- Presidenza del Consiglio dei Ministri, Struttura di Missione Casa Italia. Rapporto sulla Promozione della Sicurezza dai Rischi Naturali del Patrimonio Abitativo. 2017. Available online: http://www.casaitalia.governo.it/it/approfondimenti/rapporto-sulla-promozione-della-sicurezza/ (accessed on 1 August 2021).
- Barbieri, C.; Canturi, V.; Ciani, F.; Cogliano, V.; Colucci, A.; Cusano, G.; Del Visco, B.; Ienco, E.; Iuliano, N.; Maisto, C.; et al. Architettura e Progetto per la Ricostruzione delle Aree Interne delle Piccole Regioni. Una Strategia di Sviluppo; FrancoAngeli: Milano, Italy, 2019. [Google Scholar]
- Lecardane, R.; La Scala, P. Rete di centri minori. Temi e progetti nel territorio di Tindari. In I Centri Minori … da Problema a Risorsa; Fiore, P., D’Andria, E., Eds.; Franco Angeli: Milano, Italy, 2019; pp. 897–907. [Google Scholar]
- Zilli, S.; Dini, F. Il Riordino Territoriale dello Stato. Scenari Italiani 2014. Rapporto Annuale della Società Geografica Italiana Onlus; Società Geografica Italiana Onlus: Rome, Italy, 2015. [Google Scholar]
- Giuffrida, S.; Napoli, G.; Trovato, M.R. The urban being between environment and landscape. On the old town as an emerging subject. In Proceedings of the Smart Innovation, Systems and Technologies, 3rd International New Metropolitan Perspectives. Local Knowledge and Innovation Dynamics towards Territory Attractiveness through the Implementation of Hori-zon/Europe2020/Agenda2030, Reggio Calabria, Italy, 22–25 May 2018; pp. 378–386. Available online: https://link.springer.com/chapter/10.1007/978-3-319-92102-0_40 (accessed on 2 April 2021).
- Governo Italiano. Bilancio di Previsione dello Stato per L’anno Finanziario 2021 e Bilancio Pluriennale per il Triennio 2021–2023. (20G00202) (GU Serie Generale n.322 del 30-12-2020—Suppl. Ordinario n. 46). Available online: https://www.gazzettaufficiale.it/atto/serie_generale/caricaDettaglioAtto/originario?atto.dataPubblicazioneGazzetta=2020-12-30&atto.codiceRedazionale=20G00202 (accessed on 2 April 2021).
- United Nations. The 2030 Agenda for Sustainable Development. 2015. Available online: http://sdps.un.org/goals (accessed on 2 April 2021).
- United Nations. Millennium Development Goals; United Nations: New York, NY, USA, 2015; Available online: https://www.un.org/millenniumgoals/2015_MDG_Report/pdf/MDG%202015%20rev%20(July%201).pdf (accessed on 2 April 2021).
- Baratta, A.; Corbi, I.; Corbi, O.; De Andreis, L.; Marchetti, L.; Greco, D.; Petti, L. Heritage Preservation: Challenges and Perspective; FrancoAngeli: Milano, Italy, 2019. [Google Scholar]
- Associazione Nazionale Centri Storico Artistici (ANCSA). Centro Ricerche Economiche e Sociali del Mercato dell’Edilizia (Cresme). Centri Storici e Futuro del Paese. Indagine Nazionale sulla Situazione dei Centri Storici; ANCSA: Cresme, Italy, 2017. [Google Scholar]
- ISTAT. Rapporto Annuale 2020—La Situazione del Paese. 2020. Available online: https://www.istat.it/it/archivio/244848 (accessed on 1 August 2021).
- ISTAT. Data Set 8mila Census. Available online: http://ottomilacensus.istat.it/ (accessed on 1 August 2021).
- ISTAT. Territorial bases and census variables. Available online: https://www.istat.it/it/archivio/104317 (accessed on 1 August 2021).
- ISTAT. COMIC (COMposite Index Creator). 2013. Available online: https://www.istat.it/it/metodi-e-strumenti/metodi-e-strumenti-it/analisi/strumenti-di-analisi/comic (accessed on 1 August 2021).
- Italian National Statistics Institute (ISTAT). Censimento Della Popolazione e Delle Abitazioni. 2011. Available online: https://www.istat.it/it/archivio/censimento+popolazione (accessed on 2 January 2020).
- Trovato, M.R. A multi-criteria approach to support the retraining plan of the Biancavilla’s old town. In Proceedings of the Smart Innovation, Systems and Technologies, 3rd International New Metropolitan Perspectives. Local Knowledge and Innovation Dynamics towards Territory Attractiveness through the Implementation of Hori-zon/Europe2020/Agenda2030, Reggio Calabria, Italy, 22–25 May 2018; Bevilacqua, C., Calabrò, F., Della Spina, L., Eds.; Springer Science and Business Media Deutschland GmbH: Cham, Switzerland, 2019; Volume 101, pp. 434–441. [Google Scholar] [CrossRef]
- Borja-Vega, C.; de la Fuente, A. Municipal Vulnerability to Climate Change and Climate-Related Events in Mexico; Policy Research Working Paper 6417; The World Bank Social Development Department Sustainable Development Network: Washington, DC, USA, 2013. [Google Scholar]
- Briguglio, L.; Cordina, G.; Farrugia, N.; Vella, S. Economic Vulnerability and Resilience: Concepts and Measurements. Oxf. Dev. Stud. 2009, 37, 229–247. [Google Scholar] [CrossRef]
- De Boer, J. The Fragile City: The Epicentre of Extreme Vulnerability; United Nation University Centre for Policy Research, United Nations University: Tokyo, Japan, 2017. [Google Scholar]
- Gabrielli, L.; Giuffrida, S.; Trovato, M.R. Real Estate Landscapes and the Historic City: On How Looking Inside the Market. In Proceedings of the Smart Innovation, Systems and Technologies, 3rd International New Metropolitan Perspectives. Local Knowledge and Innovation Dynamics towards Territory Attractiveness through the Implementation of Hori-zon/Europe2020/Agenda2030, Reggio Calabria, Italy, 22–25 May 2018; Bevilacqua, C., Calabrò, F., Della Spina, L., Eds.; Springer Science and Business Media Deutschland GmbH: Cham, Switzerland, 2019; Volume 101, pp. 269–276. [Google Scholar] [CrossRef]
- Barreca, A.; Curto, R.; Rolando, D. Assessing Social and Territorial Vulnerability on Real Estate Submarkets. Buildings 2017, 7, 94. [Google Scholar] [CrossRef] [Green Version]
- Leiserowitz, A.A.; Kates, R.W.; Parris, T.M. Sustainability values, attitudes, and behaviors: A review of multinational and global trends. Annu. Rev. Environ. Resour. 2006, 31, 413–444. [Google Scholar] [CrossRef] [Green Version]
- Dillard, J.; Dujon, V.; King, M.C. (Eds.) Understanding the Social Dimension of Sustainability; Routledge: New York, NY, USA, 2009. [Google Scholar]
- Eizenberg, E.; Jabareen, Y. Social Sustainability: A New Conceptual Framework. Sustainability 2017, 9, 68. [Google Scholar] [CrossRef] [Green Version]
- Steiniger, S.; Wagemann, E.; de la Barrera, F.; Molinos-Senante, M.; Villegas, R.; de la Fuente, H.; Vives, A.; Arce, G.; Herrera, J.-C.; Carrasco, J.-A.; et al. Localising urban sustainability indicators: The CEDEUS indicator set, and lessons from an expert-driven process. Cities 2020, 101, 102683. [Google Scholar] [CrossRef]
- Trovato, M.R.; Nocera, F.; Giuffrida, S. Life-Cycle Assessment and Monetary Measurements for the Carbon Footprint Reduction of Public Buildings. Sustainability 2020, 12, 3460. [Google Scholar] [CrossRef] [Green Version]
- Mascarenhas, A.; Coelho, P.; Subtil, E.; Ramos, T.B. The role of common local indicators in regional sustainability assessment. Ecol. Indic. 2010, 10, 646–656. [Google Scholar] [CrossRef]
- Pires, S.M.; Fidélis, T. A proposal to explore the role of sustainability indicators in local governance contexts: The case of Palmela, Portugal. Ecol. Indic. 2012, 23, 608–615. [Google Scholar] [CrossRef]
- Ramos, T.; Caeiro, S. Meta-performance evaluation of sustainability indicators. Ecol. Indic. 2010, 10, 157–166. [Google Scholar] [CrossRef] [Green Version]
- Tanguay, G.A.; Rajaonson, J.; Lefebvre, J.-F.; Lanoie, P. Measuring the sustainability of cities: An analysis of the use of local indicators. Ecol. Indic. 2010, 10, 407–418. [Google Scholar] [CrossRef]
- Van Zeijl-Rozema, A.; Martens, P. An adaptive indicator framework for monitoring regional sustainable development: A case study of the INSURE project in Limburg, The Netherlands. Sustain. Sci. Pract. Policy 2010, 6, 6–17. [Google Scholar] [CrossRef] [Green Version]
- Costanza, R. Valuing natural capital and ecosystem services toward the goals of efficiency, fairness, and sustainability. Ecosyst. Serv. 2020, 43, 101096. [Google Scholar] [CrossRef]
- Trovato, M. An Axiology of Residual Green Urban Areas. Environments 2021, 8, 53. [Google Scholar] [CrossRef]
- Navarro, C.J.; Rodríguez-García, M.J. Urban policies as multi-level policy mixes. The comparative urban portfolio analysis to study the strategies of integral urban development initiatives. Cities 2020, 102, 102716. [Google Scholar] [CrossRef]
- OECD. Making Decentralisation Work: A Handbook for Policy-Makers; OECD Multilevel Governance Studies; OECD Publishing: Paris, France, 2019. [Google Scholar] [CrossRef]
- Liu, W.; Dunford, M.; Song, Z.; Chen, M. Urban–rural integration drives regional economic growth in Chongqing, Western China. Area Dev. Policy 2016, 1, 132–154. [Google Scholar] [CrossRef]
- Schintler, L.A.; Kulkarni, R. Big Data for Policy Analysis: The Good, The Bad, and The Ugly. Rev. Policy Res. 2014, 31, 343–348. [Google Scholar] [CrossRef]
- Fernández-García, M.; Navarro, C.J.; Gómez-Ramirez, I. Evaluating Territorial Targets of European Integrated Urban Policy. The URBAN and URBANA Initiatives in Spain (1994–2013). Land 2021, 10, 956. [Google Scholar] [CrossRef]
- Lawless, P. Can area-based regeneration programmes ever work? Evidence from England’s New Deal for Communities Programme. Policy Stud. 2012, 33, 313–328. [Google Scholar] [CrossRef]
- Powell, M.; Boyne, G.; Ashworth, R. Towards a geography of people poverty and place poverty. Policy Politics 2001, 29, 243–258. [Google Scholar] [CrossRef]
- Spencer, J.H. People, Places, and Policy: A Politically Relevant Framework for Efforts to Reduce Concentrated Poverty. Policy Stud. J. 2004, 32, 545–568. [Google Scholar] [CrossRef]
- Blank, R.M. Poverty, Policy, and Place: How Poverty and Policies to Alleviate Poverty Are Shaped by Local Characteristics. Int. Reg. Sci. Rev. 2005, 28, 441–464. [Google Scholar] [CrossRef]
- Servillo, L.; Atkinson, R.; Russo, A. Territorial attractiveness in EU urban and spatial policy: A critical review and future research agenda. Eur. Urban Reg. Stud. 2011, 19, 349–365. [Google Scholar] [CrossRef] [Green Version]
- Napoli, G.; Barbaro, S.; Giuffrida, S.; Trovato, M.R. The European Green Deal: New Challenges for the Economic Feasibility of Energy Retrofit at District Scale. Smart Innov. Syst. Technol. 2020, 178, 1248–1258. [Google Scholar] [CrossRef]
- Wong, C. Indicators for Urban and Regional Planning: The Interplay of Policy and Methods; Routledge: Abingdon, UK, 2006. [Google Scholar] [CrossRef]
- Andersson, R.; Musterd, S. Area-based policies: A critical appraisal. Tijdschr. Econ. Soc. Geogr. 2005, 96, 377–389. [Google Scholar] [CrossRef]
- Holman, N. Incorporating local sustainability indicators into structures of local governance: A review of the literature. Local Environ. 2009, 14, 365–375. [Google Scholar] [CrossRef] [Green Version]
- D’Orlando, E. Territori e Potere. Un Nuovo Ruolo per Regioni ed enti Locali? Prolusione all’Inaugurazione del 41° Anno Accademico 2018/2019 Università degli Studi di Udine. 2018. Available online: https://qui.uniud.it/notizieEventi/ateneo/inaugurato-il-nuovo-anno-accademico2018-19/territori-e-potere-un-nuovo-ruolo-per-regioni-ed-enti-locali-prolusione-dellaprof-ssa-elena-dorlando (accessed on 10 October 2021).
- Trovato, M.; Micalizzi, P.; Giuffrida, S. Assessment of Landscape Co-Benefits in Natura 2000 Site Management Plans. Sustainability 2021, 13, 5707. [Google Scholar] [CrossRef]
- UVAL. A Strategy for Inner Areas in Italy: Definition, Objectives, Tools and Governance; Materiali Uval Series; UVAL: Rome, Italy, 2014. [Google Scholar]
- Governo Italiano. Nuove Disposizioni per le Zone Montane. LEGGE 31 Gennaio 1994, n. 9. (G.U. Serie Generale n.32 del 09-02-1994–Suppl. Ordinario n. 24); Governo Italiano: Rome, Italy, 1994.
- Governo Italiano. Misure per il Sostegno e la Valorizzazione dei Piccoli Comuni, Nonché’ Disposizioni per la Riqualificazione e il Recupero dei Centri Storici dei Medesimi Comuni. LEGGE 6 Ottobre 2017, n. 158 (17G00171) (GU Serie Generale n.256 del 02-11-2017); Governo Italiano: Rome, Italy, 2017.
- Ministero dell’Interno. Definizione dei Parametri per la Determinazione delle Tipologie dei Piccoli Comuni che Possono Beneficiare dei Finanziamenti Previsti dalla Legge 6 Ottobre 2017, n. 158. Decreto 10 Agosto 2020 (20A04583) (GU Serie Generale n.213 del 27-08-2020); Governo Italiano: Rome, Italy, 2017.
- Hoffman, A.; Camagni, R.P.; Latella, F. Mezzogiorno e Scienze Regionali: L’Analisi e la Programmazione; Franco Angeli Edizioni: Milano, Italy, 1992. [Google Scholar]
- Bolton, R. An Economic Interpretation of a ‘Sense of Place’; Papers 130; Department of Economics Working Papers; Department of Economics, Williams College: Williamstown, MA, USA, 1989. [Google Scholar]
- OECD. OECD Regional Outlook 2019: Leveraging Megatrends for Cities and Rural Areas; OECD Publishing: Paris, France, 2019. [Google Scholar] [CrossRef]
- OECD. Regional, Rural and Urban Development. Available online: https://www.oecd.org/regional/ (accessed on 10 October 2021).
- Hobbs, R.; Higgs, E.; Hall, C.M.; Bridgewater, P.; Chapin, F.S.; Ellis, E.; Ewel, J.J.; Hallett, L.; Harris, J.; Hulvey, K.B.; et al. Managing the whole landscape: Historical, hybrid, and novel ecosystems. Front. Ecol. Environ. 2014, 12, 557–564. [Google Scholar] [CrossRef] [Green Version]
- Carluccio, M.; Del Regno, R.; Roselli, A. I Borghi Abbandonati dell’Irpinia: Un’Eredità Dimenticata; FrancoAngeli: Milano, Italy, 2019. [Google Scholar]
- Teti, V. Il Senso dei Luoghi. Memoria e Vita dei Paesi Abbandonati; Donzelli: Rome, Italy, 2004. [Google Scholar]
- OECD. Le Sfide dello Sviluppo Locale e il Ruolo delle Aree Vaste nella Pianificazione Strategica; OECD Trento Centre, Trento. 2018. Available online: www.oecd.org/cfe/leed/2018-Working-Paper-FVG-EN.pdf (accessed on 10 October 2021).
- Thomson, D.E. Strategic, Geographic Targeting of Housing and Community Development Resources. Urban Aff. Rev. 2008, 43, 629–662. [Google Scholar] [CrossRef]
- Rolando, D. Multicriteria decision problem structuring: The strategic choice approach in the context of public projects in Italy. Int. J. Multicriteria Decis. Mak. 2015, 5, 4–38. [Google Scholar] [CrossRef]
- Albrechts, L.; Balducci, A.; Hillier, J. (Eds.) Situated Practices of Strategic Planning: An International Perspective; Routledge: Abingdon, UK, 2016. [Google Scholar] [CrossRef]
- Moccia, F.D. Resistenze alla pianificazione strategica: Una analisi trans-culturale della ricezione ed uso della pianificazione strategica nella pianificazione integrata italiana. In Pianificazione Strategica e Governabilità Ambientale; Archibugi, F., Saturnino, A., Eds.; Alinea Editrice: Firenze, Italy, 2004. [Google Scholar]
- Cicerchia, A. Pianificazione Strategica e Ambiente: Teorie, Metodi, Strumenti ed Esperienze Internazionali; Franco Angeli: Milano, Italy, 2000. [Google Scholar]
- Archibugi, F. Introduzione alla Pianificazione Strategica in Ambito Pubblico; Alinea Editrice: Firenze, Italy, 2005. [Google Scholar]
- Della Spina, L. Strategic Planning and Decision Making: A Case Study for the Integrated Management of Cultural Heritage Assets in Southern Italy. In New Metropolitan Perspectives. NMP 2020. Smart Innovation, Systems and Tecashnologies; Bevilacqua, C., Calabrò, F., Della Spina, L., Eds.; Springer: Cham, Switzerland, 2021; Volume 178, pp. 1116–1130. [Google Scholar] [CrossRef]
- La Torre, M.; Semplici, L.; Zapata, J.S. Un Modello di Impact Finance per i Comuni: Il Piano Strategico di Mandato BES-Oriented. Corp. Gov. Res. Dev. Stud. 2021, 141–170. [Google Scholar] [CrossRef]
- Katz, E.G. Social Capital and Natural Capital: A Comparative Analysis of Land Tenure and Natural Resource Management in Guatemala. Land Econ. 2000, 76, 114. [Google Scholar] [CrossRef]
- Coleman, J.S. Social Capital in the Creation of Human Capital; Oxford University Press: Oxford, UK, 2003. [Google Scholar] [CrossRef]
- de Hart, J.; Dekker, P. A tale of two cities: Local patterns of social capital. In Generating Social Capital: Civil Society and Institutions in Comparative Perspective; Hooghe, M., Stolle, D., Eds.; Palgrave: New York, NY, USA, 2003; pp. 153–170. [Google Scholar]
- Napoli, G.; Giuffrida, S.; Trovato, M.R. Efficiency versus Fairness in the Management of Public Housing Assets in Palermo (Italy). Sustainability 2019, 11, 1199. [Google Scholar] [CrossRef] [Green Version]
- Lowndes, V.; Wilson, D.J. Social Capital and Local Governance: Exploring the Institutional Design Variable. Political Stud. 2001, 49, 629–647. [Google Scholar] [CrossRef]
- Maloney, W.; Smith, G.; Stoker, G. Social Capital and Urban Governance: Adding a More Contextualized ‘Top-down’ Per-spective. Political Stud. 2000, 48, 802–882. [Google Scholar] [CrossRef]
- Newton, K. Trust, social capital, civil society, and democracy. Int. Political Sci. Rev. 2001, 22, 201–214. [Google Scholar] [CrossRef]
- Glaeser, E.L.; Charles Redlick, C. Social Capital and Urban Growth; Working Paper 14374; National Bureau of Economic Research: Cambridge, MA, USA, 2008; Available online: http://www.nber.org/papers/w14374 (accessed on 10 October 2021).
- Goodwin, N.R. Five Kinds of Capital: Useful Concepts for Sustainable Development. 2003. Available online: http://ageconsearch.umn.edu/bitstream/15595/1/wp030007.pdf (accessed on 10 October 2021).
- World Bank. Where is the wealth of nations? Measuring Capital for the 21st Century. 2006. Available online: http://siteresources.worldbank.org/INTEEI/214578-1110886258964/20748034/All.pdf (accessed on 10 October 2021).
- Napoli, G.; Giuffrida, S.; Trovato, M.R. Fair Planning and Affordability Housing in Urban Policy. The Case of Syracuse (Italy). In ICCSA 2016, LNCS 9789; Gervasi, O., Apduhan, B.O., Taniar, D., Torre, C.M., Wang, S., Misra, S., Murgante, B., et al., Eds.; Springer International Publishing: Cham, Switzerland, 2016; Part III, pp. 46–62. [Google Scholar] [CrossRef]
- Camagni, R.; Capello, R. Regional Competitiveness and Territorial Capital: A Conceptual Approach and Empirical Evidence from the European Union. Reg. Stud. 2013, 47, 1383–1402. [Google Scholar] [CrossRef]
- Clawson, M. Economic and social conflicts in land use planning. Nat. Resour. J. 1975, 15, 473–489. [Google Scholar]
- Sumner, J.; Bird, L.; Smith, H. Carbon Taxes: A Review of Experience and Policy Design Considerations; Technical Report NREL/TP-6A2-47312; National Renewable Energy Laboratory: Golden, CO, USA, 2011. Available online: http://www.nrel.gov/docs/fy10osti/47312.pdf (accessed on 2 April 2021).
- Spilimbergo, A.; Ubeda, L. A model of multiple equilibria in geographic labor mobility. J. Dev. Econ. 2004, 73, 107–123. [Google Scholar] [CrossRef]
- Winnick, L. Place Prosperity vs. People Prosperity: Welfare Considerations in the Geographic Redistribution of Economic Ac-tivity. In Real Estate Research Program, University of California at Los Angeles, Essay in Urban Land Economics in Honor of the Sixty Fifth Birthday of Leo Grebler; Real Estate Research Program: Los Angeles, CA, USA, 1966; pp. 273–283. [Google Scholar]
- Nocera, F.; Giuffrida, S.; Trovato, M.R.; Gagliano, A. Energy and New Economic Approach for Nearly Zero Energy Hotels. Entropy 2019, 21, 639. [Google Scholar] [CrossRef] [Green Version]
- OECD. Rural-Urban Partnerships—An Integrated Approach to Economic Development; OECD Publishing: Paris, France, 2013. [Google Scholar]
- Peters, A.; Fisher, P. The Failures of Economic Development Incentives. J. Am. Plan. Assoc. 2004, 70, 27–37. [Google Scholar] [CrossRef]
- Camagni, R. Principi di Economia Urbana e Territoriale; Carocci: Rome, Italy, 2011. [Google Scholar]
- Giuffrida, S.; Gagliano, F.; Giannitrapani, E.; Marisca, C.; Napoli, G.; Trovato, M.R. Promoting Research and Landscape Experience in the Management of the Archaeological Networks. A Project-Valuation Experiment in Italy. Sustainability 2020, 12, 4022. [Google Scholar] [CrossRef]
- Chimirri, R.; Meijer, M. Le Culture dell’Abitare Tradizionale per un Riuso dei Paesi della Calabria; FrancoAngeli: Milano, Italy, 2019. [Google Scholar]
- Belsky, E.S.; DuBroff, N.; McCue, D.; Harris, C.; McCartney, S.; Molinsky, J. Advancing Inclusive and Sustainable Urban Development: Correcting Planning Failures and Connecting Communities to Capital; Joint Center for Housing Studies of Harvard University: Cambridge, MA, USA, 2013. [Google Scholar]
- Nabil, N.A.; AbdEldayem, G.E. Influence of mixed land-use on realizing the social capital. HBRC J. 2015, 11, 285–298. [Google Scholar] [CrossRef] [Green Version]
- Copeland, S.; Comes, T.; Bach, S.; Nagenborg, M.; Schulte, Y.; Doorn, N. Measuring social resilience: Trade-offs, challenges and opportunities for indicator models in transforming societies. Int. J. Disaster Risk Reduct. 2020, 51, 101799. [Google Scholar] [CrossRef]
- Agenzia per la Coesione Territoriale. Strategia Nazionale Aree Interne (NSIA). 2011. Available online: https://www.agenziacoesione.gov.it/strategia-nazionale-aree-interne/ (accessed on 13 April 2021).
- Giuffrida, S.; Trovato, M.R.; Strigari, A.; Napoli, G. “Houses for One Euro” and the Territory. Some Estimation Issues for the “Geographic Debt” Reduction. In New Metropolitan Perspectives. NMP 2020. Smart Innovation, Systems and Technologies; Bevilacqua, C., Calabrò, F., Della Spina, L., Eds.; Springer: Cham, Switzerland, 2021; Volume 178, pp. 1043–1052. [Google Scholar] [CrossRef]
- Zamora, J.G. Diferencias sectoriales y regionales de la recesión económica motivadas por la pandemia de la COVID-19 en México y medidas de política pública para enfrentarla. Investig. Geogr. 2021, 105, e60391. [Google Scholar] [CrossRef]
- Vecchio, G.; Tiznado-Aitken, I.; Steiniger, S. Vulnerable individuals and institutions: The double territorial burden of COVID-19 in Chile. Town Plan. Rev. 2021, 92, 271–277. [Google Scholar] [CrossRef]
- Zizek, S. Virus. Catastrofe e Solidarietà; Ponte delle Grazie: Firenze, Italy, 2020. [Google Scholar]
- Sébastien, L.; Bauler, T. Use and influence of composite indicators for sustainable development at the EU-level. Ecol. Indic. 2013, 35, 3–12. [Google Scholar] [CrossRef] [Green Version]
- Ferguson, N.; Woods, L. Travel and mobility. In Dimensions of the Sustainable City, Future City; Jenks, M., Jones, C., Eds.; Springer: Dordrecht, The Netherlands, 2010; Volume 2, pp. 53–74. [Google Scholar]
- Ministero dell’Ambiente e della Tutela del Territorio e del Mare. L’agenda 2030 e Gli Accordi Globali Sullo Sviluppo Sostenibile. Available online: www.minambiente.it/pagina/lagenda-2030-e-gli-accordi-globali-sullo-sviluppo-sostenibile (accessed on 10 October 2021).
- Morrison, N.; Pearce, B. Developing indicators for evaluating the effectiveness of the UK land use planning system. Town Plan. Rev. 2000, 71, 191. [Google Scholar] [CrossRef]
- Shiels, C.; Baker, D.; Barrow, S. “How accurately does regeneration target local need?” Targeting deprived communities in the UK. Int. J. Public Sect. Manag. 2013, 26, 203–215. [Google Scholar] [CrossRef]
- de Groot, R. Function-analysis and valuation as a tool to assess land use conflicts in planning for sustainable, multi-functional landscapes. Landsc. Urban Plan. 2006, 75, 175–186. [Google Scholar] [CrossRef]
- Della Spina, L.; Giorno, C.; Casmiro, R.G. An Integrated Decision Support System to Define the Best Scenario for the Adaptive Sustainable Re-Use of Cultural Heritage in Southern Italy. In New Metro-Politan Perspectives. NMP 2020. Smart Innovation, Systems and Technologies; Bevilacqua, C., Calabrò, F., Della Spina, L., Eds.; Springer: Cham, Switzerland, 2020; Volume 177, pp. 251–267. [Google Scholar] [CrossRef]
- Agenzia per la Coesione Territoriale. La Finanza Territoriale 2021—Regioni e Territori, Dall’emergenza Sanitaria al PNRR. 2021. Available online: https://agenziacoesione.sebina.it/SebinaOpac/news/la-finanza-territoriale-2021-regioni-e-territori-dallemergenza-sanitaria-al-pnrr/563 (accessed on 15 April 2021).
- Boscarino, S.; Federico, A.; Giuffrida, S.; Prescia, R.; Rizzo, F. Petralia Soprana. Ipotesi di Restauro Urbano e Studi di Analisi Multi-criteriale; Medina: Palermo, Italy, 1994. [Google Scholar]
- Bolasco, S. Analisi Multidimensionale dei Dati. Metodi, Strategie e Criteri D’Interpretazione, 6th ed.; Carocci: Rome, Italy, 2014. [Google Scholar]
- Giuffrida, S. City as Hope. Valuation Science and the Ethics of Capital. In Integrated Evaluation for the Management of Contemporary Cities, Green Energy and Technology; Mondini, G., Fattinnanzi, E., Oppio, A., Bottero, M., Stanghellini, S., Eds.; Springer: Cham, Switzerland, 2018; pp. 411–424. [Google Scholar] [CrossRef]
- Giuffrida, S. A Fair City. Value, Time and the Cap Rate. In Integrated Evaluation for the Management of Contemporary Cities, Green Energy and Technology; Mondini, G., Fattinnanzi, E., Oppio, A., Bottero, M., Stanghellini, S., Eds.; Springer: Cham, Switzerland, 2018; pp. 425–439. [Google Scholar] [CrossRef]
- Trovato, M.R.; Clienti, C.; Giuffrida, S. People and the City: Urban Fragility and the Real Estate-Scape in a Neighborhood of Catania, Italy. Sustainability 2020, 12, 5409. [Google Scholar] [CrossRef]
- Glaeser, E.L.; Berry, C.R. The Divergence of Human Capital Levels Across Cities; NBER Working Paper #11617; Annual Reviews Inc.: Palo Alto, CA, USA, 2005. [Google Scholar]
- Gabrielli, L.; Giuffrida, S.; Trovato, M.R. Gaps and Overlaps of Urban Housing Sub-market: Hard Clustering and Fuzzy Clustering Approaches. In Appraisal from Theory to Practice; Green Energy and Technology; Stanghellini, S., Morano, P., Bottero, M., Oppio, A., Eds.; Springer Nature Switzerland AG: Cham, Switzerland, 2016; pp. 203–219. [Google Scholar] [CrossRef]
- Gabrielli, L.; Giuffrida, S.; Trovato, M.R. From Surface to Core: A Multi-Layer Approach for the Real Estate Market Analysis of a Central Area in Catania. In Computational Science and Its Applications—ICCSA 2015, LCNS 9157; Gervasi, O., Murgante, B., Misra, S., Gavrilova, M.L., Rocha, A.M.A.C., Torre, C.M., Taniar, D., et al., Eds.; Springer Nature Switzerland AG: Cham, Switzerland, 2015; Volume III, pp. 284–300. [Google Scholar] [CrossRef]
- Gabrielli, L.; Giuffrida, S.; Trovato, M.R. Functions and Perspectives of Public Real Estate in the Urban Policies: The Sustainable Development Plan of Syracuse. In Computational Science and Its Applications—ICCSA 2016, LNCS 9789; Gervdasi, O., Murgante, B., Misra, S., Rocha, A.M.A.C., Torre, C.M., Taniar, D., Apduhan, B.O., et al., Eds.; Springer Nature Switzerland AG: Cham, Switzerland, 2016; Volume IV, pp. 13–28. [Google Scholar] [CrossRef]
- Napoli, G.; Giuffrida, S.; Trovato, M.R.; Valenti, A. Cap Rate as the Interpretative Variable of the Urban Real Estate Capital Asset: A Comparison of Different Sub-Market Definitions in Palermo, Italy. Buildings 2017, 7, 80. [Google Scholar] [CrossRef] [Green Version]
- Valenti, A.; Giuffrida, S.; Linguanti, F. Decision Trees Analysis in a Low Tension Real Estate Market: The Case of Troina (Italy). Comput. Sci. Appl. 2015, 91, 237–252. [Google Scholar] [CrossRef]
- Presidente della Repubblica. Disposizioni Urgenti per la Revisione della Spesa Pubblica con Invarianza dei Servizi ai Cittadini. Decreto-Legge del 6 Luglio 2012 n. 95 (Pubblicato in Gazzetta Ufficiale n. 156 del 6 Luglio 2012—Supplemento Ordinario). Available online: https://www.agenziaentrate.gov.it/portale/documents/20143/261699/Dl+06072012+n95_DL_95_6luglio2012.pdf/dd12dfa9-f6ec-2242-3ab6-8db8d3f8738e?version=1.0 (accessed on 1 August 2021).
- Bilsborrow, R.; Okoth-Ogendo, H.W.O. Population-driven changes in land-use in developing countries. Ambio 1992, 21, 37–45. [Google Scholar]
- Trovato, M.R. Human Capital Approach in the Economic Assessment of Interventions for the Reduction of Seismic Vulnerability in Historic Centres. Sustainability 2020, 12, 8059. [Google Scholar] [CrossRef]
- Reckien, D. What is in an index? Construction method, data metric, and weighting scheme determine the outcome of composite social vulnerability indices in New York City. Reg. Environ. Chang. 2018, 18, 1439–1451. [Google Scholar] [CrossRef] [Green Version]
- D’Agostini, F. Introduzione alla Verità; Bollati Boringhieri: Torino, Italy, 2011. [Google Scholar]
- Khan, S. Vulnerability assessments and their planning implications: A case study of the Hutt Valley, New Zealand. Nat. Hazards 2012, 64, 1587–1607. [Google Scholar] [CrossRef]
- Keeney, R.L.; Raiffa, H.; Meyer, R.F. Decisions with Multiple Objectives: Preferences and Value Trade-Offs; Cambridge University Press: Cambridge, UK, 1993. [Google Scholar]
- Von Winterfeldt, D.; Edwards, W. Decision Analysis and Behavioral Research; Cambridge University Press: Cambridge, UK, 1986. [Google Scholar]
- Montibeller, G.; Yoshizaki, H. A Framework for Locating Logistic Facilities with Multi-Criteria Decision Analysis. Lect. Notes Comput. Sci. 2011, 6576, 505–519. [Google Scholar] [CrossRef]
- Herwijnen, M.V. Spatial Decision Support for Environmental Management; Vrije Universiteit: Amsterdam, The Netherlands, 1999. [Google Scholar]
- Beinat, E. Value Functions for Environmental Management; Kluwer Academic Publishers: Dordrecht, The Netherlands, 1997. [Google Scholar]
- Roy, B.; Mousseau, V. A theoretical framework for analysing the notion of relative importance of criteria. J. Multi. Crit. Decis. Anal. 1996, 5, 145–159. [Google Scholar] [CrossRef]
- Choo, E.U.; Schoner, B.; Wedley, W.C. Interpretation of criteria weights in multicriteria decision making. Comput. Ind. Eng. 1999, 37, 527–541. [Google Scholar] [CrossRef]
- Poyhonen, M.; Hamalainen, R.P. On the convergence of multi-attribute weighting methods. Eur. J. Oper. Res. 2001, 129, 569–585. [Google Scholar] [CrossRef] [Green Version]
- Carpenter, J. Addressing Europe’s Urban Challenges: Lessons from the EU URBAN Community Initiative. Urban Stud. 2006, 43, 2145–2162. [Google Scholar] [CrossRef]
- Khare, A.T. Putting People Back into Place-Based Public Policies. J. Urban Aff. 2015, 37, 47–52. [Google Scholar] [CrossRef]
- Arribas-Bel, D.; Kourtit, K.; Nijkamp, P. Benchmarking of world cities through Self-Organizing Maps. Cities 2013, 31, 248–257. [Google Scholar] [CrossRef] [Green Version]
- Luque-Martínez, T.; Muñoz-Leiva, F. City benchmarking: A methodological proposal referring specifically to Granada. Cities 2005, 22, 411–423. [Google Scholar] [CrossRef]
- Dallara, A.; Rizzi, P. Geographic Map of Sustainability in Italian Local Systems. Reg. Stud. 2012, 46, 321–337. [Google Scholar] [CrossRef]
- Hagelman, R. Visualizing Demographic Trajectories with Self-Organizing Maps. GeoInformatica 2005, 9, 159–179. [Google Scholar] [CrossRef]
- Vallés-Planells, M.; Galiana, F.; Van Eetvelde, V. A Classification of Landscape Services to Support Local Landscape Planning. Ecol. Soc. 2014, 19. [Google Scholar] [CrossRef] [Green Version]
- Giuffrida, S.; Ventura, V.; Trovato, M.R.; Napoli, G. Axiology of the historic city and the cap rate the case of the old town of Ragusa superior. Valori Valutazioni 2017, 18, 41–55. [Google Scholar]
- Giuffrida, S.; Carocci, C.; Circo, C.; Giuffre, M.; Rosa Trovato, M.; Ventura, V. Axiological strategies in the old towns seismic vulnerability mitigation planning. Valori Valutazioni 2020, 25, 99–106. [Google Scholar]
- Giuffrida, S.; Trovato, M.R.; Circo, C.; Ventura, V.; Giuffrè, M.; Macca, V. Seismic Vulnerability and Old Towns. A Cost-Based Programming Model. Geosciences 2019, 9, 427. [Google Scholar] [CrossRef] [Green Version]
- Dempsey, N.; Brown, C.; Raman, S.; Porta, S.; Jenks, M.; Jones, C.; Bramley, G. Elements of urban form. In Dimensions of the Sustainable City. Future City; Jenks, M., Jones, C., Eds.; Springer: Dordrecht, The Netherlands, 2010; Volume 2, pp. 21–51. [Google Scholar]
- Jabareen, Y.R. Sustainable urban forms: Their typologies, models, and concepts. Plan. Educ. Res. 2006, 26, 38–52. [Google Scholar] [CrossRef]
- Jenks, M.; Jones, C. Issues and concepts. In Dimensions of the Sustainable City. Future City; Jenks, M., Jones, C., Eds.; Springer: Dordrecht, The Netherlands, 2010; Volume 2, pp. 1–19. [Google Scholar]
- Lynch, K. A Theory of Good City Form; MIT Press: Cambridge, MA, USA, 1981; pp. 111–120. [Google Scholar]
- Bolton, R. ‘Place Prosperity vs. People Prosperity’ Revisited: An Old Issue with a New Angle. Urban Stud. 1992, 29, 185–203. [Google Scholar] [CrossRef]
- Bonomi, A.; Masiero, R. Dalla Smart City alla Smart Land; Marsilio Editori: Venezia, Italy, 2014. [Google Scholar]
- Croci, E.; L’agenda Urbana per lo Sviluppo Sostenibile. Presentazione Incontro OCSE-ComPA, Trasformazioni Ambientali e Paesaggi Locali, 31 Ottobre 2018, Udine. 2018. Available online: https://compa.fvg.it/I-nostri-progetti/Comprendere-le-tendenze-globali-per-innovare-gliEE.LL/Trasformazioni-ambientali-e-paesaggi-locali (accessed on 10 October 2021).
- Giuffrida, S.; Ventura, V.; Nocera, F.; Trovato, M.R.; Gagliano, F. Technological, Axiological and Praxeological Coordination in the Energy-Environmental Equalization of the Strategic Old Town Renovation Programs. In Values and Functions for Future Cities; Mondini, G., Oppio, A., Stanghellini, S., Bottero, M., Abastante, F., Eds.; Part of Green Energy and Technology; Springer Nature Switzerland AG: Cham, Switzerland, 2019; pp. 425–446. [Google Scholar] [CrossRef]
- Wenger, E. Communities of Practice: Learning, Meaning and Identity; World Commission on Environment and Development (WCED); Cambridge University Press: New York, NY, USA, 1987. [Google Scholar]
- OECD. Culture and Local Development; OECD Publishing: Paris, France, 2005. [Google Scholar] [CrossRef]
- Bettencourt, L.M.A. The Origins of Scaling in Cities. Science 2013, 340, 1438–1441. [Google Scholar] [CrossRef] [Green Version]
- Batty, M. The Size, Scale, and Shape of Cities. Science 2008, 319, 769–771. [Google Scholar] [CrossRef] [Green Version]
- Giannelli, A.; Giuffrida, S.; Trovato, M.R. Madrid Rio Park. Symbolic Values and Contingent Valuation, Valori e valutazioni. E-Flow Tipogr. Genio Civ. 2018, 21, 75–85. [Google Scholar]
- UN-Habitat. International Guidelines on Urban and Territorial Plan. Handbook. HS/052/18E. 2018. Available online: https://unhabi-tat.org/sites/default/files/documents/2019-05/international_guidelines_on_urban_and_territorial_planning_-_handbook_.pdf (accessed on 10 October 2021).
- UN-Habitat. Implementing the New Urban Agenda by Strengthening Urban-Rural Linkages. HS/035/17E. 2017. Available online: https://urban-gate-way.org/system/files/documents/urbangateway/urban_rural_linkages_for_implementing_the_new_urban_agenda_low_resolution.pdf (accessed on 10 October 2021).
- Del Espino Hidalgo, B. Mid-Sized Cities in the centre of Andalusia. An approach to an urban-territorial phenomeno. Rev. De Estud. Reg. 2017, 108, 165–191. [Google Scholar]
- Adam, B. Medium-sized cities in urban regions. Eur. Plan. Stud. 2006, 14, 547–555. [Google Scholar] [CrossRef]
- Boix, D.R.; Trullén, T.J. Policentrism and space structure: A critical review from the perspective of research programs. Archit. City Environ. 2012, 18, 27–54. Available online: http://www-cpsv.upc.es/ace/Articles_n18/articles_PDF/ACE_18_SE_20.pdf (accessed on 2 April 2021).
- Giuffrida, S.; Gagliano, F.; Nocera, F.; Trovato, M.R. Landscape Assessment and Economic Accounting in Wind Farm Programming: Two Cases in Sicily. Land 2018, 7, 120. [Google Scholar] [CrossRef] [Green Version]
- Camagni, R.; Capello, R.; Caragliu, A. Equilibrium vs. optimal city size: Evidence from Italian cities. Int. J. Glob. Environ. Issues 2014, 13, 170. [Google Scholar] [CrossRef]
- Matthews, R.; Selman, P. Landscape as a Focus for Integrating Human and Environmental Processes. J. Agric. Econ. 2006, 57, 199–212. [Google Scholar] [CrossRef]
- Xinyue, Y.; Xingjian, L. (Eds.) Cities as Spatial and Social Networks; Springer Nature: Cham, Switzerland, 2019. [Google Scholar]
- Pflieger, G.; Rozenblat, C. Introduction. Urban Networks and Network Theory: The City as the Connector of Multiple Net-works. Urban Stud. 2010, 47, 2723–2735. Available online: https://www.jstor.org/stable/43079955 (accessed on 22 September 2021). [CrossRef] [Green Version]
- Napoli, G.; Giuffrida, S.; Trovato, M.R. A Paradigm Interpreting the City and the Analytic Network Process for the Management of Urban Transformations. In Proceedings of the Smart Innovation, Systems and Technologies, 3rd International New Metropolitan Perspectives. Local Knowledge and Innovation Dynamics towards Territory Attractiveness through the Implementation of Hori-zon/Europe2020/Agenda2030, Reggio Calabria, Italy, 22–25 May 2018; Bevilacqua, C., Calabrò, F., Della Spina, L., Eds.; Springer Science and Business Media Deutschland GmbH: Cham, Switzerland, 2019; Volume 101, pp. 672–680. [Google Scholar] [CrossRef] [Green Version]
- Mazziotta, M.; Pareto, A.A. Composite index for measuring italian regions’ development over time. Riv. Ital. Econ. Demogr. 2014, 68, 127–134. [Google Scholar]
- Pawlowsky-Glahn, V.; Buccianti, A. Compositional Data Analysis: Theory and Applications; John Wiley & Sons: Chichester, UK, 2011. [Google Scholar]
- Pawlowsky-Glahn, V.; Egozcue, J.J. Geometric approach to statistical analysis in the symplex. Stoch. Environ. Res. Risk Assess. 2001, 15, 384–398. [Google Scholar] [CrossRef]
- Pawlowsky-Glahn, V.; Egozcue, J.J.; Tolosana-Delgado, R. Modelling and Analysis of Compositional Data; Wiley: Hoboken, NJ, USA, 2015. [Google Scholar]
- Giuffrida, S.; Casamassima, G.; Trovato, M.R. Le norme EMAS-ISO nella valutazione della qualità del servizio idrico integrato. Aestimum 2017, 70, 109–134. [Google Scholar] [CrossRef]
- Ramsay, J.; Silvermann, B. Functional Data Analysis. Springer Series in Statistics. Biom. J. 1998, 40, 56. [Google Scholar] [CrossRef]
- Pires, S.M.; Fidélis, T.; Ramos, T. Measuring and comparing local sustainable development through common indicators: Constraints and achievements in practice. Cities 2014, 39, 1–9. [Google Scholar] [CrossRef]
- Van den Boogaart, K.G.; Tolosana-Delgado, R.; Bren, M. Compositions: Compositional Data Analysis. R Package Version 1.40-2. 2018. Available online: https://CRAN.R-project.org/package=compositions (accessed on 1 August 2021).
- Anselin, L. Local indicators of spatial association—LISA. Geogr. Anal. 1995, 27, 93–115. [Google Scholar] [CrossRef]
- Anselin, L.; Syabri, I.; Kho, Y. GeoDa: An Introduction to Spatial Data Analysis. Geogr. Anal. 2005, 38, 5–22. [Google Scholar] [CrossRef]
- Greenbaum, R.; Bondonio, D. Losing Focus: A Comparative Evaluation of Spatially Targeted Economic Revitalization Programmes in the US and the EU. Reg. Stud. 2004, 38, 319–334. [Google Scholar] [CrossRef]
- Cerreta, M.; Panaro, S.; Poli, G. A Spatial Decision Support System for Multifunctional Landscape Assessment: A Transformative Resilience Perspective for Vulnerable Inland Areas. Sustainability 2021, 13, 2748. [Google Scholar] [CrossRef]
- Giuffrida, S.; Trovato, M.R.; Falzone, M. The Information Value for Territorial and Economic Sustainability in the Enhancement of the Water Management Process. Comput. Sci. Appl. 2017, 10406, 575–590. [Google Scholar] [CrossRef]
- Cerreta, M.; Panaro, S. From Perceived Values to Shared Values: A Multi-Stakeholder Spatial Decision Analysis (M-SSDA) for Resilient Landscapes. Sustainability 2017, 9, 1113. [Google Scholar] [CrossRef] [Green Version]
- Chen, Y.; Yu, J.; Khan, S. Spatial sensitivity analysis of multi-criteria weights in GIS-based land suitability evaluation. Environ. Model. Softw. 2010, 25, 1582–1591. [Google Scholar] [CrossRef]
- Bailey, K.; Grossardt, T. Toward structured public involvement: Justice, geography and collaborative geospatial/geovisual de-cision support systems. Ann. Assoc. Am. Geogr. 2010, 100, 57–86. [Google Scholar] [CrossRef]
- Partridge, M.D.; Rickman, D.; Olfert, M.R.; Tan, Y. When Spatial Equilibrium Fails: Is Place-Based Policy Second Best? Reg. Stud. 2013, 49, 1303–1325. [Google Scholar] [CrossRef] [Green Version]
- Spielman, S.E.; Thill, J.-C. Social area analysis, data mining, and GIS. Comput. Environ. Urban Syst. 2008, 32, 110–122. [Google Scholar] [CrossRef]
- Giuffrida, S.; Gagliano, F.; Trovato, M.R. Land as Information. A Multidimensional Valuation Approach for Slow Mobility Planning. In Proceedings of the 7th International Conference on Information and Communication Technologies in Agriculture, Food and Environment (HAICTA 2015), Kavala, Greece, 17–20 September 2015; Andreopoulou, Z., Bochtis, D., Eds.; CEUR Workshop Proceedings: Aachen, Germany, 2015; pp. 879–891. [Google Scholar]
- Malczewski, J. GIS-based multicriteria decision analysis: A survey of the literature. Int. J. Geogr. Inf. Sci. 2006, 20, 703–726. [Google Scholar] [CrossRef]
- Berkes, F. Understanding uncertainty and reducing vulnerability: Lessons from resilience thinking. Nat. Hazards 2007, 41, 283–295. [Google Scholar] [CrossRef]
- Graziano, P.; Rizzi, P. Resilience and vulnerability in European regions. Sci. Reg. 2020, 19, 91–118. [Google Scholar] [CrossRef]
- Balletto, G.; Borruso, G.; Murgante, B.; Milesi, A.; Ladu, M. Resistance and Resilience. A Methodological Approach for Cities and Territories in Italy. In Proceedings of the International Conference on Computational Science and Its Applications, Cagliari, Italy, 13–16 September 2021; Springer: Cham, Switzerland, 2021; pp. 218–229. [Google Scholar] [CrossRef]
- Prigogine, I.; Nicolis, G. Self-Organization in Non-Equilibrium Systems; Wiley: Hoboken, NJ, USA, 1977. [Google Scholar]
- Rizzo, F. Value and Evaluations. The Science of Economics or the Economics of Science; Franco Angeli: Milan, Italy, 1999. [Google Scholar]


| 1951 | 1961 | 1971 | 1981 | 1991 | 2001 | 2016 | |
|---|---|---|---|---|---|---|---|
| Agira | 16,528 | 14,079 | 11,814 | 9146 | 9150 | 8348 | 8301 |
| Aidone | 10,106 | 8905 | 7551 | 7136 | 7275 | 6057 | 4852 |
| Assoro | 5563 | 5663 | 5167 | 5236 | 5319 | 5393 | 5135 |
| Barrafranca | 14,665 | 14,775 | 14,447 | 15,511 | 13,667 | 13,115 | 13,212 |
| Calascibetta | 8035 | 6956 | 5628 | 4837 | 5014 | 4829 | 4493 |
| Catenanuova | 3993 | 4406 | 4121 | 4420 | 5073 | 4876 | 4798 |
| Centuripe | 11,020 | 10,008 | 8172 | 6915 | 6612 | 5903 | 5416 |
| Cerami | 4652 | 4371 | 3427 | 3182 | 3100 | 2462 | 1979 |
| Enna | 27,263 | 28,323 | 28,189 | 27,838 | 28,273 | 28,983 | 27,586 |
| Gagliano | 5075 | 4846 | 4459 | 4172 | 4173 | 3772 | 3554 |
| Leonforte | 18,391 | 17,927 | 16,364 | 15,808 | 15,147 | 14,145 | 13,305 |
| Nicosia | 19,275 | 18,191 | 15,324 | 15,212 | 15,029 | 14,812 | 13,762 |
| Nissoria | 3438 | 3115 | 3032 | 3296 | 3152 | 3014 | 2992 |
| Piazza Armerina | 26,739 | 24,887 | 22,134 | 21,019 | 22,355 | 21,038 | 21,782 |
| Pietraperzia | 13,886 | 13,226 | 11,026 | 10,996 | 8015 | 7340 | 6919 |
| Regalbuto | 11,768 | 11,239 | 10,159 | 7621 | 7981 | 7744 | 7233 |
| Sperlinga | 1552 | 1432 | 1216 | 1053 | 1065 | 963 | 783 |
| Troina | 14,075 | 13,066 | 11,853 | 11,052 | 10,406 | 10,061 | 9310 |
| Valguarnera | 15,592 | 13,829 | 11,167 | 10,252 | 9171 | 8649 | 7774 |
| Villarosa | 11,059 | 9882 | 6881 | 6237 | 6205 | 5696 | 4866 |
| 1951–1961 | 1961–1971 | 1971–1981 | 1981–1991 | 1991–2001 | 2001–2016 | Average | |
|---|---|---|---|---|---|---|---|
| Agira | −14.8% | −16.1% | −22.6% | 0.0% | −8.8% | −0.6% | −10.5% |
| Aidone | −11.9% | −15.2% | −5.5% | 1.9% | −16.7% | −19.9% | −11.2% |
| Assoro | 1.8% | −8.8% | 1.3% | 1.6% | 1.4% | −4.8% | −1.2% |
| Barrafranca | 0.8% | −2.2% | 7.4% | −11.9% | −4.0% | 0.7% | −1.5% |
| Calascibetta | −13.4% | −19.1% | −14.1% | 3.7% | −3.7% | −7.0% | −8.9% |
| Catenanuova | 10.3% | −6.5% | 7.3% | 14.8% | −3.9% | −1.6% | 3.4% |
| Centuripe | −9.2% | −18.3% | −15.4% | −4.4% | −10.7% | −8.3% | −11.0% |
| Cerami | −6.0% | −21.6% | −7.1% | −2.6% | −20.6% | −19.6% | −12.9% |
| Enna | 3.9% | −0.5% | −1.2% | 1.6% | 2.5% | −4.8% | 0.2% |
| Gagliano | −4.5% | −8.0% | −6.4% | 0.0% | −9.6% | −5.8% | −5.7% |
| Leonforte | −2.5% | −8.7% | −3.4% | −4.2% | −6.6% | −5.9% | −5.2% |
| Nicosia | −5.6% | −15.8% | −0.7% | −1.2% | −1.4% | −7.1% | −5.3% |
| Nissoria | −9.4% | −2.7% | 8.7% | −4.4% | −4.4% | −0.7% | −2.1% |
| Piazza Armerina | −6.9% | −11.1% | −5.0% | 6.4% | −5.9% | 3.5% | −3.2% |
| Pietraperzia | −4.8% | −16.6% | −0.3% | −27.1% | −8.4% | −5.7% | −10.5% |
| Regalbuto | −4.5% | −9.6% | −25.0% | 4.7% | −3.0% | −6.6% | −7.3% |
| Sperlinga | −7.7% | −15.1% | −13.4% | 1.1% | −9.6% | −18.7% | −10.6% |
| Troina | −7.2% | −9.3% | −6.8% | −5.8% | −3.3% | −7.5% | −6.6% |
| Valguarnera | −11.3% | −19.2% | −8.2% | −10.5% | −5.7% | −10.1% | −10.9% |
| Villarosa | −10.6% | −30.4% | −9.4% | −0.5% | −8.2% | −14.6% | −12.3% |
| 1951–2016 | 1961–2016 | 1971–2016 | 1981–2016 | 1991–2016 | 2001–2016 | Average | |
|---|---|---|---|---|---|---|---|
| Agira | −49.8% | −41.0% | −29.7% | −9.2% | −9.3% | −0.6% | −23.3% |
| Aidone | −52.0% | −45.5% | −35.7% | −32.0% | −33.3% | −19.9% | −36.4% |
| Assoro | −7.7% | −9.3% | −0.6% | −1.9% | −3.5% | −4.8% | −4.6% |
| Barrafranca | −9.9% | −10.6% | −8.5% | −14.8% | −3.3% | 0.7% | −7.7% |
| Calascibetta | −44.1% | −35.4% | −20.2% | −7.1% | −10.4% | −7.0% | −20.7% |
| Catenanuova | 20.2% | 8.9% | 16.4% | 8.6% | −5.4% | −1.6% | 7.8% |
| Centuripe | −50.9% | −45.9% | −33.7% | −21.7% | −18.1% | −8.3% | −29.7% |
| Cerami | −57.5% | −54.7% | −42.3% | −37.8% | −36.2% | −19.6% | −41.3% |
| Enna | 1.2% | −2.6% | −2.1% | −0.9% | −2.4% | −4.8% | −2.0% |
| Gagliano | −30.0% | −26.7% | −20.3% | −14.8% | −14.8% | −5.8% | −18.7% |
| Leonforte | −27.7% | −25.8% | −18.7% | −15.8% | −12.2% | −5.9% | −17.7% |
| Nicosia | −28.6% | −24.3% | −10.2% | −9.5% | −8.4% | −7.1% | −14.7% |
| Nissoria | −13.0% | −3.9% | −1.3% | −9.2% | −5.1% | −0.7% | −5.5% |
| Piazza Armerina | −18.5% | −12.5% | −1.6% | 3.6% | −2.6% | 3.5% | −4.7% |
| Pietraperzia | −50.2% | −47.7% | −37.2% | −37.1% | −13.7% | −5.7% | −31.9% |
| Regalbuto | −38.5% | −35.6% | −28.8% | −5.1% | −9.4% | −6.6% | −20.7% |
| Sperlinga | −49.5% | −45.3% | −35.6% | −25.6% | −26.5% | −18.7% | −33.5% |
| Troina | −33.9% | −28.7% | −21.5% | −15.8% | −10.5% | −7.5% | −19.6% |
| Valguarnera | −50.1% | −43.8% | −30.4% | −24.2% | −15.2% | −10.1% | −29.0% |
| Villarosa | −56.0% | −50.8% | −29.3% | −22.0% | −21.6% | −14.6% | −32.4% |
| Residents in UA | Population Concentration in UA | Residents in HC | Population Concentration in HC | Old Age Index UA (%) | Average Age UA (years) | |
|---|---|---|---|---|---|---|
| Agira | 7701 | 91% | 5060 | 66% | 81 | 38 |
| Aidone | 4929 | 100% | 773 | 16% | 124 | 44 |
| Assoro | 4872 | 91% | 1553 | 32% | 83 | 39 |
| Barrafranca | 13,393 | 96% | 669 | 5% | 90 | 40 |
| Calascibetta | 3802 | 82% | 1241 | 33% | 98 | 36 |
| Catenanuova | 4702 | 94% | 137 | 3% | 68 | 38 |
| Centuripe | 5098 | 91% | 4547 | 89% | 109 | 40 |
| Cerami | 1995 | 93% | 776 | 39% | 137 | 42 |
| Enna | 24,003 | 86% | 5432 | 23% | 109 | 39 |
| Gagliano | 3427 | 92% | 1019 | 30% | 121 | 41 |
| Leonforte | 13,878 | 100% | 3886 | 28% | 80 | 41 |
| Nicosia | 11,306 | 79% | 3781 | 33% | 89 | 35 |
| Nissoria | 2422 | 82% | 634 | 26% | 69 | 34 |
| Piazza Armerina | 18,169 | 82% | 7731 | 43% | 80 | 35 |
| Pietraperzia | 6832 | 95% | 1358 | 20% | 104 | 41 |
| Regalbuto | 6811 | 92% | 2868 | 42% | 95 | 39 |
| Sperlinga | 596 | 72% | 127 | 21% | 116 | 33 |
| Troina | 9081 | 94% | 2946 | 32% | 117 | 42 |
| Valguarnera | 7611 | 93% | 5109 | 67% | 88 | 39 |
| Villarosa | 4744 | 92% | 1920 | 40% | 97 | 40 |
| % High Education Level UA | Families Average Components UA | Building Cubage Index HC | Building Cubage Index SU | % Inhabited Housing Area in UA | % Inhabited Housing Area in HC | |
|---|---|---|---|---|---|---|
| Agira | 28% | 2.22 | 1.41 | 0.0045 | 55% | 35% |
| Aidone | 38% | 2.35 | 1.41 | 0.0034 | 70% | 11% |
| Assoro | 27% | 2.24 | 1.45 | 0.0059 | 62% | 20% |
| Barrafranca | 31% | 2.48 | 2.44 | 0.0424 | 66% | 3% |
| Calascibetta | 30% | 2.04 | 2.26 | 0.0073 | 45% | 15% |
| Catenanuova | 30% | 2.34 | 2.33 | 0.0635 | 78% | 2% |
| Centuripe | 31% | 2.15 | 1.44 | 0.0007 | 68% | 61% |
| Cerami | 30% | 1.99 | 1.22 | 0.0031 | 57% | 23% |
| Enna | 41% | 2.20 | 2.11 | 0.0107 | 61% | 13% |
| Gagliano | 32% | 2.17 | 1.53 | 0.0088 | 56% | 16% |
| Leonforte | 30% | 2.57 | 1.82 | 0.0148 | 81% | 21% |
| Nicosia | 29% | 2.01 | 2.03 | 0.0078 | 56% | 18% |
| Nissoria | 28% | 1.98 | 0.49 | 0.0074 | 55% | 14% |
| Piazza Armerina | 36% | 1.95 | 1.80 | 0.0108 | 54% | 23% |
| Pietraperzia | 28% | 2.29 | 4.59 | 0.0174 | 30% | 6% |
| Regalbuto | 32% | 2.21 | 1.42 | 0.0062 | 54% | 22% |
| Sperlinga | 24% | 1.72 | 1.10 | 0.0021 | 55% | 10% |
| Troina | 35% | 2.23 | 1.72 | 0.0074 | 62% | 21% |
| Valguarnera | 30% | 2.33 | 1.90 | 0.0514 | 72% | 48% |
| Villarosa | 31% | 2.32 | 1.06 | 0.0119 | 58% | 25% |
Publisher’s Note: MDPI stays neutral with regard to jurisdictional claims in published maps and institutional affiliations. |
© 2021 by the authors. Licensee MDPI, Basel, Switzerland. This article is an open access article distributed under the terms and conditions of the Creative Commons Attribution (CC BY) license (https://creativecommons.org/licenses/by/4.0/).
Share and Cite
Nasca, L.; Giuffrida, S.; Trovato, M.R. Value and Quality in the Dialectics between Human and Urban Capital of the City Networks on the Land District Scale. Land 2022, 11, 34. https://doi.org/10.3390/land11010034
Nasca L, Giuffrida S, Trovato MR. Value and Quality in the Dialectics between Human and Urban Capital of the City Networks on the Land District Scale. Land. 2022; 11(1):34. https://doi.org/10.3390/land11010034
Chicago/Turabian StyleNasca, Ludovica, Salvatore Giuffrida, and Maria Rosa Trovato. 2022. "Value and Quality in the Dialectics between Human and Urban Capital of the City Networks on the Land District Scale" Land 11, no. 1: 34. https://doi.org/10.3390/land11010034