Article

Exploring Development Trends of Terrestrial Ecosystem Health—A Case Study from China

1
College of Resources and Environment, Henan Agricultural University, Zhengzhou 450002, China
2
College of Forest, Henan Agricultural University, Zhengzhou 450002, China
3
Henan Land Consolidation and Rehabilitation Center, Zhengzhou 450016, China
*
Author to whom correspondence should be addressed.
Land 2022, 11(1), 32; https://doi.org/10.3390/land11010032
Submission received: 18 November 2021 / Revised: 21 December 2021 / Accepted: 22 December 2021 / Published: 25 December 2021

Abstract

:
Terrestrial ecosystem health (TEH) is the basis of regional sustainability development. The state of TEH is an important research direction in the land science field. The purpose of this paper was to explore the development trends and influencing factors of the. By using the radial basis function (RBF), neural network model, geographic information system (GIS), and the comprehensive index method, this paper predicted the land ecological changes of Henan Province from 2007 to 2025 based on a comprehensive evaluation of the system. The results show that the TEH of Henan Province exhibited a general trend of improvement from 2007 to 2025. The predictions exhibited a tendency to fluctuate and increase, from “severe warning” to “moderate warning” and even to “no warning” state. The early warning index of the subsystem showed a fluctuating upward trend except for the press subsystem, which fluctuated between “extraordinary warning” and “heavy warning” states. The overall TEH level is improving but is largely dependent on effective corresponding measures. The health status of the land ecosystem in Henan Province is guaranteed to be stable due to improvements in rural residential incomes, mechanization levels of cultivated land, domestic sewage treatment rates, and the numbers of scientific and technological personnel per unit of land. The TEH is mainly restricted by the population densities, urbanization levels, inputs of fertilizers and pesticides, and average wastewater load factors of the land. To improve the health level of the land ecosystem, it is necessary to reduce the use of fertilizers and pesticides and to control the urbanization rate. At the same time, improving the level of forest coverage and the effective irrigation rate play a positive role in improving ecosystem health. The results provide a reference for land-use planning and management decisions.

1. Introduction

Ecosystems provide resource support and ecological service guarantees for the sustainable development of human societies [1]. Maintaining a healthy ecosystem state is an important way to achieve the sustainable development of the natural economy and society [2,3]. However, the intensification of human activities, especially the excessive demand for land resources, has led to significant changes in the ecological environment [4]. Factors such as soil pollution [5,6] and reduced farmland quality [7,8] jointly damage the ecosystems. Therefore, with the passage of time, increasing attention has been given to ecological environmental issues. Ecosystem health has become a widely studied research topic. As the basis for providing all resources, terrestrial ecosystems are related to the cycles and development of all ecosystems [9,10]. The vast majority of the population lives on land, so we refer to the terrestrial ecosystem.
The concept of land health was first proposed by American scholars and means that human use has not destroyed the integrity of land [11]. Ecosystem health represents the structural and functional integrity of ecosystems, which can provide resource support and ecological service guarantees for the sustainable development of human societies [12]. Since the 1970s, terrestrial ecosystem health (THE) has received much attention from governments and academia, and its meaning has further evolved. Scholars have conducted much research on the ecosystem changes caused by human activities. For example, microorganisms can be monitored to assess the health status of ecosystems [13,14], the relationships between nutrients and ecosystem health can be analyzed [15,16], and the impacts of different agricultural behaviors on ecosystems can be analyzed [17]. Quantitative detections at the microlevel can accurately reflect the impact of human activities on ecosystems. In addition, some scholars have examined terrestrial ecosystem changes by monitoring land use/land cover (LULC) changes coupled with increased emissions of greenhouse gases [18,19]. However, the economic behaviors resulting from human use of resources such as land are external factors of ecosystem changes, so integrating economic behaviors into the research can provide a more comprehensive understanding of these factors. The Organization for Economic Cooperation and Development (OECD) and the United Nations Environment Program (UNEP) introduced the pressure state response (PSR) model and applied it to the study of environmental problems to indicate the level of ecosystem health [12]. Since then, the PSR model has been widely used in the study of TEH. Many scholars have carried out evaluations in different regions [20,21] and in different ecosystems [22,23], and the indicator systems they have developed are diverse [21,24]. In addition, a number of ecosystem health assessment frameworks are widely used, including driving force–pressure–state-response management (DPSIRM) [25,26] and vitality–organization–resiliency (VOR) [27,28,29]. They all accurately reflect the characteristics of ecosystems. The existing studies mainly focus on current conditions [28,30]. Ecosystem health statuses based on ecosystem early warnings are necessary and should focus on exploring spatiotemporal differences and early warnings for the future, because human impacts on ecosystems lag, and the land destruction losses are difficult to identify in real time [30]. Early warning analysis of TEH helps us to understand and predict the extent of regional ecosystem degradation and it is important for achieving sustainable development [31]. Ecosystem early-warning research based on remote sensing and geographic information systems (GIS) is currently commonly used in several papers [32,33], but most research institutes currently use linear or exponential statistical regression methods [34,35,36]. However, the factors that affect ecosystems are very complex and are often nonlinear.
Considering the above factors, we introduce the radial basis function (RBF) neural network model into the study of TEH early warning. The RBF neural network, as a machine learning method, has a strong fitting ability [37]. It generates a high-precision model by using real data [38]. Compared with other neural networks, it has the following merits: a strong approximation ability, simple network structure, and rapid learning speed [39,40]. It has been widely used in short-term traffic volume forecasting [41], groundwater level forecasting [42], water demand forecasting [43], and many other fields [44]. Nevertheless, it is rarely used in the field of ecosystem assessment [45,46]. Therefore, we applied the RBF neural network in this research as an early warning for the TEH of Henan Province in 2018–2025. In this study, the entropy weight method was used to calculate the index weights, and the comprehensive evaluation method—to evaluate the health status of the ecosystem. Based on the evaluation index of the current conditions, we used the RBF neural network to build a prediction model to provide the health status of ecosystems in the future.
Since its reform and opening up, China has achieved dual growth for the population and economy. However, at the same time, a series of environmental problems, such as environmental pollution and ecological degradation, have brought many challenges to China’s green high-quality development [47,48,49]. At present, the coordinated development of the population, resources, and environment has become a major issue. Since the beginning of this century, the Chinese government has attached great importance to ecological environmental protection and has established an ecological civilization strategy, namely, to realize the decoupling of the economy and ecological impact, and to promote harmony between humans and nature [50]. How to make rational use of land resources, protect the ecological environment and realize the sustainable development of land resources has become a key social issue. General Secretary Xi Jinping pointed out that we should implement strict environmental protection policies and strive to protect the ecosystem. It is crucial to “implement a strict ecological environment protection system and vigorously protect the ecological environment” [51]. Based on this background, we took Henan Province as an example to evaluate and predict the development trends of TEH to provide a reference for the effective regulation and management of the terrestrial ecosystem in Henan.
The purpose of this study is to institute countermeasures to alleviate the early warning of TEH so as to provide guidance for land ecological safety control. Specifically, this study accomplishes the following: (1) It establishes a comprehensive evaluation index system that considers the economy, society, ecology, and environment; (2) analyzes the spatial–temporal evaluation characteristics of TEH and three subsystems (i.e., pressure, state, and response) from 2007–2017; (3) predicts the trend changes of the TEH from 2018–2025 by using an RBF neural network; and (4) analyzes the factors that influence TEH and proposes decision-making knowledge for promoting the development of the ecosystem.

2. Materials and Methods
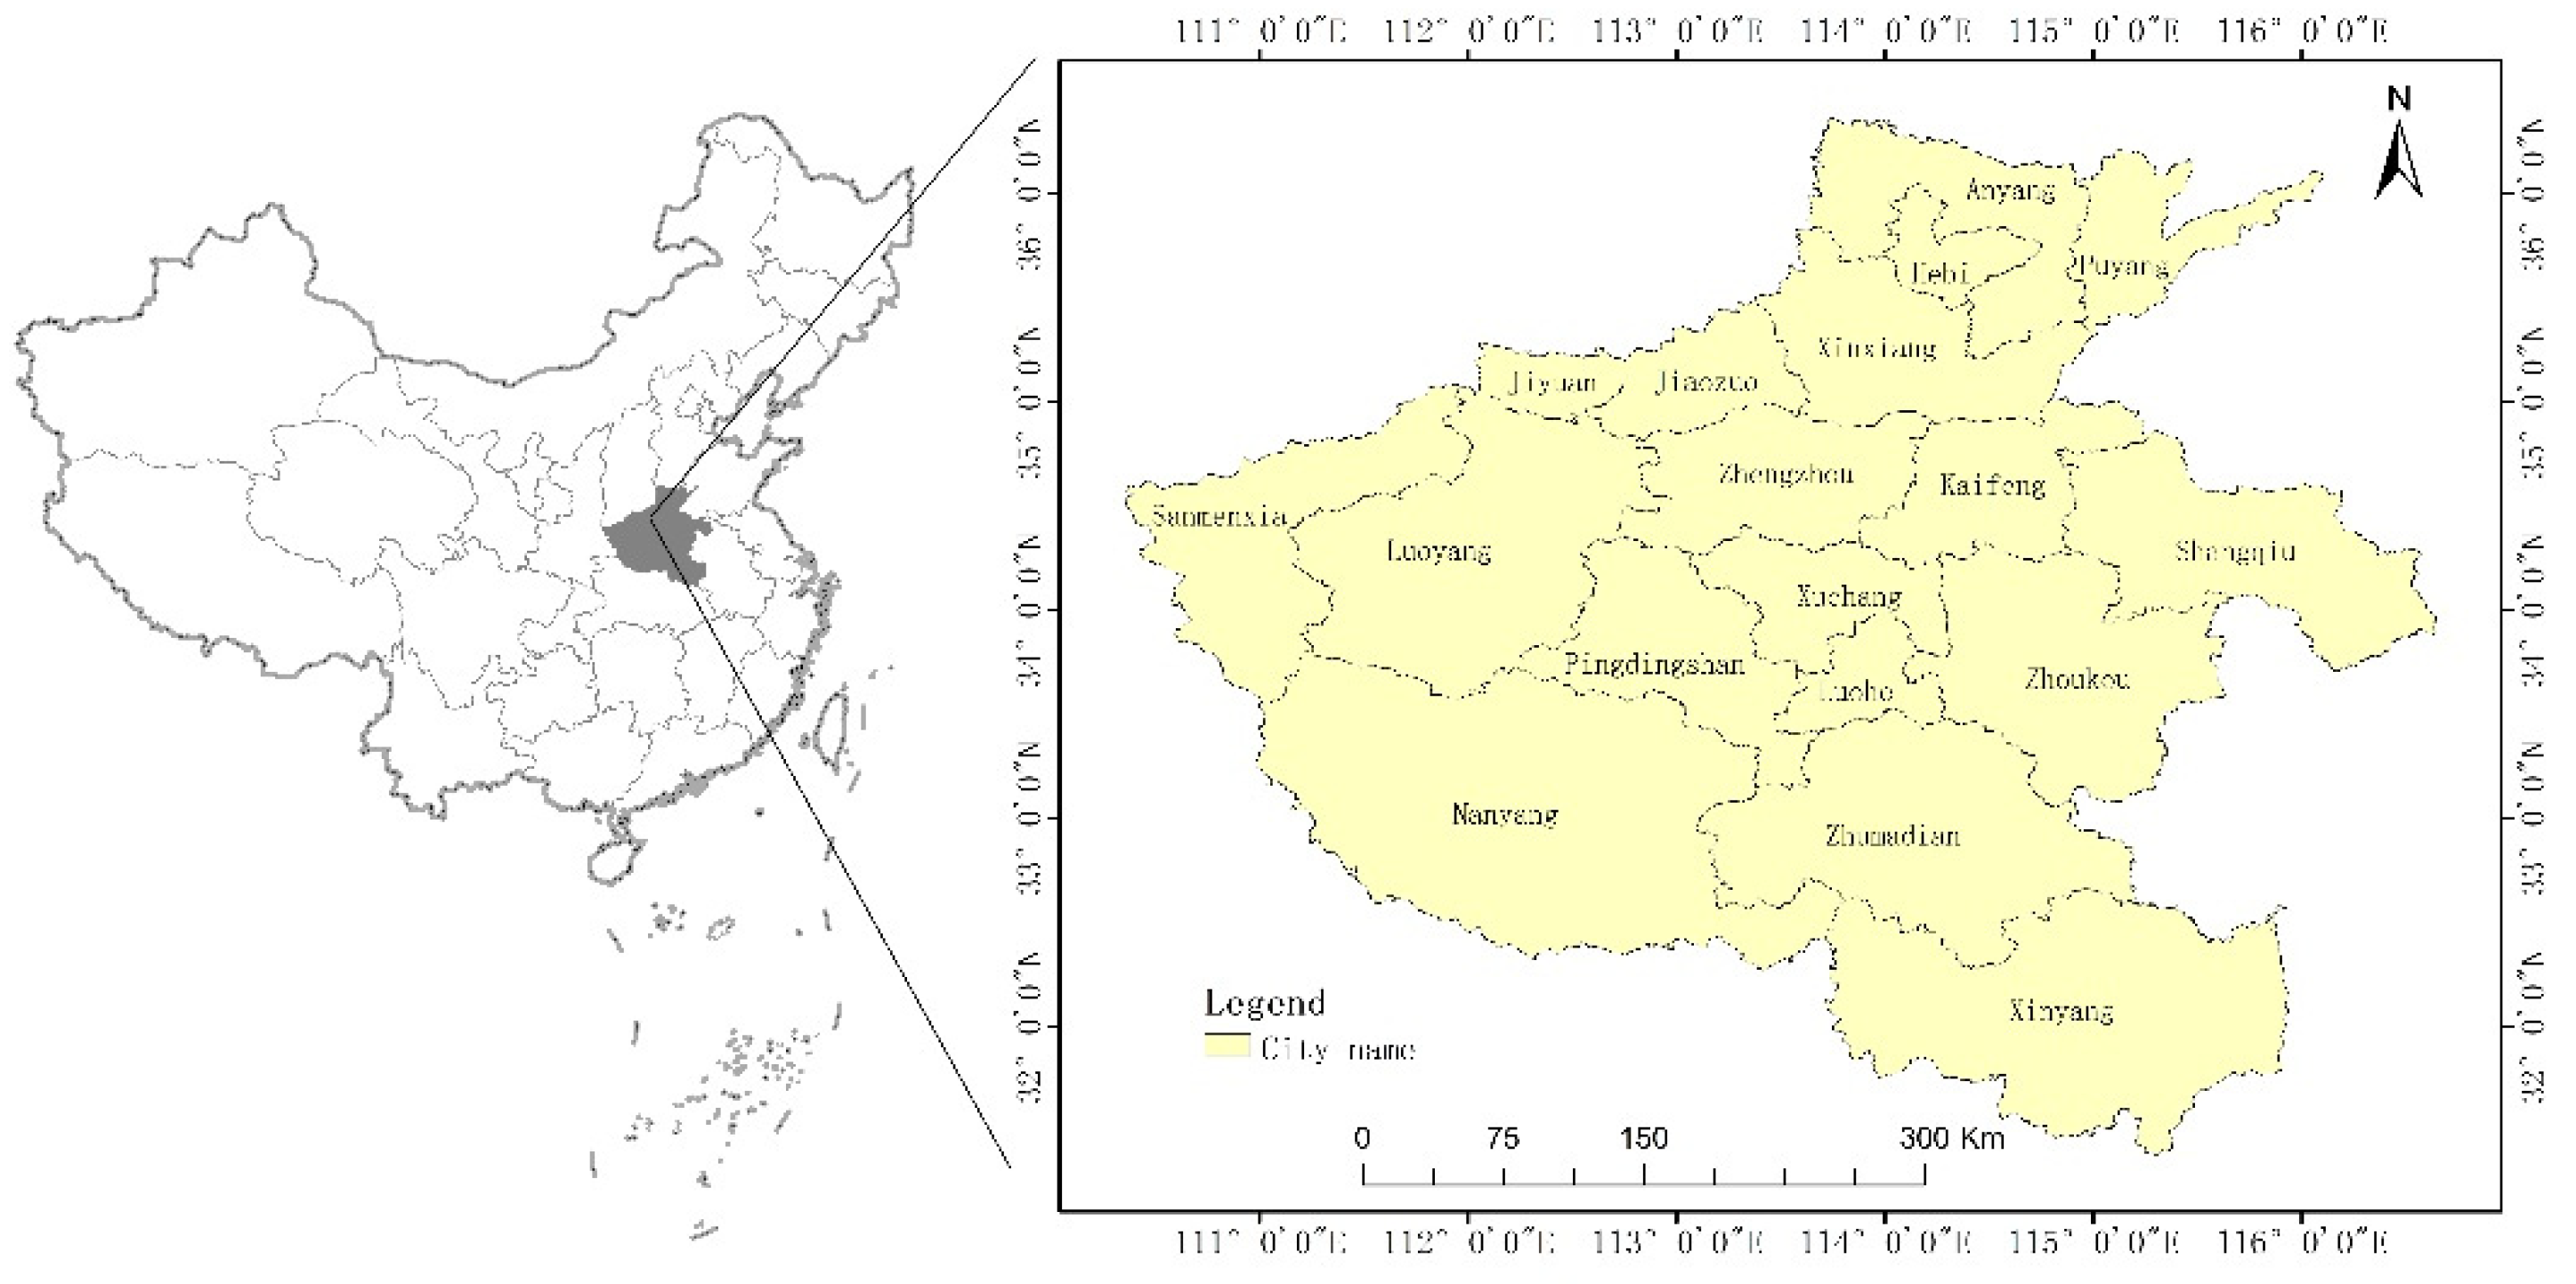
2.1. Study Area

Henan Province (29°01′53″ N–33°6′47″ N, 108°21′42″ E–116°07′50″ E) is located in Central-eastern China along the middle and lower reaches of the Yellow River. Its land area is 167,000 km2, accounting for 1.8% of China’s total land area (Figure 1). It has diverse terrain. Mountains such as the Taihang Mountains in the north, Funiu Mountains in the west, and Tongbai Mountains and Dabie Mountains in the south surround the eastern part. Plains areas account for 55.7% of this total. Abundant land resources are an important material basis for the rapid economic and social development of Henan Province. Henan is located in the transition zone between the subtropical zone and warm temperate zone, belonging to the continental monsoon climate zone. The average annual temperature ranges from 10.5 to 16.7 °C, and the mean annual rainfall ranges from 407 to 1296 mm.
Henan Province, as one of the main grain production areas in China, has always accounted for more than one-tenth of China’s total grain output. Its wheat output accounts for one quarter of this total. By the end of 2017, the total production of Henan Province, population 108.53 million, was CNY 4.5 trillion, and total grain output of 65.2426 million tons [52]. In addition, the capital of Henan Province, Zhengzhou, which is located in Central China, is a megacity and it is also a major transportation hub for the country. The development of provincial capital has also led to significant improvements in the social economy of Henan Province. Accompanied by the growth of the economy, the increased land-use intensity has caused ecological environmental problems such as a decline in the quality of cultivated land, land pollution, and ecosystem deterioration. In turn, these problems restrict the economic development of Henan Province to a certain extent. How to protect economic development while ensuring food security is a very important issue, so coordinating land ecology and economic development is particularly relevant. Henan is located in Central China and contains a variety of geographical features. Therefore, it lends itself well to carrying out research on TEH to predict future ecological problems in Henan Province while providing a reference for China and other regions in the world with similar challenges.

2.2. Data Resources

The research data were mainly obtained from the following: Henan Statistical Yearbook (2008–2018) [52], China Urban Statistical Yearbook (2008–2018) [53], Henan Statistical Bulletin of National Economic and Social Development (2007–2017) [54], and the current data regarding the land use structure in Henan Province.

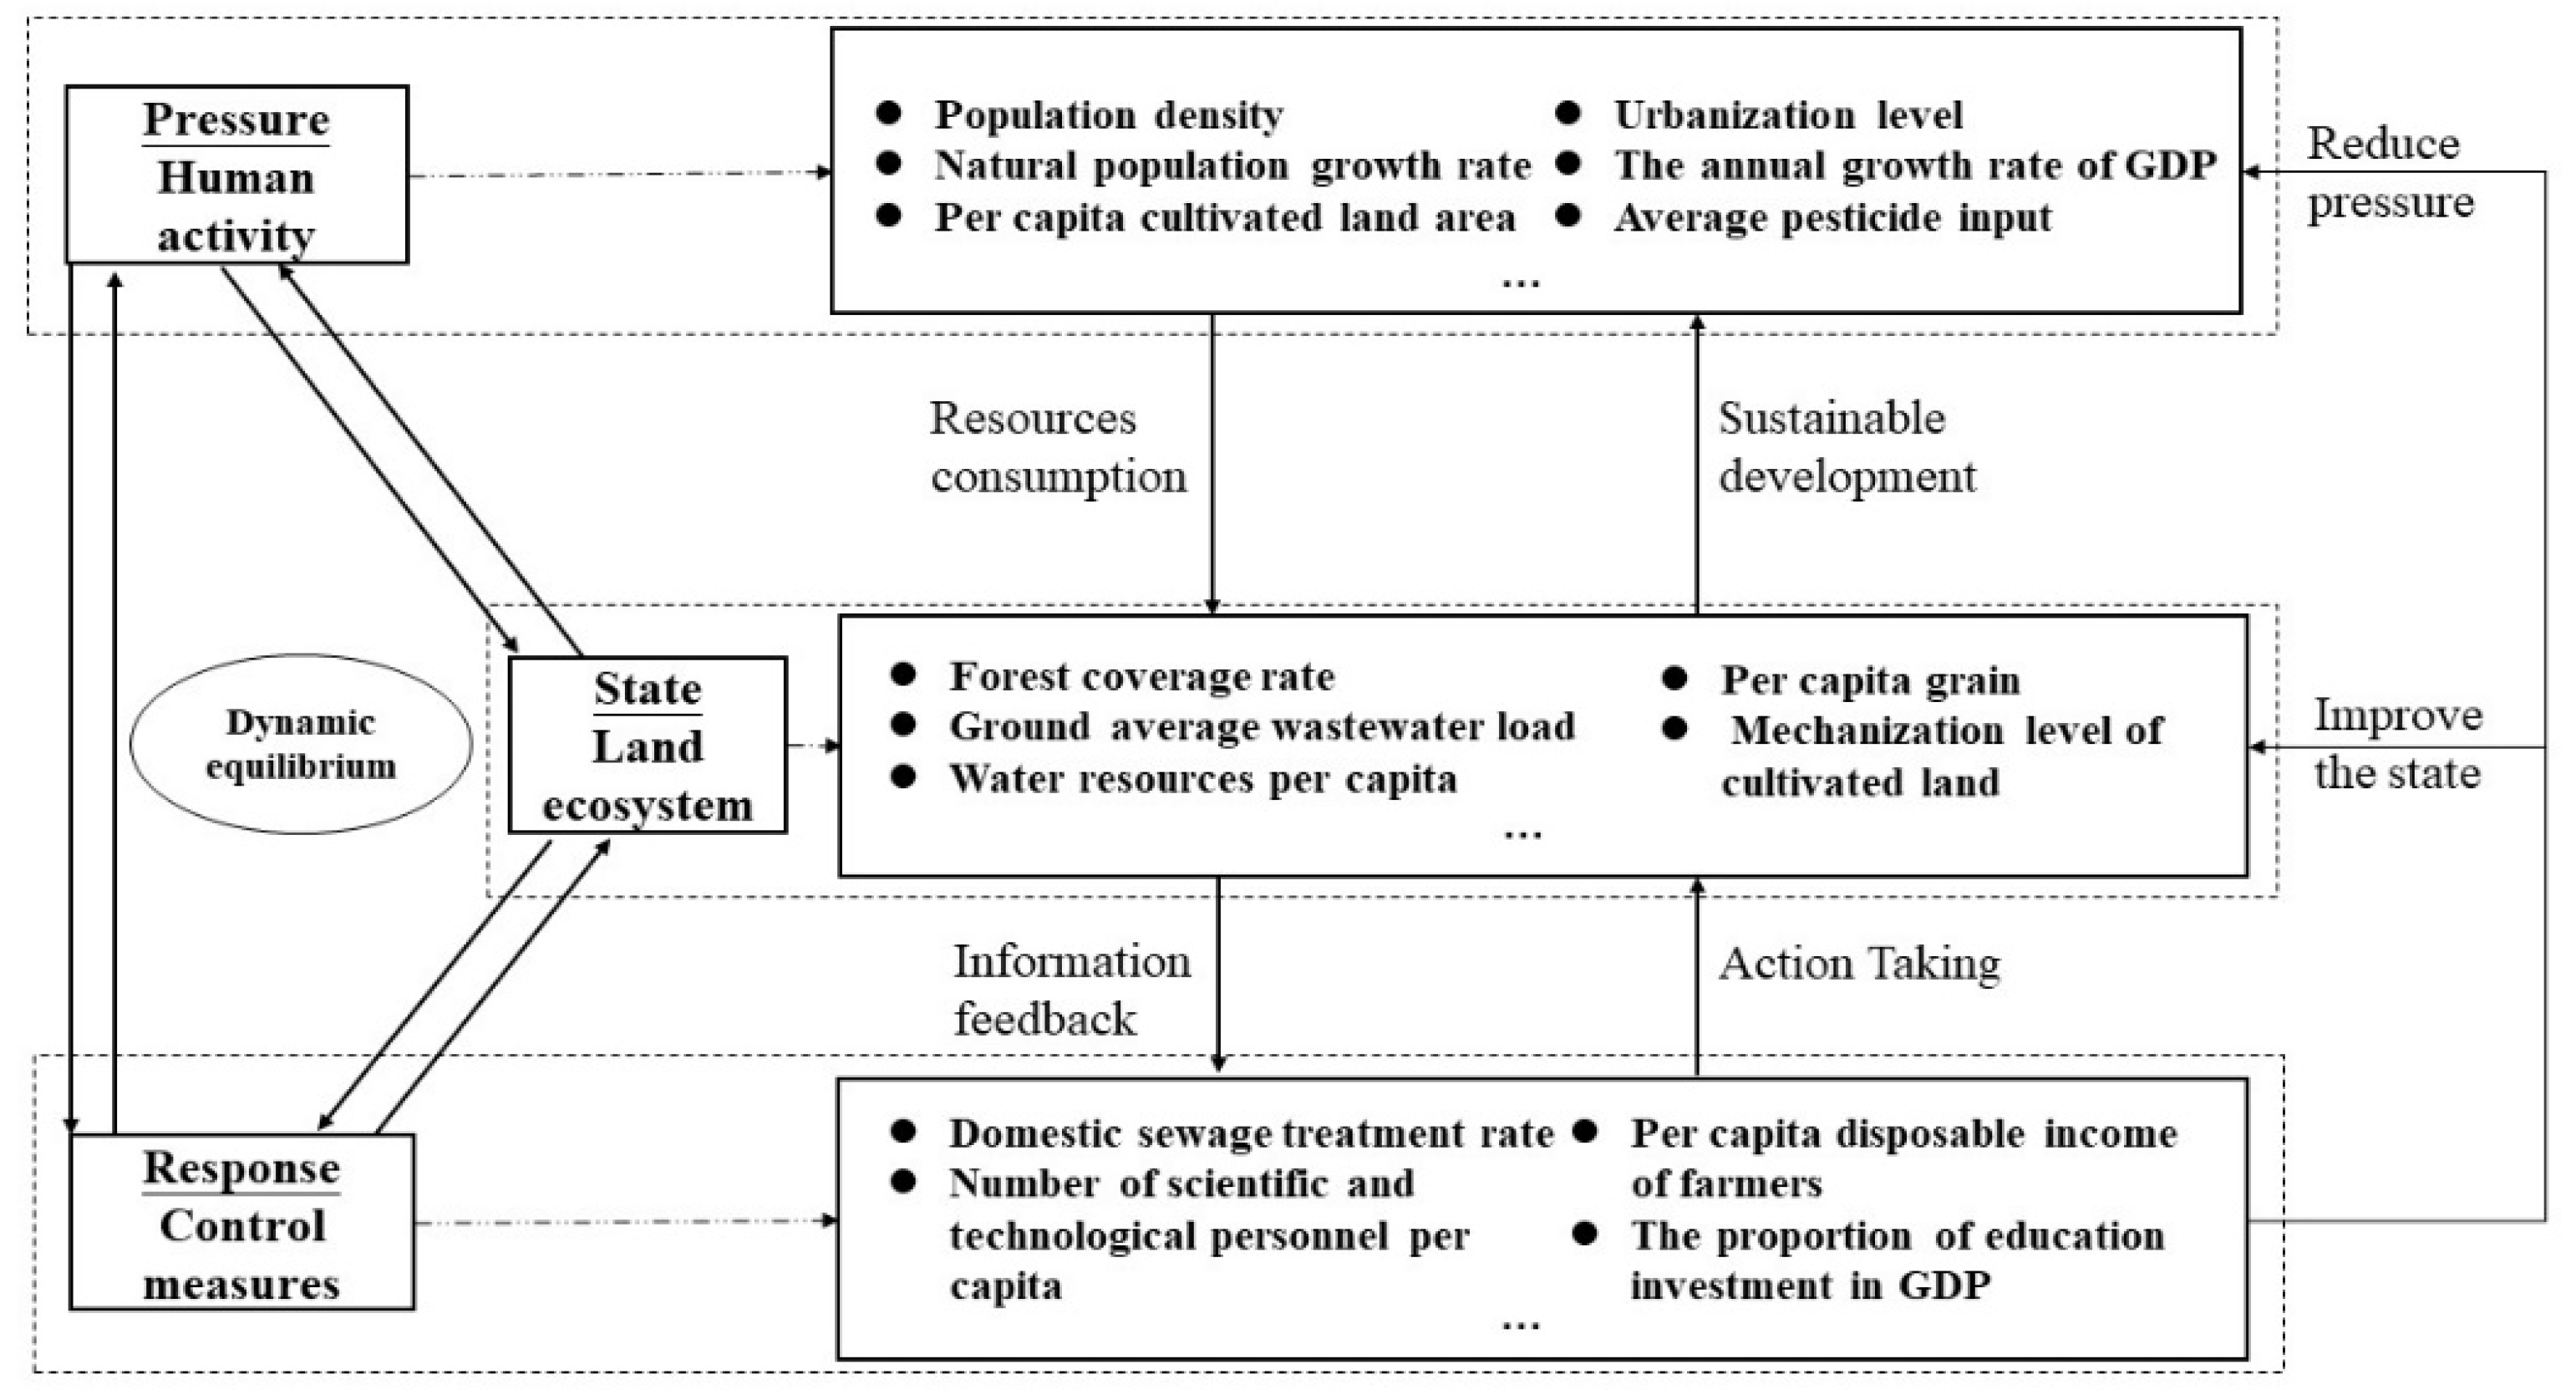
2.3. Index System Construction

TEH is a systematic and complex index system and accounts for the combined impacts of population, economy, resources, environment, and society. TEH evaluations provide a comprehensive diagnosis of the land-use system, including human activities, resource utilization, environmental status, environmental governance level, and other aspects. The PSR model that was proposed by the United Nations Economic Cooperation Development Agency classifies environmental indicators based on the interactions between humans and the environment. The indicators of the related ecosystems are classified into three categories: pressure, state, and response. The specific logic of PSR is that human activities exert pressures on ecosystems, which results in changes in the original nature and quantity of ecosystem resources. The degradation of the ecosystem will impact its ability to meet the needs of human production. Then, humans will respond with appropriate measures to restore the original ecosystem state and achieve a harmonious symbiosis between humans and ecosystems (Figure 2). This system can reflect the interactions among the ecosystem indicators from different perspectives, which is conducive for the process of providing early health warnings of ecosystems.
This study established an indicator system (Table 1) that uses the principles of comprehensiveness, objectiveness, and data availability [55,56,57]. In this study, the TEH index contains three levels: target layer, criteria layer, and index layer. The target layer represents the entire TEH value. The criteria layer includes the stress, state, and response, which reflects the constituent elements of the target layer and is the main factor that constrains the health of ecosystem. The index layer further subdivides the criteria layer. The index layer can most intuitively reflect the ecosystem characteristics. The pressure indicates the sources and functions of ecological pressures on the land. For instance, increasing population density, rapid economic and social development, and inputs of pesticides and fertilizers place some degree of pressure on ecosystems.
The state indicates the actual state of the ecosystem under the above pressure. Ecosystem presents a different state after human activities, which will change its structure and functions. The response indicates the measures that are taken by humans when the ecosystem is under pressure. Through a series of feedback measures, the ecosystem status can be improved. The criteria layer selects indicators from different aspects, which mainly focus on population, society, economy, resources, and environment.

2.4. Early Warning Methods

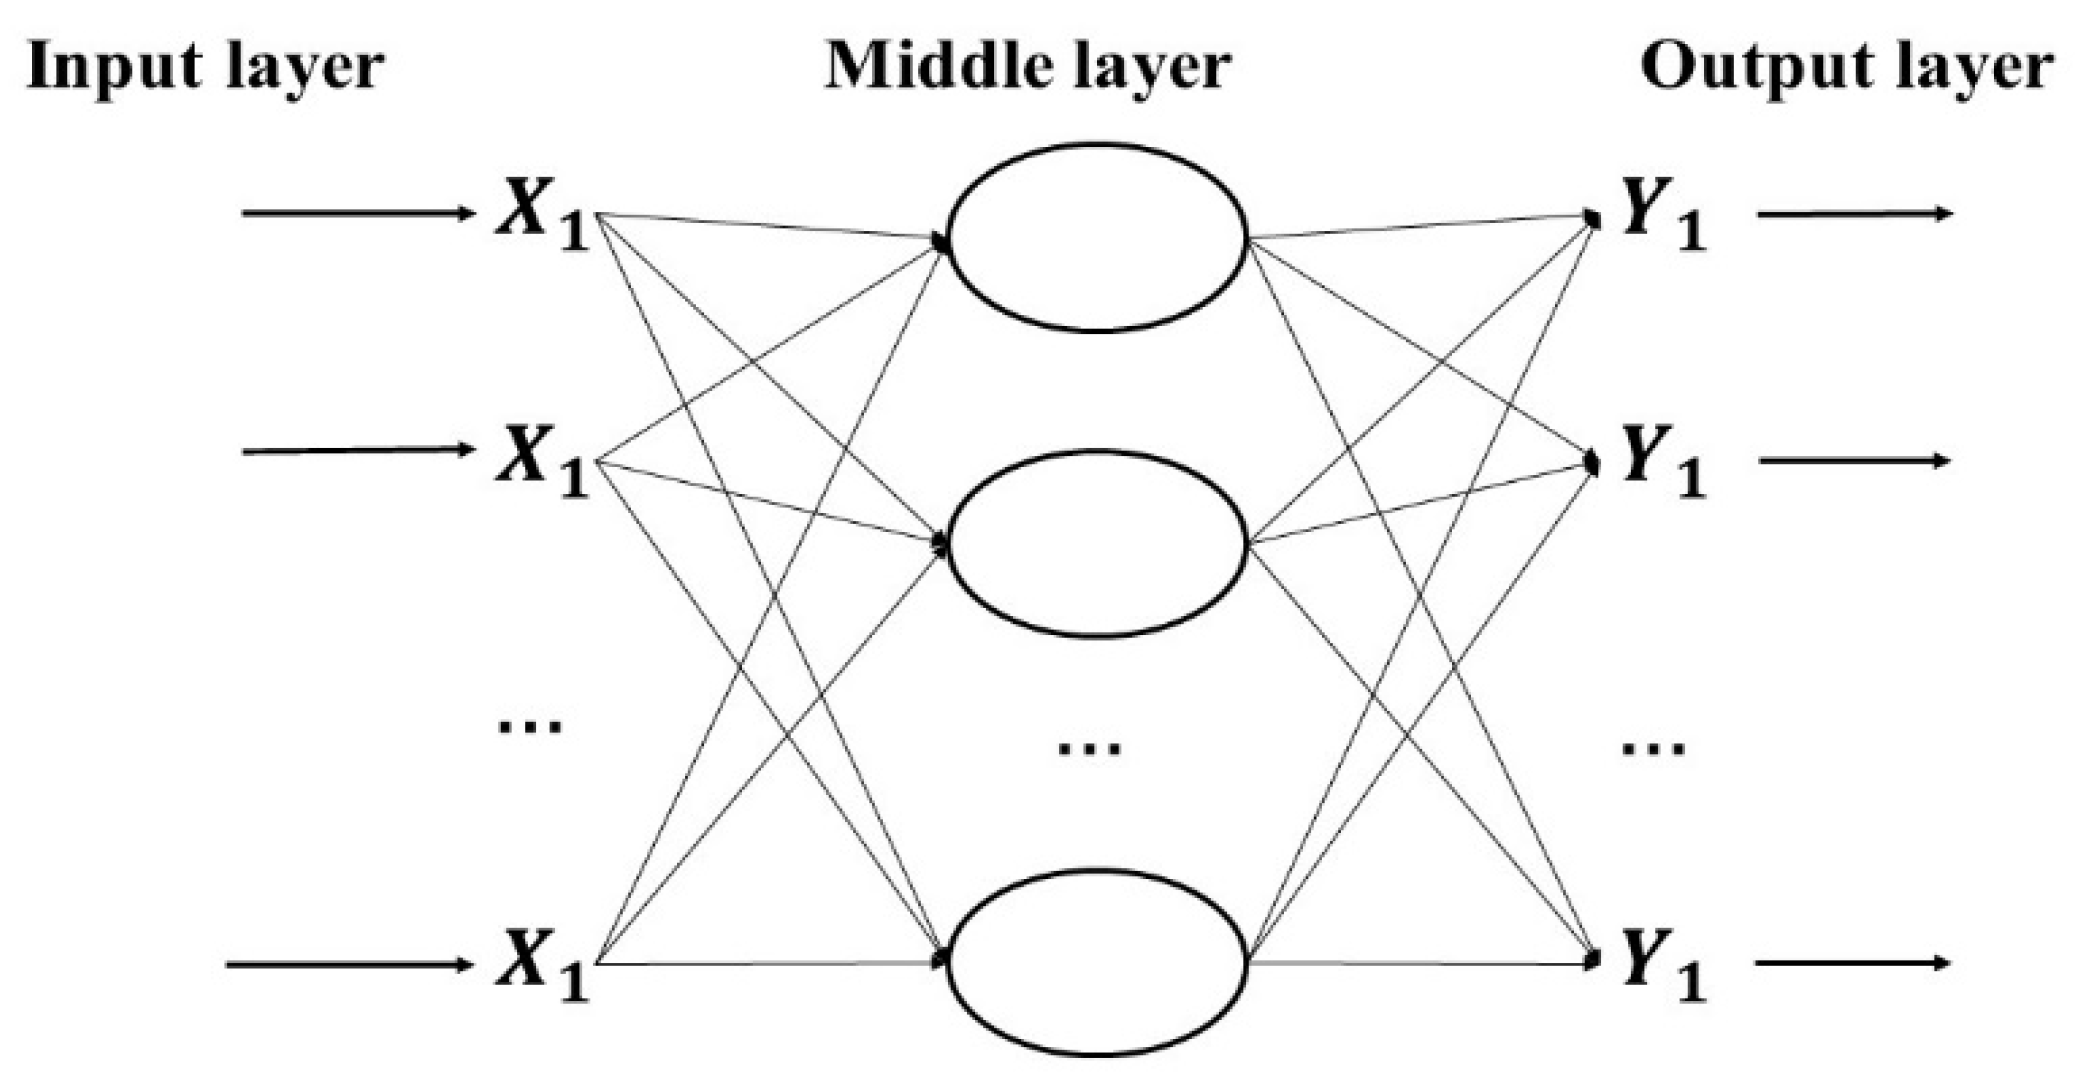
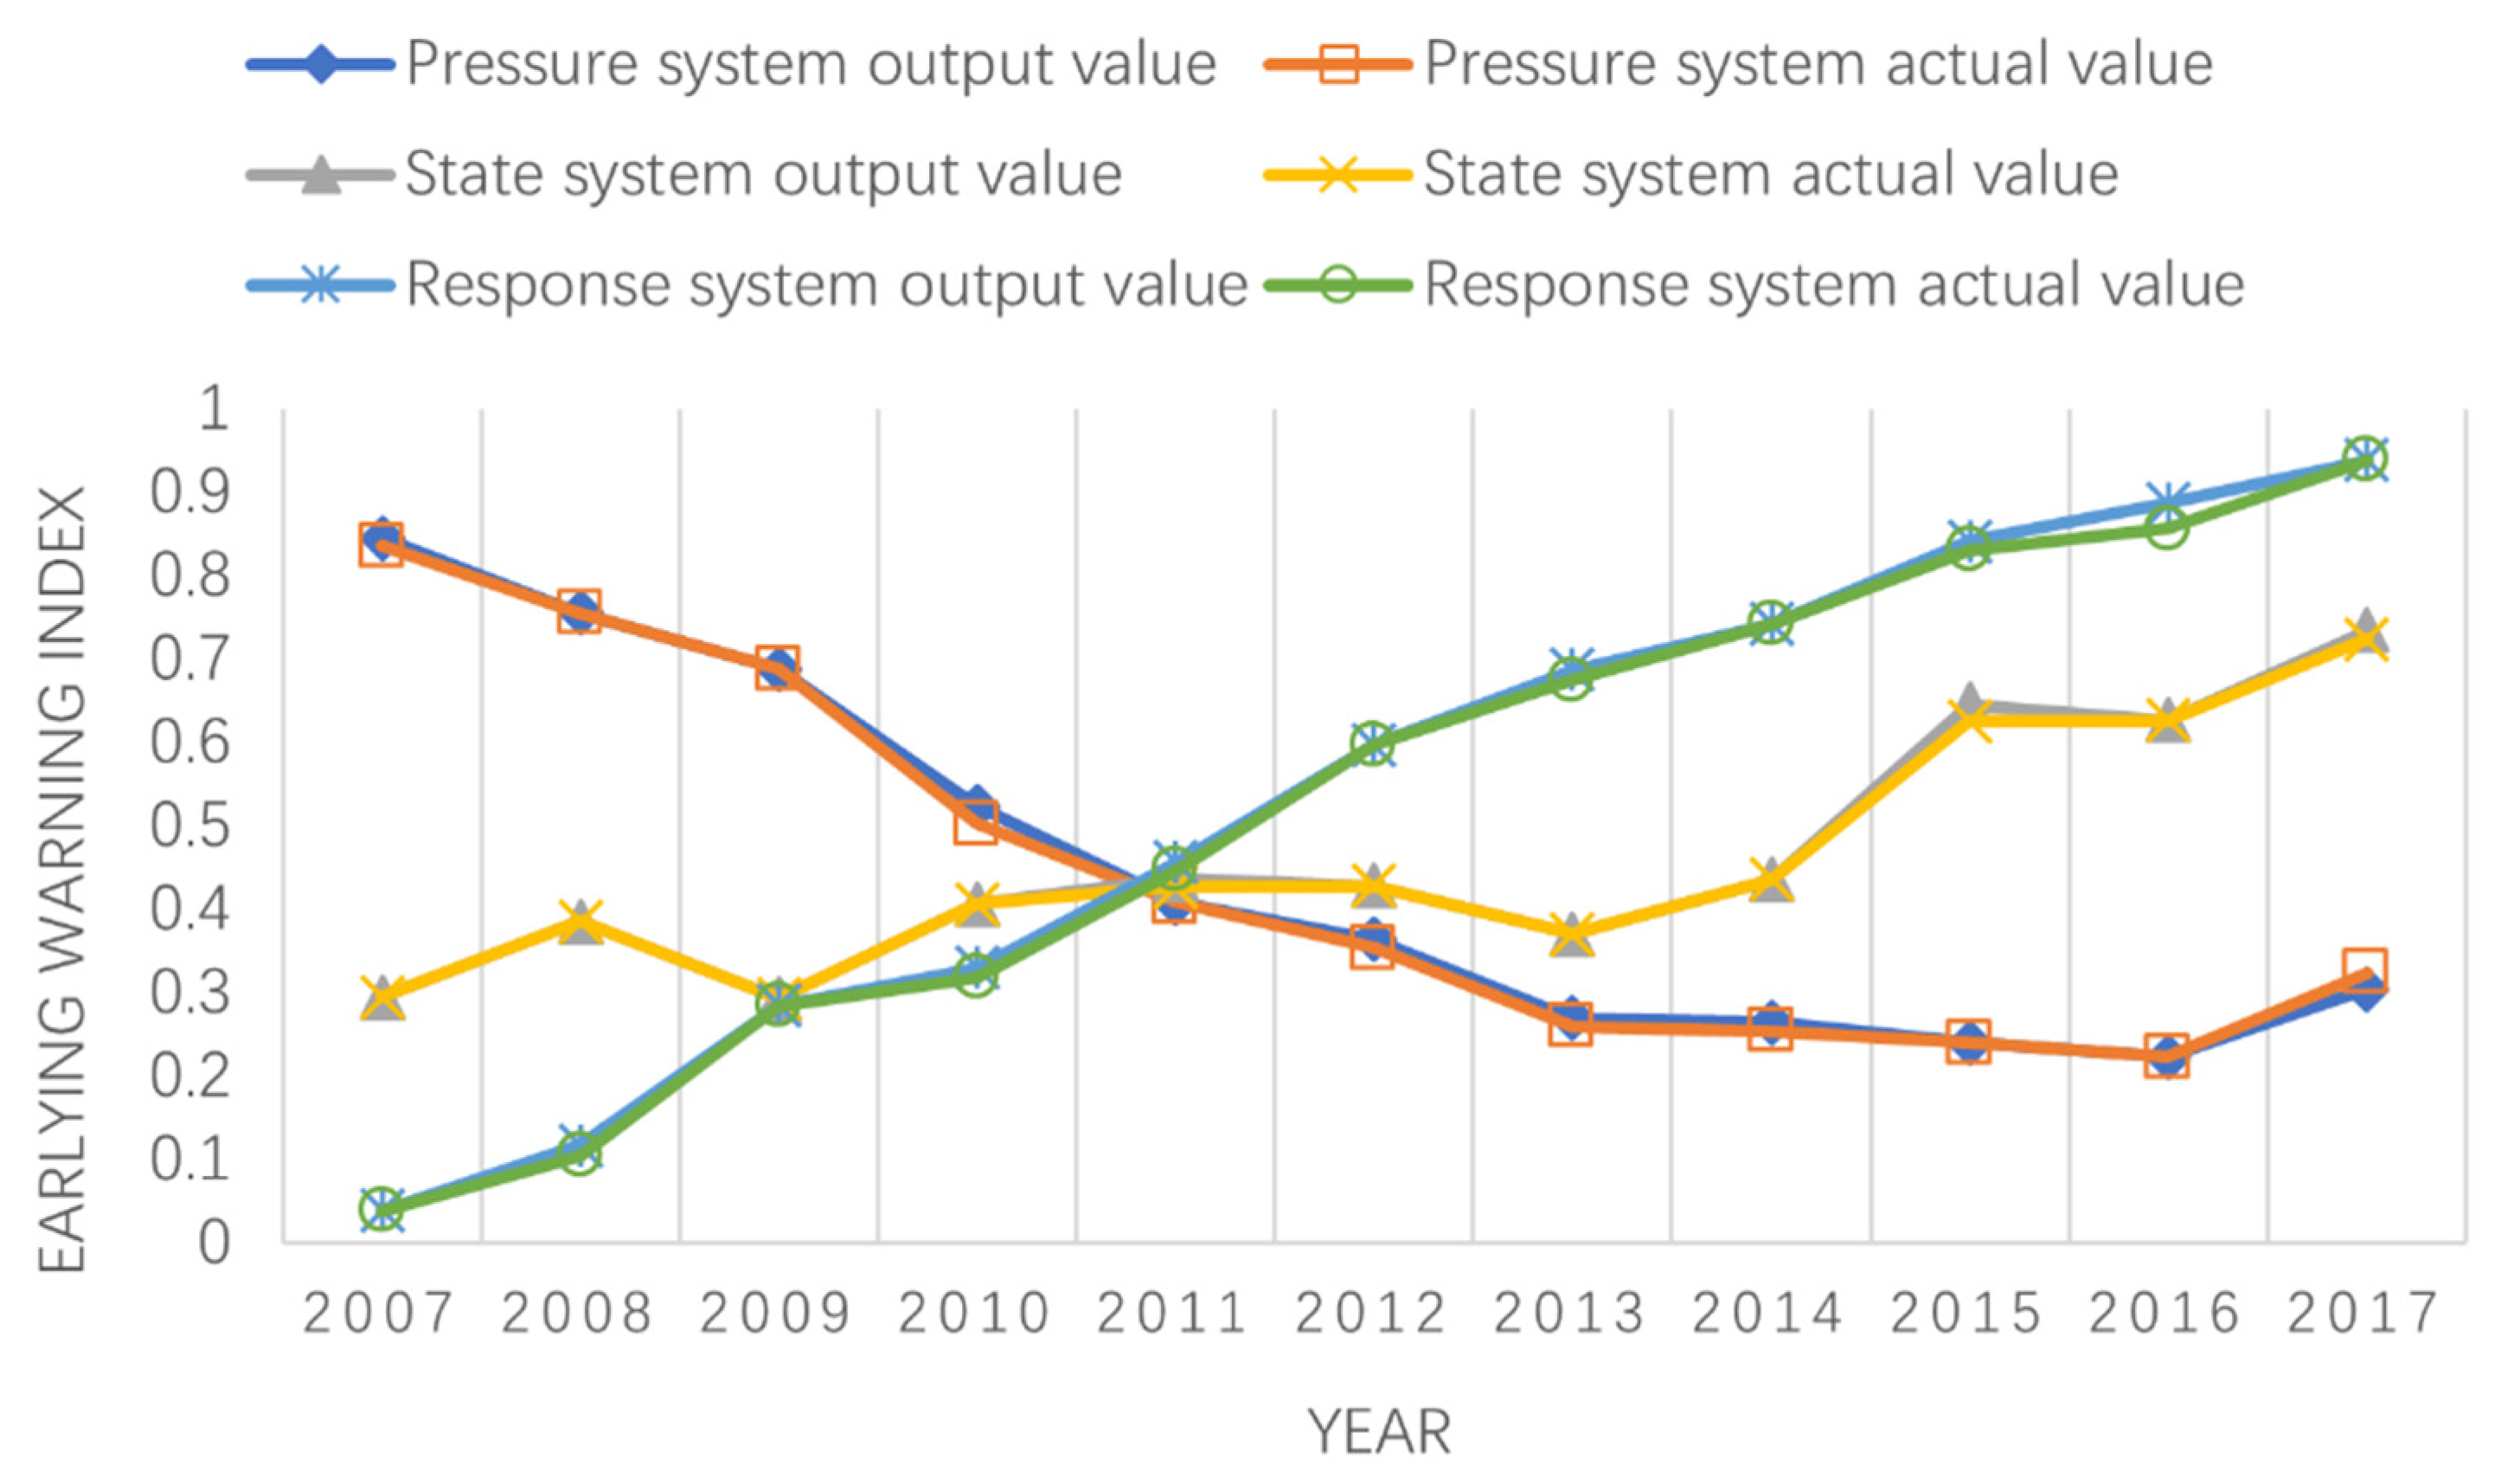
2.4.1. RBF Neural Network Model

The RBF neural network is a feed-forward network that was initially introduced by Moody and Darken at the end of the 1980s and is based on function approximation theory [58]. It simulates the neural network structure of the local adjustment and mutual covering reception domain in the human brain. It is easy to realize and cannot easily fall into local minima with the advantage of fast training speeds. An RBF neural network usually contains three layers in its network structure: input layer, hidden layer, and output layer (the network structure model is shown in Figure 3). Its operating principle is that the nodes in the hidden layer apply nonlinear changes via the basis function. The input space is mapped to a new space in which the output layer realizes the linear weighted combination [59,60]. The detailed steps are shown in Appendix A.

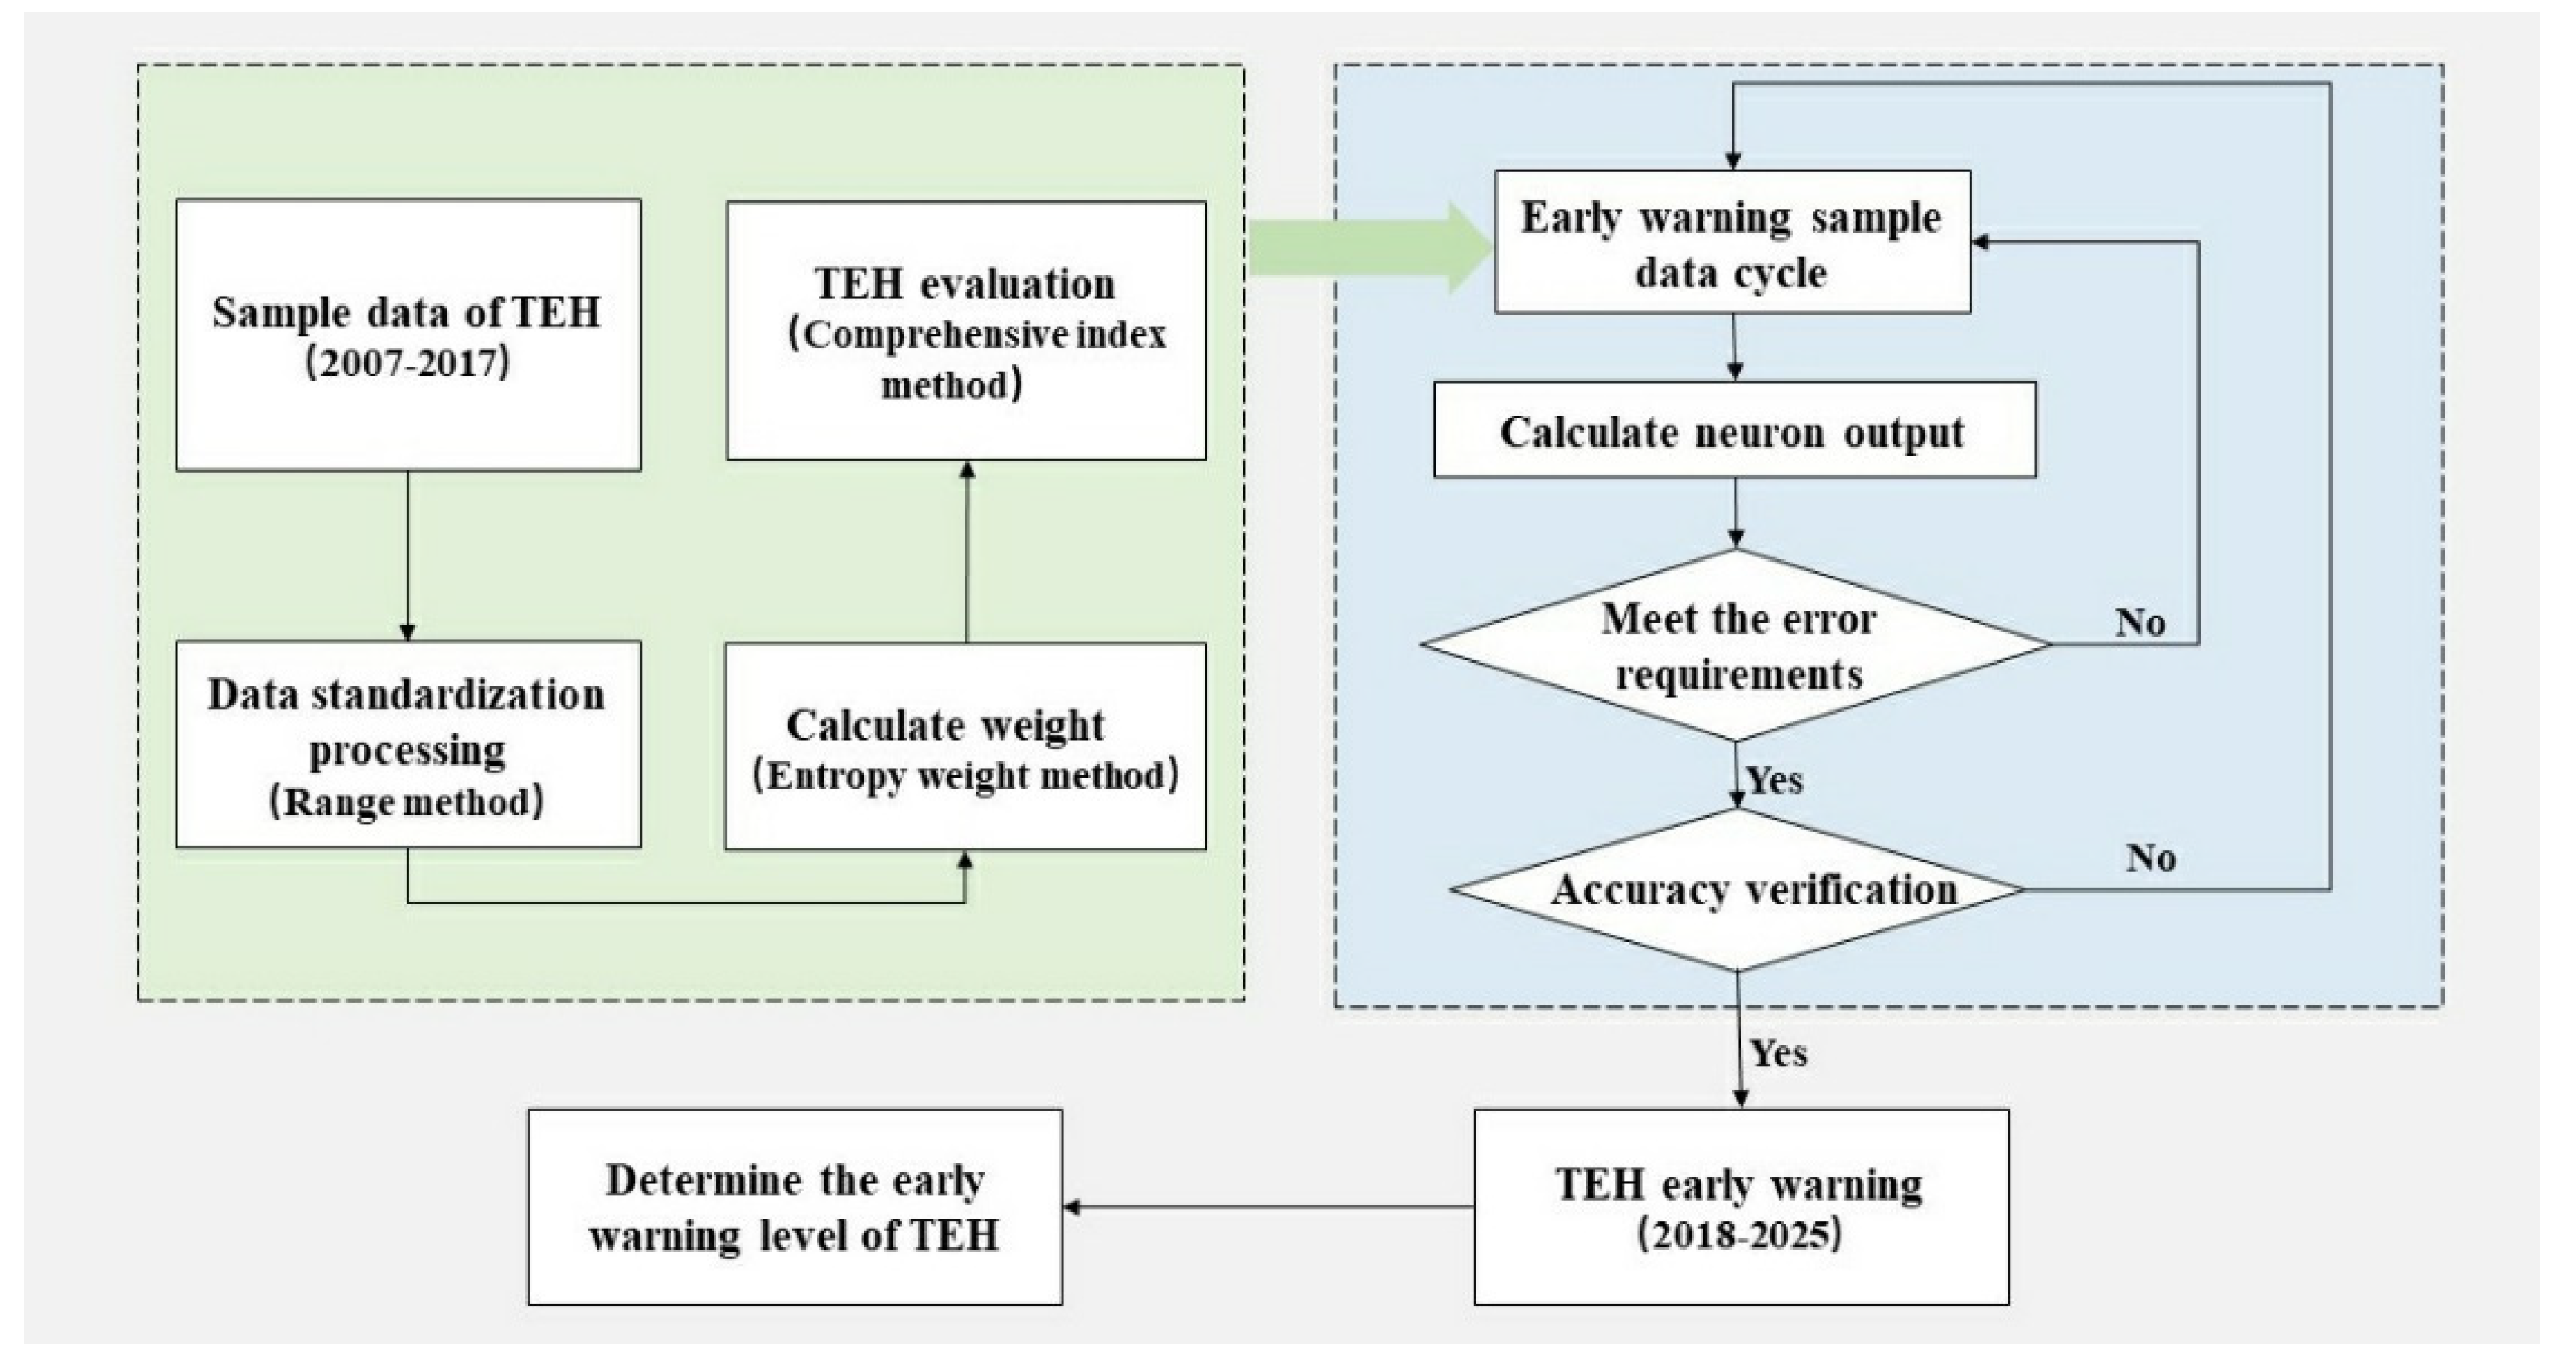
2.4.2. The Early Warning Process

This study first evaluated the TEH status from 2007 to 2017. On this basis, the RBF neural network model was used to predict the TEH status from 2018 to 2025 (Figure 4). This study used the range method to standardize the data, then used the entropy weight method to calculate the weight of the index data, and then used the comprehensive index method to obtain the TEH from 2007 to 2017. Next, the Newrb toolbox of MATLAB2016b (The MathWorks, Inc., Natick, MA, US) was used to perform the prediction. The first step consisted of calculating the data for 2007–2017 to provide the input sample set, the second step consisted of calculating the data for 2010–2017 to provide the output values, and the third step consisted of building a prediction learning model by using the time series. The development trend of each subsystem from 2018 to 2025 was predicted by using iterative rolling prediction. The preiteration cycle is 1, that is, a one-year prediction. The number of neurons in the input layer can be determined as multiple values in the rolling prediction and is generally determined by the experimental method according to the number of learning samples. The optimal number of neurons in the input layer of each system was 3 (that is, the early warning index of each subsystem in the first three years is used to predict its early warning index in the fourth year, etc.), and the number of neurons in the output layer was 1 (that is, the early warning index of each subsystem in the target year). Then, the TEH values for 2018–2015 can be predicted. More formula details are provided in Appendix A.

2.4.3. Determining the Early-Warning Levels

At present, there is no uniform threshold for the assessment standards of TEH. By referring to the relevant research and combining the actual conditions in Henan Province, this paper defines the warning classification standard for the TEH (Table 2).

3. Results

The warning indices for each TEH subsystem from 2007 to 2017 were calculated (Figure 5 and Figure 6). The learning results show that the Pearson’s R of each subsystem of land ecological security in Henan Province is close to 1, while the root–mean–square error (RMSE) values are <0.01, which indicates that the learning effect of the model is good and that the reliability is high. Based on this, the changing trends for each TEH subsystem in Henan Province from 2018 to 2025 are predicted, and the results are shown in Figure 6.

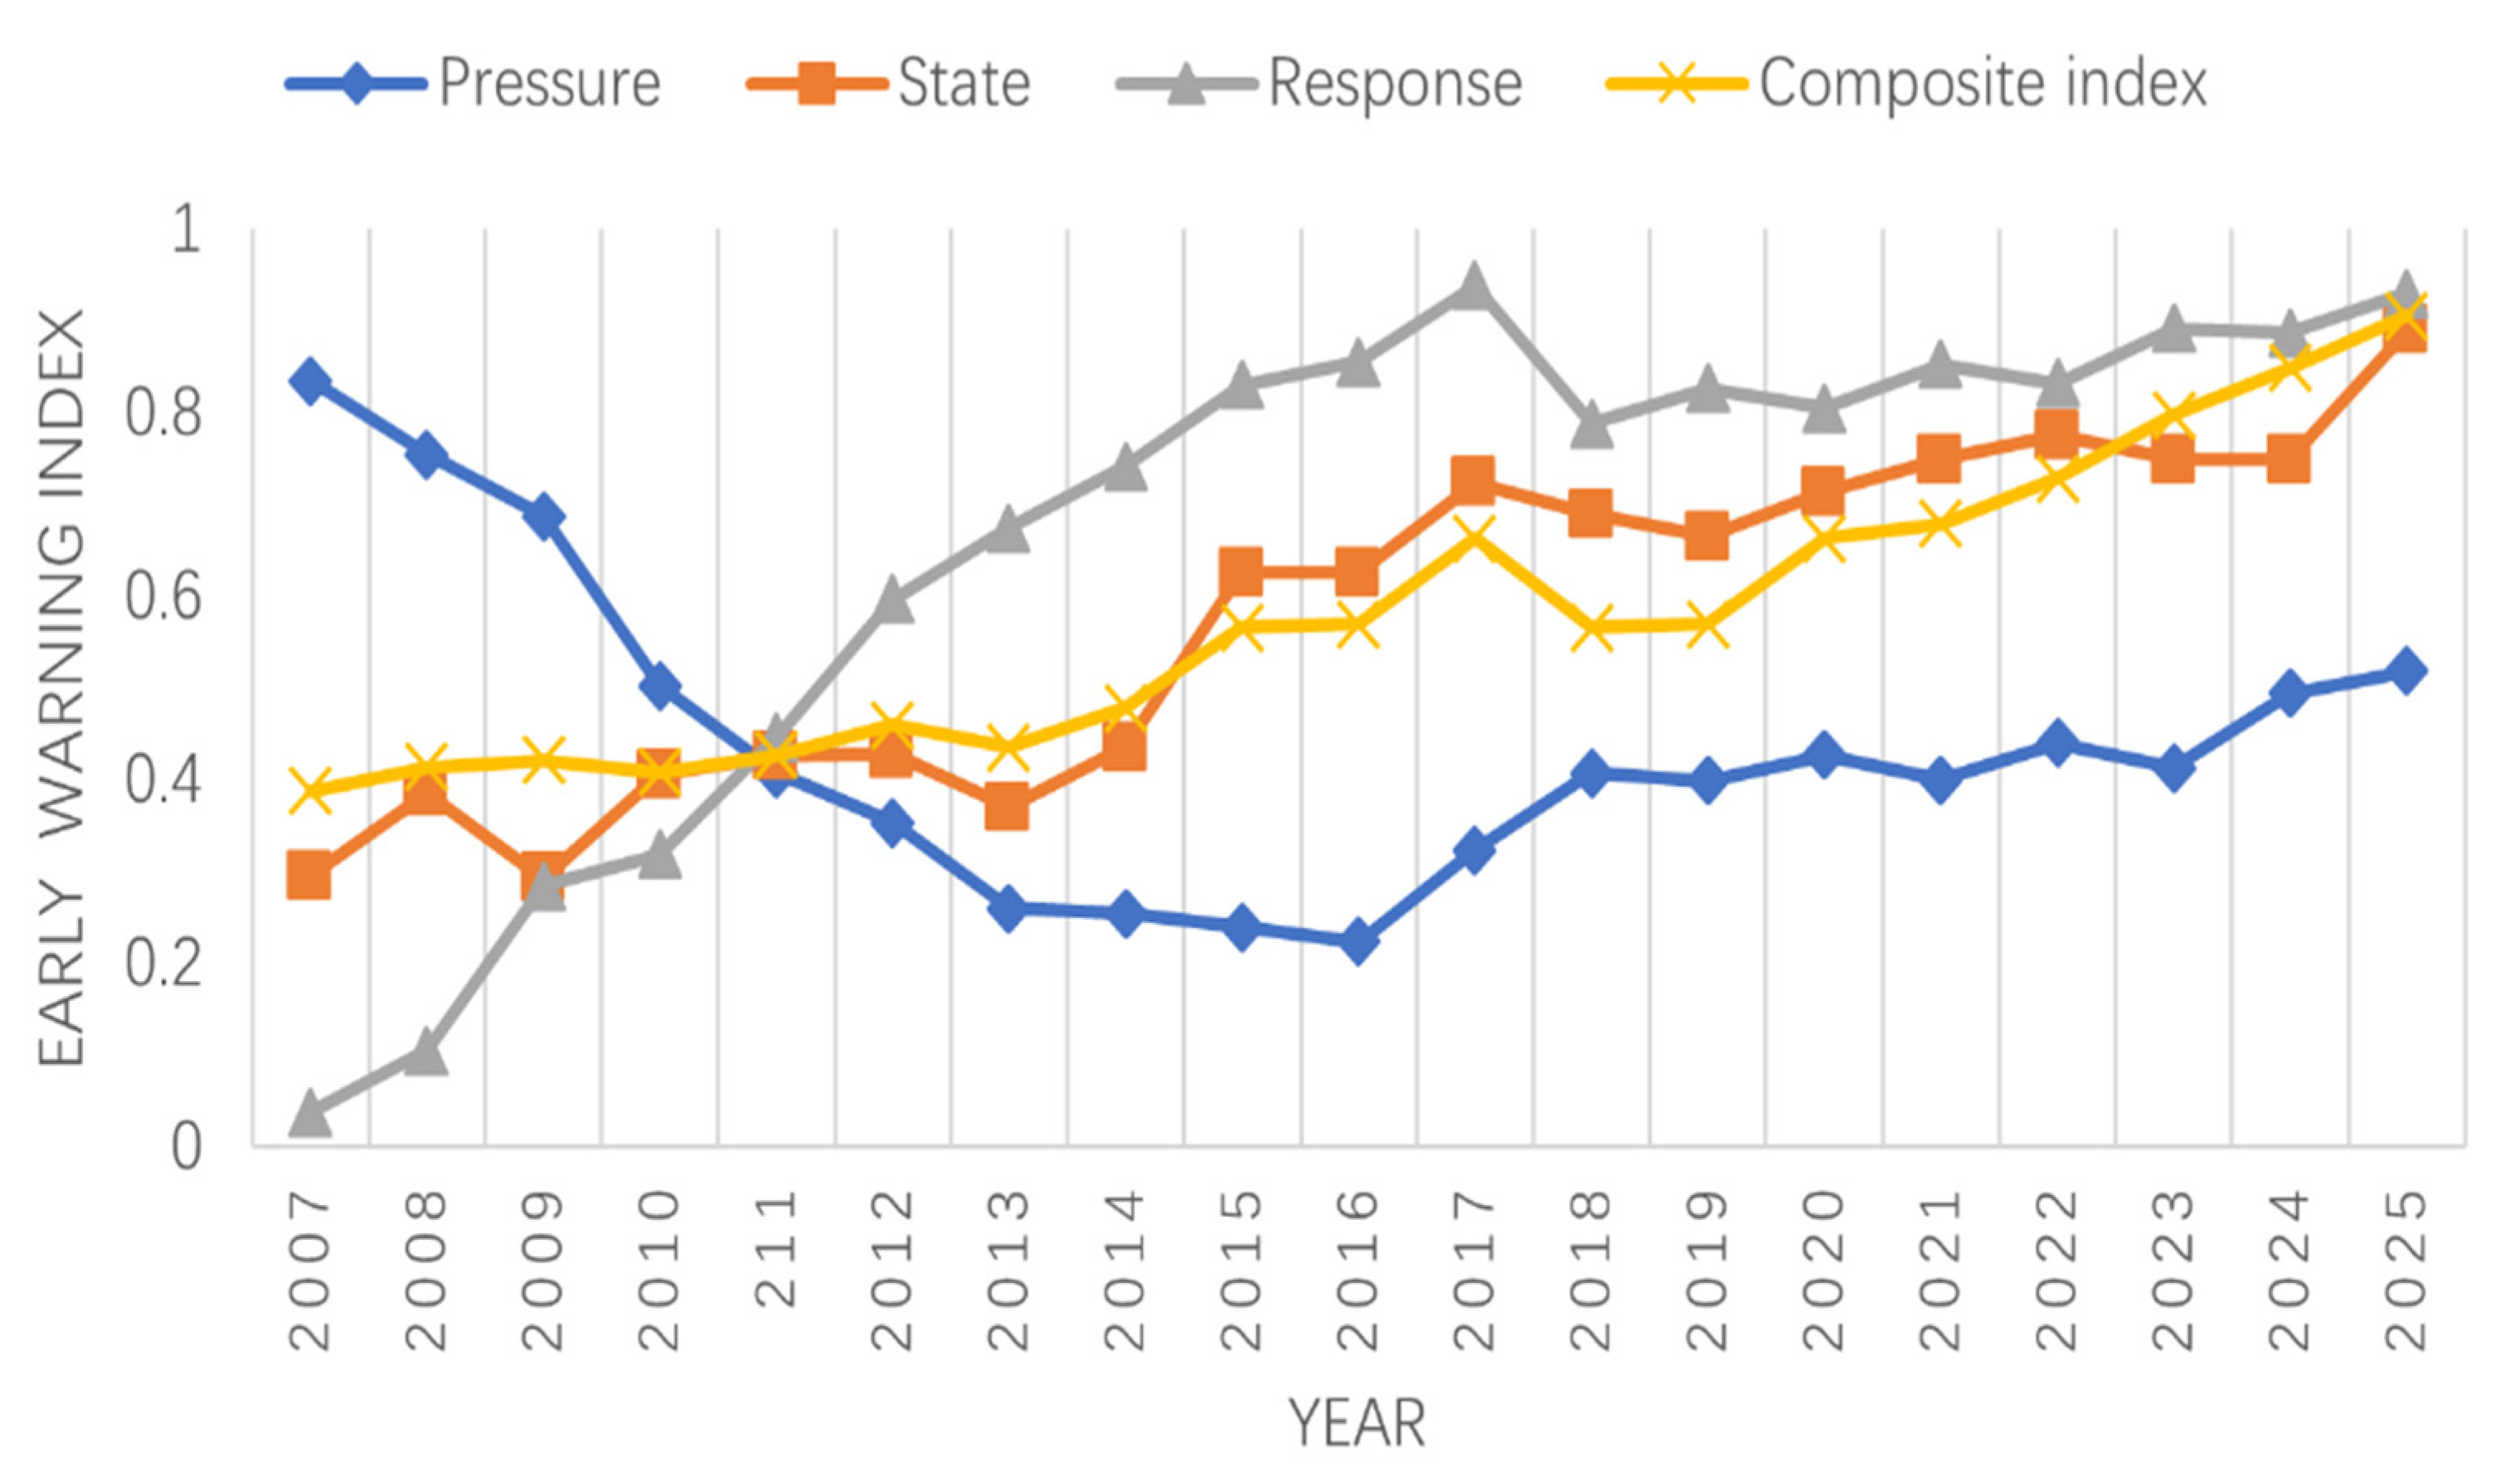
3.1. Evaluation of the Early Warnings of the TEH

In general, the health status of the ecosystem in Henan Province shows a slow increasing trend. From 2007 to 2017, the comprehensive early warning index of the TEH increased from 0.3881 in 2007 to 0.6632 in 2017, with a growth rate of 70.89% (Figure 5). The health status of the ecosystem gradually decreased from a “severe warning” to a “light warning”, improved for two levels and improved the condition of the land ecological environment to a certain extent, which indicated that the rationality and scientific basis of the land uses greatly improved. From 2007 to 2009, the comprehensive early warning index for the TEH increased from a minimum value of 0.3881 to 0.4213, but the health early warning levels were below the severe warning level. The comprehensive evaluation index decreased from 0.4213 to 0.4089 in 2009–2010, from 0.4089 to 0.4599 in 2010–2012, from 0.4599 to 0.4259 in 2012–2013, and then increased to 0.6632 in 2017 (Figure 5). The changes in the pressure index, state index, and corresponding index of the TEH are clear. Among them, the pressure index decreased significantly, the state index increased substantially, and the response index increased slowly. Henan Province utilized land to develop the national economy. At the same time, the incomes and living standards of the residents significantly improved, and the treatment rates and comprehensive utilization rates of pollutants such as sewage, garbage, and industrial solid waste continuously improved, which promoted continuous improvements in TEH.
According to the early warning results, the forecast of the comprehensive index exhibited an upward trend from 2018 to 2025, and the warning situation decreased year by year. The comprehensive index for TEH increased from 0.5663 in 2018 to 0.9062 in 2025, an increase of 60.02% with an average annual growth rate of 6.95%. From the perspective of the warning states, 2018–2019 indicated “moderate warning”, 2020–2023 “light warning”, 2024–2025, “no warning”, and the warning state increased from “severe warning” state in 2018 to “no warning” state in 2025. These results indicate that the TEH conditions in Henan Province are gradually improving. Based on the forecasting trend, it can be assumed that if no special case occurs, the TEH warning in Henan Province will remain in a light or high state for a long time.

3.2. Evaluation of the Early-Warning Index of the Pressure System

From 2007 to 2017, the early warning index of the TEH pressure system in Henan Province exhibited a fluctuating downward trend, from 0.8349 in 2007 to 0.223 in 2016 and up to 0.323 in 2017. The indicator light gradually changed from “blue light” to “red light” and fluctuated between “red light” and “yellow light” (Figure 5, Table 3). From 2007 to 2013, the pressure system index fell rapidly, with an average annual decrease of 17.69%, and the pressure on the land ecological environment continued to increase. During this period, the investment growth rates in Henan Province were at high levels, and the investments in chemical and agricultural capital were also at high levels during the research period. These economic activities exerted much pressure on the ecosystem. From 2013 to 2017, the downward trend of the pressure index was significantly alleviated. Especially in 2017, the pressure index increased for the first time in the research period; that is, the ecological pressure status tended to ease. With the continuous promotion of the construction of an ecological civilization in China, the implementation of green water, green mountains, and other ecological agricultural policies tempered the fertilizer and pesticide loads and decreased the emissions of pollutants such as sulfur dioxide. However, with the development of urbanization, the economic density of the land has been increasing, and the increased population density and decreased cultivated land area are still significant challenges faced by terrestrial ecosystems. According to the forecast results for 2018–2025, the early warning index will continue to decrease, the warning will remain at a “severe warning”, and the indicator light will alternate between a “red light” and “yellow light” (Figure 5, Table 3). In the next few years, with the provincial capital of Henan Province becoming the central city of the country and the development of the Central Plains Free Trade Zone, the urbanization process of Henan Province will continue to be in a rapid development stage. Urban expansion will inevitably occupy cultivated and ecological lands, and the pressure on terrestrial ecosystems will increase.

3.3. Evaluation of the Early-Warning Index of State System

From 2007 to 2013, the state system index fluctuated upward. Except for the decreases in the state index in 2009 and 2013, the other years exhibited upward states. In 2013, the state index rose by 0.0755 compared with 2007. At this stage, the TEH of Henan Province was good and maintained an upward trend. The state index continued to rise from 2013 to 2017 and rose by 0.3534 in 2017 compared to 2013, with an average annual growth rate of 18.22%. Since the 18th National Congress of the Communist Part of China, Henan Province has vigorously embraced the construction of an ecological civilization, and the health status of terrestrial ecosystems has significantly improved. From 2007 to 2017, the per capita GDP increased from CNY 12,578 to CNY 37,086, forest coverage increased from 16.19% to 24.53%, and the natural disaster rate decreased by 10%. In addition, the average local grain production and mechanization level of cultivated land improved, which improved the TEH in Henan Province. The forecast shows that the early warning index will continue to fluctuate upward, and the indicator will fluctuate back and forth between yellow and orange from 2018 to 2025 (Figure 5, Table 3).

3.4. Evaluation of the Early-Warning Index of the Response System

An analysis of the early-warning status of ecosystem health in the response system shows that the response index rose from 2007 to 2017, and the response status greatly improved. The response index in 2017 was 24.63 times higher than that in 2007, with an average annual growth rate of 37.77%. The indicator light gradually changed from a "red light" to a “green light”, with a clear upward trend (Figure 5, Table 3). The response index reflects the importance and degree of protection that are conferred by the government and society to the ecological environment in the region. It also reflects the strength of the government’s efforts to improve TEH by taking appropriate measures. In recent years, Henan Province has responded positively to the negative effects of ecosystem destruction and has issued a series of policies and measures to strengthen the protection of the ecological environment. The sewage treatment rate increased from 71.41% in 2007 to 96.92% in 2017, and the investment in education increased from 3.65% in 2007 to 4.84% in 2017. In addition, the investment in scientific and technical personnel and the comprehensive utilization rate of industrial solid waste have improved. In the coming years, the increased awareness of ecological and environmental protection and increased disposable income per capita of farmers will cause Henan Province’s early-warning index response system to gradually improve. In the future, Henan will not only maintain a “blue light” state but will also achieve a “green light” state. In addition, this state will be closer to the "no warning" level. (Figure 5, Table 3)

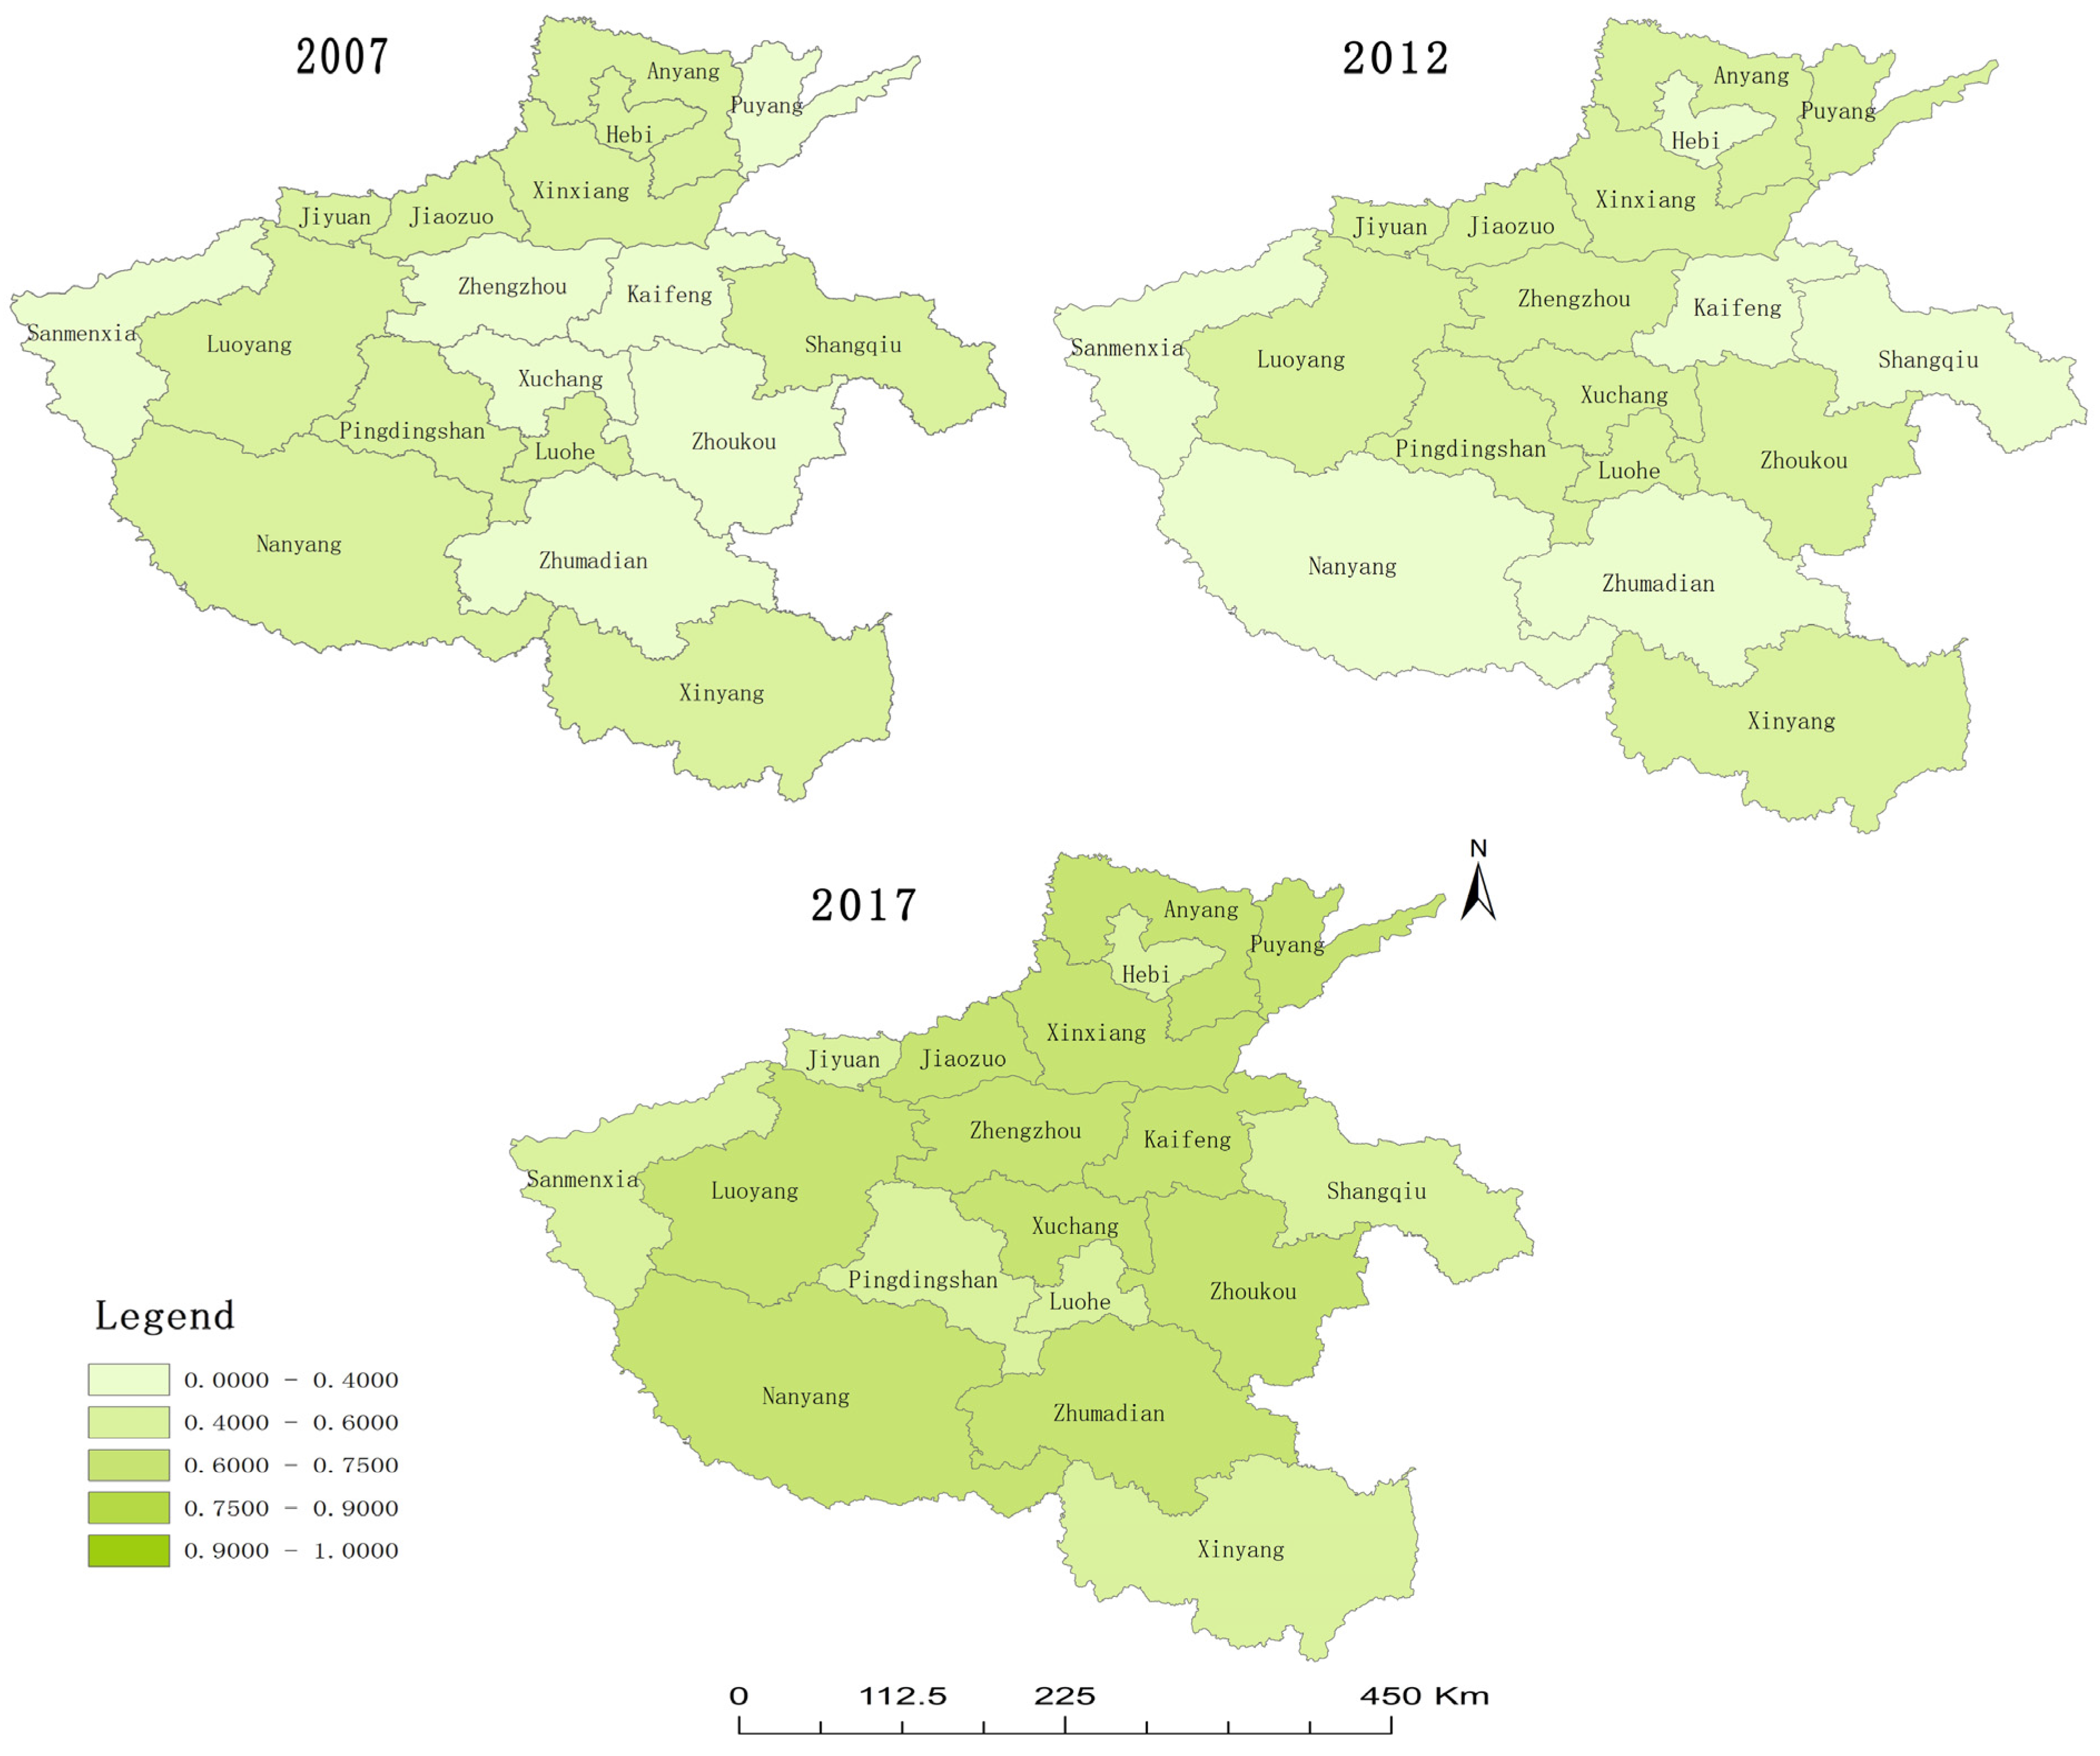
3.5. Spatial Distribution Pattern of TEH Warning Information in Henan Province

Figure 7 and Table A1 show that the comprehensive indices for 18 cities in Henan Province were in the ranges of 0.3519~0.4913, 0.3018~0.5491, and 0.5732~0.6862, respectively. Among them, the TEH levels of Pingdingshan, Luohe, Xinyang, and Jiyuan were in a critical state. The TEH levels of Zhengzhou, Xuchang, Puyang, and Zhoukou improved by one level compared with the previous time node.
Through the analysis of the evaluation indices of pressure, state, and response of 18 cities in Henan Province, we can see that the pressure indices for all cities decreased from 2007 to 2012 (Table A1, Figure 7). The higher the pressure index is, the less the pressure on the ecosystem. A decline in the pressure index means that the pressure on the ecosystem is more obvious. From 2012 to 2017, the rate of pressure index decline tended to be flat compared with the previous stage, and the pressure indices of three cities, Xuchang, Sanmenxia, and Nanyang, exhibited certain increases; that is, the ecological pressure eased compared with the previous stage. From 2007 to 2012, except for Hebi, Nanyang, and Jiyuan, the state indices for the other cities increased slightly. From 2012 to 2017, the state index maintained a steady growth trend, while the state index of all cities did not decline, which indicated that the ecological state continued to improve. The response indices of all cities from 2007 to 2012 improved to certain extents, which indicated that the level of ecological environmental protection was strengthened in all cities. Overall, the response index from 2012 to 2017 increased significantly compared with the previous stage, which indicated that the response and protection of ecological problems improved further. With the slow growth of ecological pressure and increase in the social response to ecological problems, the overall situation of the TEH in Henan Province has changed to a certain extent. In the future, efforts should be made to improve the response levels, avoid unreasonable land-use development methods to reduce the pressure level, and create a harmonious environment between humans and nature.

4. Discussion

4.1. Analysis of the TEH in Henan Province

At present, most of the research on land ecological safety in the world focuses on the micro level, such as soil pollution and microorganisms [14,15], while few studies have been done on the health of terrestrial ecosystems at mesoscales, and most of these studies were conducted by Chinese scholars. We chose Henan Province, a large grain production province with rapid economic development, as the research focus, which is representative for studying the healthy development of China’s terrestrial ecosystem.
The indicators constructed in this study analyze the factors that affect the health of the regional terrestrial ecosystem and synthesize the results of previous research and expert guidance [2,61,62]. The selected indicators used in this study were determined after analyzing the factors that affect the health of the regional terrestrial ecosystem and by synthesizing previous research and expert guidance. Considering the representativeness and comprehensiveness of the index, we increased the growth rates of fixed-asset investments and average local GDPs from the perspective of social and economic development. From the perspective of ecological environmental quality, the average ground wastewater load was added. The average numbers of scientific and technological personnel and proportions of educational investment in the GDP have been added from the perspective of environmental protection. In summary, this study explored the law of TEH change and the influencing factors in Henan Province from a more comprehensive perspective. The RBF neural network model was applied to the study of TEH. Based on the evaluation of the current conditions, an early-warning evaluation for the future was carried out, and dynamic and static evaluations were combined to make the evaluation results more systematic and comprehensive.
From the perspective of the overall health status of the ecosystem in Henan Province, the health status of the ecosystem has gradually decreased from a “severe alarm” to a “light alarm” state. It is obvious that Henan Province is constantly utilizing land to develop the national economy. The incomes and living standards of the residents have also significantly improved, and the treatment rates and comprehensive utilization rates of pollutants such as sewage, garbage, and industrial solid waste also have continuously improved. The pressure index generally declined, but the decline rate tended to be gentle compared with that of the last stage, which indicated that the ecological pressure was alleviated. The state index maintained a steady growth trend. The response index of each city shows a state of growth, the overall growth rate is larger than that of the last stage, and the responses to ecological problems and the degrees of protection are further improved. Therefore, Henan Province needs to prioritize ecological development, control agricultural pollution, increase investments in science and technology education and environmental protection, and improve policies and protection measures for regional ecological land utilization. Through the evaluation of the TEH status, we can see that both the comprehensive early warning index and early warning indices of the subsystems continue to increase, and the pressure on the ecosystem is not optimistic. The mechanization levels of cultivated land, forest coverage rates, domestic sewage treatment rates, and harmless treatment rates of domestic waste are the main factors that will help to improve the health status of the land ecosystem in Henan Province.

4.2. Analysis of Factors Affecting TEH

According to the basic principle of the entropy weight method, the main factors that affect the TEH in Henan Province can be analyzed. As described in Table 1, the pressure system accounts for the largest proportion, which is the main reason for the changes in TEH in Henan Province and should become the focus of the regulation and control of TEH in the future. The total weight of the state system and response system is relatively small, but it provides a certain restraint on the pressure system to maintain the stable situation of the TEH in the entire province. In terms of specific indicators, the weights of indicators such as the land reclamation rates, average fertilizer inputs, average pesticide inputs, average wastewater load rates, average grain outputs, and average numbers of agricultural scientific and technological personnel are large. Most of these indicators are related to the agricultural production. Henan Province is an important agricultural province in China, and the agricultural economy accounts for a large proportion. The traditional farming production mode involves using larger amounts of chemical fertilizers and pesticides, which has caused significant pressure on land ecology and is the main problem faced by the TEH of Henan Province [63]. Therefore, Henan Province should further optimize and adjust the agricultural industrial structure, reasonably guide the rational use of chemical fertilizers and pesticides in agricultural production and reduce the levels of industrial energy consumption and water consumption. Accelerating the promotion of a green economy and circular economy and realizing the coordinated development of urbanization, industrialization, agricultural modernization, and ecological environment protection are also important [64,65].

4.3. Suggestions

According to the results, the future state of THE in Henan Province is improving. However, it is a fact that the pressure system still needs more attention. The economy grows, and people need more resources, especially in the agricultural province of Henan. More attention should be given to indicators such as land reclamation rates, average fertilizer inputs, average pesticide inputs, and average wastewater load rates. In addition, suggestions are following:
First, the government should promote the transformation of farms to green agriculture [55]. In addition, adjusting the agricultural production structures and management modes is also necessary. Henan is an important food-producing province in China that plays a vital role in national food security. In the future, the use of pesticides, chemical fertilizers, and agricultural film should be reduced and controlled to improve the ecological pressure on the land, especially cultivated land.
Second, industrial wastes should be controlled. The comprehensive utilization rate of industrial solid waste and disposal rate of municipal waste without hazardous impacts should be further improved. For example, Sanmenxia has many energy-consuming industrial enterprises, such as mining, power generation, and metallurgy, which produce industrial wastes while also developing and utilizing natural resources. The wastes exert great pressure on the local TEH. The average wastewater loads have a great impact on Henan Province, and the comprehensive utilization rate of industrial solid waste is high in all cities. Industrial wastewater, waste gas, and solid waste have very large negative impacts on the TEH.
Third, in the future, we should increase the numbers of agrotechnicians to help improve the production capacity of cultivated lands. The per capita cultivated land area impacts the overall TEH. The government should strictly approve land uses according to land spatial planning to increase the economic supply of land. Effective protection of cultivated land is an inevitable requirement for maintaining the TEH. We should control the proportion of construction land and maintain sufficient agricultural production and ecological space. Improving the irrigation guarantee ability for cultivated land creates favorable conditions for agricultural production.
Overall, in the process of eco-environmental protection, we should take multiple measures at the same time, implement comprehensive policies, and use measures from the varying perspectives of science and technology, law, planning, economy, and administration.

4.4. Limitations

The focus of the international community on carbon neutralization in recent years also demonstrates the impact of carbon emissions on ecological security. Reducing carbon emissions is very helpful for achieving ecological security and sustainable development. In future research, we will explore a more accurate model that considers carbon emissions to provide more accurate ideas for promoting the sustainable development of Henan. In addition, our research focuses mainly on the medium scale, where the selection of indicators takes into account socioeconomic factors. Under the COVID-19 epidemic, global economic development has been affected. However, the Chinese government has taken effective measurements to protect the economy from being impacted, so this result is still applicable. For countries seriously affected by the epidemic, the method and ideas are applicable. However, actual local conditions need to be considered in the selection of indicators.

5. Conclusions

TEH early warnings are an important part of ecological security research. These involve a process of dynamically monitoring and evaluating the ecosystem status of a region and predicting the degree of degradation of the regional ecosystem. With the development of the global economy and society, increasing numbers of countries and regions have begun to incorporate the construction of ecological civilizations into their development processes. The development trend of each TEH system in Henan Province was simulated and predicted using the RBF model.
The results show that the fitting accuracy of the RBF model is high, and the predicted results conform to the actual conditions of Henan Province. This indicates that RBF is an effective method for predicting TEH and issuing associated warnings. This can reflect the overall TEH status in Henan Province. From 2007 to 2025, the TEH status in Henan Province exhibited an overall improving trend, and the warning level continued to decrease. The warning level decreased from “severe warning” to “no warning”. The indicator light changed from “yellow light” to “green light”. Regarding each subsystem, the pressure subsystem fluctuated between an “extraordinary warning” and a “heavy warning”. The index of the state subsystem will keep increasing and will reach a “light warning” state in the future. The early warning index of the response subsystem will show an upward trend and reach the “no warning” state. The stable development of TEH in the region mainly benefits from positive policy response measures. Combined with Table 2, the health status of the land ecosystem in Henan Province is guaranteed to be stable due to improvements in rural residential incomes, mechanization levels of cultivated land, domestic sewage treatment rates, and the numbers of scientific and technological personnel per unit of land. The TEH is mainly restricted by the population densities, urbanization levels, inputs of fertilizers and pesticides, and average wastewater load factors on the land. To maintain the health status of TEH, it is necessary to reduce the use of fertilizers and pesticides and to control the urbanization rate. At the same time, improving the level of forest coverage and the effective irrigation rate plays a positive role in improving ecosystem health.
This study constructed 28 indicators from the perspectives of different subsystems and used a combination of the entropy method and RBF neural network model to dynamically evaluate the regional TEH. After analyzing the impacts of different factors on the TEH, this research proposes some suggestions that are beneficial to ecosystems. In the future, we need to deeply explore the principles of interaction between land ecological risks and land ecological health to understand the TEH in a more comprehensive and in-depth manner.

Author Contributions

Writing—original draft, Y.L.; methodology, R.D.; writing—review and editing, M.L. and X.Z.; data curation, Z.F. and Z.L. All authors have read and agreed to the published version of the manuscript.

Funding

This research was supported by Henan provincial fund for young backbone teachers (Grant No. 2018GGJS034) and by the philosophy and social science planning project of Henan Province (Grant No. 2020BJJ037) and the National Social Science Fund of China (20&ZD090) and the Second Qinghai-Tibetan Plateau Scientific Expedition and Research Program (Grant Nos. 2019QZKK0405) and National Natural Science Foundation of China (42071249, 41671519 and 41271535).

Institutional Review Board Statement

Not applicable.

Informed Consent Statement

Not applicable.

Data Availability Statement

Not applicable.

Conflicts of Interest

The authors declare no conflict of interest.

Appendix A

Appendix A.1. Standardization of Indicator Data

Due to the indexes have the different dimensions, magnitudes, and attribute, this research adopts the range standardization method to deal with each index for a better comparison and analysis of the original data [54]:
The formula for the positive index is:
Y i j = ( X i j m i n X j ) ( m a x X j m i n X j )
The formula for negative indicators is:
Y i j = ( m a x X j X i j ) / ( m a x X j m i n X j )
where X i j represents the original value of item j of the year i , Y i j is the standardized standard value of item j of the year i , m a x X j represents the maximum value of item j , and m i n X j represents the minimum of the index in item j .

Appendix A.2. Determination of Index Weight

The index weight reflects the contribution of an evaluation index to the overall evaluation. To avoid the unstable measurement results caused by the subjective assignment method, this study adopts the entropy method to calculate the index weight [62]. The calculation process is as follows. The flows are described in Figure 4.
w j = ( 1 H j ) / ( n j = 1 n H j )
where H j = − K i = 1 n f i j ln f i j ,   f i j = Y i j / i = 1 n Y i j , k = 1/ ln n ( f i j = 0 , f i j ln f i j = 0 ), w j is the weight of the j -th index, and H j is the entropy of the j -th index. The calculation results are shown in Table 1.

Appendix A.3. Calculating Early-Warning Index

F = i = 1 3 w i × ( j = 1 n Y i j × w i j )
We used comprehensive index method to calculate in early-warning index. In the formula, F is the comprehensive index of TEH, Wi is the weight of the i -th subsystem, w i j is the weight of the index item j of subsystem i , and n is the number of indicators contained in subsystem i . The closer F is to 1, the better the status is.

Appendix A.4. Learning Process of the RBF Neural Network

For the radial basis function of the RBF neural network model, the most commonly used is the Gauss function, in the form:
R i ( x ) = e x p ( | | x c i | | 2 / 2 a i 2 ) , i = 1 , 2 , , m
where | | | | represents a norm, usually taking two norms, x is the n-dimensional input vector, ci denotes the center of the i -th basic function, ai represents the normalized parameter of the i -th hidden node, i.e., the width of the i -th non-linear varying unit, and m is the number of nodes in the hidden layer.
The RBF learning process contains two stages: unsupervised learning and supervised learning. In the unsupervised learning stage, the K-means clustering method is used to cluster the input of training samples to find the parameters of cluster center ci and a. When c i and m are determined, the RBF neural network becomes a set of linear equations, ranging from input to output. In the second supervised learning stage, the least square method is used to determine the weight, w j , from the hidden layer to the output layer. The steps are following:
(1)
Using the range method to transfer the variables to the range that the network can handle;
(2)
Calculate the output value of the hidden layer: Y h ;
(3)
Calculate the output value Y j of the j -th index of the output layer;
(4)
Calculate the error of the output layer:
Δ Y j = ( 1 Y j ) ( y j Y j )
where Y j represents the actual value of the j -th neuron
(5)
Adjust the weight coefficient to make the error of neural network meet the requirements:
Δ W = ε Δ Y j ( 1 Y j ) ( y j Y j )   ,   W j ' = W j + Δ W
where W j represents the adjusted weight, ε is the learning efficiency of neural net.
After the clustering center c i and weight W j of the neural network are determined, the prediction can be carried out with the help of the trained neural network model, and the corresponding output value can be obtained according to a known input value [46].
In this study, the Newrb toolbox in MATLAB R2016b software was applied to create an accurate network model. Using the 2007–2017 TEH index as sample data, the RBF neural network was used to train the training sample to build the prediction model and test the validation sample set to test the model’s accuracy.

Appendix A.5. Precision Check of Forecast Model

To accurately validate the model learning effect and forecast the trend of TEH, Pearson correlation coefficient, R, and RMSE were selected to test the error in the RBF learning result of the j -th neuron output value. The formula is:
R = i = 1 T ( y j t y j t ¯ ) ( Y j t y j t ¯ ) i = 1 T ( y j t y j t ¯ ) 2 i = 1 T ( Y j t y j t ¯ ) 2
R M S E = t = 1 T ( y j t Y j t ) 2 T
Its operation principle is that the node of the hidden layer performs a non-linear change through the basis function. In the formula, Y j t   and   y j t are the j -th neuron output value and actual value of the i -th sample respectively, y j t ¯ is the average of y j t , and T is the sample size. When MSE < 0.04, R > 0.95, and this shows that the learning effect of the neural network is good and has high reliability [46,66].

Appendix B

Table A1. Evaluation results of land-use ecological health in Henan Province from 2007 to 2017.
CityPressure IndexState IndexResponse IndexComposite Index
200720122017200720122017200720122017200720122017
Zhengzhou0.66090.3560.35620.44750.44880.61770.01990.42940.96930.37420.41150.6494
Kaifeng0.66010.34660.34140.22540.46930.77530.1720.33680.84830.35190.38410.6557
Luoyang0.80770.32540.24140.43060.55170.66530.1430.59920.9720.47150.48660.6139
Pingdingshan0.8580.31630.20250.3760.57610.69110.24470.53540.83960.49130.47630.5794
Anyang0.81990.45240.27140.33120.53270.68590.12950.66090.86560.42570.54910.6087
Hebi0.76380.30260.14880.44520.38870.64770.12410.41370.93240.44260.36860.5783
Xinxiang0.84140.27290.25450.32950.4310.67820.16620.59670.97440.44520.43380.6364
Jiaozuo0.69720.41230.36560.37510.45740.62530.17630.51740.86560.41490.46270.6201
Puyang0.74250.31180.23280.32570.4180.8070.06980.67120.90080.37820.46770.6478
Xuchang0.68890.41330.43680.35160.47420.6960.07170.69180.92360.36990.52690.6862
Luohe0.75890.36240.23850.37480.50590.6150.20510.59470.92660.44540.48810.5947
Sanmenxia0.67470.22690.3410.2290.48780.7340.19660.43050.64920.36590.3820.5752
Nanyang0.66850.24170.31430.37110.35620.8320.23330.30740.8510.42320.30180.6668
Shangqiu0.81210.36070.18450.29490.48010.66550.19940.30490.86460.43410.38150.5732
Xinyang0.84560.26180.09170.33040.51530.66470.24640.50480.95880.47320.42760.5732
Zhoukou0.72940.42940.22980.33490.55880.63680.11050.53850.92860.39010.50910.6001
Zhumadian0.70650.36850.13930.26420.35370.82360.14910.41750.90270.37190.38010.6236
Jiyuan0.65140.48280.25790.55130.31440.65030.01460.6420.87630.40460.48020.5957

References

  1. Mukul, S.A.; Sohel, M.S.I.; Herbohn, J.; Inostroza, L.; König, H. Integrating Ecosystem Services Supply Potential from Future Land-Use Scenarios in Protected Area Management: A Bangladesh Case Study. Ecosyst. Serv. 2017, 26, 355–364. [Google Scholar] [CrossRef]
  2. Jin, H.; Wang, J.; Jia, M.; Zhang, B.; Xu, S. Evaluation of China’s Land Use System Health Based on System Dynamics. Resour. Environ. Yangtze Basin 2020, 29, 1064–1074. [Google Scholar]
  3. Zhong, S.; Shi, P.; Yang, W.; Li, Z.; Li, P.; Yang, S. Health Evaluation and Obstacle Factor Diagnosis of Land Use System Based on PSR Model: A case study of Yanchang County. Res. Soil Water Conserv. 2019, 26, 283–289. [Google Scholar]
  4. Liu, F.; Yan, M.; Liu, Y.; Xiao, M.; Qin, W. Spatial pattern of land use intensity in China in 2000. Acta Geogr. Sin. 2016, 71, 1130–1143. [Google Scholar]
  5. Wei, R. Analysis of agricultural non-point sources pollution-taking Henan Province as an example. Chin. J. Agric. Resour. Reg. Plan. 2016, 37, 67–71. [Google Scholar]
  6. Wang, S.; Yang, D.; Sun, J.; Tang, H.; Wang, P.; Lu, S. Analysis on agricultural non-point source pollution loadings and its characteristics in China. Water Resour. Prot. 2021, 32, 1–11. [Google Scholar]
  7. Ren, Y.; Tian, J.; Chen, J. Spatial Distribution Characteristics of Core Region Grain Production Capacity in Henan Province. J. Anhui Agric. Sci. 2018, 46, 193–197. [Google Scholar]
  8. Liu, S. Study on ecological reconstruction of grain core production area in Henan Province. Chin. J. Agric. Resour. Reg. Plan. 2017, 38, 171–176. [Google Scholar]
  9. Sanaullah, M.; Usman, M.; Wakeel, A.; Cheema, S.A.; Ashraf, I.; Farooq, M. Terrestrial Ecosystem Functioning Affected by Agricultural Management Systems: A Review. Soil Tillage Res. 2020, 196, 104464. [Google Scholar] [CrossRef]
  10. Zhai, T.; Wang, J.; Fang, Y.; Qin, Y.; Huang, L.; Chen, Y. Assessing Ecological Risks Caused by Human Activities in Rapid Urbanization Coastal Areas: Towards an Integrated Approach to Determining Key Areas of Terrestrial-Oceanic Ecosystems Preservation and Restoration. Sci. Total Environ. 2020, 708, 135153. [Google Scholar] [CrossRef]
  11. Shou-guang, Y.; Hui, L.; Hai-dong, L.; Yin-long, Z. Ecosystem health assessment method of eco-redline based on land use and landscape pattern in Nanjing. J. Nat. Resour. 2020, 35, 1109. [Google Scholar] [CrossRef]
  12. Wang, T.; Cao, J.; Zhao, Y.; Han, L.; Liu, Z. Health evaluation of land ecosystem in Shaanxi Province, Northwest China based on PSR Model. Chin. J. Appl. Ecol. 2021, 11, 1563–1572. [Google Scholar]
  13. Frontalini, F.; Coccioni, R. Benthic Foraminifera as Bioindicators of Pollution: A Review of Italian Research over the Last Three Decades. Revue de Micropaléontologie 2011, 54, 115–127. [Google Scholar] [CrossRef]
  14. Microbial Indicators as a Diagnostic Tool for Assessing Water Quality and Climate Stress in Coral Reef Ecosystems. SpringerLink. Available online: https://link.springer.com/article/10.1007%2Fs00227-017-3097-x (accessed on 18 September 2021).
  15. Cape, J.N. Surface Ozone Concentrations and Ecosystem Health: Past Trends and a Guide to Future Projections. Sci. Total Environ. 2008, 400, 257–269. [Google Scholar] [CrossRef] [Green Version]
  16. An, K.-G.; Choi, J.-W.; Lee, Y.-J. Modifications of Ecological Trophic Structures on Chemical Gradients in Lotic Ecosystems and Their Relations to Stream Ecosystem Health. Anim. Cells Syst. 2013, 17, 53–62. [Google Scholar] [CrossRef] [Green Version]
  17. de Moura, E.G.; Gehring, C.; Braun, H.; Ferraz Junior, A.D.S.L.; Reis, F.D.O.; Aguiar, A.D.C.F. Improving Farming Practices for Sustainable Soil Use in the Humid Tropics and Rainforest Ecosystem Health. Sustainability 2016, 8, 841. [Google Scholar] [CrossRef] [Green Version]
  18. Kesgin Atak, B.; Ersoy Tonyaloğlu, E. Monitoring the Spatiotemporal Changes in Regional Ecosystem Health: A Case Study in Izmir, Turkey. Environ. Monit. Assess. 2020, 192, 385. [Google Scholar] [CrossRef] [PubMed]
  19. Nolan, C.; Overpeck, J.T.; Allen, J.R.M.; Anderson, P.M.; Betancourt, J.L.; Binney, H.A.; Brewer, S.; Bush, M.B.; Chase, B.M.; Cheddadi, R.; et al. Past and Future Global Transformation of Terrestrial Ecosystems under Climate Change. Science 2018, 361, 920–923. [Google Scholar] [CrossRef] [PubMed] [Green Version]
  20. Wang, Z.; Tang, L.; Qiu, Q.; Chen, H.; Wu, T.; Shao, G. Assessment of Regional Ecosystem Health-A Case Study of the Golden Triangle of Southern Fujian Province, China. Int. J. Environ. Res. Public Health 2018, 15, 802. [Google Scholar] [CrossRef] [Green Version]
  21. Sun, R.; Yao, P.; Wang, W.; Yue, B.; Liu, G. Assessment of Wetland Ecosystem Health in the Yangtze and Amazon River Basins. ISPRS Int. J. Geo-Inf. 2017, 6, 81. [Google Scholar] [CrossRef] [Green Version]
  22. Cheng, X.; Chen, L.; Sun, R.; Kong, P. Land Use Changes and Socio-Economic Development Strongly Deteriorate River Ecosystem Health in One of the Largest Basins in China. Sci. Total Environ. 2018, 616–617, 376–385. [Google Scholar] [CrossRef] [PubMed]
  23. Liu, B.; Qie, R.; Wang, D.; Liu, H. Health diagnosis on land use system based on grey correlation model: A case study of Jilin Province. Chin. J. Agric. Resour. Reg. Plan. 2016, 36, 9–17. [Google Scholar]
  24. Guo, L.; Feng, Z.; Liu, G.; Shi, Y.; Wang, J.; Lin, F.; Ma, X. Evaluation of land eco-security in Fenhe river Basin based on matter-element model. Chin. J. Ecol. 2020, 39, 2061–2069. [Google Scholar]
  25. Zhang, F.; Liu, X.; Zhang, J.; Wu, R.; Ma, Q.; Chen, Y. Ecological Vulnerability Assessment Based on Multi-Sources Data and SD Model in Yinma River Basin, China. Ecol. Model. 2017, 349, 41–50. [Google Scholar] [CrossRef]
  26. Pinto, R.; de Jonge, V.N.; Neto, J.M.; Domingos, T.; Marques, J.C.; Patrício, J. Towards a DPSIR Driven Integration of Ecological Value, Water Uses and Ecosystem Services for Estuarine Systems. Ocean Coast. Manag. 2013, 72, 64–79. [Google Scholar] [CrossRef]
  27. Das, M.; Das, A.; Mandal, A. Research Note: Ecosystem Health (EH) Assessment of a Rapidly Urbanizing Metropolitan City Region of Eastern India – A Study on Kolkata Metropolitan Area. Landsc. Urban Plan. 2020, 204, 103938. [Google Scholar] [CrossRef]
  28. Wang, H.; Hou, P.; Jiang, J.; Xiao, R.; Zhai, J.; Fu, Z.; Hou, J. Ecosystem Health Assessment of Shennongjia National Park, China. Sustainability 2020, 12, 7672. [Google Scholar] [CrossRef]
  29. Yang, Y.; Song, G.; Lu, S. Assessment of Land Ecosystem Health with Monte Carlo Simulation: A Case Study in Qiqihaer, China. J. Clean. Prod. 2020, 250, 119522. [Google Scholar] [CrossRef]
  30. Guo, J.; Wei, Z.; Ren, J.; Luo, Z.; Zhou, H. Early-Warning Measures for Ecological Security in the Qinghai Alpine Agricultural Area. Int. J. Environ. Res. Public Health 2020, 17, 9292. [Google Scholar] [CrossRef]
  31. Chen, Y.; Wang, J. Ecological Security Early-Warning in Central Yunnan Province, China, Based on the Gray Model. Ecol. Indic. 2020, 111, 106000. [Google Scholar] [CrossRef]
  32. Alibakhshi, S.; Groen, T.A.; Rautiainen, M.; Naimi, B. Remotely-Sensed Early Warning Signals of a Critical Transition in a Wetland Ecosystem. Remote Sens. 2017, 9, 352. [Google Scholar] [CrossRef] [Green Version]
  33. Ishtiaque, A.; Myint, S.W.; Wang, C. Examining the Ecosystem Health and Sustainability of the World’s Largest Mangrove Forest Using Multi-Temporal MODIS Products. Sci. Total Environ. 2016, 569–570, 1241–1254. [Google Scholar] [CrossRef] [PubMed]
  34. Jia, Q.; Zhessakov, A. Study on Ecological Evaluation of Urban Land Based on GIS and RS Technology. Arab. J. Geosci. 2021, 14, 261. [Google Scholar] [CrossRef]
  35. Bahraminejad, M.; Rayegani, B.; Jahani, A.; Nezami, B. Proposing an Early-Warning System for Optimal Management of Protected Areas (Case Study: Darmiyan Protected Area, Eastern Iran). J. Nat. Conserv. 2018, 46, 79–88. [Google Scholar] [CrossRef]
  36. Ekumah, B.; Armah, F.A.; Afrifa, E.K.A.; Aheto, D.W.; Odoi, J.O.; Afitiri, A.-R. Geospatial Assessment of Ecosystem Health of Coastal Urban Wetlands in Ghana. Ocean Coast. Manag. 2020, 193, 105226. [Google Scholar] [CrossRef]
  37. Okumura, K.; Ogoshi, T.; Asada, T.; Arimura, M.; Arreeras, T. Development of Downscaling Method Using the RBF Network Assessing the Hourly Population Inflow: A Case Study of the Sapporo Urban Area. Asian Transp. Stud. 2020, 6, 100019. [Google Scholar] [CrossRef]
  38. Papadimitrakis, M.; Stogiannos, M.; Sarimveis, H.; Alexandridis, A. Multi-Ship Control and Collision Avoidance Using MPC and RBF-Based Trajectory Predictions. Sensors 2021, 21, 6959. [Google Scholar] [CrossRef]
  39. Chen, Y.; Teng, J.; Shen, L.; Yu, G.; Li, R.; Xu, Y.; Wang, F.; Liao, B.-Q.; Lin, H. Novel Insights into Membrane Fouling Caused by Gel Layer in a Membrane Bioreactor: Effects of Hydrogen Bonding. Bioresour. Technol. 2019, 276, 219–225. [Google Scholar] [CrossRef] [PubMed]
  40. Alexandridis, A.; Chondrodima, E.; Sarimveis, H. Radial Basis Function Network Training Using a Nonsymmetric Partition of the Input Space and Particle Swarm Optimization. IEEE Trans. Neural Netw. Learn. Syst. 2013, 24, 219–230. [Google Scholar] [CrossRef] [PubMed]
  41. Cai, P.; Wang, Y.; Lu, G. Tunable and Transferable RBF Model for Short-Term Traffic Forecasting. IEEE Trans. Intell. Transp. Syst. 2019, 20, 4134–4144. [Google Scholar] [CrossRef]
  42. Li, Z.; Yang, Q.; Wang, L.; Martín, J.D. Application of RBFN Network and GM (1, 1) for Groundwater Level Simulation. Appl. Water Sci. 2017, 7, 3345–3353. [Google Scholar] [CrossRef] [Green Version]
  43. Koo, K.-M.; Han, K.-H.; Jun, K.-S.; Lee, G.; Kim, J.-S.; Yum, K.-T. Performance Assessment for Short-Term Water Demand Forecasting Models on Distinctive Water Uses in Korea. Sustainability 2021, 13, 6056. [Google Scholar] [CrossRef]
  44. Zhang, W. Computational Ecology: Artificial Neural Networks and Their Applications; World Scientific: Singapore, 2010; ISBN 978-981-4282-62-8. [Google Scholar]
  45. Hu, S.; Yin, D.; Gao, X. Effect of Soil and Water Conservation on Ecosystem Service Value in Small Watersheds. Bull. Soi Water Conserv. 2012, 32, 286–291. [Google Scholar]
  46. Wu, Y.; Deng, N. Ecological Security Warning for Resource-Based Cities Based on RBF Neural Network Model: Taking Yulin City as an Example. Ecol. Econ. 2019, 35, 111–118. [Google Scholar]
  47. Lu, Y.; Wen, F.; Yang, Y.; Chen, L.; Zong, M. An Evaluation of Urban Land Use Performance Based on the Improved TOPSIS Method and Diagnosis of Its Obstacle Indicators: A Case Study of Chongqing. Resour. Sci. 2011, 33, 535–541. [Google Scholar]
  48. Zheng, L.; Zhang, B.; Dan, J.; Ma, X. Dynamic evaluation and influencing factors of land ecological security in Jiayuguan City. Arid. Land Geogr. 2021, 44, 289–298. [Google Scholar]
  49. Yao, L.; Wu, F.; Lu, W. Co-evolution Relationship Between the Quality of Urbanization and the Health of Land Use System in Karst Regions. Resour. Environ. Yangtze Basin 2018, 27, 768–778. [Google Scholar]
  50. Lu, X.; Zhang, S.; Xing, J.; Wang, Y.; Chen, W.; Ding, D.; Wu, Y.; Wang, S.; Duan, L.; Hao, J. Progress of Air Pollution Control in China and Its Challenges and Opportunities in the Ecological Civilization Era. Engineering 2020, 6, 1423–1431. [Google Scholar] [CrossRef]
  51. Li, S. Evaluation on Urban Land Ecological Security Based on the PSR Model and Matter-Element Analysis: A Case Study of Zhuhai, Guangdong, China. J. Landsc. Res. 2019, 11, 82–92. [Google Scholar]
  52. Henan Provincial Bureau of Statistics. Available online: http://tjj.henan.gov.cn/tjfw/tjcbw/tjnj/ (accessed on 21 December 2021).
  53. China City Statistical Yearbook. Available online: https://data.cnki.net/trade/Yearbook/Single/N2013040146?z=Z006 (accessed on 21 December 2021).
  54. Statistics of National Economic and Social Development of Henan Province. Available online: http://www.ha.stats.gov.cn/tjfw/tjgb/ (accessed on 21 December 2021).
  55. Wang, P.; Wang, J.; Liu, P.; Chen, X.; Kong, X. Evaluation of health of land use system in ecological resettlement area based on PSR model-A case study of Hongsibu area. Res. Soil Water Conserv. 2018, 25, 270–276. [Google Scholar]
  56. Su, P. Study on the Health Evaluation of Land Use System Based on DPSIR-TOPSIS Model in Enshi. Master’s Thesis, Central China Normal University, Wuhan, China, 2017. [Google Scholar]
  57. Zheng, W.; Xia, L.; Zhang, R.; Liu, Z. Diagnosis on ecological security of cultivated land based on entropy method and grey prediction model. Bull. Soil Water Conserv. 2016, 36, 284–289. [Google Scholar]
  58. Moody, J.; Darken, C.J. Fast Learning in Networks of Locally-Tuned Processing Units. Neural Comput. 1989, 1, 281–294. [Google Scholar] [CrossRef]
  59. Xu, M.; Zhu, X.; Liu, L. Early-warning of Land Ecological Security in Hunan Province Based on RBF. Acta Geogr. Sinisa 2012, 67, 1411–1422. [Google Scholar]
  60. Zhang, R.; Fang, L.; Wang, B.; Ma, T. Prediction of urban built-up area based on RBF neural network-comparative analysis with BP neural network and linear regression. Resour. Environ. Yangtze Basin 2013, 22, 691–697. [Google Scholar]
  61. Wang, W.; Li, M. Spatiotemporal change of land ecological security in Hunan based on DPSIR. Chin. J. Ecol. 2020, 39, 2724–2736. [Google Scholar]
  62. Wang, Q.; Jin, X.; Zhou, Y. Cultivated land ecological security and spatial aggregation Pattern in Hebei Province. Trans. CSAE 2011, 27, 338–344. [Google Scholar]
  63. Wei, C.; Zhang, Q. Spatiotemporal pattern and obstacle factors of land eco-security early warning in Henan province. Res. Soil Water Conserv. 2020, 27, 238–246. [Google Scholar]
  64. Li, M.; Chen, W.; Xun, Y.; Ma, Y.; Guo, R. Evaluation on Farmland Ecological Security in Henan Province Based on Projection Pursuit Model. Res. Soil Water Conversat. 2018, 25, 257–269. [Google Scholar]
  65. Ma, W.; Pu, C.; Chen, Q.; Jiang, L.; Su, L.; Mu, F.; Liu, X. Health evaluation of land use system in Urumqi city based on entropy weight-set pair analysis method. Chin. J. Agric. Resour. Reg. Plan. 2018, 39, 28–33. [Google Scholar]
  66. Shu, B.; Liu, Y.; Xu, J.; He, B.; Wu, G. Early warning of ecological security based on BP-ANN: A case study of Suzhou. Resour. Environ. Yangtze Basin 2010, 19, 1080–1085. [Google Scholar]
Figure 1. Study area—Henan, China.
Land 11 00032 g001
Figure 2. Operational mechanism of the PSR model.
Land 11 00032 g002
Figure 3. Structure of the RBF neural network.
Land 11 00032 g003
Figure 4. Forecast and early warning flow chart.
Land 11 00032 g004
Figure 5. Evaluation results for the TEH in Henan Province from 2007 to 2025.
Land 11 00032 g005
Figure 6. RBF study situation of each land ecological health early-warning subsystem in Henan Province.
Land 11 00032 g006
Figure 7. Spatial TEH distribution in Henan Province.
Land 11 00032 g007
Table 1. TEH evaluation index system for Henan Province.
Target LayerCriteria LayerIndex LayerAssignmentWeightAttribute
Land ecosystem HealthPressure
(0.4451)
Population density (X1)Total population/total land area0.1034
Natural population growth rate (X2)Natural population growth/total population0.0622
Per capita cultivated land area (X3)Total cultivated area/population0.0944+
Urbanization level (X4)Nonagricultural population/total population0.0703
The annual growth rate of GDP (X5)GDP of the year/last year-10.0693
The growth rate of fixed-asset investment (X6)The current year/last year-10.0653
Land reclamation rate (X7)Cultivated land area/total land area0.1259
Average fertilizer input (X8)The total amount of fertilizer/total area of cultivated land0.1312
Average pesticide input (X9)The total amount of pesticide/total area of cultivated land0.1143
Average input of agricultural film (X10)The total amount of agricultural film/total area of cultivated land0.0977
The proportion of construction land (X11)Construction land area/total land area0.0659
State
(0.3321)
Per capita GDP (X12)GDP/total population0.0857+
Per capita grain yield (X13)Total grain output/total cultivated land area0.1722+
The proportion of primary industry in GDP (X14)The output value of the primary industry/GDP0.0698+
Per capita grain (X15)Total food production/population0.0908+
GDP per capita (X16)GDP/total land area0.0888+
Mechanization level of cultivated land (X17)The weighted sum of the yield of tractor seeder0.0510+
Effective irrigation rate (X18)Effective irrigation area/total cultivated land area0.0789+
Forest coverage rate (X19)Forest area/total land area0.0797+
Ground average wastewater load (X20)Wastewater discharge/total land area0.1213
Natural disaster rate (X21)Affected area/total cultivated area0.0750
Water resources per capita (X22)Total water resources/total population0.0869+
Response
(0.3358)
Domestic sewage treatment rate (X23)Treatment capacity/total production0.0954+
Harmless treatment rate of domestic waste (X24)Treatment capacity/total production0.1170+
Number of scientific and technological personnel per capita (X25)Total scientific and technological personnel/total land area0.2657+
Per capita disposable income of farmers (X26)Total consumer spending and savings0.2292+
The comprehensive utilization rate of industrial solid waste (X27)Comprehensive utilization/total waste production0.0857+
The proportion of education investment in GDP (X28)Education investment/GDP0.2069+
Note: “+” and “−” represent positive and negative indicators, respectively.
Table 2. Warning standard of TEH in Henan Province.
Warning Degree Extent(0~0.4](0.4~0.6](0.6~0.75](0.75~0.9](0.9~1.0]
Warning degreeExtraordinary warningSevere warningModerate warningLight warningNo warning
Indicator lightRed light
Yellow light
Orange light
Blue light
Green light
DescriptionThe ecological environment has been seriously damaged, ecological restoration and reconstruction are very difficult, and the current situation of the land ecological environment is very badThe function of the ecosystem is greatly degraded, it is difficult to recover after external interference, and the ability of sustainable development is weakThe ecological service function has been degraded, but it can still maintain the current state, which is easy to deteriorate after being disturbedThe ecosystem is less damaged, the ecological restoration ability is strong, and there is no harm to human healthThe ecosystem is not damaged, and the environmental quality is good
Table 3. Early-warning indicator lamps for the health status of the terrestrial ecosystem.
YearTerrestrial Ecosystem Health SubsystemTEH
Pressure SystemState SystemResponse System
2007
2008
2009
2010
2011
2012
2013
2014
2015
2016
2017
2018🔺🔺
2019
2020
2021
2022
2023
2024
2025
Note: ● represents a red light, ★ represents a yellow light, ▲ represents an orange light, ◆ represents a blue light, and ■ represents a green light.
Publisher’s Note: MDPI stays neutral with regard to jurisdictional claims in published maps and institutional affiliations.

