
Forest Transition and Metropolitan Transformations in Developed Countries: Interpreting Apparent and Latent Dynamics with Local Regression Models

 , , ,
, , ,
Abstract
:1. Introduction
2. Methodology
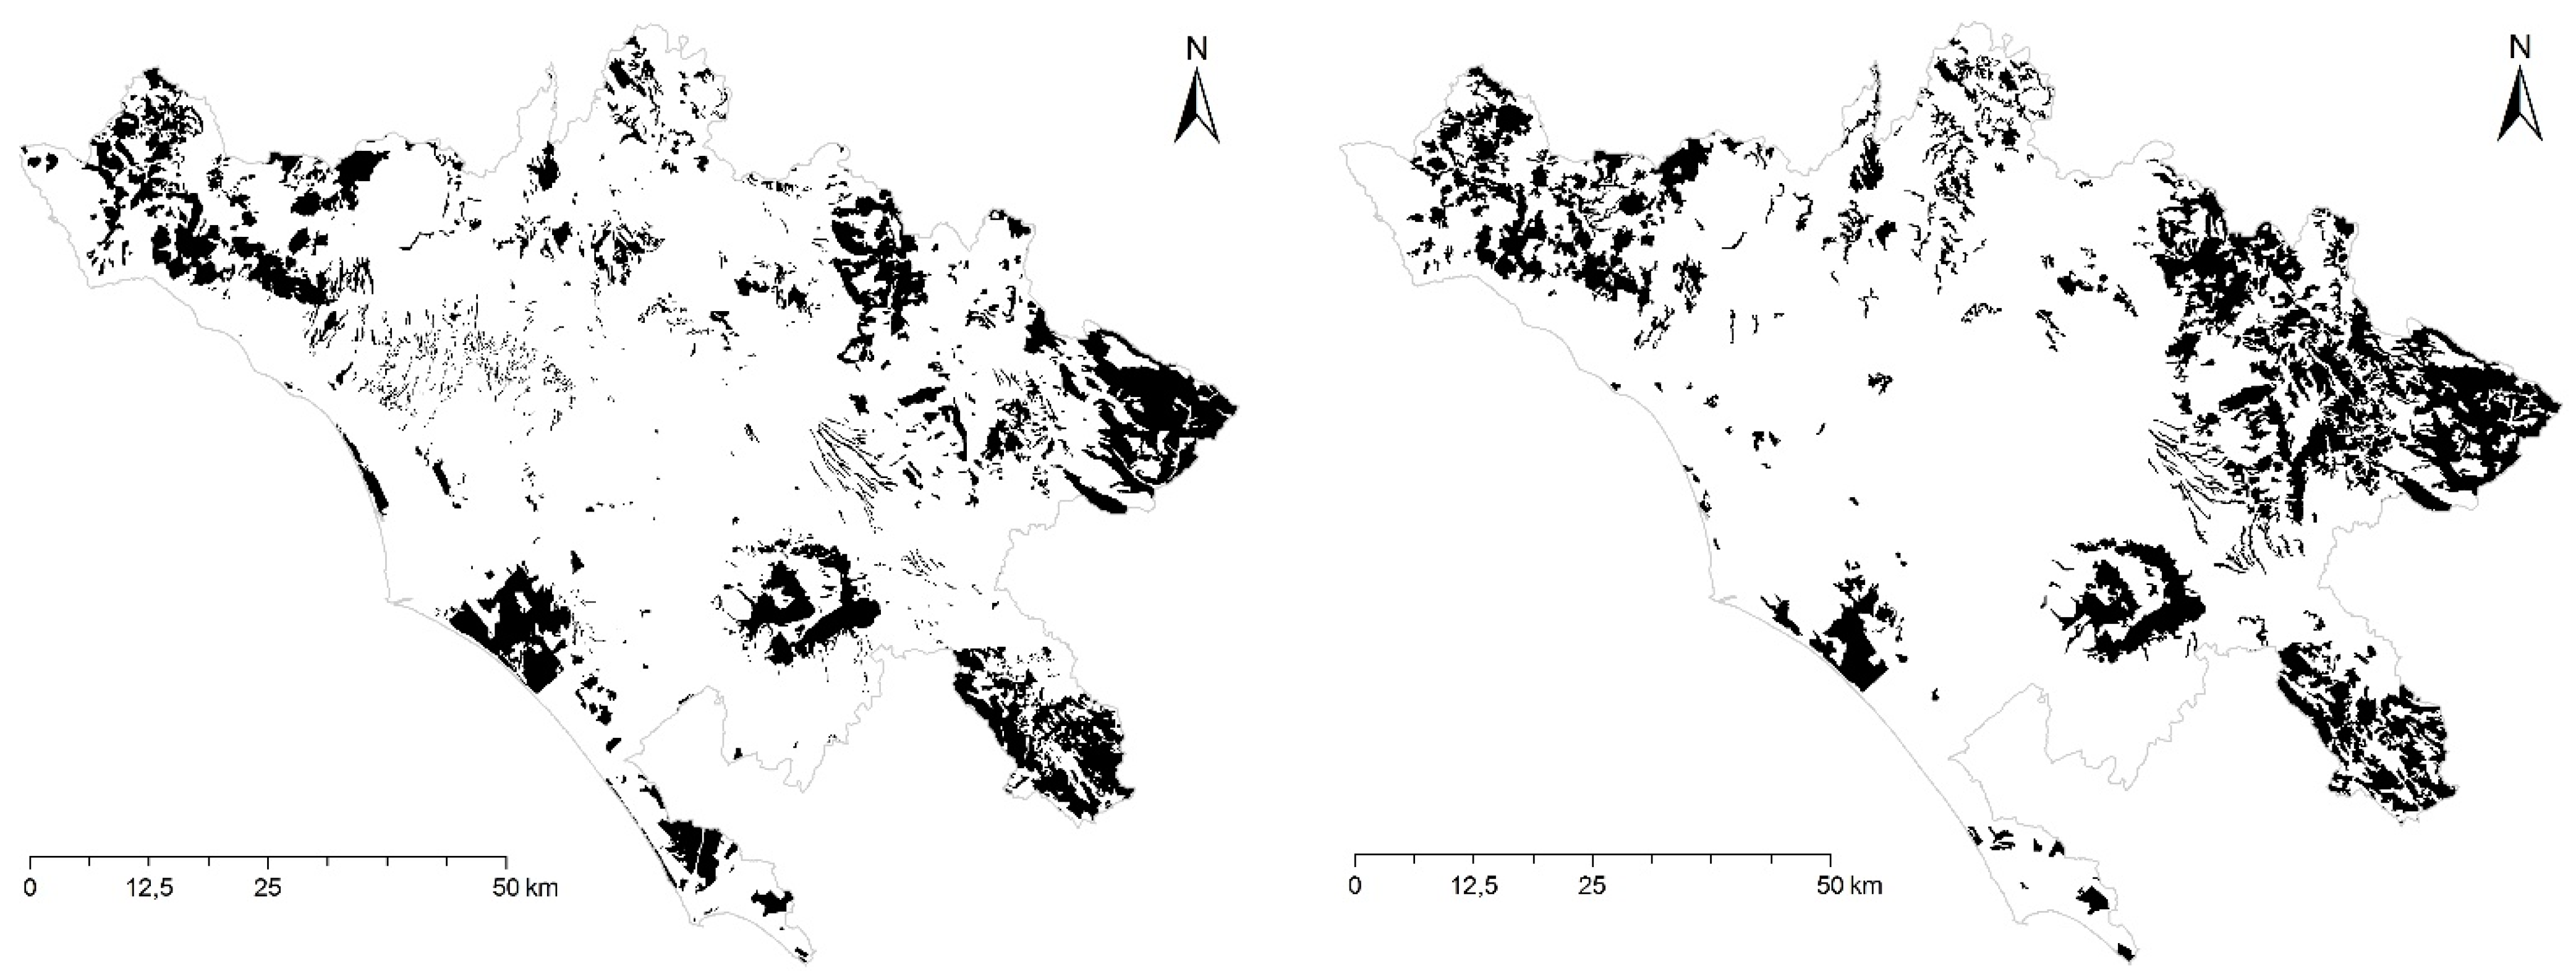
2.1. Study Area
2.2. Forest Maps
2.3. Logical Framework
2.4. Statistical Analysis
2.4.1. Global Approaches
2.4.2. Local Approaches
3. Results
3.1. Global Approaches
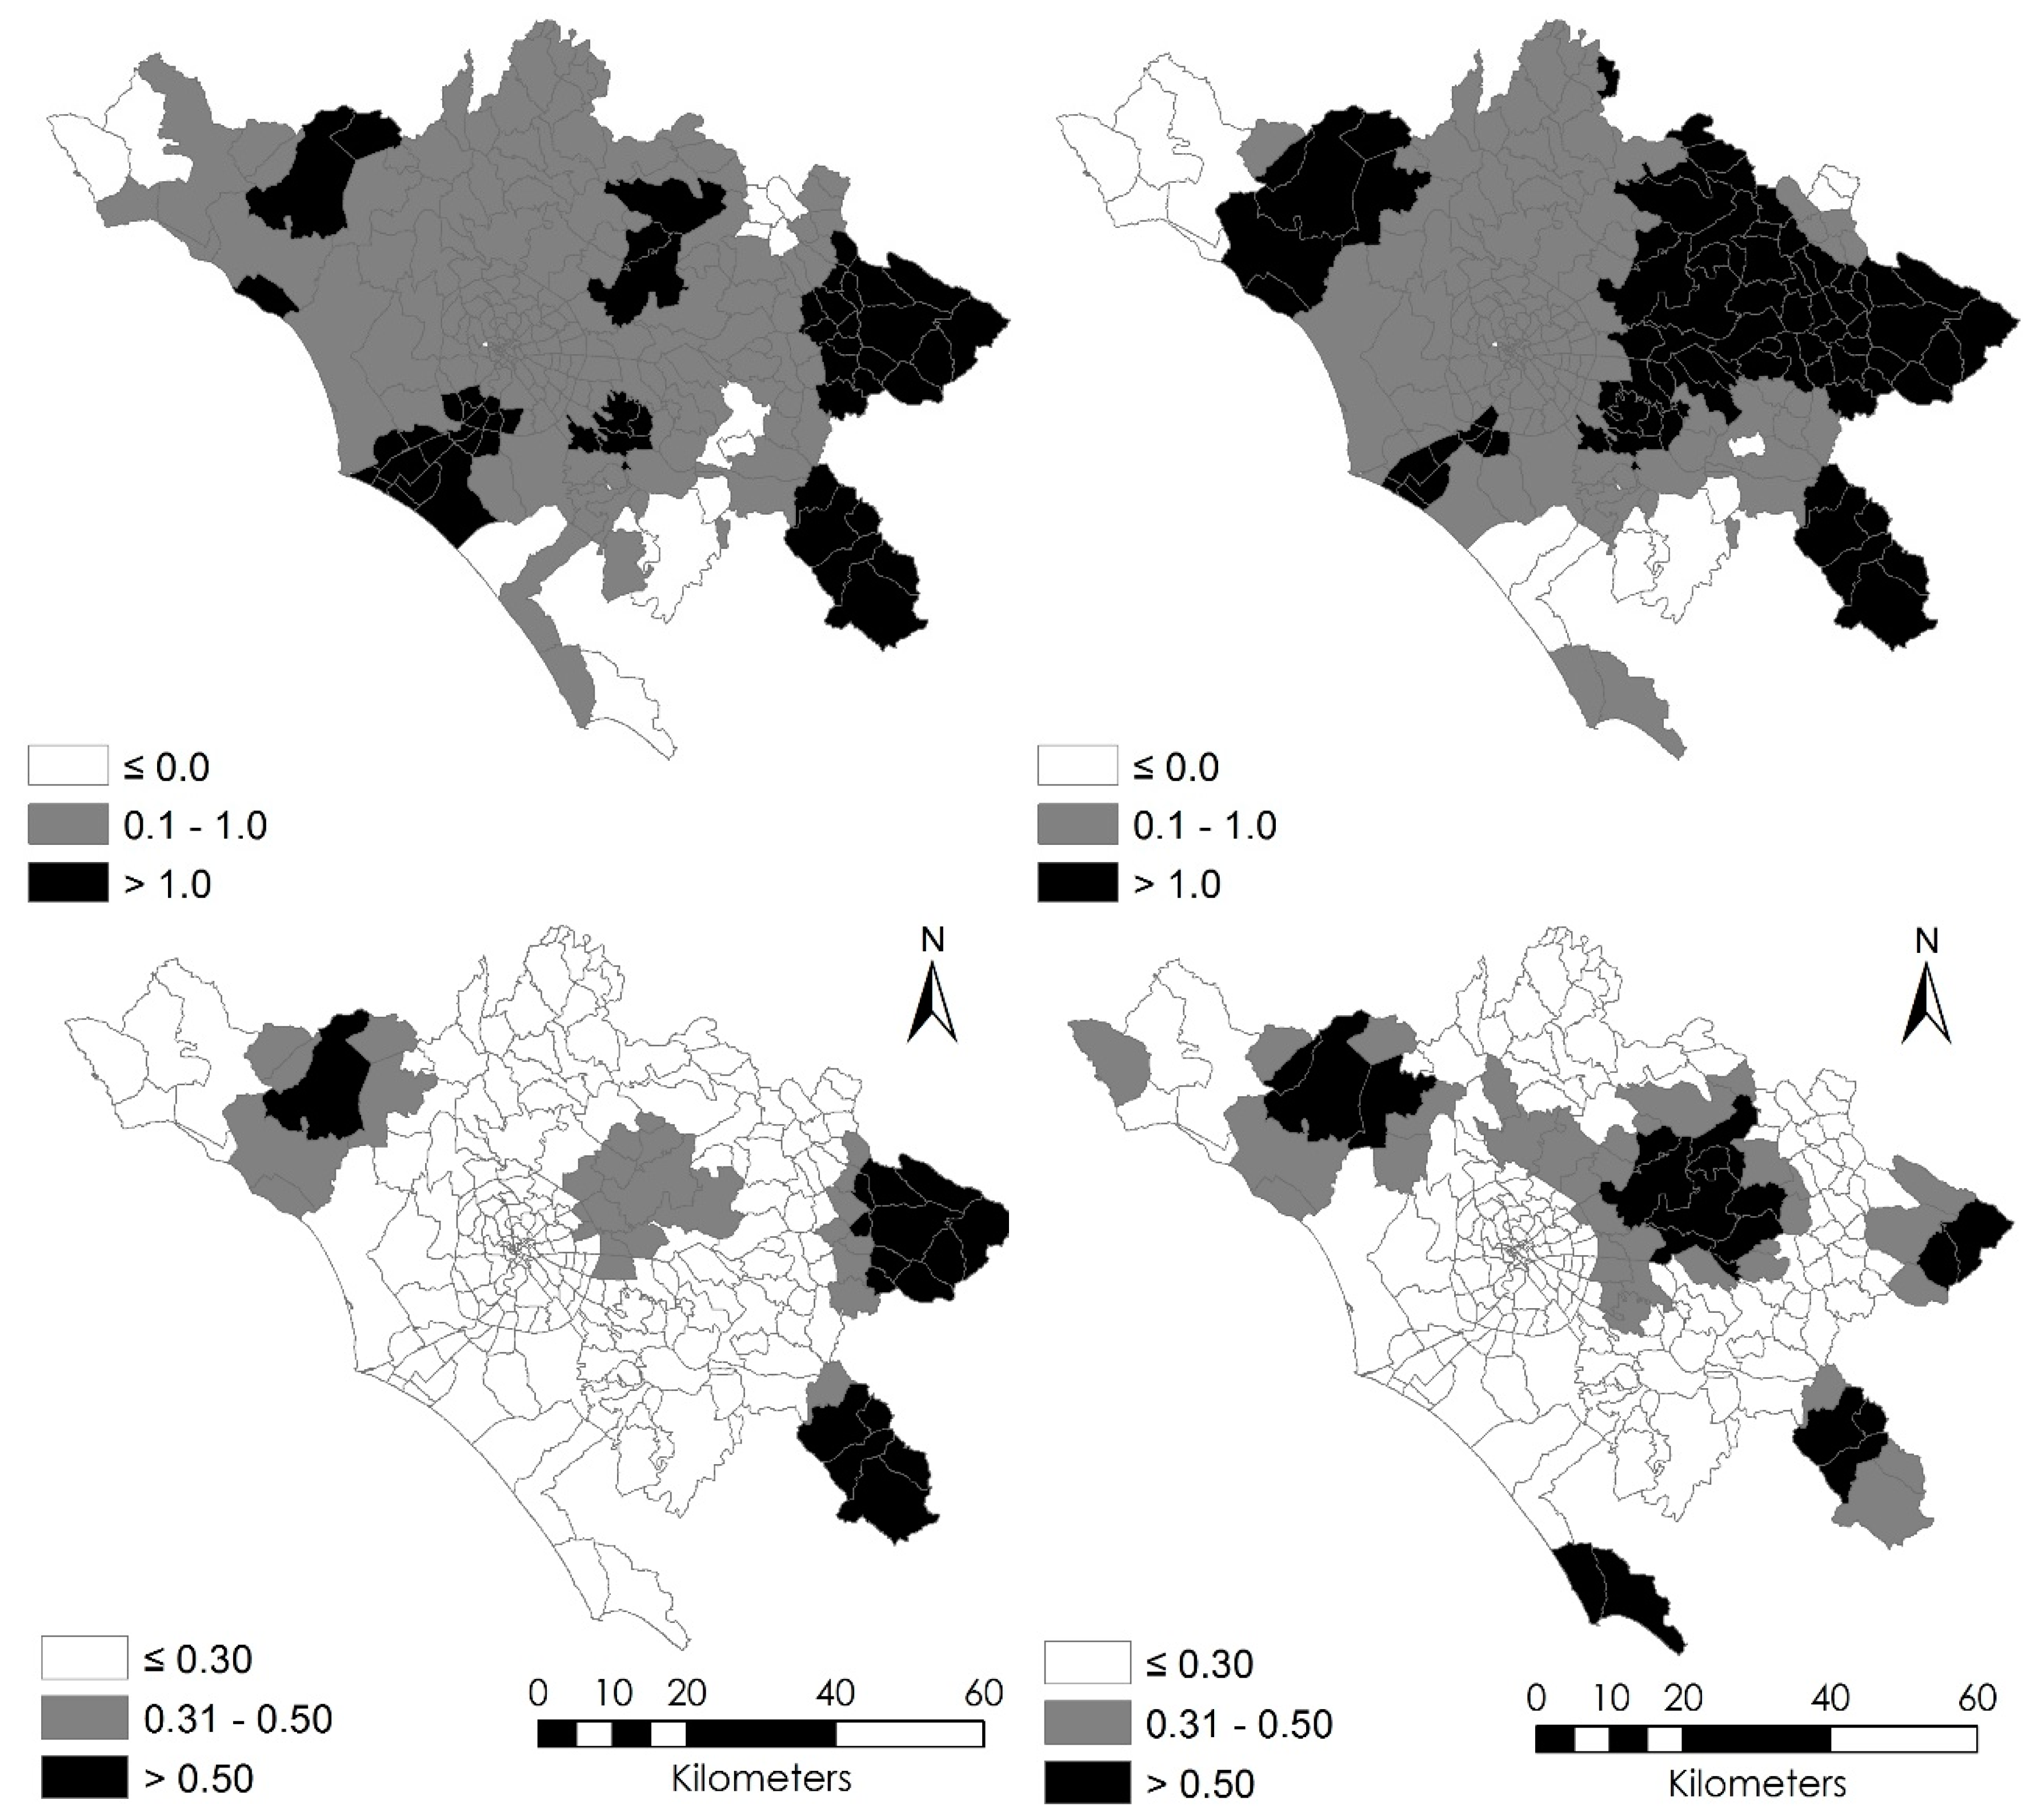
3.2. Local Approaches
4. Discussion
5. Conclusions
Author Contributions
Funding
Data Availability Statement
Conflicts of Interest
References
- Mather, A.S. Forest transition theory and the reforesting of scotland. Scott. Geogr. J. 2004, 120, 83–98. [Google Scholar] [CrossRef]
- Perz, S.G. Grand theory and context-specificity in the study of forest dynamics: Forest transition theory and other directions. Prof. Geogr. 2007, 59, 105–114. [Google Scholar] [CrossRef]
- Barbier, E.B.; Burgess, J.C.; Grainger, A. The forest transition: Towards a more comprehensive theoretical framework. Land Use Policy 2010, 27, 98–107. [Google Scholar] [CrossRef]
- Meyfroidt, P.; Lambin, E.F. Global Forest Transition: Prospects for an End to Deforestation. Annu. Rev. Environ. Resour. 2011, 36, 343–371. [Google Scholar] [CrossRef]
- Barbati, A.; Corona, P.; Salvati, L.; Gasparella, L. Natural forest expansion into suburban countryside: Gained ground for a green infrastructure? Urban For. Urban Green. 2013, 12, 36–43. [Google Scholar] [CrossRef] [Green Version]
- Pagnutti, C.; Bauch, C.T.; Anand, M. Outlook on a Worldwide Forest Transition. PLoS ONE 2013, 8, e75890. [Google Scholar] [CrossRef]
- Baines, O.; Wilkes, P.; Disney, M. Quantifying urban forest structure with open-access remote sensing data sets. Urban For. Urban Green. 2020, 50, 126653. [Google Scholar] [CrossRef]
- Bonilla-Bedoya, S.; Mora, A.; Vaca, A.; Estrella, A.; Herrera, M.Á. Modelling the relationship between urban expansion processes and urban forest characteristics: An application to the Metropolitan District of Quito. Comput. Environ. Urban Syst. 2020, 79, 101420. [Google Scholar] [CrossRef]
- Alvarez, S.; Soto, J.R.; Escobedo, F.J.; Lai, J.; Kibria, A.S.M.G.; Adams, D.C. Heterogeneous preferences and economic values for urban forest structural and functional attributes. Landsc. Urban Plan. 2021, 215, 104234. [Google Scholar] [CrossRef]
- Rudel, T.K.; Coomes, O.T.; Moran, E.; Achard, F.; Angelsen, A.; Xu, J.; Lambin, E. Forest transitions: Towards a global understanding of land use change. Glob. Environ. Chang. 2005, 15, 23–31. [Google Scholar] [CrossRef]
- Fagan, C.B.; Yackulic, M.; Jain, M.; Jina, A.; Lim, Y.; Marlier, M.; Muscarella, R.; Adame, P.; DeFries, R.; Uriarte, M. Biophysical and Socioeconomic Factors Associated with Forest Transitions at Multiple Spatial and Temporal Scale. Ecol. Soc. 2011, 16, 15. [Google Scholar] [CrossRef] [Green Version]
- Mather, A.S.; Needle, C.L. The forest transition: A theoretical basis. Area 1998, 30, 117–124. [Google Scholar] [CrossRef]
- Grainger, A. The Forest Transition: An Alternative Approach. Area 1995, 27, 242–251. [Google Scholar]
- Mather, A.S.; Fairbairn, J. From floods to reforestation: The forest transition in Switzerland. Environ. Hist. Camb. 2000, 6, 399–421. [Google Scholar] [CrossRef] [Green Version]
- van Vliet, J. Direct and indirect loss of natural area from urban expansion. Nat. Sustain. 2019, 2, 755–763. [Google Scholar] [CrossRef]
- Salvati, L.; Ciommi, M.T.; Serra, P.; Chelli, F.M. Exploring the spatial structure of housing prices under economic expansion and stagnation: The role of socio-demographic factors in metropolitan Rome, Italy. Land Use Policy 2019, 81, 143–152. [Google Scholar] [CrossRef]
- Plieninger, T.; Schaich, H.; Kizos, T. Land-use legacies in the forest structure of silvopastoral oak woodlands in the Eastern Mediterranean. Reg. Environ. Chang. 2011, 11, 603–615. [Google Scholar] [CrossRef] [Green Version]
- Nowak, D.J.; Walton, J.T.; Dwyer, J.F.; Kaya, L.G.; Myeong, S.; Myeong, S. The Increasing Influence of Urban Environments on US Forest Management. J. For. 2005, 103, 377–382. [Google Scholar]
- Kauppi, P.E.; Ausubel, J.H.; Fang, J.; Mather, A.S.; Sedjo, R.A.; Waggoner, P.E. Returning forests analyzed with the forest identity. Proc. Natl. Acad. Sci. USA 2006, 103, 17574–17579. [Google Scholar] [CrossRef] [Green Version]
- Redo, D.J.; Grau, H.R.; Aide, T.M.; Clark, M.L. Asymmetric forest transition driven by the interaction of socioeconomic development and environmental heterogeneity in Central America. Proc. Natl. Acad. Sci. USA 2012, 109, 8839–8844. [Google Scholar] [CrossRef] [Green Version]
- Rodríguez, L.G.; Pérez, M.R. Recent changes in Chinese forestry seen through the lens of Forest Transition theory. Int. For. Rev. 2013, 15, 456–470. [Google Scholar] [CrossRef] [Green Version]
- Baptista, S.R.; Rudel, T.K. A re-emerging Atlantic forest? Urbanization, industrialization and the forest transition in Santa Catarina, southern Brazil. Environ. Conserv. 2006, 33, 195–202. [Google Scholar] [CrossRef]
- Blondel, J.; Aronson, J.; Bodiou, J.-Y.; Boeuf, G. The Meditrerranean Region—Biological Diversity in Space and Time, 2nd ed.; Oxford University Press: Oxford, UK, 2010; ISBN 9780199557998. [Google Scholar]
- Sirami, C.; Nespoulous, A.; Cheylan, J.P.; Marty, P.; Hvenegaard, G.T.; Geniez, P.; Schatz, B.; Martin, J.L. Long-term anthropogenic and ecological dynamics of a Mediterranean landscape: Impacts on multiple taxa. Landsc. Urban Plan. 2010, 96, 214–223. [Google Scholar] [CrossRef]
- Vince, S.W.; Duryea, M.; Macie, E.A.; Hermansen, L.A. Forests at the Wildland-Urban Interface: Conservation and Management; CRC Press: Boca Raton, FL, USA, 2005; ISBN 9780367578213. [Google Scholar]
- Stewart, S.I.; Radeloff, V.C.; Hammer, R.B.; Hawbaker, T.J. Defining the Wildland-Urban Interface. J. For. 2007, 105, 201–207. [Google Scholar]
- Endreny, T.A. Strategically growing the urban forest will improve our world. Nat. Commun. 2018, 9, 1160. [Google Scholar] [CrossRef] [PubMed] [Green Version]
- Antrop, M. Changing patterns in the urbanized countryside of Western Europe. Landsc. Ecol. 2000, 15, 257–270. [Google Scholar] [CrossRef]
- Antrop, M. Landscape change and the urbanization process in Europe. Landsc. Urban Plan. 2004, 67, 9–26. [Google Scholar] [CrossRef]
- Scarascia-Mugnozza, G.; Oswald, H.; Piussi, P.; Radoglou, K. Forests of the Mediterranean region: Gaps in knowledge and research needs. For. Ecol. Manag. 2000, 132, 97–109. [Google Scholar] [CrossRef]
- Tomao, A.; Quatrini, V.; Corona, P.; Ferrara, A.; Lafortezza, R.; Salvati, L. Resilient landscapes in Mediterranean urban areas: Understanding factors influencing forest trends. Environ. Res. 2017, 156, 1–9. [Google Scholar] [CrossRef] [Green Version]
- Bianchini, L.; Marucci, A.; Sateriano, A.; Di Stefano, V.; Alemanno, R.; Colantoni, A. Urbanization and long-term forest dynamics in a metropolitan region of southern europe (1936–2018). Sustainability 2021, 13, 12164. [Google Scholar] [CrossRef]
- Salvati, L.; Carlucci, M. Distance matters: Land consumption and the mono-centric model in two southern European cities. Landsc. Urban Plan. 2014, 127, 41–51. [Google Scholar] [CrossRef]
- Salvati, L.; Zitti, M. Territorial disparities, natural resource distribution, and land degradation: A case study in southern Europe. GeoJournal 2007, 70, 185–194. [Google Scholar] [CrossRef]
- Colantoni, A.; Mavrakis, A.; Sorgi, T.; Salvati, L. Towards a ‘polycentric’ landscape? Reconnecting fragments into an integrated network of coastal forests in Rome. Rend. Lincei 2015, 3, 615–624. [Google Scholar] [CrossRef]
- Çakir, G.; Ün, C.; Baskent, E.Z.; Köse, S.; Sivrikaya, F.; Keleş, S. Evaluating urbanization, fragmentation and land use/land cover change pattern in Istanbul city, Turkey from 1971 to 2002. Land Degrad. Dev. 2008, 19, 663–675. [Google Scholar] [CrossRef]
- Pili, S.; Grigoriadis, E.; Carlucci, M.; Clemente, M.; Salvati, L. Towards sustainable growth? A multi-criteria assessment of (changing) urban forms. Ecol. Indic. 2017, 76, 71–80. [Google Scholar] [CrossRef]
- Duvernoy, I.; Zambon, I.; Sateriano, A.; Salvati, L. Pictures from the other side of the fringe: Urban growth and peri-urban agriculture in a post-industrial city (Toulouse, France). J. Rural Stud. 2018, 57, 25–35. [Google Scholar] [CrossRef]
- Perrin, C.; Nougarèdes, B.; Sini, L.; Branduini, P.; Salvati, L.; Perrin, C.; Nougarèdes, B.; Sini, L.; Branduini, P.; Salvati, L. Governance changes in peri-urban farmland protection following decentralisation: A comparison between Montpellier (France) and Rome (Italy). Land Use Policy 2018, 70, 535–546. [Google Scholar] [CrossRef] [Green Version]
- Žlender, V. Characterisation of peri-urban landscape based on the views and attitudes of different actors. Land Use Policy 2021, 101, 105181. [Google Scholar] [CrossRef]
- Di Feliciantonio, C.; Salvati, L.; Sarantakou, E.; Rontos, K. Class diversification, economic growth and urban sprawl: Evidences from a pre-crisis European city. Qual. Quant. Int. J. Methodol. 2018, 52, 1501–1522. [Google Scholar] [CrossRef]
- Ciommi, M.; Chelli, F.M.; Carlucci, M.; Salvati, L. Urban Growth and Demographic Dynamics in Southern Europe: Toward a New Statistical Approach to Regional Science. Sustainability 2018, 10, 2765. [Google Scholar] [CrossRef] [Green Version]
- Theobald, D.M.; Romme, W.H. Expansion of the US wildland-urban interface. Landsc. Urban Plan. 2007, 83, 340–354. [Google Scholar] [CrossRef]
- Bianchini, L.; Egidi, G.; Alhuseen, A.; Sateriano, A.; Cividino, S.; Clemente, M.; Imbrenda, V. Toward a dualistic growth? Population increase and land-use change in Rome, Italy. Land 2021, 10, 749. [Google Scholar] [CrossRef]
- Ferrari, B.; Corona, P.; Mancini, L.D.; Salvati, R.; Barbati, A. Taking the pulse of forest plantations success in peri-urban environments through continuous inventory. New For. 2017, 48, 527–545. [Google Scholar] [CrossRef]
- Camarretta, N.; Puletti, N.; Chiavetta, U.; Corona, P. Quantitative changes of forest landscapes over the last century across Italy. Plant Biosyst. 2017, 152, 1011–1019. [Google Scholar] [CrossRef]
- Grotti, M.; Mattioli, W.; Ferrari, B.; Tomao, A.; Merlini, P.; Corona, P. A multi-temporal dataset of forest mensuration of reforestations: A case study in peri-urban Rome, Italy. Ann. Silvic. Res. 2019, 43, 97–101. [Google Scholar] [CrossRef]
- Pili, S.; Serra, P.; Salvati, L. Landscape and the city: Agro-forest systems, land fragmentation and the ecological network in Rome, Italy. Urban For. Urban Green. 2019, 41, 230–237. [Google Scholar] [CrossRef]
- Biasi, R.; Brunori, E.; Smiraglia, D.; Salvati, L. Linking traditional tree-crop landscapes and agro-biodiversity in central Italy using a database of typical and traditional products: A multiple risk assessment through a data mining analysis. Biodivers. Conserv. 2015, 24, 3009–3031. [Google Scholar] [CrossRef]
- Falcucci, A.; Maiorano, L.; Boitani, L. Changes in land-use/land-cover patterns in Italy and their implications for biodiversity conservation. Landsc. Ecol. 2007, 22, 617–631. [Google Scholar] [CrossRef]
- Cecchini, M.; Zambon, I.; Pontrandolfi, A.; Turco, R.; Colantoni, A.; Mavrakis, A.; Salvati, L. Urban sprawl and the ‘olive’ landscape: Sustainable land management for ‘crisis’ cities. GeoJournal 2019, 84, 237–255. [Google Scholar] [CrossRef]
- Zipperer, W.C. Species composition and structure of regenerated and remnant forest patches within an urban landscape. Urban Ecosyst. 2002, 6, 271–290. [Google Scholar] [CrossRef]
- Foley, J.A.; DeFries, R.; Asner, G.P.; Barford, C.; Bonan, G.; Carpenter, S.R.; Chapin, F.S.; Coe, M.T.; Daily, G.C.; Gibbs, H.K.; et al. Global consequences of land use. Science 2005, 309, 570–574. [Google Scholar] [CrossRef] [PubMed] [Green Version]
- Bajocco, S.; Dragoz, E.; Gitas, I.; Smiraglia, D.; Salvati, L.; Ricotta, C. Mapping Forest Fuels through Vegetation Phenology: The Role of Coarse-Resolution Satellite Time-Series. PLoS ONE 2015, 10, e0119811. [Google Scholar] [CrossRef] [Green Version]
- Attorre, F.; Bruno, M.; Francesconi, F.; Valenti, R.; Bruno, F. Landscape changes of Rome through tree-lined roads. Landsc. Urban Plan. 2000, 49, 115–128. [Google Scholar] [CrossRef]
- Cavallo, A.; Marino, D. Understanding Changing in Traditional Agricultural Landscapes: Towards a Framework. J. Agric. Sci. Technol. 2012, 2, 971–978. [Google Scholar]


| Model/Specification | 1936 | 2018 |
|---|---|---|
| Pearson moment–product correlation | 0.616 | 0.750 |
| Non-parametric Spearman rs rank correlation | 0.755 | 0.852 |
| Un-weighted, linear Ordinary Least Square (OLS) | 0.380 | 0.563 |
| Weighted, linear OLS † | 0.382 | 0.555 |
| Square (second-order polynomial) OLS | 0.402 | 0.573 |
| Cubic (third-order polynomial) OLS | 0.439 | 0.582 |
| Un-weighted Geographically Weighted Regression (GWR) | 0.643 | 0.769 |
| Weighted GWR† | 0.703 | 0.754 |
Publisher’s Note: MDPI stays neutral with regard to jurisdictional claims in published maps and institutional affiliations. |
© 2021 by the authors. Licensee MDPI, Basel, Switzerland. This article is an open access article distributed under the terms and conditions of the Creative Commons Attribution (CC BY) license (https://creativecommons.org/licenses/by/4.0/).
Share and Cite
Bianchini, L.; Salvia, R.; Quaranta, G.; Egidi, G.; Salvati, L.; Marucci, A. Forest Transition and Metropolitan Transformations in Developed Countries: Interpreting Apparent and Latent Dynamics with Local Regression Models. Land 2022, 11, 12. https://doi.org/10.3390/land11010012
Bianchini L, Salvia R, Quaranta G, Egidi G, Salvati L, Marucci A. Forest Transition and Metropolitan Transformations in Developed Countries: Interpreting Apparent and Latent Dynamics with Local Regression Models. Land. 2022; 11(1):12. https://doi.org/10.3390/land11010012
Chicago/Turabian StyleBianchini, Leonardo, Rosanna Salvia, Giovanni Quaranta, Gianluca Egidi, Luca Salvati, and Alvaro Marucci. 2022. "Forest Transition and Metropolitan Transformations in Developed Countries: Interpreting Apparent and Latent Dynamics with Local Regression Models" Land 11, no. 1: 12. https://doi.org/10.3390/land11010012