Article

Impact of Land Use Change Due to Urbanisation on Surface Runoff Using GIS-Based SCS–CN Method: A Case Study of Xiamen City, China

1
Key Laboratory of Urban Environment and Health, Institute of Urban Environment, Chinese Academy of Sciences, Xiamen 361021, China
2
University of Chinese Academy of Sciences, Beijing 100049, China
3
Xiamen Key Lab of Urban Metabolism, Institute of Urban Environment, Chinese Academy of Sciences, Xiamen 361021, China
4
Research Center for Integrated Disaster Risk Reduction and Emergency Management, Institute for Disaster Management and Reconstruction, Sichuan University, Chengdu 610065, China
5
Institute of Forestry, Tribhuwan University, Hetauda 44107, Nepal
*
Author to whom correspondence should be addressed.
Land 2021, 10(8), 839; https://doi.org/10.3390/land10080839
Submission received: 14 July 2021 / Revised: 5 August 2021 / Accepted: 9 August 2021 / Published: 11 August 2021

Abstract

:
Rapid urban development results in visible changes in land use due to increase in impervious surfaces from human construction and decrease in pervious areas. Urbanisation influences the hydrological cycle of an area, resulting in less infiltration, higher flood peak, and surface runoff. This study analysed the impact of land use change due to urbanisation on surface runoff, using the geographic information system (GIS)-based soil conservation service curve number (SCS–CN) method, during the period of rapid urban development from 1980 to 2015 in Xiamen, located in south-eastern China. Land use change was analysed from the data obtained by classifying Landsat images from 1980, 1990, 2005, and 2015. Results indicated that farmland decreased the most by 14.01%, while built-up areas increased the most by 15.7%, from 1980 to 2015. Surface runoff was simulated using the GIS-based SCS–CN method for the rainfall return periods of 5, 10, 20, and 50 years. The spatial and temporal variation of runoff was obtained for each land use period. Results indicate that the increase in surface runoff was highest in the period of 1990–2005, with an increase of 10.63%. The effect of urbanisation can be realised from the amount of runoff, contributed by built-up land use type in the study area, that increased from 14.2% to 27.9% with the rise of urban expansion from 1980 to 2015. The relationship between land use and surface runoff showed that the rapid increase in constructed land has significantly influenced the surface runoff of the area. Therefore, the introduction of nature-based solutions such as green infrastructure could be a potential solution for runoff mitigation and reducing urban flood risks in the context of increasing urbanization.

1. Introduction

Urbanisation is a growing concern in the present world. With over 55% of the world’s population living in urban areas [1], urban expansion has dramatically influenced the change in urban land use. Land use change due to urbanisation results in more impervious surfaces that have considerable impacts on urban hydrology [2]. Urban expansion leads to large impervious surfaces that reduces rainwater infiltration, generating high surface runoff and peak flow, thus increasing the risks of urban flooding and waterlogging [3]. Urban development is one of the major causes of urban pluvial flooding, aggravated by poor urban drainage systems that become more severe with increasing frequency and magnitude of extreme precipitations as a consequence of climate change, affecting the urban population, infrastructure, and economy [4,5,6].
The effect of land use change on surface runoff depends on many factors such as spatial characteristics of land use, rainfall, and soil [7]. The effect is most prominent in areas undergoing rapid urbanisation where natural vegetation has been removed and replaced by constructed land [8]. Removal of trees and vegetation and construction of commercial and residential buildings, streets, and parking lots alters the water balance of an area by changing the balance between rainfall, infiltration, evapotranspiration, and runoff [9,10]. Constructed areas such as concrete buildings, roofs, paved roads, and sidewalks lead to an increase in impervious surfaces, which reduces the time of concentration for runoff, leading to higher storm runoff and peak discharges [11,12]. As a result, flooding and waterlogging are common issues in highly urbanised areas [13].
The effect on hydrological processes, particularly surface runoff characteristics, of land use change due to urbanisation has been studied by many researchers [14,15,16]. Specifically, Hu, Fan, and Zhang [2] investigated the impact of land use change on the distribution of surface runoff in the highly urbanised city of Beijing. Results indicated that the change in surface runoff is strongly associated with change in impervious areas. Chen et al. [17] showed that non-uniform urban expansion and intensification are the major driving forces for changing surface runoff. The studies mentioned above indicate that changes in urban land use with more impervious surfaces reduce the ability to intercept rainfall and exacerbate surface runoff process.
The SCS–CN method, developed by the Natural Resources Conservation Service (NRCS), U.S. Department of Agriculture (USDA), is one of the most widely used methods in many hydrological studies, particularly for estimating surface runoff, accounting several factors such as soil, land use treatment, and topographical features, and incorporating these factors into a single CN parameter [18,19,20,21]. However, the conventional method is more time consuming and error prone. Remote sensing (RS) and a geographic information system (GIS) can be used effectively to manage spatial and non-spatial databases that represent the hydrologic characteristics of the watershed [22]. Therefore, the application of GIS and remote sensing with hydrological models yield results with high reliability and accuracy over conventional methods [23]. Many hydrological studies are being conducted with the integration of GIS and RS techniques for simulating surface runoff. For instance, Shadeed and Almasri [24] demonstrated that the integration of GIS with SCS–CN for simulating runoff volume proved to be an effective tool in arid to semi-arid catchments [24]. Similarly, Liu and Li [25] used a GIS-based SCS model for runoff generation in Loess plateau of China and found that the calculated and observed runoff processes were well correlated.
Recently, the GIS-based SCS–CN method has been used widely to study the impacts of land use change and urban growth on surface runoff [2,14,26]. For example, Jahan et al. [27] investigated the impacts of suburban growth on surface runoff using GIS-based SCS–CN, and concluded that the integrated approach is useful for land use change detection and analysis of impact of suburban growth on surface runoff. Furthermore, Vojtek and Vojtekova [14] applied the SCS–CN method in a GIS environment to study the impact of land use change on surface runoff. Results indicated that the method is suitable for spatial modelling of runoff characteristics of a basin where few data are available. Therefore, GIS and remote sensing in the SCS–CN model is a more efficient and cost-effective method that produces adequate results without using complex data in analysing the impact of land use change and urban growth [27,28,29,30]. In this study, the GIS and SCS–CN method is integrated to analyse the effect of land use change, and examine the spatial-temporal variation in surface runoff at an urban scale.
Firstly, the study assessed land use change in Xiamen city from 1980 to 2015 by analysing land use images in GIS environment. Then, surface runoff depth was estimated using SCS–CN method. We used GIS-based SCS–CN method to evaluate the effect of land use change on surface runoff. The main objective of this research is to identify the characteristics of land use change from 1980 to 2015 and analyse the impact of land use change due to urbanisation on the temporal and spatial distribution of surface runoff under the rainfall return periods of 5, 10, 20, and 50 years.

2. Materials and Methods
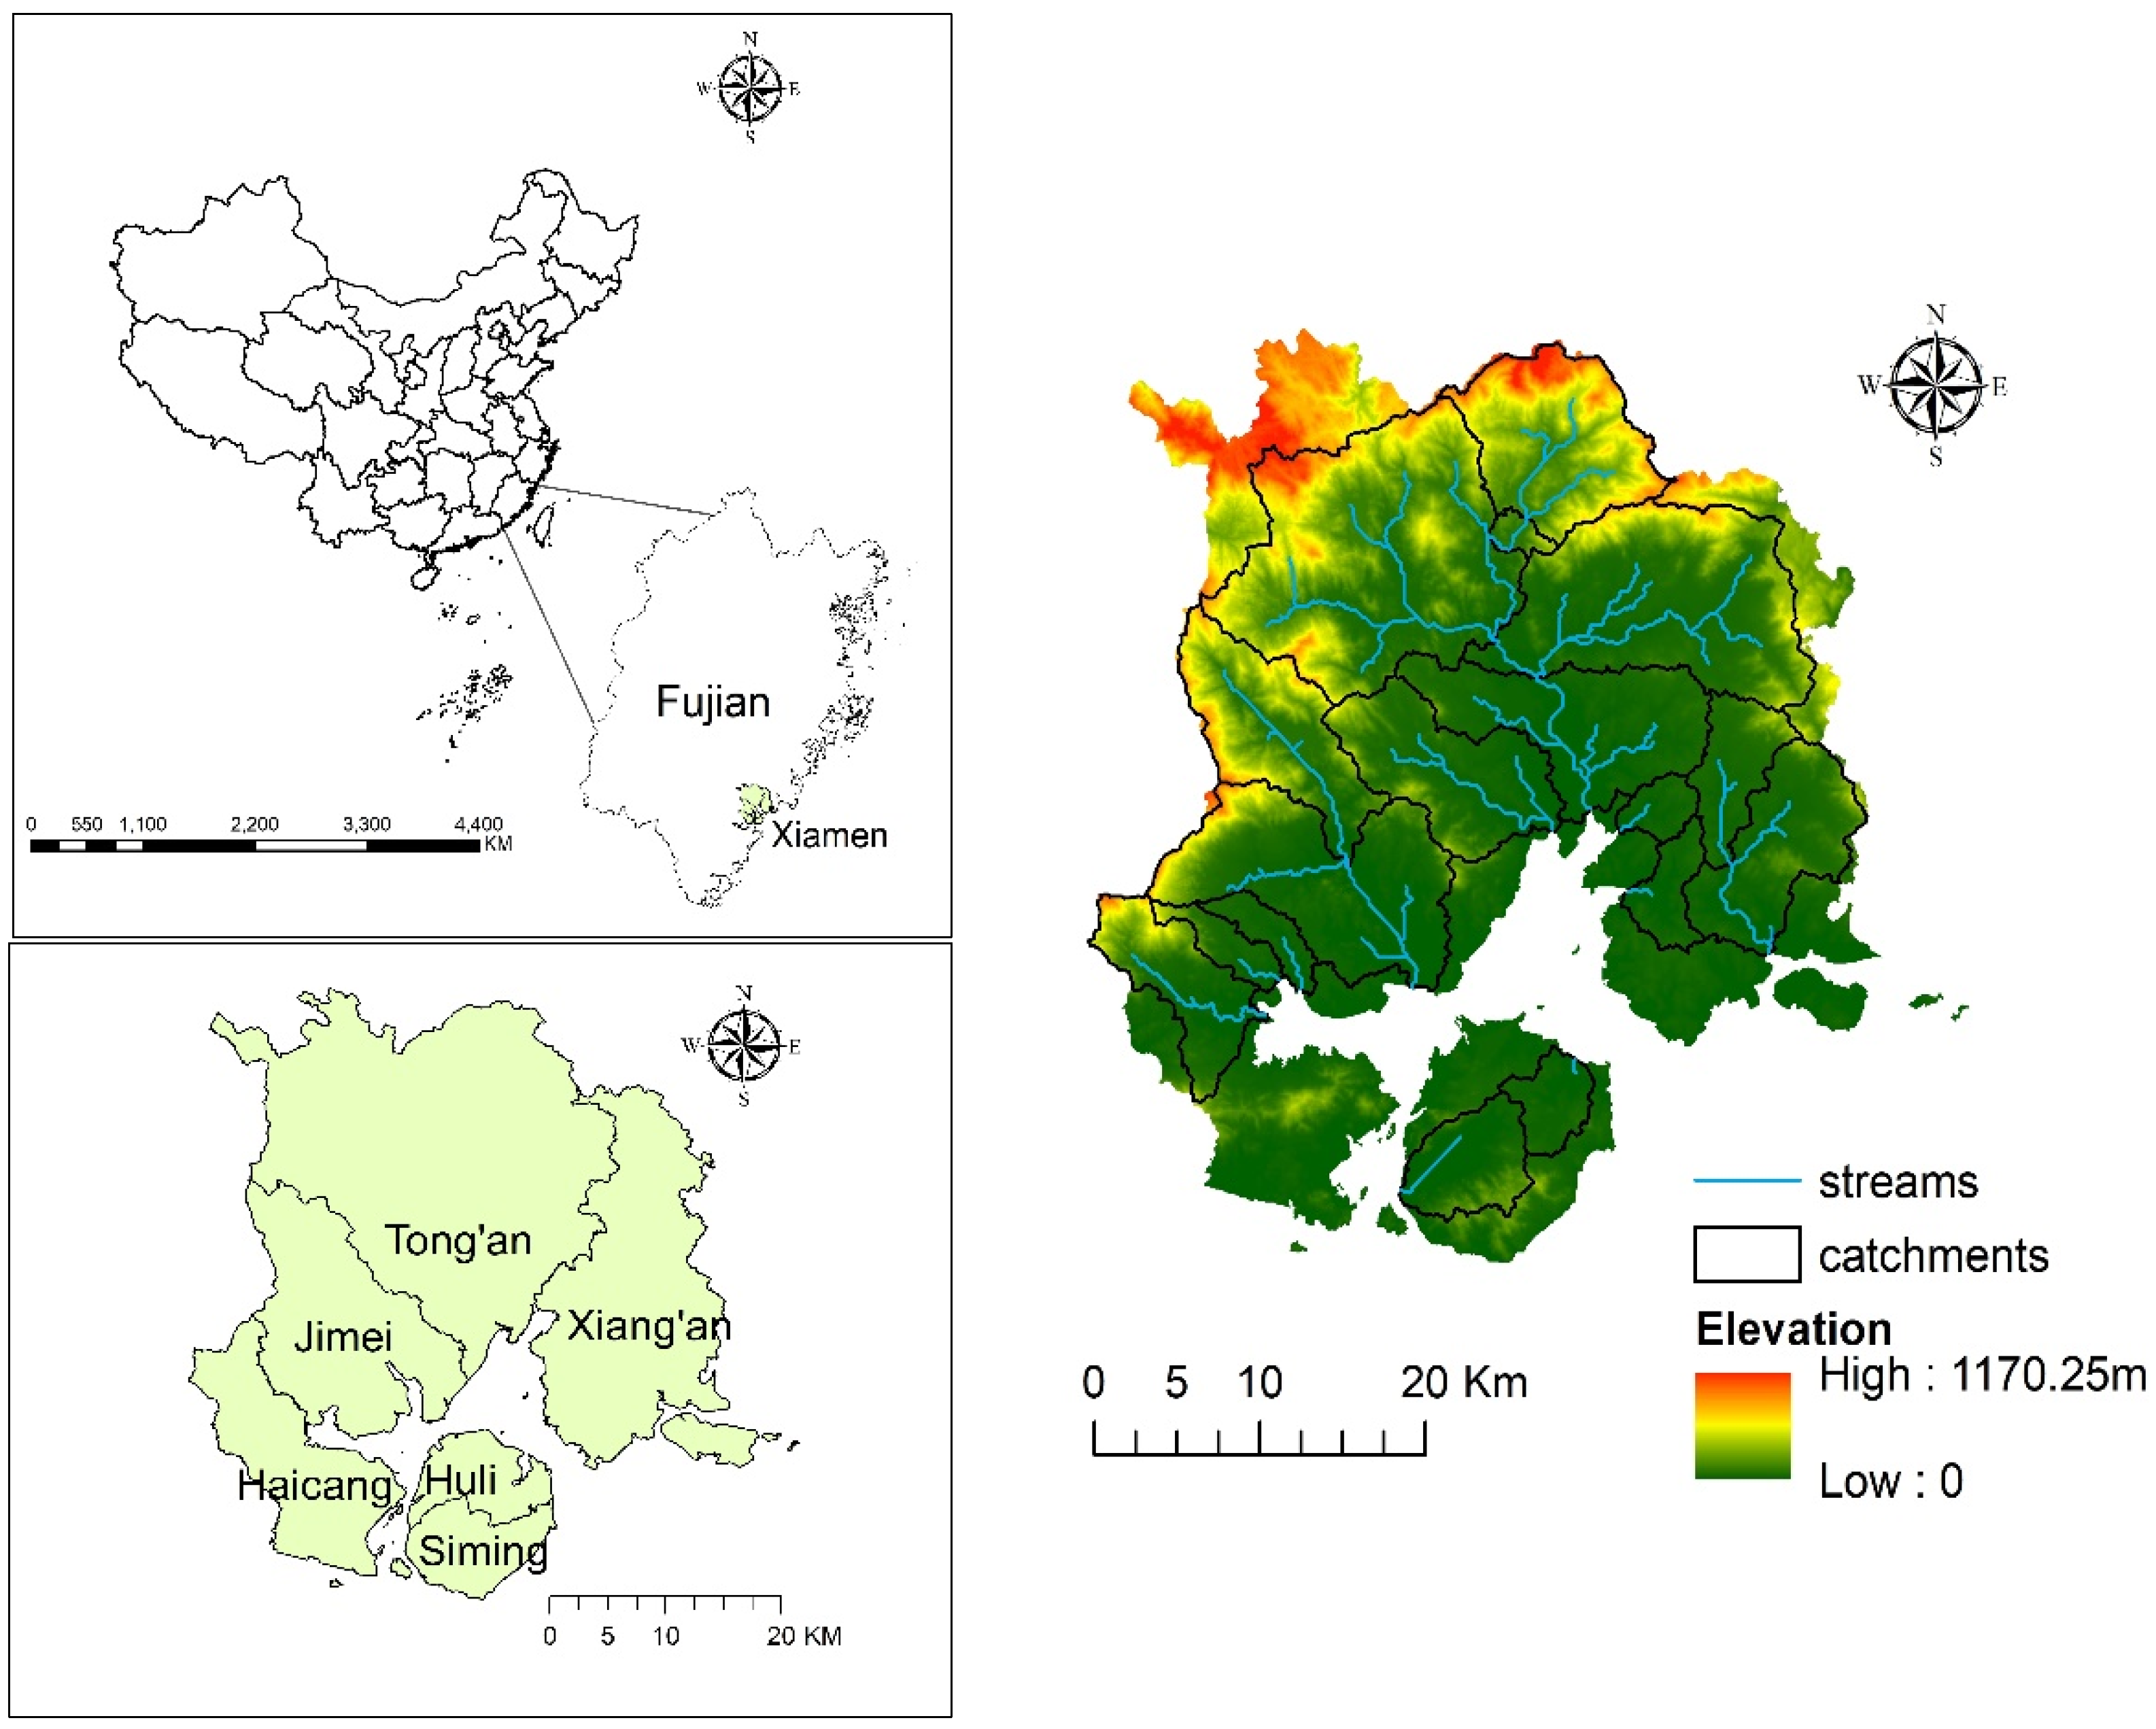
2.1. Study Area

Xiamen City is located on the west coast of the Taiwan Strait, composed of the mainland area along Xiamen Bay, Xiamen Island, Gulangyu, and other islands, including 6 administrative districts: Huli, Siming, Haicang, Jimei, Tong’an, and Xiang’an, as shown in Figure 1. The city has a total land area of 1699 km2 and a sea area of 324 km2. The study area is predominantly flat, low relief, with medium-low mountains, plains, and tidal flats. The slope of the terrain descends from northwest to southeast. The northwest part is mountainous, with the highest elevation of 1175 m above sea level, located on Yunding mountain [31]. Xiamen has a subtropical monsoon climate, with humid and mild climates throughout the year. According to the Xiamen Statistical Yearbook, annual average temperature and rainfall are approximately 21 °C and 1200 mm, respectively, with most rainfall in June, July, and August, accounting for more than half of the annual rainfall. Xiamen is one of the special economic zones in China and has experienced a rapid economic development and urbanisation [31]. According to Xiamen Municipal Bureau of Statistics [32], urban built-up area of the city has expanded from 38.5 km2 in 1985 to 348.23 km2 in 2017. The permanent population of the city was 4.29 million in 2019 [32]. As of 2019, the urbanisation rate of the population in Xiamen is 89.2% [33]. Xiamen has experienced several natural disasters, especially flooding and waterlogging induced by sea-level rise and storm surges, which is further intensified by rapid urban growth in past decades. Hence, there is an urgent need for mitigation of the potential hazards induced by urban development and climate change.
Figure 2 shows the overall methodology of the study conducted for analysing impact of land use change on surface runoff with the application of GIS and SCS–CN method. The GIS environment was used to build and intersect land use and HGS shapefiles. The land use and soil complex were used to obtain the weighted CN. The CN value of each polygon was estimated using the USDA table. Finally, raster calculator in the GIS was used to calculate runoff depth from CN values for the four rainfall return periods. The methodology was applied to four different years of 1980, 1990, 2005, and 2015, respectively.

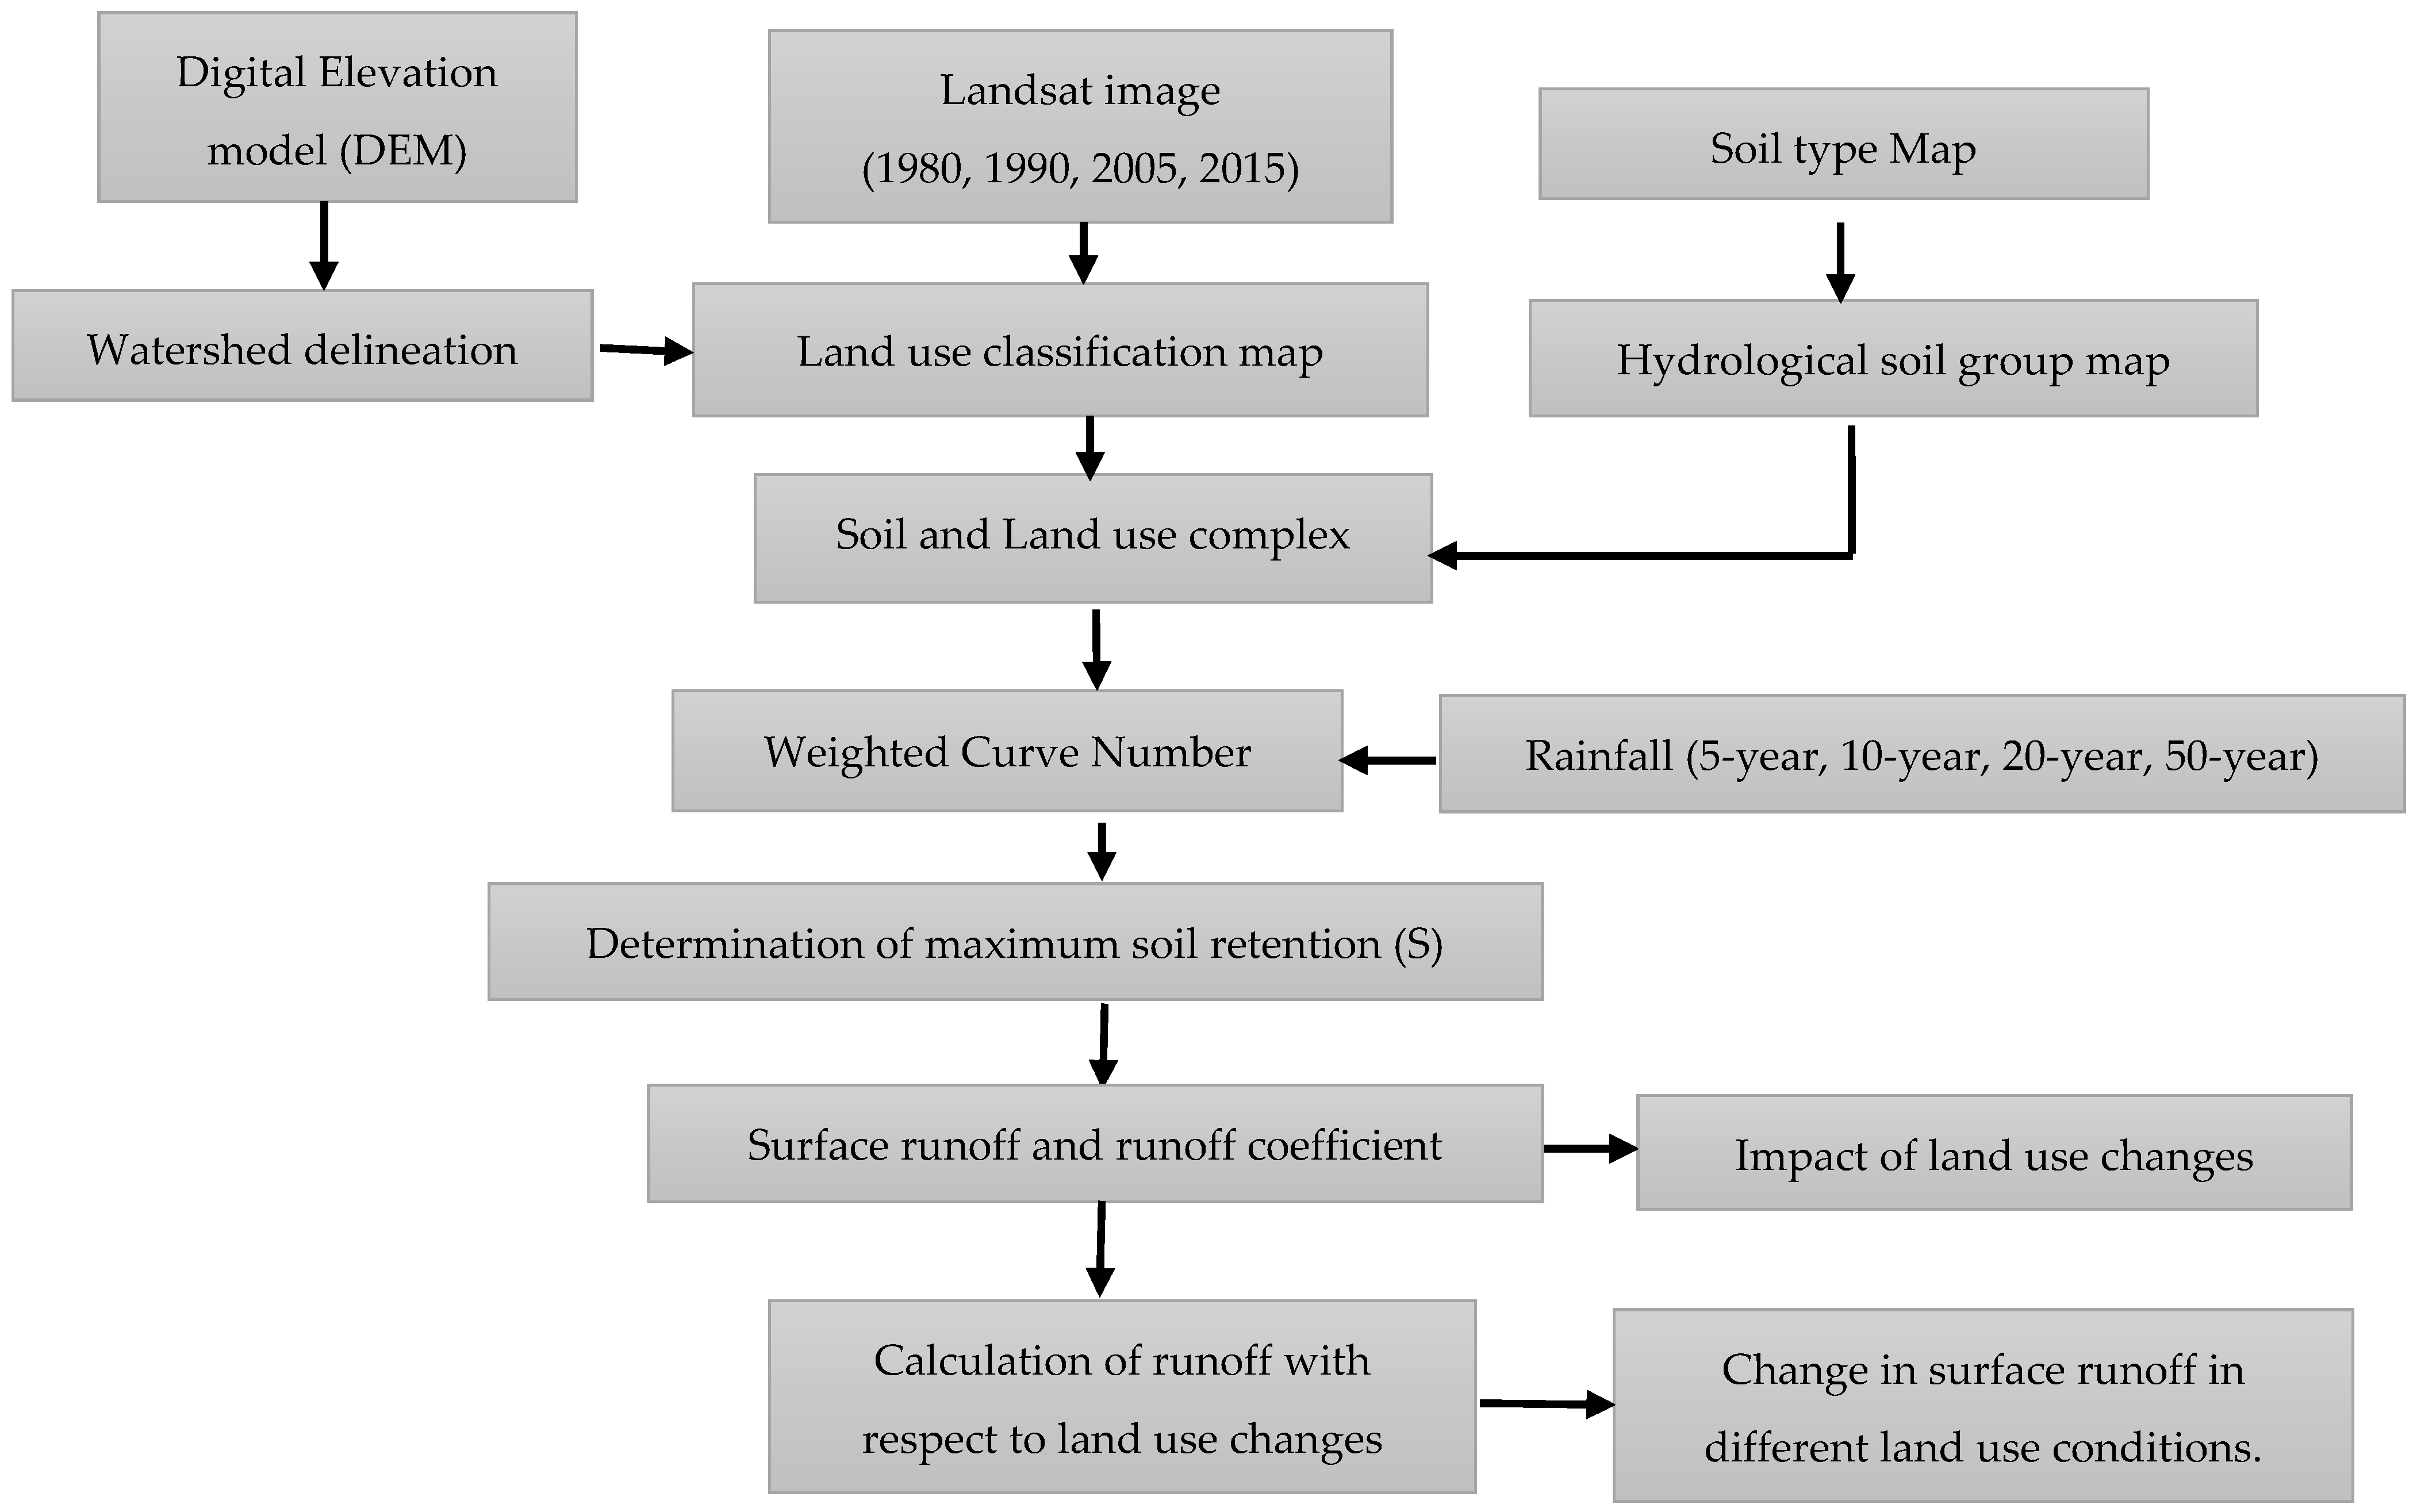
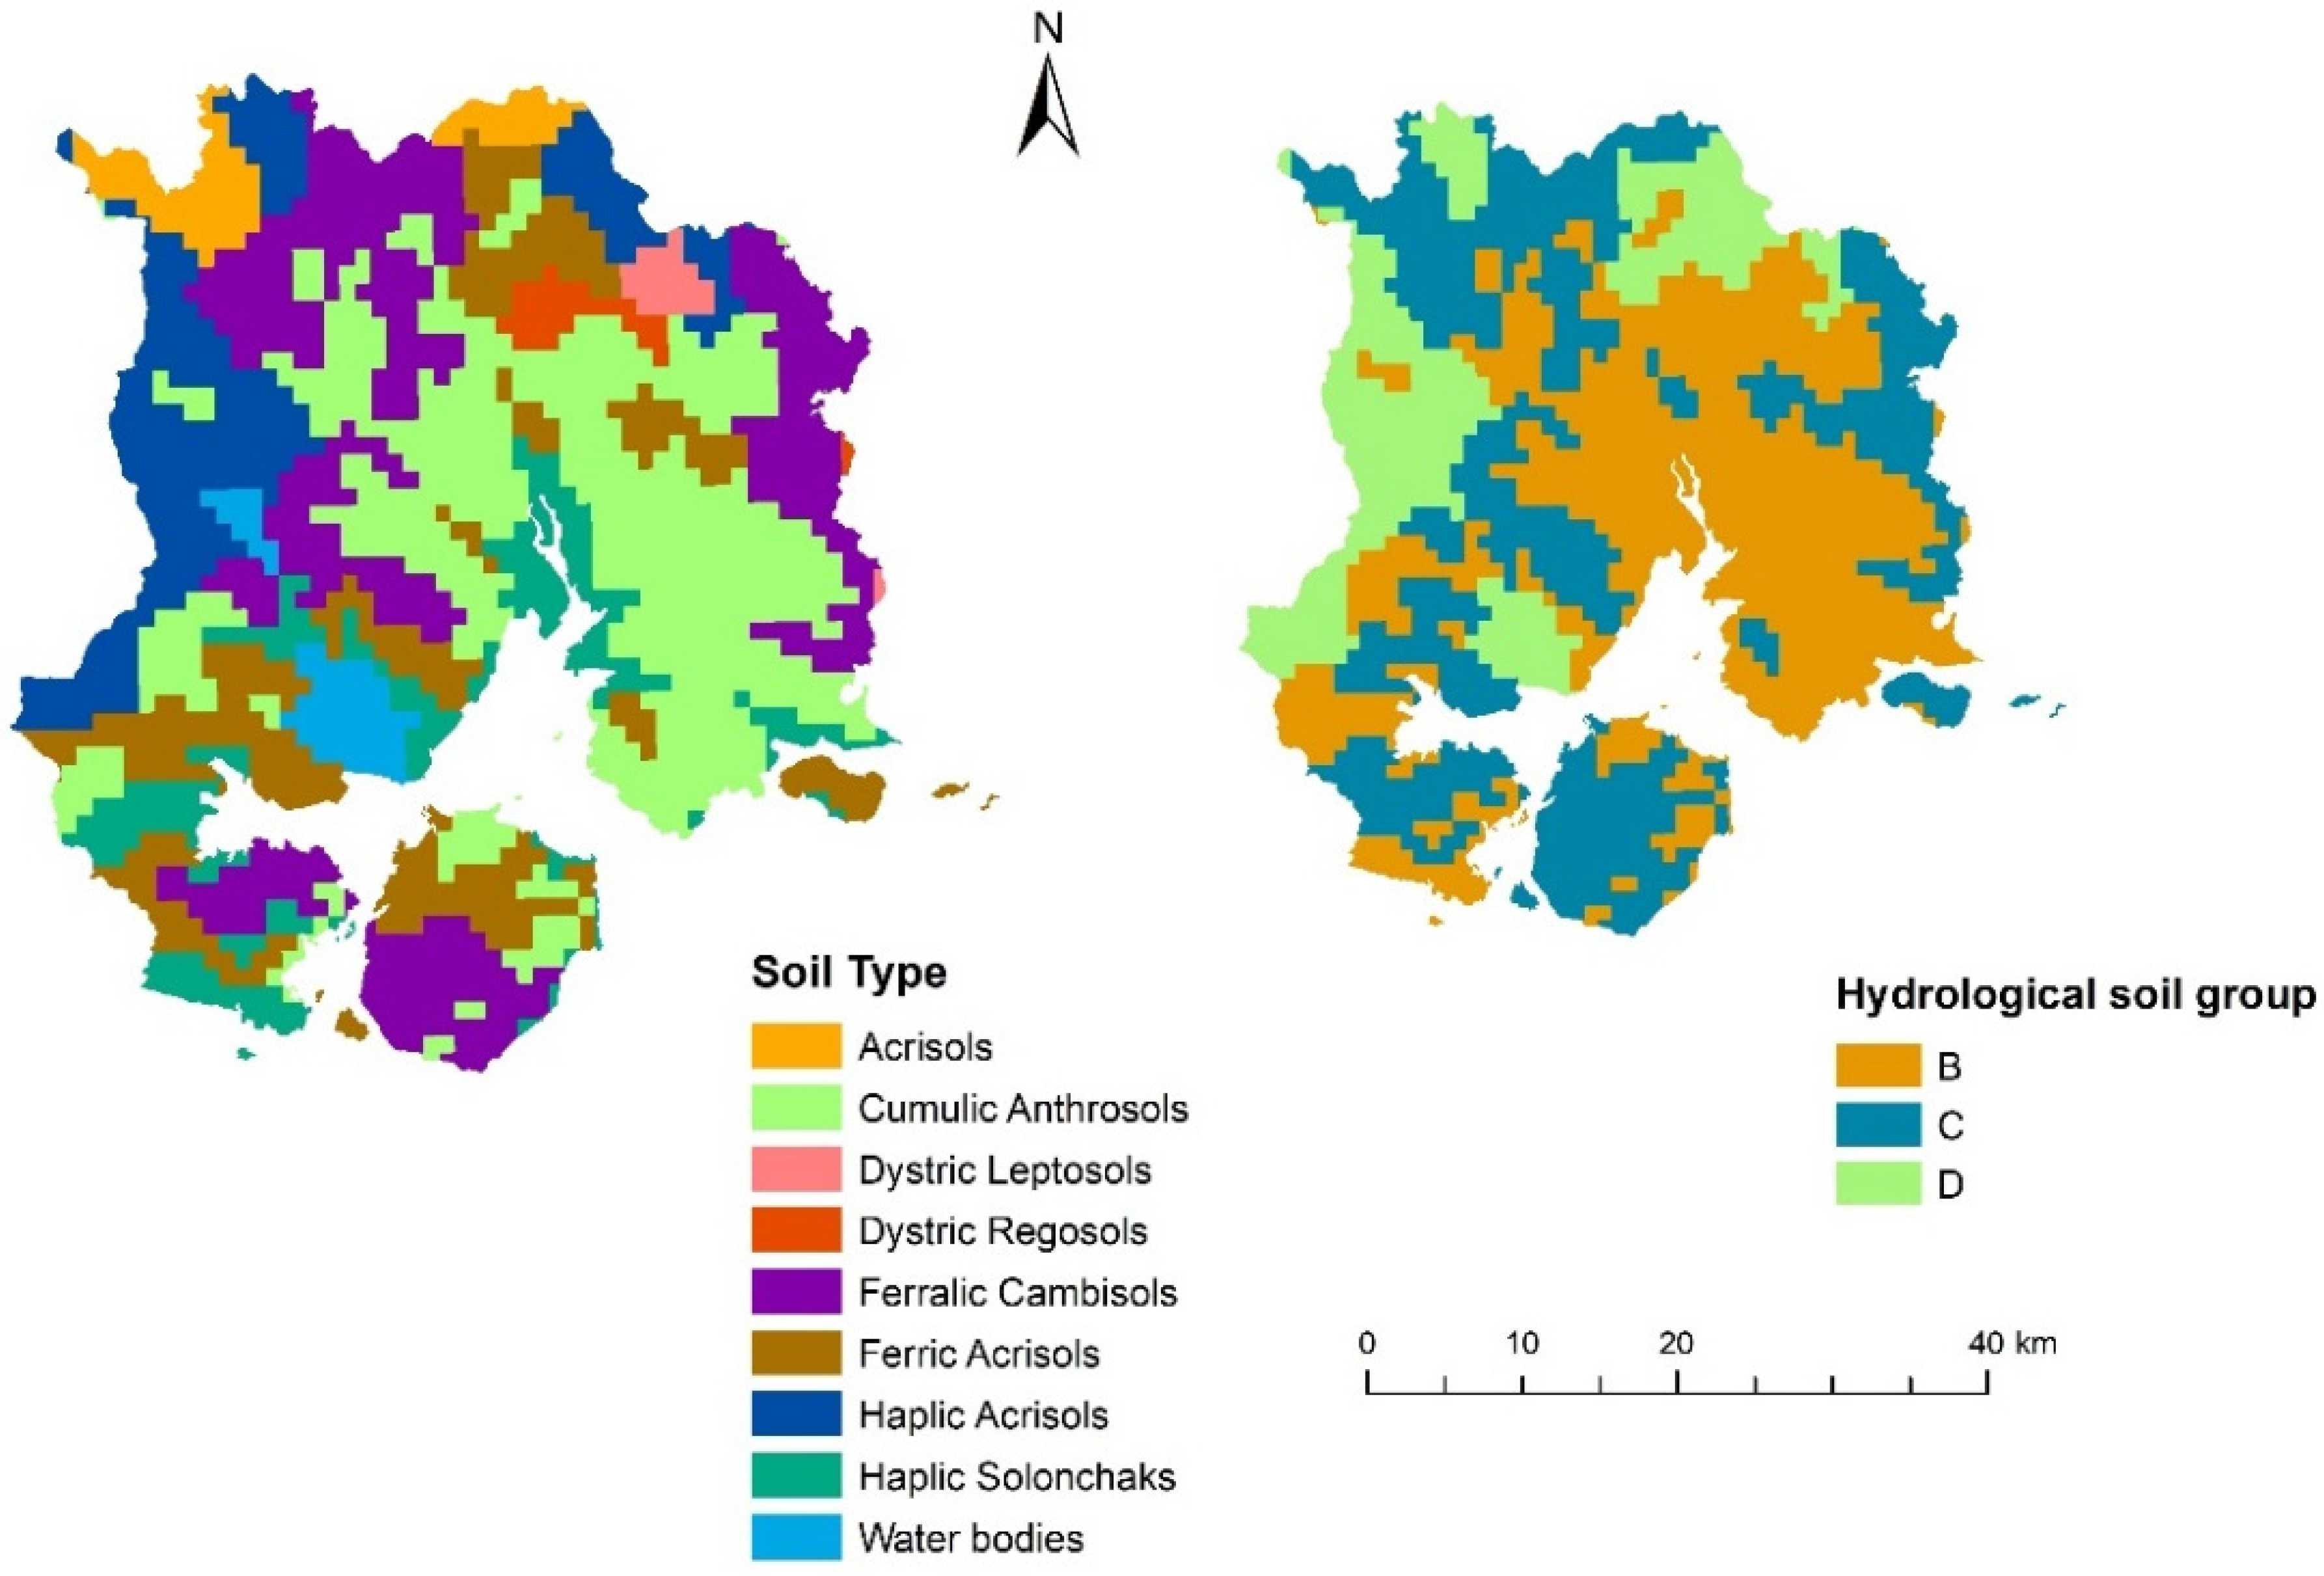
2.2. Data Source and Methods

(a) Land use data
Multispectral satellite images from Landsat 3 MSS, Landsat 5 TM, and Landsat 7 ETM+ were obtained to create a land use map of the study area for 1980, 1990, 2005, and 2015. The images were downloaded from Centre for Earth Observation and Digital Earth (CEODE), Chinese Academy of Sciences, and the United States Geological Survey (USGS) [34]. Images were georeferenced to the UTM, Zone 50 North, WGS-84 projection, and Beijing 1954 coordinate systems. The spatial resolution is set to 30 m. The land use was classified according to the National Land Cover Data Sets (NLCD) of China generated by Liu et al. [35] in the construction of the China 20th Century LUCC Spatio-temporal Platform. The method of unsupervised classification with Iterative Self Organizing Data Analysis Technique Algorithm (ISODATA) was used for image classification. Based on the national land use data product by Geographical Information Monitoring Cloud Platform, the land use was initially classified as six first level categories and twenty-five second level categories, which were reclassified into eight classes for the study. High resolution satellite imagery from Google Earth was used for visual interpretation and accuracy assessment. The overall accuracy and kappa coefficient of classified land use types is more than 85%. The high overall accuracy and kappa coefficient suggests a good relationship between classified image and reference image. The detailed descriptions of land use classes are given in Table 1. ArcGIS 10.5 and ENVI 5.3 software were used to generate various layers and land use maps.
(b) Soil data
Soil data were obtained from Harmonized World Soil Database (HWSD) and Food and Agriculture Organization (FAO). Soil information for Xiamen city was obtained from 1:1 million soil map of China with a resolution of 1 km (30 × 30 arc seconds) [36]. Hydrological soil groups are classified into A, B, C, and D on the basis of water transmission and infiltration rate of soil when the soil is thoroughly wetted [29]. Soil group A has a high infiltration rate and the lowest runoff potential. These soils consist of sands or gravels that have a high rate of water transmission. Group B and C soils have moderate runoff potential and infiltration rate with a slower rate of water transmission. Soil group D has the lowest infiltration rate and highest runoff potential composed of clay or clayey loam soils with a very slow rate of water transmission [29]. Based on soil texture and soil type, the study area is classified into three HSG types, B, C, and D, as can be seen in Figure 3, which mostly contribute to large surface runoff and less infiltration.
(c) Rainfall data
Long-time series rainfall data from 1985 to 2015, collected at the Xiamen meteorological stations, were acquired from the China Meteorological Data Service Centre of the China Meteorological Administration. The rainfall amount for the return periods of 5, 10, 20, and 50 years were obtained from maximum daily rainfall data for the hydrological analysis, as seen in Table 2. The rainfall for corresponding return periods was determined by using Log Pearson Type III distribution, which is the common probability distribution method used in China [37]. The study assumed that the climatic and soil conditions are constant. To investigate spatial heterogeneity, the study required uniformly distributed station data, which are not available. Therefore, for the temporal analysis of rainfall from the stations, the station with the most complete data was selected as a representative of the study area’s rainfall. Furthermore, the study area is small, and changes in rainfall variation is considered insignificant.
(d) Digital Elevation Model (DEM)
A digital elevation model (DEM) with a 30 m resolution was downloaded from the USGS website. Using hydrology tools in ArcGIS 10.8, 19 catchments were obtained, as seen in Figure 1. The sinks in the DEM data were filled, water flow direction was estimated, and flow accumulation was set with a threshold of 10,000 and 60,000 to obtain the catchments. As the study area has short streams and not many large rivers, areas in the southwest do not have adequate streams to obtain a catchment. Hence, runoff obtained from these areas was not significant, and only those areas with enough streams within the threshold are selected as catchments for runoff analysis.

2.3. SCS–CN Method

The SCS–CN method is the most commonly used empirical hydrological method developed by the NRCS, USDA, and is widely used to simulate runoff [19,29]. The curve number method has been successfully adopted in many ungauged watersheds and has expanded its scope of application in urbanised catchments and forested watersheds [29]. The surface runoff model uses the curve number approach of the US Soil Conservation Service [29], based on combinations of land use, hydrological soil group, and antecedent moisture condition (AMC) for the estimation of runoff. The amount of runoff was estimated using the SCS–CN method in presence of GIS and RS. The curve number is the most important factor in determining runoff via the SCS based method. The runoff of the soil and land use complex is represented by CN, which is a function of soil type, moisture conditions, and land use type [38].
The SCS–CN model is based on the water balance equation as shown in the Equations (1)–(3).
P = I a + F + Q
Q P I a = F S
I a = λ × S
where P is the rainfall depth (mm), I a is the initial abstraction of the rainfall (mm), F is infiltration, Q is surface runoff depth (mm), S is the potential maximum soil retention, and λ is abstraction coefficient that ranges between 0.0 to 0.2 or 0.05 for urbanised catchments [39]. The value of 0.2 as mentioned by Natural Resources Conservation Service (NRCS) was used in the study [29]. The runoff depth can be obtained for two conditions from the Equations (1) and (2):
For P > Ia and
Q = ( P I a ) 2 P I a + S
If P < Ia, Q = 0 and Q from Equation (4) is expressed as follows:
Q = ( P 0.2 S ) 2 P + 0.8 S
In Equation (5), S was obtained from the dimensionless parameter CN. CN is runoff curve number that ranges from 0 to 100.
S = 25 , 400 C N 254
In the SCS–CN method, curve number plays an important role in determining the surface runoff of an area, and its value depends on the corresponding soil type and AMC. AMC is antecedent moisture condition present in the soil at the beginning of the rainfall. Areas with a higher curve number represent higher runoff generated from the surface. In our study, we chose B, C, and D as three hydrological soil groups (HSG) present in the study area, and the soil moisture condition (AMC II) was set as moderate according to average runoff condition. A combined map of land use and HSG was generated by combining land use and soil maps in ArcGIS using overlay analysis. Then, the CN values were assigned for each polygon based on the information of land use and soil. The CN values for each land use type under AMC II is obtained from the TR-55 lookup Table 3 [29,40].
Area weighted CN was obtained to simulate the runoff of the whole area using the initial curve numbers from the table as in Equation (8). Combining the CN values of different land use and soil complex polygons, weighted CN was calculated for each catchment. The weighted CN is calculated by taking the sum of each CN value multiplied by its fraction of the total area of each land use type [41]. The Equation is given below:
C N w = ( C N i × A i ) A
where C N w is the weighted curve number; C N i is the curve number for each land use type; A i is area of land use with respective curve number; and A is the total area of each land use type. Finally, surface runoff depth was estimated, and runoff coefficient, i.e., the ratio of runoff to rainfall, was calculated.

2.4. Analysing Impact of Land Use Change on Surface Runoff

Impact of land use change on surface runoff was analysed by comparing the difference in runoff variables. Runoff depth and runoff coefficient was used as two variables to assess land use change on surface runoff. Surface runoff from the catchments were obtained for the different land use conditions and runoff was calculated under different rainfall return periods. The difference of runoff and runoff coefficient was obtained for the land use period of 1980–1990, 1990–2005, and 2005–2015 by using Equations (8)–(10):
Q = Q a Q b
= Q P
β = Q Q b × 100 %
where Q a and Q b denotes surface runoff depths (mm) of the initial and final land use, respectively, P is the rainfall depth (mm), ΔQ is the change in runoff depth between two periods of land use conditions, Δα is the absolute change in the runoff coefficient, and Δβ represent relative change in runoff. Land use change leads to an increase in surface runoff if the values of ΔQ and Δα are positive in the above Equation (10).
A relationship between land use and surface runoff was determined by using Pearson’s product–moment correlation coefficient. A positive and larger correlation coefficient suggests that the factor is more significant in the change in surface runoff.

2.5. Validation of SCS–CN Model

For analysing the performance of the model, the model was validated using observed flow and simulated runoff between 1981 and 2015. Four statistical indices, as shown in Table 4, were used for testing the goodness of fit.

3. Results

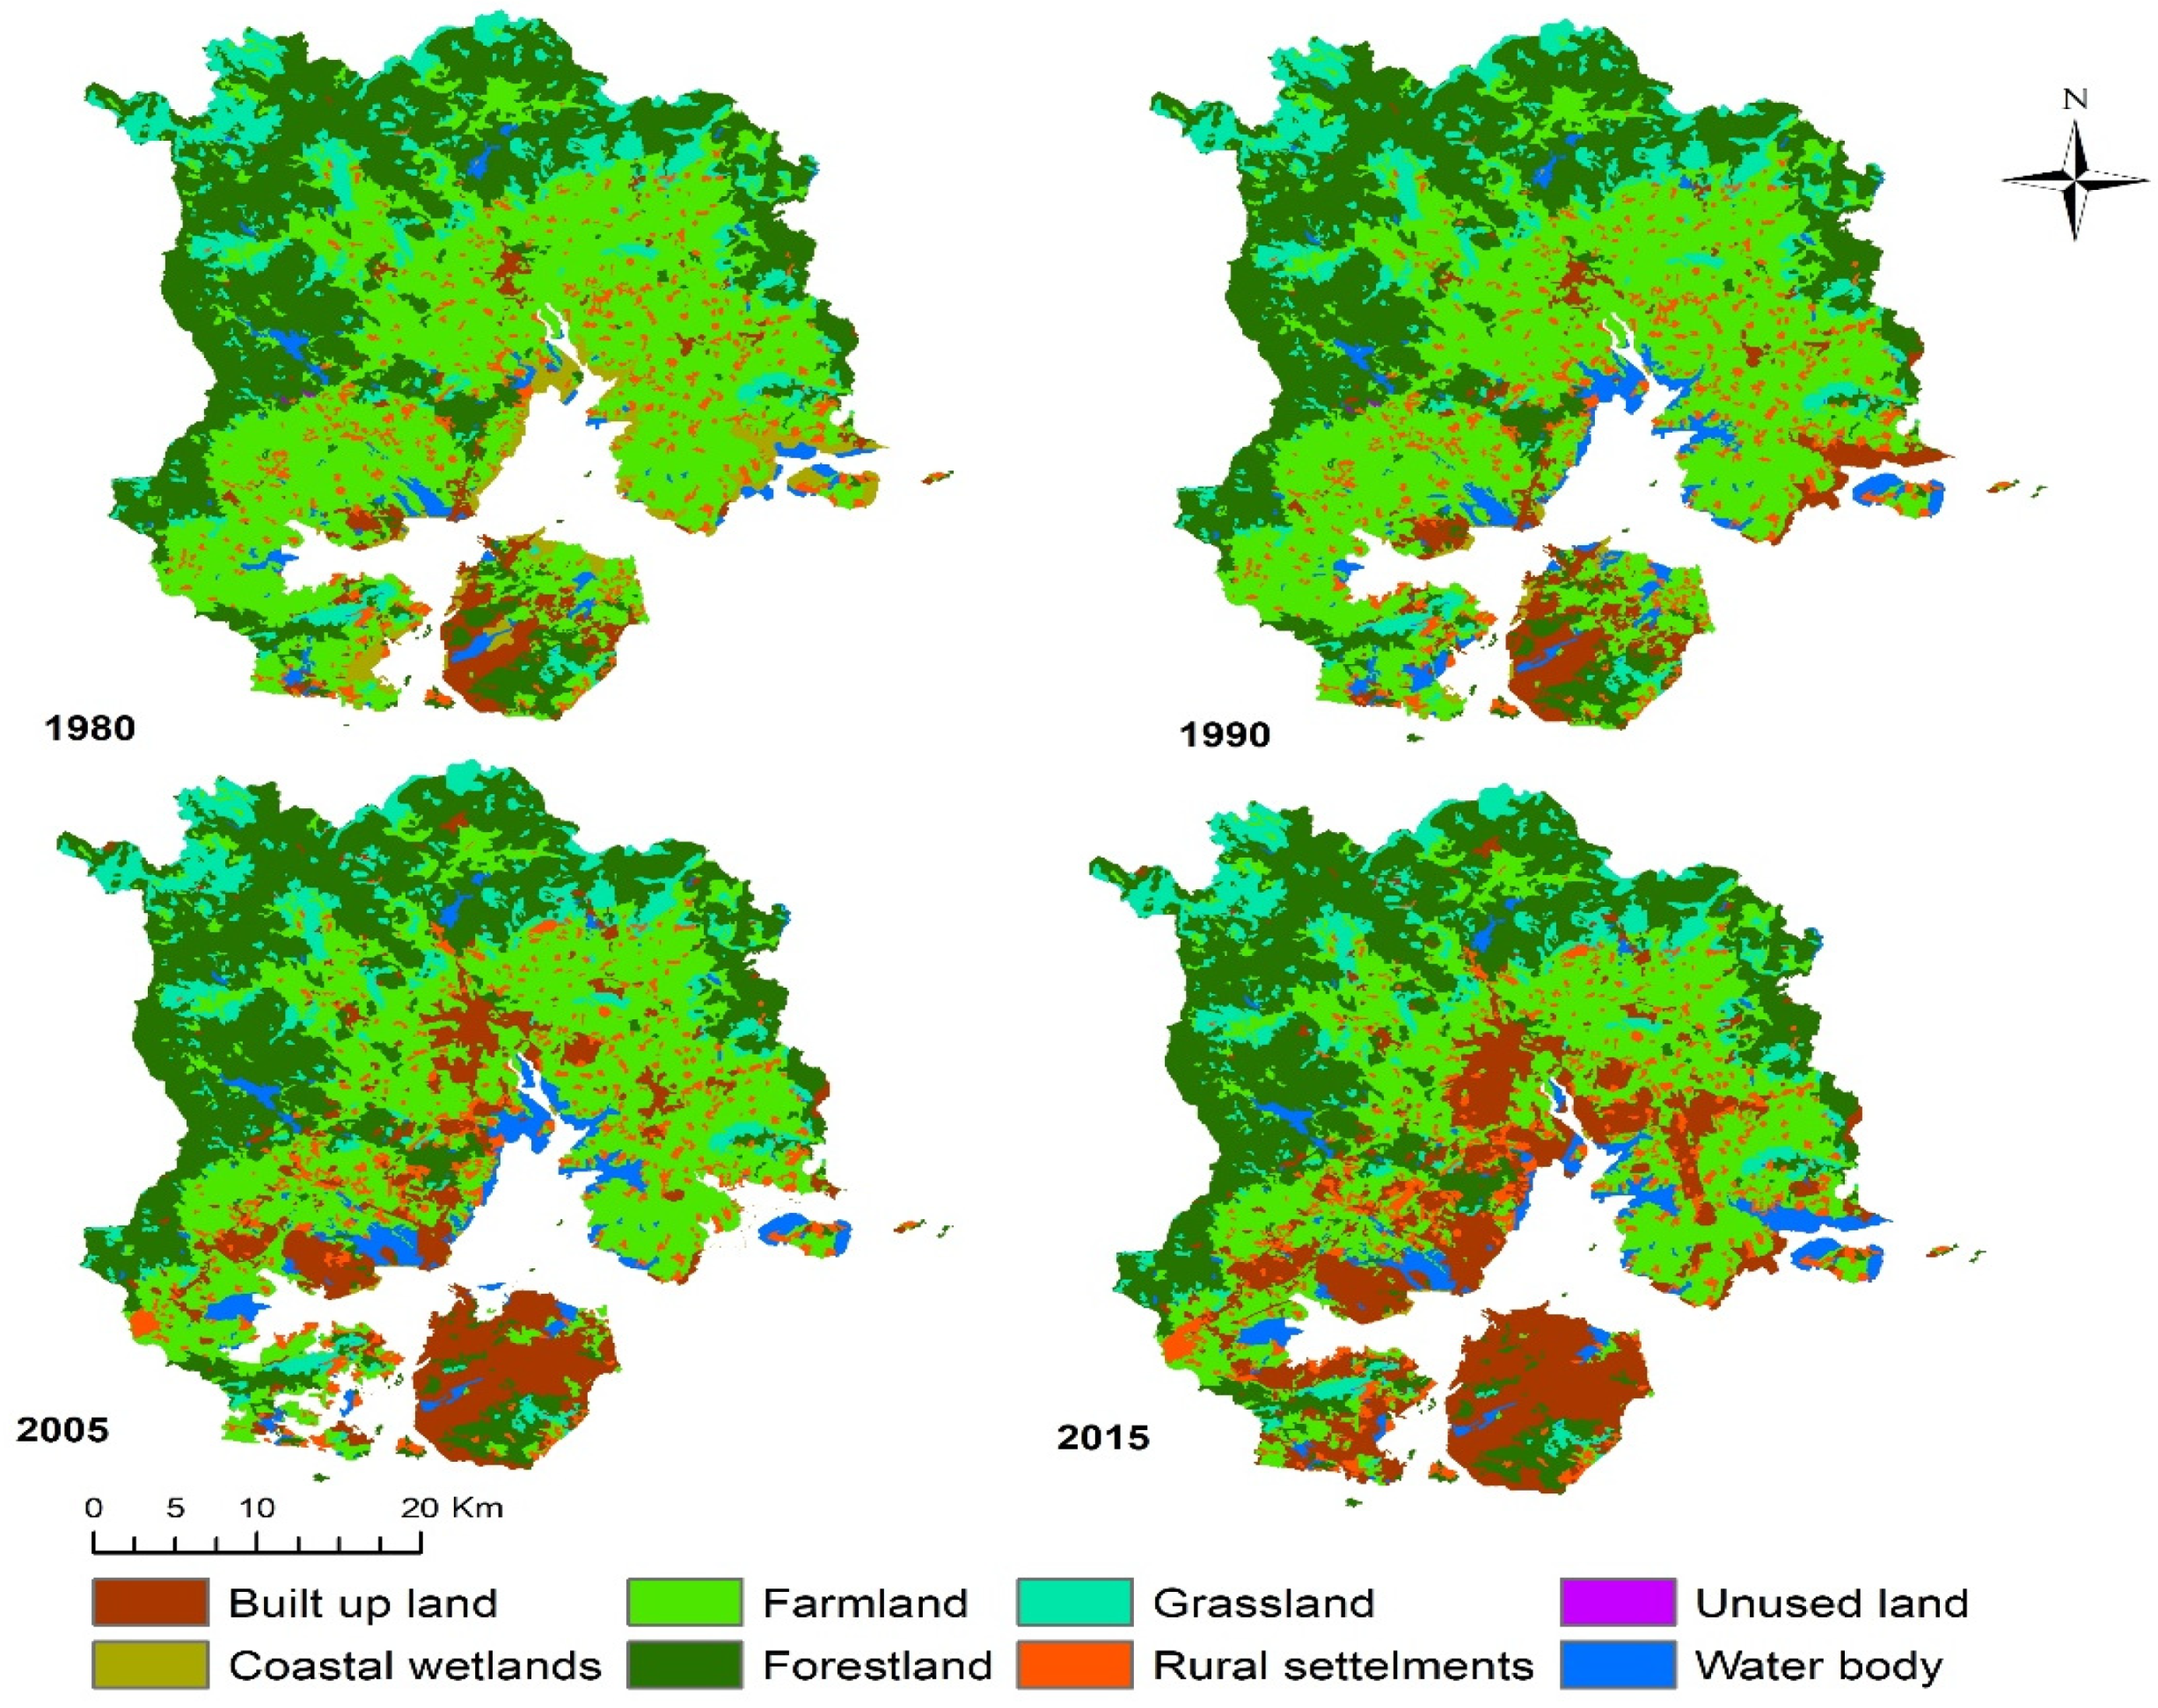
3.1. Land Use Change in the Study Area

Land use types for four different years can be seen in Figure 4. The spatial distribution of land use types show that the area has experienced significant change, especially due to urban expansion. There was a remarkable expansion of built-up areas from 62.85 to 307.54 km2 between 1980 and 2015. It was the largest gain, with a net increase of 244.69 km2. The largest net loss from 1980 to 2015 was observed in farmland and coastal wetlands with 218.2 km2 and 46.65 km2, respectively. However, constructed land that includes built-up land and rural settlements underwent the largest net increase. The forest area reduced substantially with a change of 23.93 km2.
Similarly, grassland and farmland were replaced by built-up areas in the south and south-eastern parts of the mainland and major parts of the island. It can be observed that most coastal wetlands decreased from 1980 to 1990, and built-up areas occupied most areas. The land area of Xiamen City expanded outward by reclamation and construction along the coast after the national survey of 1985, which contributed to the expansion of land area and reduced wetlands in 1990 [42]. A considerable increase in water bodies indicate some farmlands being converted to reservoirs, aqua farms, and other constructed wetlands. Table A1 shows the conversion of the land use in the form of a change matrix for the period of 1980 to 2015. There was a major conversion from farmland to constructed land. The trend of land use change from 1980 to 2015 indicates that urban development has dominated the island city, resulting in vast areas of impervious surfaces.
In Table A2, the percent and area change of each land use type is depicted from 1980 to 2015. It can be observed that farmlands have been reduced by 14.01% and built-up area has increased by 15.7%. The transfer process of land use types in between the study years can be seen from Figure 5. It can be noticed that major portion of change in farmlands in 1990 and 2005 have been replaced by built-up land. Overall, constructed land increased from 9.12% in 1980 to 26.1% in 2015. This indicates that urban impervious areas have increased considerably in the last few decades of the study period.

3.2. Spatial Distribution of Runoff in Different Years

The spatial distribution of runoff depth for the highest rainfall return period of 50 years is shown in Figure 6. Surface runoff depth ranges from 176.28 mm to 329.16 mm. The area covered by built up land with higher CN depicts a higher amount of runoff in the period from 1980 to 2015. Xiamen Island, particularly dominated by constructed area, shows larger areas of high runoff. The urban areas with high CN are often the areas with high runoff value.
Under the land use conditions of 1980, 1990, 2005, and 2015, the average surface runoff depth and runoff coefficient show an increasing trend as shown in Figure 7. The average surface depth of the area under four different periods differ from 117.2 to 271.6 mm, and runoff coefficient fluctuated from 0.6 to 0.8. The calculated value of average surface runoff and runoff coefficient increases as the rainfall return period increase from 5 years to 50 years. It can be observed that surface runoff and runoff coefficient significantly increase from the year 1990 to 2015. The amount of runoff percent for different land use types can be noticed in Figure 8. A major portion of runoff is contributed by built-up land and rural settlements which are the major constructed land in the study area with the rise from 38.2% to 48.4%. Runoff contributed by built-up land alone in the study area increased from 14.2% to 27.9% from 1980 to 2015. Similarly, farmlands and coastal wetlands also contribute to the significant portion of surface runoff in the study area.

3.3. Change in Surface Runoff in Different Land Use Conditions

Increase in urbanised area gives rise to impervious surfaces, resulting in increased surface runoff. Table 5 depicts the change in surface runoff at different stages of land use conditions for the rainfall return periods of 5, 10, 20, and 50 years. Increase in amount of runoff (ΔQ) is highest during 1990–2005 and lowest during 1980–1990. The surface runoff coefficient change (Δα) during the periods is influenced by the respective change in average surface runoff under return periods of 5, 10, 20, and 50 years.

3.4. Relationship between Surface Runoff and Land Use

Land use exhibits a high relationship with surface runoff with a statistically significant correlation (p > 0.05). As shown in Table 6, farmlands (−0.97), forestland (−0.96), and grassland (−0.97) contribute negatively to the surface runoff, which indicates that increase in these land use types contribute to a decrease in surface runoff. Increase in urban built-up land (0.98) and rural settlements (0.99) corresponded to an increase in average surface runoff, while the decrease in farmland, forestland, and grassland contribute to higher runoff. Furthermore, increase in coastal wetlands contribute to a decrease in runoff, and unused land contributed positively to average runoff. The results are consistent with the common knowledge that increase in urban constructed land causes an increase in surface runoff; however, increases in farmland, grassland, forestland, and wetlands lead to a reduction in surface runoff. Water bodies are considered to have less effect on runoff depth, hence the relationship is less significant.

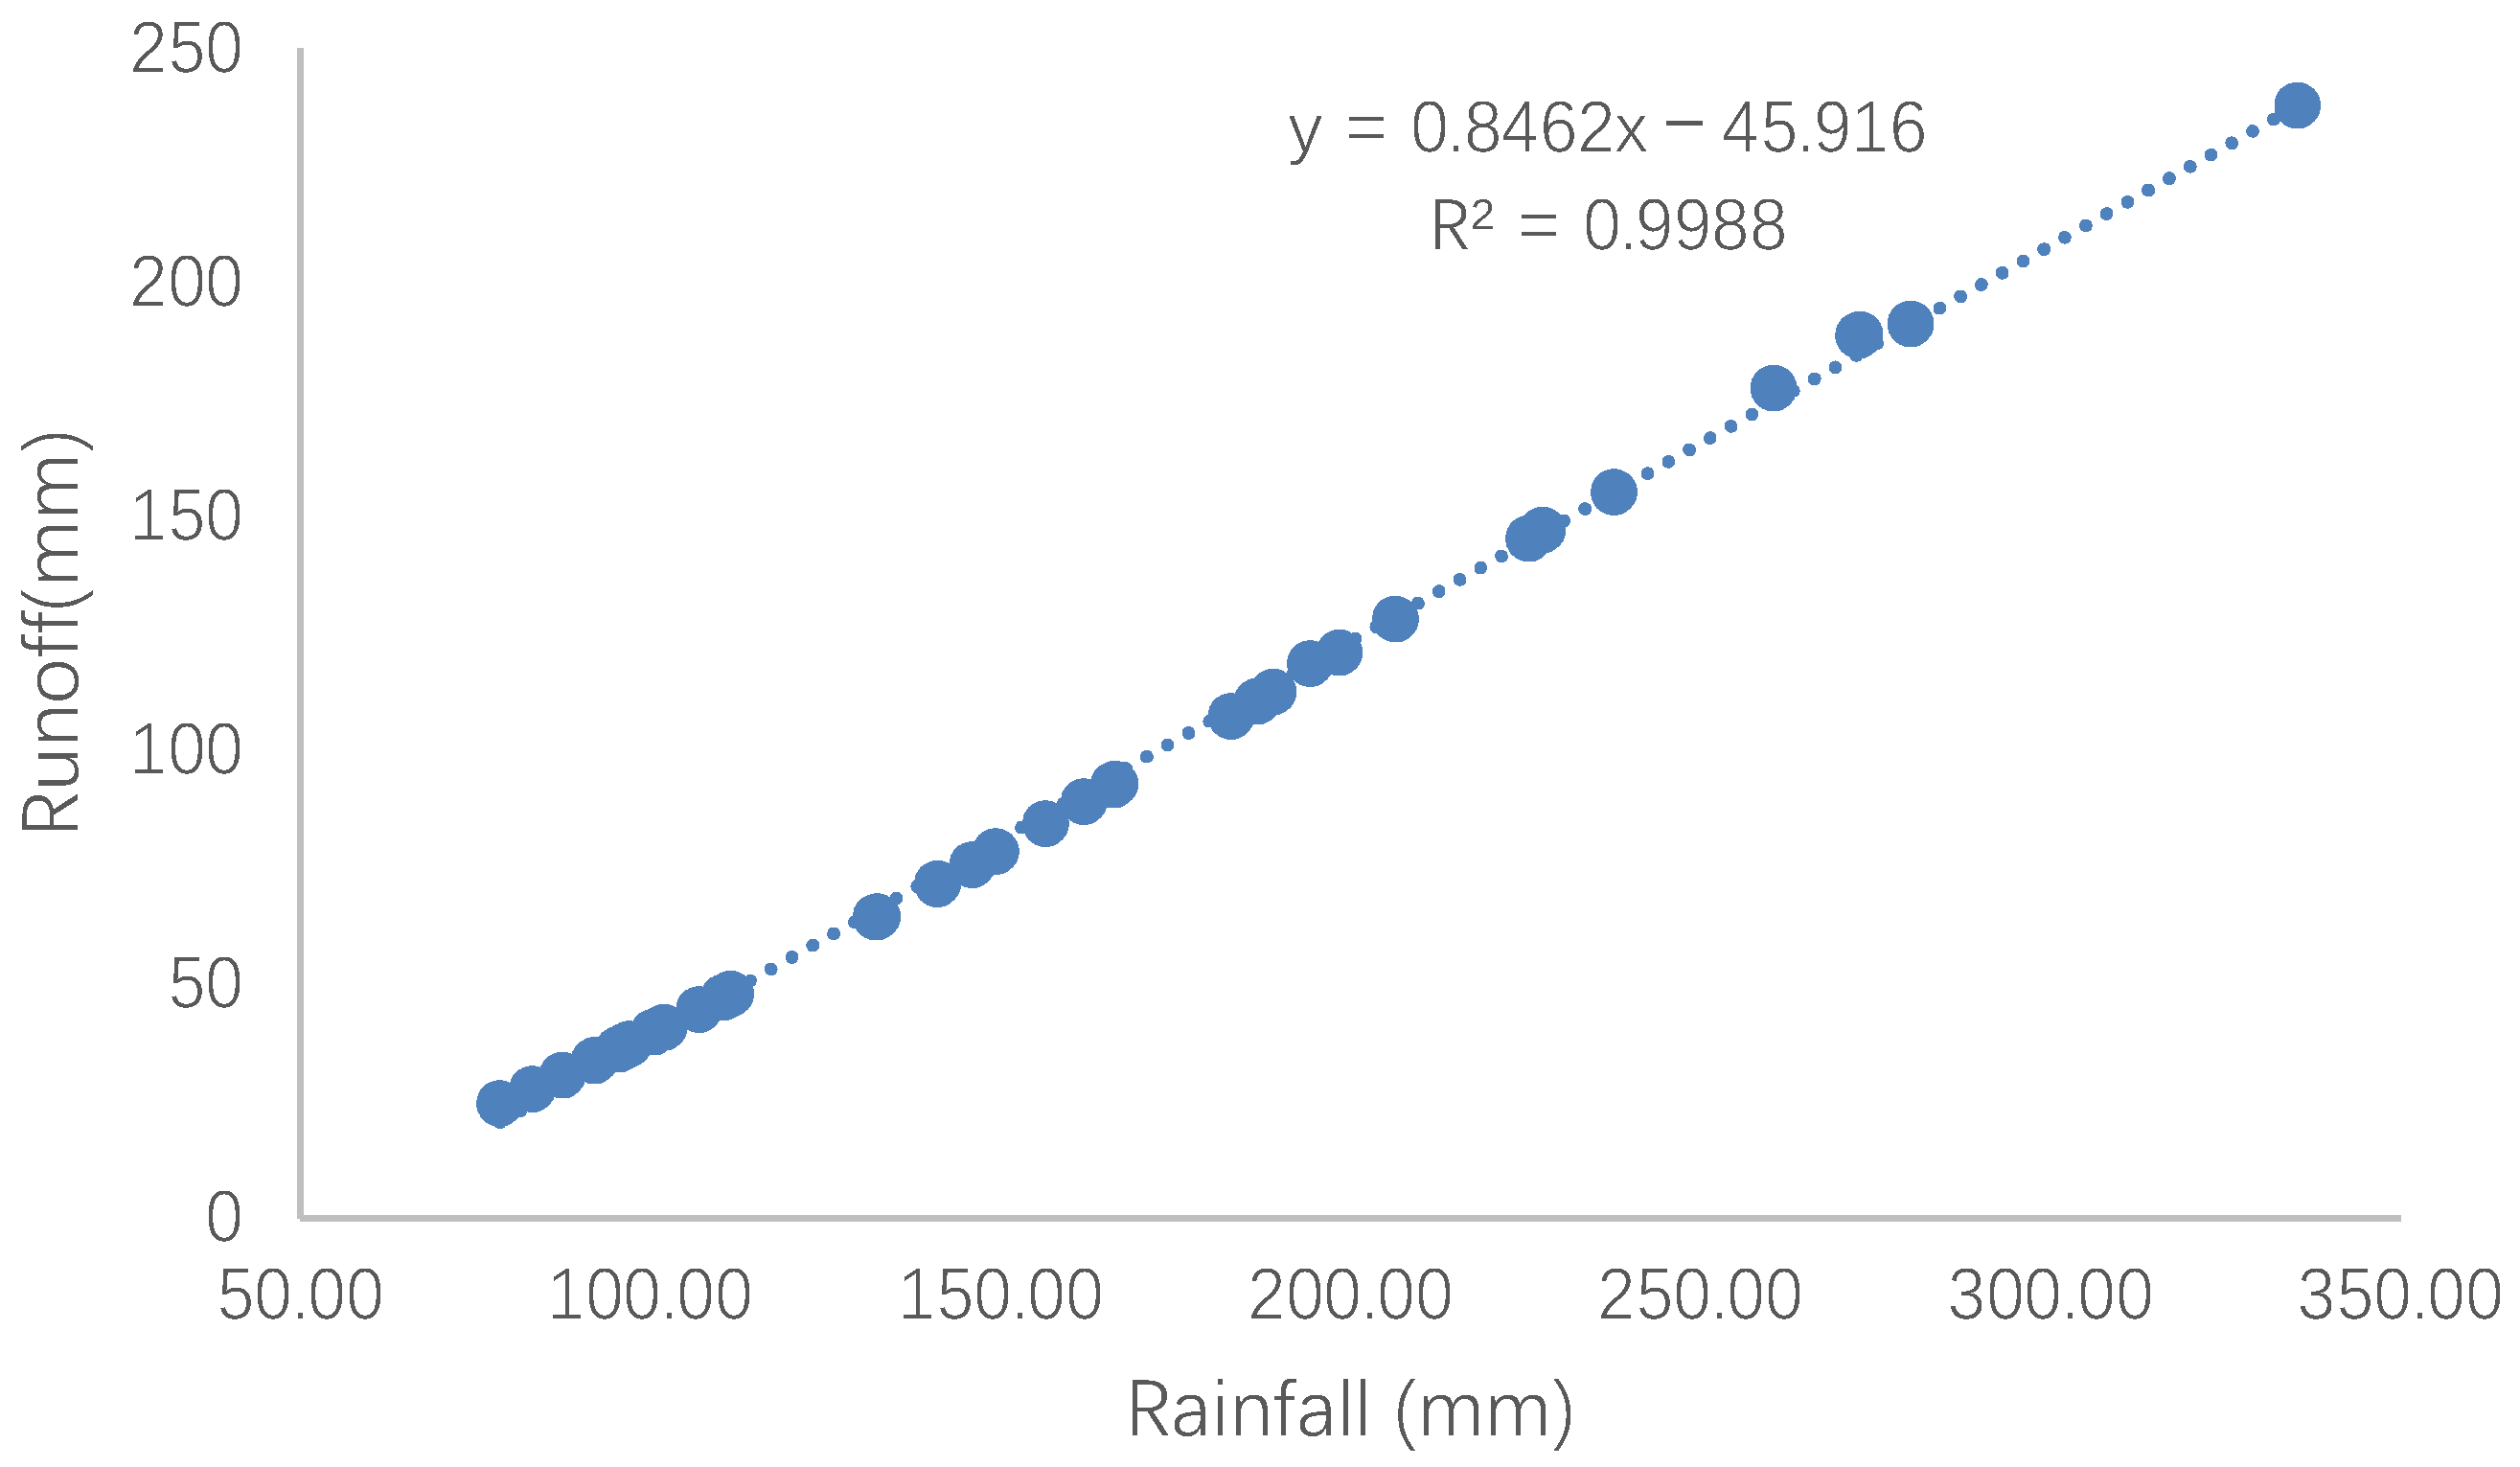
3.5. Rainfall-Runoff Correlation Analysis

The correlation analysis shown in Figure 9 indicates a strong linear relationship between the SCS–CN runoff and maximum daily rainfall, with a correlation coefficient of 0.99. The study results are comparable with the findings of Rawat and Singh [43] who found a good coefficient of determination (0.91) in a small study area using the SCS–CN model. The slope of the line determines the runoff coefficient, i.e., 0.84. The resulting findings are similar to Al. Ghobari et al. [44], who came to the conclusion that the SCS–CN model has a better simulation effect on study areas with a coefficient of runoff greater than 0.5 than those with a coefficient of runoff less than 0.5. This coefficient may provide valuable information on the extent of the basin response to runoff generation.

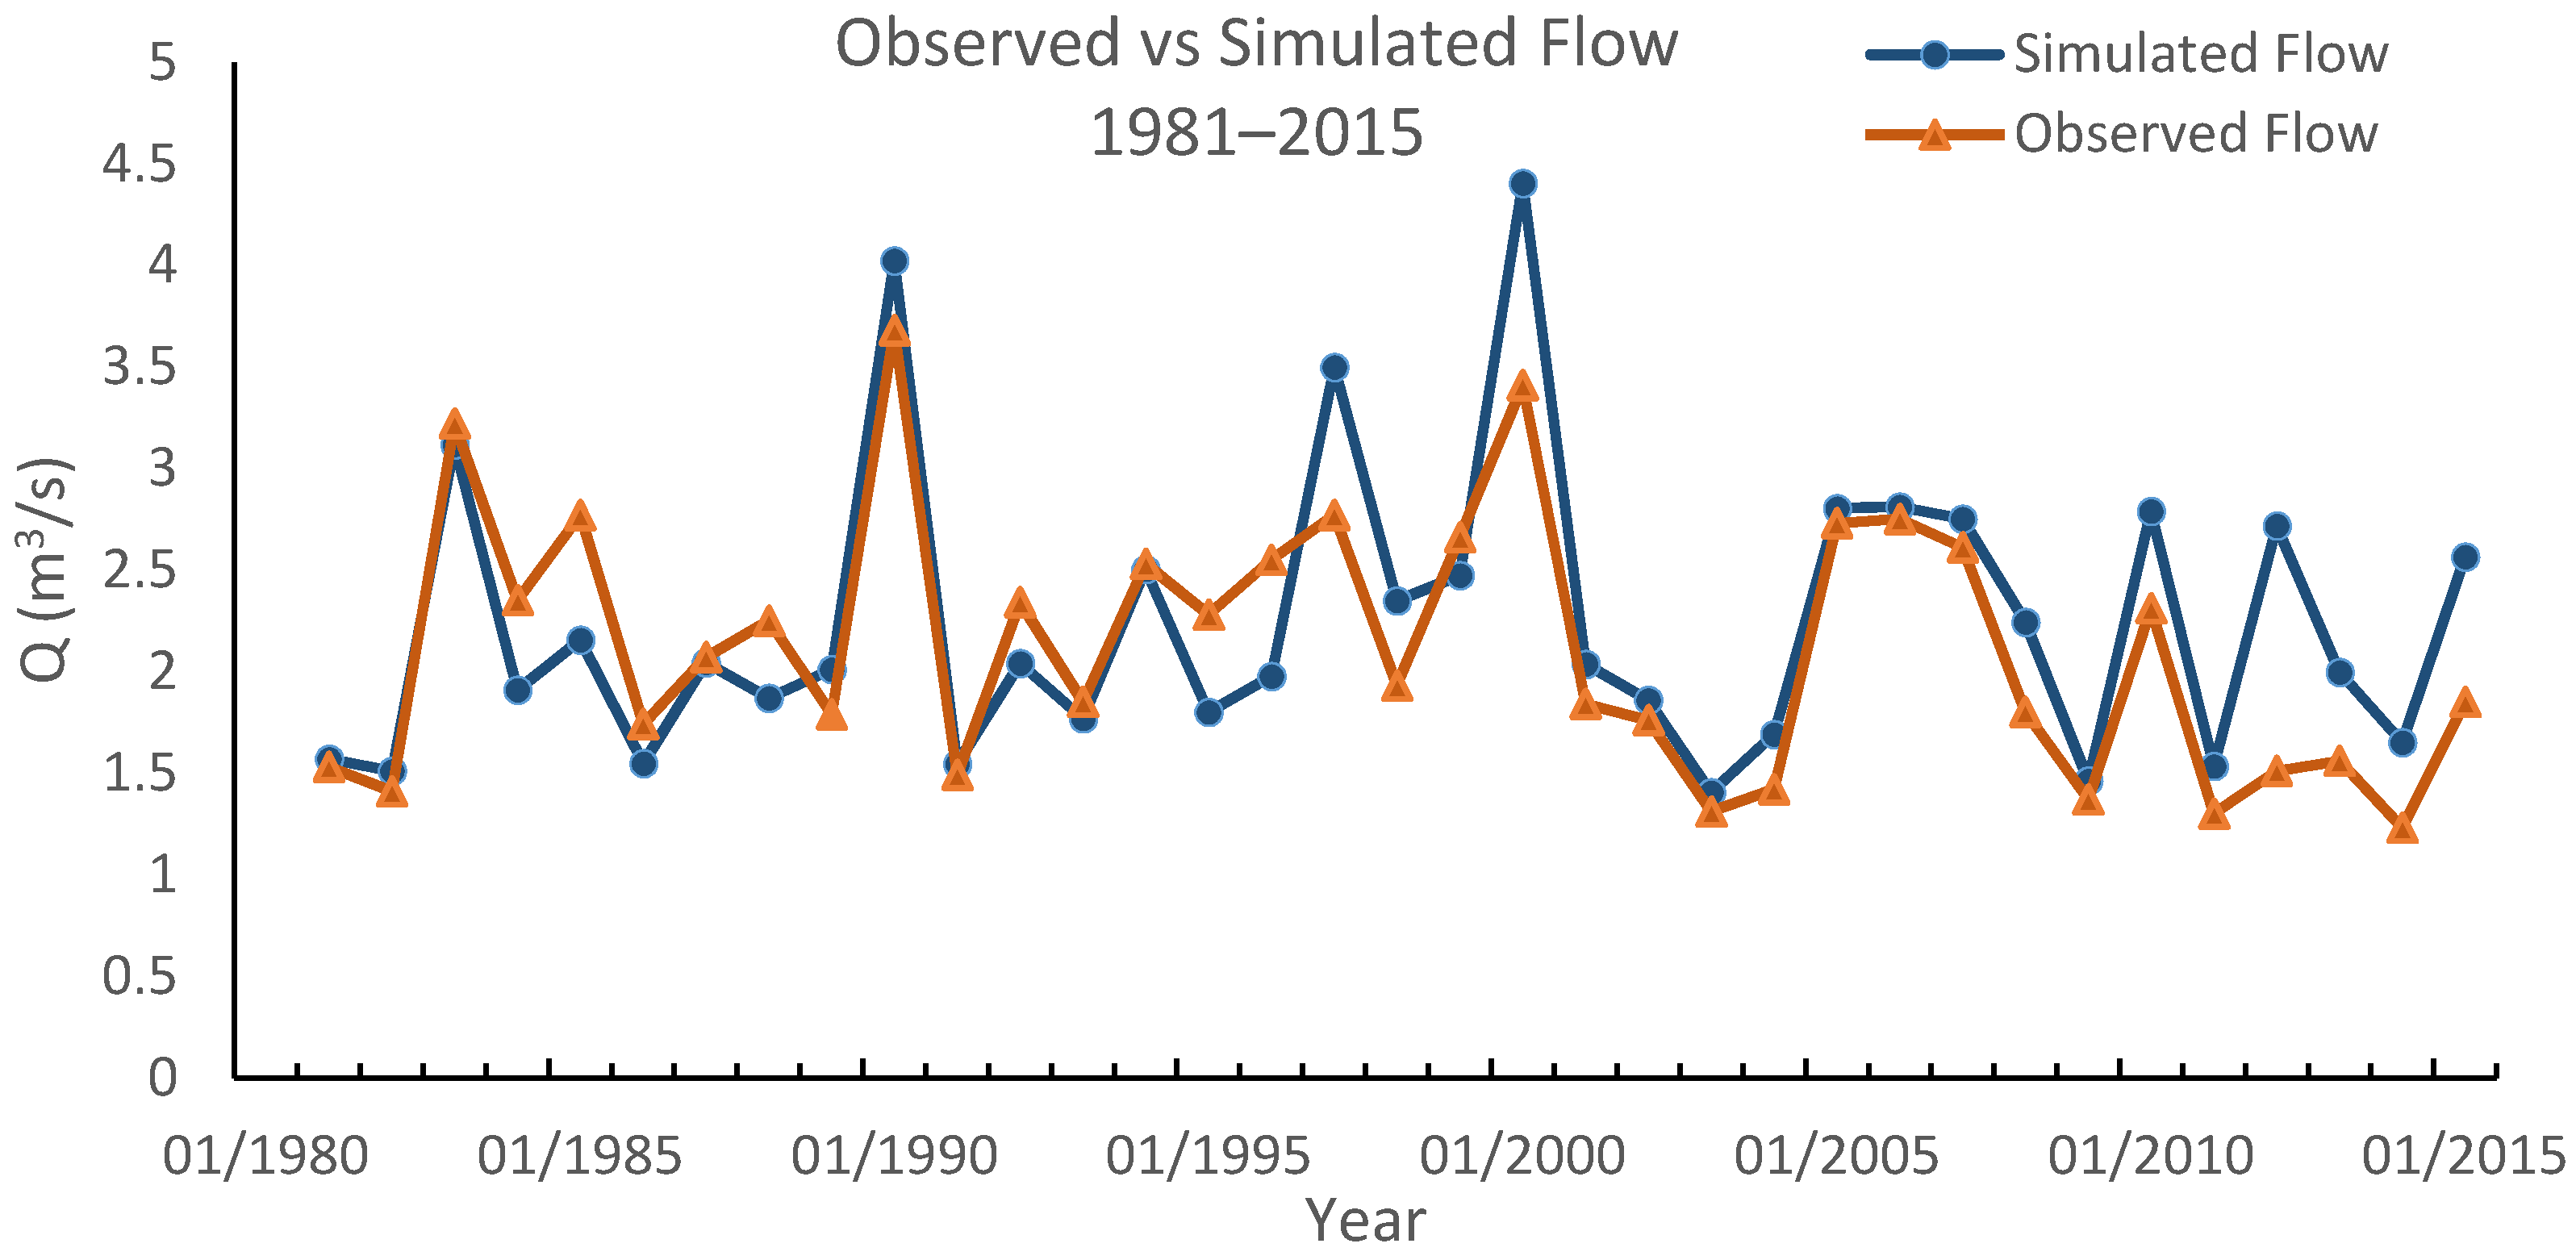
3.6. Validation of SCS–CN

The SCS–CN model was validated using historical observations and simulated flow from 1980 to 2015, as shown in Figure 10. Some statistical efficiency criteria are used to perform evaluation of the validation results between simulated output and observed data which are percent bias (PBIAS), correlation coefficient (r), Nash–Sutcliffe efficiency (NSE) and volumetric efficiency (VE). These statistical indices indicate the goodness of fit between simulated and observed data. The model successfully predicts the annual flow with the high accuracy as depicted by the indices. The PBIAS, r, NSE, and VE were −5.7, 0.82, 0.64, and 0.86, respectively. Although there is an underestimation of streamflow due to static land use, annual flow statistics indicate that there is a good relationship between observed and simulated streamflow. Hence, the model performance was satisfactory and responded well in simulation of runoff.

4. Discussion

The study area has undergone significant land use change from 1980 to 2015. A significant loss of farmland was observed in the period between 1980 and 2015. During this period, most of the farmlands are replaced by built-up lands in the south-eastern part of the study area. After the national survey was carried out in 1985, the land area of Xiamen City expanded outward through reclamation [42]. The major land use change in Xiamen is attributable to land reclamation and urban development in the past years. The process of urban construction in reclaimed land and building new residential areas started to rise after 1985, which is reflected in the runoff increase after 1990 [45,46]. In 1980, after the city was declared as specific economic zone, most of the farmlands and forestlands were converted into urban areas between 1985 and 2005. After 2005, there was major sea reclamation which increased the urban area. New initiatives for industrial and economic development occurred in the period of 1990 to 2005, and an urban renewal program took place between 2003 and 2012 [31]. The change in land use significantly affected the runoff hydrology of the city as a result of urban development. The high values of runoff gradually expanded outside Xiamen Island and were mainly distributed in the areas with increased urban construction [40]. Results show that particular increase in constructed land with higher CN value contributes to higher runoff, whereas farmland, forestland, and grassland with lower CN contribute to a lower percent of runoff [30]. Therefore, change in land use, particularly an increase in urban areas, corresponds to an increase in runoff. As a result of rapid urbanisation, significant increase in surface runoff is observed in the island and outer areas of mainland, which poses higher risks for urban as well as coastal floods [47]. Similar results depicting the strong impact of urbanisation on surface runoff has been obtained by previous studies [2,7,17,48]. Relevant studies have shown that the extent to which urbanisation affects hydrological response depends on spatial and temporal scale, physical geography, landscape composition, and physical and climatic characteristics [49]. The study area, being a lowland coastal area, is relatively flat, and a major part of the area has a slope of less than 15%. Therefore, the slope of the area had a less significant effect on the surface runoff. Additionally, the main objective of the study is to analyse the impact of land use change on the surface runoff, especially due to rapid urbanisation. The impact of slope on the runoff characteristics (peak flow and runoff velocity) are not studied in detail. However, future studies could help better understand the effect of slope on peak flow and runoff velocity.
This study demonstrated the use of a GIS-based SCS–CN method to assess the effects due to land use change on surface runoff by integrating spatial data and hydrological parameters. A GIS-based approach proved to be a reliable tool for quantifying the impact of land use change on runoff with respect to change in CN, which is a function of soil, land use, and moisture conditions [50]. The input data of the soil map and rainfall were based on actual field data, and the CN values of each land use type were obtained from the USDA standard table. The simulation of runoff was validated by comparing the observed and simulated annual flow in the study area, which shows that the design runoff simulated by the model is well accepted. Therefore, the model produced accurate and reliable results of runoff incorporating different spatial aspects. The results were consistent with the results obtained by previous studies of runoff simulations in Xiamen [40,42,51].
To fully comprehend the impacts of spatiotemporal land use change on abrupt or gradual flood peaks and runoff flow, various geographical parameters that influence the runoff should be considered in future studies. In the study, other human and environmental factors affecting runoff, such as the construction of dams, reservoirs and underground extraction, drainage systems, temperature, canopy cover, and soil loss, etc. are given little attention. Therefore, it is necessary to conduct extensive studies including these factors in the future.

5. Conclusions

With the gradual increase in urban areas from 1980 to 2015, a major fraction of land was converted to areas with poor infiltration and low potential storage, which significantly influenced surface runoff. In order to analyse the effect of land use change due to urbanisation on surface runoff, we used GIS-based SCS–CN model. The change in average runoff during the study period was determined, and relation between land use and runoff was obtained. A relation between rainfall and SCS runoff showed that the performance of SCS–CN model is suitable for runoff estimation. The GIS-based approach seemed to be an efficient tool for assessing the land use change and surface runoff through spatial analysis. Hence, the conclusions derived are as follows:
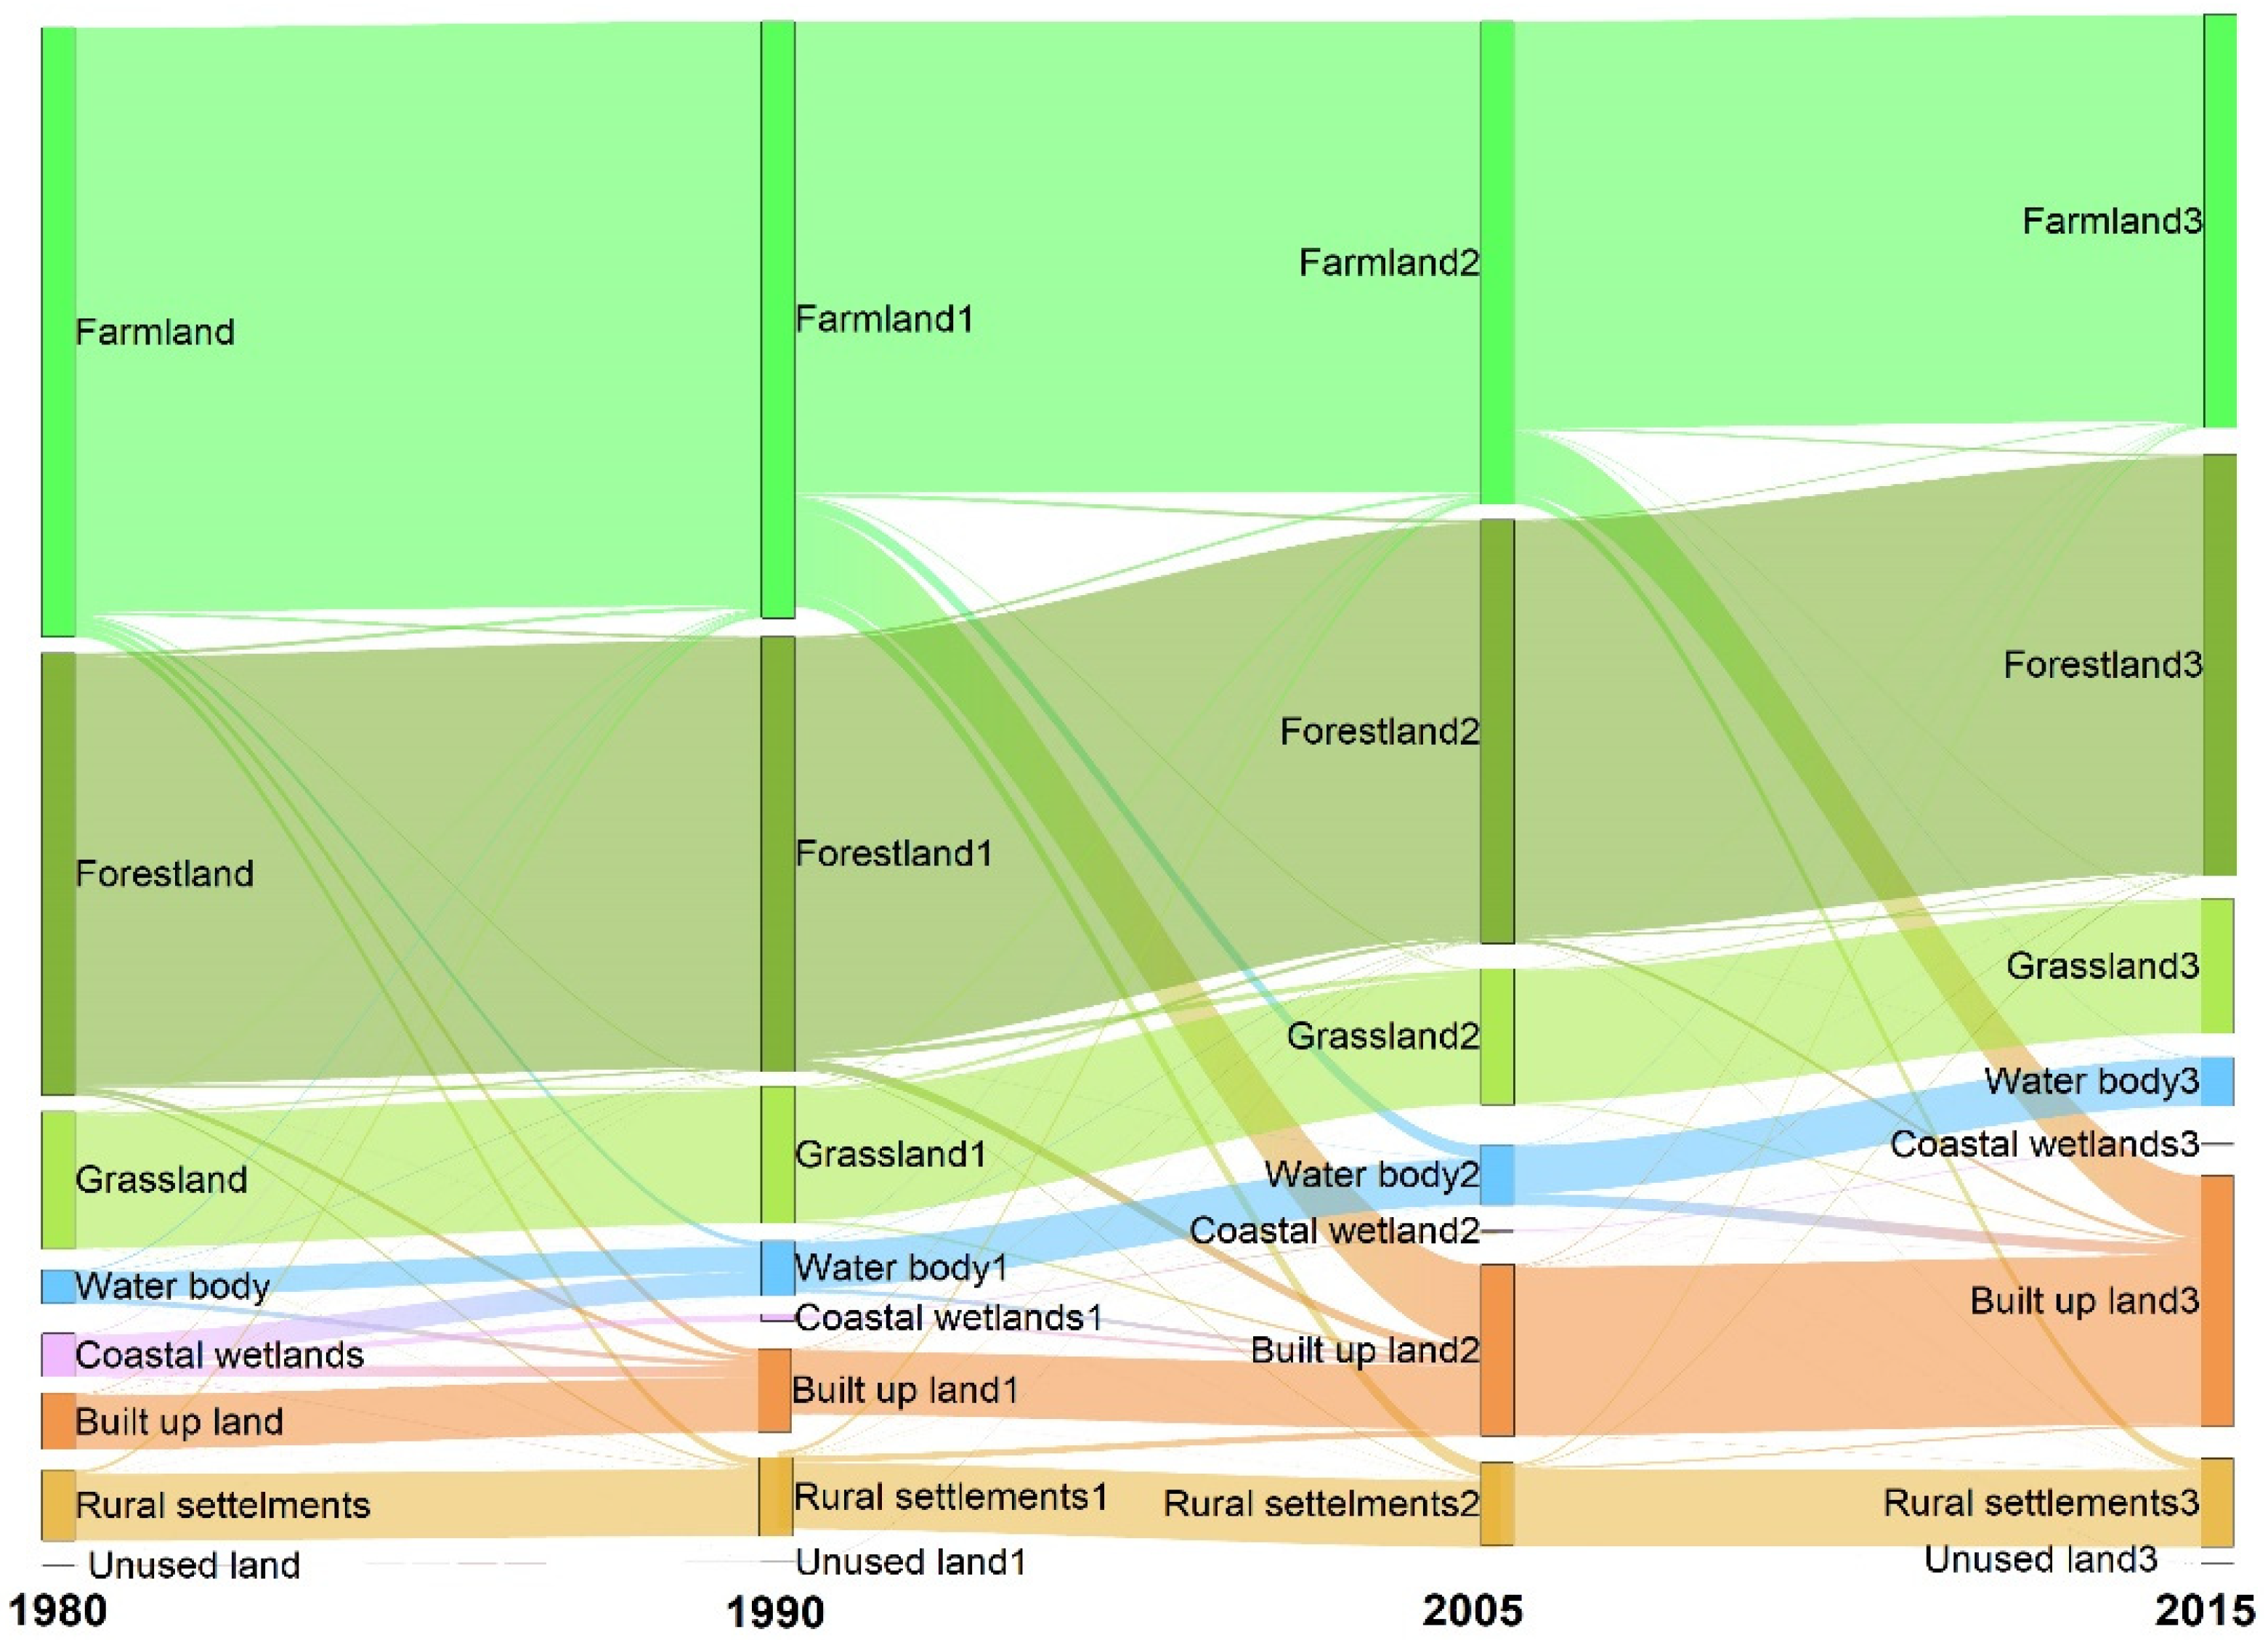
  • The major changes in land use were observed at the expense of conversion of farmland to built-up land. Farmland decreased by 14.02%, and built-up land increased by 15.7%, from 1980 to 2015. Another significant change can be observed in the reduction in coastal wetlands by 2.99% which is attributed to land reclamation and conversion of reclaimed land to constructed land. Overall, the constructed land in the study area increased from 9.12% in 1980 to 26.1% in 2015;
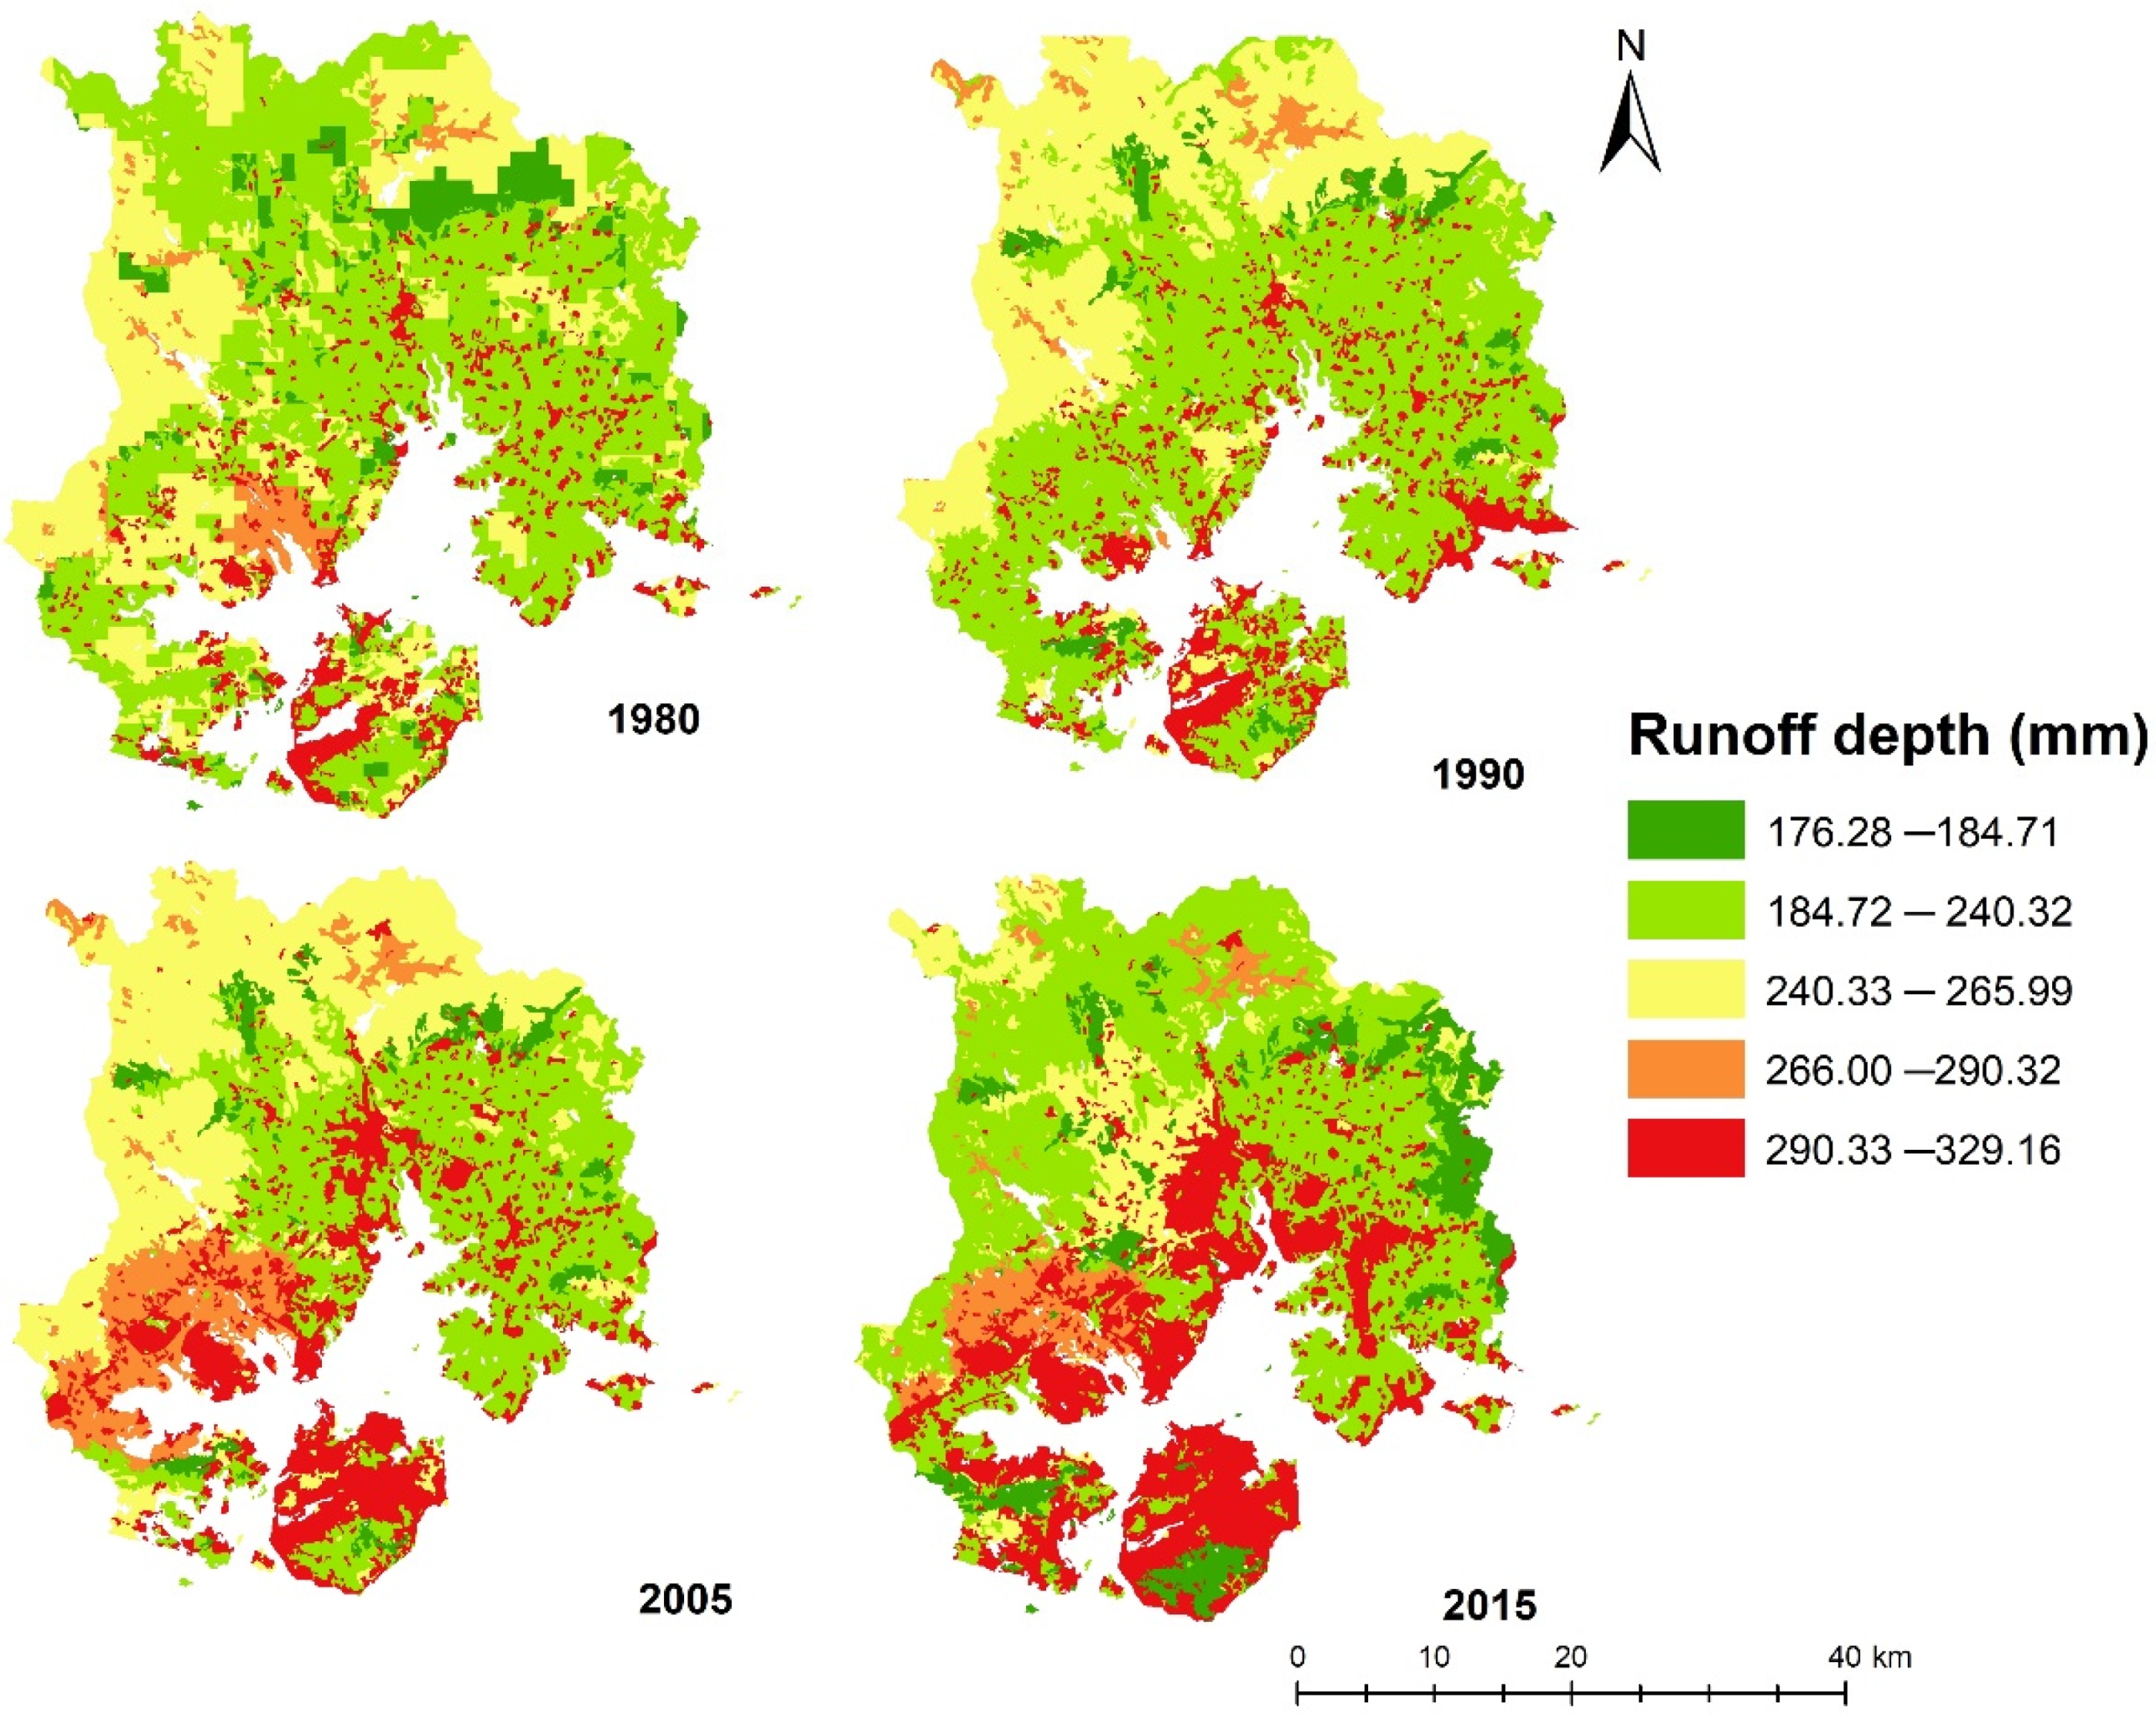
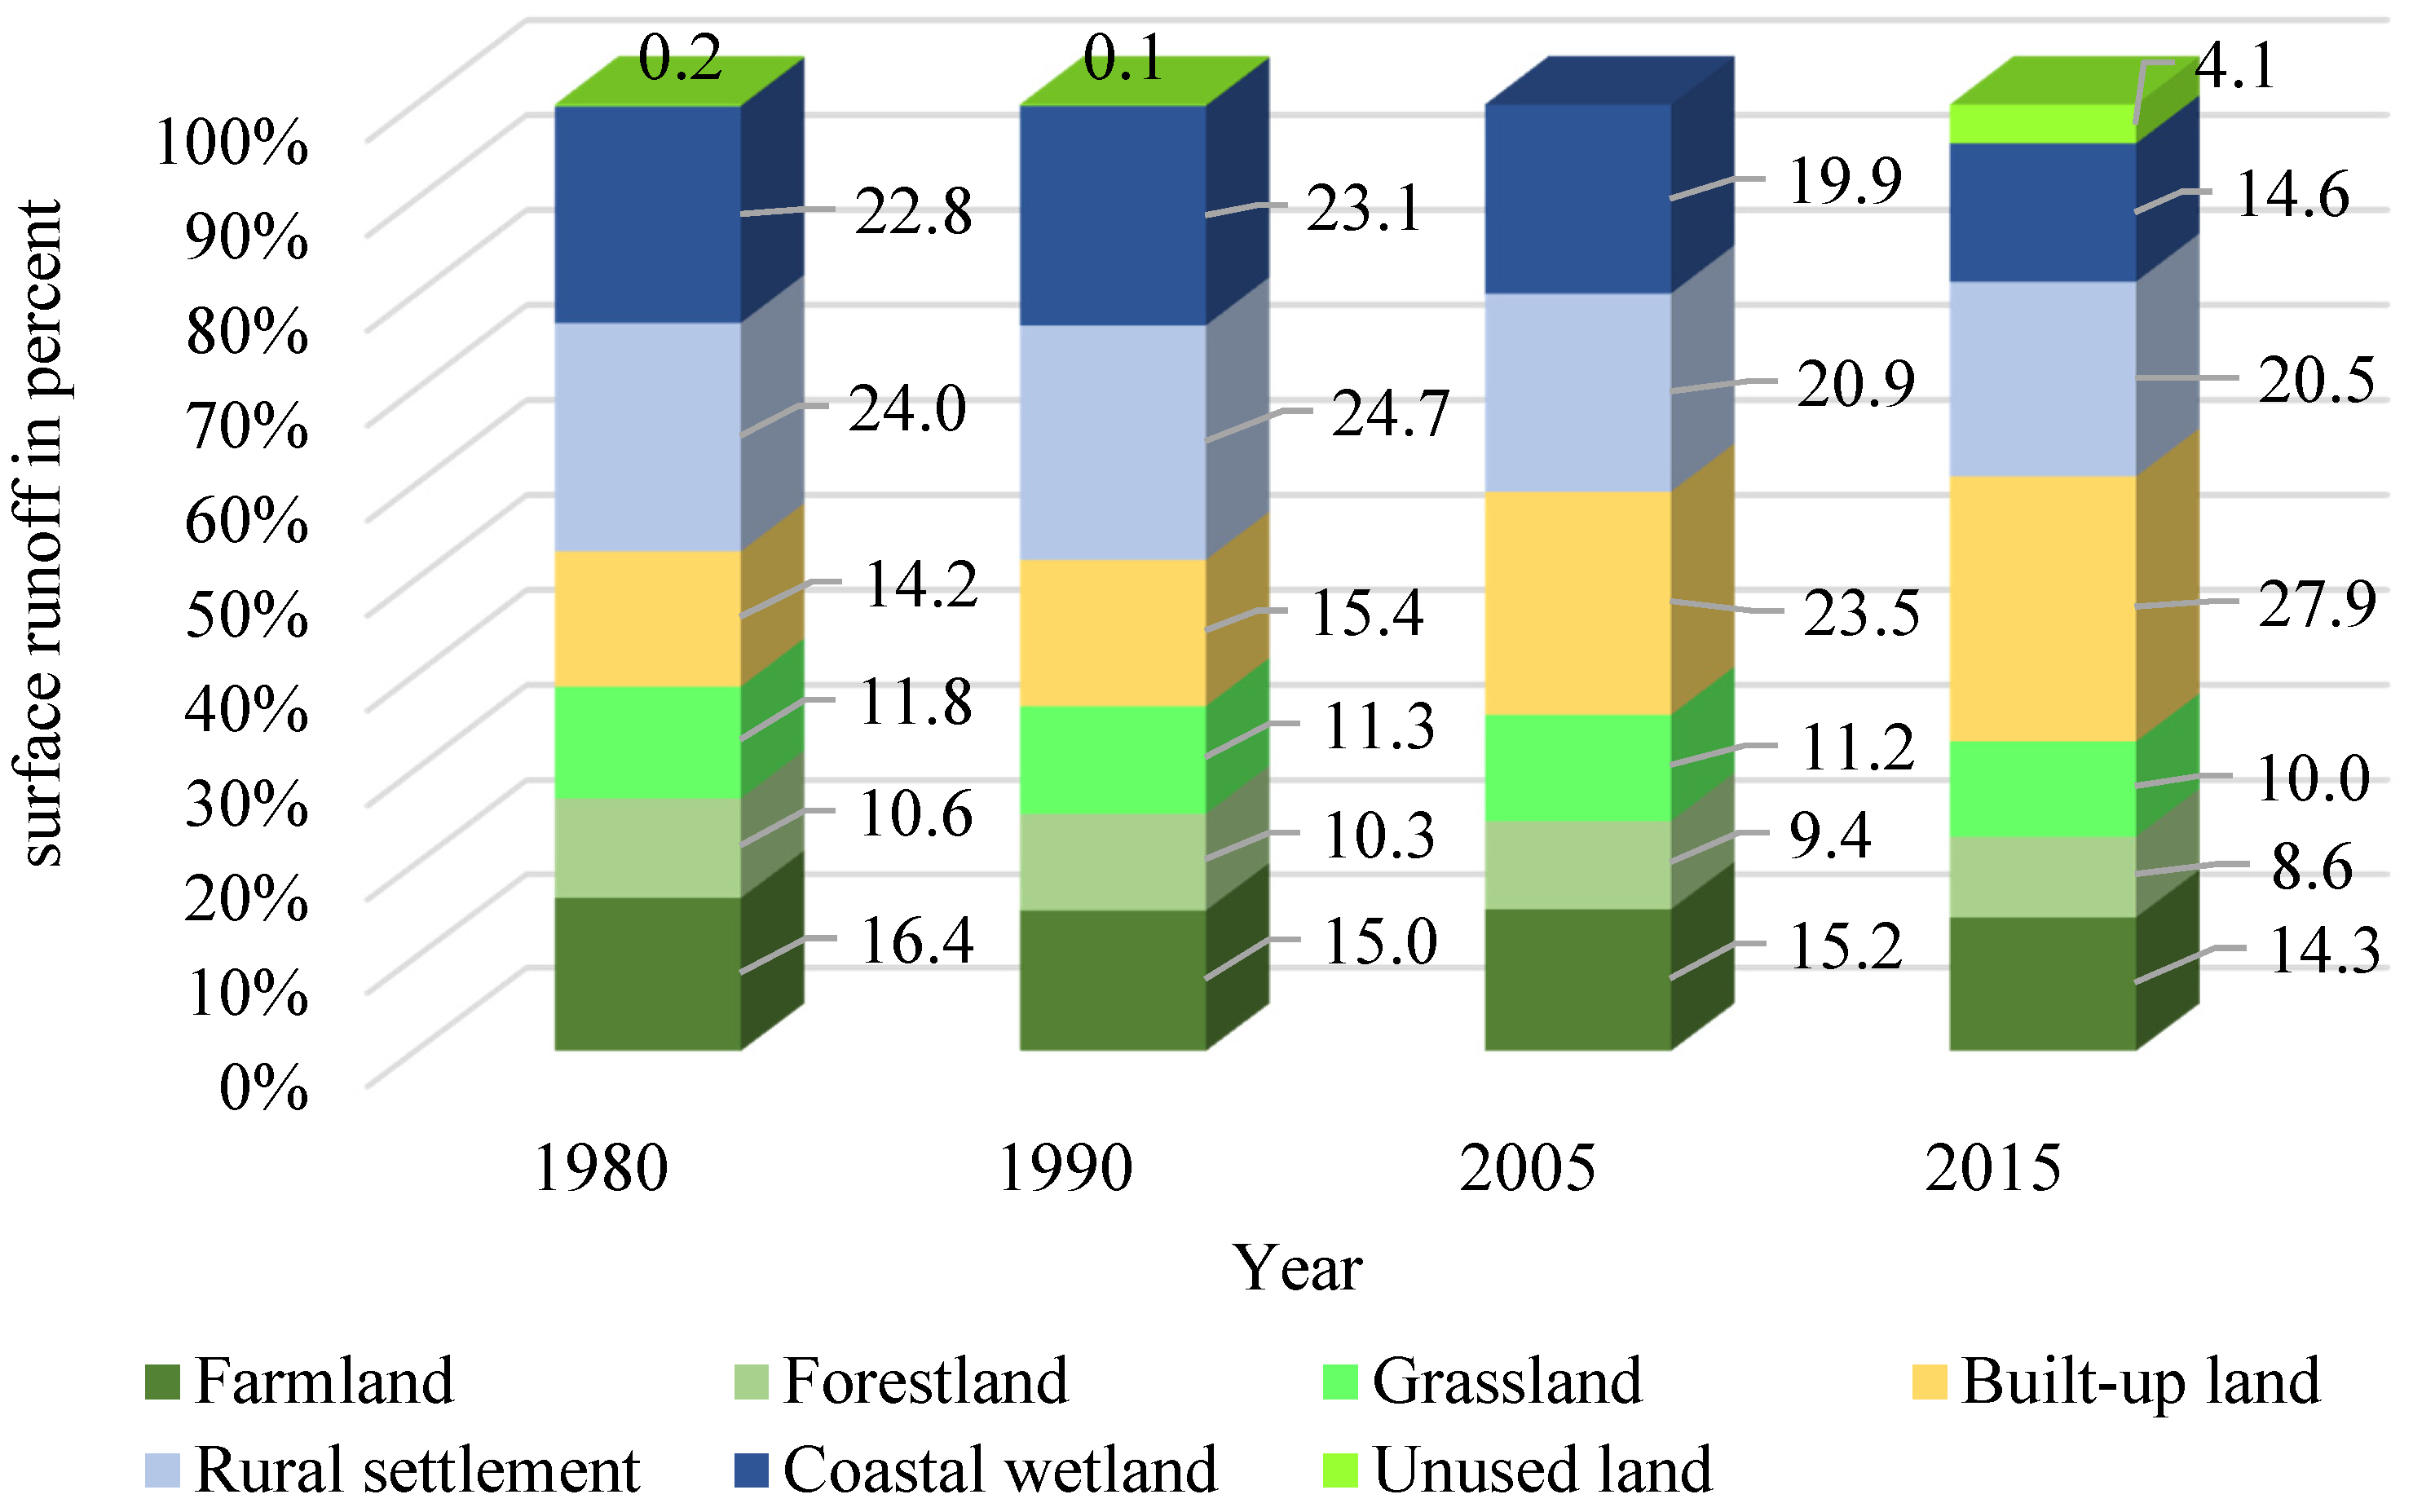
  • Spatial change in surface runoff was noticed from 1990 to 2015 in the south-eastern part of the study area, in which there are areas with higher urban built-up land. Therefore, the increase in runoff in the study area indicates the positive impact of urbanisation. The amount of runoff contributed by land use type shows that, with the increase in total constructed land, the amount of runoff significantly increased from 38.2 to 48.4%. The amount of surface runoff is noticed to be increased from 1990, which is consistent with the rise in urban development that occurred since 1990;
  • The average surface runoff was positively correlated with the built-up and rural settlements, but negatively correlated with the areas of farmland, forestland, grassland, and coastal wetlands. The urbanised land use was determined as a dominant factor for surface runoff increase during the period from 1980 to 2015.
The areas with higher runoff, especially in Xiamen Island, dominated by urban built up land, should be given more attention during land use planning. Forestland, grassland, and farmland in the area have a higher significance for storing runoff. Therefore, these natural green infrastructures should be considered as potential areas for runoff storage. Further research can be focused in exploring the effectiveness of natural infrastructure and nature-based solutions for runoff mitigation and reducing urban flood risks.

Author Contributions

Conceptualization, S.S. and S.C.; Methodology, S.S.; Software, S.S., L.W. and S.D.; Validation, S.S. and L.W.; Formal Analysis, S.S.; Investigation, S.S. and B.M.; Resources, L.W.; Data Curation, S.S. and S.D.; Writing—Original Draft Preparation, S.S.; Writing—Review and Editing, S.S, S.C., L.X. and B.M.; Visualization, S.S.; Supervision, S.C. and L.X.; Project Administration, S.C. and L.X.; Funding Acquisition, S.C. All authors have read and agreed to the published version of the manuscript.

Funding

This research was funded by the National Natural Science Foundation of China (41661144032, 42007418), the National Key Research and Development Program of China (2017YFC0506603), the FJIRSM&IUE Joint Research Fund (Y8L0971), and the Fujian Provincial Natural Science Foundation (2019J05160), China.

Institutional Review Board Statement

Not applicable.

Informed Consent Statement

Not applicable.

Data Availability Statement

The data presented in this study are available on request from the corresponding author.

Acknowledgments

Authors would like to extend their sincere gratitude to the USGS and Geographical Information Monitoring Cloud Platform is acknowledged for making the Land use data product available for the study. We also immensely thank the UCAS International Scholarship for the international Masters Student program. We thank the anonymous reviewers, editor for their constructive comments on the manuscript.

Conflicts of Interest

The authors declare no conflict of interest.

Appendix A

Table A1. Land use and land cover change from 1980 to 2015.
Land Use (km2)1980199020052015Land Cover Change
(1980–2015)
km2%km2%km2%km2%km2%
Farmland681.1443.71667.2042.81540.0235.50462.9429.70−218.2−14.01
Forestland494.8731.75486.4831.21474.0131.16470.9430.21−23.93−1.54
Grassland153.789.87153.489.85151.829.98150.919.68−2.87−0.19
Water body37.842.4362.023.9867.944.4764.994.1727.151.74
Coastal wetlands48.563.127.700.492.460.161.910.12−46.65−2.99
Built-up land62.854.0393.516.00191.8312.61307.5419.73244.6915.70
Rural settlements79.385.0988.205.6693.226.1399.466.3820.081.29
Unused land0.000.000.000.000.000.000.180.000.180.01
Table A2. Land use change transfer matrix between 1980 and 2015.
Land Use 1980 (In km2)Land Use 2015 (In km2)
Land Use ClassBuilt-Up LandCoastal WetlandsFarmlandForestlandGrasslandRural SettlementsUnused LandWater BodyGrand Total
Built-up land61.820.010.580.150.030.020.000.1862.78
Coastal wetlands22.921.760.510.110.000.840.1522.0748.37
Farmland179.680.01456.753.600.9525.280.0015.13681.42
Forestland21.360.001.79463.235.193.180.000.18494.95
Grassland5.050.000.882.27144.540.690.000.20153.62
Rural settlements7.410.011.560.880.0369.040.000.0779.01
Unused land0.000.000.000.350.000.000.000.000.35
Water body9.100.011.060.480.010.030.0027.0837.77
Grand Total307.3501.810463.134471.062150.75499.0960.15964.9131558.277
Note: The bold letters indicate that there is no change in the land use change over the time period.

References

  1. United Nations, Department of Economic and Social Affairs. World Urbanization Prospects: The 2018 Revision; United Nations: New York, NY, USA, 2019. [Google Scholar]
  2. Hu, S.; Fan, Y.; Zhang, T. Assessing the effect of land use change on surface runoff in a rapidly urbanized city: A case study of the central area of Beijing. Land 2020, 9, 17. [Google Scholar] [CrossRef] [Green Version]
  3. Ansari, T.A.; Katpatal, Y.B.; Vasudeo, A.D. Spatial evaluation of impacts of increase in impervious surface area on SCS–CN and runoff in Nagpur urban watersheds, India. Arab. J. Geosci. 2016, 9, 702. [Google Scholar] [CrossRef]
  4. Walsh, C.J.; Fletcher, T.D.; Burns, M.J. Urban stormwater runoff: A new class of environmental flow problem. PLoS ONE 2012, 7, e45814. [Google Scholar] [CrossRef] [Green Version]
  5. Gill, S.E.; Handley, J.F.; Ennos, A.R.; Pauleit, S. Adapting cities for climate change: The role of the green infrastructure. Built Environ. 2007, 33, 115–133. [Google Scholar] [CrossRef] [Green Version]
  6. Marelle, L.; Myhre, G.; Steensen, B.M.; Hodnebrog, O.; Alterskjaer, K.; Sillmann, J. Urbanization in megacities increases the frequency of extreme precipitation events far more than their intensity. Environ. Res. Lett. 2020, 15, 124072. [Google Scholar]
  7. Astuti, I.S.; Sahoo, K.; Milewski, A.; Mishra, D.R. Impact of land use land cover (LULC) change on surface runoff in an increasingly urbanized tropical watershed. Water Resour. Manag. 2019, 33, 4087–4103. [Google Scholar] [CrossRef]
  8. Shi, P.-J.; Yuan, Y.; Zheng, J.; Wang, J.-A.; Ge, Y.; Qiu, G.-Y. The effect of land use/cover change on surface runoff in Shenzhen region, China. Catena 2007, 69, 31–35. [Google Scholar] [CrossRef]
  9. Fletcher, T.D.; Andrieu, H.; Hamel, P. Understanding, management and modelling of urban hydrology and its consequences for receiving waters: A state of the art. Adv. Water Resour. 2013, 51, 261–279. [Google Scholar] [CrossRef]
  10. McGrane, S.J. Impacts of urbanisation on hydrological and water quality dynamics, and urban water management: A review. Hydrol. Sci. J. 2016, 61, 2295–2311. [Google Scholar] [CrossRef]
  11. Oudin, L.; Salavati, B.; Furusho-Percot, C.; Ribstein, P.; Saadi, M. Hydrological impacts of urbanization at the catchment scale. J. Hydrol. 2018, 559, 774–786. [Google Scholar] [CrossRef] [Green Version]
  12. Weng, Q. Modeling urban growth effects on surface runoff with the integration of remote sensing and GIS. Environ. Manag. 2001, 28, 737–748. [Google Scholar] [CrossRef]
  13. Suriya, S.; Mudgal, B.V. Impact of urbanization on flooding: The Thirusoolam sub watershed—A case study. J. Hydrol. 2012, 412, 210–219. [Google Scholar] [CrossRef]
  14. Vojtek, M.; Vojteková, J. Land use change and its impact on surface runoff from small basins: A case of Radiša basin. Folia Geogr. 2019, 61, 104. [Google Scholar]
  15. Ruisong, Q.; Min, L.; Lijun, H.; Min, L.; Lijia, Z.; Dongni, O.; Shiyuan, X.; Lizhong, Y. Impact of Land Use Dynamic Change on Surface Runoff: A Case Study on Shanghai Pudong New District. J. Catastrophol. 2009, 1, 44–49. [Google Scholar]
  16. Sajikumar, N.; Remya, R.S. Impact of land cover and land use change on runoff characteristics. J. Environ. Manag. 2015, 161, 460–468. [Google Scholar] [CrossRef]
  17. Chen, J.; Theller, L.; Gitau, M.W.; Engel, B.A.; Harbor, J.M. Urbanization impacts on surface runoff of the contiguous United States. J. Environ. Manag. 2017, 187, 470–481. [Google Scholar] [CrossRef]
  18. Sjöman, J.D.; Gill, S.E. Residential runoff–The role of spatial density and surface cover, with a case study in the Höjeå river catchment, southern Sweden. Urban For. Urban Green. 2014, 13, 304–314. [Google Scholar] [CrossRef]
  19. Ebrahimian, M. Application of NRCS-curve number method for runoff estimation in a mountainous watershed. Casp. J. Environ. Sci. 2012, 10, 103–114. [Google Scholar]
  20. Xiao, B.; Wang, Q.-H.; Fan, J.; Han, F.-P.; Dai, Q.-H. Application of the SCS–CN Model to Runoff Estimation in a Small Watershed with High Spatial Heterogeneity. Pedosphere 2011, 21, 738–749. [Google Scholar] [CrossRef]
  21. Vojtek, M.; Vojteková, J. GIS-based approach to estimate surface runoff in small catchments: A case study. Quaest. Geogr. 2016, 35, 97–116. [Google Scholar] [CrossRef] [Green Version]
  22. Pandey, A.; Sahu, A. Generation of Curve Number Using Remote Sensing and Geographic Information System. Geospatial World. 2009. Available online: https://www.geospatialworld.net/article/generation-of-curve-number-using-remote-sensing-and-geographic-information-system/ (accessed on 9 August 2021).
  23. Zhan, X.; Huang, M.-L. ArcCN-Runoff: An ArcGIS tool for generating curve number and runoff maps. Environ. Model. Softw. 2004, 19, 875–879. [Google Scholar] [CrossRef]
  24. Shadeed, S.; Almasri, M. Application of GIS-based SCS–CN method in West Bank catchments, Palestine. Water Sci. Eng. 2010, 3, 1–13. [Google Scholar]
  25. Liu, X.; Li, J. Application of SCS model in estimation of runoff from small watershed in Loess Plateau of China. Chin. Geogr. Sci. 2008, 18, 235. [Google Scholar] [CrossRef] [Green Version]
  26. Ozdemir, H.; Elbaşı, E. Benchmarking land use change impacts on direct runoff in ungauged urban watersheds. Phys. Chem. Earth Parts A/B/C 2015, 79, 100–107. [Google Scholar] [CrossRef]
  27. Jahan, K.; Pradhanang, S.M.; Bhuiyan, M.A.E. Surface Runoff Responses to Suburban Growth: An Integration of Remote Sensing, GIS, and Curve Number. Land 2021, 10, 452. [Google Scholar] [CrossRef]
  28. Chatterjee, C.; Jha, R.; Lohani, A.K.; Kumar, R.; Singh, R. Runoff curve number estimation for a basin using remote sensing and GIS. Asia-Pac. Remote Sens. GIS J. 2001, 14, 1–7. [Google Scholar]
  29. NRCS. Urban Hydrology for Small Watersheds-Technical Release 55; US Department of Agriculture Natural Resources Conservation: Washington, DC, USA, 1986. [Google Scholar]
  30. Al-Juaidi, A.E. A simplified GIS-based SCS–CN method for the assessment of land-use change on runoff. Arab. J. Geosci. 2018, 11, 269. [Google Scholar] [CrossRef]
  31. Tang, L.; Zhao, Y.; Yin, K.; Zhao, J. Xiamen. Cities 2013, 31, 615–624. [Google Scholar] [CrossRef]
  32. Bureau, X.S. Xiamen Statistical Yearbook; China Statistic Press: Beijing, China, 2020. [Google Scholar]
  33. Analysis of Xiamen’s Population Data in 2019; China Commercial Industry Research Institute: Xiamen, China, 2020.
  34. Geographical Information Monitoring Cloud Platform. Available online: www.dsac.cn (accessed on 20 January 2020).
  35. Liu, J.; Liu, M.; Tian, H.; Zhuang, D.; Zhang, Z.; Zhang, W.; Tang, X.; Deng, X. Spatial and temporal patterns of China’s cropland during 1990–2000: An analysis based on Landsat TM data. Remote Sens. Environ. 2005, 98, 442–456. [Google Scholar] [CrossRef]
  36. Nanjing Institute of Soil Science, Chinese Academy of Sciences. Soil Science Database. Available online: vdb3.soil.csdb.cn (accessed on 23 March 2020).
  37. Chenyao, X. Hydrological Response Mechanism and Simulations of a Sponge City Residential Block. Master’s Thesis, Chinese Institute of Water Resources and Hydropower Research, Beijing, China, April 2018. [Google Scholar]
  38. Sharma, K.; Singh, S. Runoff estimation using Landsat Thematic Mapper data and the SCS model. Hydrol. Sci. J. 1992, 37, 39–52. [Google Scholar] [CrossRef]
  39. Krajewski, A.; Sikorska-Senoner, A.E.; Hejduk, A.; Hejduk, L. Variability of the Initial Abstraction Ratio in an urban and an agroforested catchment. Water 2020, 12, 415. [Google Scholar] [CrossRef] [Green Version]
  40. Zhu, W.; Sun, Q.; Li, F.; Gao, Y.; Zhang, L. Assessment of the Effect of Urban Green Space Landscape on Reduction of Storm Water Runoff in Xiamen City. Res. Environ. Sci. 2019, 32, 74–84. [Google Scholar]
  41. McCuen, R.H. A Guide to Hydrologic Analysis Using SCS Methods; Prentice-Hall, Inc.: Hoboken, NJ, USA, 1982. [Google Scholar]
  42. Meixia, L. Study on Rainstorm Water Logging Disaster Risk Base on the Construction of Sponge City: A Case Study of Xiamen. Master’s Thesis, Xi’an University of Science and Technology, Xi’an, China, June 2017. [Google Scholar]
  43. Rawat, K.S.; Singh, S.K. Estimation of Surface Runoff from Semi-arid Ungauged Agricultural Watershed Using SCS–CN Method and Earth Observation Data Sets. Water Conserv. Sci. Eng. 2017, 1, 233–247. [Google Scholar] [CrossRef]
  44. Al-Ghobari, H.; Dewidar, A.; Alataway, A. Estimation of Surface Water Runoff for a Semi-Arid Area Using RS and GIS-Based SCS–CN Method. Water 2020, 12, 1924. [Google Scholar] [CrossRef]
  45. Quan, B.; Chen, J.-F.; Qiu, H.-L.; RÖMkens, M.J.M.; Yang, X.-Q.; Jiang, S.-F.; Li, B.-C. Spatial-Temporal Pattern and Driving Forces of Land Use Changes in Xiamen1 1Project supported by the Fujian Provincial Natural Science Foundation of China (No. D0210010). Pedosphere 2006, 16, 477–488. [Google Scholar] [CrossRef]
  46. Cui, S.; Ding, S.; Li, X.; Tang, J.-X.; Li, F.; Shen, Y. Dynamic analysis of land exploitation in Maluan bay during 1957–2017. J. Oceanogr. 2019, 30, 131–139. [Google Scholar]
  47. Ali, M.; Khan, S.J.; Aslam, I.; Khan, Z. Simulation of the impacts of land-use change on surface runoff of Lai Nullah Basin in Islamabad, Pakistan. Landsc. Urban Plan. 2011, 102, 271–279. [Google Scholar] [CrossRef]
  48. Gajbhiye, S.; Mishra, S. Application of NRSC-SCS curve number model in runoff estimation using RS & GIS. In Proceedings of the IEEE-International Conference on Advances in Engineering, Science and Management (ICAESM-2012), Nagapattinam, India, 30–31 March 2012; pp. 346–352. [Google Scholar]
  49. Zhou, F.; Xu, Y.; Chen, Y.; Xu, C.-Y.; Gao, Y.; Du, J. Hydrological response to urbanization at different spatio-temporal scales simulated by coupling of CLUE-S and the SWAT model in the Yangtze River Delta region. J. Hydrol. 2013, 485, 113–125. [Google Scholar] [CrossRef]
  50. Shrestha, M.N. Spatially distributed hydrological modelling considering land-use changes using remote sensing and GIS. In Proceedings of the Map Asia Conference, Singapore, 18–20 August 2009; pp. 1–8. [Google Scholar]
  51. Sheng, L. Study on the Information Extraction of the Urban Heat Island, Run-Off and Impervious Surface in Xiamen City of SE China with Remote Sensing Technology. Master’s Thesis, Fujian University, Fuzhou, China, December 2005. [Google Scholar]
Figure 1. Location of study area with administrative boundary and catchment divisions.
Land 10 00839 g001
Figure 2. Flowchart showing the methodology of the study.
Land 10 00839 g002
Figure 3. Soil type and hydrological soil group in Xiamen.
Land 10 00839 g003
Figure 4. Land use maps of Xiamen in 1980, 1990, 2005, and 2015.
Land 10 00839 g004
Figure 5. Transfer process of land use type during 1980–2015.
Land 10 00839 g005
Figure 6. Surface runoff depth in Xiamen from 1980 to 2015.
Land 10 00839 g006
Figure 7. Average surface runoff depth Q (mm) and runoff coefficient (RC) under the return period of 5, 10, 20, and 50 years under the land use conditions of 1980, 1990, 2005, and 2015.
Land 10 00839 g007
Figure 8. Runoff depth across different land use types.
Land 10 00839 g008
Figure 9. Relationship between rainfall and SCS–CN runoff.
Land 10 00839 g009
Figure 10. Observed and simulated annual flow from 1981 to 2015.
Land 10 00839 g010
Table 1. Land use classes and their description.
Land UseDescription
FarmlandAreas for growing crops, mainly including paddy fields and arable lands for vegetable farming, with or without regular irrigation facilities. It includes farmland where rice and dry land crops are rotated.
WoodlandAreas referring to forestry land for growing trees, shrubs, bamboos, and coastal mangroves, including trees and shrubs with canopy density more than 30%.
GrasslandAreas of all kinds of grassland, mainly with herbaceous plants covering more than 5%, including shrub grassland with grassland and canopy density.
WaterAreas of natural land waters and water conservancy facilities, including natural and artificial river canals, lakes, and reservoir ponds.
Coastal wetlandsAreas of tidal flats and beach lands, including lands near water level of the rivers and lakes.
Built-up landUrban land refers to land in large, medium, and small cities, residential areas, and built-up areas above county towns. It also includes construction sites such as factories and mines, large-scale industrial areas, oil fields, salt fields, and quarries, as well as roads, airports, and special sites.
Rural settlementsRefers to rural settlements independent of cities and towns.
Unused landAreas of bare land, lands covered with gravel, sand, rocks, and saline-alkali and marsh lands. Generally, vegetation coverage is less than 5%.
Table 2. Rainfall depth for 24 h maximum daily rainfall in different return periods.
Return period (years)5102050
Rainfall (mm)194.3237.7280.1335.3
Source: Xiamen Meteorological Bureau.
Table 3. CN numbers for corresponding land use types.
SNLand Use and Cover TypeHydrological Soil Group Type
BCD
1.Farmland717881
2.Forestland587279
3.Grassland567077
4.Water Body100100100
5.Coastal wetlands899395
6.Built-up land989898
7.Rural settlements717983
8.Unused land869194
Table 4. Statistical indices used for model validity.
CoefficientDescriptionOptimal Value
Percent bias (PBIAS)measures the average tendency of the simulated values to be larger or smaller than their observed ones. 0—Optimal,
Negative—underestimation,
Positive—overestimation
Nash-Sutcliffe efficiency (NSE)a normalised statistic that calculates the relative magnitude of the simulated flow variance compared to the observed flow variance.NSE = 1—perfect match,
NSE = 0—model predictions accurate as the mean of the observed data,
−Inf < NSE < 0—observed mean is a better predictor than the model
Correlation coefficient (r)statistical measure of the strength of the relationship between the relative movements of simulated and observed flow.Ranges from −1 to 1
−1—perfect negative correlation
1–perfect positive correlation
0—no correlation
Volumetric efficiency (VE)represents the fraction of water delivered at the proper time−Inf ≤ VE ≤ 1
close to 1—efficient
Table 5. Changes in surface runoff at different stages under rainfall return periods of 5, 10, 20, and 50 years.
Return PeriodTime PeriodAmount of Runoff Change (ΔQ) mmPercent Change in Runoff (ΔC) %Δα
5 years1980–19901.010.860.005
1990–200512.5710.630.065
2005–20156.154.700.032
10 years1980–19901.130.720.005
1990–200513.678.680.058
2005–20156.623.870.028
20 years1980–19901.220.630.004
1990–200514.507.370.052
2005–20156.973.300.025
50 years1980–19901.320.530.004
1990–200515.336.160.046
2005–20157.322.770.022
Table 6. Relationship between land use and surface runoff under rainfall return period of 50 years. t—t-statistic, pp-value, and R2—Pearson’s correlation coefficient. Areas in square kilometres.
FarmlandForestlandGrasslandWater BodyCoastal WetlandsBuilt-Up LandRural SettlementsUnused LandRunoff (Q50)
1980681.14494.87153.7837.8448.5662.8579.380136.96
1990667.2486.48153.4862.027.793.5188.20177.77
2005540.02474.01151.8267.942.46191.8393.220218.28
2015462.94470.94150.9164.991.91307.5499.460.18271.62
t−5.3587−4.9696−5.78721.77715−1.91977.69058.7342.0111-
p0.033110.038190.028580.21850.19490.016490.012860.182-
R2−0.97−0.96−0.970.78−0.810.980.990.82-
Publisher’s Note: MDPI stays neutral with regard to jurisdictional claims in published maps and institutional affiliations.

