Article

Communities’ Adaptation and Vulnerability to Climate Change: Implications for Achieving a Climate-Smart Landscape

1
Tropenbos Indonesia, Jl. Akasia I Blok P-I No. 6 Tanah Sareal, Bogor 16163, Indonesia
2
Tropenbos International, 6717 LT Ede, The Netherlands
*
Author to whom correspondence should be addressed.
Land 2021, 10(8), 816; https://doi.org/10.3390/land10080816
Submission received: 11 June 2021 / Revised: 18 July 2021 / Accepted: 20 July 2021 / Published: 3 August 2021
(This article belongs to the Special Issue Resilient Landscapes for Sustainable Trade and Development)

Abstract

:
Rural landscapes in many parts of Indonesia are rapidly being transformed, due to the expansion of agrocommodity plantations—oil palm in particular. At the same time, communities in those landscapes face declining crop yields and ecosystem degradation as a result of both climate and non-climate factors. We assessed local perceptions on climate stressors, adaptation and vulnerability using focus group discussions in Ketapang, West Kalimantan. We found that the main perceived climatic stressors were extreme and unpredictable seasons, fires, and saltwater intrusion, affecting ecosystem services and agricultural production. Land clearing and forest loss were mentioned as exacerbating non-climatic stressors. Respondents indicated willingness to adapt to these changes by investing in long-term measures, such as tree-planting. To adapt to yield declines, respondents indicated that many farmers shifted from rubber to oil palm. Such adaptation actions benefit households in the short term but may be at odds with long-term adaptation objectives at the landscape level. Finally, we found that perceptions about vulnerability differed between landscapes, and between communities at the landscape level and stakeholders at the district level. This stresses the importance of participatory and inclusive planning and multi-stakeholder processes towards context-based climate action planning to accommodate the differences in contexts and scale, and to reconcile the differences in perceptions.

1. Introduction

1.1. Climate Change Impacts in the Rural Tropics

People living in tropical rural landscapes are particularly vulnerable to the effects of climate change, because they depend directly on agriculture and natural resources for their livelihoods [1,2,3] and live in countries with increased risk of daily temperature extremes [4]. Climate hazards directly impact their livelihoods through various aspects of agricultural production and food provision [5,6,7,8,9]. Climate change also impacts ecosystems [10]: for example, through impacts on their biodiversity [11,12], on provisioning ecosystem services [13], as well as on their ability to provide regulating services, such as prevention of soil erosion [14]. Interplays between climate and non-climate factors have the potential to create even greater adverse impacts. Land-use change can be a major exacerbating factor for climate stressors—for example, where monocultures replace diverse ecosystems, resulting in reduced biodiversity [15,16,17], and amplify the effects of higher temperature and drier air [18,19]. For rural populations, other non-climate stressors that interact with climate change may encompass issues such as food insecurity and poverty, and even a wider range of stressors, such as market and institutional failures [1,8,20].

1.2. Towards Climate-Smart Landscapes for Mitigation and Adaptation

Due to the effects of climate change, Indonesia is predicted to be subject to higher temperatures, less frequent but more intense extreme rainfall events, and more frequent dry periods. Impacts are expected to vary greatly, but insufficient data are available to be able to perform regionalized climate change impact projections. At the same time, many adaptation initiatives are being implemented. A large proportion of these lack local impact and vulnerability assessments and are not oriented towards resolving locally relevant expected impacts [21].
Adaptation to and mitigation of climate change need to be addressed in an integrated manner [22], and integrated landscape management offers good opportunities for that [8,23]. This has been receiving growing recognition and it has given rise to the concept of the climate-smart landscape, which simultaneously supports carbon sequestration and increases people’s adaptive capacity and food security in the face of unavoidable climate change [24,25,26]. A key strategy to achieve climate-smart rural landscapes in the forested tropics is the deliberate management of trees and forests, as this offers opportunities for synergies between mitigation and adaptation [27,28]. Climate-smart rural landscapes typically combine a variety of agricultural fields, agroforests and natural forests, to deliver multiple functions [27,28]. They maintain or enhance carbon stocks and thus provide long-term mitigation benefits, while also providing immediate adaptation benefits, decreasing the vulnerability and increasing the resilience of local populations to climate change [27,28].

1.3. Assessing Local Perceptions on Vulnerability and Adaptation

In recent years, an increasing number of integrated landscape initiatives have emerged, aiming to contribute to mitigation and adaptation objectives at the landscape level, alongside other conservation and development goals [29]. To be successful and to strengthen the resilience of landscapes, however, such integrated landscape initiatives need greater insights on the relation between international and national climates and development objectives on the one hand, and the locally perceived needs for adaptation and development on the other.
The way rural communities adapt to climate change and hazards is influenced not only by their existing adaptive capacities [30], but also by their perceptions of climate change or variability [31,32,33]. Communities’ perceived vulnerabilities are the result of their past experiences, communication, and peer exchange [7], although they may not automatically lead to corresponding adaptation strategies [33,34,35]. The uptake of adaptation strategies by communities is influenced by whether they accept them as addressing the perceived vulnerabilities [36]. Therefore, a better understanding of how people perceive their vulnerabilities is key to shape further adaptation strategies and actions, e.g., by government and other external programmes [7,33,34,37,38], thus also addressing the reported need to strengthen communities’ adaptive capacities [39].
In this light, we assessed local perceptions related to climate change adaptation and vulnerability in West Kalimantan, Indonesia. The assessment aimed to increase the understanding of: (i) local perceptions of climate hazards and non-climate stressors; (ii) local response strategies to climate stressors; (iii) local perceptions of vulnerability to climate change, and the factors that contribute to that vulnerability. We aimed to pilot a methodology that could be used for other local adaptation and vulnerability studies, as called for by the Indonesian government [21]. Further, the assessment meant to inform the development of climate-smart programmes, ensuring that the intervention strategies build on what people are already doing in the landscapes, aligns with local priorities and helps fill gaps that may exist. To assess whether this last objective was met, we also considered whether the information was relevant, and whether the study provided a worthwhile contribution to existing knowledge. In this article we present the results of the assessment and reflect on the relevance and usefulness of its outcomes.

2. Materials and Methods

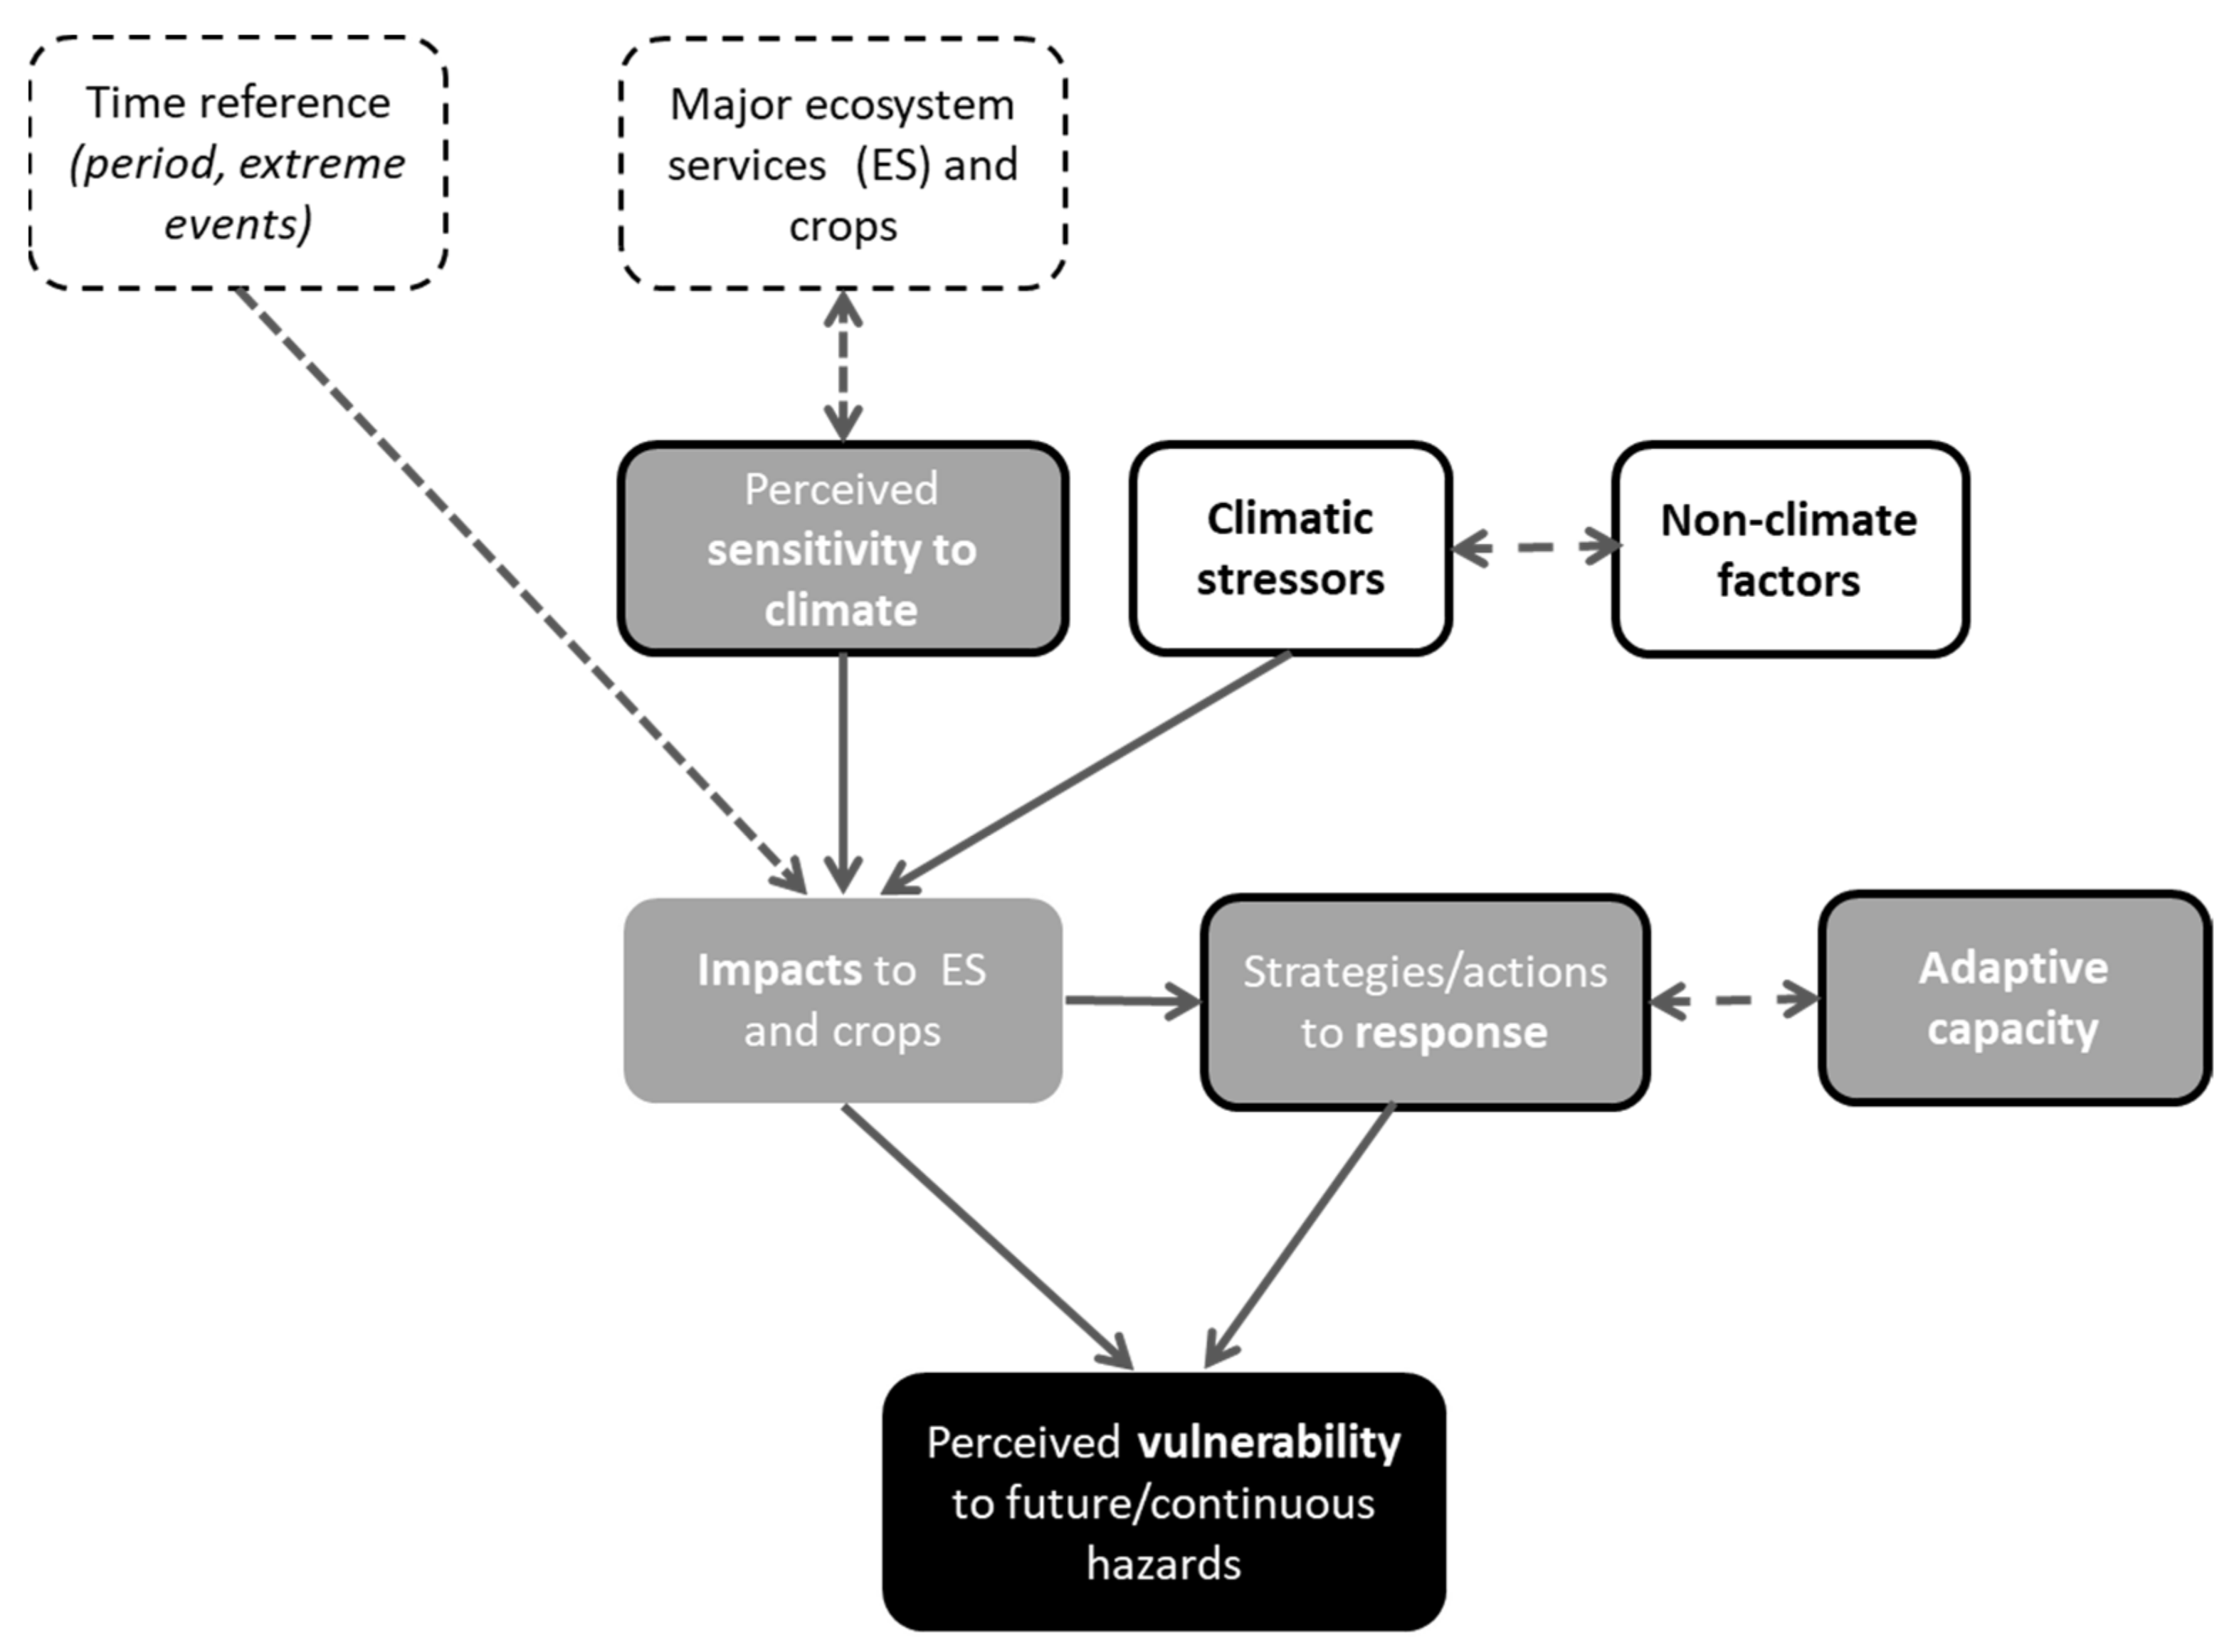
2.1. Conceptual Framework
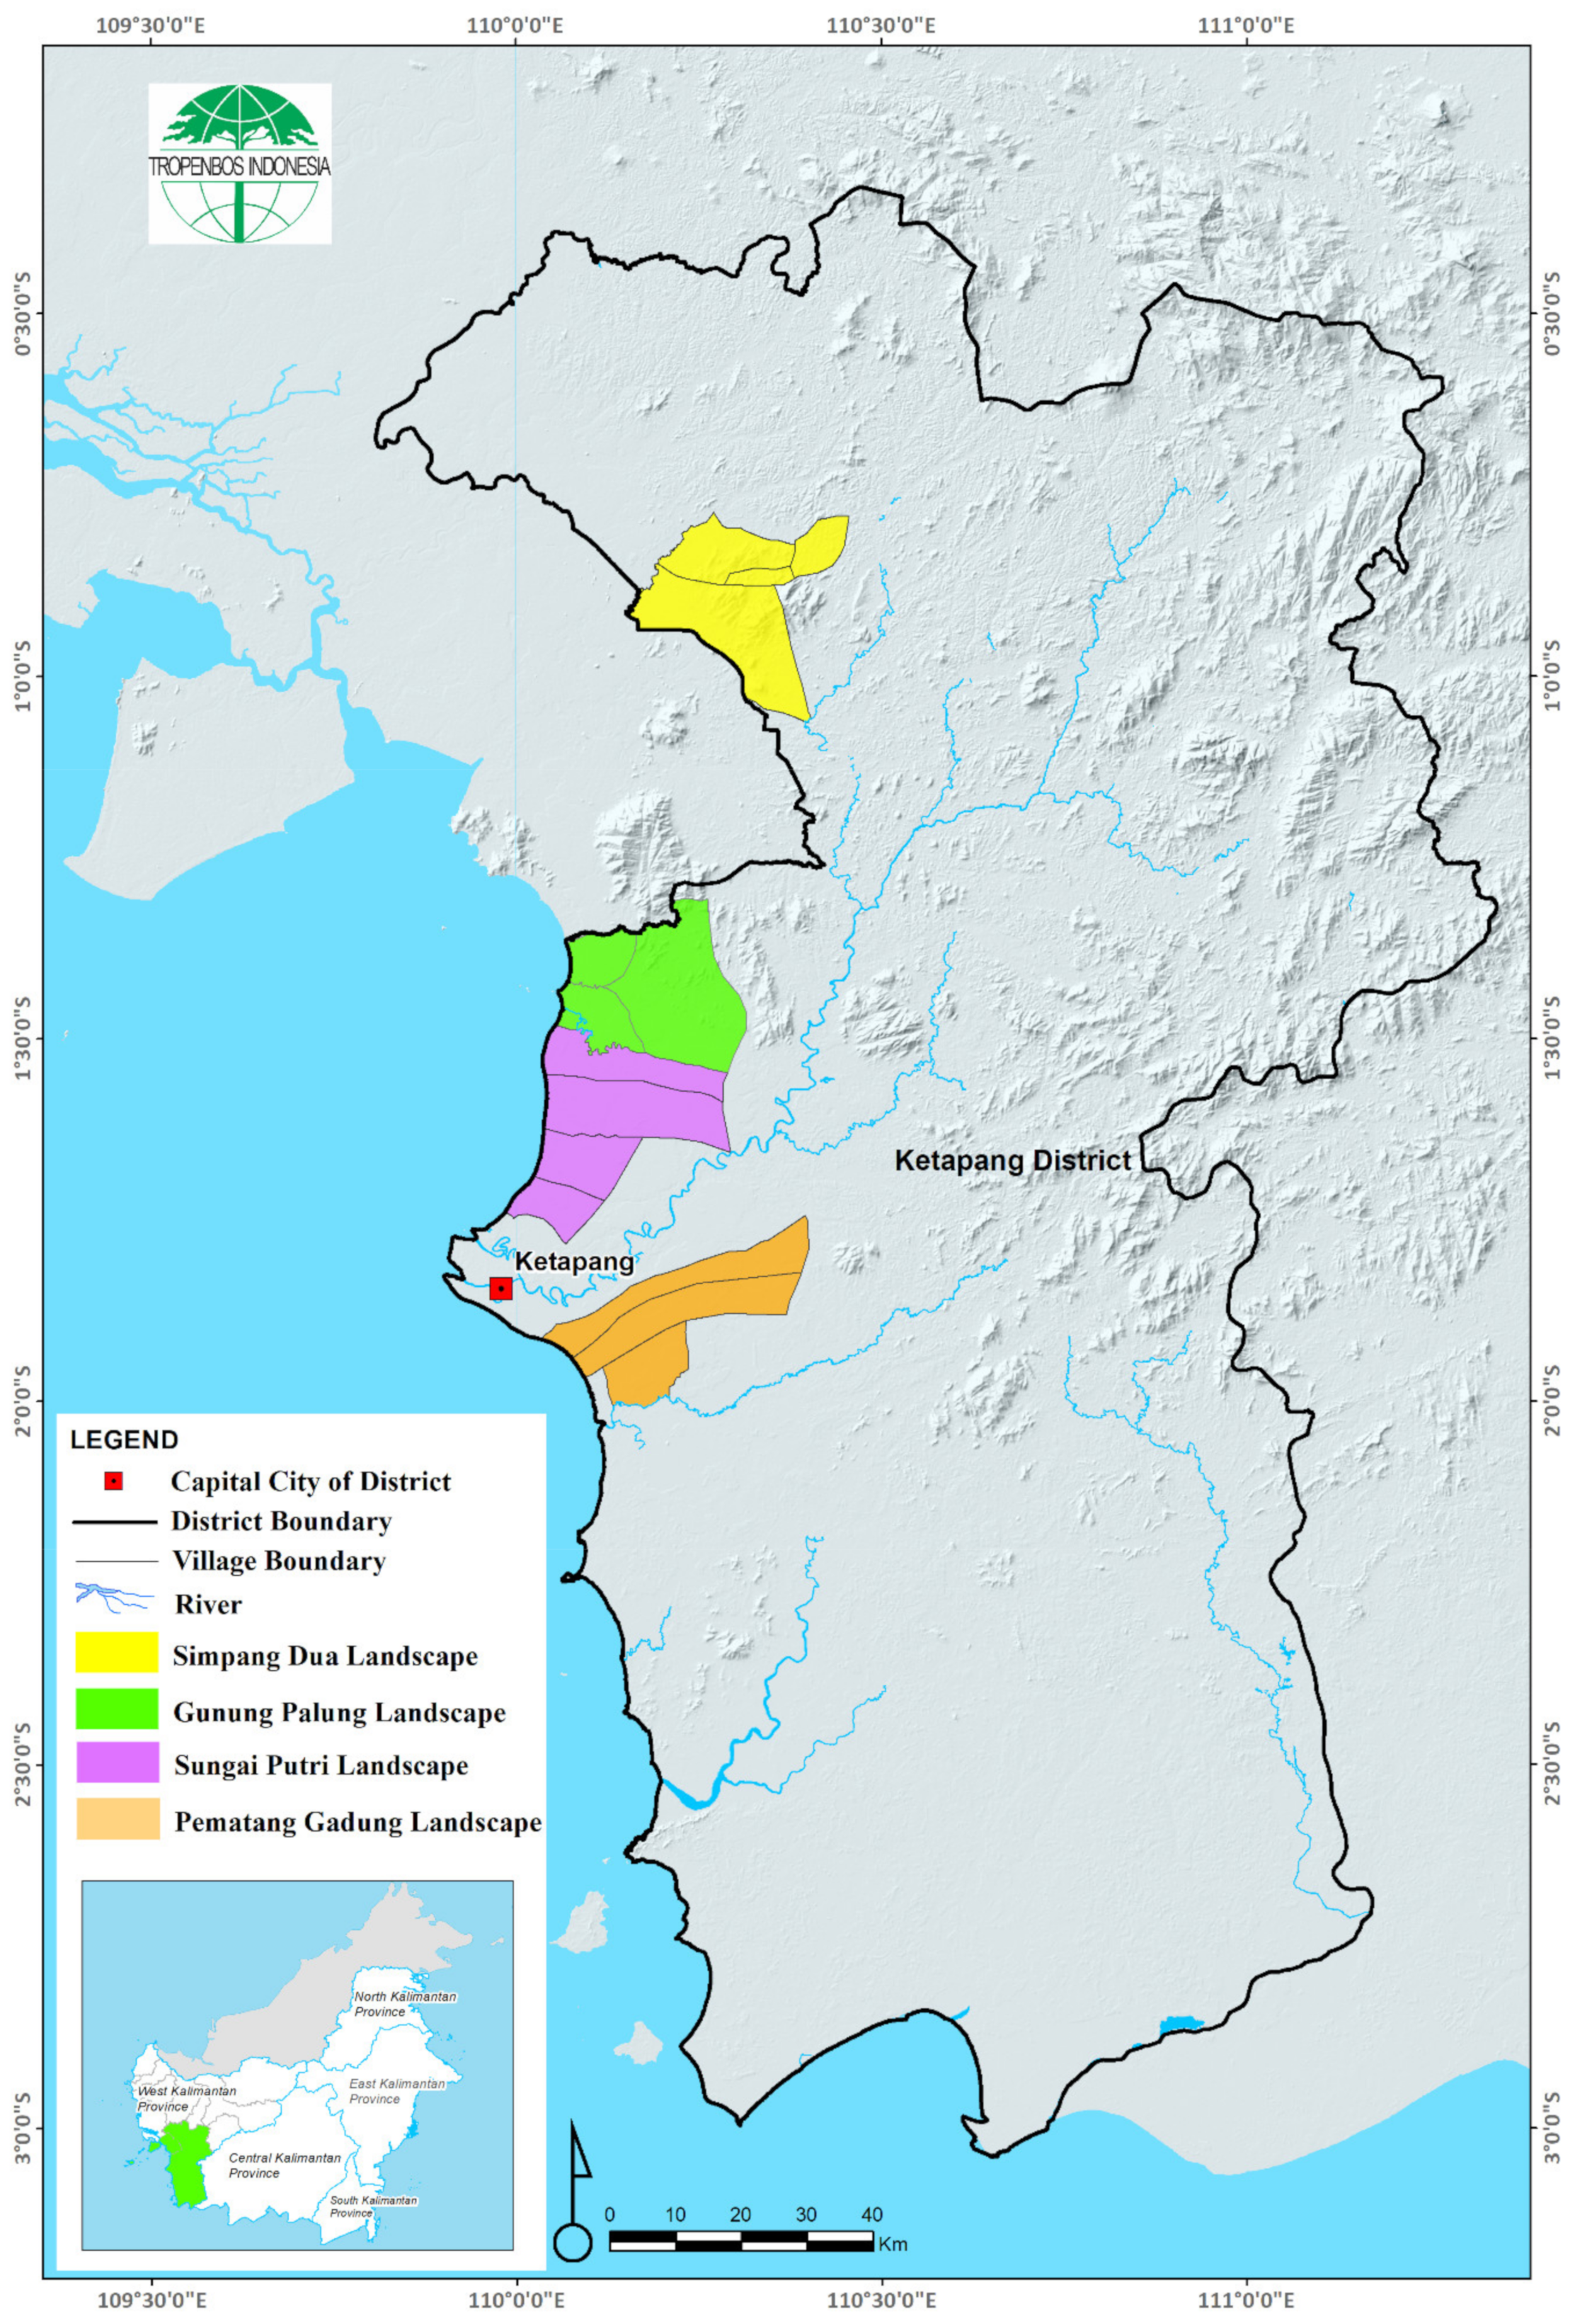
The closely related concepts of adaptation and vulnerability are key to understanding how people and natural systems respond to the effects of climate change, including climate variability and extremes.
Adaptation refers to the process of adjustment of (socioecological) systems to actual or expected changes in the climate and their effects. Adaptation actions aim to moderate the adverse effects of unavoidable climate change and may also include actions to seize new opportunities brought about by climate change. A distinction can be made between ‘incremental adaptation’ and ‘transformational adaptation’ [40]. The former refers to actions that aim to maintain the essence and integrity of an existing technological, institutional, governance or value system (e.g., a farmer who switches to drought-resistant crops, or plants trees to control erosion), while the latter refers to a fundamental change to the system (e.g., a farmer who moves from cropping to livestock, or migrates in search of employment elsewhere) [40]. Adaptation usually starts with incremental changes, but such actions may ultimately not be sufficient in the face of more drastic changes in climate conditions. Often, transformational adaptation may be needed to achieve long-term resilience [41].
Vulnerability of a socioecological system refers to the propensity or predisposition of that system to be adversely affected. The level of vulnerability is influenced by the adaptive capacity, which is the ability (of systems, institutions, humans and other organisms) to adjust to potential damage, to take advantage of opportunities, or to respond to consequences [42]. More adaptive capacity means that a system is more likely to adjust to changes, and thus decrease its vulnerability. In the context of this study, the system refers to the current combination of people and environment in the communities of the study area. Vulnerability also depends on the system’s sensitivity [40]. Sensitivity reflects the degree to which an existing system is affected by climate variability or change. For example, vulnerability in an agricultural system depends on the sensitivity of crop yields to the changing weather, as well as the ability of farmers to adapt to the circumstances, e.g., by switching crops [43]. Furthermore, the 2014 IPCC report [42] incorporates the concept of risk, which refers to the probability of harm to human life or damages due to climate hazards, and therefore depends on exposure to the hazard, the probability of the hazard to occur, and the vulnerability of the system to that hazard.
In this study, we adopt the concept of ‘vulnerability’ to climate hazards as a function of sensitivity and adaptive capacity [40,44]. Although the assessment focused on climate hazards, it also considered other drivers of change in the landscapes. It is often not possible to disentangle the roles of climate and non-climate stressors in influencing people’s actions: i.e., people usually do not adapt to one particular stressor, but to a broad combination of changes [45]. Additionally, climate-related hazards do not only impact livelihoods directly (e.g., by reducing crop yields), but also often exacerbate other, non-climate stressors with further negative outcomes for the livelihoods of poor people (e.g., increased food prices) [43], as well as for ecosystem goods and services [46]. Due to these close interactions, perceived vulnerabilities to climate change may in turn be influenced by non-climate stressors.
We categorized impacts of the hazards and stressors into two groups. The first is the ‘ecosystem service (ES) impact group’ which encompasses all impacts that concern natural goods and services, including provisioning, regulating, cultural and supporting services [47,48,49]. The second is the ‘Agricultural Production (AP) impact group’ which encompasses impacts on communities’ agricultural production and management, both for subsistence use and cash income.

2.2. Study Area

Climate change in Indonesia is already taking place, with an annual temperature increase of between 0.01 and 0.06 °C recorded, and an expected increase of between 0.67 and 1.0 °C predicted by 2035, while average total rainfall is expected to remain similar or increase, but with greater variability between regions in the country and throughout the year. For southern Kalimantan, for example, more intense dry seasons are expected, while throughout Kalimantan the wet seasons are expected to become wetter [21]. Indonesia is affected by climate change in several ways, one of which is the occurrence of forest fires, as the result of a combination of burning practices, more intense ENSO events, and mean temperature increase [50,51,52]. Agricultural-based livelihoods in many parts of the country are also affected by climate stressors [30,53], and are projected to be negatively affected by climate change [54].
While affected by the impacts of climate change, and despite recent successes in curbing deforestation rates [55], Indonesia remains a GHG-emitting country, due to CO2 emissions resulting from deforestation [56,57]. In addition to forest loss, forest and peatland fires associated with forest degradation and plantation development contribute to CO2 emissions, as well as to loss of biodiversity and livelihoods [58,59,60].
The study focusses on Ketapang District (31,588 km2) in West Kalimantan, Indonesia (Figure 1). The district is geographically located between 0°19′26.51″ to 3°4′16.59″ South and 109°47′36.55″ to 111°21′37.36″ East and is dominated by lowland areas at 0–500 m above sea level. The mean annual temperature in Ketapang is 27.2–27.8 °C, and the mean annual rainfall for 2011–2020 was 2985 mm (lowest: 2016 mm; highest: 3970 mm), with the number of wet days ranging from 134 to 265 [61]. Typically, the drier months are July and August, although in some years these can span until September.
Since the 1900s, the native Dayak communities have been managing jungle rubber and tembawang (traditional forest gardens), combining rubber (Hevea brasiliensis) with upland rice and other fruit and timber trees [62]. More recently, Malay and Javanese migrants developed rubber monocultures, especially in the lowland areas, and sometimes located on the edge of peat formations. Being a coastal district, Ketapang also produces copra out of coconut (Cocos nucifera) fields in the coastal villages.
Like in many other areas in Indonesia, West Kalimantan, including Ketapang district, experienced massive logging in the 1980s–1990s. The subsequent decades witnessed rapid and extensive agrocommodity-based development due to the expansion of oil palm (Elaeis guineensis) plantations, often at the expense of forest [56]. Ketapang has been particularly attractive for oil palm companies, as it is a lowland-coastal district with a predominance of flat areas. Moreover, district policies have been favouring license granting to large scale concessions, and the district government started to increasingly allocate large areas for plantation development around 2005–2007 [63]. In 2019, Ketapang had an oil palm area of 645,700 ha, taking up approximately 21% of the district area [64]. It makes Ketapang the district with the largest oil palm area in the province, which is estimated to have around 1.8 million ha [65].
Our case study in Ketapang district focusses on four sub-district landscapes, namely: Simpang Dua, Gunung Palung, Sungai Putri and Pematang Gadung (Figure 1). Each landscape consists of 3–4 villages, and represents characteristics as shown in Table 1.

2.3. Data Collection

We employed Focus Group Discussions (FGD) with communities’ representatives in the four landscapes. To find out how communities’ adaptation strategies and vulnerability levels were evaluated by external stakeholders at a higher administrative level, we conducted one FGD at Ketapang district level. The FGD sessions were structured around two impact groups (ES and AP). In each FGD, participants discussed: (i) the major ecosystem services (for the ES group) and the major crops (for the AP group); (ii) the changes in ecosystem services and crops affecting their livelihoods and the landscapes over a time span agreed on by the FGD participants (e.g., past 15 years); (iii) the climate factors associated with those changes; (iv) the responses to address those impacts (including the limitations and successes of those responses); (v) perceptions on how vulnerable the communities were and what determined the perceived levels of vulnerability. Figure 2 shows the flow diagram that was used to structure the discussions.
Steps (iv) and (v) focused on changes or impacts that are associated wholly or partly to climate factors. Under step (v), for impacts which communities were perceived to be vulnerable to, participants were asked to categorize the levels of vulnerability: low, medium/moderate and high. Subsequently, participants were asked to discuss the main reasons for their perceived levels of vulnerability.
The district level FGD was conducted in November 2019 and was attended by 20 people representing government officers and CSOs/NGOs. The FGDs in the four landscapes were implemented in February 2020, with the participation of 47 people for Pematang Gadung, 47 for Sungai Putri, 40 for Gunung Palung and 21 for Simpang Dua. The participants were representatives of communities at the landscape level, consisting of farmers, customary leaders, community representative groups, women representatives, youth representatives, village authorities and other village community members.

2.4. Data Analyses

To analyse adaptation strategies, we first grouped participants’ answers into six types of response actions (Table 2). These were further categorized into four categories of adaptation strategies: (i) ‘short-term strategies’, which refer to the application of quick solutions to cope with impacts immediately; (ii) ‘longer-term strategies’, which are solutions that are more thorough and long-term oriented, but without changing the livelihood source; (iii) ‘finding alternatives’, which implies alternatives for existing systems/practices; (iv) ‘reliance on government’, which refers to a reliance on external support, mainly from government regulation and programmes (Table 2). These groupings were based on post-survey data analyses. The count of responses mentioned in the FGD became the quantifier for actions and strategies, which we used as indicators of their prevalence, as well as for comparison across landscapes. We also observed and discussed how the response strategies aligned with the categorization of adaptation and resilience [40,68].
To analyse and visualize the perceived vulnerabilities, we converted the vulnerability levels expressed by participants into scores: 1 = not vulnerable, 2 = s lightly vulnerable, 3 = moderately vulnerable, and 4 = highly vulnerable. Average scores were applied to obtain scores of combined crops, i.e., food crops and tree cash crops, and at the landscape level. The explanation provided by participants on the reasons of their perceived vulnerability levels were analysed and categorized into ‘sensitivity’ and ‘adaptive capacity’, as the two main factors determining vulnerability [40,44]. In some cases, participants identified both factors.

3. Results

3.1. Climate and Non-Climate Stressors and Impacts on the Landscapes

There were eight impacts identified from all the FGDs in the four landscapes: four under the Ecosystem Service (ES) impact group and four under the Agricultural Production (AP) impact group (Table 3). Some of the impacts were identified in all four landscapes, while some others were not. Therefore, in all, there were 13 counts of impacts under the ES group and 12 counts of impacts under the AP group (Table 3). The major climate stressors identified by the communities were extreme and erratic seasons, including high rainfall and droughts, which affect the timing of the planting season and other farm management activities. In addition, fire, which frequently occurs during the dry season, was mentioned as a major stressor, especially in the peat landscapes. For coastal villages, sea water rise was also mentioned as an issue for coastal farming.
Aside from the major crops mentioned in the table, a number of other crops were identified as important for livelihoods but were not perceived to be affected by climate stressors. These included fruits, such as durian (Durio zibethinus), jengkol (Archidendron pauciflorum) and langsat (Lansium domesticum) in Simpang Dua, and clementine (Citrus reticulata) in the lowland-coastal landscapes. Next to that, oil palm was brought up as a key crop that was not affected by climate stressors. Oil palm occurs in all landscapes but is most prominent in Pematang Gadung and Gunung Palung. The presence of large-scale oil palm companies in these landscapes have created opportunities for villagers to work on large-scale plantations as labourers, or to start cultivating oil palm themselves.
Participants also identified several non-climate factors that amplified the various adverse climate-related impacts in the landscapes. In the ES impact group, these factors included logging, mining, and forest clearing for large-scale plantations, and unsustainable forest product harvesting. In the AP impact group, they included pests and diseases, newly introduced rice varieties that are more vulnerable to pests and diseases, peat water intrusion, and decreasing soil fertility.

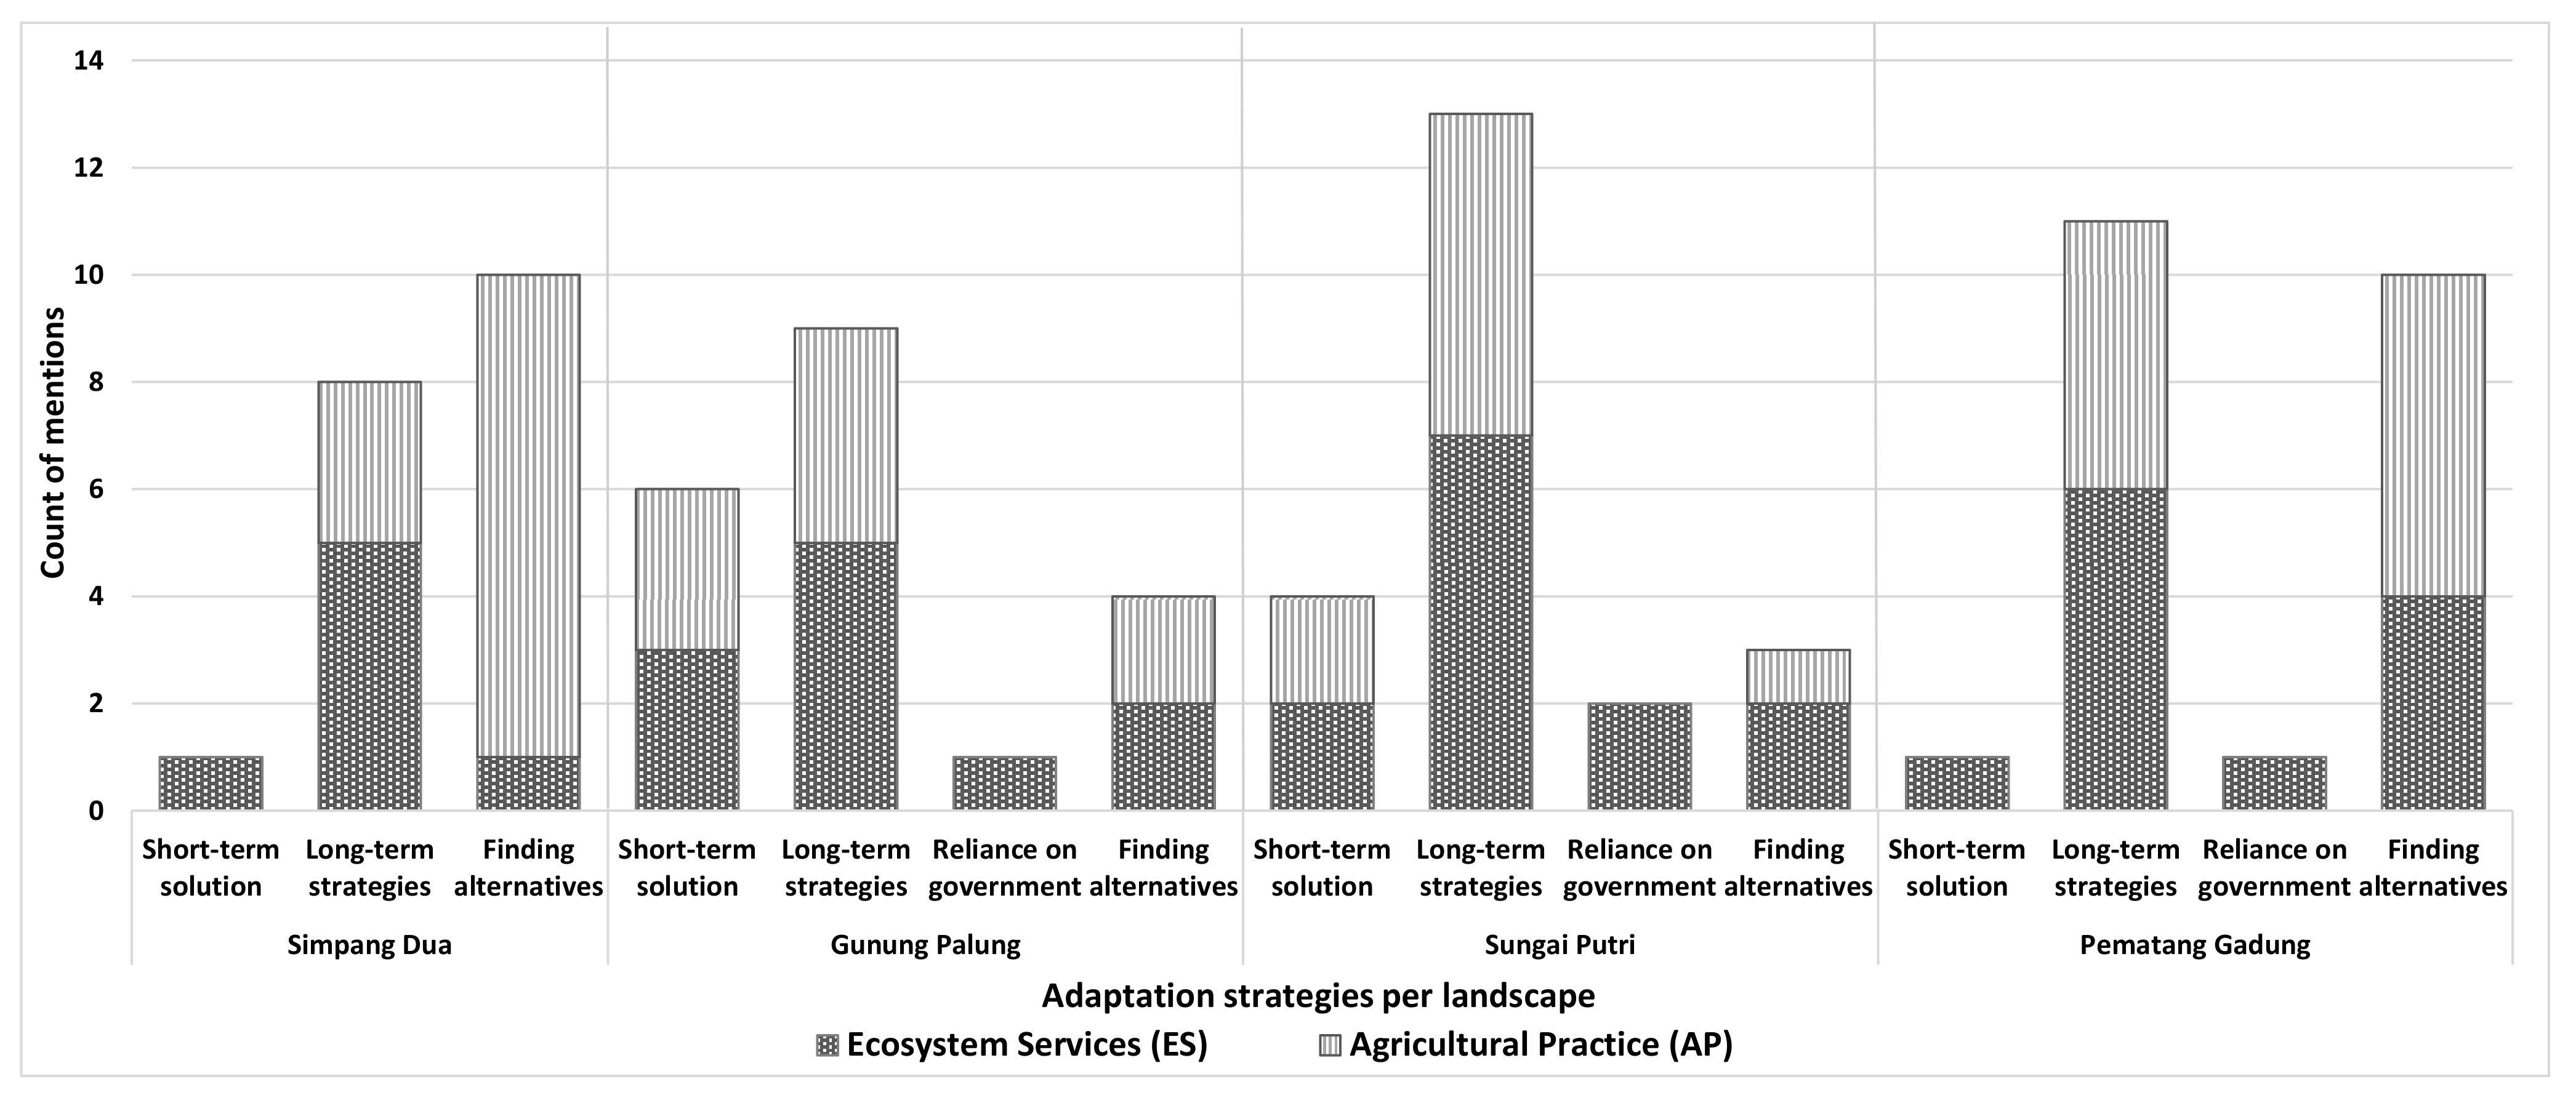
3.2. Response Actions at the Landscape Level

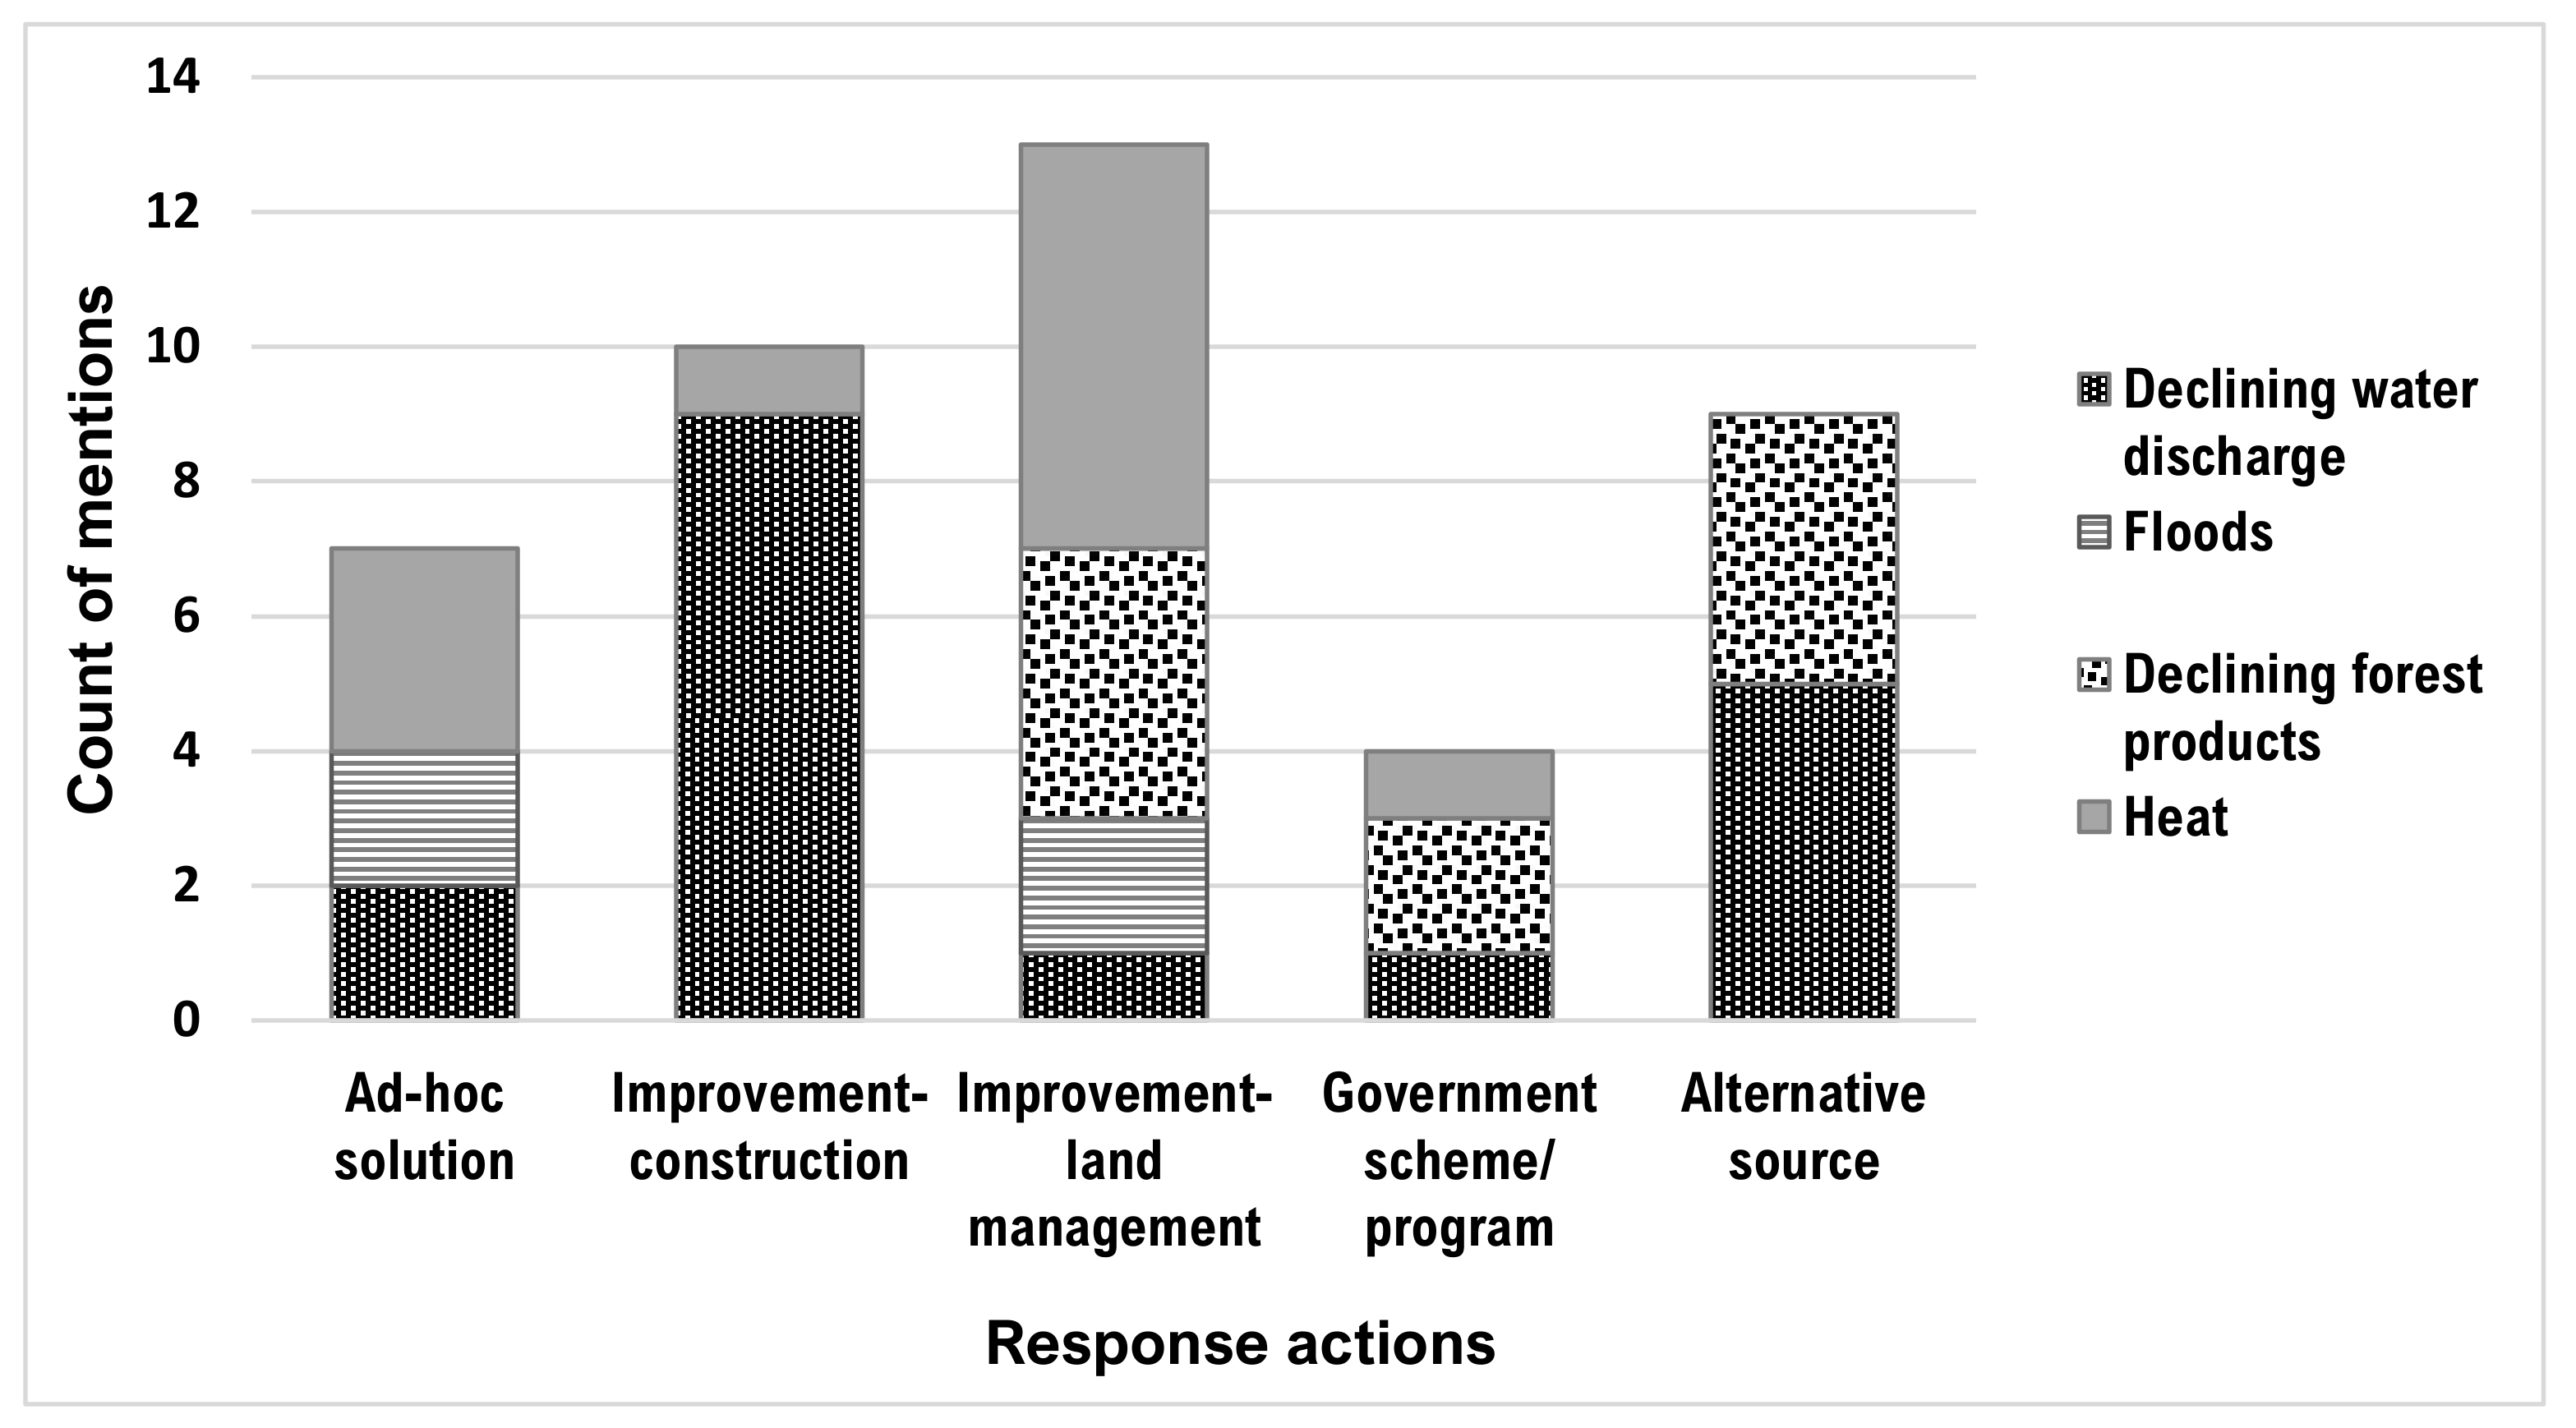
3.2.1. Response Actions for Impacts on Ecosystem Services (ES)

In the ES impact group, dominant response actions in all the landscapes were related to the improvement of forest and land management (Figure 3). This particularly referred to tree planting, either in the forest, in their own farmlands, or around the settlement areas. Participants considered tree-planting as an important action in response to heat, and declining forest products, mainly timber. In addition, this action was also taken to reduce the risk of floods and improve water discharge (Figure 3).
Improvement of construction was the second most frequent response. This was primarily to address the decline of water discharge, by constructing pipes, wells and water reservoirs. In some landscapes, communities tried to find alternative sources when ES around them were declining, such as rubber trees as an alternative for timber, and rainwater and river water as alternatives for spring water.

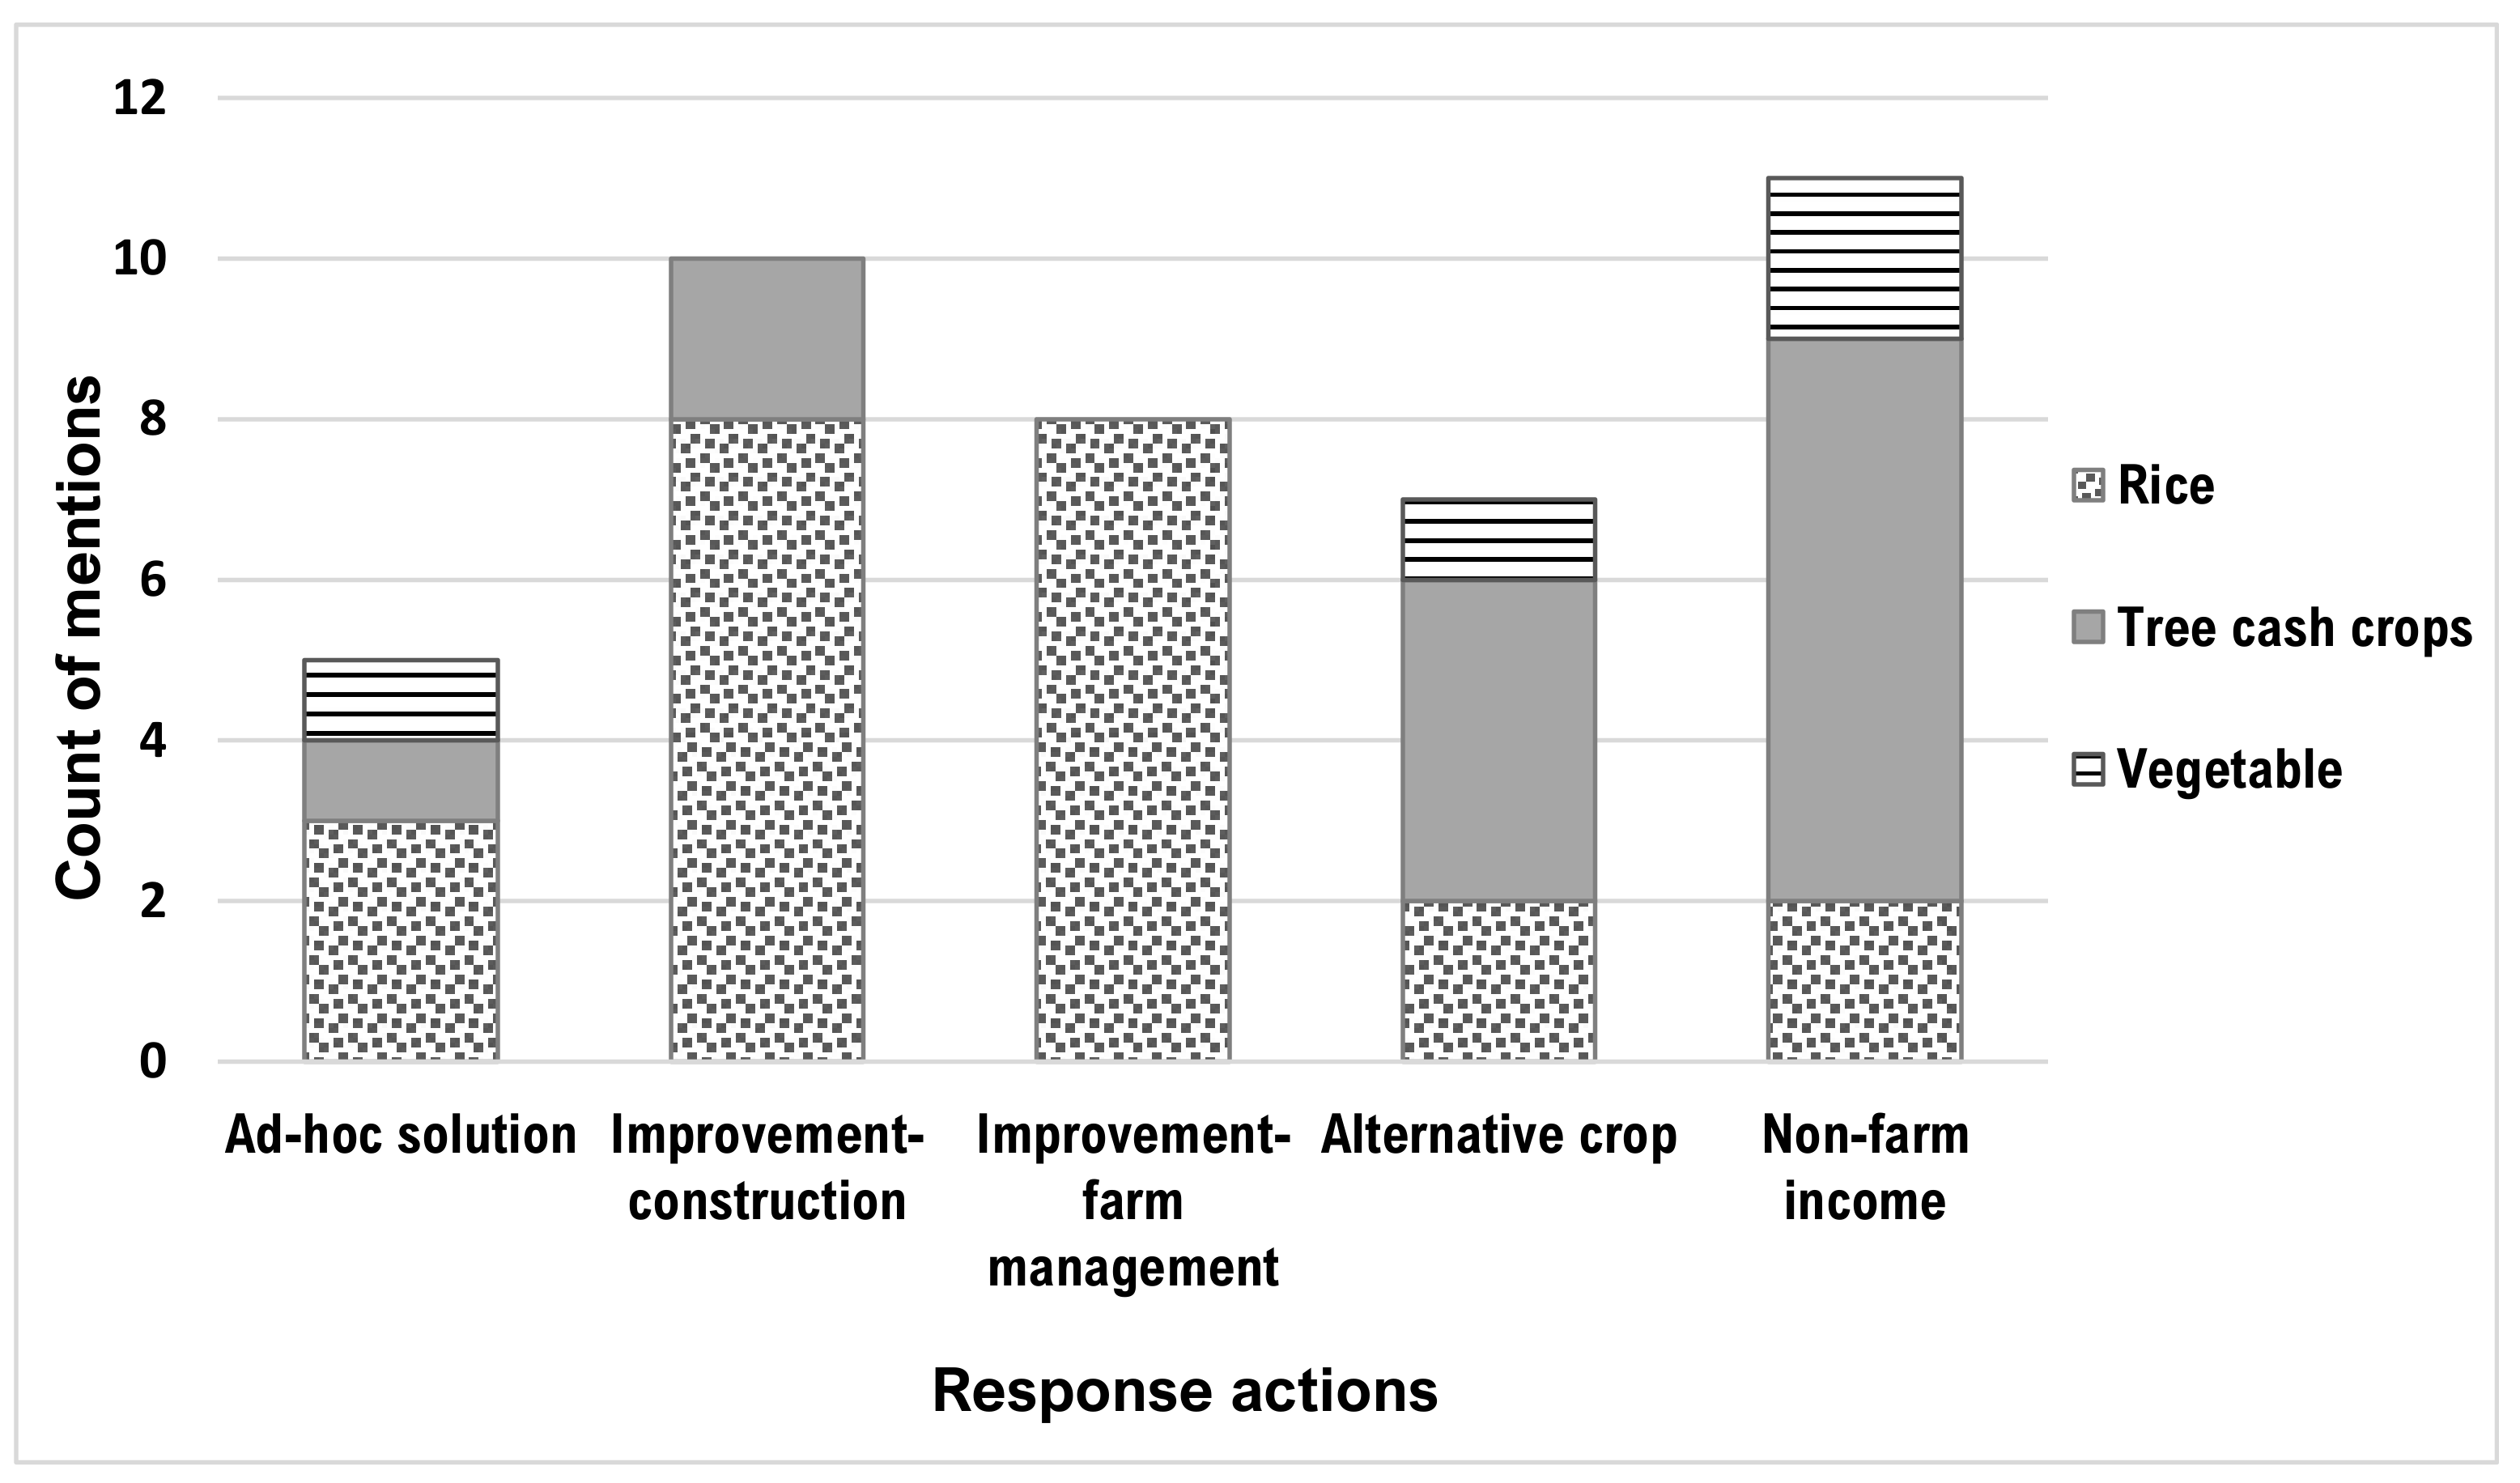
3.2.2. Response Actions for Impacts on Agricultural Production (AP)

In the AP impact group, finding non-farm income was indicated as the most important action in response to the production decline of important cash crops such as rubber and coconut (Figure 4). This was not only in response to declined yields, but also in reaction to plunges in rubber and copra prices, which resulted in a lack of interest in improving the production. The most important non-farm income options were wage labour for communities close to large-scale oil palm plantations, and the harvesting of non-timber forest products for communities close to forest and forest-gardens areas.
Improving existing constructions was the second most frequent response action, mainly in irrigation systems to address water issues for rice production. Rice farmers also engaged in various improvements in farm management, such as adjusting planting time to the unpredictable start of the rainy season or applying pest and disease control. Planting alternative crops in their own lands, oil palm in particular, is common for tree cash crop farmers. This was most common in landscapes with oil palm plantations in the vicinity, where some villagers worked in those plantations, and where there were markets and infrastructure for selling and processing the fruit bunches.

3.2.3. Adaptation Strategies by Landscape

Comparisons between the four landscapes, and with respect to both impact groups (AP and ES), show that long-term strategies were most often mentioned by FGD participants in Sungai Putri and Pematang Gadung (Figure 5). Long-term adaptation was particularly dominant in Sungai Putri, where communities depend mostly on rice cultivation and coconut farming. Here, long-term adaptation strategies focused on constructing water ditches to address saltwater intrusion in the rice fields and in the coconut gardens. There were no oil palm plantations close to the villages, which meant there were fewer options for people to find alternative income as wage laborers. These communities are not forest-dependent, despite the vast peat swamp forest at the back of their villages. Finding alternative income was most dominant in Simpang Dua because communities had access to and had been managing the forests and forest-gardens for non-timber forest products. In addition, they could also work as wage labourers in the oil palm plantations near their villages. Simpang Dua is the only landscape where communities did not refer to reliance on government as one of the strategies.

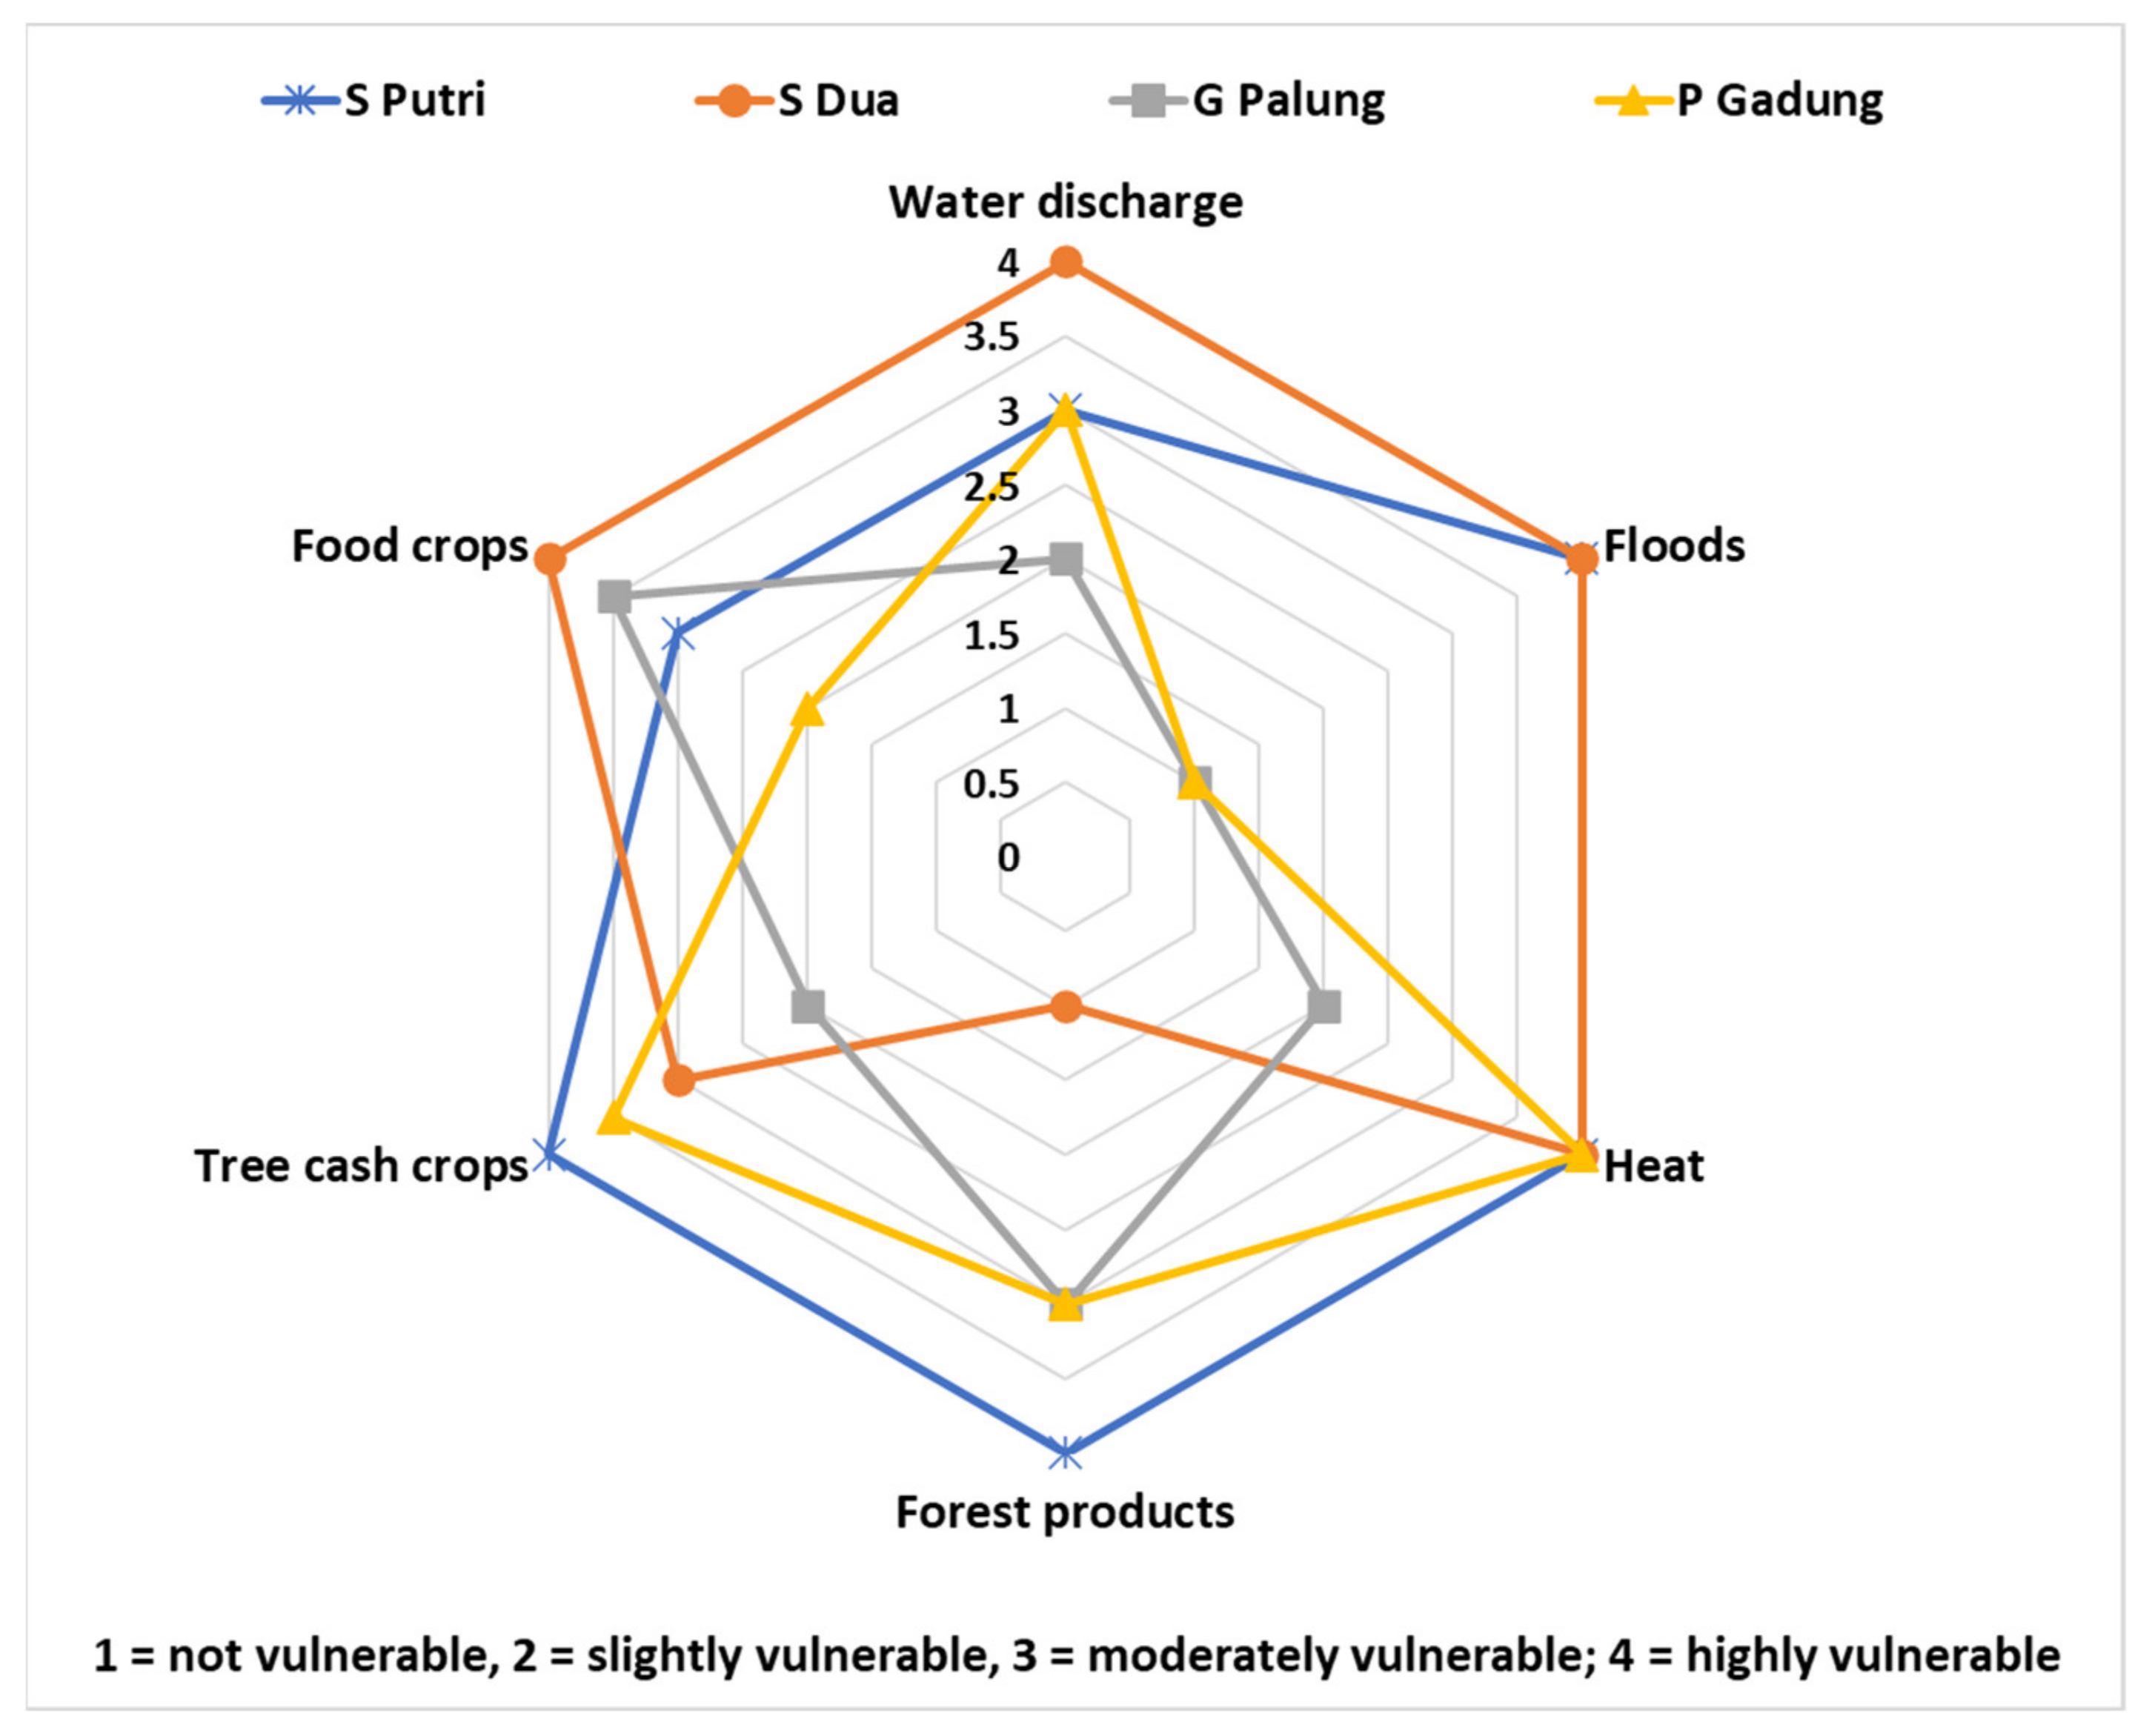
3.3. Perceived Vulnerability at Landscape Level

3.3.1. Perceived Vulnerability Levels across Landscapes

Among the four landscapes, FGD participants in Sungai Putri perceived the highest level of vulnerability, with an average score of 3.7 over six impact classes (Figure 6). Being in the coastal area, and with peatlands at the back of the villages, the landscape is exposed to various climate-induced hazards such as fire and sea water intrusion, in addition to extreme weather events and unpredictable seasons. Communities had to apply various strategies to survive the various hazards impacting their crops and farming practices (see Section 3.2.3) without having sufficient alternative options.
Simpang Dua had the second highest perceived vulnerability amongst the four landscapes, with an average score of 3.3. Despite its upstream and hinterland location, Simpang Dua communities suffered from frequent floods during heavy rains and declining water discharge during long dry seasons, both exacerbated by forest loss and land clearings. However, the remaining forest still seems to be able to supply timber and other forest products, as it was the only landscape where communities did not perceive themselves to be vulnerable to decreasing forest products.
Perceived vulnerability in Pematang Gadung was moderate (average score of 2.8), depending on the impact class. As a peatland-dominant landscape, Pematang Gadung was highly exposed to fire hazards. The perceived vulnerability to heat and to the decline of forest products was mainly attributed to peatland fires that were widespread during dry seasons.
Finally, FGD participants in Gunung Palung perceived low vulnerability, with an average score of 2.3. This was mostly attributed to successful strategies and measures to address, and adapt to, the various adverse impacts of climate stressors. These efforts included tree-planting and forest protection under a social forestry scheme (Hutan Desa) in one village, and the availability of alternative income sources to address declines in agriculture production, especially cash crops.

3.3.2. Perceived Vulnerability and Determining Factors

The perceptions of high vulnerability within the ES domain, i.e., to heat (three landscapes) and to floods (two landscapes), were attributed to the lack of support from the government as well as the low awareness of the communities themselves, which all fall under ‘adaptive capacity’ (Table 4). Lack of government support mostly related to the lack of enforcement to protect forest from logging and to conduct tree-planting, while low awareness mainly referred to some people engaging in illegal activities and river littering, which worsen the impacts. Within the AP impact group, communities perceived themselves to be highly vulnerable to the impacts on all crops (rice, tree cash crops and vegetables), but more so for tree cash crops (three out of four landscapes), which consist of rubber and coconut (Table 4). Crop sensitivity to climate was considered as a major factor, primarily in the case of rubber as the main tree cash crop. Rice farmers, on the other hand, attributed their high vulnerability mainly to a lack of adaptive capacity, referring to demands for more support from the government.
The factors behind the perceptions of high vulnerability highlight a slight difference between the two impact groups. For the AP impact group, participants recognized sensitivity of the crops as a major factor, because farmers themselves experienced crop yield declines due to climate variability and weather extremes. For the ES impact group, in most cases, both sensitivity and lack of adaptive capacities were identified as determinants for their high vulnerability. FGD participants referred to logging and land clearing as major factors for the ES impact group, which demonstrates the roles of non-climate factors in increasing landscape sensitivity to climate stressors.
In the landscapes where vulnerability was perceived to be low-to-medium, it was all attributed to adaptive capacity, manifested in strategies already in place. For the ES impact group, these mostly referred to successful tree-planting and improved constructions to secure their water supply, which all fell under ‘adaptive capacity’ (Table 4). In the AP impact group, participants mostly referred to constructions for water regulation and improved farm management to boost production of rice and vegetables. Regarding tree cash crops, participants referred to their ability to find alternative income sources, as discussed above.

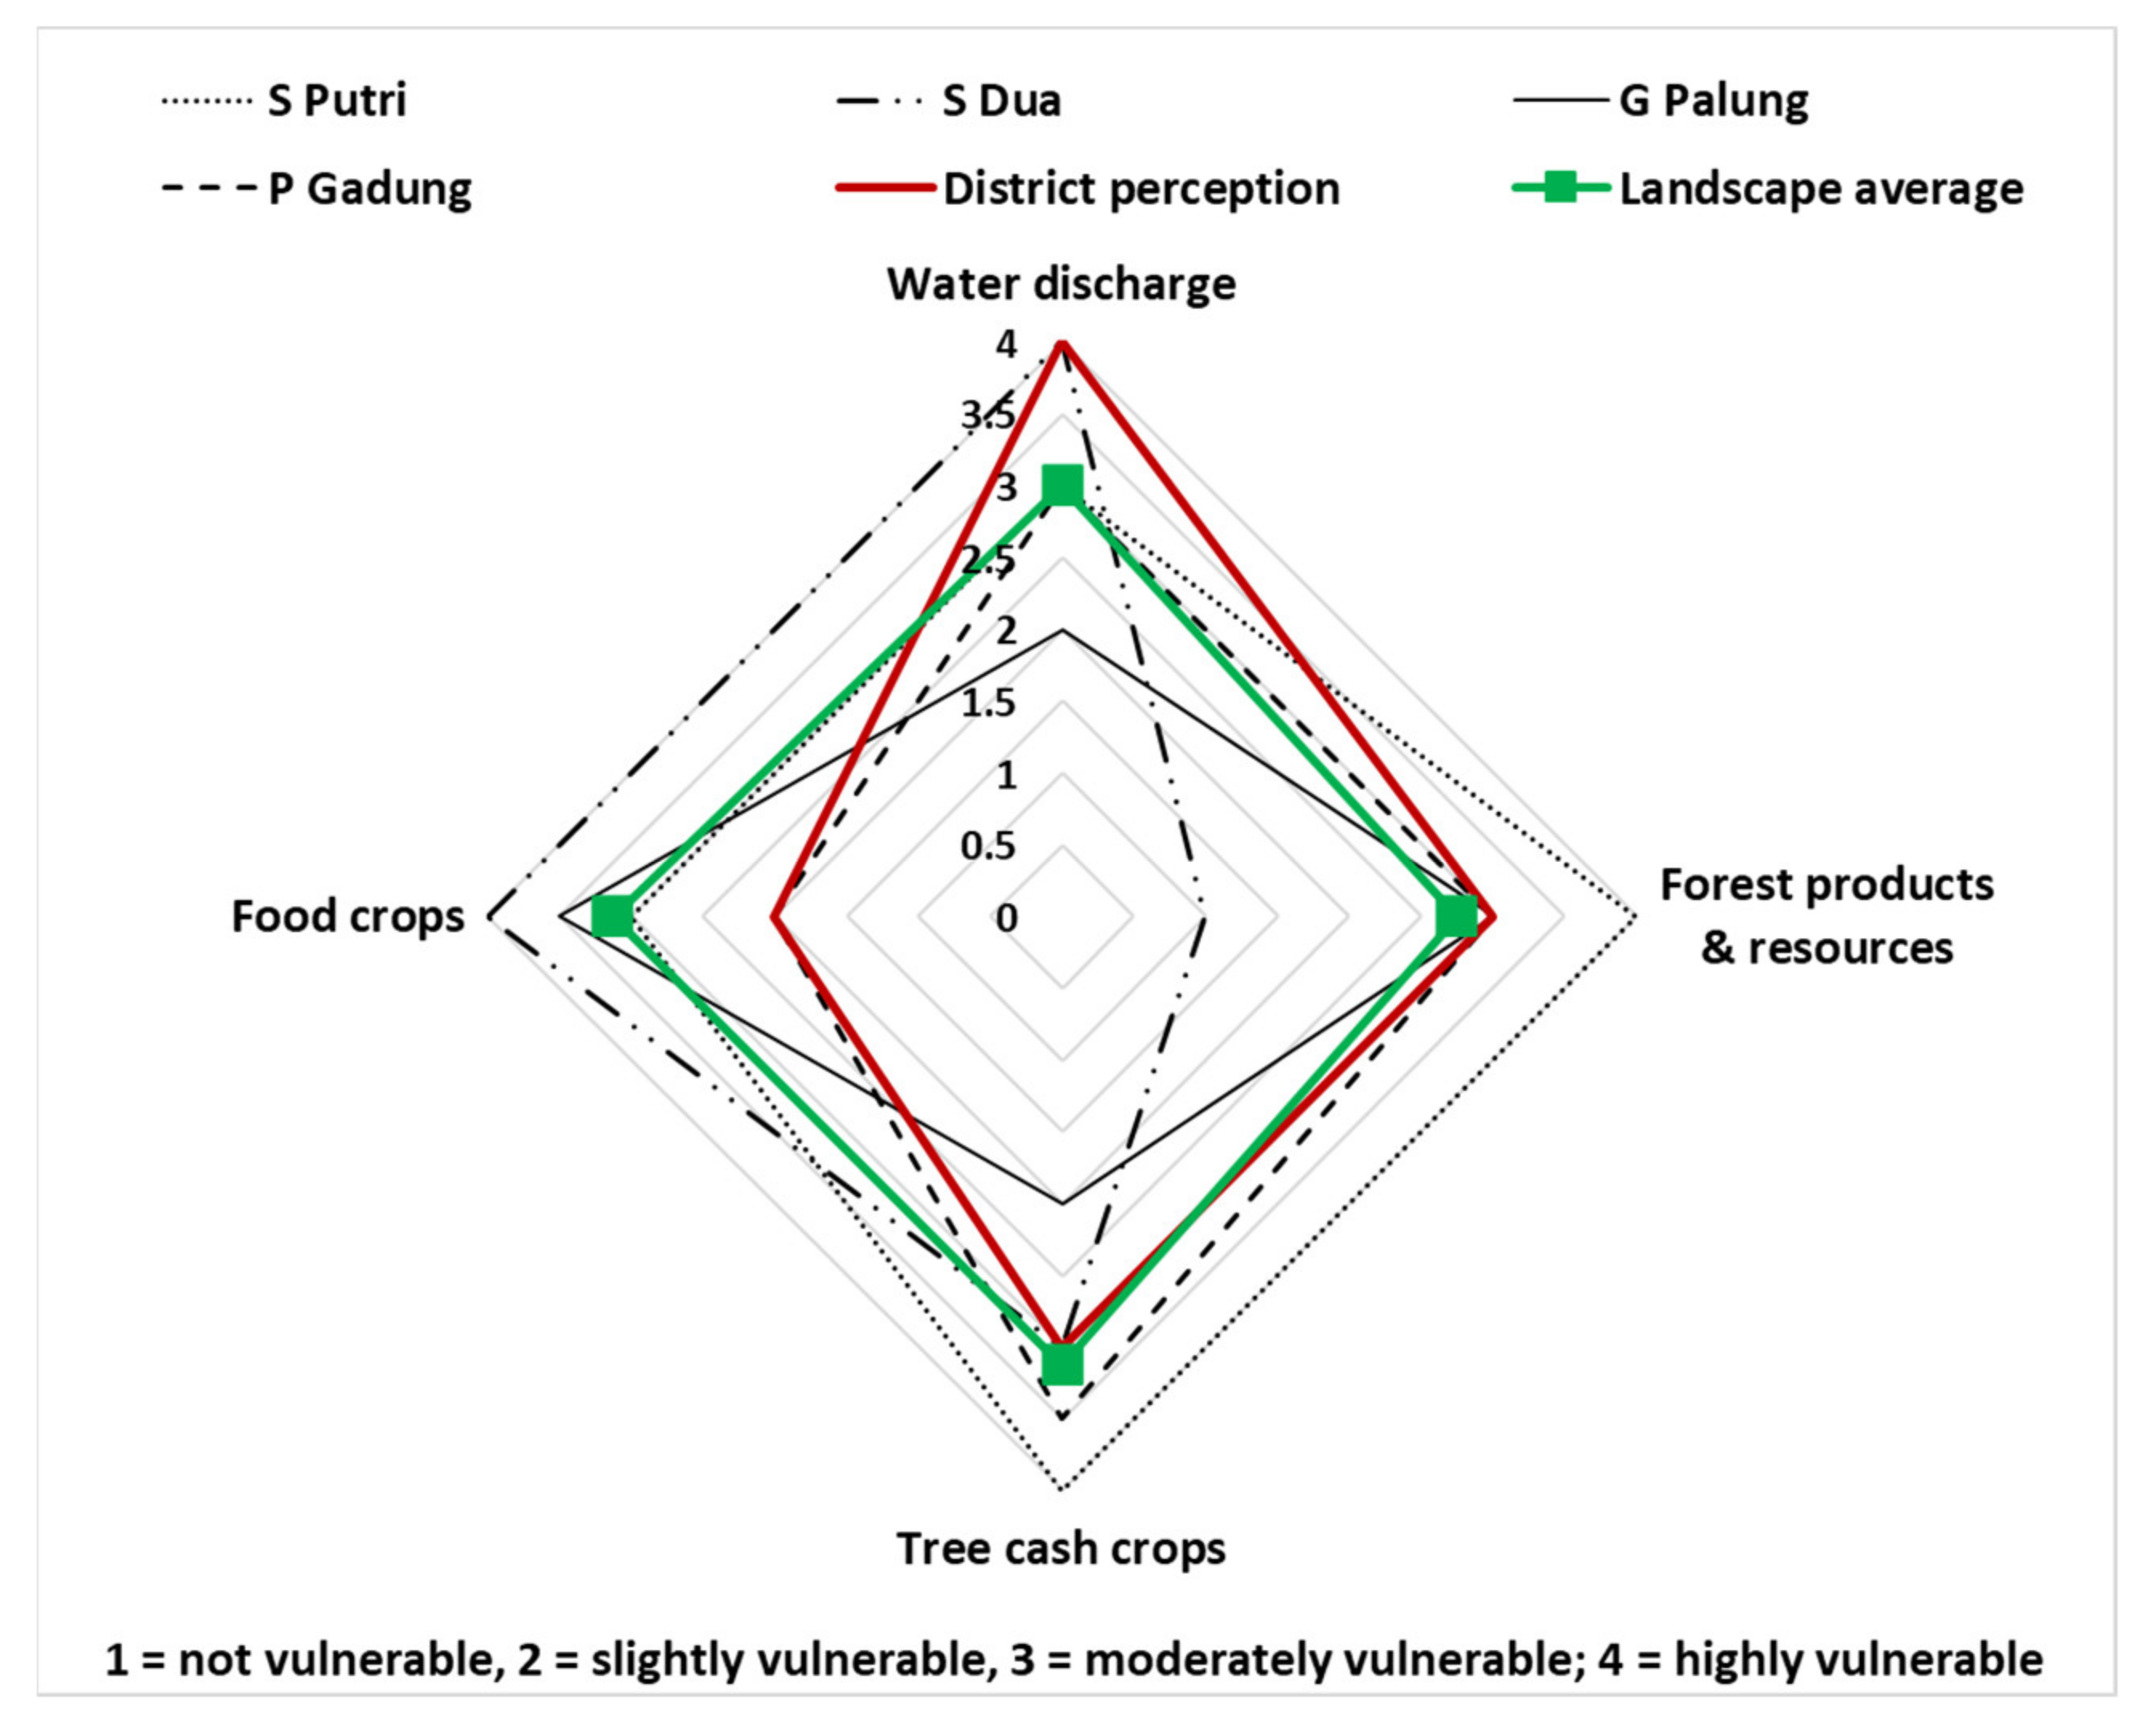
3.4. Comparison with Knowledge and Perceptions of Stakeholders at District Level

3.4.1. Climate Hazard, Impacts and Adaptation Strategies

At the district-level FGD, stakeholders identified seasonal variation and extreme events, especially fire, as major climate-related hazards in Ketapang, as similarly identified by communities (see also Table 3). FGD participants referred to big fire events affecting almost all peatlands in the district in 2015 and 2019. Impacts of climate stressors to communities in Ketapang identified by district stakeholders were similar to those identified by communities, i.e., declining forest resources as livelihood sources, declining water availability and declining production of rubber and rice. In addition, district stakeholders mentioned two impacts of forest loss that were not mentioned by communities: decreasing absorption of CO2, and decreasing biodiversity values, including germplasm. District stakeholders also identified human activities such as logging and large-scale plantation development as major factors of forest loss. At the same time, they stressed that oil palm had become an important crop for the communities, with lower sensitivity to extreme climates compared to rubber.
Communities’ adaptation strategies identified by district stakeholders were improvements to forest and farm management and the development of construction and infrastructure for water regulation. These were similar to those identified by the FGDs in the four landscapes. District government representatives emphasized that some of those strategies were part of government programmes to provide support and assistance to the communities. District stakeholders also mentioned that rubber farmers tend to look for alternative income sources in response to declining yields and decreasing prices. They also noted that farmers in Ketapang were planting different crops, helping them to curb the impacts of crop failure and declining prices.

3.4.2. Comparison of Vulnerabilities

District stakeholders considered that communities were moderately vulnerable to declines of forest products and resources (Figure 7), because communities had managed well in finding alternative sources. Regarding water availability, district stakeholders considered communities to be highly vulnerable. One major issue that was identified in the FGD was the massive water uptake by large-scale industries, such as oil palm mills and bauxite smelters. This had not been mentioned in the community FGDs. The district stakeholders did not mention floods and heat, while these were two major impacts identified in the landscape FGDs.
District stakeholders perceived the vulnerability of rubber farmers to be medium, because, despite rubber’s high climate sensitivity as well as the volatile latex price, farmers were able to find alternatives, or to diversify incomes. For rice farmers, they considered vulnerability to be low, mainly because there had been numerous and successful measures to boost rice production, including support from the government, mainly for irrigated rice fields.
Figure 7 presents the comparison between communities’ perceptions and district stakeholders’ judgments on vulnerability levels related to forest products and resources, water discharge, tree cash crops and food crops (i.e., rice and vegetables).
Vulnerability in relation to forest products and resources and tree cash crops was considered moderate according to both community and district-level FGD participants (Figure 7). Vulnerability related to water discharge was considered higher by district-level stakeholders, mainly because they identified water demand at an industrial scale (plantations and mining) as an additional factor that communities were not aware of. District stakeholders judged vulnerability in relation to food crops as low because they argued there had been numerous programmes to assist in rice farming and production. In the community FGDs, however, these programmes were considered insufficient (see Section 3.3.2).

4. Discussion

4.1. Climate and Non-Climate Stressors

This study was meant to inform landscape level climate-smart interventions that require an understanding of local perceptions related to vulnerability and adaptation to climate change and stressors. However, when discussing vulnerability and adaptation strategies, it is often not possible to distinguish between climate and non-climate stressors. Although the FGD participants in our study were well aware of the relation between the climate and the provision of certain ecosystem services and agricultural production, they seldom saw climate change as the sole cause of these impacts. In line with that, they acknowledged that their adaptation strategies are usually in response to impacts that are caused by a combination of climate and non-climate stressors. Although this compromises the extent to which we can use the data to make scientifically robust statements regarding the attribution of climate change, this ambiguity does not necessarily make the data less valuable to inform interventions. After all, climate-smart interventions are meant to reduce people’s vulnerability, by recognizing the interplay between climate and non-climate stressors, rather than segregating them.

4.2. Incremental Adaptation

A common adaptation strategy for farmers in the study area is to diversify crops across the lands that they own or manage, which is possible where lands are relatively abundant. It is especially common for rubber and coconut farmers, who are faced with declining yields due to climate stressors, as well as price declines. In response, they tend to switch to alternative crops, especially oil palm. They may return to their rubber and coconut plantations when prices increase and/or access to markets improve. In contrast, farmers hardly ever abandon their rice fields, because it is the staple food. Hence, rather than searching for alternatives, farmers tend to make extra efforts to boost rice production. In the peat landscapes, where land management can be costly [69] and land availability is not as abundant as in the upstream-hinterlands, people also adapted by diversifying into the non-land-based sector, such as home industries or local businesses. This may also be related to their cultural background (most community members were migrants from other parts of Indonesia) and their easier access to markets.
Despite the slight differences in responses to various impacts, we found that the main adaptation strategies focus on either ad hoc solutions or finding new crops or sources, while maintaining the existing system. These are thus forms of incremental adaptation [40,68]. Communities in the study area have so far been able to continue or increment the adjustments without engaging in fundamental transformations, as has been observed elsewhere [41].

4.3. Differences in Vulnerability Perceptions and Determining Factors

In the agricultural domain, communities recognized that both crop sensitivity to climate factors and their low adaptive capacity to deal with this as the determining factors of perceived high vulnerability. For ecosystem services, non-climate stressors, mainly forest loss and land clearing, increase the sensitivity of the ecosystem or the landscape, which contributes to the vulnerability of the communities. In contrast, when perceived vulnerability was low, communities would attribute this solely to the strategies that they have applied to adapt. At this level, sensitivity is considered as given, and what can be improved or changed to reduce vulnerability are the adaptive capacities.
In comparing across scale, district level stakeholders are able to take into account more factors when judging communities’ vulnerability and to assess the situation with a bird’s-eye view. As a result, they may judge communities to be less vulnerable when they consider that the communities have the ability to adapt. At the same time, they may judge that communities are more vulnerable because they see more hazards that the communities are not aware of. Consequently, the district stakeholders may be less aware of circumstances at the local level that communities might consider important in determining their vulnerabilities.
In relation to the role of government in enhancing adaptive capacities, the communities would argue that a lack of government support contributed to their vulnerability, particularly related to food crops, while the district government argued that their programmes had decreased communities’ vulnerability. This discrepancy may be caused by stakeholders’ biases, where government officials consider government programmes successful, while communities consider them insufficient. Uneven distribution of support throughout the landscapes could be another factor affecting these differentiated perceptions (e.g., when support focusses on villages within easy reach of the government agencies), but we did not find data supporting this. The differences in perceptions may also be indicative of a gap or disconnect between governments and the communities due to the insufficient roles of intermediary stakeholders (e.g., sub-district or village governments and extension officers) and/or a lack of participation and inclusiveness in the planning and implementation of the programs.

4.4. Differences of Vulnerabilities in Landscape Contexts

In the two peat landscapes in this study, despite being in the same type of ecosystem and being similarly exposed to fire hazards, communities’ perceptions towards vulnerability differed: one was high, and the other was moderate. This difference was primarily due to the availability of options to earn income, in this case from oil palm. That being said, while oil palm may decrease communities’ vulnerability by offering an alternative income, it is also one of the major drivers of peatland clearing and drainage, causing fires [70,71] and other adverse impacts, including biodiversity loss [72]. In addition, although focus group participants considered oil palm as a climate-resilient crop, it may be susceptible to droughts, losing up to 30% of its productive capacity during prolonged dry periods [73]. There seems to be a lack of awareness of such risks and how these may increase their vulnerability in the future. In other words, existing adaptive capacity in the form of available options (i.e., oil palm cultivation) might reduce the vulnerability of these peatland communities in the short term but may increase their vulnerability in the long-term.
Communities in the remote-upstream landscape in our study suffered from climate-induced hazards, i.e., floods and declining water discharge. This is exacerbated by the rampant loss of forest, which reduces the natural buffer functions that attenuate extreme seasons [74,75,76]. Moreover, these upstream communities perceived themselves to be highly vulnerable to the impacts on agricultural crop production, despite the available access to alternative income sources from forest products and oil palm. The availability of such alternatives does not reduce their perceptions of vulnerability. In addition to the adverse impacts that the communities continuously experience, the perceived high vulnerability is attributed to the remoteness of the villages that make them feel insufficiently supported by the government. Furthermore, poverty is dominant, with three of the four villages belonging to the ‘underdeveloped’ category, the lowest category in the national Village Development Index (Indeks Desa Membangun) [77].

4.5. Implications for Climate-Smart Interventions

The study provides various insights and lessons that can be used to inform interventions aiming to support climate change adaptation and mitigation at the landscape level. First, ideas about vulnerability and the influencing factors may differ substantially between landscapes within the same district. People’s perceptions of their vulnerability depend on the local context, including the available land-use opportunities, measures that have been taken (including the success of those measures), and the importance of the affected elements of the socio-ecosystem for local stakeholders. Similar results were also found in a study in South Africa, where local conditions, together with factors such as households’ access to human and financial capital, influenced the level of perceived vulnerability [78]. As was observed in South Africa, in our study area, all of the FGD participants perceived themselves to be vulnerable to some degree, indicating that their adaptation strategies are not enough to face all expected future shocks and that interventions will be necessary for them to overcome these shocks.
Second, intervening organizations need to be aware of the trade-offs that may exist between short- and medium-term adaptation actions that benefit households and communities, and adaptation actions aimed at protecting public long-term interests. For example, while people see oil palm cultivation as an option to increase their adaptive capacity at the household level, they also realize that land clearing for oil palm exacerbates climate hazards at the landscape level, such as floods, and that oil palm cultivation on drained peatland triggers more frequent fires. Similarly, there may be gaps in knowledge and awareness about the long-term outcomes of short-term strategies. There is little knowledge and awareness of the potential long-term risks of oil palm’s sensitivity to climate change [79], or the oil palm industry’s endangering local water availability, while awareness of risks is key for communities’ resilience [80].
Third, perceptions are likely to differ between stakeholders at different scales. Designing adaptation strategies based on the judgements and priorities of stakeholders at the jurisdictional level may lead to a difference in attendance to the needs of various landscapes, and the resulting strategies may be less successful, as they may not be seen as legitimate [81]. In line with this, we emphasize that climate-smart interventions need to take into account the differences in interests and objectives across scales and link these to a good understanding of the existing local adaptive capacities. Bridging such differences might require the development of incentives for landscape-level stakeholders in order for them to be willing to engage. For example, forest protection regulations may support long-term adaptation to climate change by maintaining important local ecosystem services, but they may inhibit short-term economic benefits, such as from timber sales. This may result in a lack of local interest and participation, as well as violations of the regulations. Measures to increase communities’ short-term income from the sustainable management of forest resources, e.g., promoting ecotourism and trade of non-timber forest products, can help to incentivize local support for conservation measures with long-term mitigation and adaptation benefits. Likewise, participatory and inclusive planning, where actors from different scales work together, may help to jointly develop practical options to reduce the trade-offs between different interests. In addition, beyond the formal planning processes, multi-stakeholder consultations and platforms may provide avenues that allow site-specific climate action planning to address both local and district-level concerns.

5. Conclusions

Climate-smart interventions should be aware of local contexts, leverage existing capacities, and fill relevant gaps, while linking local knowledge and perceptions to other forms of knowledge. In order to do so, it is useful to understand the existing adaptation strategies and the resultant vulnerabilities as perceived by communities and various stakeholders. The participatory methodology that we used in Ketapang was useful in detecting differences in perceived vulnerabilities and capacities, which was also helped by taking into consideration exacerbating non-climatic factors. In the study area, incremental adaptation is prevalent in the form of income diversification and improved management. The perceived vulnerabilities were mostly reflections of adaptive capacities affected by contextual factors. These results highlight that interventions to support adaptation to climate change need to take into account: existing evidence from local adaptation and vulnerability assessments; differences between landscapes and scales, and impacts at larger scales; the trade-offs between short- and long-term adaptation strategies, e.g., when land use choices are based on current market values and compromise long-term resilience. Understanding these will improve the design of climate-smart interventions at landscape as well as jurisdictional levels.

Author Contributions

Conceptualisation: A.W. and B.L.; Methodology: A.W., B.L., E.M., and R.Z.; Research implementation: A.W., E.M. and E.P.; Writing-original draft: A.W., B.L. and K.K.; Writing-review and editing: A.W., B.L., E.M., E.P., K.K. and R.Z.; All authors have agreed to the published version of the manuscript.

Funding

The study was carried out by Tropenbos Indonesia and Tropenbos International within the framework of the Mobilising More for Climate (MoMo4C) Program with the financial support of the Dutch Ministry of Foreign Affairs. It also received financial support from the CGIAR Research Program on Forests, Trees and Agroforestry (FTA).

Institutional Review Board Statement

Not Applicable.

Informed Consent Statement

Informed consent was obtained from all subjects involved in the study.

Acknowledgments

The authors acknowledge the village communities, government and stakeholders in Ketapang District for their participation in the study and Tropenbos Indonesia staff for field work and secondary data support.

Conflicts of Interest

The authors declare no conflict of interest.

References

  1. Morton, J.F. The Impact of Climate Change on Smallholder and Subsistence Agriculture. Proc. Natl. Acad. Sci. USA 2007, 104, 19680–19685. [Google Scholar] [CrossRef] [PubMed] [Green Version]
  2. Osman-Elasha, B.; Adger, N.; Brockhaus, M.; Colfer, C.J.P.; Sohngen, B.; Dafalla, T.; Joyce, L.A.; Nkem, J.; Robledo, C. Future socio-economic impacts and vulnerabilities. In Adaptation of Forests and People to Climate Change. A Global Assessment Report; IUFRO World Series; IUFRO: Helsinki, Finland, 2009; Volume 22. [Google Scholar]
  3. Molnar, J.J. Climate Change and Societal Response: Livelihoods, Communities, and the Environment. Rural Sociol. 2010, 75, 1–16. [Google Scholar] [CrossRef]
  4. Harrington, L.J.; Frame, D.J.; Fischer, E.M.; Hawkins, E.; Joshi, M.; Jones, C.D. Poorest Countries Experience Earlier Anthropogenic Emergence of Daily Temperature Extremes. Environ. Res. Lett. 2016, 11, 055007. [Google Scholar] [CrossRef]
  5. Thornton, P.K.; van de Steeg, J.; Notenbaert, A.; Herrero, M. The Impacts of Climate Change on Livestock and Livestock Systems in Developing Countries: A Review of What We Know and What We Need to Know. Agric. Syst. 2009, 101, 113–127. [Google Scholar] [CrossRef]
  6. Thornton, P.K.; Ericksen, P.J.; Herrero, M.; Challinor, A.J. Climate Variability and Vulnerability to Climate Change: A Review. Glob. Chang. Biol. 2014, 20, 3313–3328. [Google Scholar] [CrossRef]
  7. Karki, S.; Burton, P.; Mackey, B. The Experiences and Perceptions of Farmers about the Impacts of Climate Change and Variability on Crop Production: A Review. Clim. Dev. 2020, 12, 80–95. [Google Scholar] [CrossRef]
  8. Harvey, C.A.; Chacón, M.; Donatti, C.I.; Garen, E.; Hannah, L.; Andrade, A.; Bede, L.; Brown, D.; Calle, A.; Chara, J. Climate-Smart Landscapes: Opportunities and Challenges for Integrating Adaptation and Mitigation in Tropical Agriculture. Conserv. Lett. 2014, 7, 77–90. [Google Scholar] [CrossRef]
  9. Harvey, C.A.; Saborio-Rodríguez, M.; Martinez-Rodríguez, M.R.; Viguera, B.; Chain-Guadarrama, A.; Vignola, R.; Alpizar, F. Climate Change Impacts and Adaptation among Smallholder Farmers in Central America. Agric. Food Secur. 2018, 7, 1–20. [Google Scholar] [CrossRef]
  10. Fischlin, A.; Ayres, M.; Karnosky, D.; Kellomäki, S.; Louman, B.; Ong, C.; Plattner, G.-K.; Santoso, H.; Thompson, I.; Booth, T.H. Future Environmental Impacts and Vulnerabilities. IUFRO World Ser. 2009, 22, 53–100. [Google Scholar]
  11. Brawn, J.D.; Benson, T.J.; Stager, M.; Sly, N.D.; Tarwater, C.E. Impacts of Changing Rainfall Regime on the Demography of Tropical Birds. Nat. Clim. Chang. 2017, 7, 133–136. [Google Scholar] [CrossRef]
  12. Frishkoff, L.O.; Karp, D.S.; Flanders, J.R.; Zook, J.; Hadly, E.A.; Daily, G.C.; M’Gonigle, L.K. Climate Change and Habitat Conversion Favour the Same Species. Ecol. Lett. 2016, 19, 1081–1090. [Google Scholar] [CrossRef]
  13. Lamsal, P.; Kumar, L.; Atreya, K.; Pant, K.P. Vulnerability and Impacts of Climate Change on Forest and Freshwater Wetland Ecosystems in Nepal: A Review. Ambio 2017, 46, 915–930. [Google Scholar] [CrossRef]
  14. Li, Z.; Fang, H. Impacts of Climate Change on Water Erosion: A Review. Earth Sci. Rev. 2016, 163, 94–117. [Google Scholar] [CrossRef]
  15. Peters, M.K.; Hemp, A.; Appelhans, T.; Becker, J.N.; Behler, C.; Classen, A.; Detsch, F.; Ensslin, A.; Ferger, S.W.; Frederiksen, S.B. Climate–Land-Use Interactions Shape Tropical Mountain Biodiversity and Ecosystem Functions. Nature 2019, 568, 88–92. [Google Scholar] [CrossRef]
  16. Jetz, W.; Wilcove, D.S.; Dobson, A.P. Projected Impacts of Climate and Land-Use Change on the Global Diversity of Birds. PLoS Biol. 2007, 5, e157. [Google Scholar] [CrossRef] [Green Version]
  17. De Chazal, J.; Rounsevell, M.D. Land-Use and Climate Change within Assessments of Biodiversity Change: A Review. Glob. Environ. Chang. 2009, 19, 306–315. [Google Scholar] [CrossRef]
  18. Hardwick, S.R.; Toumi, R.; Pfeifer, M.; Turner, E.C.; Nilus, R.; Ewers, R.M. The Relationship between Leaf Area Index and Microclimate in Tropical Forest and Oil Palm Plantation: Forest Disturbance Drives Changes in Microclimate. Agric. For. Meteorol. 2015, 201, 187–195. [Google Scholar] [CrossRef] [Green Version]
  19. Meijide, A.; Badu, C.S.; Moyano, F.; Tiralla, N.; Gunawan, D.; Knohl, A. Impact of Forest Conversion to Oil Palm and Rubber Plantations on Microclimate and the Role of the 2015 ENSO Event. Agric. For. Meteorol. 2018, 252, 208–219. [Google Scholar] [CrossRef]
  20. Field, C.B.; Barros, V.R.; Mastrandrea, M.D.; Mach, K.J.; Abdrabo, M.-K.; Adger, N.; Anokhin, Y.A.; Anisimov, O.A.; Arent, D.J.; Barnett, J. Summary for policymakers. In Climate Change 2014: Impacts, Adaptation, and Vulnerability. Part A: Global and Sectoral Aspects. Contribution of Working Group II to the Fifth Assessment Report of the Intergovernmental Panel on Climate Change; Cambridge University Press: Cambridge, UK, 2014; pp. 1–32. [Google Scholar]
  21. Ministry of Environment and Forestry. Third National Communication under the United Nations Framework Convention on Climate Change; Ministry of Environment and Forestry of the Republic of Indonesia: Jakarta, Indonesia, 2018.
  22. Laukkonen, J.; Blanco, P.K.; Lenhart, J.; Keiner, M.; Cavric, B.; Kinuthia-Njenga, C. Combining Climate Change Adaptation and Mitigation Measures at the Local Level. Habitat Int. 2009, 33, 287–292. [Google Scholar] [CrossRef]
  23. Locatelli, B.; Pavageau, C.; Pramova, E.; Di Gregorio, M. Integrating Climate Change Mitigation and Adaptation in Agriculture and Forestry: Opportunities and Trade-Offs. WIREs Clim. Chang. 2015, 6, 585–598. [Google Scholar] [CrossRef]
  24. Scherr, S.; Shames, S.; Friedman, R. Defining Integrated Landscape Management for Policy Makers; EcoAgriculture Partners: Washington, DC, USA, 2013. [Google Scholar]
  25. Duguma, L.A.; Minang, P.A.; van Noordwijk, M. Climate Change Mitigation and Adaptation in the Land Use Sector: From Complementarity to Synergy. Environ. Manag. 2014, 54, 420–432. [Google Scholar] [CrossRef] [Green Version]
  26. Louman, B.; Campos Arce, J.J.; Mercado, L.; Imbach, P.A.; Bouroncle, C.; Finegan, B.; Martínez, C.; Mendoza Rivarola, C.A.; Villalobos Soto, R.; Medellín, M.C. Climate Smart Territories (CST): An Integrated Approach to Food Security, Ecosystem Services, and Climate Change in Rural Areas. In Climate smart-landscapes: Multifunctionality in practice; Minang, P.A., van Noordwijk, M., Freeman, O.E., Mbow, C., de Leeuw, J., Catacutan, D., Eds.; World Agroforestry Center: Nairobi, Kenya, 2015; Chapter 6. [Google Scholar]
  27. Climate-Smart Landscapes: Multifunctionality in Practice; Minang, P.A.; Van Noordwijk, M.; Freeman, O.E.; Catacutan, D. (Eds.) World Agroforestry Centre (ICRAF): Nairobi, Kenya, 2015. [Google Scholar]
  28. Kusters, K. Climate-Smart Landscapes and the Landscape Approach: An Exploration of the Concepts and Their Practical Implications; Tropenbos International: Wageningen, The Netherlands, 2015. [Google Scholar]
  29. Reed, J.; Barlow, J.; Carmenta, R.; van Vianen, J.; Sunderland, T. Engaging Multiple Stakeholders to Reconcile Climate, Conservation and Development Objectives in Tropical Landscapes. Biol. Conserv. 2019, 238, 108229. [Google Scholar] [CrossRef]
  30. Binternagel, N.B.; Juhrbandt, J.; Koch, S.; Purnomo, M.; Schwarze, S.; Barkmann, J.; Faust, H. Adaptation to climate change in Indonesia—livelihood strategies of rural households in the face of ENSO related droughts. In Soil and Recycling Management in the Anthropocene Era; Springer: Berlin/Heidelberg, Germany, 2010; pp. 351–375. [Google Scholar]
  31. Arshad, M.; Kächele, H.; Krupnik, T.J.; Amjath-Babu, T.S.; Aravindakshan, S.; Abbas, A.; Mehmood, Y.; Müller, K. Climate Variability, Farmland Value, and Farmers’ Perceptions of Climate Change: Implications for Adaptation in Rural Pakistan. Int. J. Sustain. Dev. World Ecol. 2017, 24, 532–544. [Google Scholar] [CrossRef]
  32. Bohensky, E.L.; Kirono, D.G.C.; Butler, J.R.A.; Rochester, W.; Habibi, P.; Handayani, T.; Yanuartati, Y. Climate Knowledge Cultures: Stakeholder Perspectives on Change and Adaptation in Nusa Tenggara Barat, Indonesia. Clim. Risk Manag. 2016, 12, 17–31. [Google Scholar] [CrossRef] [Green Version]
  33. Touch, V.; Martin, R.J.; Scott, F.; Cowie, A.; Liu, D.L. Climate Change Impacts on Rainfed Cropping Production Systems in the Tropics and the Case of Smallholder Farms in North-West Cambodia. Environ. Dev. Sustain. 2017, 19, 1631–1647. [Google Scholar] [CrossRef]
  34. Walshe, R.A.; Chang Seng, D.; Bumpus, A.; Auffray, J. Perceptions of Adaptation, Resilience and Climate Knowledge in the Pacific. Int. J. Clim. Chang. Strat. Manag. 2018, 10, 303–322. [Google Scholar] [CrossRef]
  35. Bunce, M.; Rosendo, S.; Brown, K. Perceptions of Climate Change, Multiple Stressors and Livelihoods on Marginal African Coasts. Environ. Dev. Sustain. 2010, 12, 407–440. [Google Scholar] [CrossRef]
  36. Jiri, O.; Mafongoya, P.; Chivenge, P. Smallholder Farmer Perceptions on Climate Change and Variability: A Predisposition for Their Subsequent Adaptation Strategies. J. Earth Sci. Clim. Chang. 2015, 5, 1–7. [Google Scholar] [CrossRef] [Green Version]
  37. Mercer, J.; Kelman, I.; Alfthan, B.; Kurvits, T. Ecosystem-Based Adaptation to Climate Change in Caribbean Small Island Developing States: Integrating Local and External Knowledge. Sustainability 2012, 4, 1908–1932. [Google Scholar] [CrossRef] [Green Version]
  38. Kinose, Y.; Masutomi, Y. Impact Assessment of Climate Change on Rice Yield Using a Crop Growth Model and Activities Toward Adaptation: Targeting Three Provinces in Indonesia. In Adaptation to Climate Change in Agriculture: Research and Practices; Iizumi, T., Hirata, R., Matsuda, R., Eds.; Springer: Singapore, 2019; pp. 67–80. ISBN 978-981-13-9235-1. [Google Scholar]
  39. Cinner, J.E.; Adger, W.N.; Allison, E.H.; Barnes, M.L.; Brown, K.; Cohen, P.J.; Gelcich, S.; Hicks, C.C.; Hughes, T.P.; Lau, J.; et al. Building Adaptive Capacity to Climate Change in Tropical Coastal Communities. Nat. Clim. Chang. 2018, 8, 117–123. [Google Scholar] [CrossRef] [Green Version]
  40. Noble, I.R.; Huq, S.; Anokhin, Y.A.; Carmin, J.; Goudou, D.; Lansigan, F.P.; Osman-Elasha, B.; Villamizar, A. Adaptation needs and options. In Climate Change 2014: Impacts, Adaptation, and Vulnerability. Part A: Global and Sectoral Aspects. Contribution of Working Group II to the Fifth Assessment Report of the Intergovernmental Panel on Climate Change; Cambridge University Press: Cambridge, UK; New York, NY, USA, 2015. [Google Scholar]
  41. Ferdinand, T.; Tye, S.; Gebregziabher, D.; Suberi, B.; Carter, R. Driving System Shifts for Climate Resilience: Case Studies of Transformative Adaptation in Bhutan, Ethiopia, and Costa Rica. WRI Publ. 2020. Available online: https://www.researchgate.net/publication/347812480_Driving_System_Shifts_for_Climate_Resilience_Case_Studies_of_Transformative_Adaptation_in_Bhutan_Ethiopia_and_Costa_Rica (accessed on 11 June 2021). [CrossRef]
  42. Pachauri, R.K.; Allen, M.R.; Barros, V.R.; Broome, J.; Cramer, W.; Christ, R.; Church, J.A.; Clarke, L.; Dahe, Q.; Dasgupta, P. Climate Change 2014: Synthesis Report. Contribution of Working Groups I, II and III to the Fifth Assessment Report of the Intergovernmental Panel on Climate Change; IPCC: Geneva, Switzerland, 2014. [Google Scholar]
  43. Fellmann, T. The Assessment of Climate Change-Related Vulnerability in the Agricultural Sector: Reviewing Conceptual Frameworks. Build. Resil. Adapt. Clim. Chang. Agric. Sect. 2012, 23, 37. [Google Scholar]
  44. Field, C.B.; Barros, V.; Stocker, T.F.; Dahe, Q. Managing the Risks of Extreme Events and Disasters to Advance Climate Change Adaptation: Special Report of the Intergovernmental Panel on Climate Change; Cambridge University Press: Cambridge, UK, 2012. [Google Scholar]
  45. Levine, S.; Ludi, E.; Jones, L. Rethinking Support for Adaptive Capacity to Climate Change: The Role of Development Interventions; Overseas Development Institute: London, UK, 2011. [Google Scholar]
  46. Handmer, J.; Honda, Y.; Kundzewicz, Z.W.; Arnell, N.; Benito, G.; Hatfield, J.; Mohamed, I.F.; Peduzzi, P.; Wu, S.; Sherstyukov, B. Changes in impacts of climate extremes: Human systems and ecosystems. In Managing the Risks of Extreme Events and Disasters to Advance Climate Change Adaptation: Special Report of the Intergovernmental Panel on Climate Change; Cambridge University Press: Cambridge, UK, 2012; pp. 231–290. [Google Scholar]
  47. Costanza, R.; d’Arge, R.; De Groot, R.; Farber, S.; Grasso, M.; Hannon, B.; Limburg, K.; Naeem, S.; O’neill, R.V.; Paruelo, J. The Value of the World’s Ecosystem Services and Natural Capital. Nature 1997, 387, 253–260. [Google Scholar] [CrossRef]
  48. De Groot, R.S.; Wilson, M.A.; Boumans, R.M. A Typology for the Classification, Description and Valuation of Ecosystem Functions, Goods and Services. Ecol. Econ. 2002, 41, 393–408. [Google Scholar] [CrossRef] [Green Version]
  49. World Resources Institute. Millennium Ecosystem Assessment: Ecosystems and Human Well-Being: A Framework for Assessment; Island Press: Washington, DC, USA, 2003. [Google Scholar]
  50. Herawati, H.; Santoso, H. Tropical Forest Susceptibility to and Risk of Fire under Changing Climate: A Review of Fire Nature, Policy and Institutions in Indonesia. For. Policy Econ. 2011, 13, 227–233. [Google Scholar] [CrossRef]
  51. Christensen, J.H.; Kanikicharla, K.K.; Aldrian, E.; An, S.I.; Cavalcanti, I.F.A.; de Castro, M.; Dong, W.; Goswami, P.; Hall, A.; Kanyanga, J.K. Climate phenomena and their relevance for future regional climate change. In Climate Change 2013 the Physical Science Basis: Working Group I Contribution to the Fifth Assessment Report of the Intergovernmental Panel on Climate Change; Cambridge University Press: Cambridge, UK, 2013; pp. 1217–1308. [Google Scholar]
  52. Edwards, R.B.; Naylor, R.L.; Higgins, M.M.; Falcon, W.P. Causes of Indonesia’s Forest Fires. World Dev. 2020, 127, 104717. [Google Scholar] [CrossRef]
  53. Butler, J.R.A.; Suadnya, W.; Puspadi, K.; Sutaryono, Y.; Wise, R.M.; Skewes, T.D.; Kirono, D.; Bohensky, E.L.; Handayani, T.; Habibi, P. Framing the Application of Adaptation Pathways for Rural Livelihoods and Global Change in Eastern Indonesian Islands. Glob. Environ. Chang. 2014, 28, 368–382. [Google Scholar] [CrossRef]
  54. Sleet, P. The State of Indonesian Food Security and Nutrition; Future Directions International: Nedlands, Australia, 2020. [Google Scholar]
  55. Wijaya, A.; Samadhi, T.N.K.; Juliane, R. Indonesia Is Reducing Deforestation but Problem Areas Remain.2019. Available online: https://www.wri.org/insights/indonesia-reducing-deforestation-problem-areas-remain (accessed on 21 May 2021).
  56. Carlson, K.M.; Curran, L.M.; Ratnasari, D.; Pittman, A.M.; Soares-Filho, B.S.; Asner, G.P.; Trigg, S.N.; Gaveau, D.A.; Lawrence, D.; Rodrigues, H.O. Committed Carbon Emissions, Deforestation, and Community Land Conversion from Oil Palm Plantation Expansion in West Kalimantan, Indonesia. Proc. Natl. Acad. Sci. USA 2012, 109, 7559–7564. [Google Scholar] [CrossRef] [Green Version]
  57. Austin, K.G.; Kasibhatla, P.S.; Urban, D.L.; Stolle, F.; Vincent, J. Reconciling Oil Palm Expansion and Climate Change Mitigation in Kalimantan, Indonesia. PLoS ONE 2015, 10, e0127963. [Google Scholar] [CrossRef]
  58. Gaveau, D.L.; Salim, M.A.; Hergoualc’h, K.; Locatelli, B.; Sloan, S.; Wooster, M.; Marlier, M.E.; Molidena, E.; Yaen, H.; DeFries, R. Major Atmospheric Emissions from Peat Fires in Southeast Asia during Non-Drought Years: Evidence from the 2013 Sumatran Fires. Sci. Rep. 2014, 4, 1–7. [Google Scholar] [CrossRef] [Green Version]
  59. Jauhiainen, J.; Hooijer, A.; Page, S.E. Carbon Dioxide Emissions from an Acacia Plantation on Peatland in Sumatra, Indonesia. Biogeosciences 2012, 9, 617–630. [Google Scholar] [CrossRef] [Green Version]
  60. Huijnen, V.; Wooster, M.J.; Kaiser, J.W.; Gaveau, D.L.A.; Flemming, J.; Parrington, M.; Inness, A.; Murdiyarso, D.; Main, B.; van Weele, M. Fire Carbon Emissions over Maritime Southeast Asia in 2015 Largest since 1997. Sci. Rep. 2016, 6, 26886. [Google Scholar] [CrossRef] [Green Version]
  61. Badan Pusat Statistik, Provinsi Kalimantan Barat (Statistics of West Kalimantan Province). Available online: https://kalbar.bps.go.id/ (accessed on 16 July 2021).
  62. Penot, E.; Chambon, B.; Wibawa, G. An History of Rubber Agroforestry Systems Development in Indonesia and Thailand as Alternatives for a Sustainable Agriculture and Income Stability. In Proceedings of the International Rubber Conference, Bali, Indonesia, 4 October 2017; pp. 1–26. [Google Scholar]
  63. Milieudefensie; WALHI. Failing Governance-Avoiding Responsibilities: European Biofuel Policies and Oil Palm Plantation Expansion in Ketapang District, West Kalimantan (Indonesia); Friends of the Earth Netherlands (Milieudefensie): Amsterdam, The Netherlands, 2009. [Google Scholar]
  64. West Kalimantan Statistics Agency. West Kalimantan Statistics 2020. Available online: https://kalbar.bps.go.id/publication/2020/04/27/62fcae2341a7a6e3d98d335f/provinsi-kalimantan-barat-dalam-angka-2020.html (accessed on 7 February 2021).
  65. Directorate General of Estate, Ministry of Agriculture. Crops Tree Crop Estate Statistics of Indonesia (2018–2020)—Palm Oil. Available online: www.ditjenbun.pertanian.go.id (accessed on 7 February 2021).
  66. Ministry of Environment and Forestry. Indonesia Land Cover Map 2019. Available online: http://dbgis.menlhk.go.id/arcgis/rest/services/KLHK/Penutupan_Lahan_Tahun_2019/MapServer. (accessed on 7 February 2021).
  67. Agricultural Land Resources Agency. Peatland Distribution in Indonesia; Agricultural Land Resources Agency, Ministry of Agriculture of the Republic of Indonesia: Jakarta, Indonesia, 2019.
  68. Béné, C.; Newsham, A.; Davies, M.; Ulrichs, M.; Godfrey-Wood, R. Resilience, Poverty and Development. J. Int. Dev. 2014, 5, 598–623. [Google Scholar] [CrossRef]
  69. Winarno, B.; Rohadi, D.; Herawati, T.; Rahmat, M.; Suwarno, E. Out of Fire Disaster: Dynamics of Livelihood Strategies of Rural Community on Peatland Use and Management. In Proceedings of the IOP Conference Series: Earth and Environmental Science, Bogor, Indonesia, 28 August 2019; IOP Publishing: Bristol, UK, 2020. [Google Scholar]
  70. Cattau, M.E.; Harrison, M.E.; Shinyo, I.; Tungau, S.; Uriarte, M.; DeFries, R. Sources of Anthropogenic Fire Ignitions on the Peat-Swamp Landscape in Kalimantan, Indonesia. Glob. Environ. Chang. 2016, 39, 205–219. [Google Scholar] [CrossRef]
  71. Page, S.E.; Siegert, F.; Rieley, J.O.; Boehm, H.-D.V.; Jaya, A.; Limin, S. The Amount of Carbon Released from Peat and Forest Fires in Indonesia during 1997. Nature 2002, 420, 61–65. [Google Scholar] [CrossRef] [PubMed]
  72. Meijaard, E.; Garcia-Ulloa, J.; Sheil, D.; Wich, S.A.; Carlson, K.M.; Juffe-Bignoli, D.; Brooks, T.M. Oil Palm and Biodiversity: A Situation Analysis by the IUCN Oil Palm Task Force; IUCN Oil Palm Task Force: Gland, Switzerland, 2018. [Google Scholar] [CrossRef]
  73. Paterson, R.R.M.; Kumar, L.; Taylor, S.; Lima, N. Future Climate Effects on Suitability for Growth of Oil Palms in Malaysia and Indonesia. Sci. Rep. 2015, 5, 1–11. [Google Scholar] [CrossRef] [Green Version]
  74. Bruijnzeel, L.A. Hydrological Functions of Tropical Forests: Not Seeing the Soil for the Trees? Agric. Ecosyst. Environ. 2004, 104, 185–228. [Google Scholar] [CrossRef]
  75. Adnan, N.A.; Atkinson, P.M. Exploring the Impact of Climate and Land Use Changes on Streamflow Trends in a Monsoon Catchment. Int. J. Climatol. 2011, 31, 815–831. [Google Scholar] [CrossRef]
  76. Peña-Arancibia, J.L.; Bruijnzeel, L.A.; Mulligan, M.; van Dijk, A.I. Forests as ‘Sponges’ and ‘Pumps’: Assessing the Impact of Deforestation on Dry-Season Flows across the Tropics. J. Hydrol. 2019, 574, 946–963. [Google Scholar] [CrossRef]
  77. Ministry of Villages, Village Development Index (Indeks Desa Membangun). Available online: https://idm.kemendesa.go.id/status (accessed on 5 March 2021).
  78. Paumgarten, F.; Locatelli, B.; Witkowski, E.T.; Vogel, C. Prepare for the Unanticipated: Portfolios of Coping Strategies of Rural Households Facing Diverse Shocks. J. Rural Stud. 2020, 80, 91–100. [Google Scholar] [CrossRef]
  79. Paterson, R.R.M.; Lima, N. Climate Change Affecting Oil Palm Agronomy, and Oil Palm Cultivation Increasing Climate Change, Require Amelioration. Ecol. Evol. 2018, 8, 452–461. [Google Scholar] [CrossRef] [PubMed] [Green Version]
  80. Lai, C.-H.; Liao, P.-C.; Chen, S.-H.; Wang, Y.-C.; Cheng, C.; Wu, C.-F. Risk Perception and Adaptation of Climate Change: An Assessment of Community Resilience in Rural Taiwan. Sustainability 2021, 13, 3651. [Google Scholar] [CrossRef]
  81. Adger, W.N.; Arnell, N.W.; Tompkins, E.L. Successful Adaptation to Climate Change across Scales. Glob. Environ. Chang. 2005, 15, 77–86. [Google Scholar] [CrossRef]
Figure 1. Four landscapes as the focus areas in Ketapang District, West Kalimantan, Indonesia.
Land 10 00816 g001
Figure 2. Conceptual framework of the study applied in the FGD processes.
Land 10 00816 g002
Figure 3. Response actions in four landscapes for the four impacts under the ES group.
Land 10 00816 g003
Figure 4. Response actions in four landscapes for the three impacts under the AP group.
Land 10 00816 g004
Figure 5. Adaptation strategies in four landscapes for the two impact groups.
Land 10 00816 g005
Figure 6. Perceived vulnerability scores for six impacts (see Table 3) in each landscape (S Putri = Sungai Putri; S Dua = Simpang Dua; G Palung = Gunung Palung; P Gadung = Pematang Gadung).
Land 10 00816 g006
Figure 7. Perceived vulnerability scores of the communities in Ketapang as perceived by FGDs in four landscapes and by district stakeholders (S Putri = Sungai Putri; S Dua = Simpang Dua; G Palung = Gunung Palung; P Gadung = Pematang Gadung).
Land 10 00816 g007
Table 1. Landscape general characteristics.
General Characteristics Simpang Dua
(Upstream)
Gunung Palung
(Transition)
Sungai Putri
(Coastal)
Pematang Gadung
(Peatlands)
Location and elevationUpstream-hinterlandsTransitional (lowland to foothills)Coastal with peatlands Peatland-predominated lowland
EthnicityIndigenous DayakDayak and MalayMalay migrantsMalay and Javanese migrants
Area * 73,000 ha57,000 ha55,000 ha46,000 ha
Population size **4300970012,30012,400
Forest area *,#13,400 ha (19%)17,500 ha (30%)31,900 ha (58%)9800 ha (20%)
* Approximate area, landscape boundaries are derived from Indonesia Village Map [66]; ** Approximate figure, from village statistics; # Forest classes in 2019 Indonesia Land Cover Map [67].
Table 2. Types of response actions and categories.
NoType of Response Action and ExamplesCategories of Adaptation Strategies
1Ad hoc solutions
(e.g., purchasing water for water shortage)
Short-term strategies
2Improvement of management
(e.g., tree-planting as part of addressing tree-cover loss; planting time adjustment for rice farming)
Longer-term strategies
3Improvement or fixing of construction
(e.g., fixing the ditch for a water issue in rice fields)
4Alternative source (for ES)/alternative farm income (for AP)
(e.g., river water as an alternative to spring water; planting oil palm as alternative to rubber tapping)
Finding alternatives
5Alternative non-farm income (for AP)
(e.g., working at oil palm plantations)
6Government programme or regulation
(e.g., forest protection programme)
Reliance on government (programme or regulation)
Table 3. Impacts under ES and AP impact groups identified in four landscapes.
NoImpact GroupImpacts Major Climate Stressors/HazardsSimpang DuaGunung PalungSungai PutriPematang Gadung
1Ecosystem Services (ES)Declining water discharge Drought
2FloodsExtreme rainy season
3HeatDrought, fire
4Declining forest productsDrought, fire
5Agricultural Production (AP)Rubber *: production declineExtreme seasons
6Coconut *: production declineExtreme seasons, sea level rise
7Rice *: production decline, irregular planting timeExtreme and erratic seasons
8Vegetable *: production declineExtreme seasons
* In further analyses, rubber and coconut are grouped into ‘tree cash crops’, and rice and vegetable are grouped into ‘food crops’.
Table 4. Vulnerability levels and the perceived determinant factors of adaptive capacity, sensitivity, or both.
ImpactsFrequency of Determinant Factors (as Number of Landscapes)
High VulnerabilityLow-Medium Vulnerability
Adaptive CapacitySensitivity Both *Adaptive CapacitySensitivityBoth *
ES Impact Group
Water discharge 13
Heat2 11
Forest products 12
Floods 11
AP Impact Group
Rice1 12
Vegetables 1 1
Tree cash crops ** 3 3
* Both = adaptive capacity and sensitivity; ** consisting of rubber (in all four landscapes) and coconut (in two landscapes).
Publisher’s Note: MDPI stays neutral with regard to jurisdictional claims in published maps and institutional affiliations.

