
An Analysis of the Effects of Development-Restricted Areas on Land Price Using Spatial Analysis


Abstract
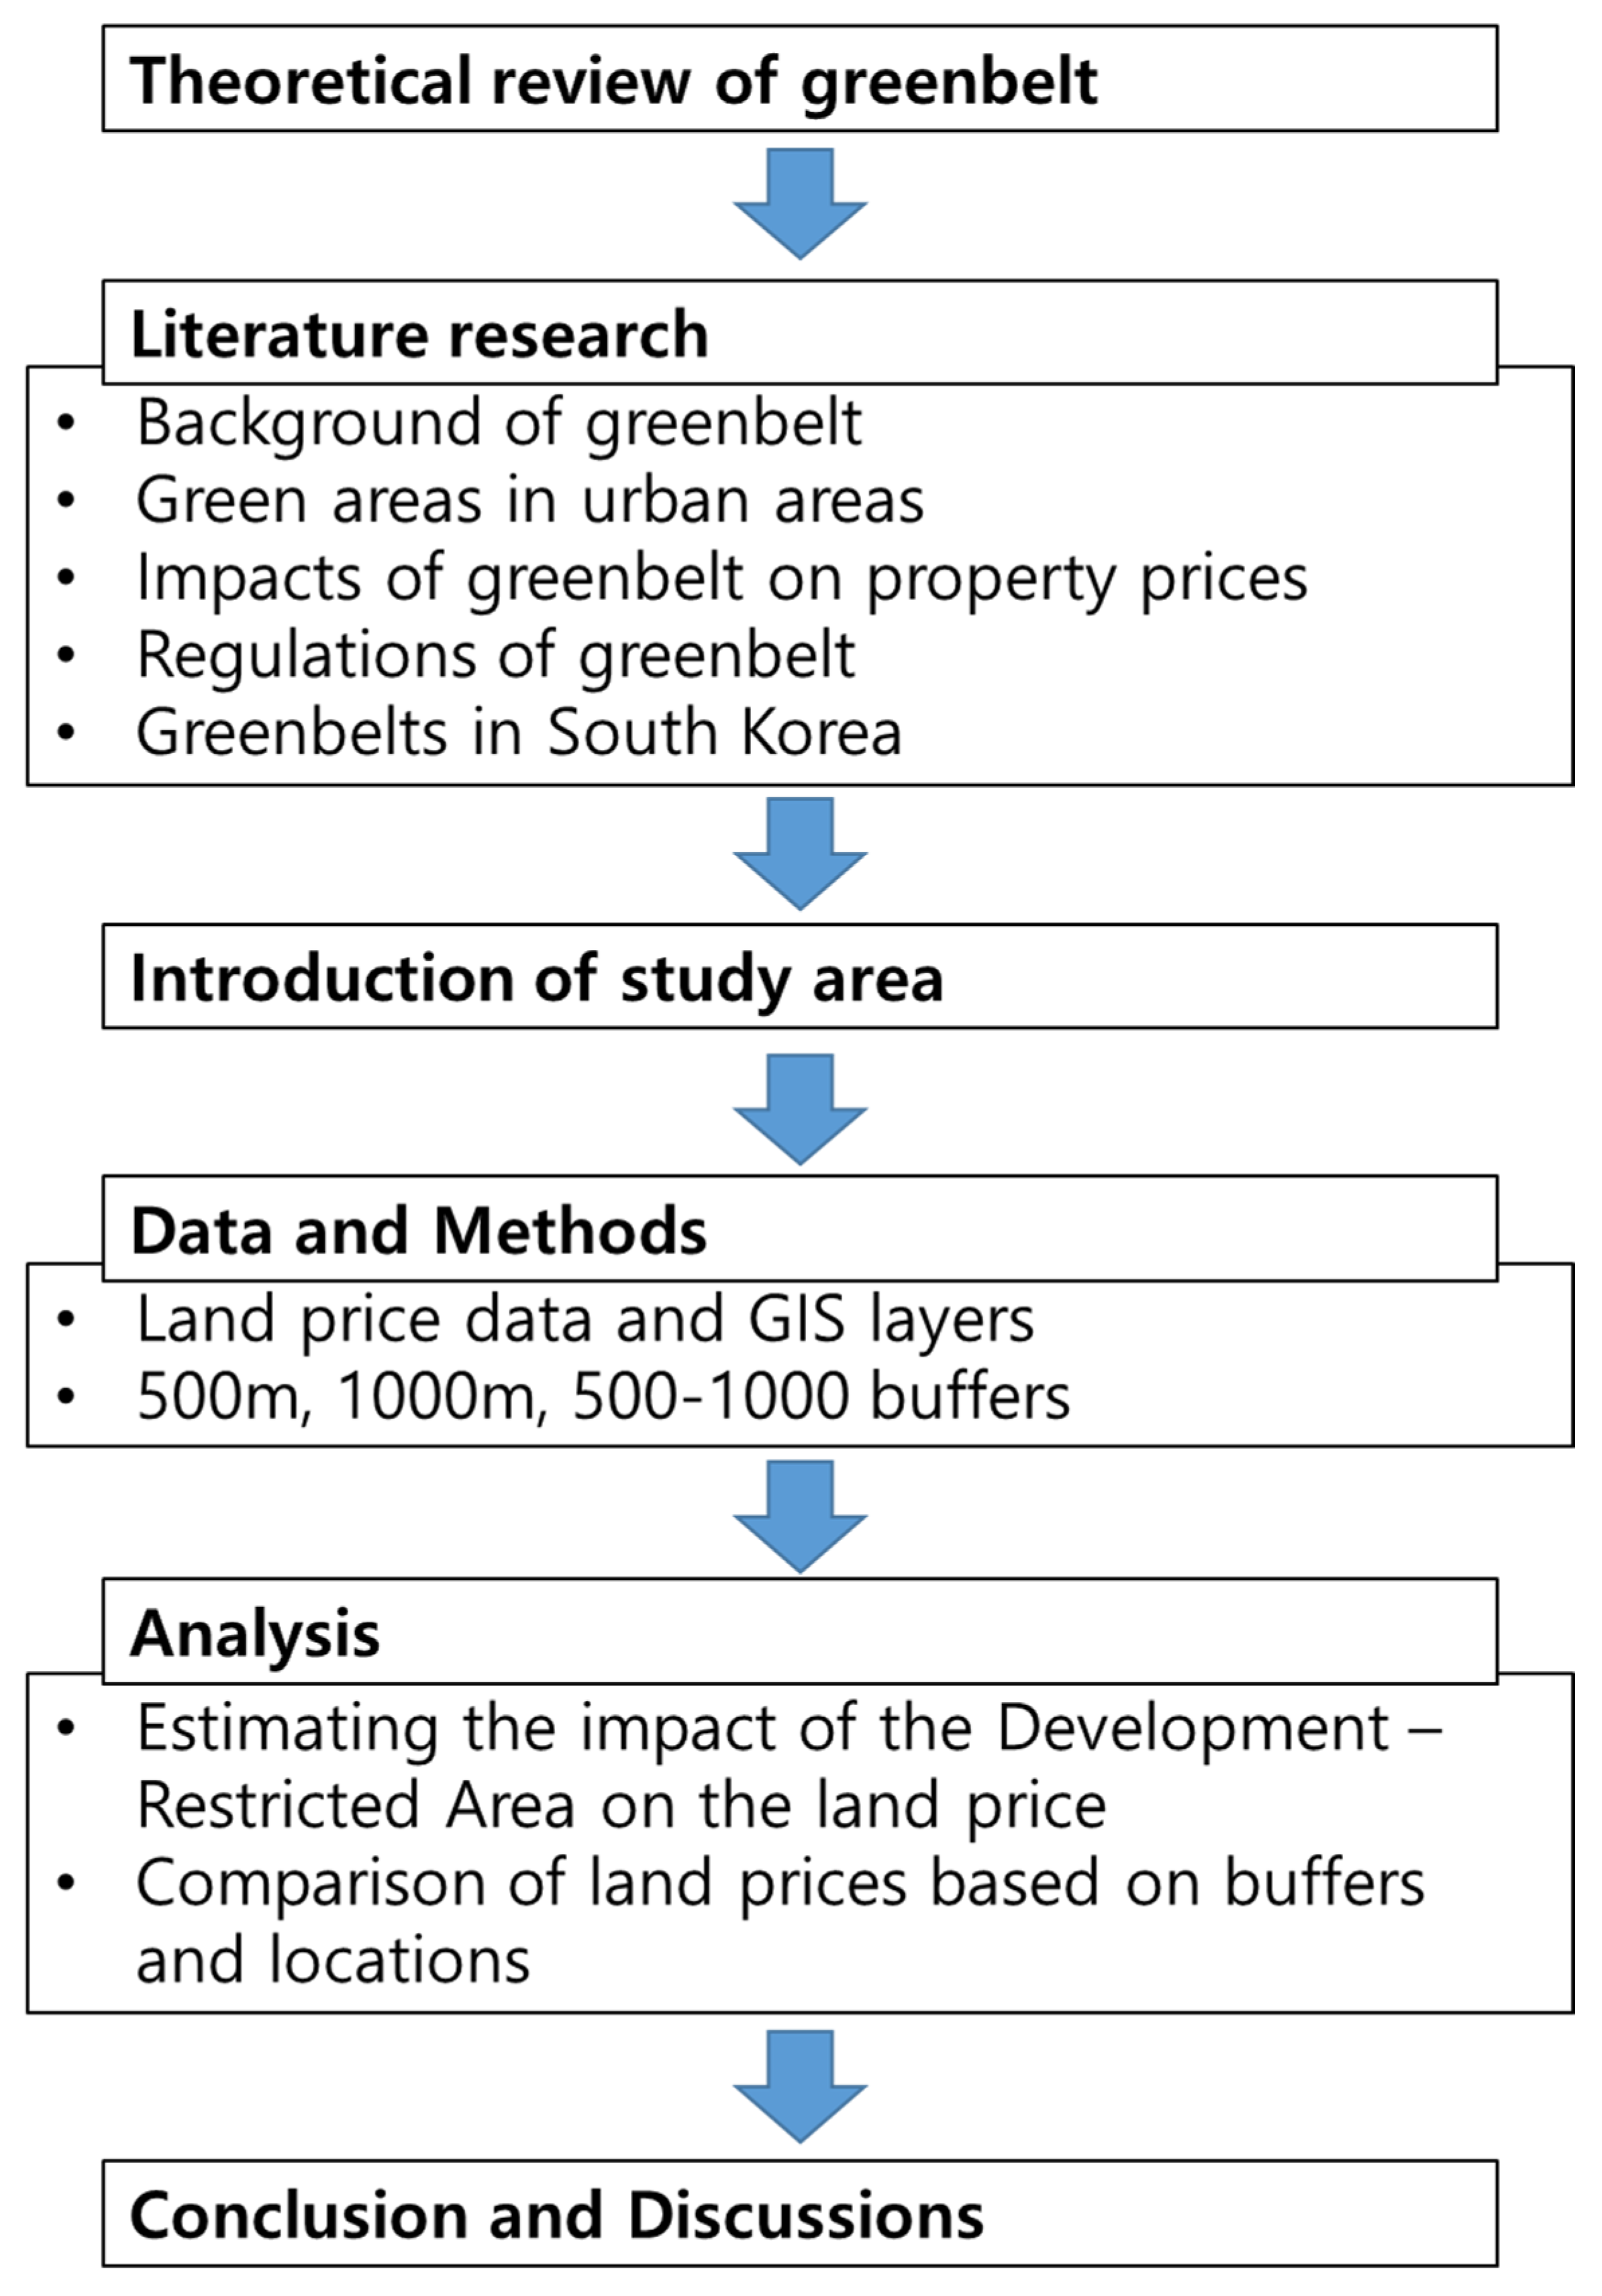
:1. Introduction
2. Literature Review
Greenbelts in South Korea
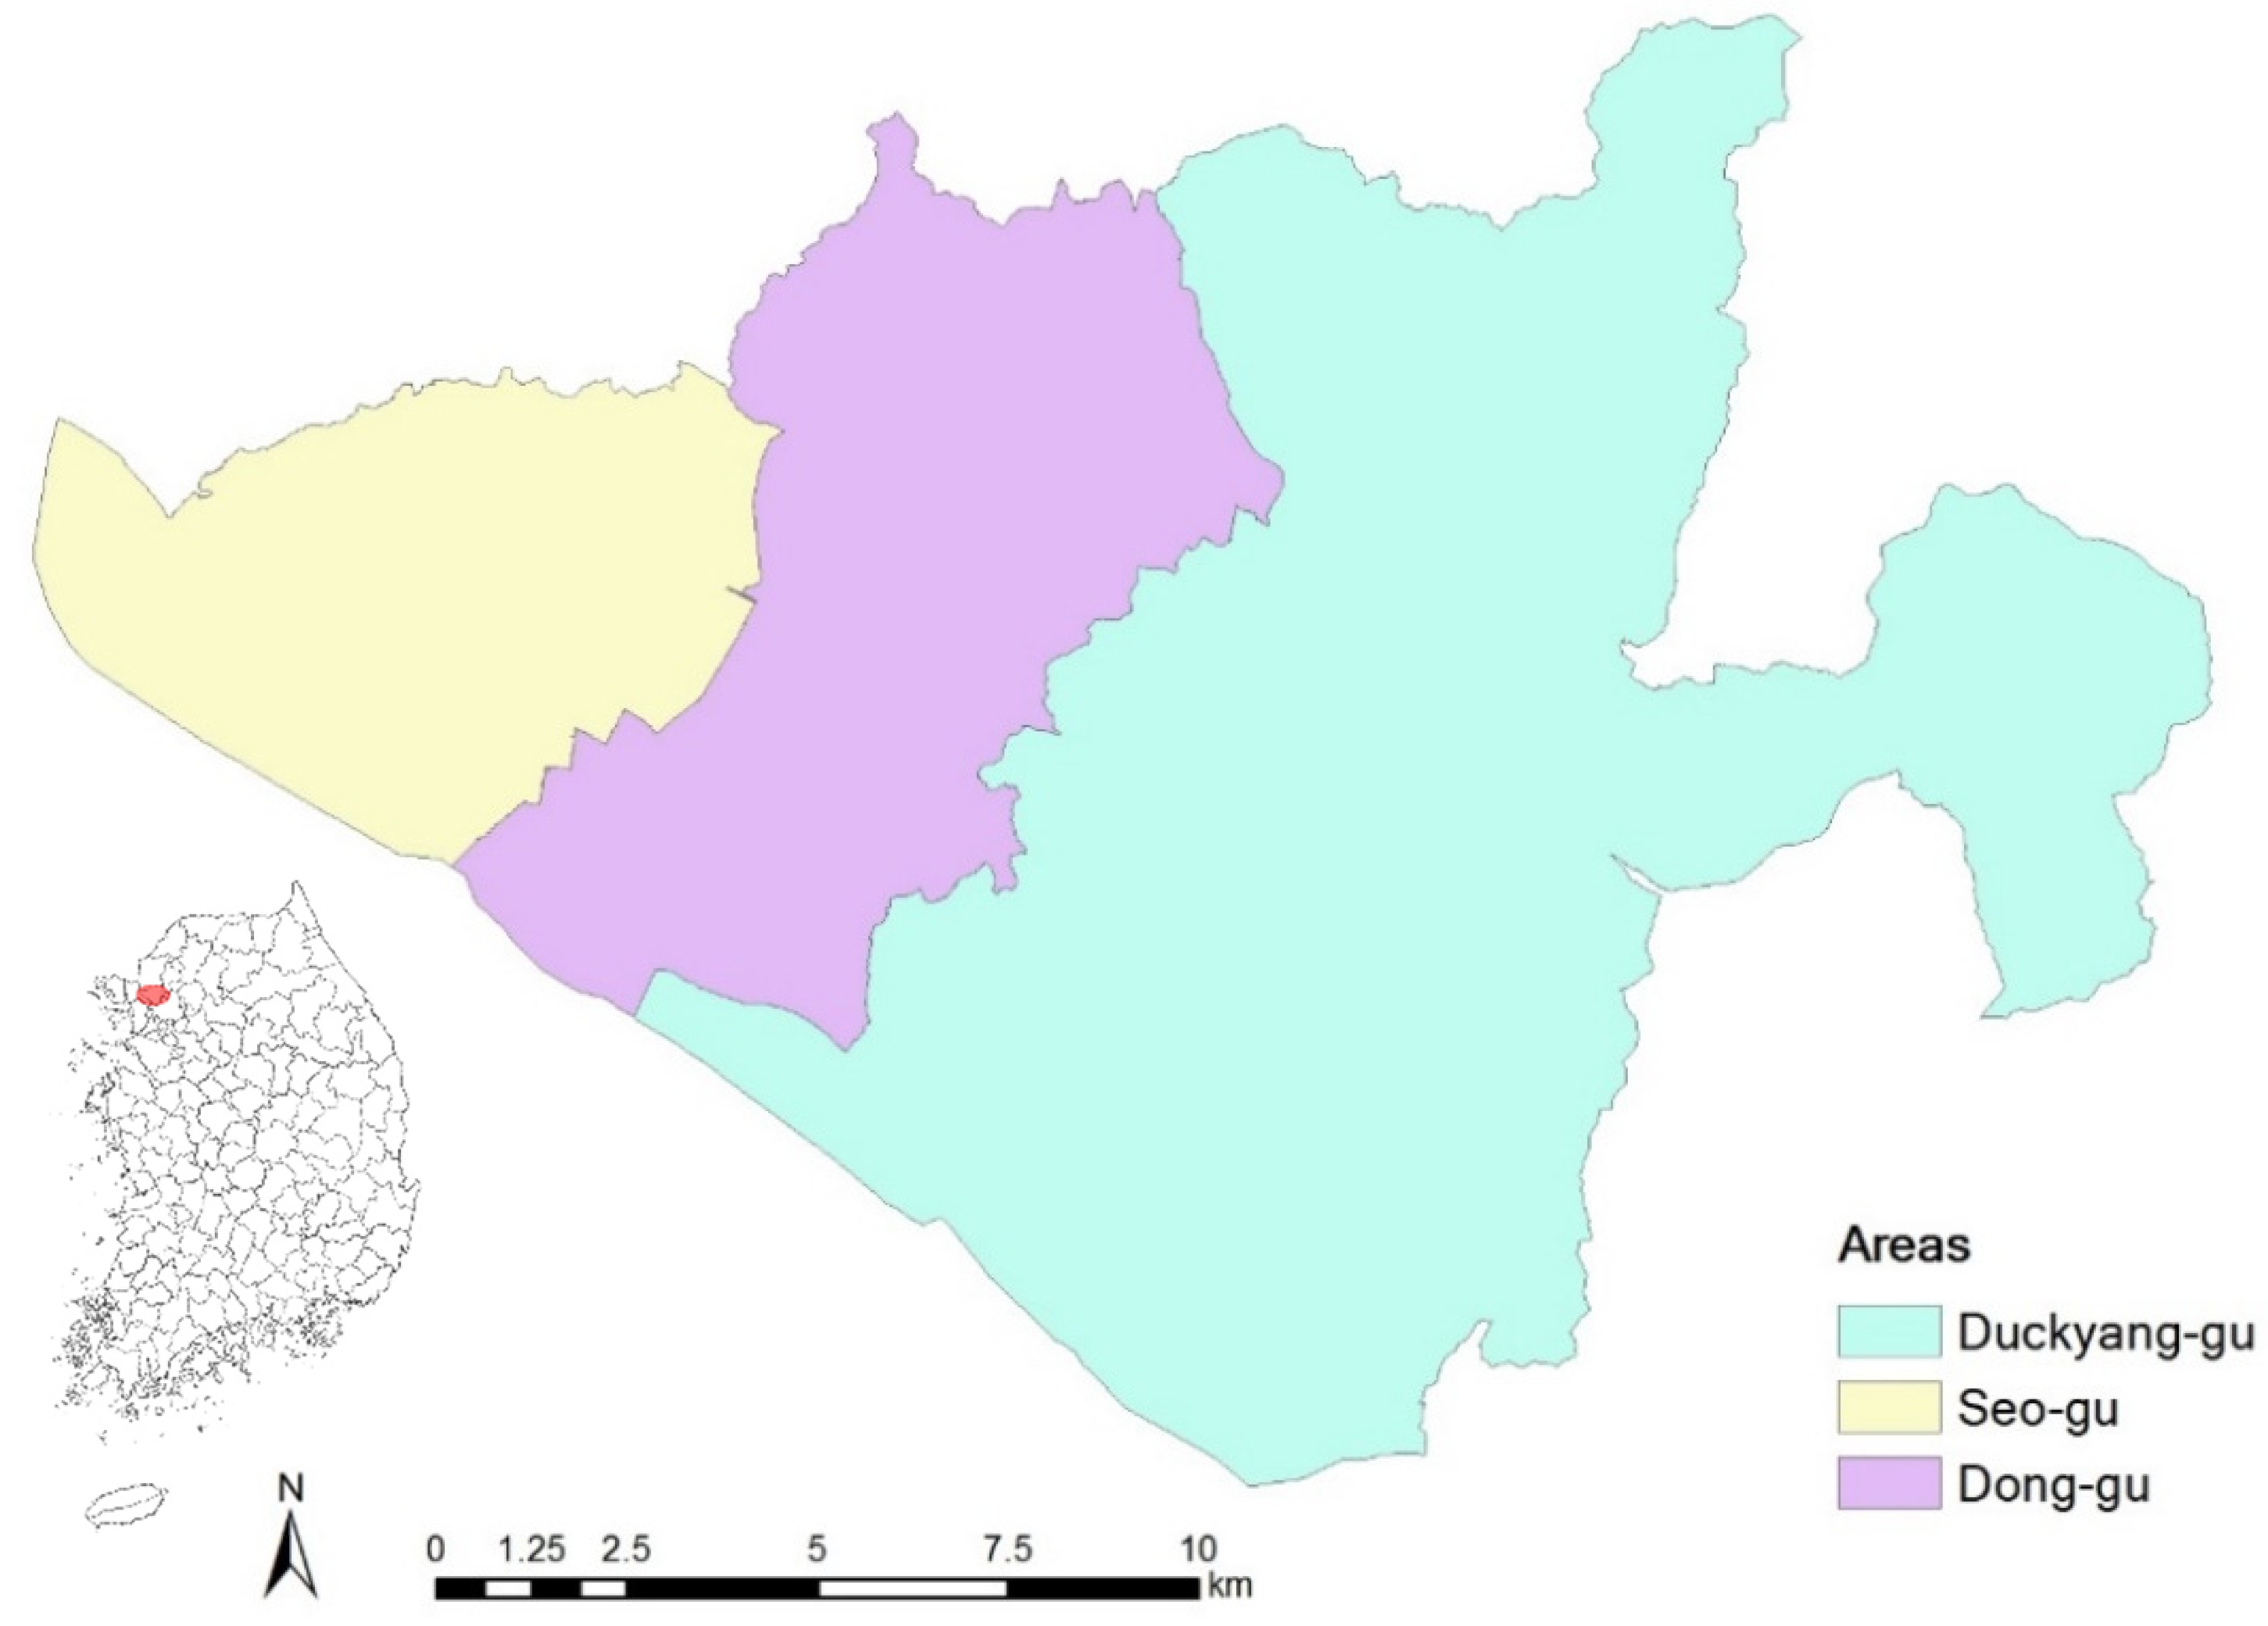
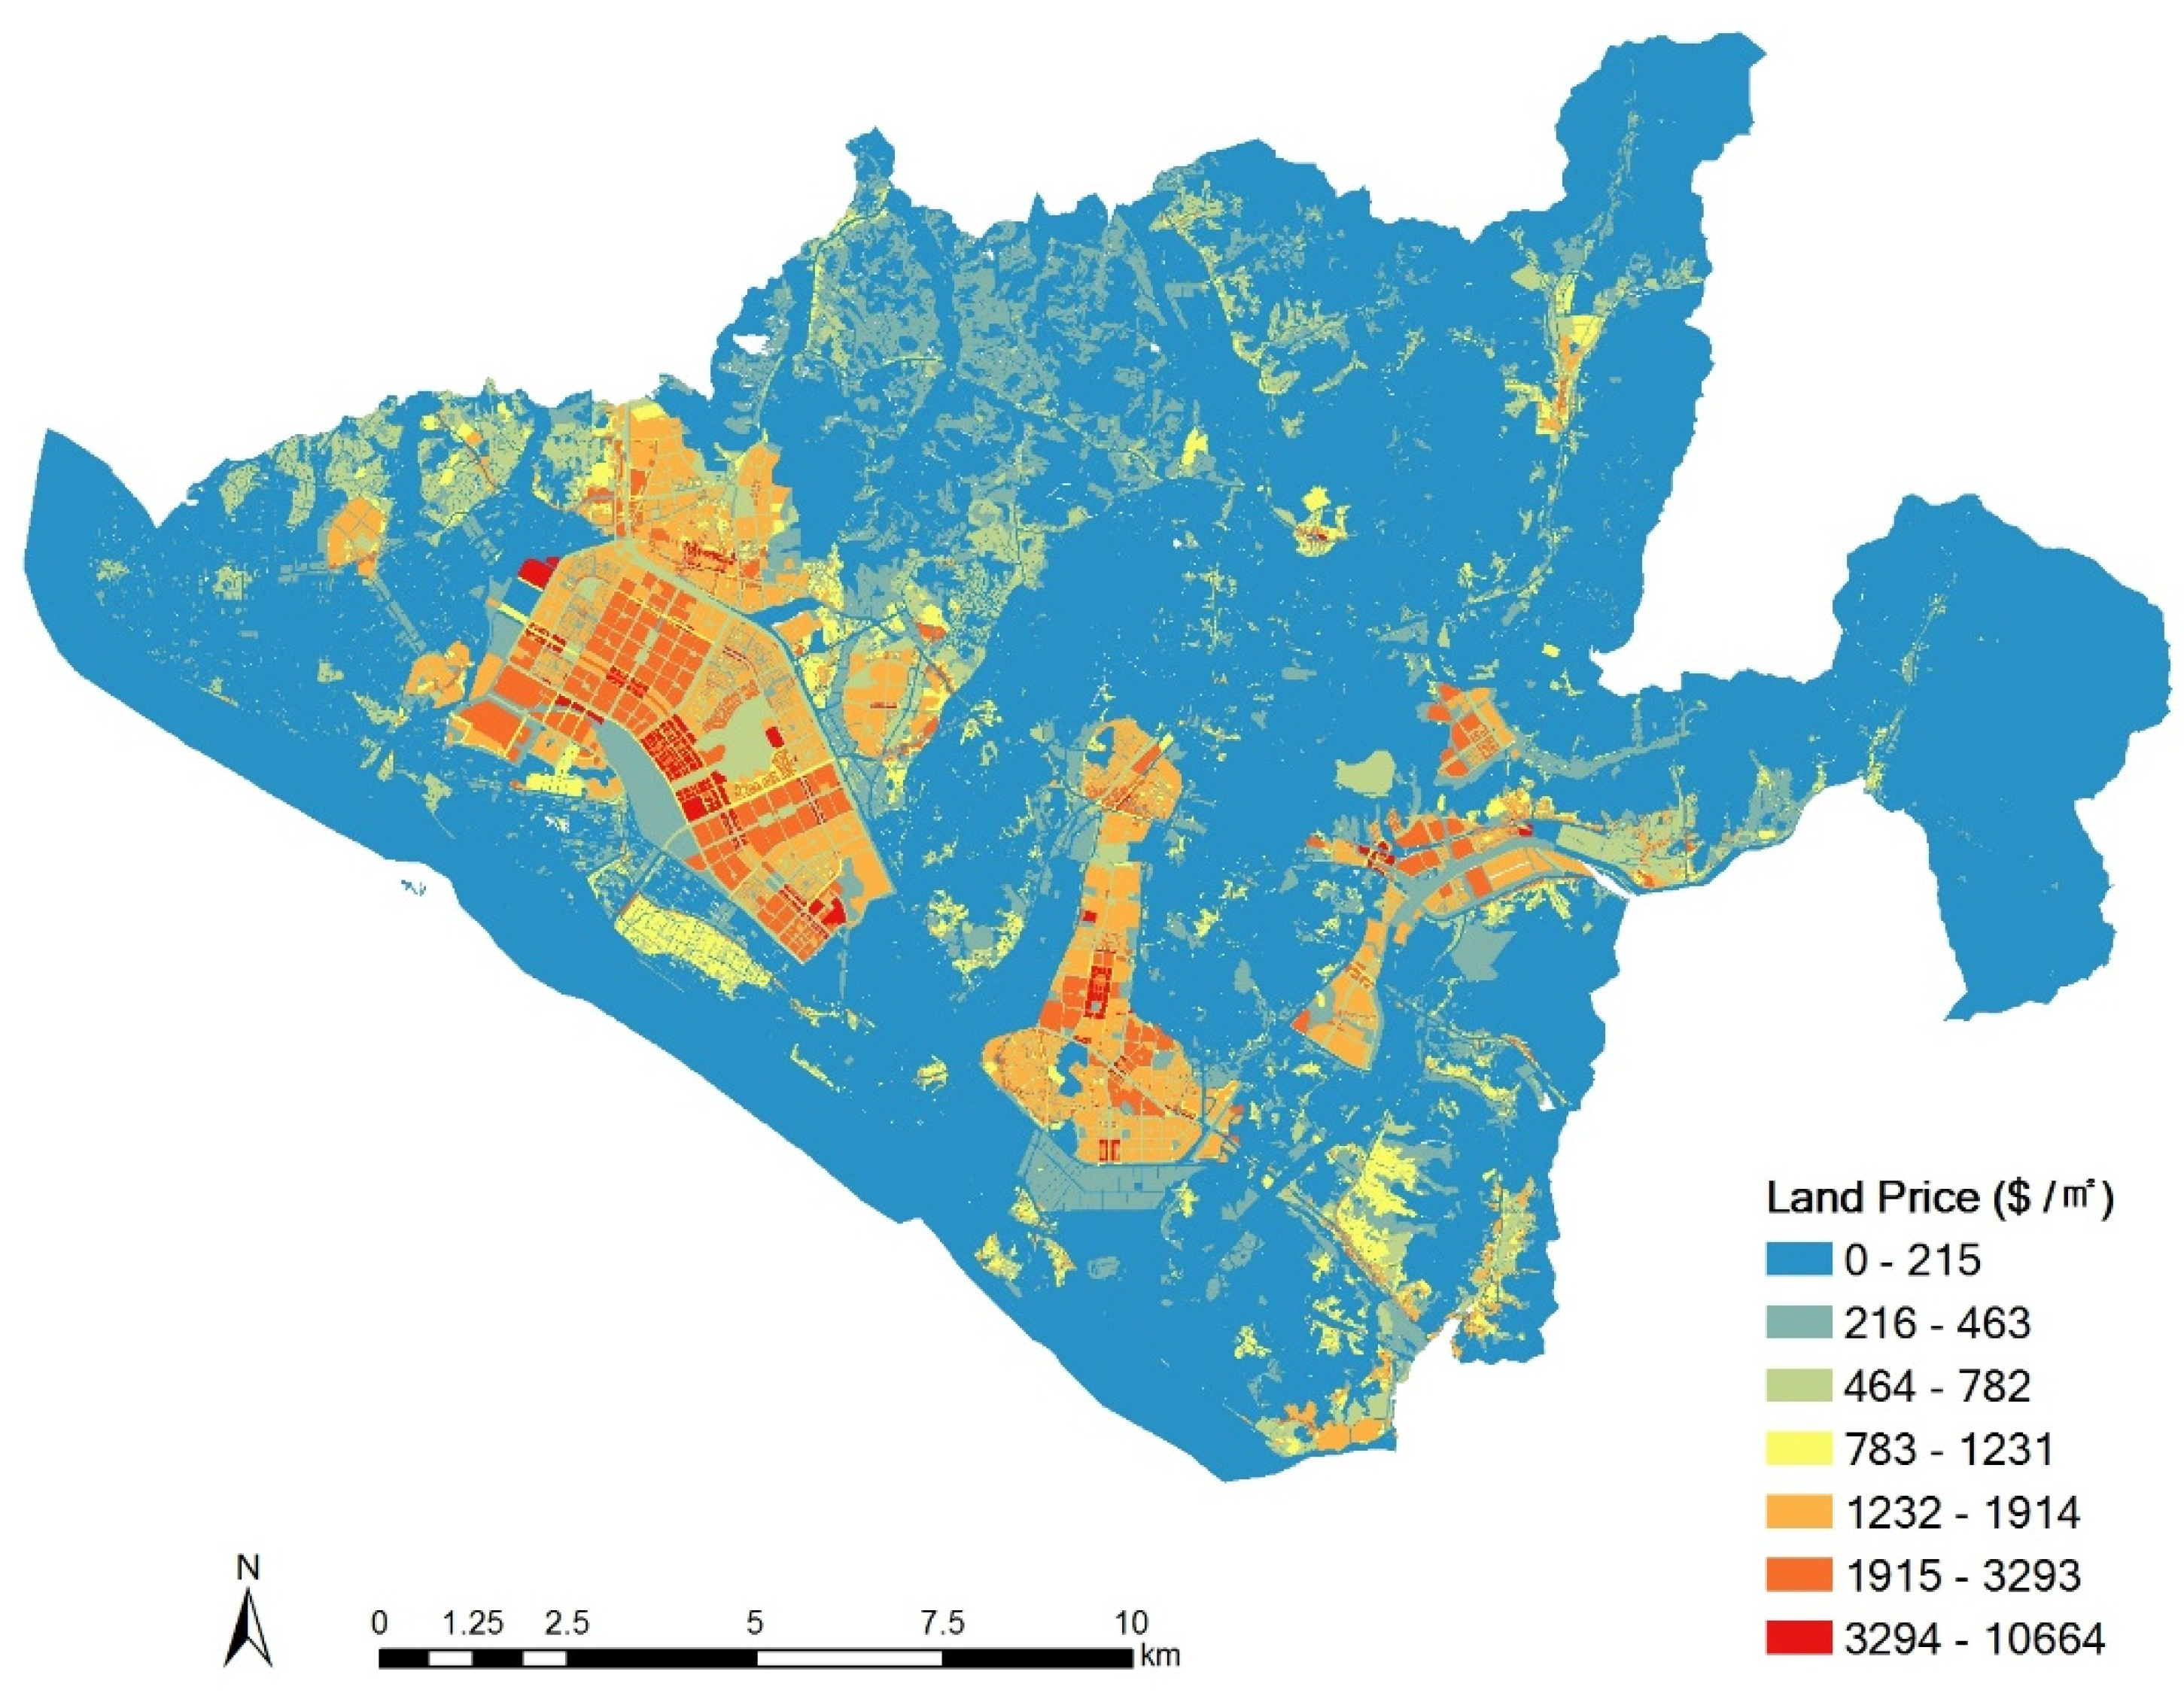
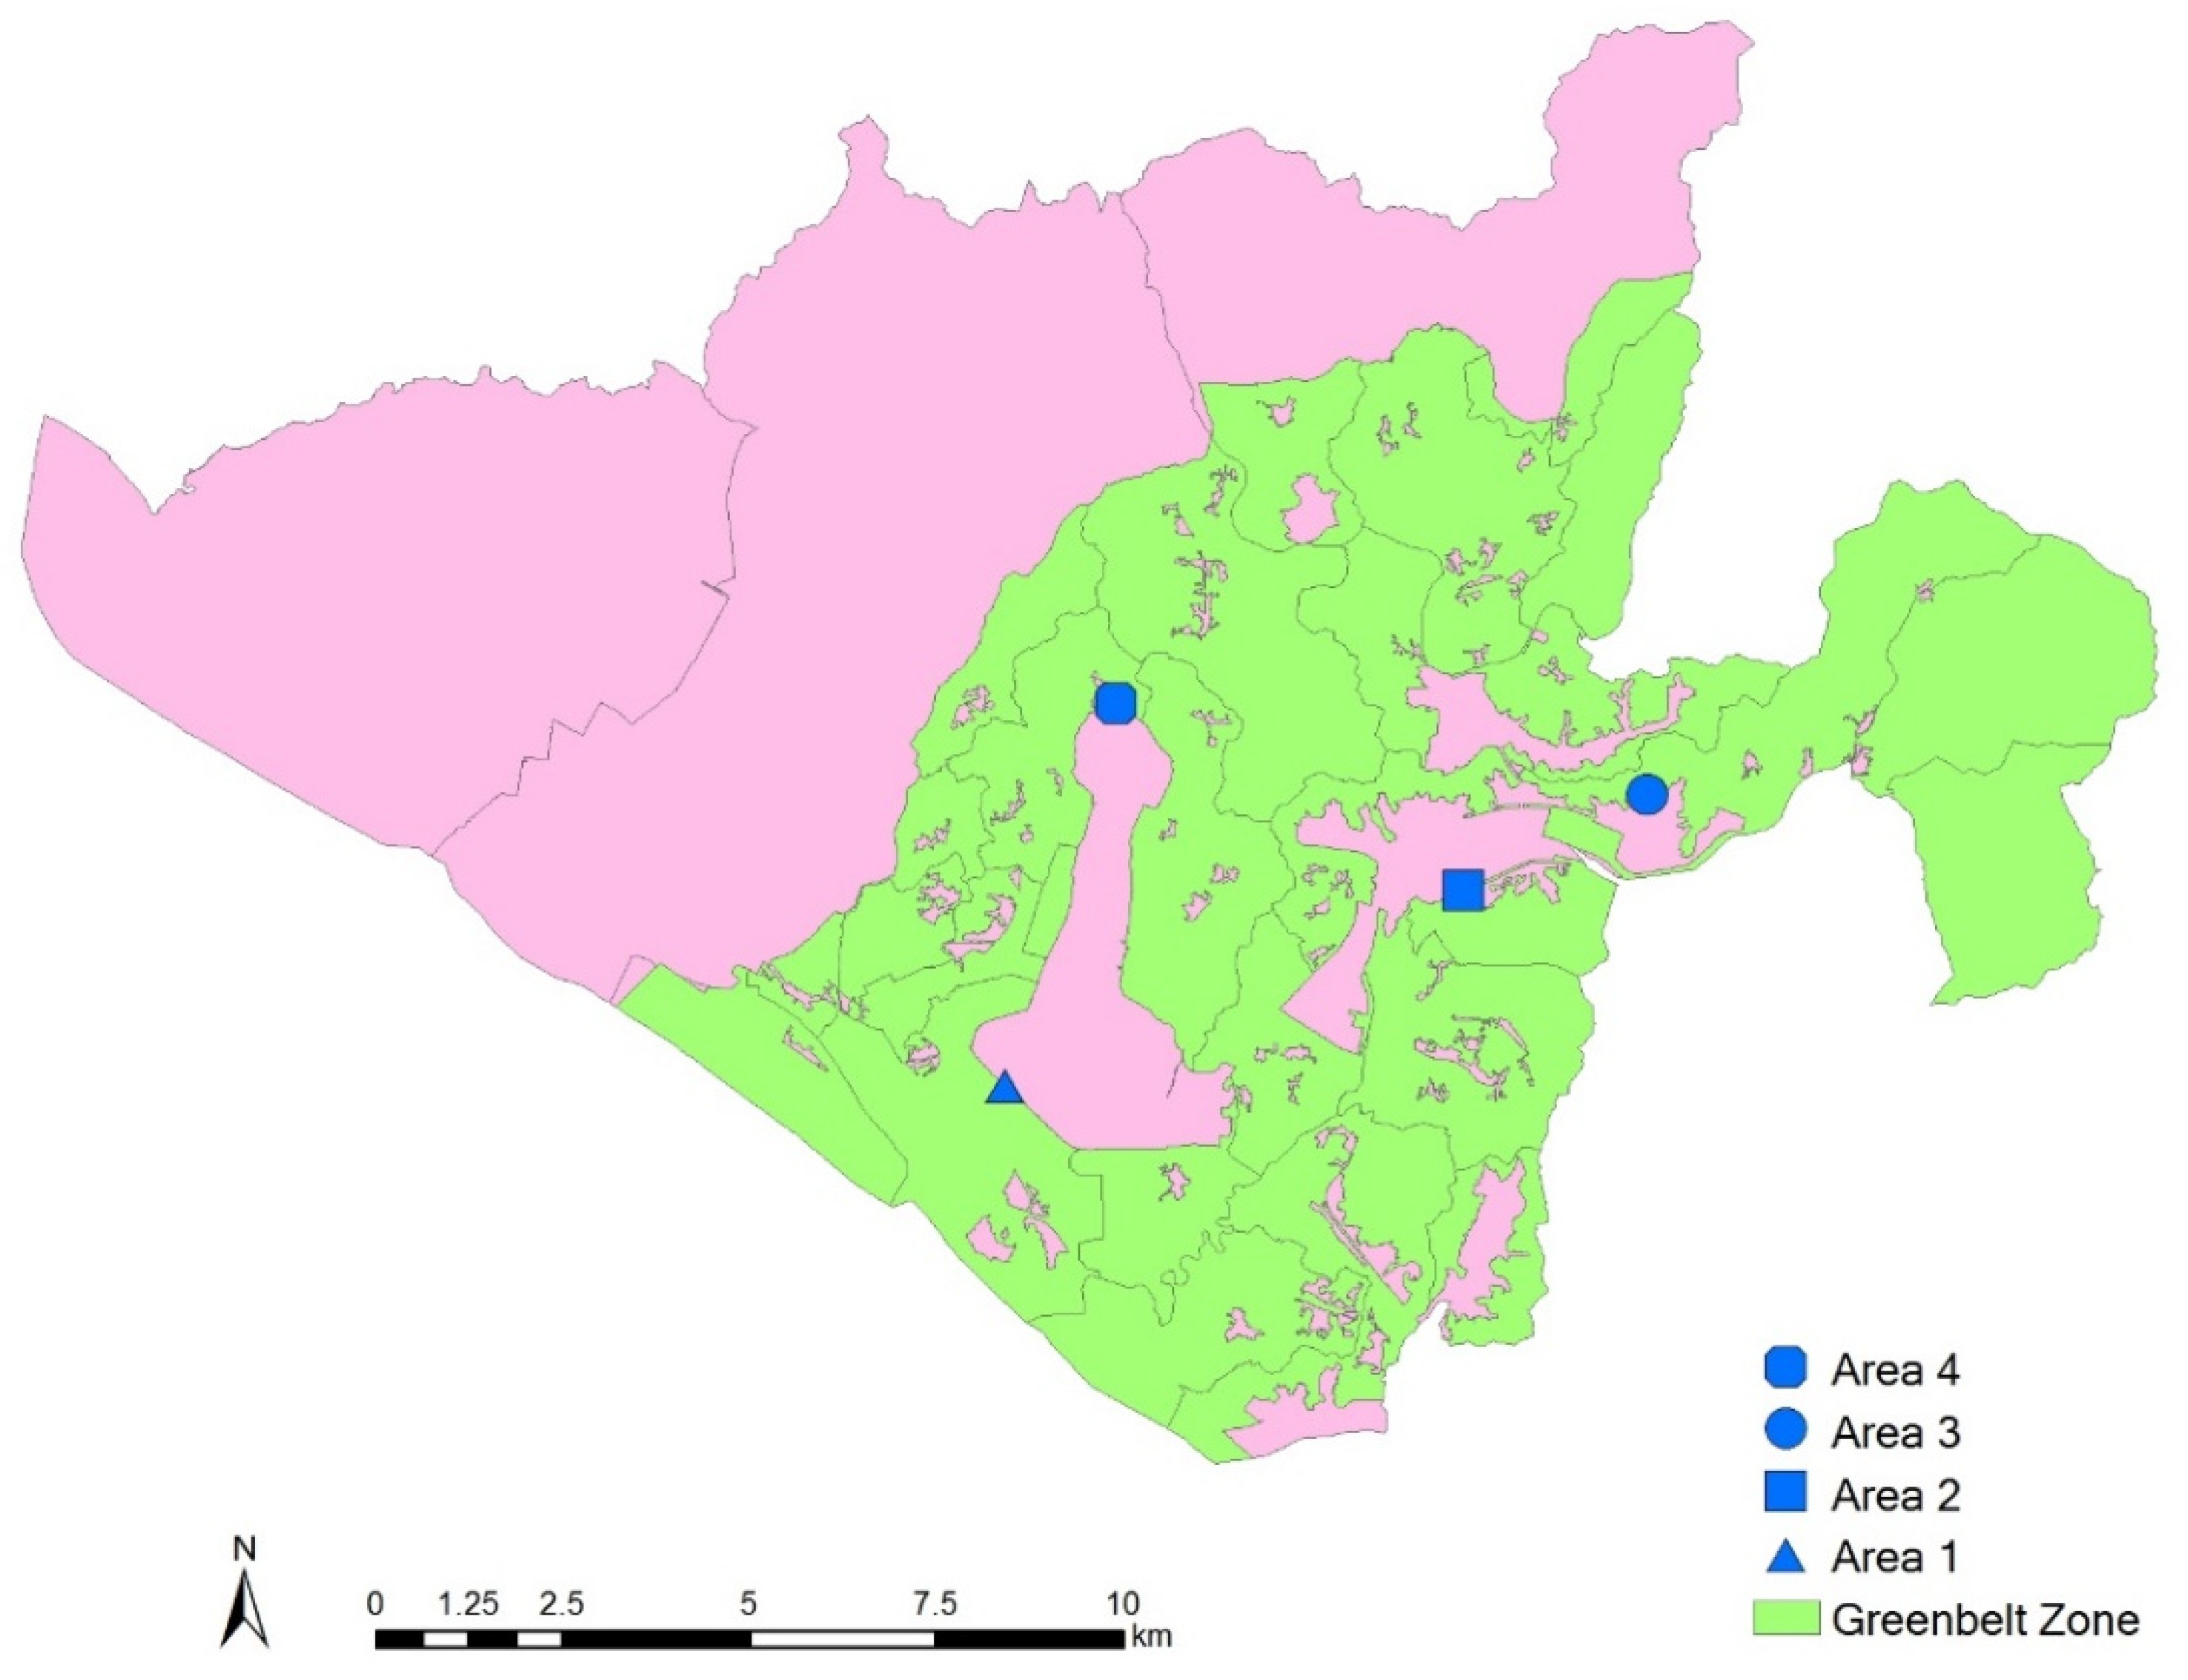
3. Study Area
4. Data and Methods
4.1. Data
4.2. Methods
5. Results
5.1. Log-linear Regression Models
5.2. Comparison of Land Price
6. Conclusions
7. Discussion
Author Contributions
Funding
Institutional Review Board Statement
Informed Consent Statement
Data Availability Statement
Acknowledgments
Conflicts of Interest
References
- Bengston, D.; Youn, Y. Urban containment policies and the protection of natural areas: The case of Seoul’s greenbelt. Ecol. Soc. 2006, 11, 3. [Google Scholar] [CrossRef]
- Banerjee, S.; Palit, D.; Roy, P. Assessment of vegetation under air pollution stress in urban industrial area for greenbelt development. Int. J. Environ. Sci. Technol. 2019, 16, 5857–5870. [Google Scholar] [CrossRef]
- Konijnendijk, C.C. The Role of Forestry in the Development and Reform of Green Belts. Plan. Pract. Res. 2010, 25, 241–254. [Google Scholar] [CrossRef]
- Kardani-Yazd, N.; Kardani-Yazd, N.; Daneshvar, M. Strategic spatial analysis of urban greenbelt plans in Mashhad city, Iran. Environ. Syst. Res. 2019, 8, 30. [Google Scholar] [CrossRef]
- Fitzsimons, J.; Pearsonb, C.J.; Lawsona, C.; Hill, M.J. Evaluation of land-use planning in greenbelts based on intrinsic characteristics and stakeholder values. Landsc. Urban Plan. 2012, 106, 23–34. [Google Scholar] [CrossRef]
- Cadieux, K.V.; Taylor, L.E.; Bunce, M.F. Landscape ideology in the Greater Golden Horseshoe Greenbelt Plan: Negotiating material landscapes and abstract ideals in the city’s countryside. J. Rural Stud. 2013, 32, 307–319. [Google Scholar] [CrossRef] [Green Version]
- Aguado, I.; Barrutia, J.M.; Echebarria, C. The green belt of Vitoria-Gasteiz. A successful practice for sustainable urban planning. Boletín Asociación Geógrafos Españoles 2013, 61, 181–193. [Google Scholar]
- Smiraglia, D.; Salvati, L.; Egidi, G.; Salvia, R.; Giménez-Morera, A.; Halbac-Cotoara-Zamfir, R. Toward a New Urban Cycle? A Closer Look to Sprawl, Demographic Transitions and the Environment in Europe. Land 2021, 10, 127. [Google Scholar] [CrossRef]
- Lityński, P.; Hołuj, A. Macroeconomic Perspective on Urban Sprawl: A Multidimensional Approach in Poland. Land 2021, 10, 116. [Google Scholar] [CrossRef]
- Kim, S.-B. The Role of Government in the Redistribution of Property Rights: The Case of the Korean Greenbelt. Int. Rev. Public Adm. 2004, 9, 97–111. [Google Scholar] [CrossRef]
- Kim, J.I.; Hyun, J.Y.; Lee, S.G. The Effects of Releasing Greenbelt Restrictions on Land Development in the Case of Medium-Sized Cities in Korea. Sustainability 2019, 11, 630. [Google Scholar] [CrossRef] [Green Version]
- Lee, C.; Linnenman, P. Dynamics of the greenbelt amenity effect on the land market: The case of Seoul’s greenbelt. Real Estate Econ. 1998, 26, 107–129. [Google Scholar] [CrossRef]
- Vongpraseuth, T.; Seong, E.Y.; Shin, S.; Kim, S.H.; Choi, C.G. Hope and reality of new towns under greenbelt regulation: The case of self-containment or transit-oriented metropolises of the first-generation new towns in the Seoul Metropolitan Area, South Korea. Cities 2020, 102, 102699. [Google Scholar] [CrossRef]
- Willis, K.; Whitby, M. The value of green belt land. J. Rural Stud. 1985, 1, 147–162. [Google Scholar] [CrossRef]
- Verheye, W.H. (Ed.) The value and price of land. In Land Use, Land Cover and Soil Sciences; UNESCO-EOLSS Publishers: Oxford, UK, 2007. [Google Scholar]
- Williams, E.; Gottfried, R.R.; Brockett, C.D.; Evans, J.P. An integrated analysis of the effectiveness of Tennessee’s Forest Greenbelt Program. Landsc. Urban Plan. 2004, 69, 287–297. [Google Scholar] [CrossRef]
- Pond, D. Ontario’s greenbelt: Growth management, farmland protection, and regime change in southern Ontairo. Can. Public Policy 2009, 35, 413–432. [Google Scholar]
- Greenbelt Coalition of Canada’s Capital Region. Greenbelt Coalition’s Position Paper for the NCC’s Greenbelt Master Plan Review. 2010. Available online: http://greenspace-alliance.ca/index.php/archives-nccfederal-government/greenbelt-master-plan-review-2/greenbelt-coalition-position-paper/ (accessed on 21 June 2021).
- Krajewska, M.; Źróbek, S.; Kovač, M.Š. The Role of Spatial Planning in the Investment Process in Poland and Slovenia. Real Estate Manag. Valuat. 2014, 22, 52–66. [Google Scholar] [CrossRef] [Green Version]
- London Green Belt Council Protecting London’s Green Belt. Available online: http://londongreenbeltcouncil.org.uk/ (accessed on 29 April 2021).
- Swanwick, C.; Dunnett, N.; Woolley, H. Nature, Role and Value of Green Space in Towns and Cities: An Overview. Built Environ. 2003, 29, 94–106. [Google Scholar] [CrossRef]
- Liu, O.Y.; Russo, A. Assessing the contribution of urban green spaces in green infrastructure strategy planning for urban ecosystem conditions and services. Sustain. Cities Soc. 2021, 68, 102772. [Google Scholar] [CrossRef]
- Leveau, L.M. Big cities with small green areas hold a lower species richness and proportion of migrant birds: A global analysis. Urban For. Urban Green. 2021, 57, 126953. [Google Scholar] [CrossRef]
- Tan, X.; Sun, X.; Huang, C.; Yuan, Y.; Hou, D. Comparison of cooling effect between green space and water body. Sustain. Cities Soc. 2021, 67, 102711. [Google Scholar] [CrossRef]
- Kaplan, G. Evaluating the roles of green and built-up areas in reducing a surface urban heat island using remote sensing data. Urbani Izziv 2019, 30, 105–112. [Google Scholar] [CrossRef]
- Bonilla-Bedoya, S.; Estrella, A.; Santos, F.; Herrera, M.Á. Forests and urban green areas as tools to address the challenges of sustainability in Latin American urban socio-ecological systems. Appl. Geogr. 2020, 125, 102343. [Google Scholar] [CrossRef]
- Lu, Y.; Chen, L.; Liu, X.; Yang, Y.; Sullivan, W.; Xu, W.; Webster, C.; Jiang, B. Green spaces mitigate racial disparity of health: A higher ratio of green spaces indicates a lower racial disparity in SARS-CoV-2 infection rates in the USA. Environ. Int. 2021, 152, 106465. [Google Scholar] [CrossRef]
- Ugolini, F.; Massetti, L.; Calaza-Martínez, P.; Cariñanos, P.; Dobbs, C.; Ostoić, S.K.; Marin, A.M.; Pearlmutter, D.; Saaroni, H.; Šaulienė, I.; et al. Effects of the COVID-19 pandemic on the use and perceptions of urban green space: An international exploratory study. Urban For. Urban Green. 2020, 56, 126888. [Google Scholar] [CrossRef] [PubMed]
- Burnett, H.; Olsen, J.R.; Nicholls, N.; Mitchell, R. Change in time spent visiting and experiences of green space following restrictions on movement during the COVID-19 pandemic: A nationally representative cross-sectional study of UK adults. BMJ Open 2021, 11, e044067. [Google Scholar] [CrossRef] [PubMed]
- Heo, S.; Lim, C.; Bell, M. Relationships between Local Green Space and Human Mobility Patterns during COVID-19 for Maryland and California, USA. Sustainability 2020, 12, 9401. [Google Scholar] [CrossRef]
- Benítez, G.; Alvarado-Castillo, G.; Palestina, R.A.; Cortés, M.; Williams, K.; Acosta, I. Designing a green belt for Xalapa City: Veracruz under current Mexican policies. Reg. Cohes. 2018, 8, 94–115. [Google Scholar] [CrossRef]
- Akimowicz, O.; Cummings, H.; Landman, K. Green lights in the Greenbelt? A qualitative analysis of farminvestment decision-making in peri-urban Southern Ontario. Land Use Policy 2016, 55, 24–36. [Google Scholar] [CrossRef]
- Akimowicz, M.; Vyn, R.J.; Cummings, H.; Landman, K. An introduction to mixed methods research in agricultural economics: The example of farm investment in Ontario’s Greenbelt, Canada. J. Rural Stud. 2018, 61, 162–235. [Google Scholar] [CrossRef]
- Semeraro, T.; Scarano, A.; Buccolieri, R.; Santino, A.; Aarrevaara, E. Planning of Urban Green Spaces: An Ecological Perspective on Human Benefits. Land 2021, 10, 105. [Google Scholar] [CrossRef]
- Macdonald, S.; Keil, R. The Ontario Greenbelt: Shifting the Scales of the Sustainability Fix? Prof. Geogr. 2012, 64, 125–145. [Google Scholar] [CrossRef]
- Amati, M.; Yokohari, M. Temporal changes and local variations in the functions of London’s green belt. Landsc. Urban Plan. 2006, 75, 125–142. [Google Scholar] [CrossRef]
- Yang, J.; Jinxing, Z. The failure and success of greenbelt program in Beijing. Urban For. Urban Green. 2007, 6, 287–296. [Google Scholar] [CrossRef]
- Siedentop, S.; Fina, S.; Krehl, A. Greenbelts in Germany’s regional plans—An effective growth management policy? Landsc. Urban Plan. 2016, 145, 71–82. [Google Scholar] [CrossRef]
- Wang, H.-B.; Li, H.; Ming, H.-B.; Hu, Y.-H.; Chen, J.-K.; Zhao, B. Past land use decisions and socioeconomic factors influence urban greenbelt development: A case study of Shanghai, China. Landsc. Ecol. 2014, 29, 1759–1770. [Google Scholar] [CrossRef]
- Xie, X.; Kang, H.; Behnisch, M.; Baildon, M.; Krüger, T. To what extent can the green belts prevent urban sprawl?—A comparative study of frankfurt am Main, London and Seoul. Sustainability 2020, 12, 679. [Google Scholar] [CrossRef] [Green Version]
- World Health Organization Regional Office for Europe. Urban Green Spaces: A Brief for Action. 2017. Available online: https://www.euro.who.int/__data/assets/pdf_file/0010/342289/Urban-Green-Spaces_EN_WHO_web3.pdf (accessed on 21 June 2021).
- Salbitano, F.; Borelli, S.; Conigliaro, M.; Chen, Y. Guidelines on Urban and Peri-Urban Forestry; FAO Forestry Paper No. 178; FAO: Rome, Italy, 2016. [Google Scholar]
- Asabere, P.K.; Huffman, F.E. The Relative Impacts of Trails and Greenbelts on Home Price. J. Real Estate Financ. Econ. 2009, 38, 408–419. [Google Scholar] [CrossRef]
- Yoon, H. When and where do we see the proximity effect of a new park?—A case study of the Dream Forest in Seoul, Korea. J. Environ. Plan. Manag. 2018, 61, 1113–1136. [Google Scholar] [CrossRef]
- Jung, E.; Choi, Y.; Yoon, H. The impact of the Gyeongui Line Park project on residential property values in Seoul, Korea. Habitat Int. 2016, 58, 108–117. [Google Scholar] [CrossRef]
- Nicholls, S.; Crompton, J.L. The Impact of Greenways on Property Values: Evidence from Austin, Texas. J. Leis. Res. 2005, 37, 321–341. [Google Scholar] [CrossRef]
- Netusil, N.R. The Effect of Environmental Zoning and Amenities on Property Values: Portland, Oregon. Land Econ. 2005, 81, 227–246. [Google Scholar] [CrossRef]
- Vyn, R.J. The Effect of Agricultural Zoning on Rural Residential Property Values: An Application to Ontario’s Greenbelt. Can. J. Agric. Econ. 2015, 63, 281–307. [Google Scholar] [CrossRef]
- Bono, H.R.; Gezon, L.L.; Smith, W.J.; Walker, M.D. The Impact of the Carrollton GreenBelt on Residential Housing Prices: A Spatial Approach. Coast. Bus. J. 2018, 16, 1–16. [Google Scholar]
- Bockarjova, M.; Botzen, W.; van Schie, M.; Koetse, M. Property price effects of green interventions in cities: A meta-analysis and implications for gentrification. Environ. Sci. Policy 2020, 112, 293–304. [Google Scholar] [CrossRef]
- Anderson, S.T.; West, S.E. Open space, residential property values, and spatial context. Reg. Sci. Urban Econ. 2006, 36, 773–789. [Google Scholar] [CrossRef] [Green Version]
- Czembrowski, P.; Łaszkiewicz, E.; Kronenberg, J.; Engström, G.; Andersson, E. Valuing individual characteristics and the multifunctionality of urban green spaces: The integration of sociotope mapping and hedonic pricing. PLoS ONE 2019, 14, e0212277. [Google Scholar] [CrossRef]
- Daams, M.N.; Sijtsma, F.J.; Van der Vlist, A. The Effect of Natural Space on Nearby Property Prices: Accounting for Perceived Attractiveness. Land Econ. 2016, 92, 389–410. [Google Scholar] [CrossRef]
- Morancho, A.B. A hedonic valuation of urban green areas. Landsc. Urban Plan. 2003, 66, 35–41. [Google Scholar] [CrossRef]
- Kim, H.-S.; Lee, G.-E.; Lee, J.-S.; Choi, Y. Understanding the local impact of urban park plans and park typology on housing price: A case study of the Busan metropolitan region, Korea. Landsc. Urban Plan. 2019, 184, 1–11. [Google Scholar] [CrossRef]
- Lee, S.; Yoon, H. Effects of greenbelt cancellation on land value: The case of Wirye New Town, South Korea. Urban For. Urban Green. 2019, 41, 55–66. [Google Scholar] [CrossRef]
- Deaton, B.J.; Vyn, R.J. The effect of strict agricultural zoning on agricultural land values: The case of Ontario’s greenbelt. Am. J. Agric. Econ. 2010, 92, 941–955. [Google Scholar] [CrossRef]
- Herath, S.; Choumert, J.; Maier, G. The value of the greenbelt in Vienna: A spatial hedonic analysis. Ann. Reg. Sci. 2015, 54, 349–374. [Google Scholar] [CrossRef] [Green Version]
- Morano, P.; Guarini, M.R.; Tajani, F.; Di Liddo, F.; Anelli, D. Incidence of different types of urban green spaces on property prices. A case study in the Flaminio District of Rome (Italy). In Computational Science and Its Applications—ICCSA 2019; Misra, S., Gervasi, O., Murgante, B., Stankova, E., Korkhov, V., Torre, C., Rocha, A.M.A.C., Taniar, D., Apduhan, B.O., Tarantino, E., Eds.; Springer: Cham, Switzerland, 2019; Volume 11622. [Google Scholar] [CrossRef]
- Han, H.; Huang, C.; Ahn, K.-H.; Shu, X.; Lin, L.; Qiu, D. The Effects of Greenbelt Policies on Land Development: Evidence from the Deregulation of the Greenbelt in the Seoul Metropolitan Area. Sustainability 2017, 9, 1259. [Google Scholar] [CrossRef] [Green Version]
- Ministry of Land, Infrastructure and Transport. Available online: http://www.molit.go.kr/USR/policyData/m_34681/dtl?id=67 (accessed on 21 June 2021).
- Kwon, Y.; Kwon, I.; Lee, Y.; Jang, H. Development Restricted Area; Communicationbooks: Seoul, Korea, 2020. [Google Scholar]
- Ministry of Land, Infrastructure and Transport. Restricted Development Zone Designation. Available online: http://stat.molit.go.kr/portal/cate/statMetaView.do?hRsId=18&hFormId=516&hSelectId=516&hPoint=00&hAppr=1&hDivEng=&oFileName=&rFileName=&midpath=&month_yn=N&sFormId=516&sStart=2020&sEnd=2020&sStyleNum=596&EXPORT= (accessed on 21 June 2021).
- Goyangcity. Available online: http://www.goyang.go.kr/www/index.do (accessed on 27 February 2021).
- Crompton, J.L. The impact of parks on property values: Empirical evidence from the past two decades in the United States. Manag. Leis. 2005, 10, 203–218. [Google Scholar] [CrossRef]
- Han, A.T.; Go, M.H. Explaining the national variation of land use: A cross-national analysis of greenbelt policy in five countries. Land Use Policy 2019, 81, 644–656. [Google Scholar] [CrossRef]
- Econometrics and the Log-Linear Model. Available online: https://www.dummies.com/education/economics/econometrics/econometrics-and-the-log-linear-model/ (accessed on 4 May 2021).
- Hyndman, R.; Koehler, A.B. Another look at measures of forecast accuracy. Int. J. Forecast. 2006, 22, 679–688. [Google Scholar] [CrossRef] [Green Version]
- Jun, M.-J. The effects of Seoul’s greenbelt on the spatial distribution of population and employment, and on the real estate market. Ann. Reg. Sci. 2012, 49, 619–642. [Google Scholar] [CrossRef]
- Zepp, H. Regional GrenBelts in the Ruhr region a planning concept revisited in view of ecosystem services. Erdkunde 2018, 72, 1–22. [Google Scholar] [CrossRef]
- Kang, S.-J. A Study on the Legal Improvement of Full-scale Park area abolition System. Dong-A Law Rev. 2018, 80, 141–176. [Google Scholar] [CrossRef]


| Variable | Min | Max | Mean | Std. Dev |
|---|---|---|---|---|
| Area 1 | ||||
| LandPrice (USD/m2) | 13.2 | 4474.8 | 1088.9 | 888.2 |
| NDRA (1 or 0) | 0 | 1 | 0.68 | 0.46 |
| Dist_GL (m) | 0.3 | 996.8 | 436.4 | 237.2 |
| Dist_sub (m) | 2.13 | 1191 | 557.8 | 232.2 |
| ReGe (1 or 0) | 0 | 1 | 0.46 | 0.50 |
| ReSer (1 or 0) | 0 | 1 | 0.02 | 0.46 |
| ReSi (1 or 0) | 0 | 1 | 0.39 | 0.14 |
| SchEnv (1 or 0) | 0 | 1 | 0.64 | 0.49 |
| SZ (1 or 0) | 0 | 1 | 0.08 | 0.48 |
| Pcul (1 or 0) | 0 | 1 | 0.08 | 0.27 |
| Dist_Cen (m) | 1436.9 | 3425.6 | 2243.9 | 467.6 |
| Area 2 | ||||
| LandPrice (USD/m2) | 81.6 | 3256.0 | 895.1 | 715.8 |
| NDRA (1 or 0) | 0 | 1 | 0.63 | 0.48 |
| Dist_GL (m) | 0.4 | 958.9 | 344.3 | 270 |
| Dist_sub (m) | 367 | 5667.4 | 4759.5 | 558.2 |
| ReSer (1 or 0) | 0 | 1 | 0.09 | 0.28 |
| SchEnv (1 or 0) | 0 | 1 | 0.23 | 0.42 |
| Pcul (1 or 0) | 0 | 1 | 0.04 | 0.19 |
| Dist_Cen (m) | 4196.6 | 6190.6 | 5259.3 | 465.1 |
| Area 3 | ||||
| LandPrice (USD/m2) | 54.5 | 4565.0 | 1022.6 | 899.4 |
| NDRA (1 or 0) | 0 | 1 | 0.84 | 0.36 |
| Dist_GL (m) | 0.14 | 470 | 132 | 110 |
| Dist_sub (m) | 6099 | 8071 | 6847 | 411 |
| ReGe (1 or 0) | 0 | 1 | 0.13 | 0.34 |
| SchEnv (1 or 0) | 0 | 1 | 0.50 | 0.50 |
| Pcul (1 or 0) | 0 | 1 | 0.10 | 0.30 |
| Dist_Cen (m) | 6833.2 | 8793.7 | 7781.7 | 387.1 |
| Area 4 | ||||
| LandPrice (USD/m2) | 112.2 | 484.0 | 931.0 | 842.1 |
| NDRA (1 or 0) | 0 | 1 | 0.56 | 0.49 |
| Dist_GL (m) | 0.8 | 894 | 250 | 185 |
| Dist_sub (m) | 2776 | 4762 | 3591 | 465 |
| URD (1 or 0) | 0 | 1 | 0.28 | 0.45 |
| MMD (1 or 0) | 0 | 1 | 0.57 | 0.50 |
| REIZ (1 or 0) | 0 | 1 | 0.10 | 0.30 |
| SEIA (1 or 0) | 0 | 1 | 0.14 | 0.34 |
| SF (1 or 0) | 0 | 1 | 0.41 | 0.49 |
| PCSF (1 or 0) | 0 | 1 | 0.04 | 0.19 |
| Dist_Cen (m) | 1942.2 | 3939.1 | 2669.5 | 492.6 |
| Buffer Size | Model | Adj. | DF |
|---|---|---|---|
| (m) | R-Square | ||
| Area 1 | |||
| 500 | Log(LandPrice) = 11.61 + 2.2 × DRA − 7.5 × 10⁻⁵ × NDRA_G + 1.9 × 10⁻⁴ × Dist_sub − 0.2 × URD − 0.08 × MMD + 0.27 × REIZ + 0.2 × SEIA − 0.6 × SF | 0.75 | 1230 |
| 1000 | Log(LandPrice) = 12.2 + 2.2 × NDRA − 5.02 × 10⁻⁴ × NDRA_G − 3.9 × 10⁻⁴ × Dist_sub + 0.25 × URD − 0.57 × MMD − 3.2 × 10⁻⁴ × Dist_Cen | 0.78 | 4391 |
| 500–1000 | Log(LandPrice) = 11.4 + 1.8 × NDRA + 3.6 × 10⁻⁴ × NDRA_G + 3.1 × 10⁻⁴ × Dist_sub + 3.3 × URD − 0.55 × MMD + 0.18 × REIZ − 0.41 × SF | 0.79 | 3329 |
| Area 2 | |||
| 500 | Log(LandPrice) = 16.4 + 1.6 × NDRA + 6.7 × 10⁻⁵ × NDRA_G − 6.2 × 10⁻⁴ × Dist_sub − 0.92 × MMD − 0.4 × PCSF − 2.5 × 10⁻⁴ × Dist_Cen | 0.54 | 921 |
| 1000 | Log(LandPrice) = 12.15 + 1.5 × NDRA + 8.9 × 10⁻⁶ × NDRA_G + 1.2 × 10⁻⁴ × Dist_sub − 1.2 − 5.3 × PCSF − 5.4 × 10⁻⁴ × Dist_Cen | 0.61 | 2292 |
| 500–1000 | Log(LandPrice) = 12 + 1.5 × NDRA + 1.9 × 10⁻⁴ × NDRA_G + 1.8 × 10⁻⁴ × Dist_sub − 1.6 × MMD − 0.6 × PCSF − 1.6 × 10⁻⁴ × Dist_Cen | 0.65 | 1549 |
| Area 3 | |||
| 500 | Log(LandPrice) = 17.81 + 0.8 × NDRA + 1.0 × 10⁻³ × NDRA_G − 9.0 × 10⁻⁴ × Dist_sub | 0.38 | 832 |
| 1000 | Log(LandPrice) = 17.2 + 0.8 × NDRA + 1.2 × 10⁻³ × NDRA_G − 1.0 × 10⁻⁴ × Dist_sub − 1.8 × MMD + 0.12 × SEIA − 2.1 × 10⁻⁴ × Dist_Cen | 0.6 | 2438 |
| 500–1000 | Log(LandPrice) = 17.9 + 0.9 × NDRA + 7.5 × 10⁻⁴ × NDRA_G − 1.1 × 10⁻³ × Dist_sub − 1.7 × MMD + 0.09 × SEIA + 2.9 × 10⁻⁴ × Dist_Cen | 0.63 | 1785 |
| Area 4 | |||
| 500 | Log(LandPrice) = 14 + 1.4 × NDRA + 4.5 × 10⁻⁴ × NDRA_G + 6.2 × 10⁻⁴ × Dist_sub − 0.1 × URD − 0.7 × MMD + 0.6 × REIZ + 0.2 × SEIA − 0.5 × SF − 1.4 × 10⁻³ × Dist_Cen | 0.75 | 612 |
| 1000 | Log(LandPrice) = 14 + 1.5 × NDRA + 6.6 × 10⁻⁴ × NDRA_G − 1.0 × 10⁻⁴ × Dist_sub − 0.16 × URD − 0.8 × MMD + 0.51 × REIZ + 0.16 × SEIA − 0.4 × SF − 5.6 × 10⁻⁴ × Dist_Cen | 0.8 | 2614 |
| 500–1000 | Log(LandPrice) = 14 + 1.5 × NDRA + 8.9 × 10⁻⁴ × NDRA_G − 2.0 × 10⁻⁴ × Dist_sub − 0.16 × URD − 0.78 × MMD + 0.37 × REIZ + 0.12 × SEIA − 0.47 × SF − 4.5 × 10⁻⁴ × Dist_Cen | 0.81 | 2111 |
| Buffer Size (m) | RMSE (Root Mean of Squared Errors) | MAPE (Mean of Absolute Percentage Errors) | MASE (Mean of Absolute Scaled Errors) | AIC |
|---|---|---|---|---|
| Area 1 | ||||
| 500 | 0.53 | 3.16 | 0.50 | 1960 |
| 1000 | 0.60 | 3.76 | 0.44 | 7999 |
| 500–1000 | 0.61 | 3.78 | 0.41 | 6134 |
| Area 2 | ||||
| 500 | 0.71 | 4.49 | 0.69 | 1928 |
| 1000 | 0.70 | 4.38 | 0.63 | 4873 |
| 500–1000 | 0.67 | 4.07 | 0.58 | 3165 |
| Area 3 | ||||
| 500 | 1.10 | 7.10 | 0.80 | 2554 |
| 1000 | 0.90 | 5.61 | 0.66 | 6437 |
| 500–1000 | 0.89 | 5.55 | 0.63 | 4677 |
| Area 4 | ||||
| 500 | 0.63 | 3.81 | 0.44 | 1203 |
| 1000 | 0.61 | 3.59 | 0.38 | 4875 |
| 500–1000 | 0.59 | 3.49 | 0.36 | 3816 |
| Buffer Size (m) | Average in GB (USD/m2) | Average Outside of GB (USD/m2) | Difference in Average (USD/m2) |
|---|---|---|---|
| Area 1 | |||
| 500 | 108 | 1316 | 1207 |
| 1000 | 107 | 1204 | 1097 |
| 500–1000 | 107 | 1204 | 1044 |
| Area 2 | |||
| 500 | 266 | 932 | 677 |
| 1000 | 237 | 914 | 665 |
| 500–1000 | 223 | 900 | 677 |
| Area 3 | |||
| 500 | 179 | 849 | 760 |
| 1000 | 151 | 874 | 723 |
| 500–1000 | 138 | 882 | 744 |
| Area 4 | |||
| 500 | 187 | 1025 | 838 |
| 1000 | 166 | 1194 | 1028 |
| 500–1000 | 159 | 1242 | 1082 |
| Area | Difference in Land Price Within 500 m Buffer (USD/m2) | Difference in Land Price Within 1000 m Buffer (USD/m2) | Difference in Land Price Within 500–1000 m Buffer (USD/m2) | Average Difference in Land Price (USD/m2) |
|---|---|---|---|---|
| Area 1 | 1207 | 1097 | 1044 | 1116 |
| Area 2 | 665 | 677 | 677 | 673 |
| Area 3 | 670 | 723 | 744 | 713 |
| Area 4 | 838 | 1028 | 1082 | 983 |
| Average difference in land price in Areas 1–4 | USD 871/m2 |
| Difference in land price in greenbelt | USD 110 billion |
| Areas | 50% | 30% | 10% |
|---|---|---|---|
| Area 1 | 71 | 42 | 14 |
| Area 2 | 43 | 26 | 9 |
| Area 3 | 45 | 27 | 9 |
| Area 4 | 62 | 37 | 12 |
| Greenbelt area | 55 | 33 | 11 |
| Area | Difference in Land Price (USD/m2) |
|---|---|
| Jugyo-dong, | 698 |
| Samsong-dong 1 | 985 |
| Samsong-dong 2 | 833 |
| Average | 839 |
Publisher’s Note: MDPI stays neutral with regard to jurisdictional claims in published maps and institutional affiliations. |
© 2021 by the authors. Licensee MDPI, Basel, Switzerland. This article is an open access article distributed under the terms and conditions of the Creative Commons Attribution (CC BY) license (https://creativecommons.org/licenses/by/4.0/).
Share and Cite
Lee, D.; Choi, C. An Analysis of the Effects of Development-Restricted Areas on Land Price Using Spatial Analysis. Land 2021, 10, 660. https://doi.org/10.3390/land10060660
Lee D, Choi C. An Analysis of the Effects of Development-Restricted Areas on Land Price Using Spatial Analysis. Land. 2021; 10(6):660. https://doi.org/10.3390/land10060660
Chicago/Turabian StyleLee, Dongkwan, and Choongik Choi. 2021. "An Analysis of the Effects of Development-Restricted Areas on Land Price Using Spatial Analysis" Land 10, no. 6: 660. https://doi.org/10.3390/land10060660