Article

Scale Transition and Structure–Function Synergy Differentiation of Rural Residential Land: A Dimensionality Reduction Transmission Process from Macro to Micro Scale

1
School of Public Administration and Policy, Shandong University of Finance and Economics, Jinan 250014, China
2
Shandong Institute of Territorial and Spatial Planning, Jinan 250014, China
*
Author to whom correspondence should be addressed.
Land 2021, 10(6), 647; https://doi.org/10.3390/land10060647
Submission received: 8 May 2021 / Revised: 11 June 2021 / Accepted: 14 June 2021 / Published: 17 June 2021
(This article belongs to the Special Issue Land Use Transitions under Rapid Urbanization)

Abstract

:
In order to enhance the scientific understanding of the transition law of rural residential areas and enrich the theory and method system of land use transition research, this article takes Shandong Province as an example and constructs a comprehensive research framework of rural residential land scale, structure, and function from the perspective of the combination of the macro and micro scales based on differences between the rural residential areas in the region and the village scale forms. Using model quantitative analysis and horizontal comparative analysis methods, this paper explores the process characteristics of rural residential land use scale transition and the corresponding stage differentiation law of spatial structure and system function. Research has shown that the stage characteristics of the scale transition of rural residential land use in Shandong Province in the past 10 years are significant. The five transition stages—from the primary stage, low stage, intermediate stage, advanced stage, to the stable stage—show obvious spatial agglomeration and spatial autocorrelation, which are mainly driven by the positive and negative interactions of economic development, the policy environment, natural conditions, and population. With the gradual upgrading of the land use scale transition in rural residential areas, the spatial pattern of rural residential areas has been continuously optimized, the land use structure has tended to be balanced and complicated, and the living-production-ecological function as a whole has been strengthened. The essence of this type of differentiation is the differential performance of rural residential areas adapting their own conditions to the external environment. The transition of the rural residential area from the macro to the micro scale is also the process of realizing rural reconstruction and rural revitalization. In the future, under the framework of the “element–structure–function” system of rural residential areas, the rural transition and development should be continuously promoted through the support, organization, guidance, and promotion mechanisms of internal and external factors.

1. Introduction

Land use transition (LUT) is a new topic in the international frontier research of Land Change Science (LCS) [1]. Since the proposal of Mather and Grainger et al. [2,3,4], rapid development has been achieved in the land use transition of woodland [5,6], farmland [7,8], urban and rural construction land [9,10], and regional land [11,12]. In recent years, the depth of research on land use transition, especially arable land use transition from the point of view of land-scale research, has expanded to green transition [13], function transition [14], intensive transition [15], and arable land use transition [16,17,18,19] from the new perspectives of labor factor changes, the relationship between input and output, the organizational structure, and rural revitalization. At the same time, the scope of land use transition research has also been widened, and a large number of studies have emerged on the relationship between land use transition and rural reconstruction [20], farmers’ livelihoods [21], and the impact of land use transition on ecological environment change [22], continuously enriching the theory and method system of land use transition to form a research theory and method system including the comprehensive transition of explicit and implicit forms of land use [11].
Studies have shown that the governance of rural areas is mainly related to land issues [23]. As a highly important land use type that exists widely in rural areas, rural residential areas have been in a state of steady evolution since they emerged from the stable natural geographical environment and location conditions, with the influence of the natural increases and decreases in rural population and the slow growth of the rural economy. However, with the acceleration of urbanization, the phenomenon of idle rural residential areas and the hollowing out of villages has stood out, coupled with the insufficient supply of newly added construction land under the rigid control of construction land indicators. In this context, policies and activities such as linking urban-rural construction land increase and decrease in the hook, the reform of the rural land system, and comprehensive land improvement across the whole region have been implemented. Meanwhile, under the joint guidance of the rural revitalization strategy and rural construction actions, a drastic reduction in the sizes of rural residential areas has taken place or will take place over the whole area, which reflects the basic characteristics and general laws of land use transition and has aroused widespread concern from all of society.
At present, the research on rural residential areas mainly focuses on its quantity change [24,25], spatial distribution [26,27], utilization state [28,29], regulation mode [30,31], etc., which all belong to the research category of land use and land-cover change (LUCC) in the early stage and rarely involve research on the transition of rural residential areas. In 2006, Long [32] proposed the basic concept and measurement method of rural homestead transition and applied it to specific areas. Then, based on this theory, some scholars conducted a first empirical exploration of the transition of rural residential areas in Shandong Province and the Beijing-Tianjin-Hebei region; revealed the spatial differentiation characteristics of the transition of regional rural residential areas [33,34]; and further explored the process and mechanism of the transition of the human–land relationship in rural residential areas, using per capita rural residential land area (PCRA) as the characterization index [35]. On this basis, related studies were carried out on the relationship between rural residential areas and many types of land transition [36,37], the influencing factors of the transition of rural residential areas [38], and the effect of rural residential area transition [39], preliminarily forming a general theoretical system of rural residential area transition [40,41,42]. However, these studies mainly focused on the transition analysis of the scale and quantity of rural residential land, and there have been few studies carried out on the morphological evolution trend or transition characteristics of the land structure and system function under the spatial carrier attribute of rural residential land. The basic theories, research perspectives, and methods of rural residential area transition need to be further explored.
To enhance the understanding of the theory and law of rural residential transition, and enrich the methodological system and practical application of land use transition, this study takes Shandong Province, which can be considered as a microcosm of China, as the research area. Based on the manifestations and characteristics of rural residential areas at village and regional levels, and combining both macro and micro levels, the method of amalgamating model measurement analysis and horizontal comparison is used to explore the process mechanisms of rural residential land scale transition and the corresponding gradual differentiation trend of the spatial structure and system function. Then, the framework and strategy of rural reconstruction are created from the comprehensive perspective of “element-structure-function”. The structure of this paper is as follows: Section 2 proposes the theoretical framework and research ideas. Section 3 introduces the relevant research methods and describes the data source and processing. Section 4 analyzes the scale transition, structure and function differentiation of rural residential land on the macro and micro scales. Section 5 and Section 6 discuss the theoretical contributions and limitations of this paper, put forward a rural reconstruction strategy, and draw relevant conclusions.

2. Theoretical Framework and Research Ideas

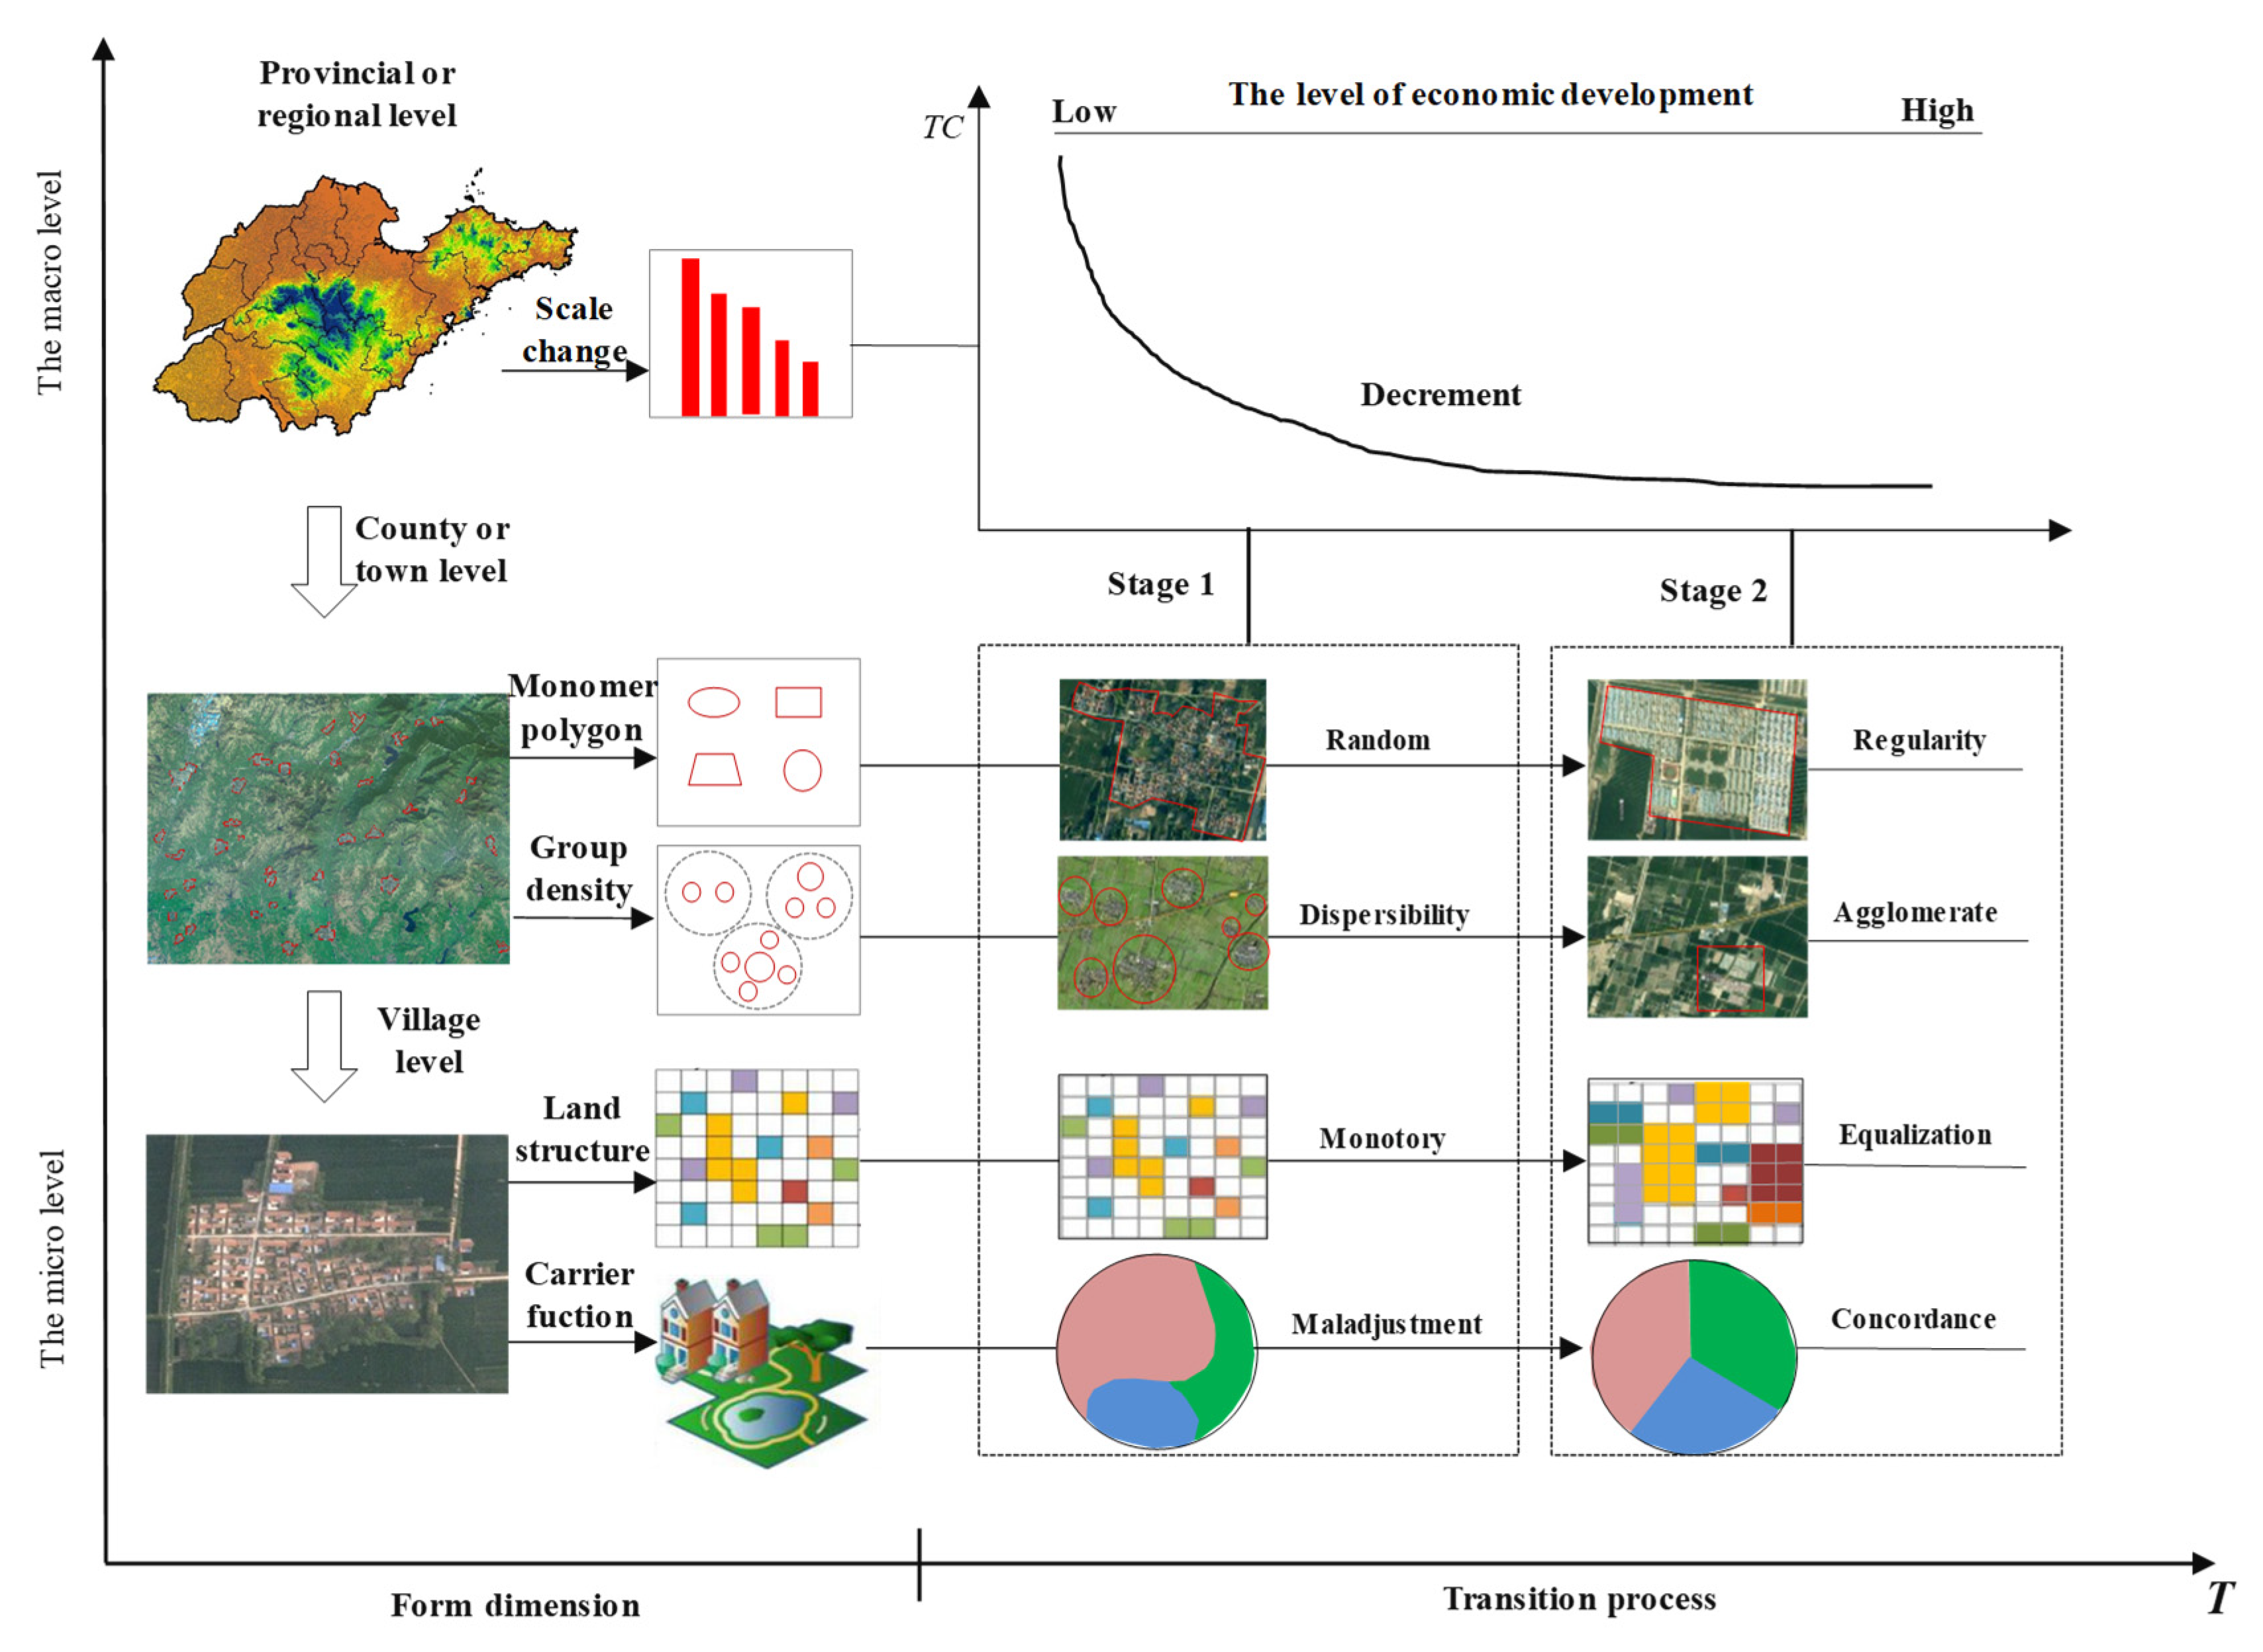
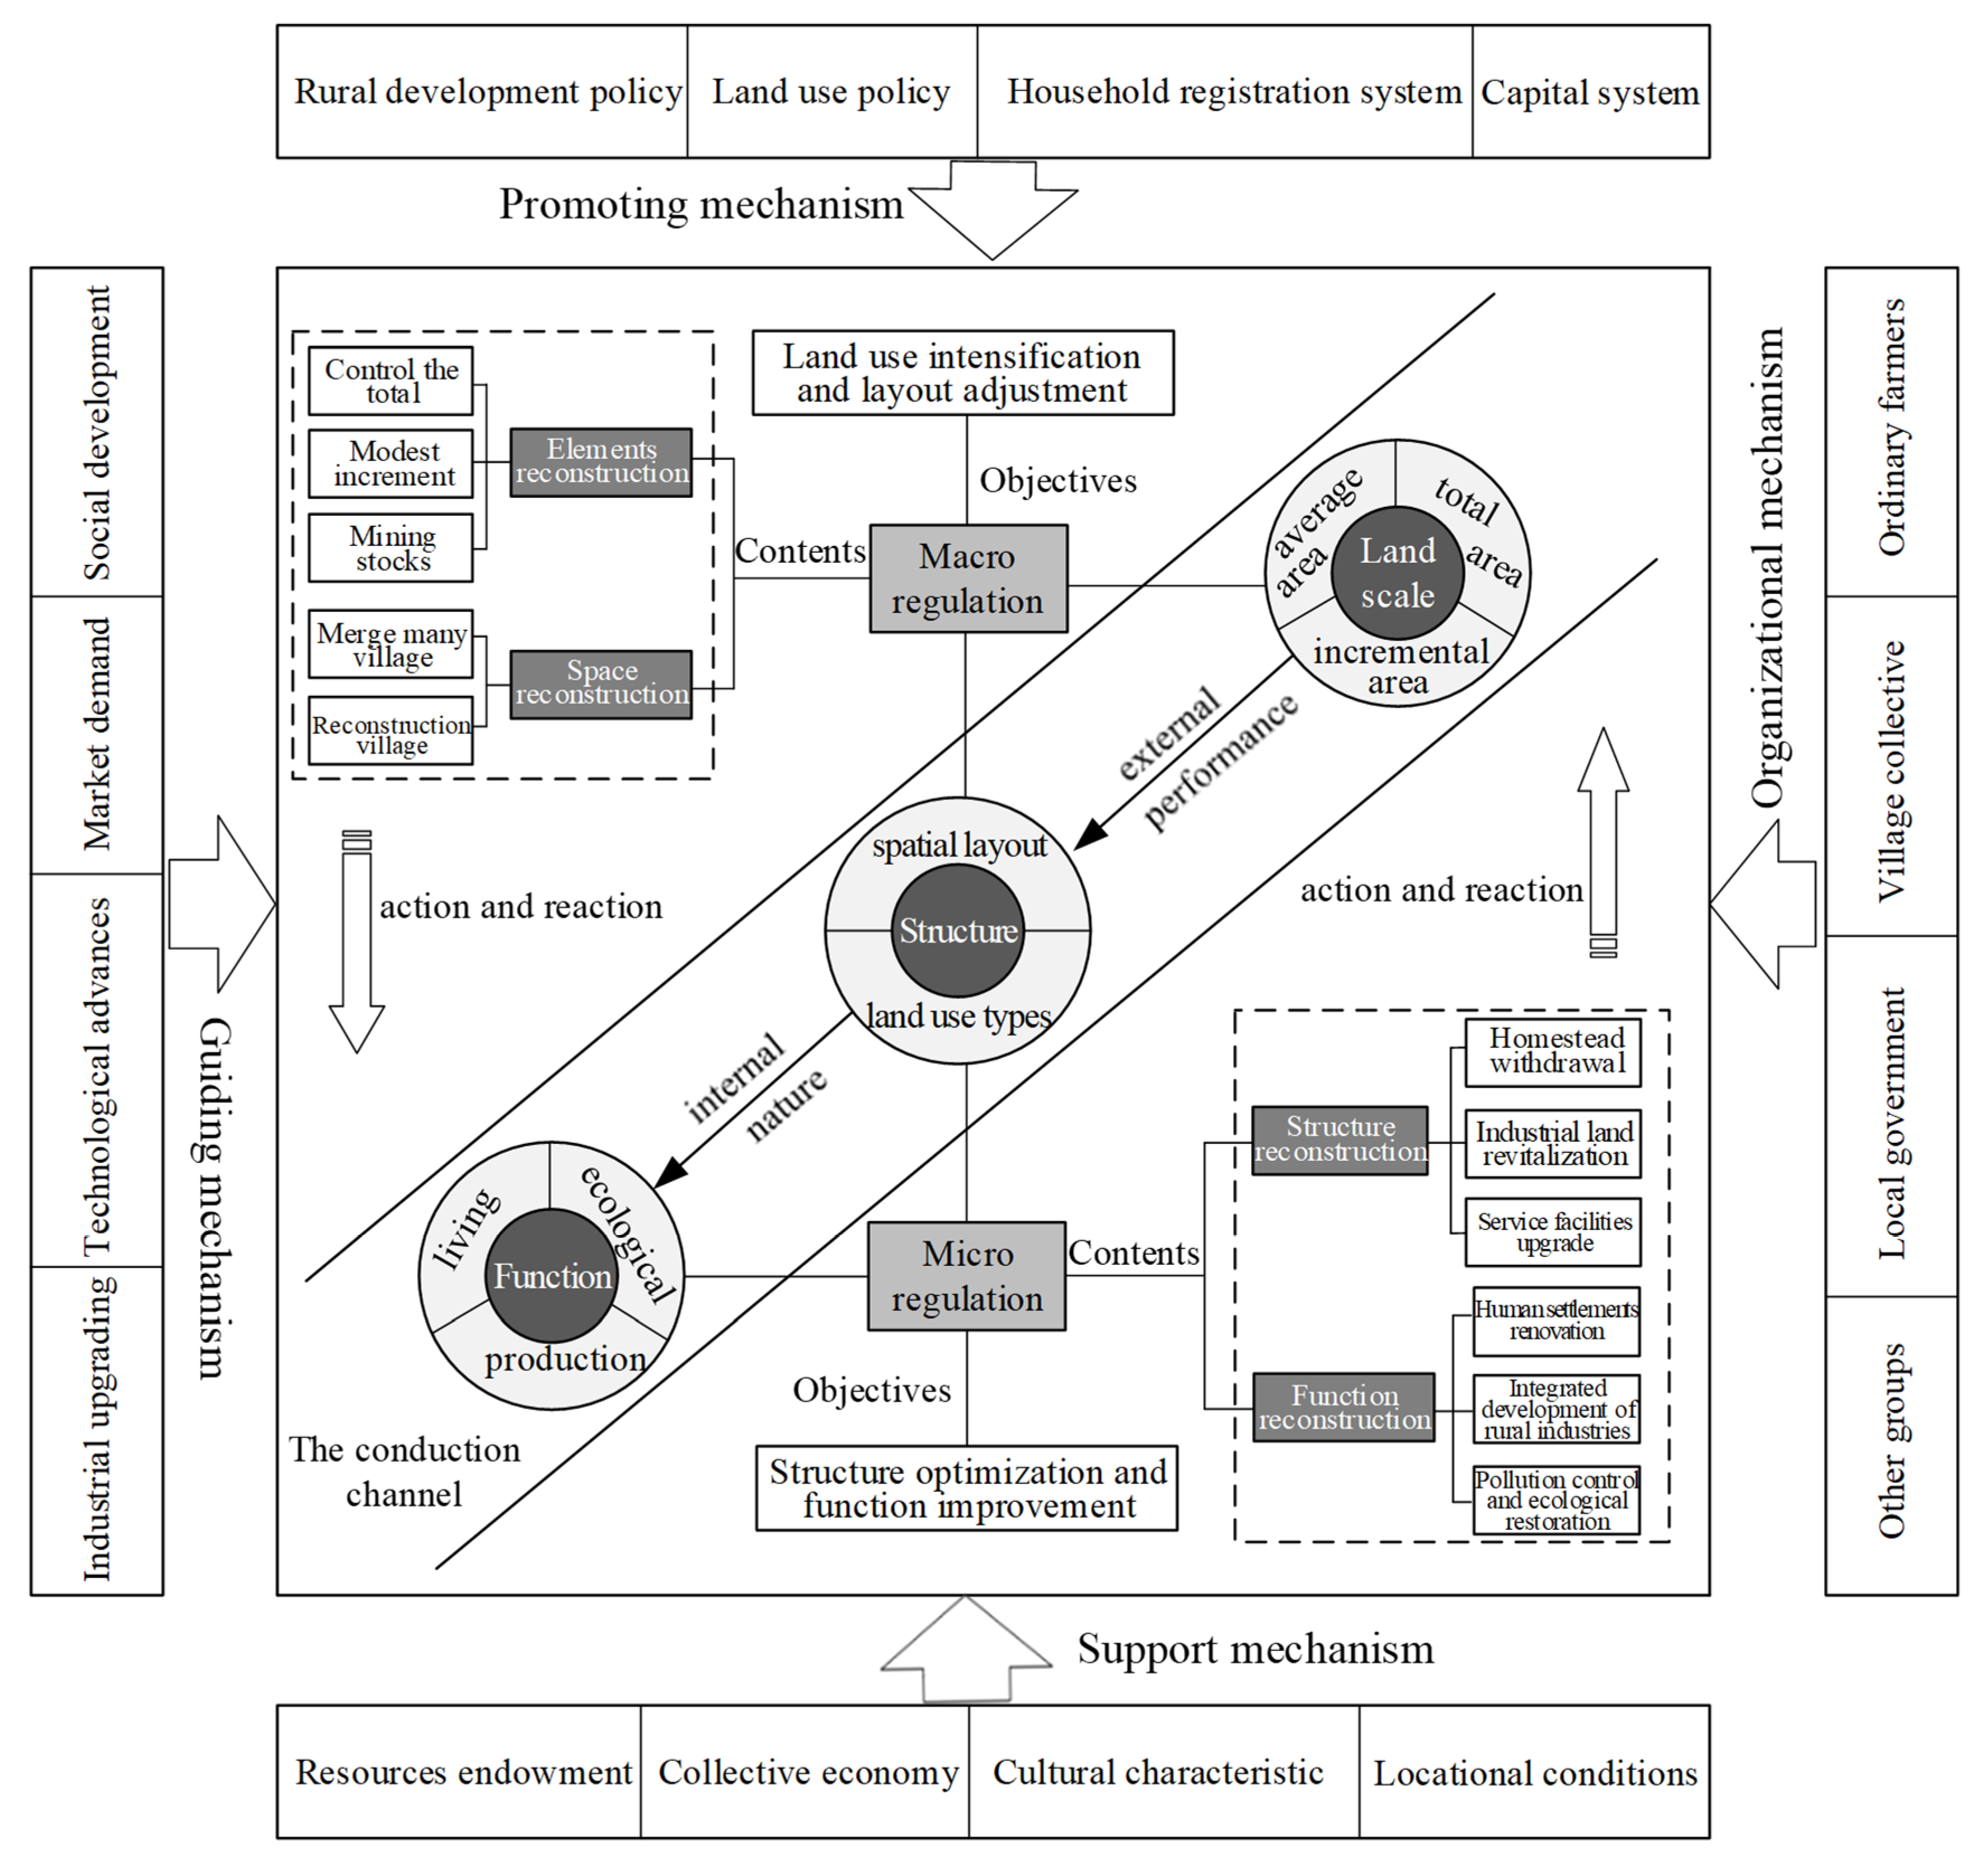
2.1. Theoretical Framework
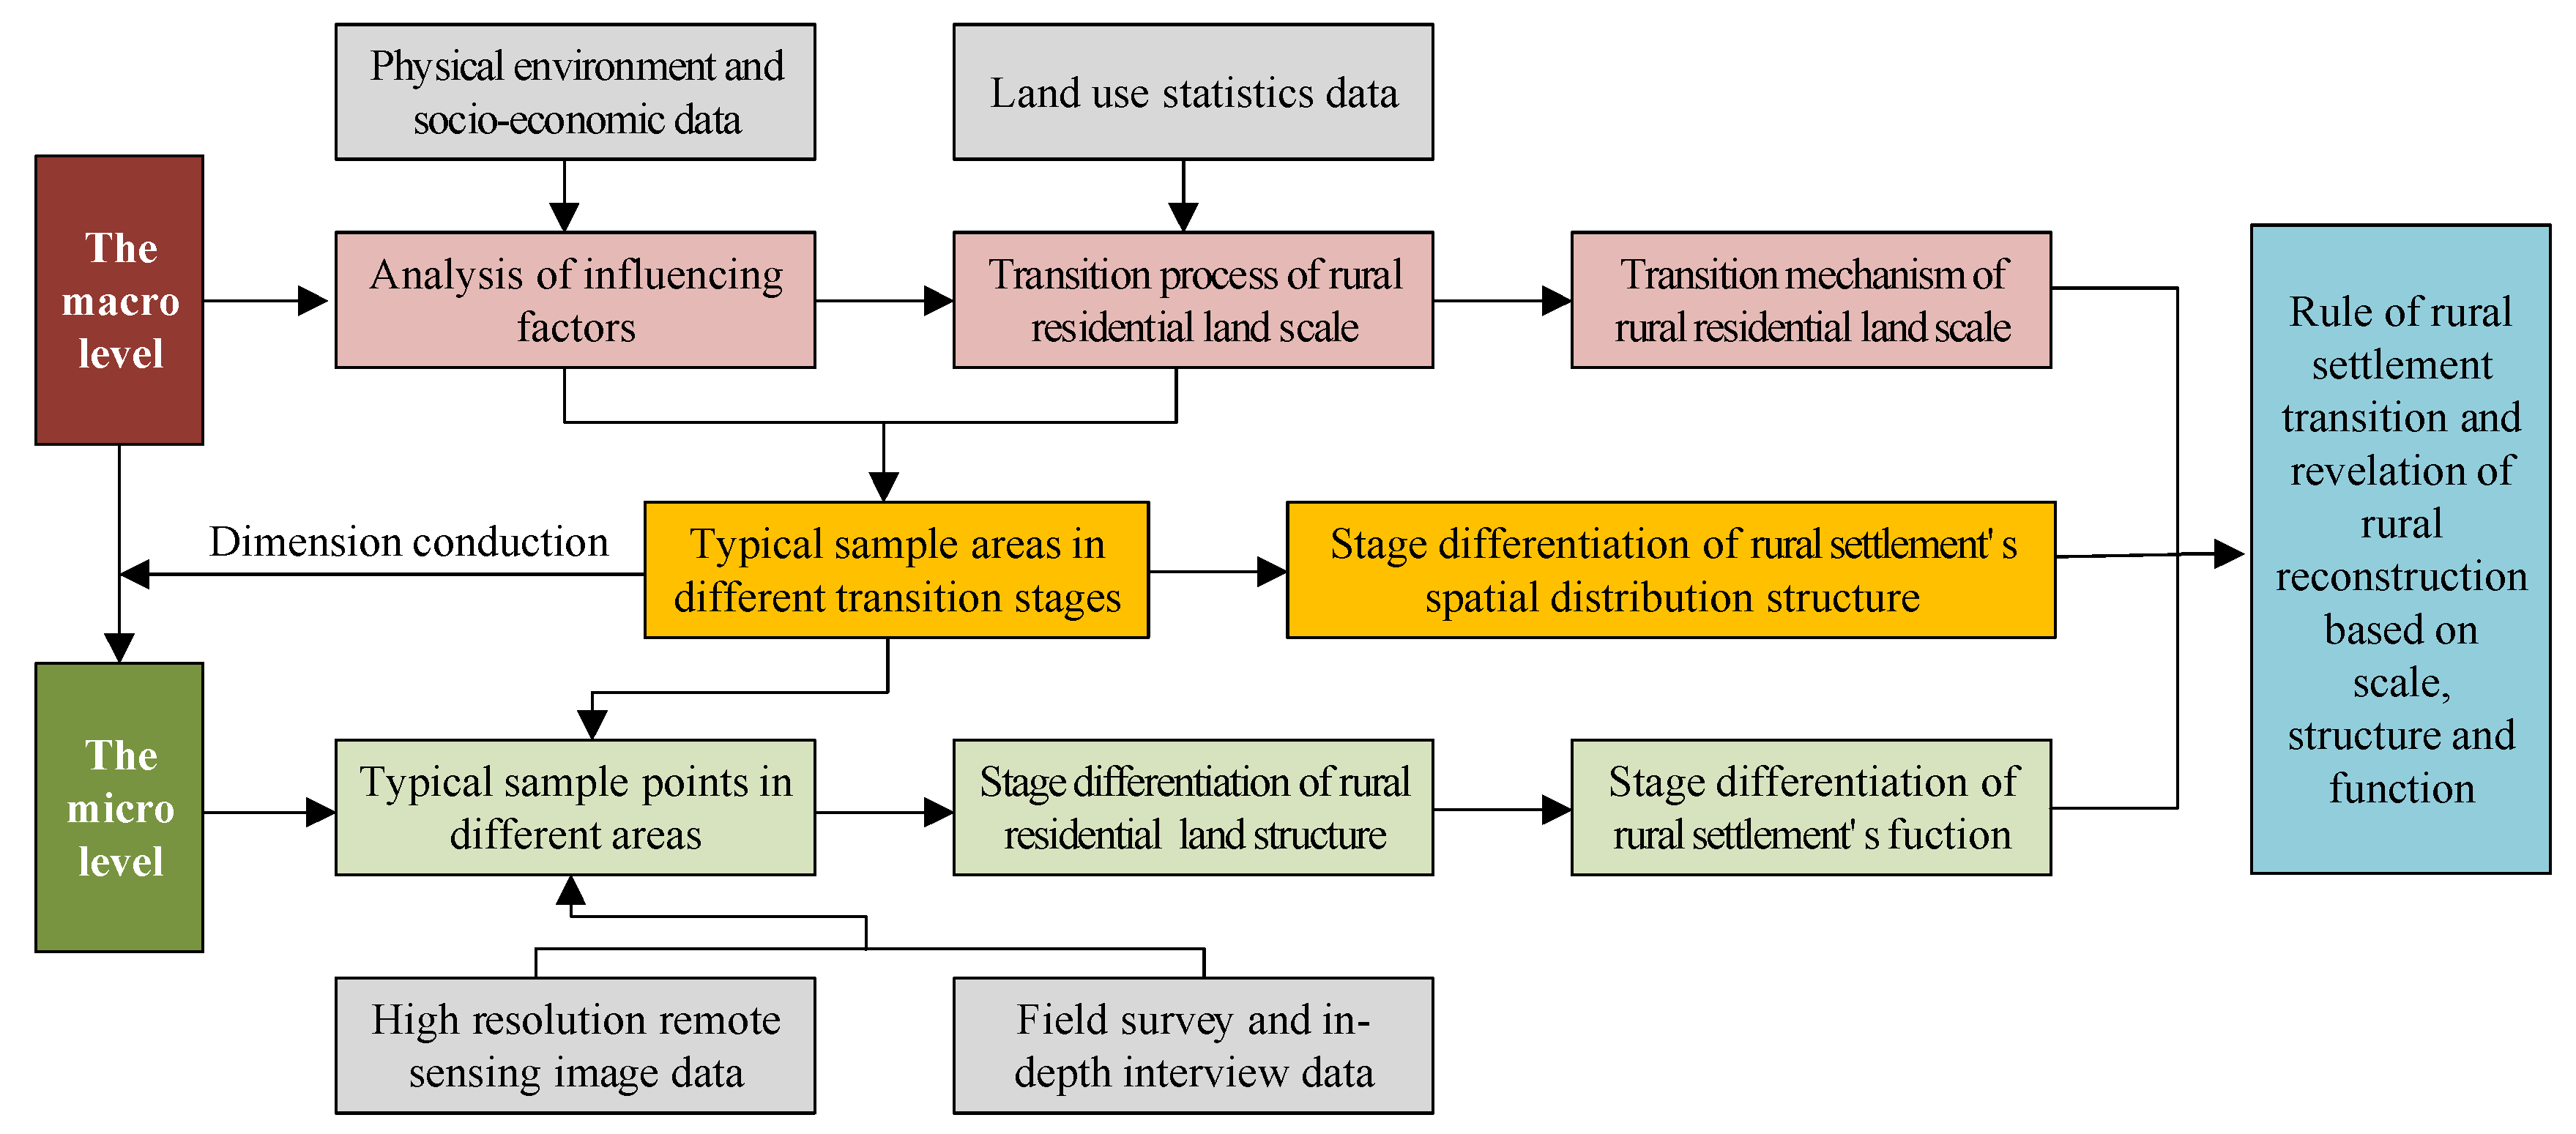
Rural residential areas are a type of a complex system that is widely distributed in rural areas and corresponds to the locations of cities. At the national and regional levels, rural residential areas are usually regarded as the “containers” that accommodate the rural population. The scale of rural residential areas, especially their increase or decrease, which occurs with the movement of rural populations, is the key to their role in economic and social development [35], and also the main means by which administrative departments at all levels carry out statistical analyses. However, in certain areas affected by external factors such as geographical environment, traffic location, and industrial basic conditions, rural residential areas appear as patches of different shapes embedded in the agricultural landscape. These patches differ in density and arrangement, with obvious spatial structure characteristics of complexity of patch boundaries and agglomeration or dispersion of spatial patterns, which has become the main issue in territory spatial planning and village planning. In specific villages, a large number of houses, horizontal and longitudinal roads, scattered factories, concentrated public service facilities, and natural or artificial vegetation green spaces are distributed, which reflects that the patches of rural residential areas also contain various land types, buildings, facilities, industries, and other elements. These elements provide the most basic living guarantee, necessary production conditions, and special ecological environments for rural residents in different combination forms, reflecting the element composition, structure organization, and functional value form of rural residential areas at the micro level. Therefore, the understanding of rural residential areas needs to be examined from a multi-scale perspective [33]. At the macro level, with the advancement of urbanization, the rural population outflow increases and the corresponding scale of rural residential land should decrease accordingly. The transition of rural residential land mainly shows that the incremental proportion of land use scale decreases gradually and tends to be stable; at the micro level, there will always be some people living in rural areas. Rural housing security, equal public services, and improvement in living environments are also important factors in the transition of rural residential areas. Therefore, from the perspective of combining macro and micro scales, the transition of rural residential areas is not a simple scale reduction and spatial transition, but also a process of the adjustment or redistribution of elements to drive the optimization of the system structure and functions.
In general, the structure and function of rural residential areas are also transited in the process of the land scale transition of rural residential areas [40] (Figure 1). In the initial stage of the rural residential land scale transition, the scale increment is relatively large. On the one hand, affected by external factors such as transportation, nearby cities, and service facilities, the newly added land for rural residential areas is mostly distributed outside villages, and some of the land will be far away from the center of the village, causing the overall layout of rural residential areas to spread out, resulting in the shape of rural residential areas becoming more complex and the patch density becoming more scattered. On the other hand, due to the different uses of newly added land (generally residence, industry, and public service facilities), the structural combination and carrier functions of rural residential areas have shown a diversified trend. When the newly added land is mainly the residential land, the land structure will tend to be singular, and the dominance of the residential security function will accordingly be stronger. When the newly added land is mainly based on the construction of the village and township industrial parks, the land structure of production and residence in rural residential areas will tend to be balanced and the rural non-agricultural production functions will also be improved. When the amount of land allotted to public service facilities increases, the land use structure of rural residential areas will likely be diversified, the life service functions will be enhanced, and the system functions of rural residential areas will become more complex.
With the strict promotion and implementation of village planning and control policies, the scale of rural residential land tends to be stable or even shrink, and the amount of newly added land is relatively reduced. In the process of the unified planning and construction of new rural communities in scattered villages, the shape of rural residential areas tends to be regular, and the spatial layout of rural residential areas within a certain range is more concentrated. At the same time, in order to improve the equalization of urban and rural public services and the quality of the human settlement environment, rural areas also require increased education, medical care, transportation, leisure, ecology, and other basic service facilities, encouraging the structure of rural residential land to be balanced, while the corresponding living, production, and ecological functions are continuously optimized and improved. In essence, the transition of rural residential areas is a synchronous process of the decreasing of the land use scale, with a regular and compact spatial layout, balanced land use structure, and coordination of living-production-ecological function.

2.2. Research Ideas

Land use transition research is generally based on the longitudinal comparative study of long-term series data, but the land use statistics in China concern a relatively short time-scale, especially with regard to micro data such as data on land use, buildings, facilities, population, and industry in a large range of rural residential areas. However, affected by the regional differences in the natural environment and social and economic development, rural residential areas show obvious regional characteristics [43]. These characteristics show that the rural residential areas in different regions are in different transition stages due to the differences in regional socioeconomic development in the same period of time between areas. This provides weight to the feasibility of our idea to use the horizontal comparison method to carry out structural and functional changes in rural residential areas.
Taking the above factors into consideration, the research idea of this study is shown in Figure 2. First, based on the change data of rural residential land scale, this paper uses the homestead transition measurement method proposed by Long [32] to identify the transition stage of the rural residential land scale in different counties and urban areas at the macro provincial level and further explores the influencing factors and mechanisms of the transition. Then, this study considers the characteristics of the influencing factors of the transition of rural residential land scale and selects the typical sample areas (counties/cities) from different transition stages. By adopting the idea of “point” mapping “surface” [44], this study further selects typical sample points (villages) in typical sample areas. Through sample site surveys and in-depth interviews, micro-data on land, population, industry, buildings, and facilities inside rural residential areas were obtained. Using the diversified econometric model, the differentiation characteristics of the structure and function of rural residential areas in different transition stages were analyzed at the micro-level. Finally, based on the mechanism of rural residential land scale transition and the characteristics of structural and functional differentiation, the paper puts forward relevant strategies for promoting rural reconstruction through rural residential land transition.

3. Research Method

3.1. Measurement of Rural Residential Land Scale Transition

3.1.1. Transition Model

Based on the characteristics of rural homestead scale change, Long [32] proposed the theoretical hypothesis of rural homestead transition—that is, rural homestead transition refers to the fact that the proportion of rural homestead out of the total amount of increased construction land will gradually decrease with the change in social and economic development stage, until it tends towards a fixed value. The rural homestead he refers to is the land use type with the largest share of the rural residential area, and its essence is the rural residential area in a narrow sense. Therefore, this article uses this idea to calculate the transition index of the rural residential land use scale, and the calculation method is as shown in Equation (1).
T C r = I A r l I A c l × 100 % .
In the formula, TCr is the transition index of the rural residential land use scale with power index distribution characteristics. IArl is the area increment in rural residential land, hm2; IAcl is the increment of the total scale of construction land, hm2.

3.1.2. Analysis of Influencing Factors

Traditional regression models (OLS models) can be used to estimate samples and parameters globally. However, due to the influence of the spatial pattern relationship, if there is a spatial autocorrelation of independent variables, the independence assumption of residuals in the OLS model cannot be satisfied, and the parameter estimation of the ordinary least square method is no longer applicable. The geographically weighted regression (GWR) model can estimate the influence of different regions and reflect the non-stationarity of parameter estimation in different spaces, making the results more in line with reality [35]. Therefore, in order to comprehensively analyze the influencing factors and the spatial differentiation of rural residential land transition, the GWR model was introduced on the basis of OLS model analysis so as to reflect the impact of influencing factors in different spaces. The model structure is shown in Formula (2):
y i = β 0 ( μ i , v i ) + k = 1 n β k ( μ i , v i ) x i k + ε i .
In the formula, yi is the PCRA score of the i-th spatial unit; β0 (µi, vi) is the regression coefficient of the i-th spatial unit, indicating the influence degree of the independent variable on the dependent variable; (µi, vi) are the geographic center coordinates of the i-th spatial unit; βk (µi, vi) is the score of the continuous function βk (µ, v) in the i-th spatial unit; xik is the score of the k-th explanatory variable in the i-th spatial unit; εi is random error. The accuracy of the GWR model is greatly affected by the weight and bandwidth. Considering the differences between the freedom degrees of different models, this paper uses the Gaussian weighting method and “Optimization to Minimize AICc” bandwidth method for local estimation.
Changes to the scale of rural residential land use are usually affected by many factors. We referred to related literature [32,35,44] and initially selected altitude (A1), distance from urban resident (A2), transportation convenience (A3), GDP change rate (B1), local fiscal revenue change rate (B2), fixed asset investment change rate (B3), rural population change rate (C1), change rate of rural residents’ per capita income (C2), change rate of per capita arable land area (C3), urban and rural construction land planning control scale (D1), urban and rural construction land increase or decrease linkage scale (D2), land supply rate of construction land planning (D3), and 12 other indicators as influencing factors for the transition of rural residential land use scale from the perspective of reflecting the regional natural background conditions, economic development level, social living conditions, and policy and institutional environment.

3.2. Measurement of Rural Residential Areas’ Structure

From a macro point of view, in an overall pattern in the form of a plaque, rural residential areas are manifested in various shapes, agglomerations, and dispersions in a certain area, with structural differences in their spatial distribution. On the micro scale, rural residential areas include residential land, production land, public service land, roads, and greening land. These land use types form the whole rural residential space with different combinations and have different characteristics of land use structure. Therefore, the structural characteristics of rural residential areas were measured from the two aspects of spatial distribution structure and internal land use structure.

3.2.1. Spatial Distribution Structure

Previous studies have shown that the landscape ecology index can effectively measure land use layout [45]. Generally, land use layout is described by selecting relevant indexes from two aspects: individual characteristics and community characteristics of landscape patches. The landscape pattern index measurement software Fragstats contains nearly 30 optional indicators, but most of these indicators are collinear. To reflect the synthesis of indicators and eliminate nonlinearity, this study refers to the screening results of principal component analyses carried out in existing studies [46,47]. Meanwhile, considering the characteristics of the patch size, irregular shape, and scattered distribution of rural residential land, five indicators (i.e., area-weighted mean patch shape index (AWMSI), area-weighted mean patch fractal index (AWMPFD), patch density(PD), patch association index (COHESION) and interspersion juxtaposition index(IJI)) were selected to measure the differentiation law of the spatial distribution pattern. The analyses are conducted from two aspects, i.e., shape complexity and spatial agglomeration degree. The meanings and calculation methods of each index are shown in Table 1.

3.2.2. Internal Land Use Structure

According to the classification standard of land use status (GB-T21010-2007), the internal land use structure of rural residential areas is divided into six categories: homestead, public service land, industrial land, commercial service land, road, and idle land. The Gibbs–Martin diversity index and concentration index [48], which are often used to express the element structure in landscape ecology, were used to conduct the quantitative analysis of the internal land use structure of rural residential areas in this research, and the measurement indexes and calculation methods are shown in Formulas (3) and (4).
G M = 1 i = 1 6 X i 2 ( i = 1 6 X i ) 2 .
where GM is the Gibbs–Martin diversification index and Xi is the area or proportion of different land use types. Generally speaking, the higher the GM score, the more diverse the land use type, the greater the balance of land use, and the more complex the structure. When the area of each land use structure type is equal, the GM score reaches its theoretical maximum value.
I = A R M R .
In the formula, I is the concentration index of the regional land use structure; A is the sum of the cumulative percentages of various land use types in the region; M is the sum of the maximum cumulative percentages assuming that the land use in the region is concentrated in a certain type, which is 600; R is the sum of the cumulative percentages of various land use types in the upper level area of the sample area, which is 532.

3.3. Measurement of Rural Residential Areas’ Function

As an important carrier of rural residents’ life and production, rural residential areas comprise a complex system formed by the interaction and organization of population, land, industry, buildings, facilities, and other elements, playing an obvious multi-functional part in meeting the needs of residents [44]. According to the territorial system of human–environment interaction of the logical train of thought of expression function elements, rural development takes moderately livable life space, intensive and efficient production space and ecological space of picturesque scenery as the goals. This study evaluates the functions of rural residential areas from the three aspects: living, production, and ecological functions. In accordance with the coupling, compatibility, and symbiosis processes of various elements, this study further subdivides the functions into six sub-functions of residence guarantee, basic services, agricultural production, non-agricultural production, ecological conservation, and environmental maintenance to comprehensively measure the strength and coordination of various functions of rural residential areas (Table 2). First, according to the principle of the leading, comprehensibility, conciseness, and substitution of the evaluation index, the multi-functional evaluation index system of rural residential land was constructed. Residential guarantee and basic services functions are provided by residential buildings, public service facilities, and roads. Agricultural production and non-agricultural production functions are provided by factors such as productive buildings, employment methods, industrial types, and land resource allocation. Ecological conservation and environmental maintenance functions are provided by elements such as ecological infrastructure and environmental governance facilities. Then, the range standardization method was adopted to quantify the values of each index between 0 and 1, and the intensity score of each function of rural residential areas was measured by referring to the idea and method of quantifying farmers’ livelihood assets [44]. Finally, the comprehensive coordination degree model (Formulas (5) and (6)) was used to measure the comprehensive strength of rural residential functions and the coordination between them.
F = α F l + β F p + λ F e
C = 3 [ ( F l × F p × F e ) ( F l + F p + F e ) 3 ] 1 / 3
Here, F represents the comprehensive intensity index of living, production, and ecological functions and C represents the degree of coordination among living, production, and ecological functions. α, β, and λ represent the functional coefficients, and their sum is 1. Considering that the significance and value of life, production, and ecological functions to rural residents are different, in this paper, α, β, and λ are set as 0.4, 0.35, and 0.25, respectively. For example, living function is the basic life guarantee function of rural residents, and living conditions and social security directly determine the improvement of farmers’ happiness; as the employment guarantee function of rural residents, production function reflects the important impacts that the extension of the rural industrial chain and the cultivation of new business forms shows on the survival guarantee of rural households in the context of rural revitalization; the dual differentiation between rural and urban areas makes rural areas better than urban areas in terms of ecological aspects, such as vegetation coverage and air purification, which further weakens rural households’ demand for ecological functions relative to living and production functions.

3.4. Data Sources and Processing

The research data involve two aspects: statistical data and survey data. The statistical data include land use change data, basic geographic information data, and economic and social statistical data, mainly from the National Basic Geographic Information System database and the “Shandong Province 2010~2020 Statistical Yearbook”. Survey data refer to the micro-basic information of typical samples. Aiming to assess the differences in the economic development level and topographical conditions of the study area, this study selected villages with the assistance and recommendation of local natural resources departments according to the principle of “economically developed counties choose villages with relatively strong internal economic strength, underdeveloped counties choose their internally developed villages, plain counties choose internally flat villages, mountainous counties choose villages with more complex internal terrain”. From July 2019 to December 2020, three survey teams investigated 123 villages five times. Assisted by field observations of sample villages and questionnaire interviews with village committees or village cadres, we obtained data on the scale, land use structure, population structure, building structure, economic income, facility construction of each village, among other types of data. Based on the above basic data, the ArcGIS10.2 operating platform was used to establish the basic database of rural residential land transition research in Shandong Province, including county-level administrative units and rural residential land plaques.

4. Results and Analysis

4.1. The Transition Process of Rural Residential Land Scale at the Macro Level

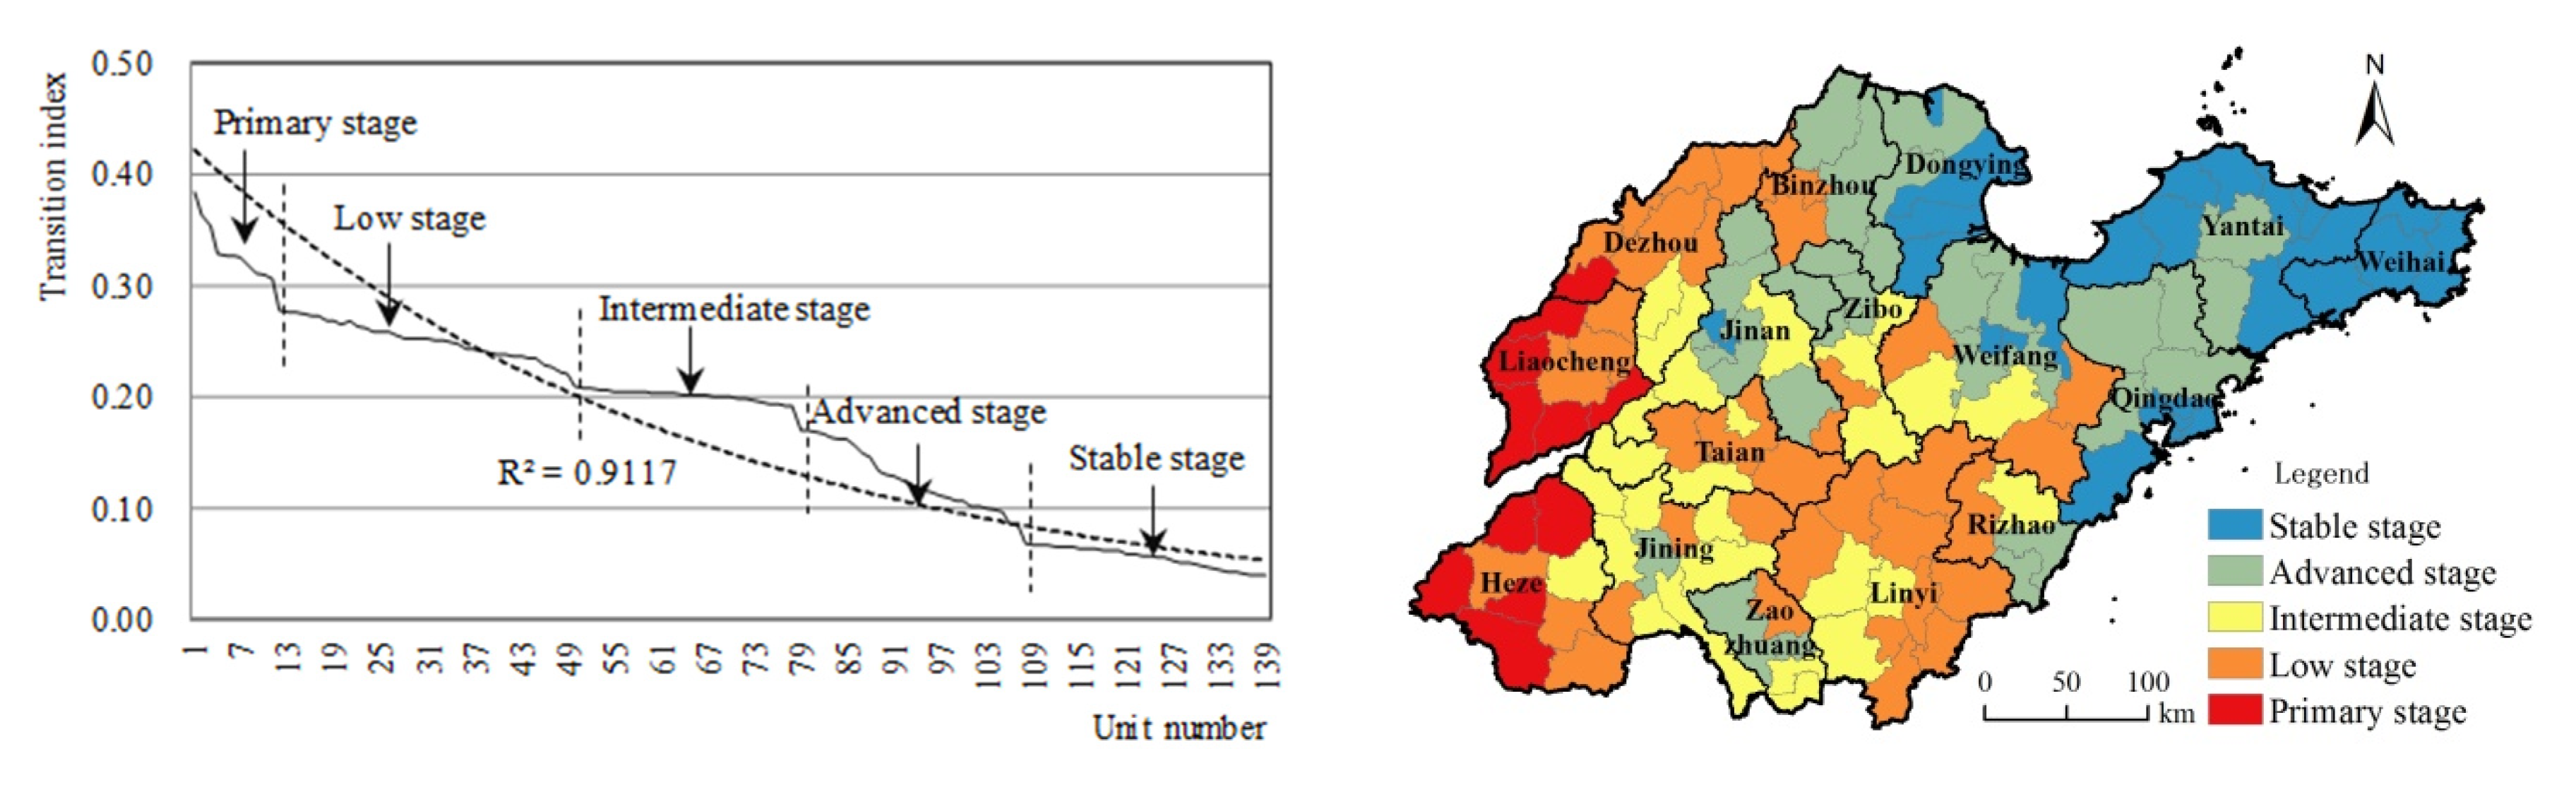
4.1.1. Division and Distribution Characteristics of Transition Stages

As can be seen from Figure 3 and Table 3, the transition index of rural residential land at each county level in Shandong Province gradually decreases with the fitting curve characteristic of power function (R2 = 0.9117), and the sequence mutations between each unit are obvious. Taking the mutation point as the critical value, the transition stage of rural residential area was divided into five stages from the primary stage to stable stage by the breakpoint method. This indicates that from the lower stage to the higher stage, the balance between rural residential land and other construction land gradually tends to a new state, which is basically consistent with the theory of rural homestead transition proposed by Long [32] and its application results along the Yangtze River [49].
At the same time, the coefficient of variation of the transition index of rural residential areas corresponding to the five transition stages of Shandong Province is relatively low, indicating that the deviation of the transition index of rural residential areas within each stage is small and the concentration is strong. It can also be seen from Figure 3 that the spatial distribution of rural residential areas in the transition stage of Shandong Province is relatively concentrated, with the primary stage containing 11 administrative units, mainly distributed in Heze City and Liaocheng City on Luxi Plain. The low stage contains 38 county-level units, which are the most numerous and widely distributed, including Linyi City, Laiwu City, Tai’an City, and other places adjacent to the primary stage in the West Shandong Plain and the middle of the Shandong mountainous area. The intermediate stage contains 29 county-level units, which are mainly distributed in the piedmont plains from the central Shandong mountainous area to the southwest and north of Shandong, mostly in Jinan City, Jining City, and Zibo City. The advanced stage also contains 29 county-level units, which are mainly located in Binzhou City, Dongying City, Weifang City, and the hinterland of Jiaodong Peninsula in the coastal area of northern Shandong Province, while a small number of units are distributed in Zaozhuang City and Rizhao City in the hilly area of southern Shandong Province. In the stable stage, there are 30 county-level units, which is a relatively large number, which are concentrated in the coastal cities of Jiaodong Peninsula and the core area of the Yellow River Delta.

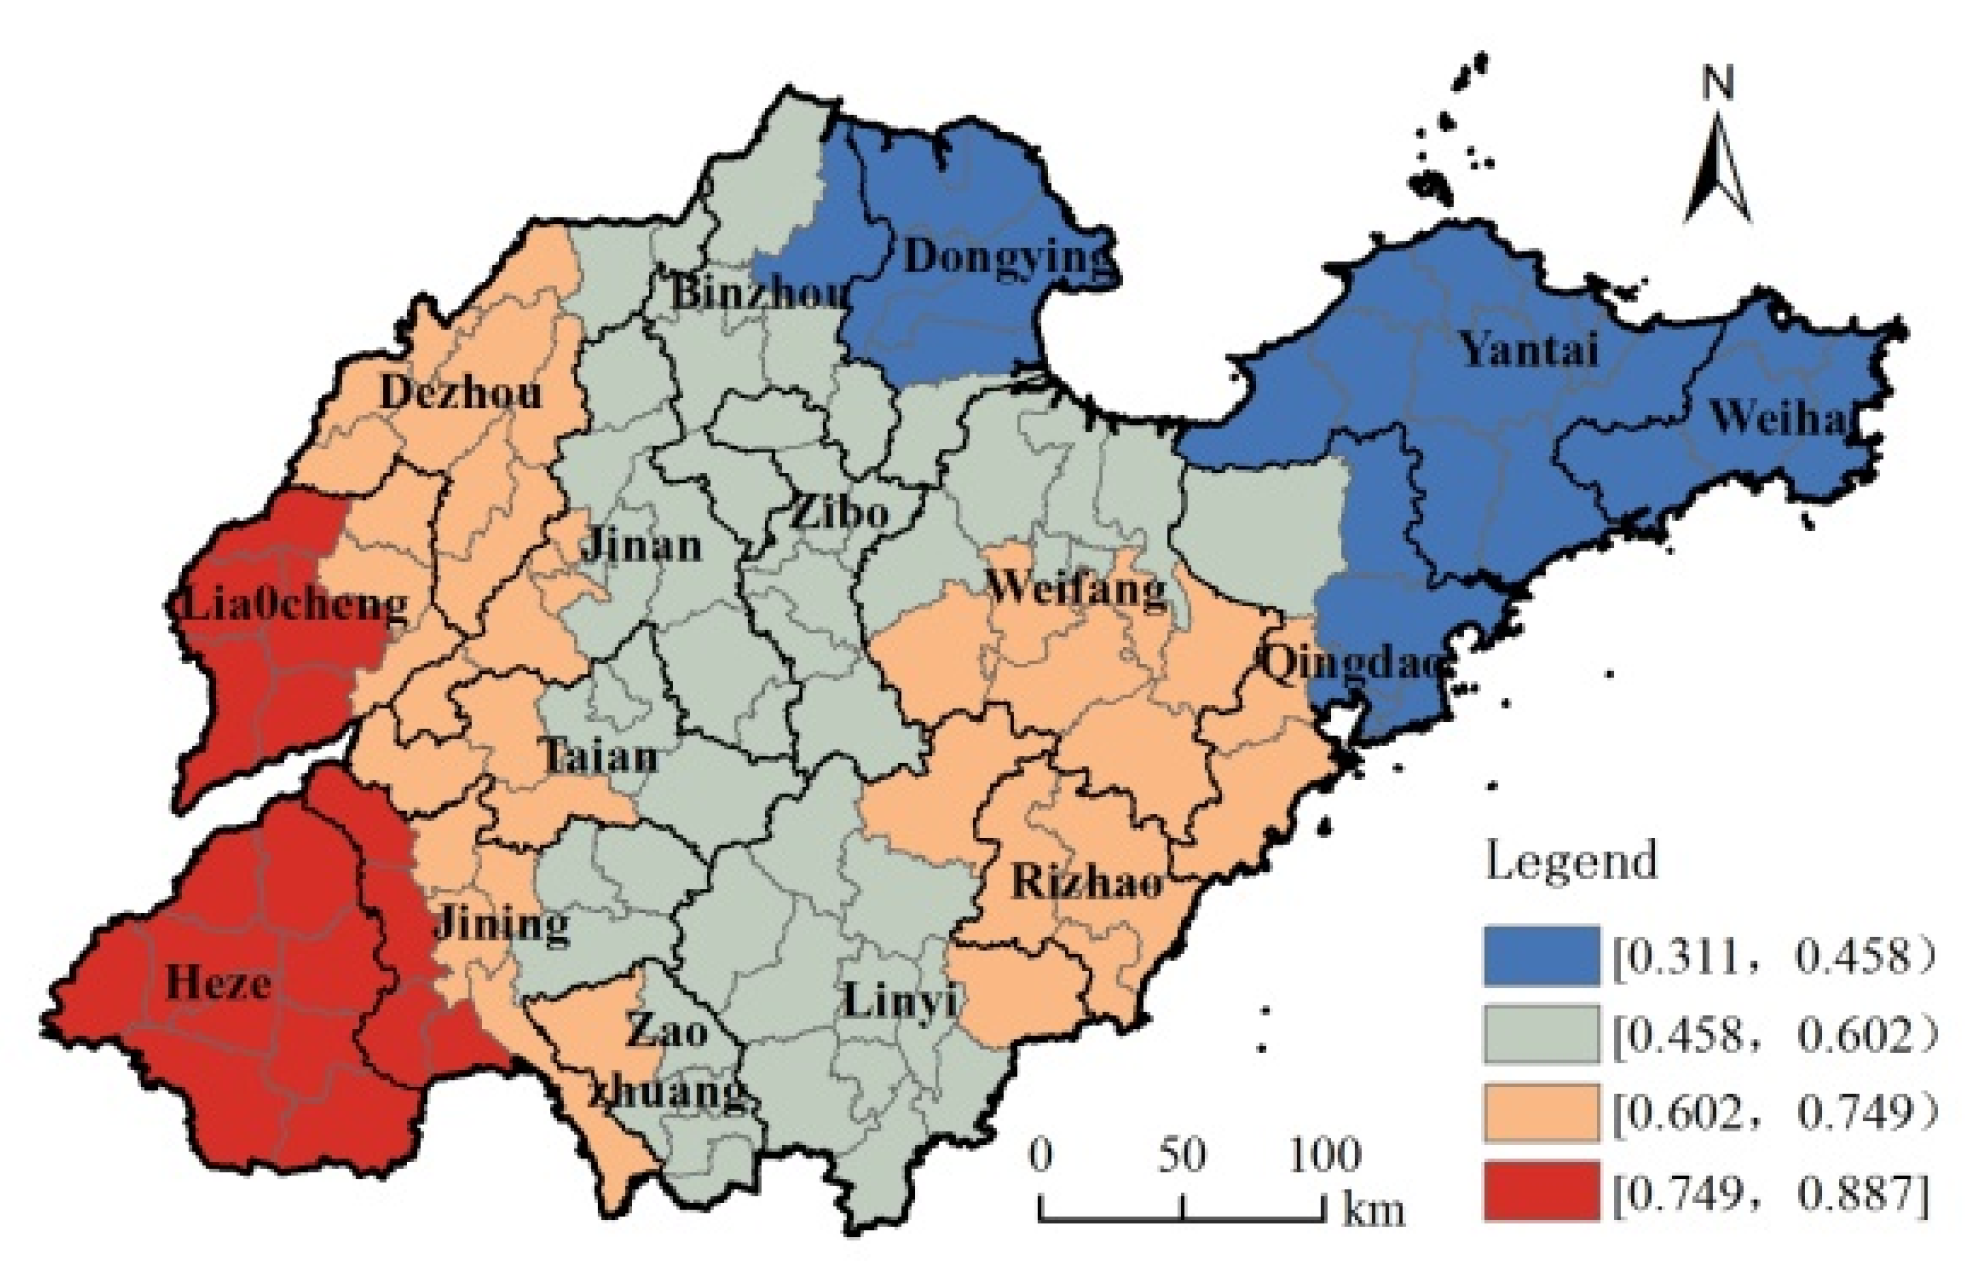
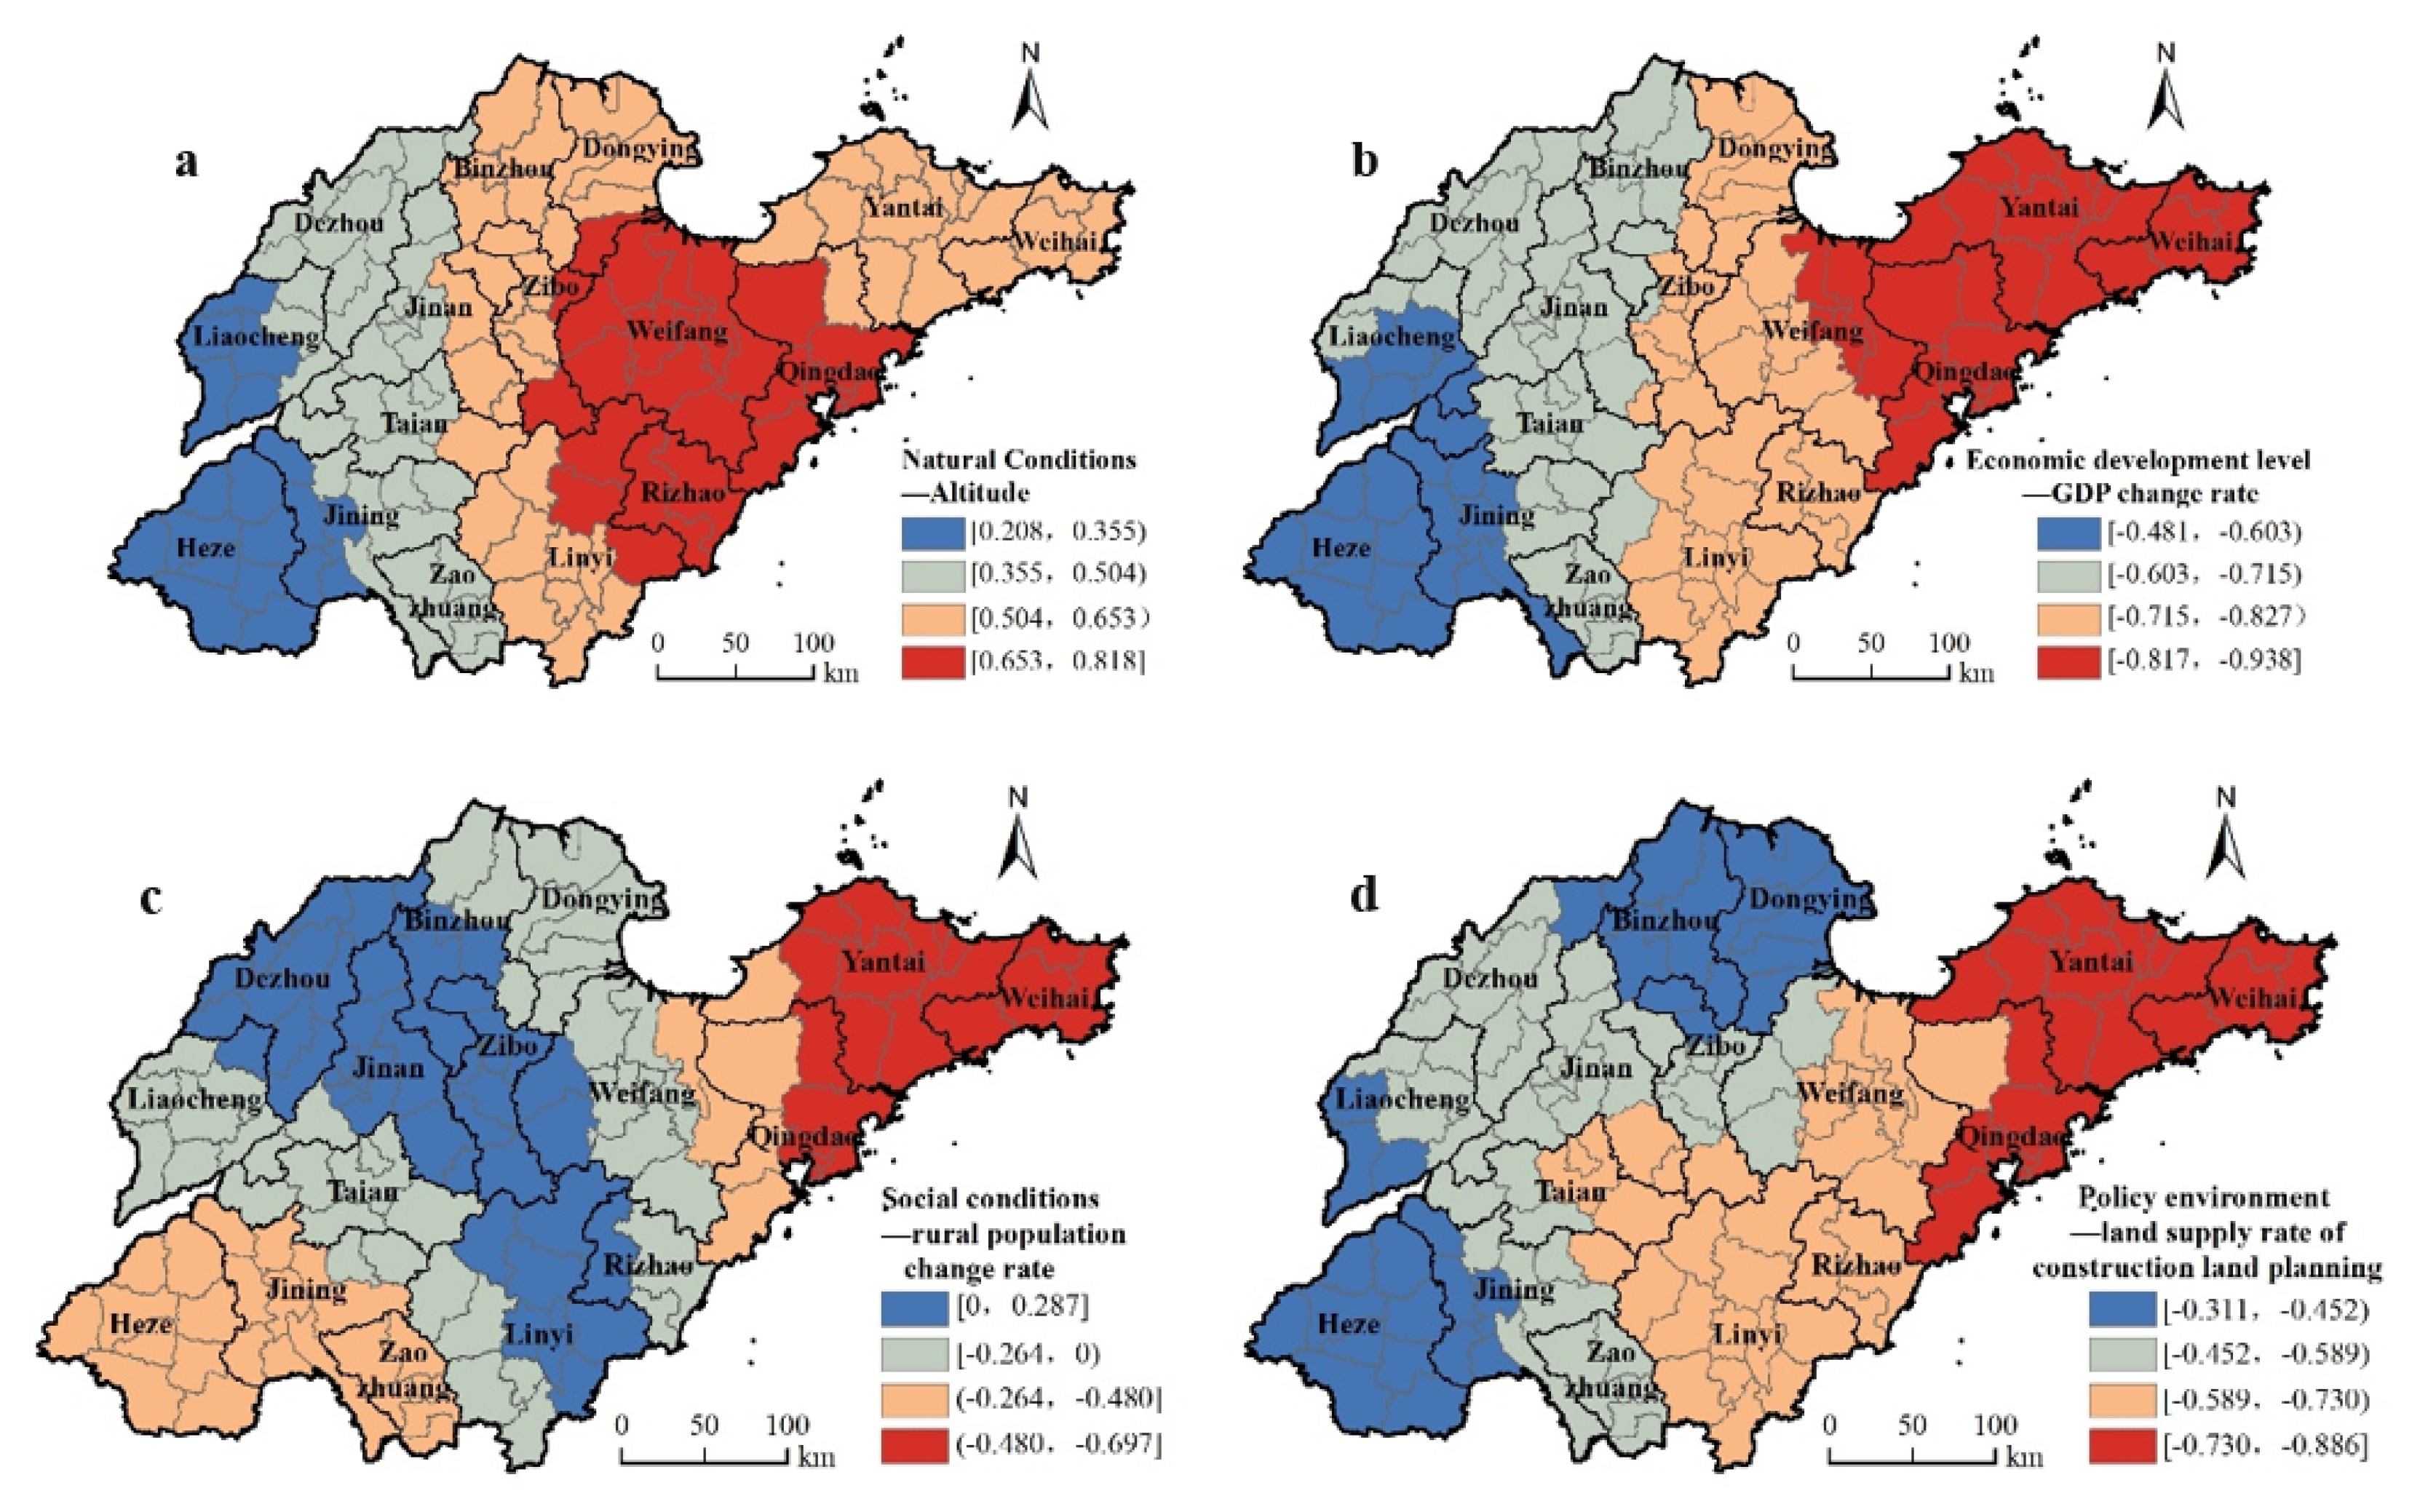
4.1.2. Identification and Action Pattern of Key Influencing Factors

(1)
Identification of key influencing factors
In order to avoid the influence of index multicollinearity on the local estimation, the principal component analysis method was first used to reduce the amount of index data and transform the variables to eliminate the overlapping parts of much of the data, and a few new variables were used to represent the data structure of the original variables. The analysis found that the KMO test value of the original variable factor was 0.822, while the concomitant probability of the Bartlett sphericity test was 0.000, which was less than the significance level of 0.05, so it was suitable for factor analysis. Due to the fact that the eigenvalue was greater than 1, four principal component variables (Table 4 and Table 5) were extracted. The first principal component basically reflected the regional natural conditions of the transition of rural residential areas, the second principal component reflected the regional economic development level of the transition of rural residential areas, the third principal component reflected the social conditions of the transition of rural residential areas, and the fourth principal component reflected the policy environment of the transition of rural residential areas. Therefore, in accordance with the principle of independence and simplification, the maximum correlation coefficient of each principal component was selected as the final influencing factor, which were, respectively, regional altitude (A1), GDP change rate (B1), rural population change rate (C1), and land supply rate of construction land planning (D3).
(2)
Analysis of the action pattern of key influencing factors.
Generally speaking, R2 and Radj2 are effective parameters for analyzing the performance of the quantitative evaluation model, and their values vary between 0 and 1. The larger the score, the better the fitting effect. Compared with the OLS model (Table 6), the R2 and Radj2 of the GWR model reached 0.726 and 0.741, respectively, indicating that the selected variables of the model can explain about 75% of the transition differentiation of regional rural residential areas, which was 15% higher than that of the OLS model. In addition, the AICc score of the GWR model was significantly smaller than that of the OLS model, indicating that the former had a greater advantage in estimating local differences and could better explain the spatial heterogeneity between rural residential area transition and influencing factors.
The GWR model is a local estimation model, and each sample data point has a set of local parameter estimates. From the perspective of multivariate synthesis effects (Figure 4), it can be seen that the parameter estimation results and regression coefficients of the control variables of each county-level unit in Shandong Province are not the same, indicating that instability of the geographic space exists. The model determination coefficient R2 is between 0.311 and 0.887, with an average value of 0.615, which shows a differentiation pattern of “high in the west and low in the east, and abrupt changes in the southeast” as a whole. Among them, Heze City, Liaocheng City, Dezhou City, Jining City, Weifang City, Rizhao City, and other regions have higher R2 values, indicating that these regions have been better simulated. The R2 values of Yantai City, Weihai City, Dongying City, and Qingdao City are relatively low, indicating that the fitting optimization of these areas is slightly poor, and the differentiation of rural residential areas’ transition stages is also affected by other factors outside the model. In terms of univariate effects (Figure 4), the order of influence on the transition index of rural residential areas is: GDP change rate > land supply rate of construction land planning > altitude > rural population change rate. In addition to altitude, other factors generally have a negative effect.
Altitude has the least impact on the transition of rural residential areas in southwestern Shandong. The terrain in this area is simple, with a minimal topography, and the entire area is composed of plains. The effects of terrain conditions on the transition index of rural residential areas are very similar. In contrast, altitude has a greater impact on central and eastern Shandong. The terrain in this region is relatively complex, and is a transition zone from mountainous areas to piedmont plains. The new construction land is preferentially arranged in the flat terrain area with a low construction cost, and mostly in the area where the municipal or county-level government is stationed. From plains to hills and mountains, the newly increased scale of construction land is gradually decreasing, which will help to increase the proportion of rural residential areas and promote the transition of rural residential areas in the region.
The GDP change rate has less of an impact on the transition of rural residential areas in eastern Shandong and has a greater impact on western Shandong. The differences in economic levels between the county-level units in eastern Shandong are relatively small, the scale of rural residential areas is relatively stable, and the structure and function of the rural residential areas are relatively stable. The economic development in western Shandong is relatively backward and the differences between the regions are large, especially from provincial capital cities to provincial cities, and from urban areas to counties. From the high administrative level to the low administrative level, the level of economic development gradually decreases. As a result, the scale of newly added construction land has increased. Administrative levels and economic conditions have a significant reverse effect on the transition index of rural residential areas.
The rural population change rate has positive effects on the transition index of rural residential areas in eastern Shandong. The rural population flow in this area is mainly characterized by the characteristics of “leave the soil and never leave the hometown, and enter the factory and not enter the city”. The rapid development of the local economy has driven the employment transformation of local farmers from agriculture to industry. The increase in income has driven people to return to their hometown and build new homes. This phenomenon has led to the continuous expansion of the rural housing area and promoted an increase in the transition index of rural residential areas. The impact of the rural population’s mobility in central Shandong has a negative effect. Faced with the problem of hollowing in rural residential areas, the region vigorously promotes rural land improvement projects and linking urban–rural construction land increase and decrease in the hook projects to transfer rural populations to cities for the purpose of living, finding employment and retiring to vacant and over-standard rural residential land. The structure of construction land was adjusted by tapping the potential of the stock—that is, the rural population flow of “leaving the soil and leaving the hometown” is conducive to promoting the transition of rural residential areas.
The land supply rate of construction land planning also has the largest negative effect on the transition of rural residential areas in eastern Shandong, especially in Qingdao City. The scale of newly added construction land in Qingdao City is directly approved by the state, and the land supply rate is significantly higher than that in other regions. In addition, the newly added construction land is mainly used for urban development and the construction of infrastructure. The scale of rural residential areas is basically stable, which is conducive to the continuous progress of its transition. However, the level of urbanization in southwestern Shandong is low, and the allocation of planning indicators for newly added construction land is relatively small. Many rural houses in the region are in violation of regulations. Coupled with the incomplete management system and high management costs, the scale of rural construction land continues to expand, which is extremely detrimental to the transition of rural residential areas.

4.2. Staged Differentiation of Structure and Function of Rural Residential Areas at the Micro Level

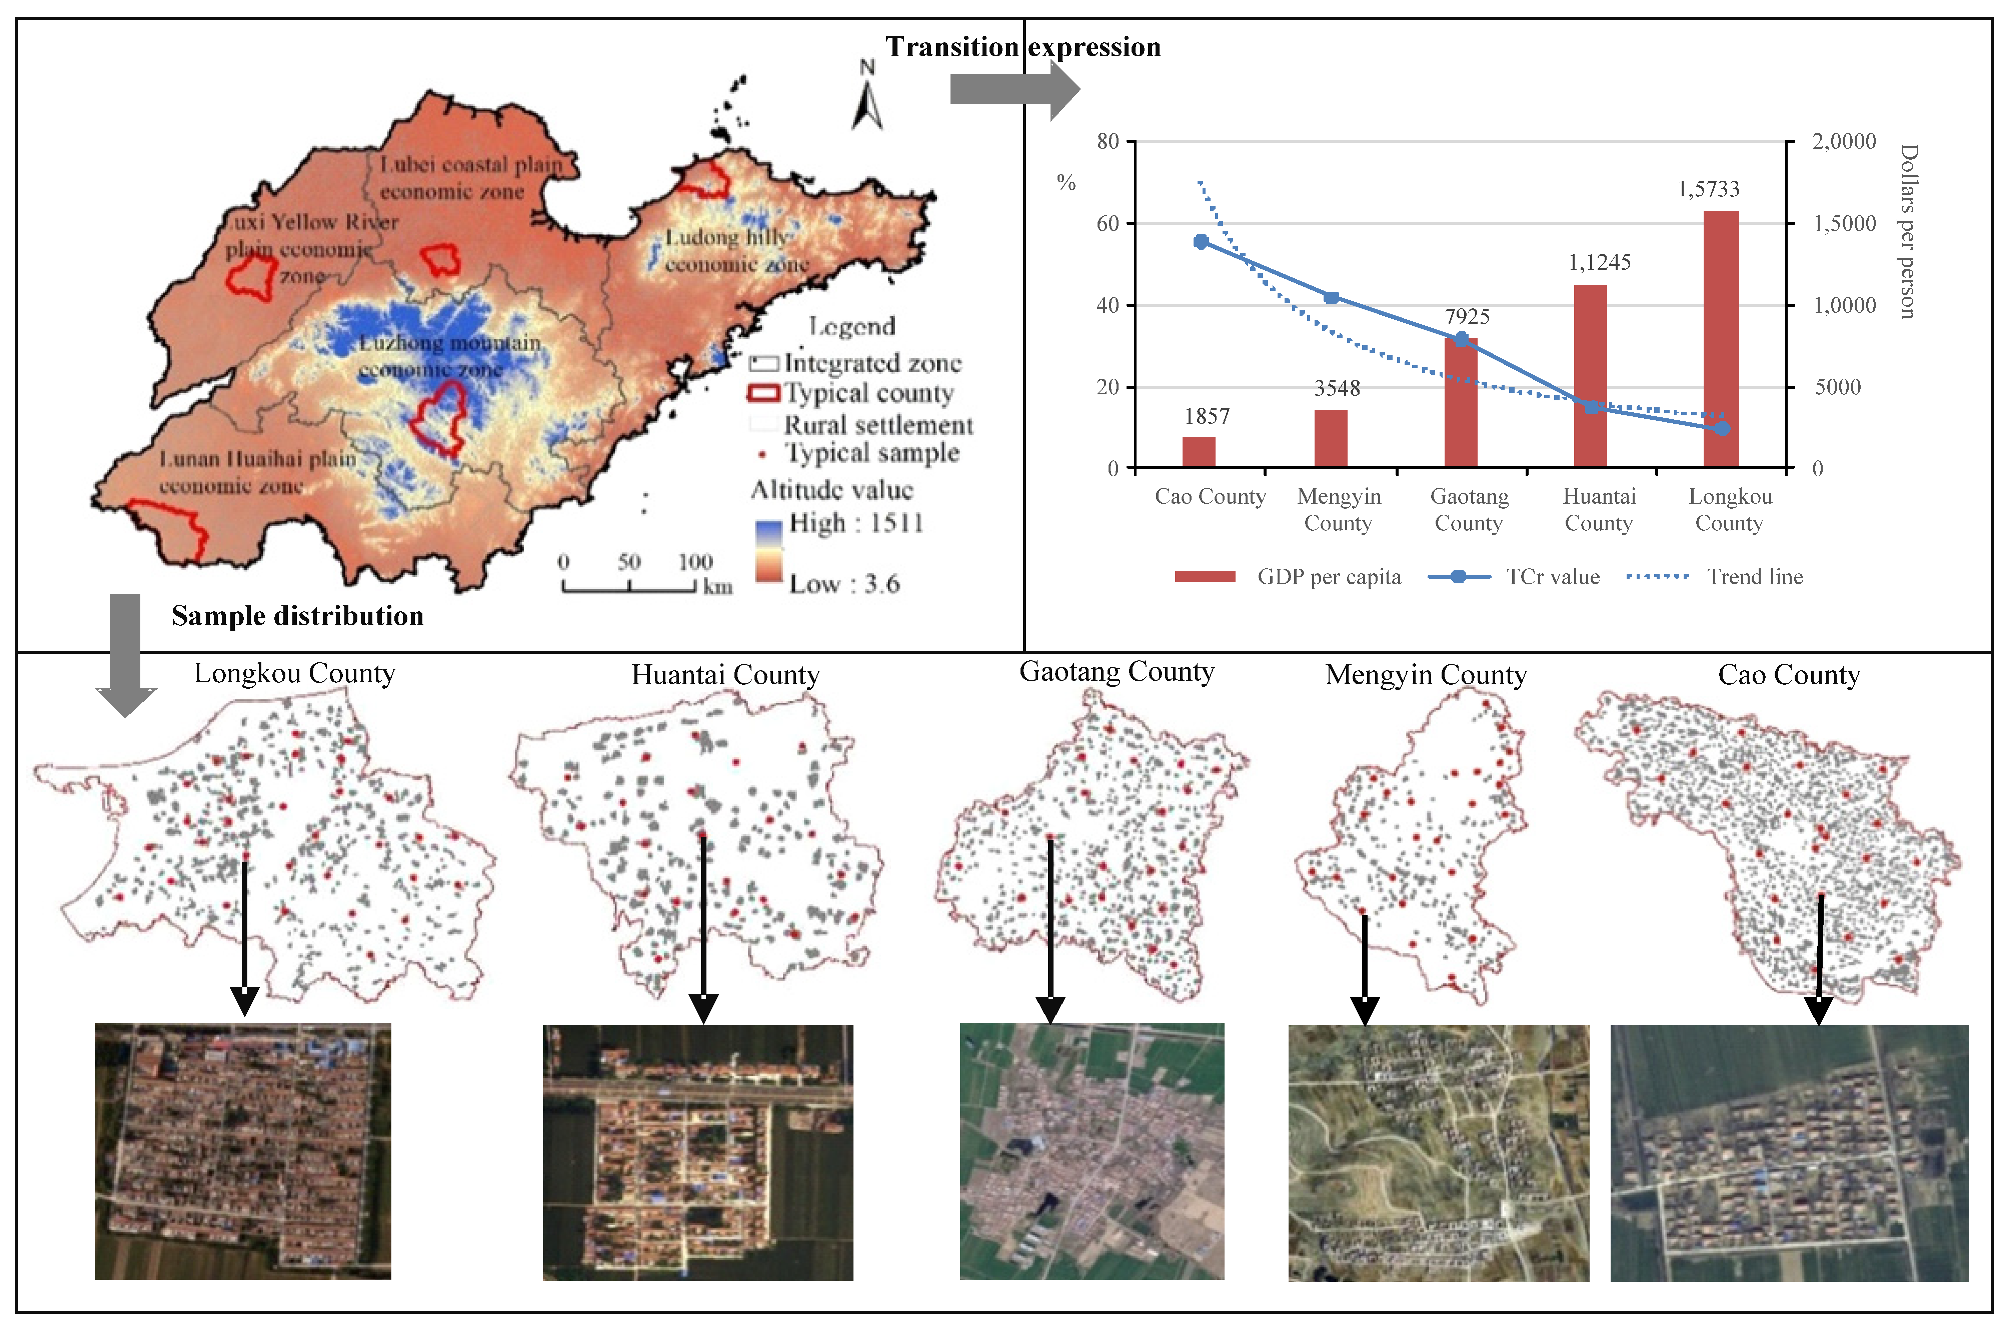
4.2.1. Selection of Typical Sample Areas and Sample Points in Different Transition Stages

Comprehensively considering the social, economic, and natural environment and other leading factors that affect the transition of rural residential areas, we selected for analysis five typical county-level sample areas in different transition stages in Longkou County, Huantai County, Gaotang County, Mengyin County, and Cao County and their internal 123 sample villages (Table 7 and Figure 5).
From the perspective of the sampling areas, on the one hand, the five typical sample areas and counties are located in the Ludong hilly economic zone, the Lubei coastal plain economic zone, the Luxi yellow river plain economic zone, the Luzhong mountain economic zone, and the Lunan Huai-hai plain economic zone, reflecting the differences in comprehensive geographical conditions and social and economic development. On the other hand, the transition index of rural residential land scale in the five sample counties decreased gradually from Cao County, through Mengyin County, Gaotang County, and Huantai County, to Longkou County, showing the characteristic of power exponent consistent with the theoretical hypothesis and representing the different stages of rural residential land transition. From the perspective of samples, on the one hand, the number of typical samples within each sample area is equivalent, distributed in each township within each sample area and corresponding to the economic level and topographic conditions of the sample area, ensuring the representativeness of the sample. On the other hand, the land use structure, spatial distribution structure, and living-production-ecological function of rural residential areas in different typical samples of different areas have certain similarities and differences, providing the conditions for us to explore the differentiation law of the structure and function of rural residential areas in different transition stages.

4.2.2. Stage Differentiation Characteristics of Rural Residential Structure

(1)
Differentiation of spatial distribution structure in rural residential areas
From the perspective of the plaque shape complexity of rural residential areas (Table 8), the changes in the AWMSI and AWMPFD indices of the five samples are consistent. Overall, with the continuous upgrade from lower stage to higher stage in the transition, the shape of the rural residential areas changes from complex to regular, which also indicates that the fractal characteristics of rural residential areas tend to be simplified and that the influence degree of human activity is gradually increasing. This is mainly due to the influence of the mountainous terrain, the scattered rural residential areas, and the irregular shape of the village’s periphery.
From the perspective of the spatial agglomeration degree of plaques in rural residential areas (Table 8), with the continuous upgrading of the transition stage, the fragmentation degree of rural residential plaques is gradually reduced, but the characteristics of this change are greatly affected by the terrain. On the other hand, the plaque connectivity and dispersion of the five samples show an opposite trend of increases and decreases. Among them, the COHESION indexes of Longkou County and Huantai County are significantly higher than those of the other three regions, and their IJI indexes are significantly lower than those of the other three regions. This shows that with the continuous upgrading of the transition stage, the degree of spatial connection and agglomeration of rural residential areas has gradually increased, and the spatial pattern of rural residential areas has gradually evolved from extensive to intensive.
(2)
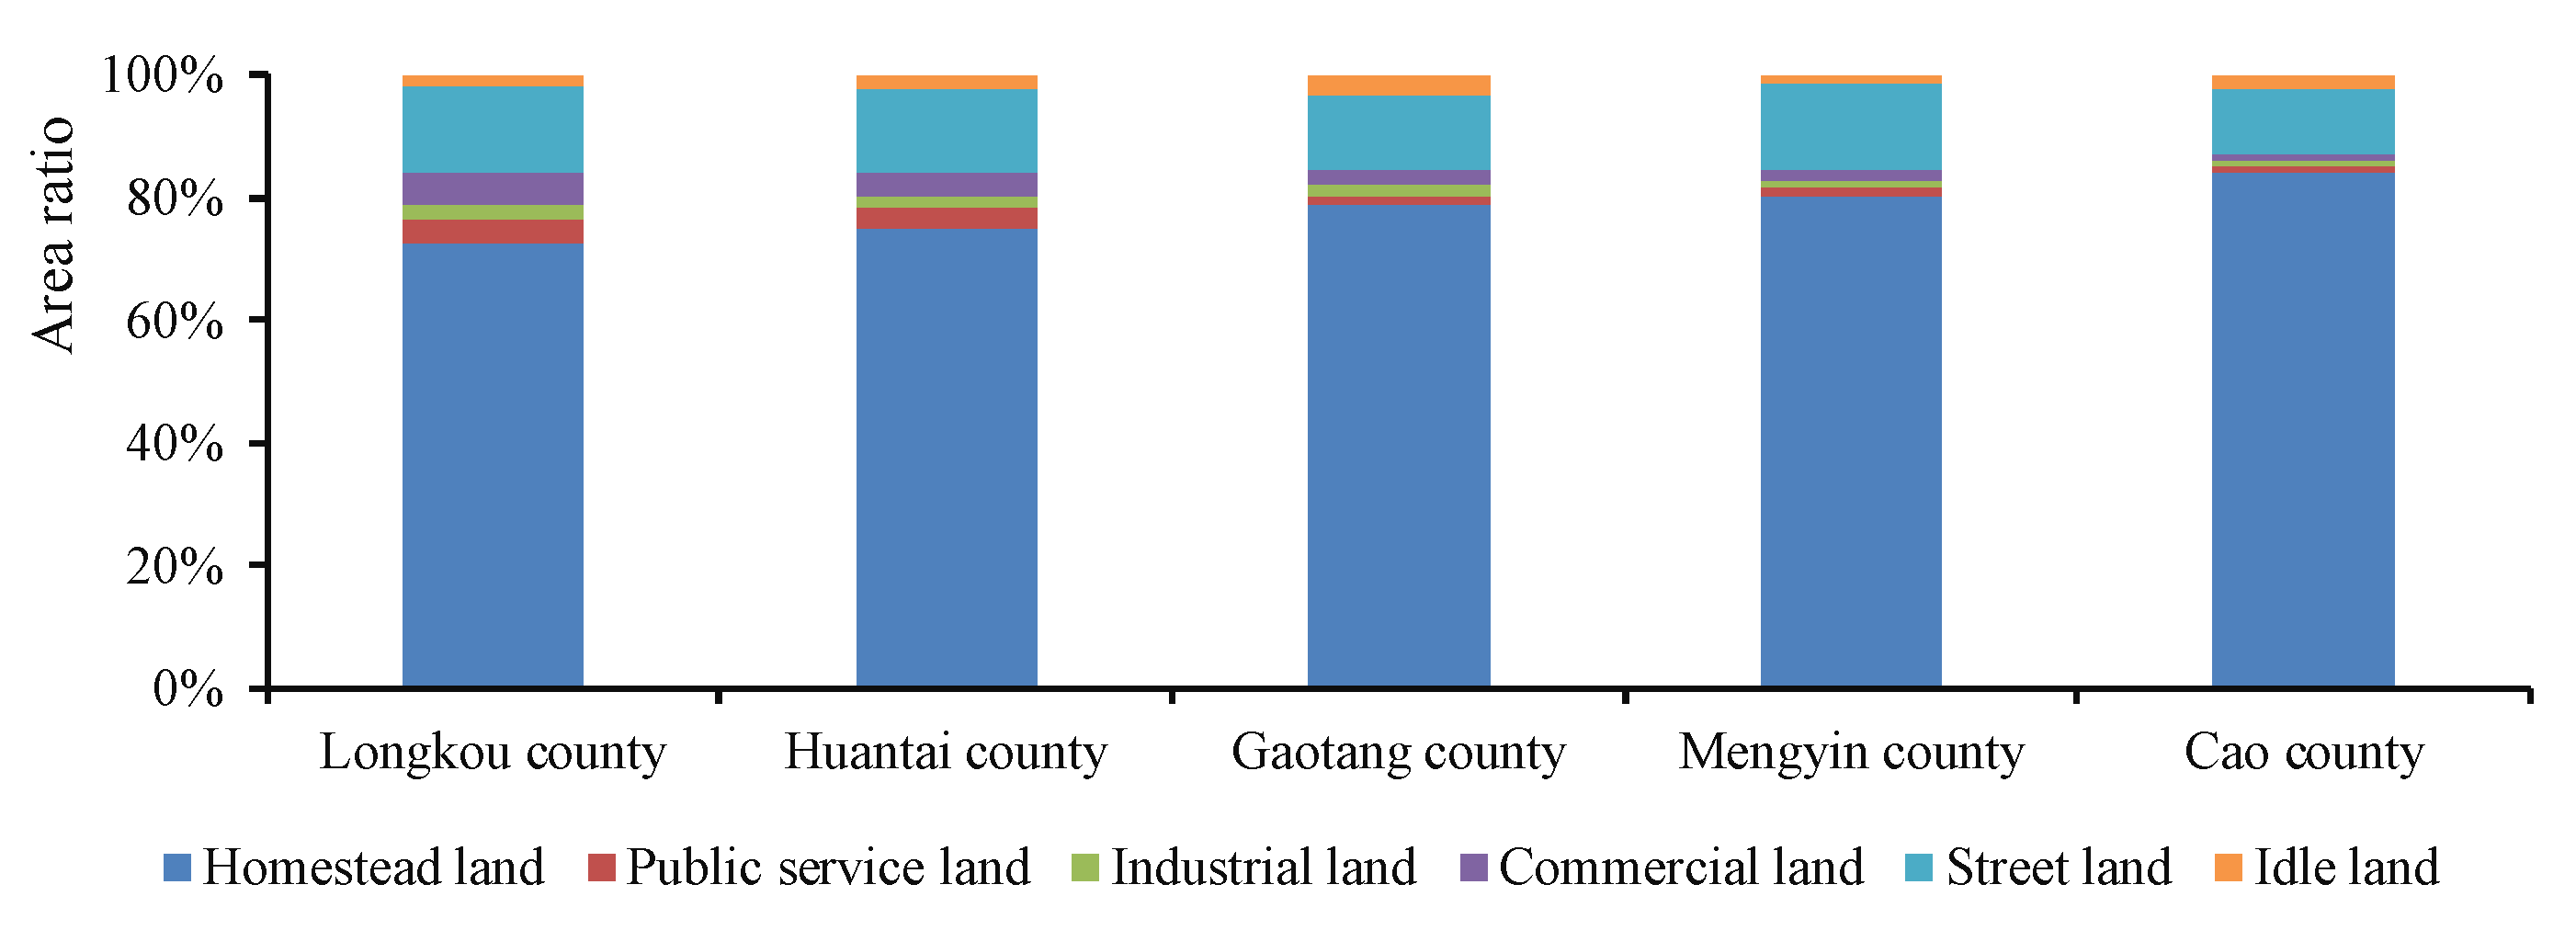
Differentiation of land use structure in rural residential areas
According to the average statistics of the area proportion of land use types in the rural residential areas of the typical sample villages in various areas (Figure 6), the homestead is the main part of the rural residential areas, and shows a trend of gradually increasing from high-level stage areas to low-level stage areas. Road occupies the second place in terms of size in rural residential areas, presenting the opposite characteristics to those found with regard to homestead change. Among them, the proportion of street land area in Mengyin County is slightly higher. The reason for this is that rural houses in mountainous areas are scattered and the area of roads connecting with each other increases; public service land, industrial land and commercial land have a low overall scale configuration and show the opposite characteristics to those found with regard to the changes in homesteads. These characteristics indicate that the level of infrastructure allocation in rural residential areas at each stage remains to be improved. Idle land refers to vacant and unused land in a village, which makes up a certain proportion in the five typical sample areas. Affected by terrain, the proportion of idle land in the plain area is significantly higher than that in the hilly area and the mountainous area, which shows that the internal land use structure conversion in the transition process of rural residential areas is not yet sufficient and the level of intensive land use needs to be improved, especially in plain areas.
In terms of the diversity and concentration of the internal land use structure of rural residential areas (Figure 7), both the GM score and the I score show opposite changes at the sample point and area level. First of all, there are certain differences in the internal land use structure of rural residential areas among the various sample points in the five sample areas. Among them, the maximum and minimum values of GM continue to increase with the upgrading of the transition stage, while the threshold range of GM gradually decreases from mountains and hills to the plain areas—that is, as the complexity of the terrain increases, the diversity of land use types within rural residential areas becomes more significant. The change in the I value is basically the opposite of the GM score. The proportions of samples with an I value of less than 0 continues to increase with the upgrading of the transition stage, showing that the internal land use types of rural residential areas in the high-level transition stage tend to be more diversified, while the internal land use types of rural residential areas in the low-level transition stage tend to be a single type dominated by homesteads. The differences in the internal land use structure of rural residential areas as a whole in the five sample areas are also significant. With the gradual escalation of the transition stage of rural residential areas, the average GM value continues to increase. The mean value of I decreases, and the law of stage differentiation is obvious. This phenomenon has a strong relationship with the regional socio-economic conditions. The higher the level of socio-economic development, the higher the demand for improved living conditions, while the higher the intensity of industrial activities, the more diverse functions are carried by rural residential areas. Therefore, it is necessary to provide more land use options for people’s living and production activities so as to make the internal land use structure of rural residential areas more diversified. The more land types there are and the more balanced the structure ratio is, the lower the possibility of there being a single or small amount of land use types is and the weaker the concentration is.

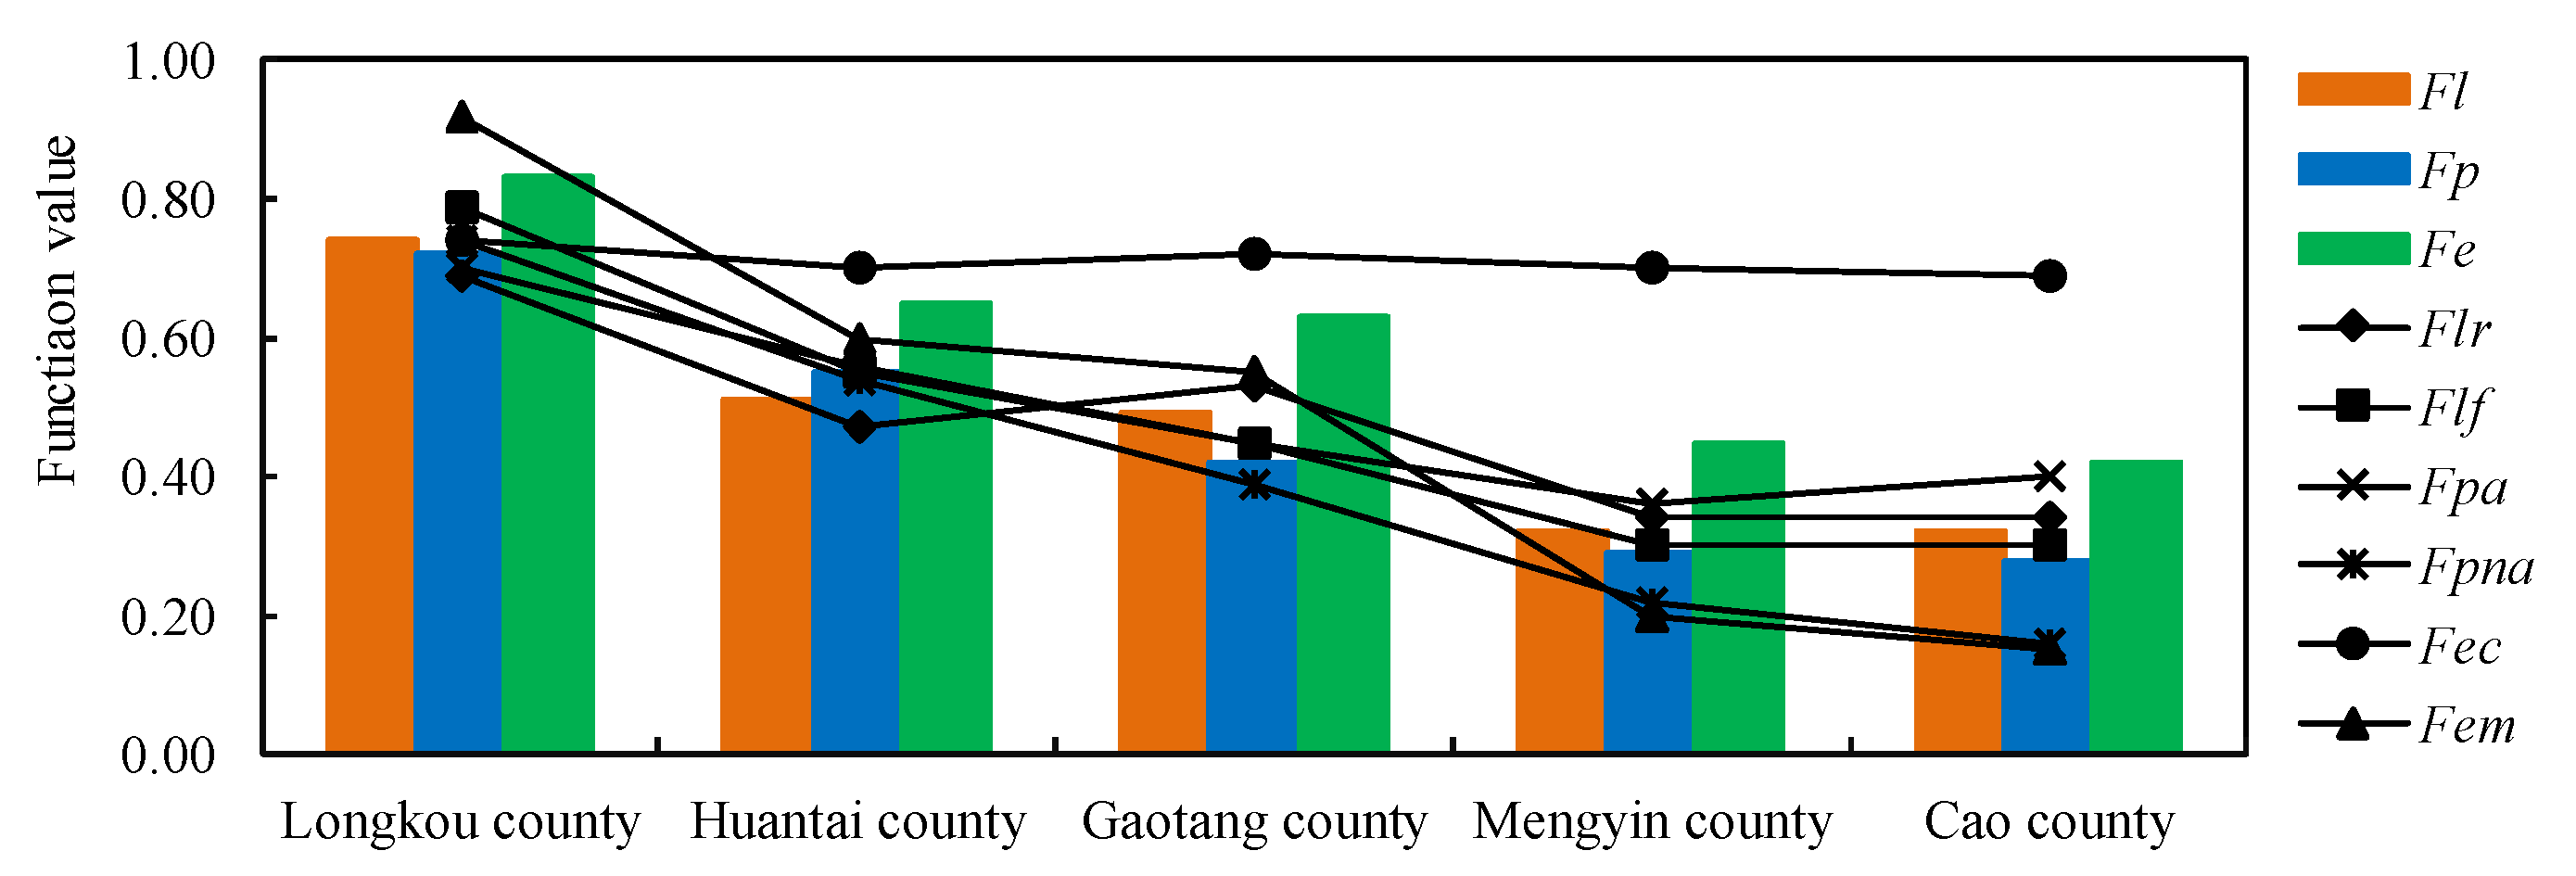
4.2.3. Stage Differentiation Characteristics of Rural Residential Functions

(1)
Intensity differentiation of single function
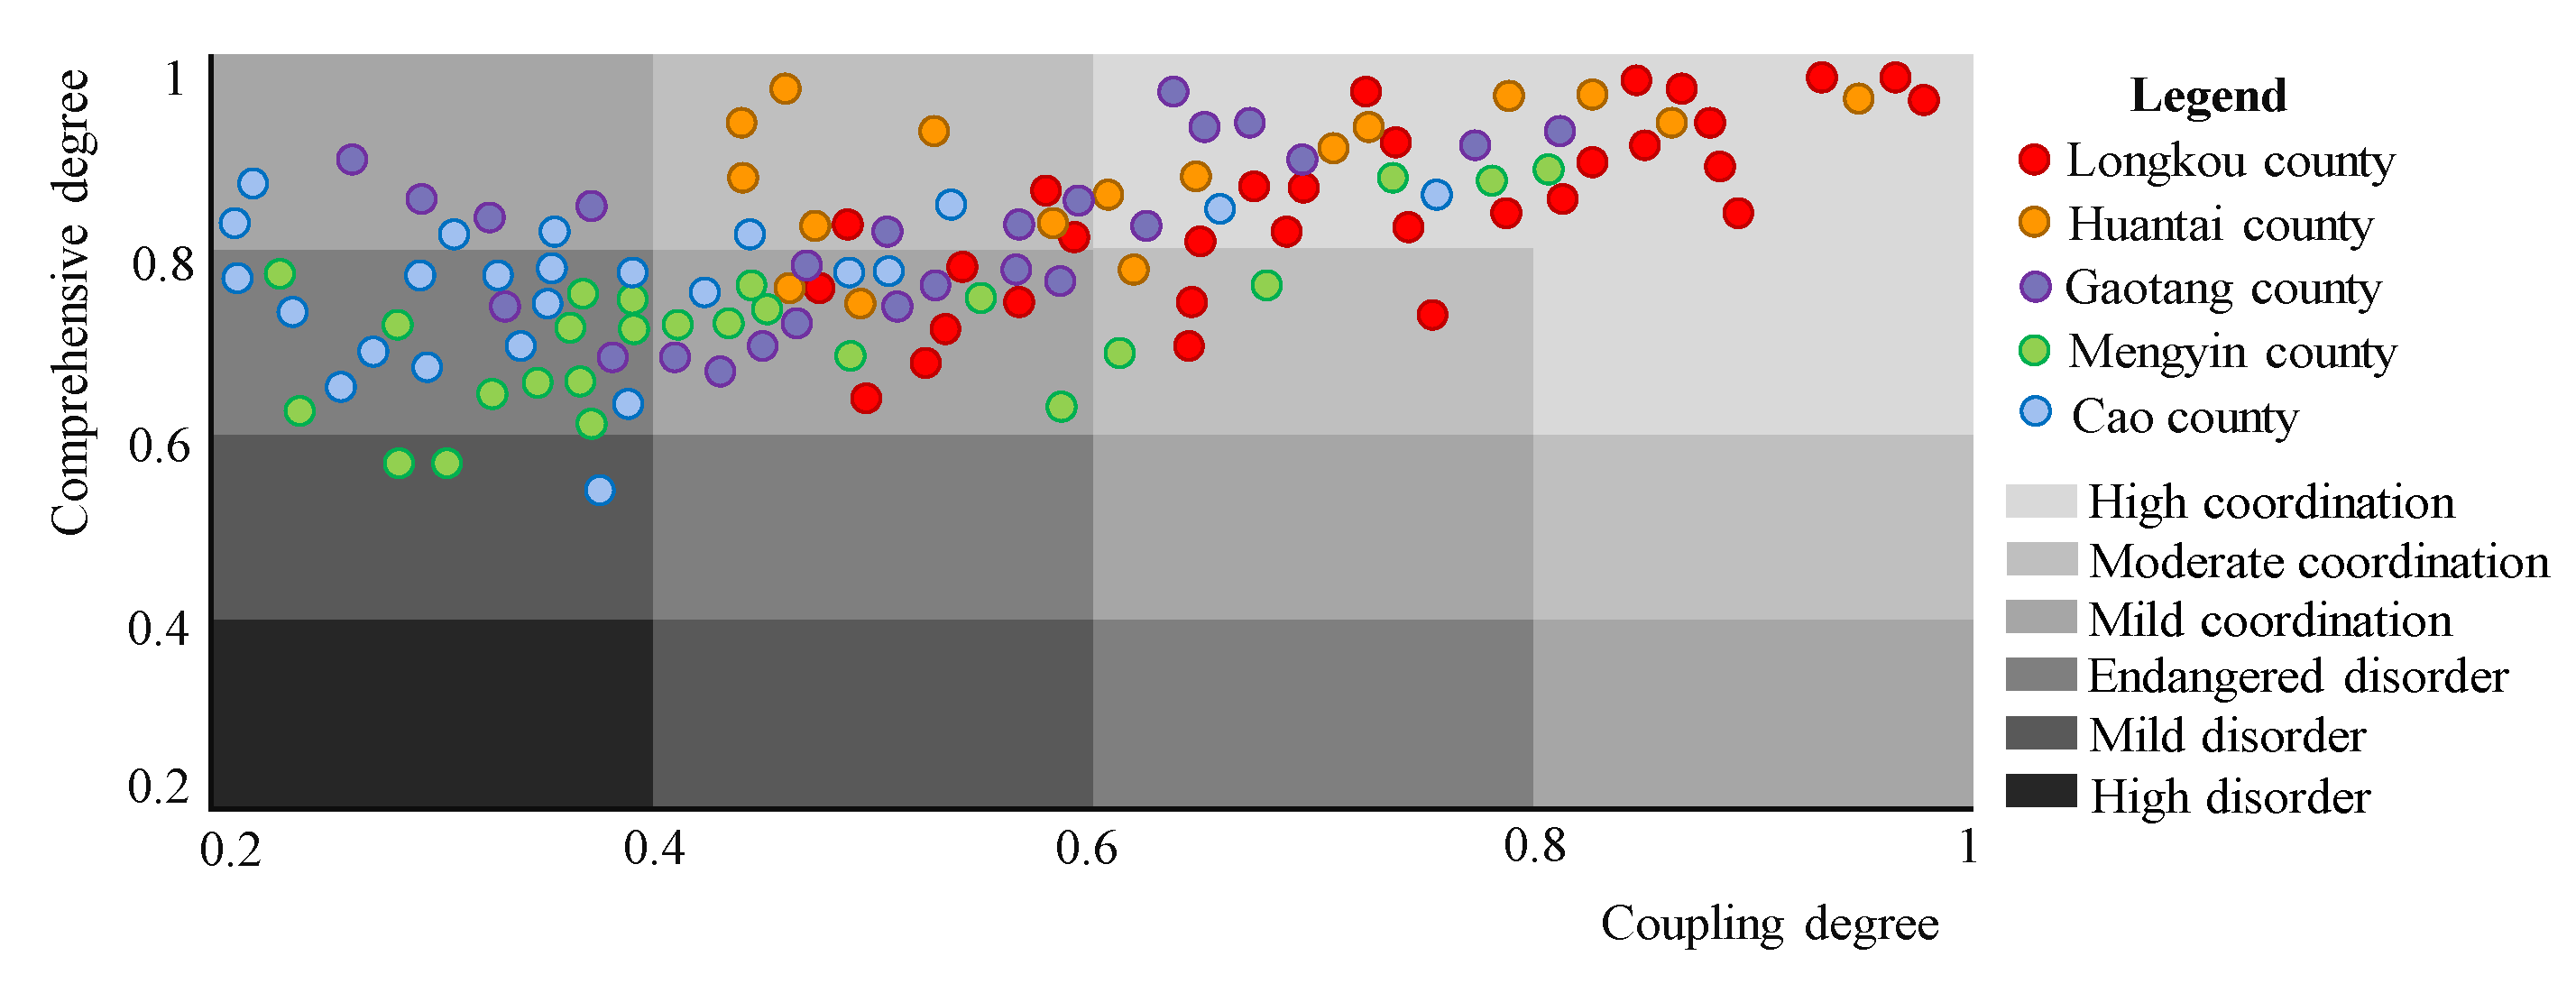
The living, production, and ecological functions of rural residential areas in the five sample areas all showed obvious gradient differences (Figure 8). Among them, the living function presents a “three-stage” gradient change, which is due to the high-level rural economy, the relatively large number of buildings, and the complete configuration of public services and infrastructure in the advanced transition stage. In terms of the production function of rural residential areas, the “four-stage” gradient change characteristics of the five sample areas are relatively significant, and the differences between different transition stages are more obvious. Among them, the non-agricultural production function in the primary stage is marginally better than that of the low stage. The reason for this is that the amount of per capita arable land area is relatively small. More rural laborers go out to work, and long-term or short-term non-agricultural production also drive the increase in non-agricultural income, which affects the changes in production and income structure. The ecological function of rural residential areas shows obvious characteristics of “three-stage” gradient changes. More specifically, the change trajectories of the ecological conservation function and environmental maintenance function are quite different. Among them, the overall difference in the scores for the ecological conservation functions is not large, showing a phased increase, which is closely related to the per capita green area in the village. Villages in the advanced stage have relatively complete rural home renovation and infrastructure construction, especially as the road hardening rate increases and the number of original trees in front of doors and at the roadside gradually decreases. In the low stage villages, a large number of trees and other types of vegetation are still preserved on both sides of the farmers’ courtyards and at the side of dirt roads. In this case, the overall score of the environmental maintenance function is quite different, and it maintains the characteristic of gradual decline. The ecological facilities of the advanced stage villages are more complete and sound than those of the low stage villages, showing that they are important influencing factors.
(2)
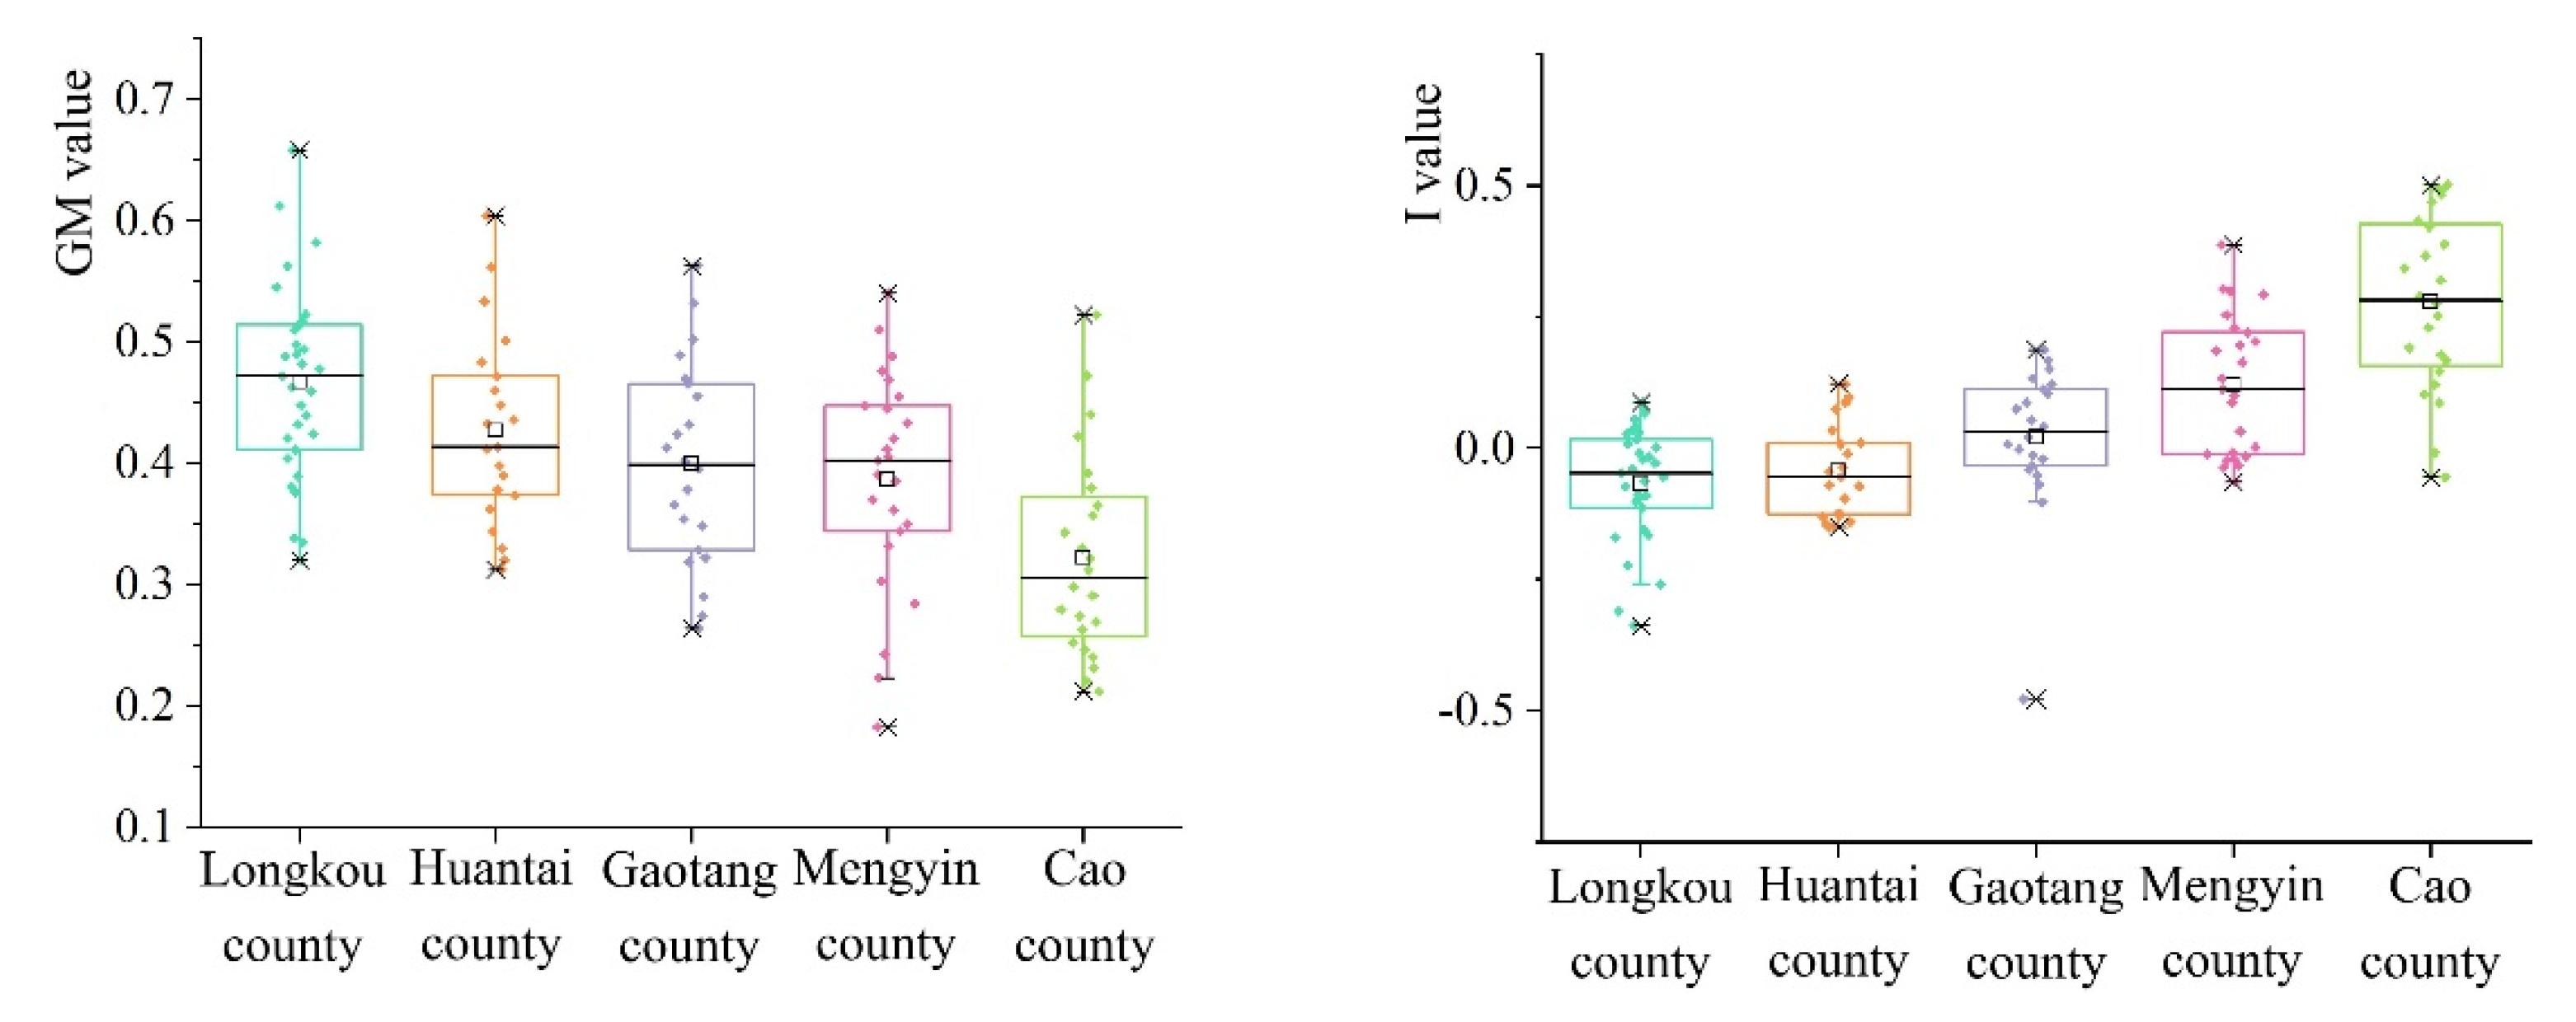
Multi-functional integration and coordinated differentiation
From the perspective of the comprehensive degree of the living-production-ecological function of rural residential areas (Figure 9), there are certain differences between the five sample areas and their typical sample points. Among them, the highest value of the multi-functional comprehensiveness of rural residential areas in the advanced transition stage is close to 1.0, the threshold interval is about 0.45, and the average value is above 0.6. However, the intermediate stage and low stage have the highest value of functional comprehensiveness at around 0.8, the threshold interval is around 0.55, and the average value is between 0.3 and 0.5. This shows that with the upgrading of the transition stage, the comprehensive functions of rural residential areas have been continuously enhanced, and the differences within the samples have gradually slowed down. From the perspective of the multi-functional coupling relationship of rural residential areas, the five sample areas and their typical sample sites all have certain process fluctuations—that is, with the continuous upgrading of the transition stage, the mean coupling degrees of the living-production-ecological function of rural residential areas decrease first and then increase. This volatility shows a certain terrain difference—that is, from the plain area to the hilly area to the mountain area, the multi-functional coupling degree of rural residential areas gradually decreases. In the plain area, with the upgrading of the transition stage, the multi-functional coupling degree of the rural residential areas gradually increases.
From the perspective of the coordination of the multi-functional comprehensive degree and coupling degree of rural residential areas and the downgrading of the transition stage, the multi-functional coordination of rural residential areas gradually decreases and the types of coordination tends to become more complicated. The areas in the advanced transition stage have a high-level of multi-functional coordination. Among them, more than 50% of the samples in Longkou County are in the high coordinated state. Gaotang County, which is in the intermediate transition stage, has a relatively general multi-functional coordination, with mild coordination as the mainstay, accounting for about 60% of the total number of typical samples. However, Mengyin County and Cao County, which are in the low transition stage, have low multi-functional coordination. In these two counties, less than 10% of the samples are coordinated moderately and highly, while more than 80% of the samples are in mild coordination and endangered disorder.

5. Discussion

5.1. The General Law and Formation Mechanism of Rural Residential Transition

The scale transition of rural residential land is the primary manifestation of the transition of rural residential areas. The transition of rural residential areas is actually a process of synergy and differentiation of structure and function on the basis of scale transition. This process is the result of the combined effect of multiple driving forces. Among them, the natural background condition is the basic driving force for the transition of rural residential areas, which has a long-term influence on the evolution of rural residential areas and plays a decisive role in the transition of early rural residential areas. With the development of economy and urbanization, the influence of natural conditions has been surpassed by other non-natural factors to some extent. Affected by economic development, population mobility, and government regulation [11], the transition of rural residential land scale has become more intense [29].
The transition of rural residential areas has stage characteristics. From the low-level transition stage to the high-level transition stage, the scale transition of rural residential areas is manifested as a slowdown or even as negative growth according to the land use scale. Meanwhile, the structures and functions of rural residential areas are gradually optimized and tend to be coordinated. In the low-level transition stage, it is less affected by urbanization and policy-related factors and retains significant rurality. The transition of rural residential land largely comprises the renewal and reconstruction of villages. With the gradual development of the rural economy, farmers have a strong desire to expand and build houses to improve their living conditions. The scale of rural residential areas has increased significantly. The spatial distribution is affected by natural conditions and lacks planning guidance, often presenting a scattered and disorderly distribution. The functions of rural residential areas are single, with traditional living function as the mainstay. In the mid-level transition stage, driven by urbanization and the market economy, the orientation of rural industrialization is obvious. Rural construction has shifted from housing to infrastructure and factories, and the rurality is gradually weakened. The spatial form of rural residential areas is greatly affected by population migration. At this stage, the spatial structure presents a trend of differentiation, while regional agglomeration and internal empty and disused areas coexist. The internal land structure of rural residential areas tends to be balanced and decentralized, which is reflected in the gradual decrease in the proportion of homestead areas, and the gradual increase in public service facility land, industrial land, and roads. Rural residential areas mainly have living function and production function. In the high-level transition stage, the urban–rural integration becomes closer due to the effects of urban development and the government’s policy regulation, while the rurality gradually weakens or even disappears locally. Strictly controlled by policies such as land use planning and management systems, the scale of rural residential areas has remained stable or even been reduced, the spatial form has begun to pursue fairness and justice, the spatial distribution has become more intensive and reasonable, the amount of empty and disused areas has decreased, and artificial buildings have become dense and regular. The internal structure of rural residential areas tends to be more complicated and their functions tend to be diversified. It can be seen that the transition stage differentiation of rural residential land scale consists in the difference in its own conditions to adapting to the external environment. For rural residential areas with superior conditions and gradual improvement, their ability to adapt to changes in the external environment is relatively strong and they are gradually upgraded from the lower stage to the higher stage. For rural residential areas with poor conditions and continuous degradation, they do not adapt to the development of the external environment and remain at a low stage until they die out [40]. This finding further enriches the existing single research content on the scale, structure, and functional transition of rural residential land use [29,32,50].

5.2. Rural Reconstruction Strategy Based on the Comprehensive Framework of “Elements–Structure–Function”

As a basic land use type and an important carrier of rural life and production, rural residential areas have comprehensively embodied the systematic characteristics of “element–structure–function” in the process of continuous evolution and transition. Rural reconstruction is a process of adapting to changes in rural internal factors and the external environment. By optimizing the allocation of elements and strengthening management methods, the reconstruction of the rural social form and regional spatial pattern is aimed at achieving the optimization of the internal structure and function of the rural regional system [51]. It can be seen that the spatial distribution pattern, internal land structure, and stage differentiation and upgrading of the system functions of rural residential areas driven by the transition of land element attributes are essentially the process of rural reconstruction [11,52]. Therefore, combined with the transmission characteristics of the rural residential area transition and dimensionality reduction proposed in this paper, this research constructs a comprehensive rural restructuring framework of “element–structure–function” (Figure 10) and proposes corresponding implementation strategies.
At the macro level, the land element attributes and spatial distribution pattern of rural residential areas are the main manifestations of this process. Under the influence of the urbanization process and the lack of a control system, the total scale of rural residential land is large, the phenomenon of hollowing and illegal construction is serious, and the spatial distribution is irregular and scattered. Changing these undesirable forms is the basic premise for promoting the transition of rural residential land. Therefore, under the joint action of a series of guiding mechanisms, such as external social development, market demand, technological progress, industrial upgrading, and policy innovation, the reconstruction of rural elements and space should be emphasized [53]. On the one hand, the village planning should be formulated scientifically. Based on the concept of equal emphasis on intensification and development, the village development boundary should be reasonably delimited and the overall land use scale of the village should be strictly controlled. At the same time, it is necessary to give full play to the blanking mechanism of planning and reserve a certain amount of land for uncertain projects in the process of future rural revitalization. On the other hand, it is also necessary to promote the land comprehensive consolidation and vigorously carry out hollow village governance. Taking advantage of the opportunity for rural land system reform, it is necessary to strengthen the orderly removal of the remaining rural construction land, such as idle and abandoned rural homesteads and industrial plants, so as to fully tap the potential of rural residential land and make use of land elements to promote the integrated development of rural industries and optimize the comprehensive effect of rural governance capacity. Moreover, with the effective planning and regulation of favorable policies concerning urban–rural integrated development and rural revitalization, the rural population should be appropriately concentrated in rural areas and non-agricultural industries should be appropriately structured to develop according to local conditions. Through different means, such as the relocation of villages and towns and the intensive internal organization of large-scale villages, the reconstruction of the rural spatial layout could be realized.
At the micro level, the internal land use structure of rural residential areas and the diverse functions that meet the needs of villagers are the main manifestations. The improvement and promotion of awareness of the problems of simple land use structures within villages, unbalanced land use for supporting service facilities and industrial development, poor living conditions, low production income, and pollution of the ecological environment are the fundamental factors for promoting the transition of rural residential areas. In this regard, it is necessary to combine the resource endowment conditions, location conditions, economic foundation, and subject behavior characteristics; encourage the internal support and organizational mechanism of the rural system; and focus on promoting the optimization and reorganization of the rural land structure and the restructuring of system functions. Among them, the optimization of land use structure should focus on rural homesteads, industrial land, and public service land. On the one hand, according to the principle of "one household has one house" and "every house has people living in it", some excess homestead land could be traded to users who need houses through ownership adjustment by means of policy incentives so as to solve the problem of the insufficient supply of homesteads. The other part of the surplus homesteads could be used for the development of rural industry through conversion to solve the problem of the lack of non-agricultural industrial land. On the other hand, according to the revitalization needs of rural industries, the planning of rural industrial parks should be promoted and the integrated development of rural industries should be promoted through the market transactions of stock collective construction land and appropriate incremental replenishment so as to provide opportunities for local employment and urban capital to the countryside. In addition, according to the requirements of the equalization of urban and rural public services, the allocation of rural public service resources should be improved. In particular, for villages with priority development, land investment and a centralized layout of basic service facilities such as education, health, parks, and squares should be strengthened to continuously improve the rural service capacity.
It is necessary to combine different aspects of life, production, and ecology with a definite target to improve the function of the rural system. On the one hand, under the guidance of the rural revitalization strategy, appropriate human intervention measures should be taken to improve the traditional rural development mode. With the help of policies and institutions, it is possible to improve the organizational capacity of rural communities and provide diversified sources of livelihoods. Using engineering technology to strengthen the renovation of rural dilapidated houses and the treatment of environmental pollution, we can gradually change rural employment methods, lifestyles, and family consumption concepts and ideologies and comprehensively improve the life quality of rural residents. On the other hand, based on planning guidance and market mechanisms and according to the principle of agglomeration development and intensive management, the development layout of rural industries should be coordinated, non-agricultural industries should be integrated into parks, and point land supply should be combined so as to promote the mutual flow of urban and rural populations and capital and accelerate the reconstruction of rural industries. In addition, based on the characteristics of the rural ecosystem, an ecological interception system should be established to absorb and purify non-point source pollution; strengthen the comprehensive treatment project of pollutants; and form a system of source reduction, flow interception, and treatment. At the same time, it is also important to follow the principles of landscape ecology to strengthen the background matrix of rural woodland and farmland ecosystems, improve the corridor of the rural ecosystem, protect the habitat environment of species, and maintain the diversity of biological resources.
In this way, rural reconstruction can be placed in the integrated frame of the "element–structure–function" of the rural residential system. Under the guidance and promotion mechanism of the external environment of the system and through the macro reconstruction of land elements and spatial patterns, the structure and function of rural residential land will be continuously upgraded from the aspects of resource optimal allocation and planning control. With the support of the internal elements of the system and the action of the organizational mechanism, the micro land use structure optimization and function improvement can meet the needs of the improvement of residents’ living quality and rural transition, and then feed back to the macro element allocation and spatial reconstruction. Finally, an evolutionary process of interaction between the guidance of macro-control and feedback of micro-control is formed to promote rural reconstruction [54].

5.3. Contributions, Limitations, and Future Work

In theory, we have established a multi-level framework with comprehensive scale, structure, and function to discuss the transition mechanism and stage differentiation characteristics of rural residential areas, and—to some extent—solve the limitations of rural residential land use transition research from a single perspective. The scale transition of rural residential land and the synergistic differentiation of structure and function revealed by this research will help enrich and improve the existing rural land use transition theories. The proposed theoretical framework is designed for research into the transition of different regions and different types of rural residential areas. It has a wide range of promotional value and universality. At the same time, we adopted Long’s classic model of rural homestead transition measurement [32], a landscape index model, a spatial statistical analysis method, and a multi-factor comprehensive analysis method. This study gradually reduces the dimensionality from the macro-provincial scale to the micro-village scale, and conducts a systematic empirical analysis of the transition process of rural residential land use. We also put forward a feasible strategy for achieving rural restructuring, realizing an effective combination of theory and application. Therefore, the systematic research logic and the multiple analysis methods of the dimensionality reduction process adopted by this research provide a new perspective for multidisciplinary cross-integration research, which will help to enrich the theoretical research and practical applications of land use transition and rural development worldwide.
However, although this study puts forward new ideas and a more effective method for understanding the transition problems of rural residential areas, there are certain potential uncertainties in the results. On the one hand, land use transition is a regional and even global issue, and different regions have different transition characteristics due to various factors [43]. This research mainly focuses on the transition characteristics of rural residential areas with different natural conditions and social and economic development levels. The consideration of human factors, such as policy system, culture, and subject behavior, is still lacking. On the other hand, the various and complicated methods of land use transition are also a shortcoming of the current research, which is related to the land use system, including various types of land, such as productive land, public welfare land, and ecological land. This research mainly focuses on the scale characteristics of rural residential areas and proposes a land use transition analysis method system for use in the process of dimensionality reduction. The analysis of long-term historical sequence evolution must be strengthened. Meanwhile, various detailed indicators are more suitable for the characteristics of the study area, and are not yet fully popularized. For use in other regions, they should be adjusted and supplemented. Therefore, the application of the research framework constructed in this article to China as a whole, and indeed the world in the long-term rural residential area transition research still requires further research and discussion. In the future, comprehensive analysis of the driving factors behind all elements of nature, society, the economy, culture, and institutions, the research theory of the interaction between subject and object, and the horizontal, vertical, and universal method systems will be an important research direction with regard to the transition of rural residential areas and even land use transition, which have important scientific value and practical significance in terms of developing a deep understanding of the evolutionary process of rural residential areas in different regions of the world.

6. Conclusions

Based on the process of dimensionality reduction transmission from the macro pattern to the micro sample points, this paper used the index of scale transition, the landscape pattern, the diversity and concentration index, and the living-production-ecological function index to divide the transition stages of the rural residential land use scale and comparatively analyze the influential factors of typical areas and sample points. On this basis, the procedural characteristics of the scale transition of rural residential land in Shandong Province over the past 10 years and the stage differentiation law with the corresponding structure and function are discussed in depth.
(1) The transition index of rural residential area in each county (district) of Shandong Province ranges from 0.0396 to 0.3838, with significant stage characteristics. The transition stage of rural residential areas in Shandong Province can be divided into five stages: a primary stage, low stage, intermediate stage, advanced stage, and stable stage. From the lower stage to the higher stage, the rural residential land gradually tends toward a new balance, and the spatial distribution shows an obvious agglomeration and autocorrelation. The driving factors and intensity of the effects are expressed as GDP change rate > land supply rate of construction land planning > altitude > rural population change rate. Altitude has a positive effect on the transition of rural residential areas, while other factors have a negative effect on the whole.
(2) With the gradual upgrading of the transition stage, the spatial distribution pattern of rural residential areas has been continuously integrated and optimized and the spatial distribution has become more intensive. The internal land use structure of rural residential areas tends to be balanced and decentralized, and the system functions of rural residential areas are gradually changing. The comprehensive functions of living, production, and ecology are gradually increasing, while the ecological conservation function is weakening. The stage differentiation of the structure and function of rural residential areas shows the difference in the conditions of rural residential areas adapting to the external environment. For rural residential areas with superior conditions and gradual improvement, their ability to adapt to changes in the external environment is relatively strong and they are gradually upgraded from the lower stage to the higher stage. Meanwhile, rural residential areas with poor conditions and continuous degradation cannot adapt to the development of the external environment and will remain in the lower stage until they die out.

Author Contributions

Conceptualization, Y.Q.; methodology, Y.Q., X.D. and L.Z.; formal analysis, Y.Q., X.D. and L.Z.; data curation, Y.Q., H.S., Z.P. and W.Z.; writing—original draft preparation, Y.Q., X.D. and L.Z.; writing—review and editing, Y.Q., X.D. and H.S.; visualization, Y.Q., X.D. and L.Z.; supervision, Y.Q. and H.S.; funding acquisition, Y.Q. All authors have read and agreed to the published version of the manuscript.

Funding

This research was funded by the National Natural Science Foundation of China, grant numbers 42077434, 41771560, and the Shandong Provincial Institutions of Higher Learning “Youth Innovation Team Development Plan” Project, grant number 2019RWG016.

Institutional Review Board Statement

Not applicable for studies not involving humans or animals.

Informed Consent Statement

Not applicable for studies not involving humans.

Conflicts of Interest

The authors declare no conflict of interest.

References

  1. Turner, B.L.; Lambin, E.F.; Reenberg, A. The emergence of land change science for global environmental change and sustainability. Proc. Natl. Acad. Sci. USA 2007, 104, 20666–20671. [Google Scholar] [CrossRef] [Green Version]
  2. Mather, A.S. Global Forest Resources; Belhaven: London, UK, 1990. [Google Scholar]
  3. Mather, A.S. The forest transition. Area 1992, 24, 367–379. [Google Scholar]
  4. Grainger, A. National land use morphology: Patterns and possibilities. Geography 1995, 80, 235–245. [Google Scholar]
  5. Bae, J.S.; Joo, R.W.; Kim, Y.-S. Forest transition in South Korea: Reality, path and drivers. Land Use Policy 2012, 29, 198–207. [Google Scholar] [CrossRef]
  6. Yeo, I.Y.; Huang, C. Revisiting the forest transition theory with historical records and geospatial data: A case study from Mississippi (USA). Land Use Policy 2013, 32, 1–13. [Google Scholar] [CrossRef]
  7. Bertoni, D.; Aletti, G.; Ferrandi, G.; Micheletti, A.; Cavicchioli, D.; Pretolani, R. Farmland Use Transitions After the CAP Greening: A Preliminary Analysis Using Markov Chains Approach. Land Use Policy 2018, 79, 780–800. [Google Scholar] [CrossRef]
  8. Ma, L.; Long, H.; Tu, S.; Zhang, Y.; Zheng, Y. Farmland transition in China and its policy implications. Land Use Policy 2020, 92, 104470. [Google Scholar] [CrossRef]
  9. Ernstson, H.; Van der Leeuw, S.E.; Redman, C.L.; Meffert, D.J.; Davis, G.; Alfsen, C.; Elmqvist, T. Urban transitions: On urban resilience and human-dominated ecosystems. Ambio 2010, 39, 531–545. [Google Scholar] [CrossRef] [PubMed] [Green Version]
  10. Kong, X.; Liu, Y.; Jiang, P.; Tian, Y.; Zou, Y. A novel framework for rural homestead land transfer under collective ownership in China. Land Use Policy 2018, 78, 138–146. [Google Scholar] [CrossRef]
  11. Long, H.; Qu, Y.; Tu, S.; Zhang, Y. Development of land use transitions research in China. J. Geogr. Sci. 2020, 30, 1195–1214. [Google Scholar] [CrossRef]
  12. Drummond, M.A.; Auch, R.F.; Karstensen, K.A.; Sayler, K.L.; Taylor, J.L.; Loveland, T.R. Land change variability and human–environment dynamics in the United States Great Plains. Land Use Policy 2011, 29, 710–723. [Google Scholar] [CrossRef] [Green Version]
  13. Lu, X.; Qu, Y.; Sun, P.; Yu, W.; Peng, W. Green Transition of Cultivated Land Use in the Yellow River Basin: A Perspective of Green Utilization Efficiency Evaluation. Land 2020, 9, 475. [Google Scholar] [CrossRef]
  14. Song, X.; Li, X. Theoretical explanation and case study of regional cultivated land use function transition. Acta Geogr. Sin. 2019, 74, 992–1010. [Google Scholar]
  15. Ge, D.; Wang, Z.; Tu, S.; Long, H.; Yan, H.; Sun, D.; Qiao, W. Coupling analysis of greenhouse- led farmland transition and rural transformation development in China’s traditional farming area: A case of Qingzhou City. Land Use Policy 2019, 86, 113–125. [Google Scholar] [CrossRef]
  16. Liao, L.; Long, H.; Ma, E. Rural Labor Change and Farmland Use Transition. Econ. Geogr. 2021, 41, 148–155. [Google Scholar]
  17. Lou, Y.; Yin, G.; Xin, Y.; Xie, S.; Li, G.; Liu, S.; Wang, X. Recessive Transition Mechanism of Arable Land Use Based on the Perspective of Coupling Coordination of Input–Output: A Case Study of 31 Provinces in China. Land 2021, 10, 41. [Google Scholar] [CrossRef]
  18. Zhou, X.; Li, X.; Song, W.; Kong, X.; Lu, X. Farmland Transitions in China: An Advocacy Coalition Approach. Land 2021, 10, 122. [Google Scholar] [CrossRef]
  19. Niu, S.; Fang, B.; Cui, C.; Huang, S. The spatial-temporal pattern and path of cultivated land use transition from the perspective of rural revitalization: Taking Huaihai Economic Zone as an example. J. Nat. Resour. 2020, 35, 1908–1925. [Google Scholar]
  20. Long, H.; Tu, S.; Ge, D.; Li, T.; Liu, Y. The Allocation and Management of Critical Resources in Rural China under Restructuring: Problems and Prospects. J. Rural Stud. 2016, 47, 392–412. [Google Scholar] [CrossRef] [Green Version]
  21. Barbieri, A.F.; Guedes, G.R.; dos Santos, R.O. Land use systems and livelihoods in demographically heterogeneous frontier stages in the amazon. Environ. Dev. 2020, 38, 100587. [Google Scholar] [CrossRef]
  22. Long, H.; Ge, D.; Zhang, Y.; Tu, S.; Qu, Y.; Ma, L. Changing man-land interrelations in China’s farming area under urbanization and its implications for food security. J. Environ. Manag. 2018, 209, 440–451. [Google Scholar] [CrossRef]
  23. Cowell, M.; Eckerd, A.; Smart, H. The rural identity and the encroaching city: Governance, policy and development in Northern Virginia’s Wine Country. Growth Chang. 2020, 51, 79–101. [Google Scholar] [CrossRef]
  24. Liu, Y.; Yang, R.; Long, H.; Gao, J.; Wang, J. Implications of land use change in rural China: A case study of Yucheng, Shandong Province. Land Use Policy 2014, 40, 111–118. [Google Scholar] [CrossRef]
  25. Wang, Y.; Bi, G.; Yang, Q.; Wang, Z. Analyzing land use characteristics of rural settlements on the urban fringe of Liangjiang New Area, Chongqing, China. J. Mt. Sci. 2016, 13, 1855–1866. [Google Scholar] [CrossRef]
  26. Sharma, A. Urban Proximity and Spatial Pattern of Land Use and Development in Rural India. J. Dev. Stud. 2016, 52, 1593–1611. [Google Scholar] [CrossRef]
  27. Yang, R.; Xu, Q.; Long, H. Spatial distribution characteristics and optimized reconstruction analysis of China’s rural settlements during the process of rapid urbanization. J. Rural Stud. 2016, 47, 413–424. [Google Scholar] [CrossRef]
  28. Mazloum, B.; Pourmanafi, S.; Soffianian, A.; Salmanmahiny, A.; Prishchepov, A.V. The fate of rangelands: Revealing past and predicting future land-cover transitions from 1985 to 2036 in the drylands of Central Iran. Land Degrad. Dev. 2021, 14. [Google Scholar] [CrossRef]
  29. Ma, W.; Jiang, G.; Zhang, R.; Li, Y.; Jiang, X. Achieving rural spatial restructuring in China: A suitable framework to understand how structural transitions in rural residential land differ across peri-urban interface? Land Use Policy 2018, 75, 583–593. [Google Scholar] [CrossRef]
  30. Muyombano, E.; Espling, M. Land use consolidation in Rwanda: The experiences of small-scale farmers in Musanze District, Northern Province. Land Use Policy 2020, 99, 105060. [Google Scholar] [CrossRef]
  31. Zhang, F.R.; Zhou, J.; Zhang, B.L. Construction land consolidation potential analysis for rural settlements from aspects of land use structure and their functions. J. China Agric. Univ. 2016, 21, 155–160. [Google Scholar]
  32. Long, H. Rural housing land transition in China: Theory and verification. Acta Geogr. Sin. 2006, 61, 1100. [Google Scholar]
  33. Qu, Y.; Jiang, G.; Zhang, B. Spatial characteristics of rural residential land transition and its economic gradient differentiation. Acta Geogr. Sin. 2017, 72, 1845–1858. [Google Scholar]
  34. Wen, Y.; Zhang, Z.; Liang, D.; Xu, Z. Rural residential land transition in the Beijing-Tianjin- Hebei region: Spatialtemporal patterns and policy implications. Land Use Policy 2020, 96, 104700. [Google Scholar] [CrossRef]
  35. Shang, R.; Qu, Y.; Jiang, H. Spatiotemporal characteristics and formation mechanism of rural residential land transition from the perspective of human-land relationship. Resour. Sci. 2020, 42, 672–684. [Google Scholar]
  36. Qu, Y.; Jiang, G.; Li, Z.; Tian, Y.; Wei, S. Understanding rural land use transition and regional consolidation implications in China. Land Use Policy 2019, 82, 742–753. [Google Scholar] [CrossRef]
  37. Qu, Y.; Jiang, G.; Tian, Y.; Shang, R.; Wei, S.; Li, Y. Urban-Rural construction land Transition (URCLT) in Shandong Province of China: Features measurement and mechanism exploration. Habitat Int. 2019, 86, 101–115. [Google Scholar]
  38. Silva, R.J.; Nardoto, G.B.; Schor, T.; da Silva, M.R.F.; Martinelli, L.A. Impacts of market economy access and livelihood conditions on agro-food transition in rural communities in three macro-regions of Brazil. Environ. Dev. Sustain. 2021, 1–21. Available online: https://link.springer.com/article/10.1007/s10668-021-01480-3 (accessed on 5 February 2021).
  39. Qu, Y.; Jiang, G.; Ma, W.; Li, Z. How does the rural settlement transition contribute to shaping sustainable rural development? Evidence from Shandong, China. J. Rural Stud. 2021, 82, 279–293. [Google Scholar]
  40. Qu, Y. Transition of rural settlements: Concept, feature, mechanism and path. Sci. Geogr. Sin. 2020, 40, 572–580. [Google Scholar]
  41. Chen, K.; Long, H.; Liao, L.; Tu, S.; Li, T. Land Use Transitions and Urban-Rural Integrated Development: Theoretical Framework and China’s Evidence. Land Use Policy 2020, 92, 104465. [Google Scholar] [CrossRef]
  42. Chen, R.; Ye, C.; Cai, Y.; Xing, X.; Chen, Q. The impact of rural out-migration on land use transition in China: Past, present and trend. Land Use Policy 2014, 40, 101–110. [Google Scholar] [CrossRef]
  43. Foley, J.A.; Defries, R.; Asner, G.P.; Barford, C.; Bonan, G.; Carpenter, S.R.; Chapin, F.S.; Coe, M.T.; Daily, G.C.; Gibbs, H.K.; et al. Global Consequences of Land Use. Science 2005, 309, 570–574. [Google Scholar] [CrossRef] [Green Version]
  44. Qu, Y.; Jiang, G.; Zhao, Q.; Ma, W.; Zhang, R.; Yang, Y. Geographic identification, spatial differentiation, and formation mechanism of multifunction of rural settlements: A case study of 804 typical villages in Shandong Province, China. J. Clean. Prod. 2017, 166, 1202–1215. [Google Scholar] [CrossRef]
  45. Zhang, Q.; Zhou, B.; Mo, Y.; Wu, Q. Ecological Landscape Evaluation for Regional Sustainability of Land-use. Chin. J. Eco-Agric. 2008, 3, 741–746. [Google Scholar]
  46. McGarigal, K.; Cushman, S.A.; Ene, E. FRAGSTATS, v4: Spatial Pattern Analysis Program for Categorical and Continuous Maps. 2012. Available online: https://www.umass.edu/landeco/research/fragstats/fragstats.html (accessed on 5 February 2021).
  47. Lemoine-Rodríguez, R.; Inostroza, L.; Zepp, H. The global homogenization of urban form. An assessment of 194 cities across time. Landsc. Urban Plan. 2020, 204, 103949. [Google Scholar] [CrossRef]
  48. Jiang, G.; Zhang, F.; Zhou, D. Analyzing the land use structure characteristics of rural residential area in Beijing city. Resour. Sci. 2007, 29, 109–116. [Google Scholar]
  49. Long, H.; Heilig, G.K.; Li, X.; Zhang, M. Socio-economic development and land-use change: Analysis of rural housing land transition in the Transect of the Yangtse River, China. Land Use Policy 2005, 24, 141–153. [Google Scholar] [CrossRef]
  50. Zhu, F.; Zhang, F.; Li, C.; Zhu, T. Functional transition of the rural settlement: Analysis of land-use differentiation in a transect of Beijing, China. Habitat Int. 2014, 41, 262–271. [Google Scholar] [CrossRef]
  51. Long, H. Land Use and Rural Transformation Development in China; Science Press: Beijing, China, 2012. [Google Scholar]
  52. Long, H.; Liu, Y. Rural restructuring in China. J. Rural Stud. 2016, 47, 387–391. [Google Scholar] [CrossRef]
  53. Long, H. Land Use Transitions and Rural Restructuring in China; Springer: Singapore, 2020. [Google Scholar]
  54. Long, H.; Qu, Y. Land use transitions and land management: A mutual feedback perspective. Land Use Policy 2018, 74, 111–120. [Google Scholar] [CrossRef]
Figure 1. Theoretical framework of rural residential transition based on dimension reduction.
Land 10 00647 g001
Figure 2. Research framework of rural residential land transition.
Land 10 00647 g002
Figure 3. The division of rural residential land transition stages in Shandong Province.
Land 10 00647 g003
Figure 4. Spatial distribution map of R2 in the GWR model and distribution maps for the regression coefficients of independent variables in the GWR model. Among them, (a) represents the spatial distribution of the impact of altitude on rural residential area transition; (b) represents the spatial distribution of the impact of GDP change rate on rural residential area transition; (c) represents the spatial distribution of the impact of rural population change rate on rural residential area transition; (d) represents the spatial distribution of the impact of land supply rate of construction land planning on rural residential area transition.
Land 10 00647 g004aLand 10 00647 g004b
Figure 5. Distribution of typical sample areas and points in different transition stages.
Land 10 00647 g005
Figure 6. The mean statistics of the proportion of rural residential land types in different areas.
Land 10 00647 g006
Figure 7. Statistics on the internal structure characteristics of rural residential land in different areas.
Land 10 00647 g007
Figure 8. Single function value of rural residential areas in different areas.
Land 10 00647 g008
Figure 9. Comprehensive and coupling degree of rural residential area functions in different areas.
Land 10 00647 g009
Figure 10. The framework of rural reconstruction based on the integration of “factor, structure, and function”.
Land 10 00647 g010
Table 1. The indicator system of the spatial distribution structure.
IndicatorMetricEquationDescription
Degree of Shape ComplexityArea-Weighted Mean Patch Shape Index (AWMSI) A W M S I = j = 1 n [ ( 0.25 P i j a i j ) ( a i j j = 1 n a i j ) ]
Pij = perimeter (m) of patchij.
aij = area (m2) of patchij.
The value reflects the complexity of different plaque shapes, the value range is ≥1, and it increases as the irregularity of the plaque shape increases with no upper limit. When AWMSI = 1, the patch is square.
Area-Weighted Mean Patch Fractal Dimension (AWMPFD) A W M P F D = j = 1 n [ ( 2 l n ( 0.25 P i j ) l n ( a i j ) ) ( a i j j = 1 n a i j ) ]
Pij = perimeter (m) of patchij.
aij = area (m2) of patchij.
The value reflects the impact of human activities on the landscape pattern, and the value range is between 1 and 2. The larger the value, the more complex the shape, indicating that the plaque is affected more by nature and less by humans.
Degree of Spatial AgglomerationPatch Density (PD)PD = ni/A (10,000) (100)
ni = number of patches in the landscape of patch type (class) i.
A = total landscape area (m2)
The value reflects the spatial distribution of plaques. This is ≥ 0 with no upper limit. The higher the value, the more fragmented the plaque.
Patch Cohesion Index
(COHESION)
C O H E S I O N = [ 1 i = 1 m j = 1 n P i j i = 1 m j = 1 n P i j · a i j ] [ 1 1 A ] 1 ( 100 )
Pij = perimeter (m) of patchij.
aij = area (m2) of patchij.
A = total landscape area (m2)
Reflects the physical connectivity of similar patches. The value ranges from 0 to 100. The larger the value, the higher the connectivity between patches.
Interspersion Juxtaposition Index
(IJI)
I J I = i = 1 m j = 1 n [ ( e i j E ) · l n ( e i j E ) ] l n ( 0.5 [ m ( m 1 ) ] ) ( 100 )
eij = Boundary type length
E = Sum of the length of the boundary type
m = Number of plaques
Reflects the corresponding type of adjacent focus and dispersion under a specific random distribution. The value ranges from 0 to 100. The higher the value, the more scattered the plaques.
Table 2. Multi-functional index system and calculation method of rural residential land.
Type of FunctionsMetricsCalculation MethodComprehensive Calculation Formula
Living
function (Fl)
Residence guarantee (Flr)Per capita housing area (r1)r1 = residential floor area/rural populationFlr = (r1 + r2 + r3)/3Fl = (Flr + Flf)/2
Building quality (r2)r2 = the number of buildings with brick and concrete structure/total number of village houses
The proportion of buildings (r3)r3 = the number of residential buildings/total number of rural households
Basic services (Flf)Completeness of public service facilities (f1)f1 = the proportion of the number of 7 public service facilities in the village (including water supply system, drainage system, garbage disposal equipment, health room, school, cultural station, fitness place)Flf = (f1 + f2 + f3)/3
Road area per capita (f2)f2 = rural road area/rural population
Rural road quality (f3)f3 = hardened rural road area/total area of rural road
Production
function (Fp)
Agricultural Production (Fpa)Cultivated land area per capita (a1)a1 = arable land area/rural populationFpa = (a1 + a2 + a3)/3Fp = (Fpa + Fpna)/2
Agricultural employment ratio (a2)a2 = number of people engaged in agricultural production/total population
Agricultural income ratio (a3)a3 = agriculture income/total income
Non-agricultural Production (Fpna)Per capita area of commercial building land (na1)na1 = rural industrial land area/rural populationFpna = (na1 + na2 + na3)/3
Non-agricultural employment ratio (na2)na2 = number of people engaged in non-agricultural production/total rural population
Non-agricultural income ratio (na3)na3 = non-agriculture income/total income
Ecological
function (Fe)
Ecological conservation (Fec)Green area ratio (c1)c1 = green land area in village/total area of villageFec = (c1 + c2)/2Fe = (Fec + Fem)/2
Ecological landscape land area ratio (c2)c2 = ecological land area such as forest, grass, and water in the village/total area of village
Environmental maintenance (Fem)Sewage treatment rate (m1)m1 = number of households with centralized sewage treatment/total number of rural householdsFem = (m1 + m2)/2
Waste treatment rate (m2)m2 = number of households with centralized garbage disposal/total number of rural households
Table 3. Mathematical statistics of the rural residential transition index in Shandong Province.
Transition StageIndex ThresholdMean ValueMutation PointCoefficient of VariationNumbers of Counties
Primary stage0.3068~0.38380.33240.30680.024611
Low stage0.2201~0.27750.25190.22010.016038
Intermediate stage0.1920~0.20890.20150.19200.004829
Advanced stage0.0845~0.17010.12750.17010.027629
Stable stage0.0396~0.06780.05520.06780.009430
Table 4. Total variance explained.
ComponentInitial EigenvaluesExtraction Sums of Squared LoadingsRotation Sums of Squared
Loadings
Total% of
Variance
Cumulative %Total% of
Variance
Cumulative %Total% of
Variance
Cumulative %
15.52542.35242.3525.52542.35242.3523.89425.4225.42
23.8226.04468.3963.8226.04468.3963.73823.15348.573
32.04113.50381.8992.04113.50381.8993.5722.84671.419
41.73810.27492.1731.73810.27492.1733.21620.75492.173
50.7655.32297.495
60.4141.00398.498
70.1250.87299.37
80.0630.36599.735
90.0320.13699.871
100.0170.08399.954
110.0060.04299.996
120.0010.004100
Table 5. Rotated component matrix.
IndexesComponent
1234
A10.921−0.038−0.242−0.176
A3−0.8820.3190.1820.211
A2−0.8470.3300.1370.067
B10.167−0.9620.2070.326
B2−0.328−0.9440.0860.153
B3−0.040−0.8970.0630.180
C1−0.089−0.1590.914−0.065
C3−0.3050.129−0.887−0.231
C2−0.155−0.2360.845−0.084
D3−0.093−0.165−0.214−0.908
D10.0880.1630.208−0.854
D2−0.2350.2020.091−0.836
Table 6. GWR and OLS model estimation result for rural residential land transition.
VariablesRegression
Coefficient of OLS Model
Regression Coefficient of GWR Model
Minimum1/4 MedianMedian3/4 MedianMaximum
Intercept--0.1520.2440.3510.4730.675
Altitude0.511 ***0.2080.3100.5160.6270.818
GDP Change rate−0.634 ***−0.481−0.564−0.762−0.811−0.938
Rural population change rate−0.484 ***−0.264−0.389−0.554−0.676−0.818
Land supply rate of construction land planning−0.612 ***−0.311−0.478−0.594−0.717−0.886
Local R2--0.311~0.887
R20.5570.726
Radj20.5720.741
AICc−101.43−178.54
Note: *** indicate that the regression coefficients are significant at the level of 1%.
Table 7. Basic profile of rural residential land in typical areas.
NameTransition IndexTransition StageEconomic
Development Stage
Geographical ConditionsPer Capita Land Area of Rural Residential Areas (m2)Sample Numbers
Longkou County0.0581Stable stageEconomically developed stageLudong Hills220.5031
Hengtai County0.1187Advanced stageAdvanced stage of industrializationLubei Plain232.0321
Gaotang County0.2020Intermediate stageIntermediate stage of industrializationLuxi Plain278.7622
Mengyin County0.2616Low stageInitial stage of industrializationLuzhong Mountains304.0525
Cao County0.3605Primary stagePrimary production stageLunan Plain366.2324
Note: The economic development stage is divided according to the standard of per capita GDP of 1200, 2400, 4800, 9000 yuan/person in the literature [11].
Table 8. Calculation results of the landscape metrics of rural residential land in a typical area.
Sample AreaShape ComplexitySpatial Agglomeration
AWMSIAWMPFDPDCOHESIONIJI
Longkou County14.661.0711.5668.8526.21
Hengtai County19.081.179.0260.4026.32
Gaotang County23.091.299.2153.9340.32
Mengyin County30.911.3314.4345.9046.23
Cao County28.091.319.4643.5247.34
Publisher’s Note: MDPI stays neutral with regard to jurisdictional claims in published maps and institutional affiliations.

