Article

Assessing Controversial Desertification Prevention Policies in Ecologically Fragile and Deeply Impoverished Areas: A Case Study of Marginal Parts of the Taklimakan Desert, China

1
School of Land Science and Technology, China University of Geosciences (Beijing), Beijing 100083, China
2
Key Laboratory of Land Consolidation and Rehabilitation, Ministry of Natural Resources, Beijing 100083, China
3
Institute of Geographic Sciences and Natural Resources Research, Chinese Academy of Sciences, Beijing 100101, China
4
College of Environmental Science and Engineering, Tianjin University, Tianjin 30072, China
5
China Geo-Engineering Corporation, Beijing 100093, China
6
Tourism College, Beijing Union University, Beijing 100101, China
7
Land Consolidation and Rehabilitation Center, Ministry of Natural Resources, Beijing 100812, China
*
Author to whom correspondence should be addressed.
Land 2021, 10(6), 641; https://doi.org/10.3390/land10060641
Submission received: 12 May 2021 / Revised: 6 June 2021 / Accepted: 11 June 2021 / Published: 16 June 2021
(This article belongs to the Special Issue Sustainable Rangeland Management to Protect Habitat and Livelihoods)

Abstract

:
Overgrazing plays an important role in the grassland desertification in global drylands. The effectiveness of policies related to grazing directly affects efforts to combat desertification and sustainable rangeland management. However, there remain questions around how the interplay of grassland desertification and poverty affects the implementation of policies. To reveal the effectiveness of the desertification prevention policy that delineates national key ecological function areas (NKEFAs), the main objective was to perform a sustainability assessment and on-site investigation in Northwest China. A parallel index system, which integrates the indices for economic input–output and material supply–demand to represent sustainability, and the indices for interview records from managers and questionnaires from residents to represent the effectiveness of NKEFA policy, was proposed to comprehensively judge the performance of NKEFA policy, and the underlying causes behind undesirable effects were further analyzed. The results indicate that (1) the performance of desertification control policy is related to socioeconomic conditions—a few counties with increased socioeconomic and land resource sustainability (SLS) are peri-urban or resource-rich; (2) the fact that the socioeconomic benefits of the NKEFA policy are not obvious to impoverished farmers greatly reduces their enthusiasm for preventing desertification; and (3) the livelihood needs and defective ecological compensation force residents with underdeveloped comprehensive quality to overdevelop or use grassland resources even though they have received subsidies for conserving grassland. It is concluded that poverty and grassland desertification interact to influence potential policy performance. Our analysis can help decision makers to formulate desertification control policies with multiple goals to achieve sustainable performance in an economy–ecology system.

1. Introduction

Land resources provide an important material foundation for human survival and development [1]. However, the irresponsible use and poor management of land resources have led to severe global land desertification in recent years [2,3]. Desertification is a form of land degradation, especially the grassland desertification at the marginal parts of the desert, caused by the interaction of climate change with human activities in arid, semi-arid, and sub-humid arid regions [4,5]. Grassland desertification is an escalating environmental issue in rangeland; how to formulate more reasonable policies to effectively deal with desertification has become a concern in both academies and political circles.
The recognition of the United Nations Convention to Combat Desertification’s (UNCCD) failure to reduce the rate of desertification triggered the emergence of the land degradation neutrality (LDN) paradigm [6,7]. Simultaneously, many countries have gradually established grassland desertification prevention areas and there have also been many attempts to formulate more sustainable policies to combat grassland desertification at global, regional, and local levels [8,9,10]. A sustainable desertification prevention policy is very necessary for achieving the target of LDN in 2030 [11]. Due to the implementation of international responsibilities and to protect regional land resources, China has implemented different land protection policies [12,13]. As key areas for ecological service functions and national ecological security, the delineation and implementation of national key ecological function areas (NKEFAs) are important for sustainable regional development and improved human well-being [14]. The NKEFA policy is a comprehensive measure that restricts large-scale, high-intensity grazing and land development in areas with important ecological functions, such as wind control and sand fixation, soil and water conservation, biodiversity maintenance, and water source conservation, to maintain and improve the supply capacity of ecosystem services [15,16].
Although the purpose of an ecological policy is to improve the environment [17], insufficient supervision may prevent its benefits from being released [18]. In addition, strict restrictions on resources may hinder socioeconomic development [19]. To effectively control desertification, previous studies have provided valuable insight into the identification of grassland desertification and ecological compensation [20,21]. However, as a result of the late appearance of China’s NKEFA policy, current studies mainly focus on changes in the area of rangeland desertification in NKEFAs. At the same time, related studies on NKEFAs always ignore the impact on the socioeconomic structure, especially their effects on livelihood and poverty alleviation [22,23,24]. The implementation of land/ecological policies is inseparable from the joint participation of managers and residents. Managers are comprehensive, and transfer policy tasks, organize residents’ participation, coordinate various interests, compensate residents for losses, and supervise and report policy issues during the implementation of land policies. Under the organization, guidance, compensation, and supervision of managers, residents are direct participants in implementing policies on the land by changing their behaviors [25], such as grazing or rest grazing, cutting or planting trees, reclaiming grassland or returning farmland, etc. Therefore, the effect of policy implementation depends on the cooperation between managers and residents. However, under the actual conditions of grassland desertification and deep poverty, cooperation has become an interesting game [26]. How to balance economic income and grassland protection under the constraints of poverty requires the joint consideration of managers and residents.
While preventing desertification, changes in socioeconomic development directly affect the behavior of local residents. Residents around grassland desertification prevention areas are not only users of rangelands but also direct executors of desertification control policies [25]. The effectiveness of the implementation of desertification control mainly depends on their cognition and attitude towards these policies [27]. However, early ecological protection policies did not fully take into account the interests of residents [28]. As these land desertification prevention policies limit the development and utilization of grassland resources, local residents have a negative attitude towards them [29]. Due to the need to better resolve the contradiction between desertification control and herders’ poverty, research on the livelihood of residents around the grassland desertification prevention area has become ever increasingly valuable [26,30]. Does the attitude of stakeholders, mainly residents and managers, affect the effectiveness of the policy? Through investigation, fully understanding the views of managers and residents on the policy and its implementation is a necessary way to scientifically evaluate the effect of the policy. Evaluation of the effects of NKEFA policy and analysis of the causes of these effects are important evidence for the prevention and control of grassland degradation in less economically developed areas.
The ecosystem around the Taklimakan Desert is extremely fragile [31]. Desertification threatens the ecological security of local rangeland and the sustainable development of the economy and society. Therefore, the area around the Taklimakan Desert in Northwest China was selected to analyze the effectiveness of NKEFA policy implementation from 2005 to 2015 (the relevant policies have changed since 2016). Through the establishment of the socioeconomic and land resource sustainability (SLS) evaluation model, combined with the investigation into and questionnaire on stakeholders’ views on policies, the aim of study is to reveal the effectiveness and driving forces of grassland desertification prevention policy in NKEFAs from stakeholders’ perspectives. Specifically, we focus on three scientific objectives: (1) to reveal the issues and causes of the implementation of NKEFA policy; (2) to determine the uncertainties surrounding desertification prevention policies in poverty-stricken areas; and (3) to propose grassland degradation control methods for underdeveloped areas in order to improve policy performance. Our results reveal the role of stakeholders’ attitudes in the implementation of desertification control policies from a socioeconomic perspective, and help formulate sustainable ecological policies.

2. Study Area and Materials
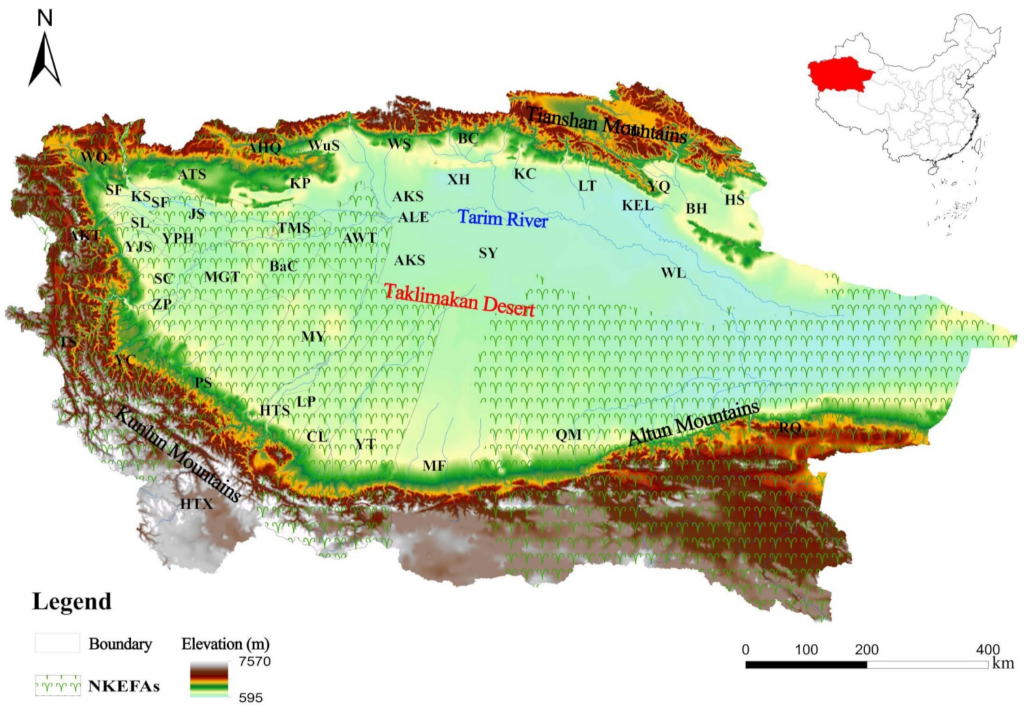
2.1. Study Area

The Taklimakan Desert (73°10′~94°05′ E, 34°55′~43°08′ N) is a typical temperate continental arid climate region (Figure 1) [32]. The spatial and temporal distributions of water resources around the Taklimakan Desert are strongly uneven, and the economic conditions are highly underdeveloped [33]. The area is mainly engaged in livestock farming and agriculture [34]. The livestock, which includes sheep, cattle, horses, and camels, has caused overgrazing. Furthermore, a large number of grasslands have been developed for agriculture to grow wheat, corn, and cotton. With very low vegetation coverage, the desert is extremely vast and unstable [33], and grassland desertification is the most serious ecological issue around the Taklimakan Desert [35]. At the same time, this region is also one of the core areas of grassland desertification prevention in China. Due to the degradation of grassland, Populus euphratica forest and shrublands, the ecological function of the ecosystems has been weakened [34]. All forty-four counties/cities in the study area were used for this comparative study of the area around the Taklimakan Desert. Twenty-one of these counties belonged to NKEFAs, and the other 23 counties belonged to non-NKEFAs.

2.2. Dataset

Statistical data, raster data, vector data, and interview records from 44 counties around the Taklimakan Desert were obtained (Table 1). China Land Use Remote Sensing Monitoring Data (spatial resolution of 1 km) from 2005 and 2015 were used to extract the land use cover changes (http://www.resdc.cn/, accessed on 20 July 2019.). The statistical data, such as per capita GDP, agricultural and forestry output, etc., from Statistical Yearbooks in 2005 and 2015, were all counted by county-level units (http://www.xjtj.gov.cn/, accessed on 21 July 2019.). The 2015 GDP data were based on 2005, and converted to the base year. Due to the lag effect of statistical data, this study chose Statistical Yearbook 2006 and Statistical Yearbook 2016 to obtain relevant statistical data. They have been compared with constant GDP using 2005 as the base year. Field surveys, which included interviews with managers of the grassland, agriculture and environment, for 21 NKEFAs and 23 non-NKEFAs, were scheduled for May to July 2019. Interview records and questionnaire data referenced from the literature were used to verify the rationality of the results [36,37]. Due to the large study area, which covered 1.05 million square kilometers, all spatial data were unified into raster data with a resolution of 1 km.

2.3. Methodology and Empirical Model

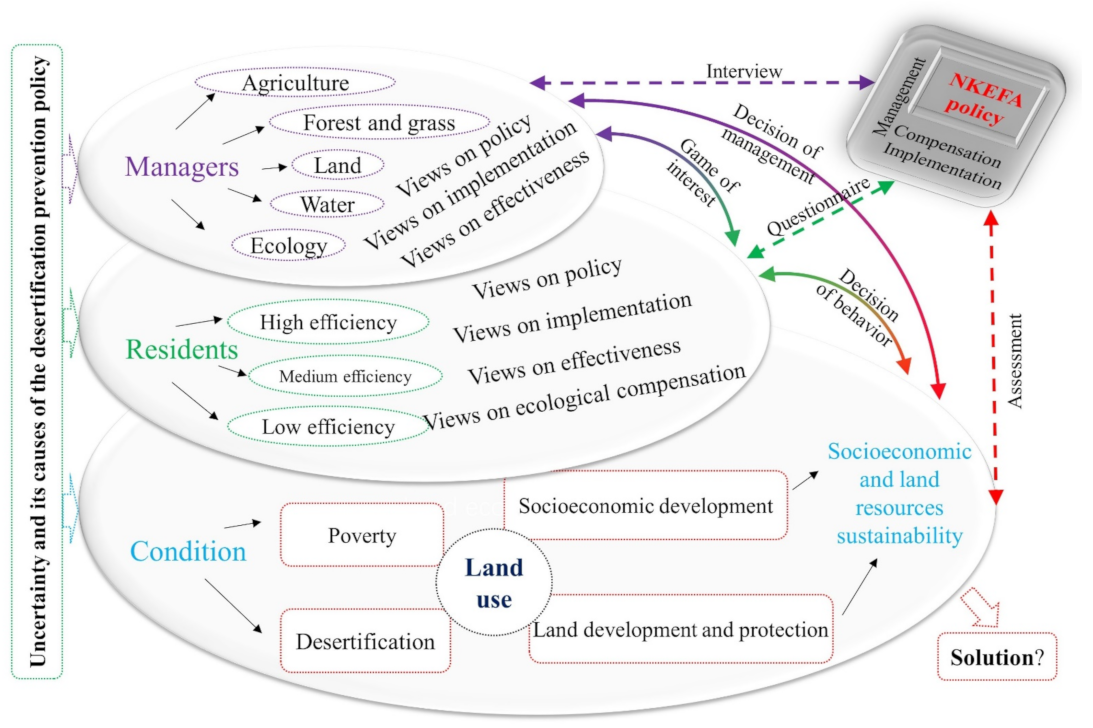
2.3.1. Methodological and Theoretical Framework

To resolve the problem of grassland desertification caused by reclamation, China has successively carried out desertification control policies since 1978, such as returning farmland to forest, prohibiting grazing on grassland, and the Three-North Shelter Forest Program. Desertification in most areas of China has been controlled, while understanding of policy effects and driving factors in ecologically fragile and deeply impoverished areas is still insufficient [39]. “Ecological function regionalization” firstly delimited the Tarim River Basin ecological function area for wind control and sand fixation at the end of 2005 [40]. These ecological function areas were renamed national key ecological function areas in 2010 [41]. A mechanism of reward and punishment for ecological compensation has been established, and regular supervision and inspections have been carried out (Table 2).
To reveal the effect of the implementation of NKEFA policy in this uncertain game, we established a comprehensive SLS evaluation model (Figure 2). This model not only considers local socioeconomic development, but also includes elements of the effectiveness of grassland development and protection. Through this model, the change in SLS index (CSLSI) before and after policy implementation is calculated. Combining this CSLSI’s internal differences in the NKEFA region and the CSLSI’s differences between the NKEFA region and non-NKEFA region, the effect of the implementation of NKEFA policy is comprehensively analyzed. To verify the accuracy of the evaluation results, we also obtained the views of managers and residents through discussions and questionnaires. Meanwhile, based on their views, the specific reasons for the uncertainty of this policy were analyzed and discussed. Thus, this paper combines these reasons to find solutions to related problems, and then guides subsequent policy formulation and implementation.

2.3.2. Socioeconomic and Land Resource Sustainability

The SLS evaluation model was constructed for the area around the Taklimakan Desert (Table 3). To reveal the impact of poverty on desertification control and assess sustainability, the SLS index not only considers the development and use of grassland resources, but also socioeconomic development in the study area. As with the SLS evaluation method, the catastrophe progression method is a comprehensive analysis method derived from catastrophe theory [42] to evaluate the state of a system [43,44]. This method effectively avoids uncertainty in weight assignment [45,46]. The differences in CSLSI between the NKEFAs and non-NKEFAs under the NKEFA policy, especially from the implementation of the ecological compensation policy, were evaluated. The model subdivided the factors into two aspects: socioeconomic balance and land resource sustainability.
We searched the literature assessing socioeconomic or land resource sustainability; after review and evaluation, 11 indicators were included in the SLS model. This selection was based on three criteria: (1) feasibility of obtaining data related to socioeconomic and grassland use, (2) reflecting the spatial variability of economy or grassland use at the county level, and (3) ability to be quantified. In addition to the indicators selected from the literature, we also included fixed assets investment indicators through interviews with experts. The socioeconomic balance project layer included two aspects: economic investment and economic output. Economic investment mainly included economic and technological inputs, such as fixed asset investment and ecological compensation [47]. The economic output mainly included socioeconomic outputs, such as the proportion of the tertiary industry [48], per capita GDP [48], and agricultural and livestock output [49]. The change in investment and output has a significant influence on the economic system. The changing trend of per capita GDP and fixed asset investment fully reflects the stability of economic development. The land resource sustainability project layer included three aspects: management status, social demand and material supply. Management status mainly included the current management situation of land resources, such as the desertification control area [50] and saline-alkali land control area [51]. Social demand mainly included three factors: population growth rate [52], population density [53], and urbanization rate [54]. Material supply is mainly affected by two indicators: crop yield per unit area [55] and vegetation cover rate [56]. Land management and changes in the supply–demand of resources have a significant impact on the sustainability of society [57]. Continued desertification has caused unnecessary effects on social stability.

2.3.3. Likert Scale Analysis Symposium

The interviews were designed to accurately investigate the actual socioeconomic–ecological status. This study revealed problems of the implementation of NKEFA policy through interviews. To prevent important information from being ignored, such as the reasons for some problems and suggestions, etc., this study adopted a freer form of the symposium. We held a symposium in 44 counties from 11 May 2019 to 8 July 2019. Before arriving in a county, we contacted each relevant department in advance and invited them to freely choose 1–2 people to participate in our symposium voluntarily. The choice of participants mainly included two principles: involving all departments and insisting on voluntary participation. Each symposium included 10–15 participants. The participants of each symposium included managers in different fields, such as grass, agriculture, water, land management, ecology, etc. Considering the differences in the local situation, although the specific questions in the discussion process were different, each symposium was around nine fixed themes (Table 4). The symposium was a many-to-many format, and all participants fully discussed each theme. As managers in different departments have different concerns, they usually only expressed their views on familiar themes. Since ethnic-minority managers can use Chinese proficiently, in our symposium process, the language used was Chinese. The duration of each symposium was about 1–2 h. A total of 572 managers were involved in the entire survey process, and 44 records were formed (21 counties belonged to NKEFAs, and 23 counties belonged to non-NKEFAs). Each symposium record records the content of the discussion in detail, instead of simply asking the participants to fill out a questionnaire. The main content of each record contains three categories of views: the policy itself, the implementation process, and the effectiveness.
To analyze the symposium records, we adopted the Likert scale analysis method, which is a special model to quantify these qualitative records [58]. According to the statistical table of the method (Table 5), we followed five steps to quantify the symposium records into semi-quantitative data that could be used for statistical analysis.
Step 1: According to the interviewees’ answers to each question in the interview record, the answers were divided into five levels from strong agreement to strong disagreement. Among them, clear support was classified as strong agreement, general support was classified as mostly agreement, a vague answer was classified as neither agreement nor disagreement, a general objection was classified as mostly disagreement, and a clear objection was classified as strong disagreement.
Step 2: According to the classification results of the answers for each view, we assigned values to each category separately (1 5: strong disagreement strong agreement).
Step 3: Based on quantification, we separately counted the number ( n i j ) of answers for different levels ( j : 1   to   5 ) for each question ( i ).
Step 4: According to the number ( n i j ), we separately calculated the frequency ( p i j ) of different levels for each question (Equation (1)).
p i j = n i j j = 1 5 n i j
Step 5: Finally, to better analyze the comprehensive view of each question, we calculated the average value ( V ¯ i ) of each question by weight mean (Equation (2)) according to frequency ( p i j ).
V ¯ i = j = 1 5 j × p i j

2.3.4. Cluster Analysis of the Questionnaire

Residents are direct participants in implementing policies on the grassland, and their behavior directly affects the implementation and effectiveness of NKEFA policy. While analyzing the views of residents, 105 questionnaires for household surveys of residents [37,38] quoted from other studies were used to verify the SLS evaluation conclusions and content of the symposium. These studies conducted random household surveys by questionnaire to study whether the desertification control policies and related ecological compensation contribute to control desertification. Some studies around the Taklimakan Desert or similar cases were analyzed [36,37,38]. The main content of the questionnaire consisted of three parts (Appendix A). The first part was basic information of the respondents, including their age, income, knowledge level of the head of the household, etc. The second part was about the changes of residents in the past ten years, including grassland, property, skills, cost of living, living environment, etc. The third part was their views on NKEFA policy, including understanding, willingness to support, implementation process, etc.
It is well known that there is a correlation between poverty and grassland degradation [59]. In addition, residents in the same underdeveloped area may have different productivity and poverty levels. Therefore, views on the policy and the implementation of the policy may be different for residents with different household incomes and productivity levels. The implementation of policies may have different impacts on different residents, and the behavior of residents with different productivity level under the same policy may also be inconsistent. Differences in income and knowledge levels can reflect differences in their productivity. According to the age of head of the household, knowledge level and income, three types of families were identified by cluster analysis (SPSS 22.0) to further determine the relationship between policy implementation and residents with different production efficiencies:
Step 1: We counted the basic information of each questionnaire to form 105 samples.
Step 2: These samples were input into SPSS for cluster analysis. A cluster map was obtained through the hierarchical cluster analysis tool (SPSS22.0/analyze classify hierarchical cluster analysis).
Step 3: All samples in the cluster map were divided into three categories (high-efficiency group, medium-efficiency group, and low-efficiency group).
The results of the cluster analysis show that the high-efficiency group mainly consisted of families with high knowledge and high income. The low-efficiency group mainly consisted of families with low knowledge and low income.

3. Results and Analysis

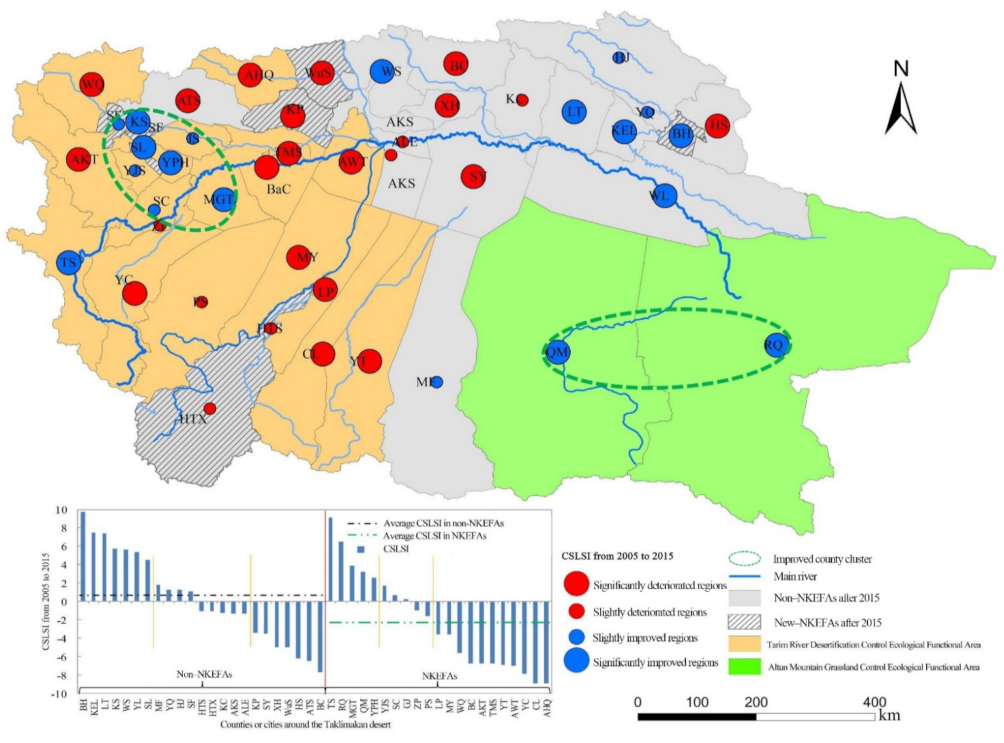
3.1. Changes and Dynamics of SLS

3.1.1. Overall Changes in SLS in the NKEFAs

The CSLSI in the NKEFAs was generally lower than that in the non-NKEFAs (Figure 3). According to the histogram distribution of the CSLSI, this study used the natural breaks in ArcGIS 10.3 to divide the CSLSI value of each county into four categories (greater than 2, 0–2, −2–0, less than −2) to more deeply reflect the SLS impact of the policy. This study assumed that counties with CSLSIs greater than 2 were significantly improved regions, and the regions with CSLSIs of less than −2 were significantly deteriorated regions. The CSLSIs in 18 counties were severely negative, and 11 of these counties were located in NKEFAs. The CSLSIs were extremely positive in 12 counties, and only 5 of these counties were located in NKEFAs. There were fewer improved counties than deteriorated counties inside the NKEFAs. In addition to the considerable improvement in western (TS, YPH, and MGT) and southeast (QM and RQ) counties, only three counties (YJS, SC, and GJ) were slightly improved. However, the CSLSIs in 11 counties experienced a great degree of deterioration. The CSLSIs in two counties experienced slight deterioration. However, there were nearly an equal number of improved counties and degraded counties within the non-NKEFAs. The CSLSIs in seven counties were greatly improved in the non-NKEFAs.
The overall average CSLSI in the NKEFAs was negative, but that in the non-NKEFAs was positive. The overall average CSLSI in NKEFAs was 2.5 times lower than that in the non-NKEFAs. The proportion of improved regions was 38.1% in the NKEFAs but 47.83% in the non-NKEFAs. The proportion of significantly improved regions was 23.81% in the NKEFAs but 30.44% in the non-NKEFAs. The proportion of deteriorated counties was 61.9% in the NKEFAs, and 52.38% of them were significantly deteriorated.

3.1.2. Internal Differences of SLS in the NKEFAs

In NKEFAs, there are significant differences in CSLSI in different regions, and there are concentrated distribution characteristics (Figure 3). The concentrated characteristics indicate that the SLS is improved significantly in areas with relatively high socioeconomic levels or areas with rich water and land resources, while SLS deteriorates in underdeveloped areas with scarce water and land resources. The improved counties are mainly located in the western concentrated areas (average 2.16) and the eastern concentrated areas (average 4.82). The western concentrated areas are mainly distributed around KS, which is the area with the best socioeconomic development in the NKEFAs. KS is the economic center, cultural center, and transportation center in the western part of the Tarim River Basin. Although KS does not belong to the NKEFA area, its radiation effect makes the surrounding socioeconomic balance effect significantly better than that in other places. The eastern concentrated area mainly includes QM and RQ counties. As with TX (9.23) on the western plateau, the population here is extremely sparse (population density = 0.36/km2) and the per capita resources are abundant. Subject to the same policy constraints, the available land and water resources in these areas meet development needs. Therefore, the eastern concentrated area has shown a high degree of improvement, but this is necessary to prevent a decline in sustainability caused by continued development in the future. For other counties, while being restricted by resources, their transportation and industries are relatively weak, which causes the NKEFA to deteriorate.

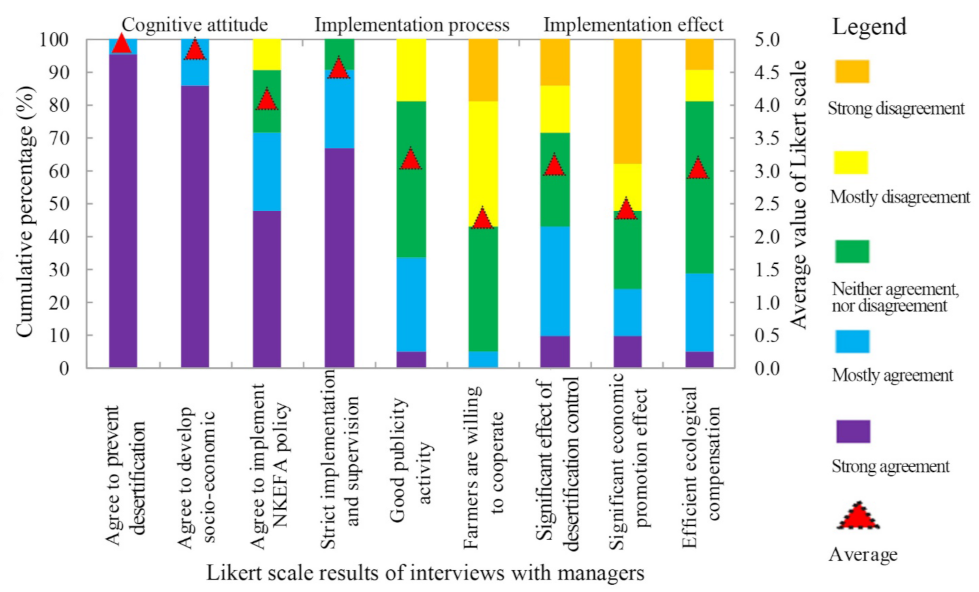
3.2. Views of Managers

The interviews with the basic administrative departments of the 21 counties in the NKEFAs indicated that the NKEFA policy restrained socioeconomic development (Figure 4). All interviewees, who were the departmental managers of grass, agriculture and the environment, were firmly in support of the NKEFA policy. According to the Likert scale analysis method, the managers were most supportive of preventing desertification (4.95) and developing the social economy (4.86). More than 70% of managers supported the continued implementation of the NKEFA policy (4.10), and more than 90% of managers believed that the implementation process was strict (4.57). However, during the implementation of the policy, approximately 30% of managers agreed that they had publicized the policy to residents (3.19), and few interviewees believed that the residents cooperated well with the policy implementation (2.29). A land manager said that illegal grassland reclamation and the over-extraction of surface water was a common phenomenon; thus, the problems of desertification and salinization are serious. Similarly, the forestry and grassland managers in the lower reaches of the Tarim River also stated that over-extraction upstream caused water stress downstream, and the numerous degraded Populus euphratica forests and grasslands made it difficult to control desertification effectively. When asked how effective the policy had been recently, fewer interviewees gave positive answers (significant desertification prevention effect: 3.10; significant economic promotion effect: 2.43; efficient ecological compensation: 3.05). A rangeland manager reported that since the implementation of the NKEFA policy and ecological compensation measures, grasslands of forbidden pastures had recovered effectively, but it was still difficult to achieve the goal of grass–livestock balance.
Although the effects of preventing desertification will be felt in the future, they argued that oversized desertification prevention areas strongly constrained current socioeconomic development. A rangeland manager said that the restoration of grassland must be achieved by increasing the area of forbidden pastures, but this undoubtedly harms the livestock industry, grassland restoration and socioeconomic development, which have formed a conflict that is difficult to resolve. It is believed that there are many reasons why monetary compensation is ineffective. In remote and economically underdeveloped areas, residents whose grassland is restricted from grazing and developing cannot find work because they lack job skills. Thus, the residents destroy the environment covertly to generate income through actions such as overgrazing, deforestation, and stealing groundwater. When asked to solve these issues, the interviewees believed that promoting ecological protection awareness and upgrading working skills were key to improving the overall benefits of NKEFAs.

3.3. Views and Behavior of Residents

The NKEFA policy increased the living costs of residents, but ecological improvement was not obvious (Figure 5). Stress was lower in the high-efficiency group than in the low-efficiency group. The proportion of families with reduced pastures was higher in the high-efficiency group (70%) than in the low-efficiency group (42.22%). However, the proportion of families with increased livestock numbers in the low-efficiency group was twice that in the high-efficiency group. In terms of farming skills, only 15.56% of families in the low-efficiency group were improving, but this percentage was more than one-quarter that in the high-efficiency group. With the gradual implementation of the NKEFA policy, 35% of families in the high-efficiency group switched from livestock to other industries, but this proportion was only 6.67% in the low-efficiency group. In terms of ecology, only 22% of families believed that ecology had improved, and 60% of families believed that there was no obvious effect.
The questionnaire data showed that the effectiveness of ecological compensation was especially poor, but the comprehensive efficiency of the residents affected the effectiveness of the ecological compensation policy. The specific ecological requirement of the NKEFA policy for residents was well known by 70% of people, but it was significantly less well known in the low-efficiency group (42%) than in the high-efficiency group (90%). More than 80% of families believed that there were some supervision measures for preventing grassland degradation, but only 20% believed that there had been land protection-related outreach activities in the village. More than 93% of families supported the ecological compensation policies, but less than 10% were willing to reduce land development voluntarily. More than 70% of the families willing to reduce grazing were from the high-efficiency group.

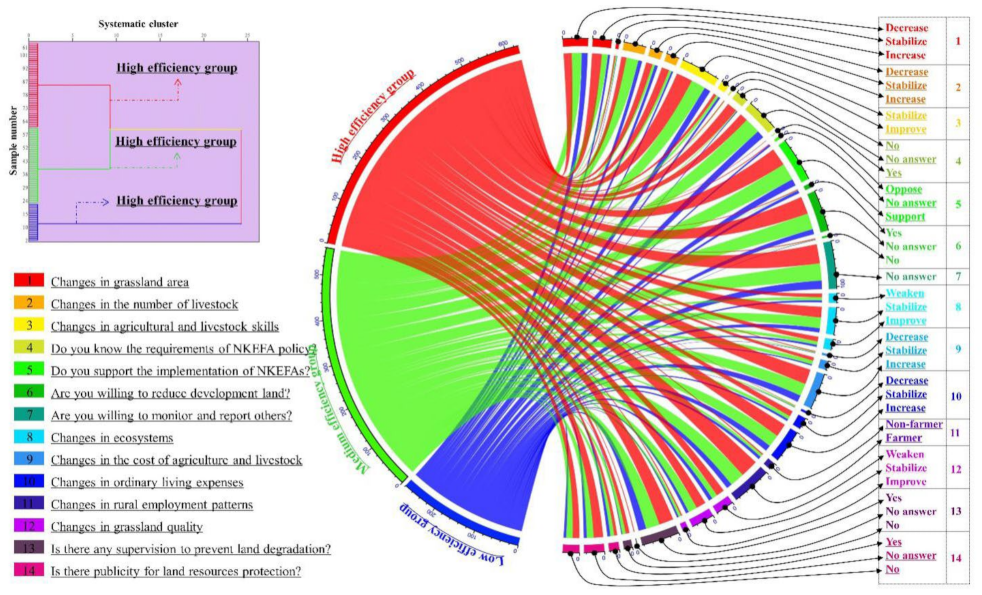
3.4. Cognition of Dynamic Decisions under Different Efficiency

Rationality in economics means that a person can make the best choices according to the information available during decision-making [60]. For the same production efficiency, the residents’ demand for higher socioeconomic benefits comes at the expense of desertification prevention benefits. Furthermore, as the demand for desertification prevention benefits rises, there is a loss of socioeconomic benefits. The negative impact of residents on the surrounding land resources is mainly reflected in economic benefits from the ecosystem, such as food, building materials, and minerals. Under the same desertification prevention requirements, the higher the production efficiency of the residents, the higher the socioeconomic benefits (Figure 6). The comprehensive benefits of the NKEFA policy are related to the productivity levels of the residents in the surrounding areas. Therefore, this study plotted the desertification prevention–socioeconomic benefit curves (D–S curves) for different efficiency residents: low-efficiency group I1, medium-efficiency group I2, and high-efficiency group I3 (Figure 6). Three different points marking desertification prevention benefits (S1 < S0 < S2) were selected in the vertical coordinates, while two different points marking socioeconomic benefits (P0 < P1) were selected in the horizontal coordinates. Residents with different efficiencies performed in different states (E0, E1, E2) under different requirements of socioeconomic or desertification prevention benefits. Under the same production efficiency (I1), the increasing demand for socioeconomic benefits (P0 < P1) is the reason for lower desertification prevention benefits (S1 < S0). Under the same socioeconomic requirements (P1), the low production efficiency (I1 < I3) is the reason for low desertification prevention and comprehensive benefits (S1 < S2, S1 + P1 < S2 + P1). However, the production skills of farmers and herdsmen in NKEFAs are generally lower. Therefore, improving the overall productivity of residents (I1 I3) is necessary to simultaneously improve socioeconomic and desertification prevention benefits.

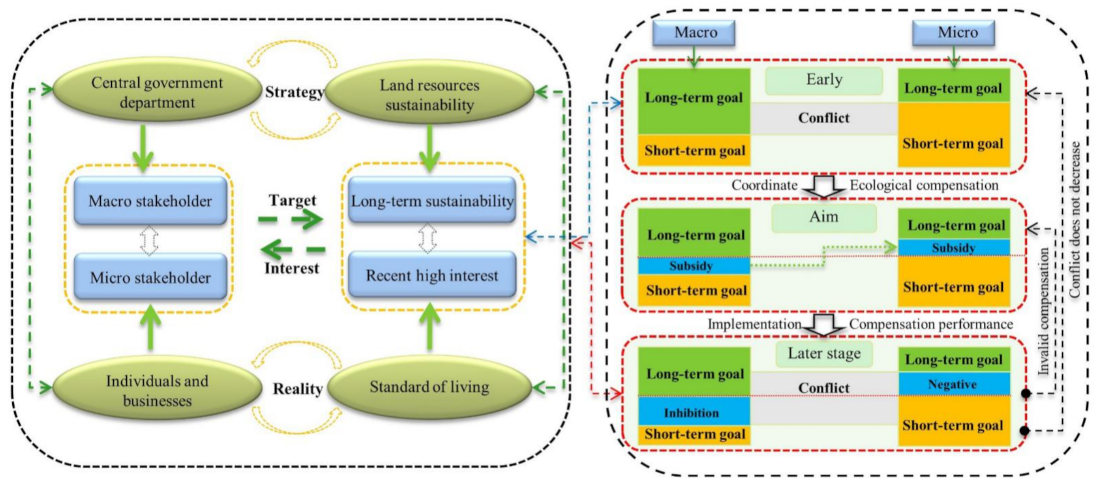
3.5. Dilemma of the Policy Conflict

In the process of implementing the NKEFA policy, there were contradictions between the macro-stakeholders, who were represented by the government, and the micro-stakeholders, who were represented by enterprises and residents (Figure 7). To meet current living standards, macro-stakeholders pay more attention to sustainable land use, which has strategic significance. Conversely, micro-stakeholders pay more attention to recent living standards and economic income [61]. The contradiction between the strategic goals and private interests was a conflict not only between the macro- and micro-stakeholders but also between the long-term sustainability goals and short-term economic benefits. Due to this contradiction, ecological compensation was considered an efficient way to coordinate conflict between the larger long-term goals of the macro-stakeholders and the larger short-term interests of the micro-stakeholders. Controlling grassland desertification and not reducing the short-term interests of micro-stakeholders is the ideal result of macro-stakeholders. However, increasing government constraints severely hamper the socioeconomic development of underdeveloped areas due to the monetary compensation. Meanwhile, as a result of a lack of environmental protection awareness, micro-stakeholders, who are subsidized, continue to engage in grassland development and secret overuse activities. The manager wants to change the early state (a larger conflict exists between the macro- and micro-stakeholders) to the target state (balance of interests) through the adjustment of ecological compensation (Figure 7). However, the actual result is that the conflict between them has not decreased in the later state.
The conflicts of concern between the macro- and micro-stakeholders make the effect of grassland desertification control less than the target. Therefore, ecological compensation in the form of money alone is ineffective and does not diminish conflict in the NKEFAs. The effect of NKEFA policy is not obvious in preventing desertification. Meanwhile, ecological compensation has not improved the social and economic conditions significantly. There are two reasons: firstly, the low level of cognition of the policy by the micro-stakeholders in impoverished areas, and secondly, the single ecological compensation method. Therefore, it is necessary to increase recognition of the NKEFA policy and improve methods of ecological compensation.

4. Discussion

4.1. Why Is Land Desertification Difficult to Control Effectively?

Linkages between poverty and grassland desertification exist in impoverished areas [62]. In the areas characterized by drought and deficient resources, the economic situation has resulted in poverty [63]. Some natural resources, such as water [64], minerals and land [65], are implicit in poverty reduction [66]. For poverty alone, inefficient production modes caused grassland degradation and low resource utilization efficiency in 1997 [63]. The concentrated characteristics of CSLSI in the NKEFA region indicate that socioeconomic level has a significant impact on the implementation effect of the NKEFA policy (Figure 3). This has been verified by many other related studies worldwide [3,62,67]. Thus, consistent with the conclusions of other studies, the effect of a single desertification prevention policy is not ideal and even has a negative impact [68]. Due to poverty, it is difficult to effectively control land desertification in many places [63], including this study area.
Policies related to grazing have important implications for desertification control [69] and poverty reduction [67], and are part of the 17 United Nations Sustainable Development Goals (SDG 1 and SDG 15). However, policies typically target one goal and rarely do they explore trade-offs between two goals together [70,71]. As a project for protecting grassland resources with positive externalities, the delivery of comprehensive benefits from the NKEFA policy was very slow. It was difficult to find obvious effects for residents in a short period, and the short-term effect was very small. The implementation of policies, such as controlling grazing, banning grassland development and inhibiting construction, conflicted with the production habits of residents. Increasing recent income and alleviating poverty were the first demands of poor residents in the NKEFAs [3]. Different from other economic or environmental research [62,67], our research supplements the role of psychological factors in this conflict from the perspective of residents. The fact that the socioeconomic benefits of the NKEFA policy are not obvious to impoverished farmers greatly reduces their enthusiasm for preventing desertification. The residents subjectively judged the NKEFA policy based on this factor. Residents’ implementation of desertification control policies was not effective (Figure 4), especially for low-income and low-efficiency residents (Figure 5). These conflicts have severely hindered the achievement of the long-term goals of policymakers.
To make socioeconomic and land resource sustainability succeed, land desertification and poverty are problems that must be tackled together [72]. While protecting grassland resources, the livelihoods of the residents cannot be ignored. Better promotion and outreach efforts of environmental policies are necessary for the protection of resources and the prevention of desertification in ecologically fragile and deeply impoverished areas. Policymakers should break the cycle of “desertification–poverty” and formulate comprehensive policies to simultaneously solve poverty and desertification from the perspective of improving residents’ productivity and environmental awareness.

4.2. Implications for Ecological Compensation Policy

Ecological compensation is an essential way to alleviate the short-term loss of benefits to residents due to restrictions on protection policies [73]; however, providing long-term benefits is still a challenge [74]. A previous study claimed that ecological compensation contributes little to poverty alleviation [73]. As a supplement, we found that the core significance of ecological compensation is to stimulate residents to protect land resources using their own initiative while compensating them for their short-term interests, rather than formal protection. Most existing studies have seen the problems with ecological compensation but are limited to considering the amount of monetary compensation [38,75]. In economically underdeveloped rangeland, grassland is one of the few productive assets owned by the rural poor [76]; residents usually exploit natural resources to supplement consumption and income [37,75]. The main issue is that residents of NKEFAs continue to develop grassland resources after receiving monetary subsidies as ecological compensation for the economic losses caused by a restriction of the development of grassland resources [37,77].
The performance of ecological compensation is critical for realizing the transformation of “ecological mountains” into “economic mountains” [75]. Higher ecological protection consciousness, higher production efficiency, and having more life skills are prerequisites for ecological compensation [78], such as increasing ecological protection awareness, enhancing industrial transformation, and providing jobs [79]. Therefore, by encouraging the poor to participate in socioeconomic development and environmental restoration [73], rather than just giving monetary compensation, we can truly achieve a win–win situation of poverty alleviation and ecological protection. Our results indicated that ecological compensation is necessary to adapt to the local socioeconomic conditions.
It is urgent to solve the issue of residents continuing to develop grassland secretly after receiving ecological compensation in the form of money. Transforming the path of ecological compensation is an effective method for alleviating current pressures. In addition to monetary compensation, there is great potential for improving the efficiency of ecological compensation. Some new agricultural planting theories and techniques should be popularized among local farmers and herders according to local conditions to promote the transformation of agriculture and animal husbandry from extensive to intensive. On the premise of not causing desertification of the land, supporting high value-added ecotourism and the distinctive orchard industry are good ways to realize the diversification of herder income and stimulate the awareness of the ecological protection of residents.

4.3. Implications for Sustainable Development

“End poverty” and “achieve a land-degradation neutral world” correspond to goal 1 and goal 15.3 of the United Nations Sustainable Development Goals (SDGs), respectively [80]. Many scholars suggest that a potential downward trend in land degradation and poverty may occur in rural areas [76]. We found that the socioeconomic situation is an essential factor for desertification prevention policies, which confirmed that deepening poverty and environmental degradation usually coexist [81]. Therefore, considering the land degradation–poverty nexus in policy formulation would ameliorate both obstacles, especially in ecologically fragile and contiguous extremely poverty-stricken areas.
In recent years, based on expanding NKEFAs, the Chinese government has further considered the sustainable livelihoods of residents (Table 1), such as through targeted poverty alleviation, a rural revitalization strategy, and rural comprehensive land improvement. By the end of 2020, China had achieved complete poverty alleviation in the deeply impoverished areas [82] and vegetation coverage has continued to increase [83]. Overall, deterioration prevention should be given a priority in NKEFAs, which requires policy solutions tailored to the specific economic situation, and only by the trade-off of alleviating poverty and the goal of attaining zero net degraded land can we better achieve these two critical SDGs. Due to the COVID-19 pandemic, we are unable to continue on-site investigations. We will follow up to summarize a better policy combination for this issue.

4.4. Limitations and Uncertainty

The Tarim River Basin has a large area of up to 1.05 million square kilometers. To achieve comparability between various regions, despite some factors not being taken into account, the main issue and its causes have been effectively expressed. Although our results show that policy performance can be improved through multiple policy combinations and diversified ecological compensation, how to balance the relationship between multiple policies and how to find compensation methods that are conducive to sustainable development are also unclear and need further investigation based on the actual local conditions. The limitations of this study are also reflected in the trend of policy effects. How to quantify the changing trend of the long-term series of the policies’ contribution is also the content of our further research. Furthermore, this study mainly used the method of a symposium to record and analyze managers’ views on NKEFA policy. Although this record can better reflect the problems in the policy implementation process from the perspective of managers, we still quote related studies and questionnaires to verify our views from the perspective of residents. There are great differences in grassland desertification and poverty-causing factors in different regions of the world. We hope that this conclusion can obtain some validation from other, similar areas.

5. Conclusions

Compared with non-NKEFAs, the sustainability performance of the socioeconomic situation and grassland resources in NKEFAs was not adequate before 2015. The conflict between managers’ long-term goals and residents’ short-term interests, in particular, delayed desertification control policy in NKEFAs. The fact that the socioeconomic benefits of the NKEFA policy are not obvious to impoverished farmers greatly reduces their enthusiasm for preventing desertification. Although residents have received subsidies for conserving grassland, underdeveloped comprehensive quality and livelihood needs resulted in a system of incentives that was insufficient to prevent grassland development. Higher ecological protection consciousness, higher production efficiency, and having more life skills are prerequisites for ecological protection. Therefore, the NKEFA policy needs better promotion and outreach efforts that encourage the poor to participate in socioeconomic development and environmental restoration.
Partially sustainable and improved counties were mainly concentrated in areas with higher levels of socioeconomic development. Poverty and desertification interact to influence potential policy performance. Therefore, policymakers should break the cycle of desertification–poverty and formulate comprehensive policies to simultaneously solve poverty and desertification, especially in ecologically fragile and contiguous extremely poverty-stricken areas. Policies with multiple goals should be treated comprehensively to achieve a win–win situation for economies of scale and desertification control. Policymakers should promote the effectiveness of policies by integrated desertification prevention policies with a targeted poverty alleviation and rural revitalization strategy. Furthermore, diversified ecological compensation should be advocated to stimulate residents’ initiatives for desertification prevention. In addition to monetary compensation, it is necessary to improve the quality of comprehension of residents. Some new agricultural planting theories and techniques should be popularized among local farmers and herders according to local conditions to promote the transformation of agriculture and animal husbandry from extensive to intensive.

Author Contributions

S.L.: conceptualization, investigation, software, writing—original draft, writing—review and ed-iting. J.Z. (Jianjun Zhang): resources, writing—original draft, writing—review and editing. J.Z. (Jie Zhang): software, writing—review and editing. Z.L.: writing—review and editing. Y.G. (Yiqiang Guo): resources, writing—original draft, writing—review and editing. Y.G. (Yuhuan Geng): inves-tigation. All authors have read and agreed to the published version of the manuscript.

Funding

This research was funded by the National Key R&D Program of China, grant number 2019YFC0507804.

Institutional Review Board Statement

Not applicable.

Informed Consent Statement

Not applicable.

Acknowledgments

This article was supported by the National Key R&D Program of China (Grant No: 2019YFC0507804). Additionally, the authors gratefully acknowledge colleagues and friends at the China University of Geosciences (Beijing), and Institute of Geographic Sciences and Natural Resources Research for providing basic data and relevant information.

Conflicts of Interest

The authors declare that they have no conflicts of interest with this work. We declare that we do not have any commercial or associated interest that would represent a conflict of interest in connection with the work submitted.

Appendix A

Table A1. Main Content of the Questionnaire.
IDMain QuestionAlternative Answer
1Age of head of householdA: ≤40
B: 40 < A ≤ 50
C: 50 < A ≤ 60
D: >60
2Knowledge of head of householdA: Lower
B: junior high school
C: higher
3Family income (CNY 10,000)A: ≤1
B: 1 < A ≤ 5
C: 5 < A ≤ 10
D: >10
4Changes in the number of livestockA: Decrease
B: Stabilize
C: Increase
5Changes in agricultural and livestock skillsA: Stabilize
B: Improve
6Changes in the cost of agriculture and livestockA: Decrease
B: Stabilize
C: Increase
7Changes in ordinary living expensesA: Decrease
B: Stabilize
C: Increase
8Changes in rural employment patternsA: Non-farmer
B: Farmer
9Changes in grassland areaA: Decrease
B: Stabilize
C: Increase
10Changes in grassland qualityA: Weaken
B: Stabilize
C: Improve
11Changes in ecosystemsA: Weaken
B: Stabilize
C: Improve
12Do you know the ecological requirements of NKEFA policy for residents?A: Yes
B: No answer
C: No
13Whether to support the implementation of NKEFAs?A: Oppose
B: No answer
C: Support
14Are you willing to reduce land development?A: Yes
B: No answer
C: No
15Are you willing to monitor and report others?A: Yes
B: No answer
C: No
16Is there any supervision to prevent land degradation?A: Yes
B: No answer
C: No
17Is there theme publicity for land resources protection?A: Yes
B: No answer
C: No
Note: “No answer” in this table means that the respondent does not want to answer this question.

References

  1. Mellino, S.; Buonocore, E.; Ulgiati, S. The worth of land use: A GIS-emergy evaluation of natural and human-made capital. Sci. Total Environ. 2015, 506, 137–148. [Google Scholar] [CrossRef]
  2. Wijitkosum, S. Reducing Vulnerability to Desertification by Using the Spatial Measures in a Degraded Area in Thailand. Land 2020, 9, 49. [Google Scholar] [CrossRef] [Green Version]
  3. Simmonds, J.S.; Sonter, L.J.; Watson, J.E.M.; Bennun, L.; Costa, H.M.; Dutson, G.; Edwards, S.; Grantham, H.; Griffiths, V.F.; Jones, J.P.G.; et al. Moving from biodiversity offsets to a target-based approach for ecological compensation. Conserv. Lett. 2019, 13, e12695. [Google Scholar] [CrossRef] [Green Version]
  4. Stringer, L.C.; Reed, M.S.; Dougill, A.J.; Seely, M.K.; Rokitzki, M. Implementing the UNCCD: Participatory challenges. Nat. Resour. Forum 2007, 31, 198–211. [Google Scholar] [CrossRef]
  5. Martinez-Valderrama, J.; Guirado, E.; Maestre, F.T. Unraveling Misunderstandings about Desertification: The Paradoxical Case of the Tabernas-Sorbas Basin in Southeast Spain. Land 2020, 9, 269. [Google Scholar] [CrossRef]
  6. Chasek, P.; Akhtar-Schuster, M.; Orr, B.J.; Luise, A.; Ratsimba, H.R.; Safriel, U. Land degradation neutrality: The science-policy interface from the UNCCD to national implementation. Environ. Sci. Policy 2019, 92, 182–190. [Google Scholar] [CrossRef]
  7. UNCCD. Achieving Land Degradation Neutrality at the Country Level: Building Blocks for LDN Target Setting; United Nations: New York, NY, USA, 2016. [Google Scholar]
  8. Salvia, R.; Egidi, G.; Vinci, S.; Salvati, L. Desertification Risk and Rural Development in Southern Europe: Permanent Assessment and Implications for Sustainable Land Management and Mitigation Policies. Land 2019, 8, 191. [Google Scholar] [CrossRef] [Green Version]
  9. Akbari, M.; Memarian, H.; Neamatollahi, E.; Shalamzari, M.J.; Noughani, M.A.; Zakeri, D. Prioritizing policies and strategies for desertification risk management using MCDM-DPSIR approach in northeastern Iran. Environ. Dev. Sustain. 2021, 23, 2503–2523. [Google Scholar] [CrossRef]
  10. Dressler, W.; de Koning, J.; Montefrio, M.; Firn, J. Land sharing not sparing in the “green economy”: The role of livelihood bricolage in conservation and development in the Philippines. Geoforum 2016, 76, 75–89. [Google Scholar] [CrossRef]
  11. Lu, Q.; Lei, J.; Li, X.; Yang, Y.; WANG, F. China’s combating desertification: National solutions and global paradigm. Bull. Chin. Acad. Sci. 2020, 35, 656–664. [Google Scholar]
  12. Wang, Y.S.; Li, Y.H.; Li, Y.R. Land Engineering Consolidates Degraded Sandy Land for Agricultural Development in the Largest Sandy Land of China. Land 2020, 9, 199. [Google Scholar] [CrossRef]
  13. Mao, K.; Hanley, E.A. State corporatism and environmental harm: Tax farming and desertification in northwestern China. J. Agrar. Chang. 2018, 18, 848–868. [Google Scholar] [CrossRef]
  14. Chen, Y.; Zhang, Z.; Guo, X.; Lv, C.; Wang, X. Spatial-temporal Analysis on Ecological Land Changes in the Key Ecological Functional Areas in China. China Land Sci. 2018, 32, 19–26. [Google Scholar]
  15. Janus, J.; Markuszewska, I. Forty years later: Assessment of the long-lasting effectiveness of land consolidation projects. Land Use Policy 2019, 83, 22–31. [Google Scholar] [CrossRef]
  16. Yurui, L.; Xuanchang, Z.; Zhi, C.; Zhengjia, L.; Zhi, L.; Yansui, L. Towards the progress of ecological restoration and economic development in China’s Loess Plateau and strategy for more sustainable development. Sci. Total Environ. 2020, 756, 143676. [Google Scholar] [CrossRef]
  17. Kostka, G. Barriers to the implementation of environmental policies at the local level in China. World Bank Policy Res. Work. Pap. 2014, 7016. [Google Scholar]
  18. Kostka, G. Command without control: The case of China’s environmental target system. Regul. Gov. 2016, 10, 58–74. [Google Scholar] [CrossRef]
  19. Mao, K.; Zhang, Q.; Xue, Y.; Weeks, N. Toward a socio-political approach to water management: Successes and limitations of IWRM programs in rural northwestern China. Front. Earth Sci. 2020, 14, 268–285. [Google Scholar] [CrossRef]
  20. Zhou, Y.; Zhou, J.; Liu, H.; Xia, M. Study on eco-compensation standard for adjacent administrative districts based on the maximum entropy production. J. Clean. Prod. 2019, 221, 644–655. [Google Scholar] [CrossRef]
  21. Zanpin, X.; Changzhen, Y.; Kun, F.; Lina, X.; Dawen, Q.; Jiali, X. Spatial and Temporal Variation of Ecosystem Service Value in the Nature Reserves of Bailongjiang Watershed from 1975 to 2015. J. Desert Res. 2019, 39, 1–10. [Google Scholar]
  22. Nguyen, T.T.; Do, T.L.; Grote, U. Natural resource extraction and household welfare in rural Laos. Land Degrad. Dev. 2018, 29, 3029–3038. [Google Scholar] [CrossRef] [Green Version]
  23. Zhou, Y.; Li, Y.; Liu, Y. The nexus between regional eco-environmental degradation and rural impoverishment in China. Habitat Int. 2020, 96, 102086. [Google Scholar] [CrossRef]
  24. van Rooij, B. Implementation of Chinese environmental law: Regular enforcement and political campaigns. Dev. Change 2006, 37, 57–74. [Google Scholar] [CrossRef]
  25. Wang, C.C.; Zhang, Y.Q.; Yang, Y.S.; Yang, Q.C.; Hong, J. What is driving the abandonment of villages in the mountains of Southeast China? Land Degrad. Dev. 2019, 30, 1183–1192. [Google Scholar] [CrossRef]
  26. Gambella, F.; Quaranta, G.; Morrow, N.; Vcelakova, R.; Salvati, L.; Morera, A.G.; Rodrigo-Comino, J. Soil Degradation and Socioeconomic Systems’ Complexity: Uncovering the Latent Nexus. Land 2021, 10, 30. [Google Scholar] [CrossRef]
  27. Clements, T.; Suon, S.; Wilkie, D.S.; Milner-Gulland, E.J. Impacts of Protected Areas on Local Livelihoods in Cambodia. World Dev. 2014, 64, S125–S134. [Google Scholar] [CrossRef] [Green Version]
  28. D’Anna, G.; Vega Fernandez, T.; Pipitone, C.; Garofalo, G.; Badalamenti, F. Governance analysis in the Egadi Islands Marine Protected Area: A Mediterranean case study. Mar. Policy 2016, 71, 301–309. [Google Scholar] [CrossRef]
  29. Rees, S.E.; Attrill, M.J.; Austen, M.C.; Mangi, S.C.; Rodwell, L.D. A thematic cost-benefit analysis of a marine protected area. J. Environ. Manag. 2013, 114, 476–485. [Google Scholar] [CrossRef]
  30. Selva, G.V.; Pauli, N.; Kim, M.K.; Clifton, J. Can environmental compensation contribute to socially equitable conservation? The case of an ecological fiscal transfer in the Brazilian Atlantic forest. Local Environ. 2019, 24, 931–948. [Google Scholar] [CrossRef]
  31. Liu, S.; Zhang, J.; Zhang, J.; Wang, K.; Wu, X.; Xu, L. Simulated glacier responses to temperature and precipitation trends in a snowmelt-dominated river basin. Ecol. Indic. 2019, 106, 105492. [Google Scholar] [CrossRef]
  32. Xue, L.; Wang, J.; Zhang, L.; Wei, G.; Zhu, B. Spatiotemporal analysis of ecological vulnerability and management in the Tarim River Basin, China. Sci. Total Environ. 2019, 649, 876–888. [Google Scholar] [CrossRef]
  33. Wang, F.; Wang, C.; Ye, Y.; Wen, B. An Improved Method for Evaluating Regional Resource Carrying Capacities: A Case Study of the Tarim River Basin in Arid China. Pol. J. Environ. Stud. 2019, 28, 2415–2428. [Google Scholar] [CrossRef]
  34. Liu, S.; Xu, L.; Zhang, J. Spatiotemporal change of land ecological security in Xinjiang. Acta Ecol. Sin. 2019, 39, 1–13. [Google Scholar]
  35. Feng, Q.; Tian, Y.Z.; Yu, T.F.; Yin, Z.L.; Cao, S.X. Combating desertification through economic development in northwestern China. Land Degrad. Dev. 2019, 30, 910–917. [Google Scholar] [CrossRef]
  36. Xinhua, Z.; Jinping, L.; Shuzhong, G.; Limao, W. Assessing the implementation effects of grassland eco-compensation in Xinjiang. J. Arid Land Resour. Environ. 2017, 31, 39–44. [Google Scholar]
  37. Duan, S. The Benefit Research on Ecological Compensation of Ta Cheng under the Herds’ View. Master’s Thesis, Shihezi University, Shihezi, China, 2015. [Google Scholar]
  38. Chen, Z. Research on Ecological Compensation Mechanism of Key Ecological Function Areas in Xinjiang. Ph.D. Thesis, Shihezi University, Shihezi, China, 2014. [Google Scholar]
  39. Han, X.Y.; Jia, G.P.; Yang, G.; Wang, N.; Liu, F.; Chen, H.Y.; Guo, X.Y.; Yang, W.B.; Liu, J. Spatiotemporal dynamic evolution and driving factors of desertification in the Mu Us Sandy Land in 30 years. Sci. Rep. 2020, 10, 1–15. [Google Scholar] [CrossRef] [PubMed]
  40. Deng, M.; Fan, Z.; Xu, H.; Zhou, H. Ecological function regionalization of Tarim River Basin. Arid Land Geogr. 2017, 40, 705–717. [Google Scholar]
  41. The State Council of the People’s Republic of China. The Main Functional Area Planning; The State Council of the People’s Republic of China: Beijing, China, 2010. [Google Scholar]
  42. Shen, D.T.; Qian, T.L.; Xia, Y.; Zhang, Y.; Wang, J.C. Micro-scale Flood Hazard Assessment Based on Catastrophe Theory and an Integrated 2-D Hydraulic Model: A Case Study of Gongshuangcha Detention Basin in Dongting Lake Area, China. ISPRS Int. J. Geo-Inf. 2020, 9, 206. [Google Scholar] [CrossRef] [Green Version]
  43. Song, F.; Yang, X.H.; Wu, F.F. Catastrophe progression method based on M-K test and correlation analysis for assessing water resources carrying capacity in Hubei province. J. Water Clim. Chang. 2020, 11, 556–567. [Google Scholar] [CrossRef] [Green Version]
  44. Chen, L.Y.; Gao, X.; Gong, S.T.; Li, Z. Regionalization of Green Building Development in China: A Comprehensive Evaluation Model Based on the Catastrophe Progression Method. Sustainability 2020, 12, 5988. [Google Scholar] [CrossRef]
  45. Zhang, L.H.; Nie, Q.Y.; Chen, B.Y.; Chai, J.X.; Zhao, Z.Y. Multi-scale evaluation and multi-scenario simulation analysis of regional energy carrying capacity—Case study: China. Sci. Total Environ. 2020, 734, 139440. [Google Scholar] [CrossRef]
  46. Zheng, L.; Bi, X.; Song, L.; Dong, S. Evaluation of marine ecological environment carrying capacity and obstacle diagnosis for the Bohai Sea Ring Area of China based on entropy and catastrophe progression method. Mar. Sci. Bull. 2018, 37, 591–600. [Google Scholar]
  47. Yang, Y.; Yao, C.; Xu, D. Ecological compensation standards of national scenic spots in western China: A case study of Taibai Mountain. Tour. Manag. 2020, 76, 103950. [Google Scholar] [CrossRef]
  48. Wang, J.; Wei, X.; Guo, Q. A three-dimensional evaluation model for regional carrying capacity of ecological environment to social economic development: Model development and a case study in China. Ecol. Indic. 2018, 89, 348–355. [Google Scholar] [CrossRef]
  49. Moriarty, P. Transport and the Environment. Australian Conservation Foundation Melbourne: Melbourne, Australia, 2000. [Google Scholar]
  50. Zhao, S.; Wu, X.; Zhou, J.; Pereira, P. Spatiotemporal tradeoffs and synergies in vegetation vitality and poverty transition in rocky desertification area. Sci. Total Environ. 2021, 752, 141770. [Google Scholar] [CrossRef] [PubMed]
  51. Zhang, F.; Yushanjiang, A.; Wang, D. Ecological risk assessment due to land use/cover changes (LUCC) in Jinghe County, Xinjiang, China from 1990 to 2014 based on landscape patterns and spatial statistics. Environ. Earth Sci. 2018, 77, 1–16. [Google Scholar] [CrossRef]
  52. Tong, Q.; Qiu, F. Population growth and land development: Investigating the bi-directional interactions. Ecol. Econ. 2020, 169, 106505. [Google Scholar] [CrossRef]
  53. Noda, K.; Iida, A.; Watanabe, S.; Osawa, K. Efficiency and sustainability of land-resource use on a small island. Environ. Res. Lett. 2019, 14, 054004. [Google Scholar] [CrossRef]
  54. Kuang, B.; Lu, X.; Han, J.; Fan, X.; Zuo, J. How urbanization influence urban land consumption intensity: Evidence from China. Habitat Int. 2020, 100, 102103. [Google Scholar] [CrossRef]
  55. Li, B.; Chen, D.; Wu, S.; Zhou, S.; Wang, T.; Chen, H. Spatio-temporal assessment of urbanization impacts on ecosystem services: Case study of Nanjing City, China. Ecol. Indic. 2016, 71, 416–427. [Google Scholar] [CrossRef]
  56. Fan, X.; Hao, X.; Hao, H.; Zhang, J.; Li, Y. Comprehensive Assessment Indicator of Ecosystem Resilience in Central Asia. Water 2021, 13, 124. [Google Scholar] [CrossRef]
  57. Liu, S.D.; Liu, L.; Zhang, J.J.; Wang, K.; Guo, Y.Q. Study on ecological protection and restoration path of arid area based on improvement of ecosystem service capabilily, a case of the ecological protection and restoration pilot project area in Irtysh River Basin. Acta Eeologica Sin. 2019, 39, 1–10. [Google Scholar]
  58. Briske, D.D.; Zhao, M.; Han, G.; Xiu, C.; Kemp, D.R.; Willms, W.; Havstad, K.; Kang, L.; Wang, Z.; Wu, J.; et al. Strategies to alleviate poverty and grassland degradation in Inner Mongolia: Intensification vs. production efficiency of livestock systems. J. Environ. Manag. 2015, 152, 177–182. [Google Scholar] [CrossRef] [PubMed]
  59. Joshi, A.; Kale, S.; Chandel, S.; Pal, D. Likert Scale: Explored and Explained. Br. J. Appl. Sci. Technol. 2015, 7, 396–403. [Google Scholar] [CrossRef]
  60. Wang, G. Research on the Issues of Environmental Equity in Prevention and Control of Land Desertification. Ph.D. Thesis, Lanzhou University, Lanzhou, China, 2018. [Google Scholar]
  61. Gabel, V.M.; Home, R.; Stolze, M.; Pfiffner, L.; Birrer, S.; Kopke, U. Motivations for swiss lowland farmers to conserve biodiversity: Identifying factors to predict proportions of implemented ecological compensation areas. J. Rural Stud. 2018, 62, 68–76. [Google Scholar] [CrossRef]
  62. Barbier, E.B. The economic linkages between rural poverty and land degradation: Some evidence from Africa. Agric. Ecosyst. Environ. 2000, 82, 355–370. [Google Scholar] [CrossRef]
  63. Cheng, H.; Dong, S.; Li, F.; Yang, Y.; Li, Y.; Li, Z. A circular economy system for breaking the development dilemma of ‘ecological Fragility Economic poverty’ vicious circle: A CEEPS-SD analysis. J. Clean. Prod. 2019, 212, 381–392. [Google Scholar] [CrossRef]
  64. Hurni, H.; Giger, M.; Liniger, H.; Studer, R.M.; Messerli, P.; Portner, B.; Schwilch, G.; Wolfgramm, B.; Breu, T. Soils, agriculture and food security: The interplay between ecosystem functioning and human well-being. Curr. Opin. Environ. Sustain. 2015, 15, 25–34. [Google Scholar] [CrossRef]
  65. Zhang, J.; He, C.; Chen, L.; Cao, S. Improving food security in China by taking advantage of marginal and degraded lands. J. Clean. Prod. 2018, 171, 1020–1030. [Google Scholar] [CrossRef]
  66. Rigg, J. Land, farming, livelihoods, and poverty: Rethinking the links in the Rural South. World Dev. 2006, 34, 180–202. [Google Scholar] [CrossRef] [Green Version]
  67. Cheng, X.; Shuai, C.; Liu, J.; Wang, J.; Liu, Y.; Li, W.; Shuai, J. Topic modelling of ecology, environment and poverty nexus: An integrated framework. Agric. Ecosyst. Environ. 2018, 267, 1–14. [Google Scholar] [CrossRef]
  68. Cao, S.; Wang, X.; Song, Y.; Chen, L.; Feng, Q. Impacts of the Natural Forest Conservation Program on the livelihoods of residents of Northwestern China: Perceptions of residents affected by the program. Ecol. Econ. 2010, 69, 1454–1462. [Google Scholar] [CrossRef]
  69. Krupnik, T.J.; Schulthess, U.; Ahmed, Z.U.; McDonald, A.J. Sustainable crop intensification through surface water irrigation in Bangladesh? A geospatial assessment of landscape-scale production potential. Land Use Policy 2017, 60, 206–222. [Google Scholar] [CrossRef] [PubMed] [Green Version]
  70. Lorenz, K.; Lal, R.; Ehlers, K. Soil organic carbon stock as an indicator for monitoring land and soil degradation in relation to United Nations’ Sustainable Development Goals. Land Degrad. Dev. 2019, 30, 824–838. [Google Scholar] [CrossRef]
  71. Mahari, W.A.W.; Azwar, E.; Li, Y.; Wang, Y.; Peng, W.; Ma, N.L.; Yang, H.; Rinklebe, J.; Lam, S.S.; Sonne, C. Deforestation of rainforests requires active use of UN’s Sustainable Development Goals. Sci. Total Environ. 2020, 742, 140681. [Google Scholar] [CrossRef] [PubMed]
  72. Zhong, B.; Peng, S.; Zhang, Q.; Ma, H.; Cao, S. Using an ecological economics approach to support the restoration of collapsing gullies in southern China. Land Use Policy 2013, 32, 119–124. [Google Scholar] [CrossRef]
  73. Kangalawe, R.Y.M.; Noe, C. Biodiversity conservation and poverty alleviation in Namtumbo District, Tanzania. Agric. Ecosyst. Environ. 2012, 162, 90–100. [Google Scholar] [CrossRef]
  74. Gong, C.; Xu, C.; Chen, L.; Cao, S. Cost-effective compensation payments: A model based on Buying Green Cover to sustain ecological restoration. For. Policy Econ. 2012, 14, 143–147. [Google Scholar] [CrossRef]
  75. Hu, Y.; Huang, J.; Hou, L. Impacts of the Grassland Ecological Compensation Policy on Household Livestock Production in China: An Empirical Study in Inner Mongolia. Ecol. Econ. 2019, 161, 248–256. [Google Scholar] [CrossRef]
  76. Barbier, E.B.; Hochard, J.P. Land degradation and poverty. Nat. Sustain. 2018, 1, 623–631. [Google Scholar] [CrossRef]
  77. Pei, S.; Zhang, C.; Liu, C.; Liu, X.; Xie, G. Forest ecological compensation standard based on spatial flowing of water services in the upper reaches of Miyun Reservoir, China. Ecosyst. Serv. 2019, 39, 39. [Google Scholar] [CrossRef]
  78. Gao, X.; Shen, J.; He, W.; Sun, F.; Zhang, Z.; Zhang, X.; Zhang, C.; Kong, Y.; An, M.; Yuan, L.; et al. Changes in Ecosystem Services Value and Establishment of Watershed Ecological Compensation Standards. Int. J. Env. Res. Public Health 2019, 16, 2951. [Google Scholar] [CrossRef] [Green Version]
  79. Cheng, X.; Shuai, C.M.; Liu, J.L.; Wang, J.; Liu, Y.; Li, W.J.; Shuai, J. Modelling environment and poverty factors for sustainable agriculture in the Three Gorges Reservoir Regions of China. Land Degrad. Dev. 2018, 29, 3940–3953. [Google Scholar] [CrossRef]
  80. UN. Transforming Our World: The 2030 Agenda for Sustainable Development; United Nations: New York, NY, USA, 2015. [Google Scholar]
  81. Alvarado, R.; Toledo, E. Environmental degradation and economic growth: Evidence for a developing country. Environ. Dev. Sustain. 2017, 19, 1205–1218. [Google Scholar] [CrossRef]
  82. Fengcheng, Y.; Jinpeng, Z. The Struggle of the CPC for One Hundred Years and the Completion of a Well-off Society in All-round Ways. J. Shaanxi Norm. Univ. 2021, 50, 37–51. [Google Scholar]
  83. Piao, S.; Wang, X.; Park, T.; Chen, C.; Myneni, R.B. Characteristics, drivers and feedbacks of global greening. Nat. Rev. Earth Environ. 2019, 1, 1–14. [Google Scholar] [CrossRef]
Figure 1. Geographical location of the Taklimakan Desert. This region is one of the core areas of land desertification prevention. Forty-four counties were used for this comparative study. Twenty-one of these counties belonged to national key ecological function areas (NKEFAs), and the other 23 counties belonged to non-NKEFAs. (ALE: Alaer; SL: Shule; BH: Bohu; KEL: Kuerle; XH: Xinhe; KC: Kuce; YQ: Yanqi; WuS: Wushi; HJ: Hejing; BC: Baicheng; HS: Heshuo; LT: Luntai; SF: Shufu; AKS: Aksu; WS: Wensu; SY: Shaya; KP: Kalpin; YL: Yuli; MF: Minfeng; ATS: Atushi; HTS: Hetianshi; KS: Kashi; HTX: Hetianxian; YPH: Yuepuhu; GJ: Jiashi; TMS: Tumushuke; SC: Shache; ZP: Zepu; AWT: Awat; BaC: Bachu; MGT: Maigaiti; YJS: Yingjisha; RQ: Ruoqiang; MY: Moyu; YT: Yutian; QM: Qiemo; LP: Lop; AHQ: Aheqi; PS: Pishan; YC: Yecheng; CL: Cele; AKT: Aketao; TS: Tashi; WQ: Wuqia).
Land 10 00641 g001
Figure 2. Research framework of NKEFA policy effects. Combining the objective evaluation results and the views of managers and residents, understanding the content that needs attention, and improvement in the process of policy formulation and implementation.
Land 10 00641 g002
Figure 3. Changes in socioeconomic conditions. The main figure reflects the spatial change in socioeconomic and land resource sustainability index (CSLSI) in each county, and the bar chart at the bottom reflects the change in SLS index (CSLSI) of NKEFAs and non-NKEFAs from 2005 to 2015.
Land 10 00641 g003
Figure 4. Results of interviews with managers. The symposium records were divided into 5 levels using Likert scale analysis (1 5: strong disagreement strong agreement).
Land 10 00641 g004
Figure 5. Resident reflection of questionnaire. The NKEFA policy increased the living costs of residents, but ecological improvement was not obvious. The high-efficiency group had a better evaluation of this policy than the low-efficiency group.
Land 10 00641 g005
Figure 6. Decision process of residents. Different efficiency residents belong to different D–S curves. Low-efficiency group I1 < medium-efficiency group I2 < and high-efficiency group I3.
Land 10 00641 g006
Figure 7. Dilemma of the policy conflict. There were contradictions between the macro-stakeholders and the micro-stakeholders. Ecological compensation failed to achieve a balance between long-term and short-term benefits.
Land 10 00641 g007
Table 1. Summary of dataset information.
Type of DataDataDate ReceivedResolutionData Sources
Statistical dataInterview record11 May 2019 to 8 July 2019/Survey interviews
Questionnaire data18 April 2014 to 15 June 2015/References [36,37,38]
Statistical Yearbooks2006; 2016/http://www.xjtj.gov.cn/, accessed on 21 July 2019
Raster dataCLURSMDJuly 2005; July 20151 kmhttp://www.resdc.cn/, accessed on 20 July 2019
Vector dataBoundaries of NKEFAs2018/http://www.ndrc.gov.cn/, accessed on 12 May 2019
County-level boundaries2018/http://www.ngcc.cn/, accessed on 12 May 2019
CLURSMD: China land use remote sensing monitoring data.
Table 2. Introduction of national key ecological function area (NKEFA) policy in marginal parts of the Taklimakan Desert.
Background
First phase
2005–2010
Due to the serious desertification in the study area, “ecological function regionalization” delimited the Tarim River Basin wind control and sand fixation ecological function area for the first time in 2005.
Second phase
2010–2015
In 2010, the State Council of China passed “The Main Functional Area Planning” policy and renamed each ecological function area as a “national key ecological function area”.
Third phase
2015–present
To achieve the goal of ecological civilization strategy and sustainable development, 6 counties including WS, KP, SF, SL, HT, and BH were added as national key ecological function areas in 2006.
Measures (2005–2015)
Management measures1. Organization: The implementation of the NKEFA policy involves multiple departments. Governments at all levels have established corresponding organizations.
2. Funds: With government investment as the mainstay, policies actively guide social funds to invest in the NKEFAs.
3. Government: In addition to the regional GDP, the importance of ecological quality in the government assessment process is included. Lifetime accountability for ecological damage responsibility has been established.
Implementation measures1. Implementation: Large-scale, high-intensity industrialization and excessive use of grassland are restricted in areas with the important ecological functions of wind control and sand fixation.
2. Supervision: A reward and punishment mechanism has been established, and regular supervision and inspections are executed.
3. Transfer payment: After 2008, special transfer payment funds were set according to the needs of desertification control.
Compensation measures1. Ecological compensation: The government provided ecological compensation to the affected residents. Monetary compensation is provided for losses caused by reducing the function of productive resources due to ecological functions (2005–2010). The land use activities in NKEFAs are all affected by this policy. All residents within NKEFAs will be compensated according to the size of their rangeland or arable land (land use right). In 2005, an ecological benefit compensation fund was established. After 2010, the central government’s ecological compensation transfer payment fund was established.
2. Population resettlement: The original land, such as homesteads and breeding sheds, lost by ecological immigrants can be replaced by the towns surrounding the county. In addition, residents after resettlement enjoy partial tax relief to improve their quality of life.
Changes (2015-New)To improve people’s livelihoods and achieve more scientific poverty alleviation, the Chinese government has successively issued policies such as “targeted poverty alleviation”, “rural revitalization strategy”, and “rural comprehensive land improvement” from the perspectives of rural living environment, industry, and technology.
Note: The research object does not include the 6 newly added counties after 2015.
Table 3. Index system of the socioeconomic and land resource sustainability (SLS) evaluation model.
GuidelinesFactorsIndicatorsDirection of Indicators
Socioeconomic balanceEconomic investmentFixed assets investment ($)Negative
Ecological compensation ($)Negative
Economic outputProportion of the tertiary industry (%)Positive
Agricultural and livestock output ($/ha)Positive
Per capita GDP ($)Positive
Land resource sustainabilityManagement statusDesertification control area (ha)Positive
Saline-alkali land control area (ha)Positive
Social demandPopulation growth rate (%)Negative
Population density (people/km2)Negative
Urbanization rate (%)Negative
Material supplyCrop yield per unit area (kg/ha)Positive
Vegetation cover rate (%)Positive
Table 4. The main content of the symposium record.
Main Content of SymposiumMain Record Content
Attitude towards policyPrevent desertificationAgree to prevent desertification
Socioeconomic developmentAgree to develop socioeconomic
Implement NKEFA policy continuouslyAgree to implement NKEFA policy
Views on implementationSupervisionStrict implementation and supervision
Publicity and guideGood publicity activity
Residents cooperateResidents are willing to cooperate
Views on effectivenessDesertification controlSignificant effect of desertification control
Socioeconomic promotionSignificant economic promotion effect
Ecological compensation effectEfficient ecological compensation
Table 5. Likert scale analysis method.
Agree GradeLevelAverage
Strong AgreementMostly AgreementNeither Agreement nor DisagreementMostly DisagreementStrong Disagreement
Value54321 V ¯ i
Number n i 5 n i 4 n i 3 n i 2 n i 1
Frequency p i 5 p i 4 p i 3 p i 2 p i 1
Note: Here, i is the i th question.
Publisher’s Note: MDPI stays neutral with regard to jurisdictional claims in published maps and institutional affiliations.

