Article

Multi-Scenario Simulation for the Consequence of Urban Expansion on Carbon Storage: A Comparative Study in Central Asian Republics

1
Law School, Ningbo University, Ningbo 315211, China
2
Department of Land Management, Zhejiang University, Hangzhou 310058, China
3
School of Geographic Sciences, East China Normal University, Shanghai 200241, China
4
Department of Urban-Rural Planning, Zhejiang Gongshang University, Hangzhou 310018, China
5
School of Economics, Zhejiang University, Hangzhou 310058, China
*
Author to whom correspondence should be addressed.
Land 2021, 10(6), 608; https://doi.org/10.3390/land10060608
Submission received: 25 April 2021 / Revised: 2 June 2021 / Accepted: 3 June 2021 / Published: 7 June 2021

Abstract

:
There is growing concern about the consequences of future urban expansion on carbon storage as our planet experiences rapid urbanization. While an increasing body of literature was focused on quantifying the carbon storage impact of future urban expansion across the globe, rare attempts were made from the comparative perspective on the same scale, particularly in Central Asia. In this study, Central Asian capitals, namely Ashkhabad, Bishkek, Dushanbe, Nur Sultan, and Tashkent, were used as cases. According to the potential impacts of BRI (Belt and Road Initiative) on urban expansion, baseline development scenario (BDS), cropland protection scenario (CPS), and ecological protection scenario (EPS) were defined. We then simulated the carbon storage impacts of urban expansion from 2019 to 2029 by using Google Earth Engine, the Future Land Use Simulation model, and the Integrated Valuation of Environmental Services and Tradeoffs model. We further explored the drivers for carbon storage impacts of future urban expansion in five capitals. The results reveal that Nur Sultan will experience carbon storage growth from 2019 to 2029 under all scenarios, while Ashkhabad, Bishkek, Dushanbe, and Tashkent will show a decreasing tendency. EPS and CPS will preserve the most carbon storage for Nur Sultan and the other four cities, respectively. The negative impact of future urban expansion on carbon storage will be evident in Ashkhabad, Bishkek, Dushanbe, and Tashkent, which will be relatively inapparent in Nur Sultan. The potential drivers for carbon storage consequences of future urban expansion include agricultural development in Bishkek, Dushanbe, and Tashkent, desert city development in Ashkhabad, and prioritized development of the central city and green development in Nur Sultan. We suggest that future urban development strategies for five capitals should be on the basis of differentiated characteristics and drivers for the carbon storage impacts of future urban expansion.

1. Introduction

Since the late 19th century, the earth witnessed climate change with a warming rate of 0.17 °C per decade as greenhouse gas continued to increase [1,2]. As climate change becomes a primary contemporary global concern, carbon storage is increasingly perceived as an essential ecosystem service to address this issue [3,4,5]. Carbon storage indicates the capacity of the terrestrial ecosystem to remove atmospheric CO2. It was estimated that soil organic carbon, one of the carbon pools, could offset 5–15% of the global fossil-fuel emissions [6]. Moreover, the enhancement of carbon storage is endowed with economic benefits since the Kyoto Protocol proposed assigning credits for carbon sequestration in forestry and agricultural soils [7]. Therefore, there is growing attention on carbon storage change across the world [8], given the predicted climate change in the coming decades [9].
However, unprecedented global urban expansion and consequent land-use change during the last century imposed direct and indirect impacts on carbon storage. On the one hand, urban expansion by consuming vegetation cover resulted in the loss of vegetation biomass [10] while preserving forest increased carbon storage [11,12]. On the other hand, the transformation from non-urban to urban land use changed the density of soil organic carbon [13], which may transfer the soil from sink to source for atmospheric carbon. Unfortunately, global carbon storage will be vulnerable to the triple global urban land circa 2000 that is predicted to occur by 2030 [14]. Thus, simulating the consequences of urban expansion on carbon storage is intensified as an urgent task for achieving sustainable urban growth.
Currently, scholars have increasingly put attention to simulating the impacts of urban expansion on carbon storage at different scales. At the global scale, Seto et al. [14] estimated the carbon loss from global urban expansion by 2030 and concluded that the most considerable carbon stock loss would occur in pan-tropical Africa. At the national scale, Eigenbrod et al. [15], Lawlera et al. [16], and Liu et al. [17] analyzed the spatiotemporal change of carbon storage according to the simulations of urbanization and consequent land-use change in Britain, the United States, and China, respectively. The results showed that Britain and China would experience different degrees of decline in carbon storage, while the United States would experience an increase. At the regional scale, case studies were focused on Changsha-Zhuzhou-Xiangtan urban agglomeration [18], Hubei province [19], Beijing [20], and Charlotte [21], which came to the same conclusion of carbon storage loss with future urban expansion. However, there are still two challenges to be addressed in the existing literature. First, while a plethora of previous literature has focused on quantifying the carbon storage impact of future urban expansion for a single region, few attempts have been made through the comparison among different regions on the same scale [22]. That is, there have been a lack of comparative studies to link with future urban expansion patterns, carbon storage impacts, and related drivers. Second, most existing studies investigating the carbon consequences of land-use change were focused on China, America, and Europe. Nevertheless, some areas have not been receiving attention to the same extent, such as Central Asia [23].
Central Asia is chronically overlooked in the studies on global carbon balance [23,24]. This region has been covered by extensive grasslands and deserts for centuries. The grasslands foster fertile soils to store more soil organic carbon because of the better root production [25]. In terms of deserts, the soil organic carbon density in Central Asia is 1–2 times as that of the global hot deserts [26]. As Li et al. [26] reported, carbon storage in Central Asia amounted to 43–44.58 Pg that was equaled to 18–24% of the global amount in deserts and dry shrublands. As Central Asia entered a more agrarian society during the 20th century, human-induced vegetation change imposed a profound influence on terrestrial carbon storage. The widespread conversion of grassland to cropland and grazing-induced grassland degradation resulted in a loss of carbon storage [27]. According to Sommer and de Pauw [28], these two types of vegetation change were responsible for the depletion of 4.1% of the total soil carbon storage in Central Asia. Currently, the region is experiencing continuous urbanization, with an annual growth rate of urbanization above 1% during the past two decades. The fraction will be kept at approximately 1% in the forthcoming decade [29], indicating the continuous urban expansion and urban population growth, which may pose a long-term impact on carbon storage. However, despite the similar physical environments, environmental issues, and urbanization trends in Central Asia, the concern about whether their cities share a similar characteristic and driver for the carbon storage impacts of future urban expansion remains rarely explored.
Furthermore, Central Asian Republics are increasingly impacted by the BRI (Belt and Road Initiative) that was proposed by the Chinese government as a strategy to strengthen economic cooperation in 2013 [30,31]. Benefiting from investment funds for economic cooperation and infrastructure development by the BRI, urban expansion in Central Asian cities was accelerated through building cooperation development zones, developing transportation networks, and improving infrastructures [32]. The increasing prevalence of advanced agricultural technology helped to crack the issues of water shortage and mass production, facilitating extensive reclamation of agricultural land. For instance, China’s Huaxin Cement company and Zhongtai Textile company signed an agreement with Tajikistan to build a cement industrial park and textile industrial park near Dushanbe, respectively. However, the large-scale expansion of land development and transportation networks may exacerbate environmental risks in Central Asian regions, including carbon emission [33], habitat loss [34], and resource overexploitation [35]. A growing body of literature emphasized to devise of proactive regulations to cope with these environmental and ecological challenges [33,35,36]. Under the circumstances, it is of great significance to consider such uncertainties induced by the BRI—motivating urban growth, facilitating agricultural development, or devising environmental strategy—when assessing carbon storage impacts of future urban expansion in Central Asian cities.
To address the knowledge gap, we used five capitals of Central Asian Republics as study cases to (1) simulate urban expansion and consequent carbon storage change under three BRI-related scenarios, (2) compare the consequences of urban expansion on carbon storage, and (3) explore the potential drivers for carbon storage impact of urban expansion across five capitals. In this study, urban expansion was defined in a broad sense that included both built-up land growth and associated land-use change [37].

2. Study Area and Data

2.1. Study Area

Central Asia is often defined as five republics, including Kazakhstan, Turkmenistan, Uzbekistan, Tajikistan, and Kyrgyzstan [38,39]. The capitals of Central Asian Republics include Ashkhabad (Turkmenistan), Bishkek (Kyrgyzstan), Dushanbe (Tajikistan), Nur Sultan (Kazakhstan), and Tashkent (Uzbekistan). In this study, 20 km buffer zones centering on urban cores were defined as study areas due to the different administrative scales among five republics (Figure 1). The regions of Bishkek and Tashkent were clipped by national boundaries.
While Nur Sultan and Tashkent are located in flatlands, Bishkek, Dushanbe, and Ashkhabad are located in mountain feet and basins. Five cities are characterized by a temperate continental climate, with hot and dry summer and cold winter. These regions are varied in precipitation. Ashkhabad has an average precipitation of less than 100 mm/yr, while the other four cities have an average precipitation of approximately 400 mm/yr. In 2018, the total population in five capitals approximated 7 million. With the above 6% population of their respective nations, they play important roles in the economy, politics, trading, and education. As Central Asia has transformed from nomadic society to agrarian society since the era of the Soviet Union [25], cropland and built-up land became the most common landscapes in capital regions. Furthermore, these regions have experienced steppe degradation [27], deforestation [23], inappropriate irrigation [24], and water exhaustion [39]. Due to the ongoing urbanization in the future, dramatic land-use change is likely to result in more ecological impacts.

2.2. Data Sources

In the present work, terrain data, socioeconomic data, road networks, and ancillary geographic data were used to simulate urban expansion in the Future Land Use Simulation (FLUS) model. The digital elevation model (DEM) with a 30 m resolution was obtained from the Geospatial Data Cloud (http://www.gscloud.cn/, accessed on 4 June 2021). Slope and topographic relief were derived from DEM. Population density, a raster map with 250 m resolution, was downloaded from Joint Research Centre, European Commission (https://data.jrc.ec.europa.eu/, accessed on 4 June 2021). 12 monthly nightlight imageries for 2018 with a resolution of 0.5°, downloaded from the National Geophysical Data Center (https://www.ngdc.noaa.gov/, accessed on 4 June 2021), were used to generate composite nightlight imagery by using an average algorithm. Point of Interest (POI) and road network were downloaded from Open Street Map (https://www.openstreetmap.org/, accessed on 4 June 2021). The ancillary geographic data, including the coordinates of central business districts (CBD) and town centers, was collected from the Google Map (https://www.google/maps, accessed on 4 June 2021). All datasets were reprojected to the Universal Transverse Mercator coordinate system, with a pixel size of 100 m × 100 m.
Land use maps and carbon density were used to estimate carbon storage in the Integrated Valuation of Ecosystem Services and Tradeoffs (InVEST) model. Land use maps for 2009 and 2019 were derived from Google Earth Engine (GEE), including six types—cropland, forest, grassland, water, built-up land, and unused land. The carbon densities of six land types were obtained from Li et al. [26]. These simulated carbon densities were validated to be matched well with field observations, which indicated the applicability to estimate carbon storage in Central Asia.

3. Methods

3.1. Interpreting Land Use in GEE

We used GEE to interpret land use from Landsat satellite images. GEE (https://code.earthengine.google.com/, accessed on 4 June 2021) is a cloud-based platform for the analysis of petabyte-scale satellite imagery and geospatial datasets on a global scale [40]. It provides access to collected earth-observing remote sensing imagery, which can be interpreted using cloud computing technology. Due to the parallel computing based on millions of servers distributed across the globe, the process of interpreting land use for extensive coverage only costs a few minutes [41]. An example can be found via: https://code.earthengine.google.com/1d04a8a5f6a366d67c1762c308db10c0, accessed on 4 June 2021.
Land use interpretation was conducted in GEE by using JavaScript code, which included the following steps (Figure 2). Firstly, we used Landsat 5 TM, Landsat 7 ETM+, and Landsat 8 calibrated top-of-atmosphere reflectance data to classify land use of five capitals in 2009 and 2019, respectively. Cloud, snow, and cloud shadow in all imageries were masked by removing the bitmasks in the band “pixl_qa”. All available imageries from 1 April to 30 October 2009, and 2019 were composited to one imagery using a median algorithm, respectively.
Secondly, the bands of red, green, near-infrared, short-wave infrared, thermal infrared were extracted from the composited imageries to detect textural features for classification. The textural features included Normalized Difference Vegetation Index (NDVI), Normalized Difference Built-up Index (NDBI), Normalized Difference Bareness Index (NDBaI), and Modified Normalized Difference Water Index (MNDWI).
Thirdly, we used the Random Forest algorithm as a classifier. We also defined 589 and 613 training samples for land use classification of 2009 and 2019 according to Google Earth (GE), respectively (Figure S1). The numbers and areas of the training samples were determined based on the proportion of each land type. Meanwhile, 300 validation samples were randomly selected in each capital and each year for accuracy assessment. By comparing the validation samples with high-resolution images in GE, overall accuracies were calculated. The overall accuracies of land use classification for all capitals are above 89.7% (Tables S1 and S2).

3.2. Setting Scenarios and Estimating Land Demand

The first step to simulate future urban expansion is defining scenarios. Considering the potential influence of the BRI on future urban expansion and related land-use change, including but not limited to motivating urban expansion, facilitating agricultural development, and cracking environmental issues, we set three scenarios, namely baseline development scenario (BDS), cropland protection scenario (CPS), and ecological protection scenario (EPS). The BDS is assumed that the BRI’s investment funds for economic cooperation and infrastructure development will be continued without a distinct shift in the developmental strategy. Therefore, the current momentum of urban growth will be kept in the near future. The CPS is assumed to put agricultural development as a priority of the BRI, given that the agricultural sector has played an increasingly dominant role in the economic development of Central Asia during the 20th century [25]. Under the CPS, protecting cropland will be one of the most important tasks in future urban growth. The EPS is assumed to respond to the BRI’s “green shift” proposed by Tracy et al. [35], which emphasizes the coordination of ecological regulation and economic cooperation. Under the EPS, ecological land will be put as the priority over urban expansion, given that land degradation, deforestation, and water shrinkage have long been urgent ecological issues in Central Asia [23,28,39].
Under the BDS, the amounts of future land use were estimated according to the land conversion probability of 2009–2019, which is calculated by the Markov chain [42]. According to Hu et al. [43], Kindu et al. [44], and Chotchaiwong and Wijitkosum [45], we defined the land conversion probability of the BDS as a benchmark, which could be adjusted according to the priority of protecting specific land type under the CPS and EPS (Table 1).

3.3. Simulating Urban Land Use by Using the FLUS Model

The urban expansion and related land-use change for 2029 were simulated using the FLUS model. FLUS model can be used to address the complex land conversion rules of the traditional cellular automaton (CA) model in urban simulations under the impact of diverse driving factors. The model integrates artificial neural network (ANN) and self-adaptive inertia and competition mechanism [46,47].
Firstly, a three-layer ANN model was used to calculate the nonlinear relationship between historical land use and related driving factors, with the aim to derive the probability-of-occurrence for six land types at the grid-scale. In the input layer, each neuron is equal to a driving factor. In the study, physical conditions (elevation, slope, and topographic relief), population density, socioeconomic factors (POI density and nightlight intensity), the proximity to waters, road networks (highways and railways), and hubs (CBD and town centers) were defined as driving factors. The land use maps of 2009 were also used. In the hidden layer, the ANN model was trained with six land-use types and driving factors by using random sampling, with a sampling rate of 10%. In the output layer, the probability-of-occurrence surfaces of six land use types for 2019 were derived by using a sigmoid activation function, according to the following equation:
P p , k t = j w j , k × s i g m o i d ( n e t j ( p , t ) ) = j w j , k × 1 1 + e i w i . j × X i ( p , t )
where P p , k t refers to the probability-of-occurrence of land use type k on grid cell p at training time t ; n e t j ( p , t ) refers to the signal received by neuron j from all input neurons on cell p at time t ; X i ( p , t ) refers to the ith factor related to the input neuron i on cell p at time t; w j , k and w i , j refers to adaptive weights between the hidden layer and the output layer, which were both calibrated during the process of ANN training.
To measure the fit goodness of ANN training performance, we used Receiver Operating Characteristic (ROC) curve to validate the probability-of-occurrence of six land use types for 2019. The AUC values for all land types in five regions were both larger than 0.7, indicating a good fit of ANN model to estimate the probability-of-occurrence of land use types for 2019 [48].
Secondly, the self-adaptive inertia and competition mechanism, including neighborhood effect, inertia coefficient, conversion cost, and roulette selection, was adopted to cope with the competition and interactions among different land types [47]. In the mechanism, the neighborhood effect was firstly considered based on the first law of geography, which was expressed as:
α p , k t = m × m c o n ( c p t 1 = k ) n × n 1 × w k
where α p , k t refers to the neighborhood effect of land use type k on grid cell p at training time t ; w k refers to the weight of different land-use types; m × m c o n ( c p t 1 = k ) refers to the cell amount of land type k within n × n window at iteration time t 1 . n was set as 3. The neighborhood weights for six land-use types are shown in Table S3.
The self-adaptive inertia coefficient was defined to regulate the land conversion probability in light of the total amount of a land-use type under different scenarios. The inertia coefficient could enhance the inheritance of a land-use type for adjusting the land-use trend in the next iteration when the conversion trend was negatively correlated with the total amount. The self-adaptive inertia coefficient was defined as:
I n e r t i a k t = { I n e r t i a k t 1   i f   | D k t 1 | | D k t 2 | I n e r t i a k t 1 × D k t 2 D k t 1   i f   D k t 1 < D k t 2 < 0 I n e r t i a k t 1 × D k t 1 D k t 2   i f   0 < D k t 2 < D k t 1
where I n e r t i a k t refers to the self-adaptive inertia coefficient of land use type k at time t ; D k t 1 and D k t 2 refer to the total amount of land use type k at iteration time t 1 and t 2 , respectively.
The conversion cost was set to indicate the possibility of conversion from current land use type l to target type k . Its value c l k includes 0 and 1, which refers to impossible conversion and possible conversion, respectively. In the present work, the conversion costs of all land use types were set in light of expert knowledge (Table S4).
Through the above-mentioned steps, the combined probability of six land use types for 2019 at the cell scale could be mathematically defined as:
T P p , k t = P p , k t × α p , k t × I n e r t i a k t × c l k
where T P i , k t refers to the combined probability of grid cell p from current land use type to k at iteration time t ; P p , k t , α p , k t , I n e r t i a k t and c l k refer to the probability-of-occurrence, neighborhood effect, inertia coefficient, and conversion cost, respectively.
The roulette selection was built to indicate the competition among each cell of different land-use types, with the aim to capture randomness and uncertainty in land use change. By using the roulette selection, land-use types with a larger combined probability are more likely to change, and those with a smaller probability are still possible to change [46].
In this study, we firstly simulated the land use pattern for 2019 based on land use maps of 2009 and the combined probability of land use change for 2019. The actual land-use maps of 2019 were then used to validate the simulated land maps of 2019. The indicators of Figure of Merit (FoM) for five regions were both higher than 0.18, indicating the reliability of the model for simulating future land use [49]. Then, land use patterns for five capitals in 2029 were simulated by coupling the land use maps of 2019, validated the FLUS model with future land demands under three scenarios.

3.4. Estimating Carbon Storage Using the InVEST Model

The InVEST model developed by the Natural Capital Project was employed to estimate carbon storage. In the model, carbon storage, including aboveground carbon, belowground carbon, soil organic carbon, and dead organic matter carbon, can be calculated by using land-use types and corresponding carbon densities. As reported by Batjes [50], global carbon storage in the terrestrial ecosystem (2000–2500 Pg) is mainly composed of vegetation carbon pool (500–600 Pg) and carbon storage in the upper 1 m soil (1500–1900 Pg). Due to such a great proportion of vegetation carbon and soil organic carbon, a large body of previous studies were focused on estimating these two types of carbon storage [17,51,52]. Therefore, we estimated aboveground vegetation carbon and soil organic carbon in this study by using the given equation:
C t ( x , y ) = A × ( D t ( x , y ) A b o v e + D t ( x , y ) S o i l )
where C t ( x , y ) refers to carbon storage of raster cell ( x , y ) in land use type t, A refers to each cell area, D t ( x , y ) A b o v e and D t ( x , y ) S o i l refer to the aboveground vegetation carbon density and soil organic carbon density (Mg/ha) in a cell ( x , y ) of land use type t, respectively. The mean carbon densities of six land-use types are shown in Table 2. According to He et al. [20], Goldstein et al. [53], and Sallustio et al. [54], the carbon density of built-up land was set as zero.

4. Results and Discussion

4.1. Future Urban Expansion and Carbon Storage Change

4.1.1. The Simulations of Urban Land Use for Alternative Scenarios

The simulations for urban expansion of 2029 are shown in Figure 3. Five capitals will experience a dramatic change in both spatial patterns and the amounts of land use. The BDSs show the most rapid urban expansion with the most considerable amounts of built-up land. Under the BDSs, built-up land of all capitals will exhibit infilling growth and edge growth, being likely to be more clustered. Bishkek and Dushanbe will be increasingly characterized by scattered towns. In Nur Sultan, grassland will be vulnerable to urban expansion, with 5.88% of its coverage being transformed to built-up land; in other capitals, cropland and unused land will be the primary sources converted to built-up land. Under the CPSs, the urban expansion will be the slowest, whose majority will occur in the central urban areas. The difference between CPS and BDS is that the contiguous croplands encircling urban areas will be rarely occupied by urban expansion under the CPS. Croplands within the urban areas in Ashkhabad, Dushanbe, and Tashkent will be preserved. The EPSs of all regions show moderate urban expansion, which will lead to urban patterns similar to BDSs. Natural landscapes are forecasted to be well preserved under the EPSs, particularly in Nur Sultan, Ashkhabad, and Dushanbe. In Nur Sultan and Ashkhabad, increased grassland will be respectively concentrated in two regions—the watersides along Ishim River and the piedmont along Kopet-Dag Range. In Dushanbe, 6.3 km2 grassland is predicted to increase, with the northern mountain area absorbing 80% of the total amount.

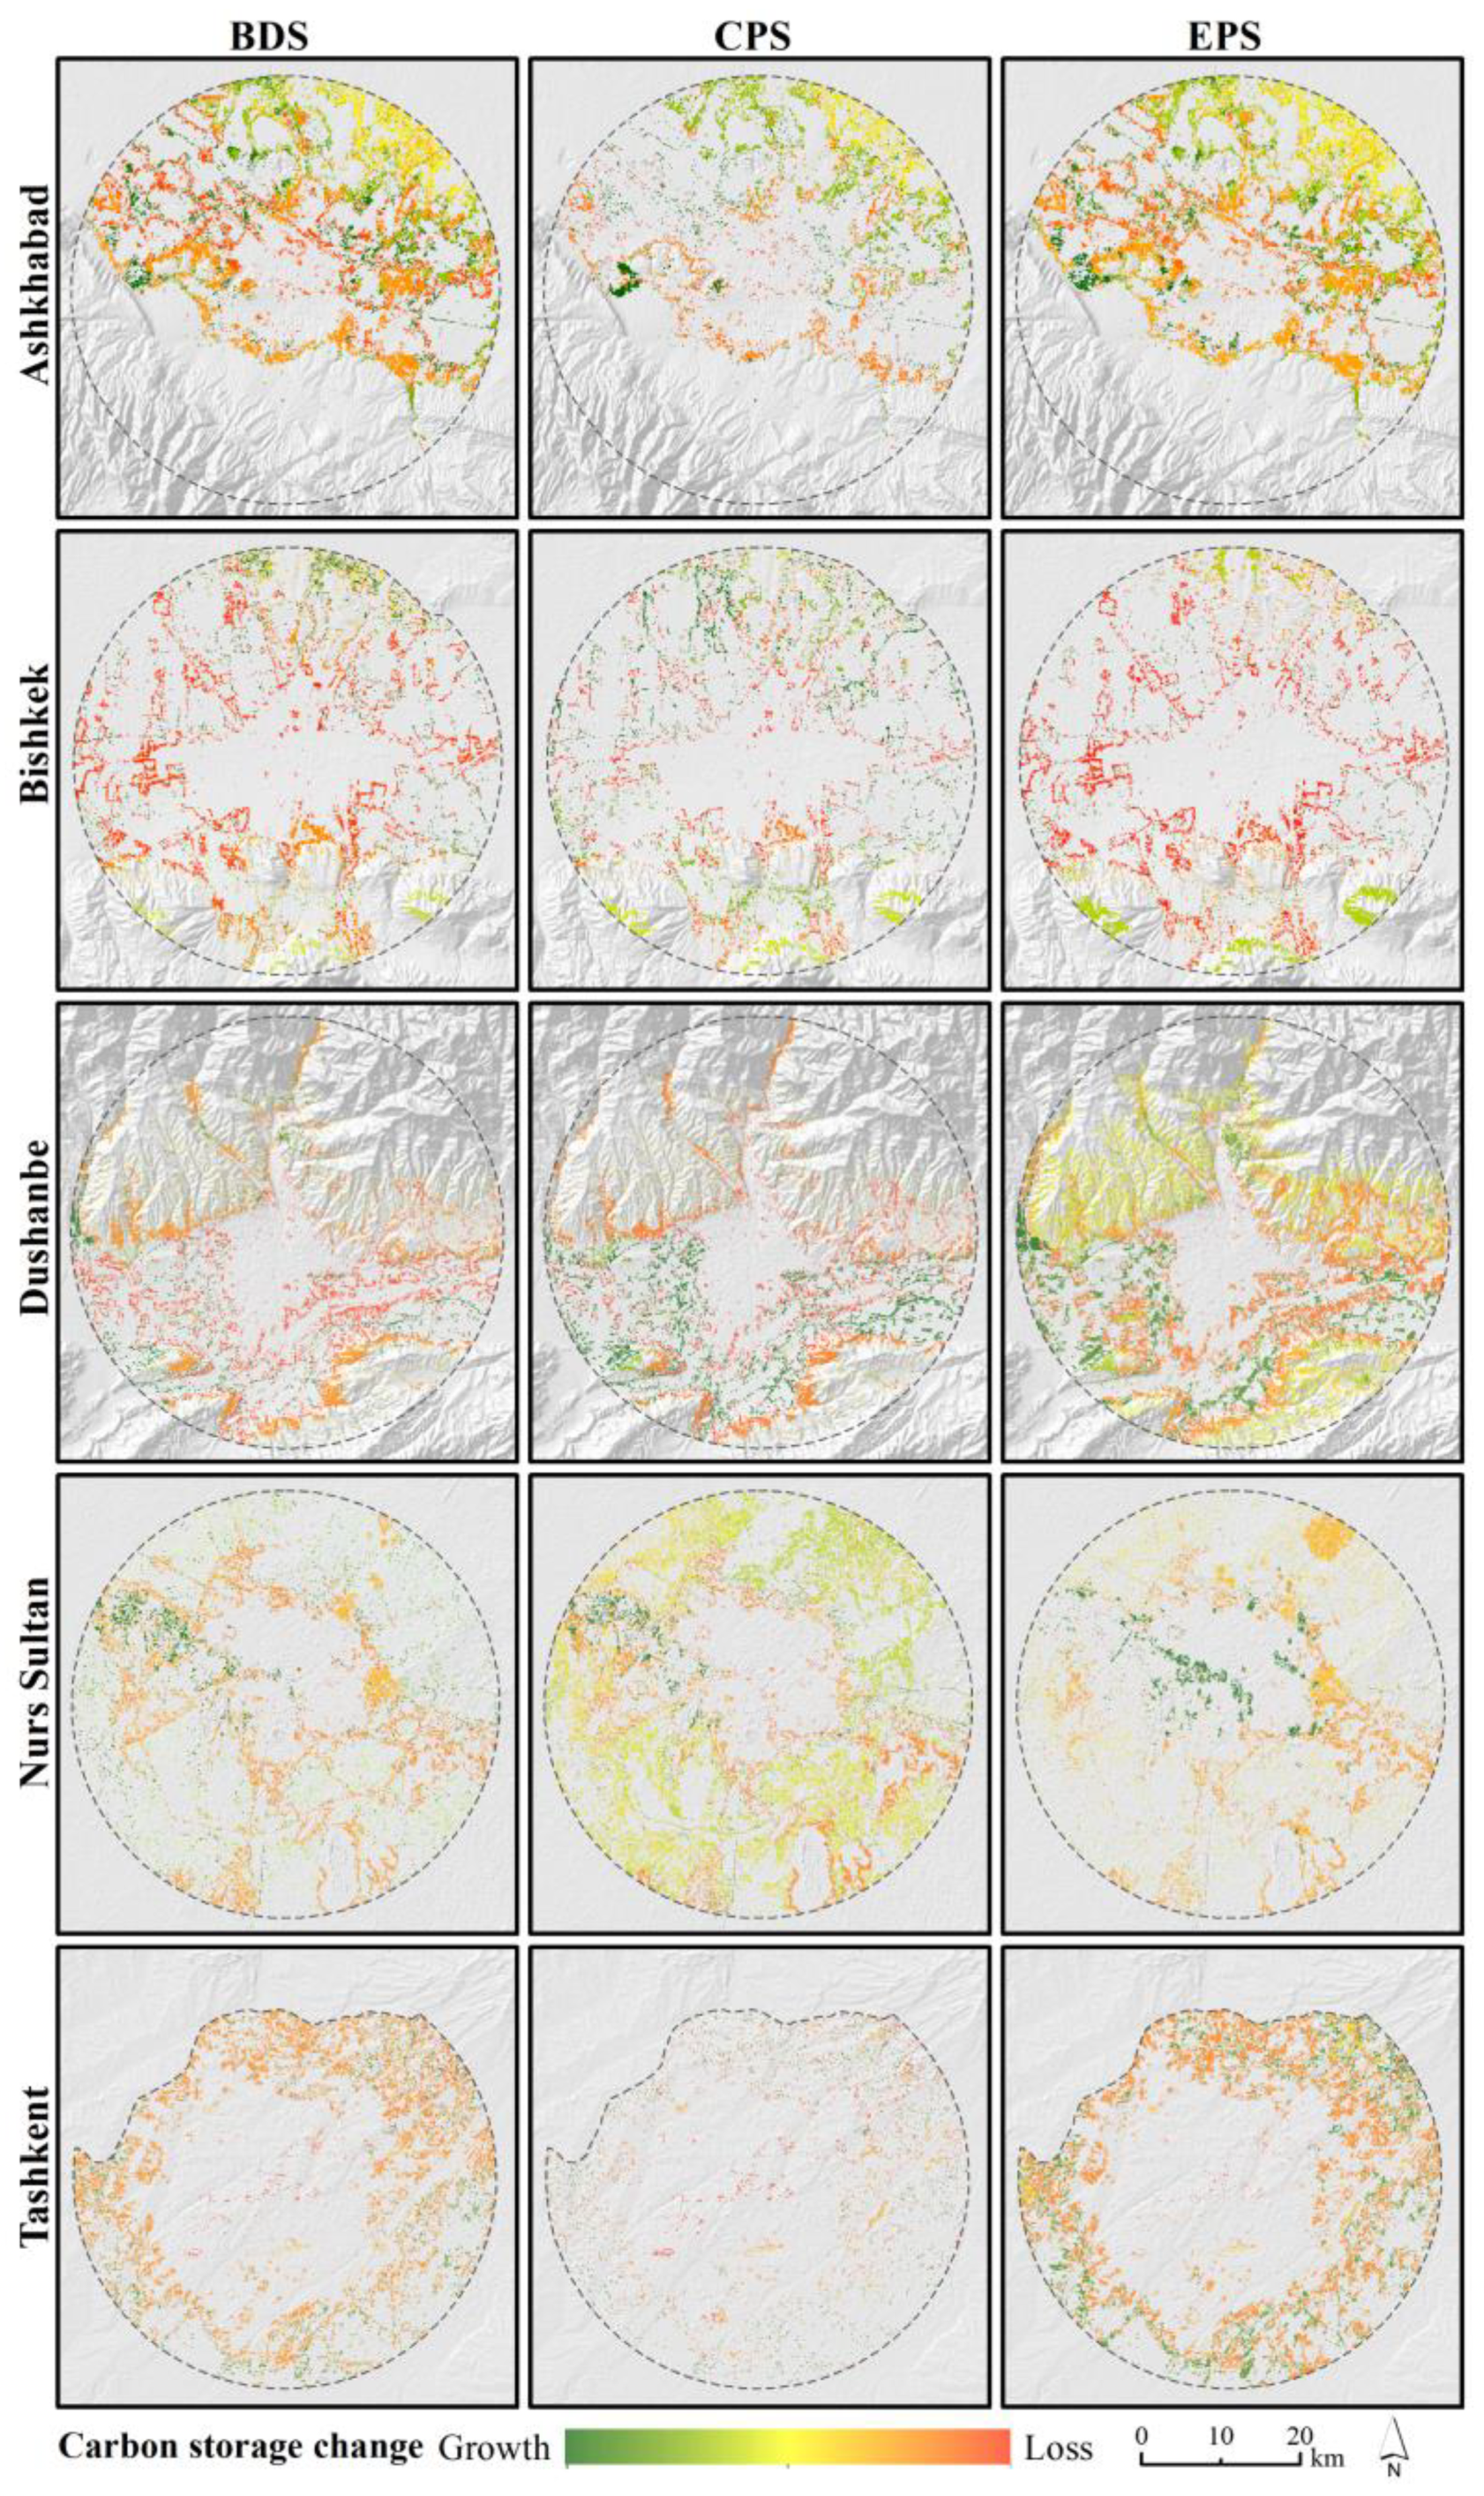
4.1.2. Carbon Storage Changes under Three Scenarios

The carbon storage changes of five capitals under three scenarios are shown in Table 3. Ashkhabad, Bishkek, Dushanbe, and Tashkent will experience a decreasing tendency of carbon storage under most scenarios. The carbon storage in Tashkent will decrease to 2.61 Tg, 3.29 Tg, and 2.96 Tg under the BDS, CPS, and EPS in 2029, respectively, with a total decline of 1.05 Tg, 0.37 Tg, and 0.7 Tg, respectively, indicating the lowest capacity for storing carbon and the largest carbon storage loss. Carbon storages in Bishkek and Dushanbe are predicted to decrease by 0.65 Tg and 0.52 Tg under the BDS, 0.16 Tg, and 0.16 Tg under the CPS, 0.5 Tg, and 0.17 Tg under the EPS, respectively. These results are in agreement with previously reported findings that future carbon storage is prone to decline [18,19,20,21]. On the contrary, Carbon storage in Nur Sultan manifests a growing tendency under all scenarios, with a growth of 0.01 Tg, 0.11 Tg, and 0.14 Tg under the BDS, CPS, and EPS, respectively. This result has rarely been described in previous literature. An explanation for the difference between Nur Sultan and previous literature is that carbon storage loss will be more than offset by carbon storage growth resulting from increased forest and cropland in Nur Sultan.
By comparing carbon storage change among three scenarios, we found that Ashkhabad, Bishkek, Dushanbe, and Tashkent will benefit more from the CPSs in carbon storage than BDSs and EPSs. Under the CPSs, Bishkek, Dushanbe, and Tashkent will have the largest amount of carbon storage, with the least carbon storage loss; Ashkhabad will experience carbon storage growth of 0.11 Tg. This finding differs from that of Jiang et al. [18], who found that larger carbon storage and less carbon storage loss will occur under the EPSs. However, EPS will be the most beneficial to Nur Sultan to store carbon, which accords with the observation of Jiang et al. [18]. The discrepancy can be explained by the different main sources for carbon storage between Nur Sultan and the other four cities. While forest and grassland are more responsible for carbon sequestration in Nur Sultan, cropland plays a crucial role in carbon sequestration in the other four cities. In this regard, carbon storage will be more preserved when forest/grassland and cropland are protected in Nur Sultan and the other four cities under CPSs and EPSs, respectively.

4.2. Impacts of Future Urban Expansion on Carbon Storage

As shown in Table 4 and Figure 4, BDSs, CPSs, and EPSs agree on the noticeable depletion of carbon storage that is triggered by urban expansion in Ashkhabad, Bishkek, Dushanbe, and Tashkent. It is estimated that urban expansion in four capitals will result in a decline of 0.73 Tg, 0.25 Tg, and 0.51 Tg carbon storage, at least under the BDS, CPS, and EPS, respectively. The ratios of carbon storage loss resulting from urban expansion to the total carbon storage loss are predicted to exceed 0.9 under most scenarios. Carbon storage in Tashkent will be particularly vulnerable to urban expansion, decreasing by 1.24 Tg, 0.45 Tg, and 1.26 Tg under the BDS, CPS, and EPS, respectively. Furthermore, the ratios of carbon storage loss induced by urban expansion to the total carbon storage growth in Bishkek, Dushanbe, and Tashkent will be more than 1.1 under all scenarios. These results indicate an evident negative impact of future urban expansion on carbon storage, which is also reported by Jiang et al. [18], Yang et al. [19], He et al. [20], and Zhang et al. [22].
Meanwhile, carbon storage in Nur Sultan will show relatively less loss under the influence of urban expansion. Carbon storage loss resulting from urban expansion under the BDS and EPS are predicted to be the smallest, with a decline of 0.55 Tg and 0.38 Tg, respectively. The ratios of carbon storage loss resulting from urban expansion to the total carbon storage loss/growth will be less than 0.65 under all scenarios. Such small ratios indicate an inapparent influence of urban expansion on carbon storage loss.

4.3. Drivers for Carbon Storage Impact of Land Use Change

Carbon storage changes in five Central Asian capitals result from three types of land-use change, which may be driven by the differentiated urban development modes in specific physical environments. The first type is the carbon storage loss that arose from the occupation of cropland by built-up land in Bishkek, Dushanbe, and Tashkent (Figure 5). The occupation of cropland by built-up land, mostly distribute surrounding the central urban areas (Figure 6), will lead to a loss of 48.5% carbon storage at least under the BDSs and EPSs in these three regions but also will result in 42.5% of carbon storage loss at least under the CPSs in Bishkek and Dushanbe. This finding accords with previous studies that the occupation of cropland by urban land plays a dominant role in carbon storage loss [17,20,22]. Such a result may be associated with the agriculture development in Bishkek, Dushanbe, and Tashkent as Central Asia entered agrarian society during the past centuries [25]. Bishkek, Dushanbe, and Tashkent are situated in the Chu River Basin, Gissar Basin, and Chirchik River Valley, respectively, where prosses flat grounds and fine soils for cropland reclamation. The well-known rivers, including Chu River Canal, Varzob River, Kafirnigan River, and Chirchik River, provide plenty of possibilities for agricultural irrigation. The agriculture-oriented development promotes wheat, corn, and cotton filed as prevalent landscapes, facilitating cropland to be the main source of carbon storage. The loss of cropland to urban land is thus equal to the loss of carbon storage. The phenomenon is evident in Tashkent. As the forest was massively occupied by urban land since the middle of the 20th century [55], cropland was left to be the sole primary source to store carbon. Unfortunately, the growth of Tashkent’s urban agglomeration, population, and industrial production results in increasingly limited cropland in the last decade. Currently, the government plans a New City in eastern Tashkent. The planning boosts the projects of economic cooperation and infrastructure construction in the BRI, such as building a financial center, which will occupy the surrounding cropland. It is thus no surprise that Tashkent has the lowest carbon sequestration and will experience the largest carbon storage loss among the five regions.
The second type is evident in Ashkhabad, whose carbon storage loss is triggered by the simultaneous loss of cropland and unused land to built-up land. In Ashkhabad, the conversion of cropland to built-up land will contribute to 51.23%, 18.58%, and 52.56% of carbon storage loss under the DBS, CPS, and EPS, respectively (Figure 5). Also, 55.88 km2, 29.7 km2, and 54.71 km2 of unused lands are forecasted to be developed as built-up land under the DBS, CPS, and EPS, resulting in 33.45%, 51.55%, and 32.54% of carbon storage loss, respectively. Carbon storage loss resulting from the transformation of unused land to built-up will be distributed along the piedmont along Kopet-Dag Range, and that resulting from the occupation of cropland by the urban expansion will mainly occur along the Karakum Canal and M37 Road (Figure 6). These unique characteristics of carbon storage loss and land-use change in Ashkhabad can be explained by the desert city development. The city is born with extensive deserts and barren mountains located in the join between the Karakum Desert and the Kopet-Dag Range. Its dry climate and infertile soils give rise to the unsuitability for most areas to develop crops, forests, and grasses. Barren land has thus long been the most dominated landscape in the region that was the main source of built-up land. However, the opening of the Karakum Canal in 1962 opened a new possibility for urban development. Agricultural irrigation and life demands were satisfied by the abundant water from the canal. In the urban fringe, both sides along the Karakum Canal were exploited as cropland, which nowadays was the other source to store carbon; Within the central city, both sides were evolved into prime locations for urban construction projects. Unfortunately, given the greater significant economic benefit of urban construction, the cropland along the Karakum Canal will be vulnerable to future urban growth.
The third type is typical in Nur Sultan, whose forest and cropland development lead to the enhancement of carbon storage. The increase of forest and cropland will contribute to a growth of 0.83 Tg, 0.85 Tg, and 0.87 Tg carbon storage under the BDS, CPS, and EPS, respectively, accounting for more than 95% of the total carbon storage growth. These growths will offset 95.9%, 100%, and 100% of the total carbon storage loss under BDS, CPS, and EPS, respectively. The carbon storage growth from forest development will be distributed in the western bogs and along the Ishim River, and that from cropland development will be mostly distributed in the city’s periphery (Figure 6). The possible explanations for the type in Nur Sultan are prioritized development of the central city and green development. Firstly, the priority of central city development prevents suburban development from occupying cropland. Since Nur Sultan was approved as the new capital of Kazakhstan in 1997, the city planned new government building projects and infrastructures along the south of the Ishim River, which was focused on developing the central city. The planned construction for the central city will be continued until 2030 [56]. Numerous projects from the BRI are primarily distributed in the central city, including light rail projects, ring road projects, water supply engineering, etc. As a result, the possibility of future growth is estimated to be higher as closer to the central city [57]. Inversely, towns and villages surrounding Nur Sultan are standing still since 1991 [56]. This prevents outer suburban from large-scale built-up land growth and thus preserves cropland. Secondly, green development is committed to developing forests and thus maintains the integrality of the carbon pool. Master Plan and Genplan, conducted by planners with the forestry department, exert positive impacts on preserving steppe and fostering forests [55]. For example, ongoing green space projects and afforestation projects are implemented to build green zone around populated areas, create forest lines along rivers, and foster green networks along roads; the sanitary and protected green zone of Nur Sultan is implemented, with an area of 30,000 ha [55]. So far, the green belt surrounding Nur Sultan is partially completed with an area of 65,000 ha, supposed to continue growing and contribute to an increase of carbon storage.

4.4. Implications for Future Urban Growth

Comparing carbon storage impacts of future urban expansion among five capitals under three scenarios can be useful for implementing an appropriate strategy in the BRI. Ashkhabad, Bishkek, Dushanbe, and Tashkent show similar trends in carbon storage loss in the future urban expansion, although distinct priorities about the BRI were considered in setting scenarios. Authorities, planners, and enterprises should be sensitive to the carbon storage impact of urban expansion in the BRI. Higher environmental standards, advanced energy technologies, and low-carbon incentives should be introduced in the BRI [33,35]. Meanwhile, it should be noted that the CPS tends to result in less carbon loss than the BDS and the EPS in most capitals (Table 3 and Table 4), indicating the good potential of the agriculture developmental strategies of the BRI for storing carbon in those four capitals. However, due to the best capacity of carbon storage in the EPS, emphasizing ecological governance in the BRI may be a better choice for carbon storage in Nur Sultan.
This study can also provide planning implications for future urban growth according to distinct characteristics and drivers for the carbon storage impact of land-use change. In the surroundings of Bishkek, Dushanbe, and Tashkent, only cropland is widely distributed; hence, cropland loss is playing a dominant role in the reduction of carbon storage. Authorities and planners should put a high priority on the balance between urban expansion and agricultural development when drawing up urban planning. In these regions, urban edge-growth will be the most likely way of future urban expansion (Figure 3). Under the circumstances, appropriate urban edge-growth by occupying cropland for future urbanization should be approved. Planning efforts should be put into limiting the suburban frog-leap growth that may consume cropland, to guarantee the carbon stock of cropland and prevent inefficient urban expansion at the utmost. Agricultural activities such as crop rotation, applying organic fertilizer, and addressing land degradation that may contribute to accumulating soil organic matters and vegetation biomass should be encouraged [58].
Nevertheless, the policy implications in Bishkek, Dushanbe, and Tashkent cannot be replicated by Ashkhabad due to the disparate physical environment among these regions. In Ashkhabad, barren land is the primary characteristic, with extensive coverage and less carbon density. The first goal to preserve carbon storage should be focused on simultaneously converting unused land to a built-up area and preventing the occupation of cropland, grassland, and water from urban expansion. The spacious unused land surrounding the city provides a deal of possibility for urban expansion, which can be preferentially included in future urban planning. Cropland and grassland along the Karakum canal, which take advantage of water resources, should be strictly occupied by future urban expansion. Meanwhile, considering the high cost of fostering vegetation for sand breaks, building new green infrastructures within urban areas is more feasible to enhance carbon sequestration.
In Nur Sultan, carbon storage will be immune to the adverse impacts of urban expansion in the next decade due to the extensive distribution of steppe, forest, and cropland. Therefore, urban growth will be the primary task for Nur Sultan, given that the planned construction of Nur Sultan is supposed to be completed in 2030. Nur Sultan should focus on progressive development in the central city since nearby towns are relatively underdeveloped. More attention should be paid to the concern about the trade-off between ecological protection and agricultural development. The great carbon storage of Nur Sultan is supported by high-quality ecological conditions. Thus, it is necessary to strictly protect carbon-rich natural landscapes, such as supporting ongoing green plans and prohibiting bog reclamation. Meanwhile, as the main source to produce food and support economic development for Nur Sultan, sufficient cropland for agricultural development is needed. Reclaiming steppe and unused land for cropland shall be allowable, due to it takes advantage of fertile soils but also preserves carbon density as high as steppe.

4.5. Uncertainties

Our study has several uncertainties. Firstly, the carbon density of built-up land still remains uncertain in the existing literature. While soil organic carbon density of built-up land in this study was defined as 0 according to Goldstein et al. [53] and Sallustio et al. [54], a certain value for that was determined through field surveys by Yan et al. [59]. When above-ground carbon density (81.3 Mg/ha) and soil organic carbon density (167.7 Mg/ha) of built-up land are taken into account according to Li et al. [26], carbon storage of five capitals will be above 13 Tg under all scenarios, being 6.5 Tg higher than current results at least (Table S5). Meanwhile, five capitals will experience carbon storage growth under three scenarios, with most above 0.5 Tg. Secondly, soil organic carbon density of unused land in deep soil is greater than that in topsoil. When soil organic carbon density (118.9 Mg/ha) of unused land is calculated in a depth of 3 m, according to Li et al. [26], carbon storage and carbon storage loss in Ashkhabad, Bishkek, and Dushanbe will be 1.5 Tg and 0.35 Tg more than current results at least under most scenarios, respectively. Nevertheless, these two values in Tashkent will be approximate to current results. To deal with the above uncertainties, it is necessary to combine field observations and related literature for determining carbon densities of built-up land and unused land.

5. Conclusions

Simulating the impacts of urban expansion on carbon storage was widely conducted across the globe. Nevertheless, while a plethora of literature focused on quantifying the impact of urban expansion on carbon storage, few attempts were made from a comparative perspective, particularly in Central Asian Republics. In this study, three scenarios—BDS, CPS, and EPS—according to the BRI experiences in Central Asian Republics were defined. The impacts of urban expansion on carbon storage in Central Asian capitals for 2029 under BDS, CPS, and EPS were assessed and compared. Furthermore, the drivers for the carbon storage impacts of future expansion from a perspective of urban development were analyzed.
The results show that urban edge-growth is likely to be prevailing in five capitals under all scenarios. Carbon storage in Nur Sultan shows an increasing tendency from 2019 to 2029 under three scenarios, which will preserve the most carbon storage under EPS. In contrast, Ashkhabad, Bishkek, Dushanbe, and Tashkent will experience a decrease in carbon storage from 2019 to 2029 and have the best capacity for preserving carbon storage under CPS. The urban expansion will result in above 0.9 of ratios to carbon storage loss under most scenarios, except in Nur Sultan. The carbon storage consequences of urban land-use change in five capitals are driven by the different urban development modes, including (1) agricultural development in Bishkek, Dushanbe, and Tashkent, (2) desert city development in Ashkhabad, and (3) prioritized the development of the central city and green development in Nur Sultan. Therefore, it is necessary to formulate appropriate urban growth strategies for different Central Asian capitals in the context of the BRI according to the different characteristics and drivers in carbon storage consequences of future urban expansion.

Supplementary Materials

The following are available online at https://www.mdpi.com/article/10.3390/land10060608/s1, Figure S1: The used training samples in interpreting land use in GEE, Table S1: Accuracy assessment of land use classification of five capitals in 2009, Table S2: Accuracy assessment of land use classification of five capitals in 2019, Table S3: The neighborhood weights for six land use types in five capitals, Table S4: Conversion cost matrix of land use pairs under three scenarios, Table S5: Two uncertainties in estimating carbon storage impacts of future land use change.

Author Contributions

Conceptualization, Y.C. (Yang Chen) and W.Y.; Data curation, Y.C. (Yang Chen); Formal analysis, Y.C. (Yang Chen), W.Y. and X.L.; Funding acquisition, W.Y.; Methodology, Y.C. (Yang Chen) and X.L.; Project administration, W.Y.; Resources, Y.C. (Yang Chen); Software, Y.C. (Yang Chen); Supervision, W.Y.; Validation, Y.C. (Yang Chen) and X.L.; Visualization, L.Z.; Writing—original draft, Y.C. (Yang Chen); Writing—review & editing, L.Z. and Y.C. (Ye’an Chen) All authors have read and agreed to the published version of the manuscript.

Funding

This research was funded by the Strategic Priority Research Program of Chinese Academy of Sciences, Pan-Third Pole Environment Study for a Green Silk Road (Pan-TPE) (XDA20040400) and Natural Science Foundation of Zhejiang Province (LQ20D010004).

Data Availability Statement

The data presented in this study are available on request from the author.

Conflicts of Interest

The authors declare no conflict of interest.

References

  1. Houghton, J.T.; Callander, B.A.; Varney, S.K. Climate Change 1992: The supplementary Report to the IPCC Scientific Assessment; Cambridge University Press: Cambridge, UK, 1992. [Google Scholar]
  2. The Intergovernmental Panel on Climate Change. Climate Change: The Scientific Basis; Cambridge University Press: Cambridge, UK, 2001. [Google Scholar]
  3. Aguilera, E.; Lassaletta, L.; Gattinger, A.; Gimeno, B.S. Managing soil carbon for climate change mitigation and adaptation in Mediterranean cropping systems: A meta-analysis. Agric. Ecosyst. Environ. 2013, 168, 25–36. [Google Scholar] [CrossRef]
  4. Smith, P.; Martino, D.; Cai, Z.; Gwary, D.; Janzen, H.; Kumar, P.; McCarl, B.; Ogle, S.; O’Mara, F.; Rice, C.; et al. Greenhouse gas mitigation in agriculture. Philos. Trans. R. Soc. B Biol. Sci. 2008, 363, 789–813. [Google Scholar] [CrossRef] [PubMed] [Green Version]
  5. Lal, R. Sequestration of atmospheric CO2 in global carbon pools. Energy Environ. Sci. 2008, 1, 86–100. [Google Scholar] [CrossRef]
  6. Lal, R. Soil carbon sequestration impacts on global climate change and food Security. Science 2004, 304, 1623–1627. [Google Scholar] [CrossRef] [PubMed] [Green Version]
  7. Lal, R. Global potential of soil carbon sequestration to mitigate the greenhouse effect. Crit. Rev. Plant Sci. 2003, 22, 151–184. [Google Scholar] [CrossRef]
  8. Powlson, D.S.; Whitmore, A.P.; Goulding, K.W.T. Soil carbon sequestration to mitigate climate change: A critical re-examination to identify the true and the false. Eur. J. Soil Sci. 2011, 62, 42–55. [Google Scholar] [CrossRef]
  9. Karl, T.R.; Trenberth, K.E. Modern global climate change. Science 2003, 302, 1719–1723. [Google Scholar] [CrossRef] [PubMed] [Green Version]
  10. Ren, Y.; Wei, X.; Wei, X.; Pan, J.; Xie, P.; Song, X.; Peng, D.; Zhao, J. Relationship between vegetation carbon storage and urbanization: A case study of Xiamen, China. For. Ecol. Manag. 2011, 261, 1214–1223. [Google Scholar] [CrossRef]
  11. Fang, J.; Chen, A.; Peng, C.; Zhao, S.; Ci, L. Changes in forest biomass carbon storage in China between 1949 and 1998. Science 2001, 292, 2320–2322. [Google Scholar] [CrossRef]
  12. Houghton, R.A. Temporal patterns of land-use change and carbon storage in China and tropical Asia. Sci. China 2002, 45 (Suppl. 1), 10–17. [Google Scholar] [CrossRef]
  13. Ostle, N.J.; Levy, P.E.; Evans, C.D.; Smith, P. UK land use and soil carbon sequestration. Land Use Policy 2009, 26, S274–S283. [Google Scholar] [CrossRef]
  14. Seto, K.C.; Guneralp, B.; Hutyra, L.R. Global forecasts of urban expansion to 2030 and direct impacts on biodiversity and carbon pools. Proc. Natl. Acad. Sci. USA 2012, 109, 16083–16088. [Google Scholar] [CrossRef] [Green Version]
  15. Eigenbrod, F.; Bell, V.A.; Davies, H.N.; Heinemeyer, A.; Armsworth, P.R.; Gaston, K.J. The impact of projected increases in urbanization on ecosystem services. Proc. R. Soc. B Boil. Sci. 2011, 278, 3201–3208. [Google Scholar] [CrossRef] [Green Version]
  16. Lawlera, J.J.; Lewisb, D.J.; Nelsonc, E.; Plantingad, A.J.; Polaskye, S.; Witheyf, J.C.; Helmersg, D.P.; Martinuzzig, S.; Penningtonh, D.; Radeloff, V.C. Projected land-use change impacts on ecosystem services in the United States. Proc. Natl. Acad. Sci. USA 2014, 111, 7492–7497. [Google Scholar] [CrossRef] [PubMed] [Green Version]
  17. Liu, X.; Wang, S.; Wu, P.; Feng, K.; Hubacek, K.; Li, X.; Sun, L. Impacts of urban expansion on terrestrial carbon storage in China. Environ. Sci. Technol. 2019, 53, 6834–6844. [Google Scholar] [CrossRef] [PubMed]
  18. Jiang, W.; Deng, Y.; Tang, Z.; Lei, X.; Chen, Z. Modelling the potential impacts of urban ecosystem changes on carbon storage under different scenarios by linking the CLUE-S and the InVEST models. Ecol. Model. 2017, 345, 30–40. [Google Scholar] [CrossRef]
  19. Yang, H.; Huang, J.; Liu, D. Linking climate change and socioeconomic development to urban land use simulation: Analysis of their concurrent effects on carbon storage. Appl. Geogr. 2020, 115, 102135. [Google Scholar] [CrossRef]
  20. He, C.; Zhang, D.; Huang, Q.; Zhao, Y. Assessing the potential impacts of urban expansion on regional carbon storage by linking the LUSD-urban and InVEST models. Environ. Model. Softw. 2016, 75, 44–58. [Google Scholar] [CrossRef]
  21. Shoemaker, D.A.; BenDor, T.K.; Meentemeyer, R.K. Anticipating trade-offs between urban patterns and ecosystem service production: Scenario analyses of sprawl alternatives for a rapidly urbanizing region. Comput. Environ. Urban Syst. 2019, 74, 114–125. [Google Scholar] [CrossRef]
  22. Zhang, D.; Huang, Q.; He, C.; Wu, J. Impacts of urban expansion on ecosystem services in the Beijing-Tianjin-Hebei urban agglomeration, China: A scenario analysis based on the Shared Socioeconomic Pathways. Resour. Conserv. Recycl. 2017, 125, 115–130. [Google Scholar] [CrossRef]
  23. Chen, Y.; Luo, G.; Maisupova, B.; Chen, X.; Mukanov, B.M.; Wu, M.; Mambetov, B.T.; Huang, J.; Li, C. Carbon budget from forest land use and management in Central Asia during 1961–2010. Agric. For. Meteorol. 2016, 221, 131–141. [Google Scholar] [CrossRef]
  24. Lal, R. Carbon sequestration in soils of central Asia. Land Degrad. Dev. 2004, 15, 563–572. [Google Scholar] [CrossRef]
  25. Chuluun, T.; Ojima, D. Land use change and carbon cycle in arid and semi-arid lands of East and Central Asia. Sci. China 2002, 45 (Suppl. 1), 48–54. [Google Scholar] [CrossRef]
  26. Li, C.; Zhang, C.; Luo, G.; Chen, X.; Maisupova, B.; Madaminov, A.A.; Han, Q.; Djenbaev, B.M. Carbon stock and its responses to climate change in Central Asia. Glob. Chang. Biol. 2015, 21, 1951–1967. [Google Scholar] [CrossRef]
  27. Conant, R.T.; Paustian, K.; Elliott, E.T. Grassland management and conversion into grassland effects on soil carbon. Ecol. Appl. 2001, 11, 343–355. [Google Scholar]
  28. Sommer, R.; de Pauw, E. Organic carbon in soils of Central Asia-status quo and potentials for sequestration. Plant Soil 2010, 338, 273–288. [Google Scholar] [CrossRef]
  29. United Nations. World Population Prospects. 2019. Available online: https://population.un.org/wpp/ (accessed on 10 December 2019).
  30. Huang, Y. Environmental risks and opportunities for countries along the Belt and Road: Location choice of China’s investment. J. Clean. Prod. 2019, 211, 14–26. [Google Scholar] [CrossRef]
  31. Hoh, A. China’s Belt and Road Initiative in Central Asia and the Middle East. Dig. Middle East Stud. 2019, 28, 241–276. [Google Scholar] [CrossRef]
  32. Williams, J.; Robinson, C.; Bouzarovski, S. China’s Belt and Road Initiative and the emerging geographies of global urbanisation. Geogr. J. 2020, 186, 128–140. [Google Scholar] [CrossRef]
  33. Zhang, N.; Liu, Z.; Zheng, X.; Xue, J. Carbon footprint of China’s Belt and Road. Nature 2017, 357, 1107. [Google Scholar] [CrossRef] [PubMed]
  34. Ascensão, F.; Fahrig, L.; Clevenger, A.P.; Corlett, R.T.; Jaeger, J.A.G.; Laurance, W.F.; Pereira, H.M. Environmental challenges for the Belt and Road Initiative. Nat. Sustain. 2018, 1, 206–209. [Google Scholar] [CrossRef]
  35. Tracy, E.F.; Shvarts, E.; Simonov, E.; Babenko, M. China’s new Eurasian ambitions: The environmental risks of the Silk Road Economic Belt. Eurasian Geogr. Econ. 2017, 58, 56–88. [Google Scholar] [CrossRef] [Green Version]
  36. Fang, K.; Wang, S.; He, J.; Song, J.; Fang, C.; Jia, X. Mapping the environmental footprints of nations partnering the Belt and Road Initiative. Resour. Conserv. Recycl. 2021, 164, 105068. [Google Scholar] [CrossRef]
  37. Sun, X.; Crittenden, J.C.; Li, F.; Lu, Z.; Dou, X. Urban expansion simulation and the spatio-temporal changes of ecosystem services, a case study in Atlanta Metropolitan area, USA. Sci. Total Environ. 2018, 622–623, 974–987. [Google Scholar] [CrossRef]
  38. Lioubimtseva, E.; Cole, R.; Adams, J.M.; Kapustin, G. Impacts of climate and land-cover changes in arid lands of Central Asia. J. Arid. Environ. 2005, 62, 285–308. [Google Scholar] [CrossRef]
  39. Chen, X.; Bai, J.; Li, X.; Luo, G.; Li, J.; Li, B.L. Changes in land use/land cover and ecosystem services in Central Asia during 1990–2009. Curr. Opin. Environ. Sustain. 2013, 5, 116–127. [Google Scholar] [CrossRef]
  40. Gorelick, N.; Hancher, M.; Dixon, M.; Ilyushchenko, S.; Thau, D.; Moore, R. Google Earth Engine: Planetary-scale geospatial analysis for everyone. Remote Sens. Environ. 2017, 202, 18–27. [Google Scholar] [CrossRef]
  41. Chen, F.; Zhang, M.; Tian, B.; Li, Z. Extraction of glacial lake outlines in Tibet Plateau using Landsat 8 imagery and Google Earth Engine. IEEE J. Sel. Top. Appl. Earth Obs. Remote Sens. 2017, 10, 4002–4009. [Google Scholar] [CrossRef]
  42. Arsanjani, J.J.; Helbich, M.; Kainz, W.; Boloorani, A.D. Integration of logistic regression, Markov chain and cellular automata models to simulate urban expansion. Int. J. Appl. Earth Obs. Geoinf. 2013, 21, 265–275. [Google Scholar] [CrossRef]
  43. Hu, Y.; Zheng, Y.; Zheng, X. Simulation of land-use scenarios for Beijing using CLUE-S and Markov composite models. Chin. Geogr. Sci. 2013, 23, 92–100. [Google Scholar] [CrossRef]
  44. Kindu, M.; Schneider, T.; Dollerer, M.; Teketay, D.; Knoke, T. Scenario modelling of land use/land cover changes in Munessa-Shashemene landscape of the Ethiopian highlands. Sci. Total Environ. 2018, 622–623, 534–546. [Google Scholar] [CrossRef]
  45. Chotchaiwong, P.; Wijitkosum, S. Predicting urban expansion and urban land use changes in Nakhon Ratchasima City using a CA-Markov model under two different scenarios. Land 2019, 8, 140. [Google Scholar] [CrossRef] [Green Version]
  46. Liang, X.; Liu, X.; Li, X.; Chen, Y.; Tian, H.; Yao, Y. Delineating multi-scenario urban growth boundaries with a CA-based FLUS model and morphological method. Landsc. Urban Plan. 2018, 177, 47–63. [Google Scholar] [CrossRef]
  47. Liu, X.; Liang, X.; Li, X.; Xu, X.; Ou, J.; Chen, Y.; Li, S.; Wang, S.; Pei, F. A future land use simulation model (FLUS) for simulating multiple land use scenarios by coupling human and natural effects. Landsc. Urban Plan. 2017, 168, 94–116. [Google Scholar] [CrossRef]
  48. Lin, Y.-P.; Chu, H.-J.; Wu, C.-F.; Verburg, P.H. Predictive ability of logistic regression, auto-logistic regression and neural network models in empirical land-use change modeling—A case study. Int. J. Geogr. Inf. Sci. 2011, 25, 65–87. [Google Scholar] [CrossRef] [Green Version]
  49. Chen, Y.; Li, X.; Liu, X.; Zhang, Y.; Huang, M. Tele-connecting China’s future urban growth to impacts on ecosystem services under the shared socioeconomic pathways. Sci. Total Environ. 2019, 652, 765–779. [Google Scholar] [CrossRef]
  50. Batjes, N.H. Total carbon and nitrogen in the soils of the world. Eur. J. Soil Sci. 1996, 47, 151–163. [Google Scholar] [CrossRef]
  51. Zaehle, S.; Bondeau, A.; Carter, T.R.; Cramer, W.; Erhard, M.; Prentice, I.C.; Reginster, I.; Rounsevell, M.D.A.; Sitch, S.; Smith, B.; et al. Projected changes in terrestrial carbon storage in Europe under climate and land-use change, 1990–2100. Ecosystems 2007, 10, 380–401. [Google Scholar] [CrossRef]
  52. Janssens, I.A.; Freibauer, A.; Ciais, P.; Smith, P.; Nabuurs, G.-J.; Folberth, G.; Schlamadinger, B.; Hutjes, R.W.A.; Ceulemans, R.; Schulze, E.-D.; et al. Europe’s terrestrial biosphere absorbs 7 to 12% of European anthropogenic CO2 emissions. Science 2003, 300, 1538–1542. [Google Scholar] [CrossRef] [PubMed] [Green Version]
  53. Goldstein, J.H.; Caldarone, G.; Duarte, T.K.; Ennaanay, D.; Hannahs, N.; Mendoza, G.; Polasky, S.; Wolny, S.; Daily, G.C. Integrating ecosystem-service tradeoffs into land-use decisions. Proc. Natl. Acad. Sci. USA 2012, 109, 7565–7570. [Google Scholar] [CrossRef] [PubMed] [Green Version]
  54. Sallustio, L.; Quatrini, V.; Geneletti, D.; Corona, P.; Marchetti, M. Assessing land take by urban development and its impact on carbon storage: Findings from two case studies in Italy. Environ. Impact Assess. Rev. 2015, 54, 80–90. [Google Scholar] [CrossRef] [Green Version]
  55. Åkerlund, U.; Knuth, K.; Barfoed, T.R.; Schipperijn, J. Urban and Peri-Urban Forestry and Greening in West and Central Asia: Experiences, Constraints and Prospects; FOA Forestry Department: Rome, Italy, 2005; pp. 1–63. [Google Scholar]
  56. Yacher, L. Astana, Kazakhstan: Megadream, megacity, megadestiny? In Engineering Earth; Brunn, S.D., Ed.; Springer: Dordrecht, The Netherlands, 2011. [Google Scholar]
  57. Ilyassova, A.; Kantakumar, L.N.; Boyd, D. Urban growth analysis and simulations using cellular automata and geo informatics: Comparison between Almaty and Astana in Kazakhstan. Geocarto Int. 2021, 36, 520–539. [Google Scholar] [CrossRef]
  58. Chuai, X.; Yuan, Y.; Zhang, X.; Guo, X.; Zhang, X.; Xie, F.; Zhao, R.; Li, J. Multiangle land use-linked carbon balance examination in Nanjing City, China. Land Use Policy 2019, 84, 305–315. [Google Scholar] [CrossRef]
  59. Yan, Y.; Zhang, C.; Hu, Y.; Kuang, W. Urban land-cover change and its impact on the ecosystem carbon storage in a dryland city. Remote Sens. 2016, 8, 6. [Google Scholar] [CrossRef] [Green Version]
Figure 1. Locations of five Central Asian capitals.
Land 10 00608 g001
Figure 2. Schematic illustration of land use interpretation in GEE.
Land 10 00608 g002
Figure 3. Simulation for urban land use under three scenarios in 2029.
Land 10 00608 g003
Figure 4. The comparisons between carbon storage loss resulting from urban expansion and the total carbon storage loss/growth. Note: L and G refer to the ratio of carbon storage loss induced by urban expansion to the total carbon storage loss/growth, respectively.
Land 10 00608 g004
Figure 5. The percentages of carbon storage loss induced by land use change under three scenarios.
Land 10 00608 g005
Figure 6. The distribution of carbon storage changes under three scenarios. Note: unchanged carbon storage in the corresponding land type is set as colorless.
Land 10 00608 g006
Table 1. Descriptions of three scenarios.
ScenariosAssumptionsFuture Land Demands
BDSFollowing current trend of urban expansion without human interventionThe future land use will take place according to the land conversion probability of 2009–2019.
CPSPreventing urban expansion from occupying croplandCompared with the BDS, the conversion probabilities of cropland to built-up land and unused land decrease by 80% and 100%, respectively; the probabilities to the forest, grassland, and water decrease by 30%, respectively.
EPSEmphasizing urban expansion based on ecological protectionCompared with the BDS, the conversion probabilities of forest, grassland, and water to built-up land decrease by 80%; the probabilities to unused land decrease by 100%. Water was set as a restricted area for land conversion.
Table 2. Carbon densities of six land use types.
Land Use TypeAbove Ground Carbon (Mg/ha)Soil Organic Carbon (Mg/ha)
Built-up land00
Unused land8.741.6
Forest157.6280.3
Cropland4.877.1
Grassland555.2
Water00
Table 3. Carbon storage changes under three scenarios (Tg).
Capitals2019BDSCPSEPS
2029+/−2029+/−2029+/−
Ashkhabad5.905.65−0.256.010.115.82−0.08
Bishkek6.545.89−0.656.38−0.166.04−0.50
Dushanbe6.015.49−0.525.85−0.165.84−0.17
Nur Sultan7.327.330.017.430.117.460.14
Tashkent3.662.61−1.053.29−0.372.96−0.70
Table 4. The carbon storage losses resulting from urban expansion (Tg).
CapitalsBDSCPSEPS
Ashkhabad−0.75−0.25−0.75
Bishkek−0.74−0.31−0.51
Dushanbe−0.73−0.57−1.02
Nur Sultan−0.55−0.35−0.38
Tashkent−1.24−0.45−1.26
Publisher’s Note: MDPI stays neutral with regard to jurisdictional claims in published maps and institutional affiliations.

