Article

Groundwater-Extracting Rice Production in the Rejoso Watershed (Indonesia) Reducing Urban Water Availability: Characterisation and Intervention Priorities

by
Ni’matul Khasanah
1,*,
Lisa Tanika
1,2,
Lalu Deden Yuda Pratama
1,
Beria Leimona
1,
Endro Prasetiyo
1,
Fitri Marulani
1,
Adis Hendriatna
1,
Mukhammad Thoha Zulkarnain
1,
Alix Toulier
3,4,5 and
Meine van Noordwijk
1,6,7
1
World Agroforestry (ICRAF), Bogor 16001, Indonesia
2
Forest Ecology and Forest Management Group, Wageningen University & Research, 6708 PB Wageningen, The Netherlands
3
Institut de physique du globe de Paris, Université de Paris, CNRS, 75005 Paris, France
4
Laboratoire GéoSciences Réunion, Université de La Réunion, 97744 Saint Denis, France
5
HydroSciences Montpellier (HSM), Université Montpellier, IRD, CNR, 34090 Montpellier, France
6
Plant Production Systems, Wageningen University & Research, 6700 AK Wageningen, The Netherlands
7
Study Group Agroforestry, Faculty of Agriculture, Brawijaya University, Malang 65145, Indonesia
*
Author to whom correspondence should be addressed.
Land 2021, 10(6), 586; https://doi.org/10.3390/land10060586
Submission received: 8 April 2021 / Revised: 19 May 2021 / Accepted: 26 May 2021 / Published: 1 June 2021
(This article belongs to the Special Issue Agroforestry-Based Ecosystem Services)

Abstract

:
Production landscapes depend on, but also affect, ecosystem services. In the Rejoso watershed (East Java, Indonesia), uncontrolled groundwater use for paddies reduces flow of lowland pressure-driven artesian springs that supply drinking water to urban stakeholders. Analysis of the water balance suggested that the decline by about 30% in spring discharge in the past decades is attributed for 47 and 53%, respectively, to upland degradation and lowland groundwater abstraction. Consequently, current spring restoration efforts support upland agroforestry development while aiming to reduce lowland groundwater wasting. To clarify spatial and social targeting of lowland interventions five clusters (replicable patterns) of lowland paddy farming were distinguished from spatial data on, among other factors, reliance on river versus artesian wells delivering groundwater, use of crop rotation, rice yield, fertiliser rates and intensity of rodent control. A survey of farming households (461 respondents), complemented and verified through in-depth interviews and group discussions, identified opportunities for interventions and associated risks. Changes in artesian well design, allowing outflow control, can support water-saving, sustainable paddy cultivation methods. With rodents as a major yield-reducing factor, solutions likely depend on more synchronized planting calendars and thus on collective action for effectiveness at scale. Interventions based on this design are currently tested.

1. Introduction

Ecosystem services are defined as benefits people obtain from ecosystems [1], directly as goods or indirectly as regulating, cultural, and supporting services dependent on well-functioning ecosystems [2]. There is growing evidence of significant adverse impacts from landscape degradation due to land use/cover changes, population growth, and anthropogenic pressures, aggravated by the impacts of global climate change, for example increasing variability of rainfall [3]. These issues deserve attention at the global, regional, and national levels; sustainable landscape management is needed, encompassing both upland and lowland issues, to combat landscape degradation and strengthen the resilience of communities to climate change.
Sustainable landscape management typically implies the application of a landscape-scale approach, which has increasingly been recognised as an opportunity to minimize negative trade-offs and reconcile conservation, agriculture, and rural-to-urban livelihoods [4,5]. A ‘landscape(-scale) approach’ emphasises stakeholder engagement, including smallholder perspectives on the achievement of multiple objectives: maintaining ecosystem services and goods while improving livelihoods and addressing ‘development deficits’. It also implies integrated assessment of upland–lowland relations and flexible implementation [6]. Several landscape management schemes have been introduced to combat landscape degradation and to strengthen the resilience of communities, such as through ecosystem services co-investment schemes [7]. However, such schemes are still in the pilot stage and usually end when external support is withdrawn. Thus, ‘upscaling’ technologies and sustainability of interventions is indispensable. Internalization of externalities has to include the establishment of new norms of behaviour, beyond economic incentives in the initial phase. Building on the mixed success of ‘scaling up’ technologies that were successful in the locations where they were developed, but not as good elsewhere, Sinclair and Coe [8] identified the need for an ‘option by context’ approach to addressing the variability of social, economic, and ecological issues across geographies for research and development which involves smallholder farmers. Representing the context to characterize variability of farmer’s practices in managing the land that is needed to operationalise the evaluation of options.
In the context of production landscapes, agriculture both depends on ‘upstream’ ecosystem services and influences (often negatively) services for stakeholders further ‘downstream’ [9]. For water-related services, the up- and downstream terminology can be taken literally [10] (i.e., as a spatial geographical location), in other services, it is used as a metaphor (i.e., upland as the supplier of ecosystem services, while lowland as the beneficiaries of such services). Land cover type and land use management, including the status of property rights [11] in the upland and lowland determine the quantity and quality of the ecosystem services generated and utilized in the landscape. Water availability that is naturally based on a flow from the uplands to adjacent lowlands, is influenced by the capacity of the watershed to filter and buffer the flows [12,13] in different parts of a landscape. Landscape managers have both legal and perceived rights to modify these flows, such as by abstracting water that may reduce extractable surface and groundwater flows. This activity may affect the water supply further down in the landscape, which at the end will raise complex issues of legal and perceived water rights of the lowland communities. Thus, the understanding of the hydrological relations, is fundamental to disentangle the social interactions and find solutions that manage conflicts and adverse trade-offs. The interactions between farmer practices and ecological subsystems need to be quantitatively understood to manage the overall resource in a fair and efficient way [14]. The scale of the overall resource availability and use needs to be connected to that of farmer decisions, i.e., access rights and appropriation, and that of collective action, essential for reliable solutions and interventions.
The Rejoso watershed in the Pasuruan District, East Java Province (Indonesia) has experienced progressive deforestation on the higher slopes of Mount Bromo-Tengger, land use/cover changes across all elevations, and unsustainable farming practices due to rapid population growth and anthropogenic pressures [15]. In combination, these changes have affected the watershed’s function of maintaining ecosystem goods and services, including impact on the quality and quantity of water resources, i.e., depleting the water flows, increasing risks of droughts and floods, soil erosion, and landslides according to local stakeholders [15]. In addition, the government is implementing a national project to pipe the water from the Rejoso watershed, i.e., from the Umbulan artesian spring to supply the adjacent districts and cities, including the metropole of Surabaya, the 2nd largest city of Indonesia and East Java capital. Artesian conditions develop where the hydraulic head (pressure) from a confined aquifer is higher than the topographic surface, allowing the free flow of groundwater through artesian springs (and/or wells) [16]. There are both similarities and differences with the well-documented agricultural over-use of groundwater in India, where a reduction of the energy subsidy for pumps provides at least some incentives for farmers to only use pumps when needed [17]. The simplest forms or artesian wells flow 24 hours per day and 365 days per year.
Figure 1 illustrates the upper (>1000 m a.s.l), middle (100–1000 m a.s.l) and lower (<100 m a.s.l) zones of the Rejoso watershed supplying surface flows (rivers) and groundwater flows (aquifers). Artesian conditions develop in the lowland zone, where a mostly impermeable layer inherited from volcanic processes covers and confines the underlying aquifer (water-rock reservoir). The current data shows that the discharge of the Umbulan spring has been decreased from about 5000 L/s in 1980 to 3500 L/s in 2020, with a continuous trend towards further decline [18]. The attribution of this decrease across the upper, middle and lower zone has triggered debates (e.g., climate change affecting all zones vs. local anthropogenic impact) that led to the current research. In the decline of 1500 L/s, lowland flowing artesian wells and reduced recharge of aquifer by reduced upper and middle zone infiltration both may play a role. Sustainable landscape management in the Rejoso watershed will depend on appropriate incentives, rules and motivation across all zones, based on a detailed diagnosis and co-investment by stakeholders [15,19].
Through diagnostic studies, broad stakeholder participation and consultations with government agencies, proposals were formulated for performance based-payment schemes. These include managing tree and grass strips in horticultural farming systems in the upland part, increasing tree density and building of infiltration/sediment capture pits in the agroforestry farming systems of midstream smallholders [16]. Activities here target increased soil infiltration rates for groundwater recharge, control of soil erosion and increased on-site sedimentation. According to a study in the upper part of the Rejoso catchment [20], increasing tree canopy cover to values >55% in the upland and >80% in the midstream (highest rainfall elevation) qualified as ‘infiltration-friendly’ land use in the watershed, respectively, and can be expected to reduce runoff below 15% of rainfall. Groundwater recharge depends mainly on the balance between precipitation, evapotranspiration and runoff in each zone, but is also influenced by the seasons (wet and dry) [16].
In the lowland area, the Pasuruan district used to be a major sugarcane producer with good surface irrigation infrastructure, hosting since 1887 the national sugarcane research institute. However, since the last decades, most of the land has been converted to paddy fields, using additional groundwater resources mostly from flowing artesian wells (Figure 1B). In this zone, reported problems include diminishing areas of fertile soil for farming (rather than for urban expansion), high intensity of pest and diseases, and low paddy productivity indicate unsustainable agricultural practices. Furthermore, intensive use of groundwater to irrigate the paddy fields decreases the aquifer pressure and then the water productivity of artesian wells and springs as the sources of agriculture and domestic water for local communities [16]. Hence, better water management in irrigated areas is one of the targets for improved landscape-wide ecosystem services from a lowland, urban water user perspective. Five crucial root causes of unsustainable agricultural in Rejoso watershed have been identified [17] as unsynchronised planting calendars, inefficient use of groundwater, high chemical inputs, imbalanced fertiliser application, and conventional, suboptimal planting patterns. The average rice yield at the district and province level is about 5.8 ton per ha [21], which is lower than in other provinces, i.e., Bali and Central Java. East Java Province is the second largest (with about 19%) contributor to national paddy production, with 3% of national level produced in Pasuruan District [22]. Therefore, addressing the issues by introducing sustainable paddy cultivation (i.e., optimal use of chemical fertiliser, application of biopesticide, improved water management regimes and planting pattern) to increase productivity while reducing environmental impacts is essential. Current agricultural practices lead to high methane (CH4) and nitrous oxide (N2O) emissions, high intensity of pest and diseases and low agricultural yield. Water-saving techniques are expected to be financially and environmentally beneficial to smallholders by enhancing their resilience to shocks and improving the capacity of the production landscape to generate ecosystem services [23]. Nevertheless, introducing sustainable paddy cultivation beyond the current, conventional practices is a challenge, as behavioural changes and biophysical conditions vary.
Understanding the variability of farmer’s practices in managing the land and cultivating paddy is, therefore, considered as an initial step towards pilot actions for the lowland zone with the potential to scale up sustainable paddy cultivation. To contextualize current practices and propose ‘options by context’ as restoration solutions, we thus needed a detailed characterisation of paddy farming and possible spatial patterns in cropping intensity and use of river versus groundwater for irrigation. By triangulation of quantitative spatial data analysis, qualitative insights from the participation of local farmers, communities, and government agencies, and a targeted, quantitative household survey, we hoped to understand the rationale(s) of farmers for considering and choosing specific practices. Scenarios for improved resource management at landscape scale require identification of the main sustainability risks and local perspectives, at the scale required for impacts to be noticeable. Our analysis of catchment-level water balance, patterns of land and water use, and specific practices used in paddy farming tried to answer questions at three levels:
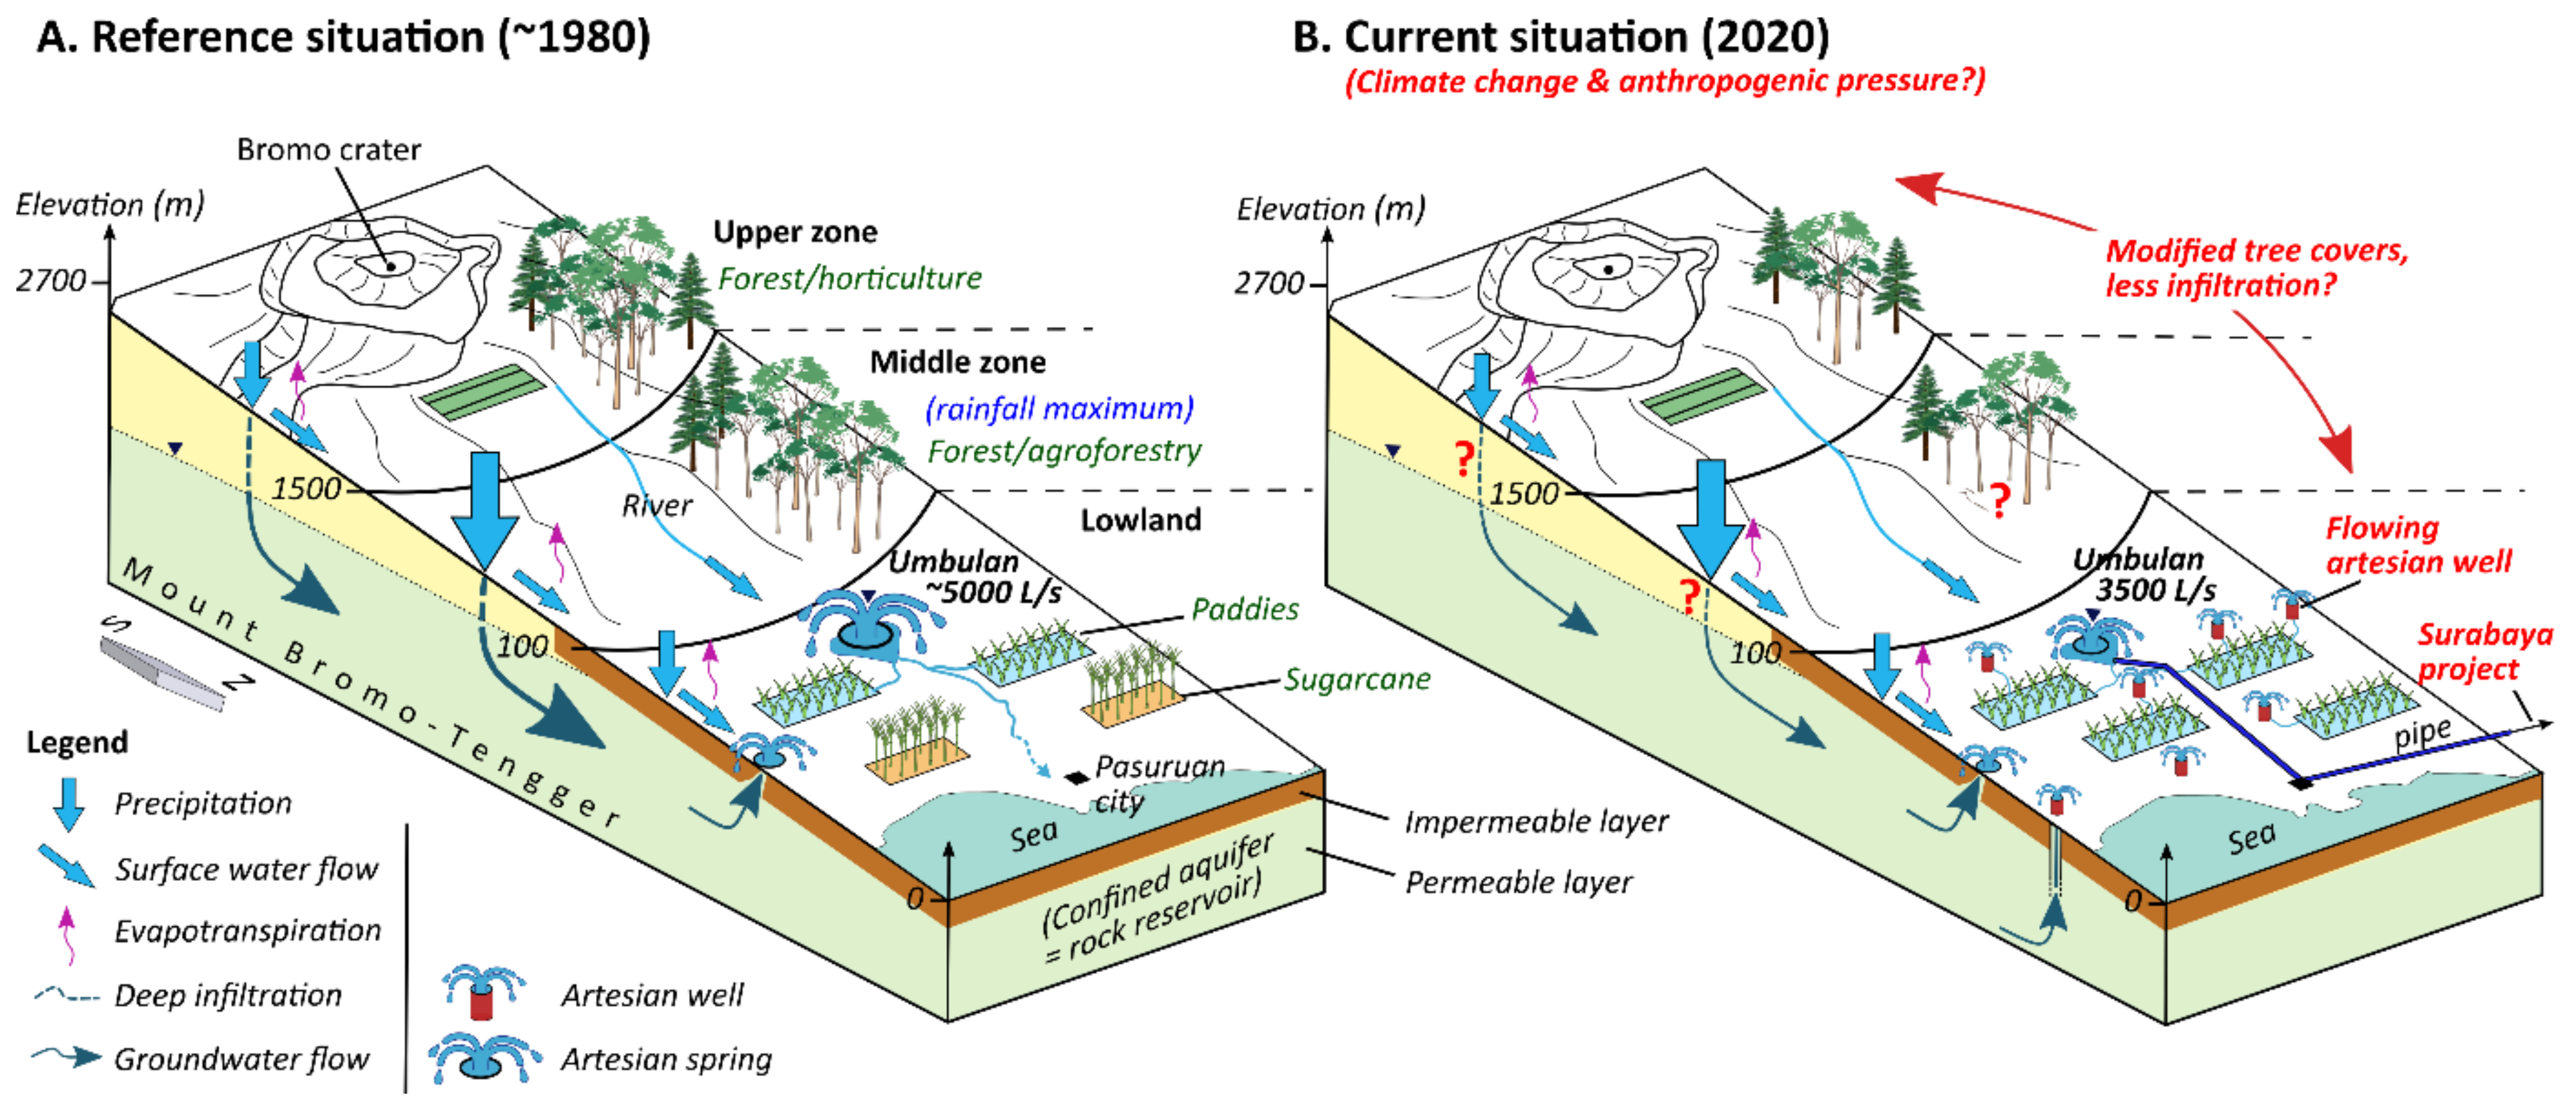
  • Is there quantitative evidence that the lowland practices are co-responsible for the decrease of the Umbulan spring’s discharge?
  • Is there relevant geographic variation between villages and hamlets in the farmers’ practices in managing land and water in cultivating paddy?
  • Can a participatory survey of paddy cultivation and spatial data analysis for the development of characteristics identify options by context for upscaling sustainable paddy cultivation?
We expected that the combined use of quantitative and qualitative methods, together with the participatory approach used in this study, would enable a subsequent scaling-up phase that is salient, credible, and legitimate for all segments of the community at village and district levels.

2. Site Description and Methodology

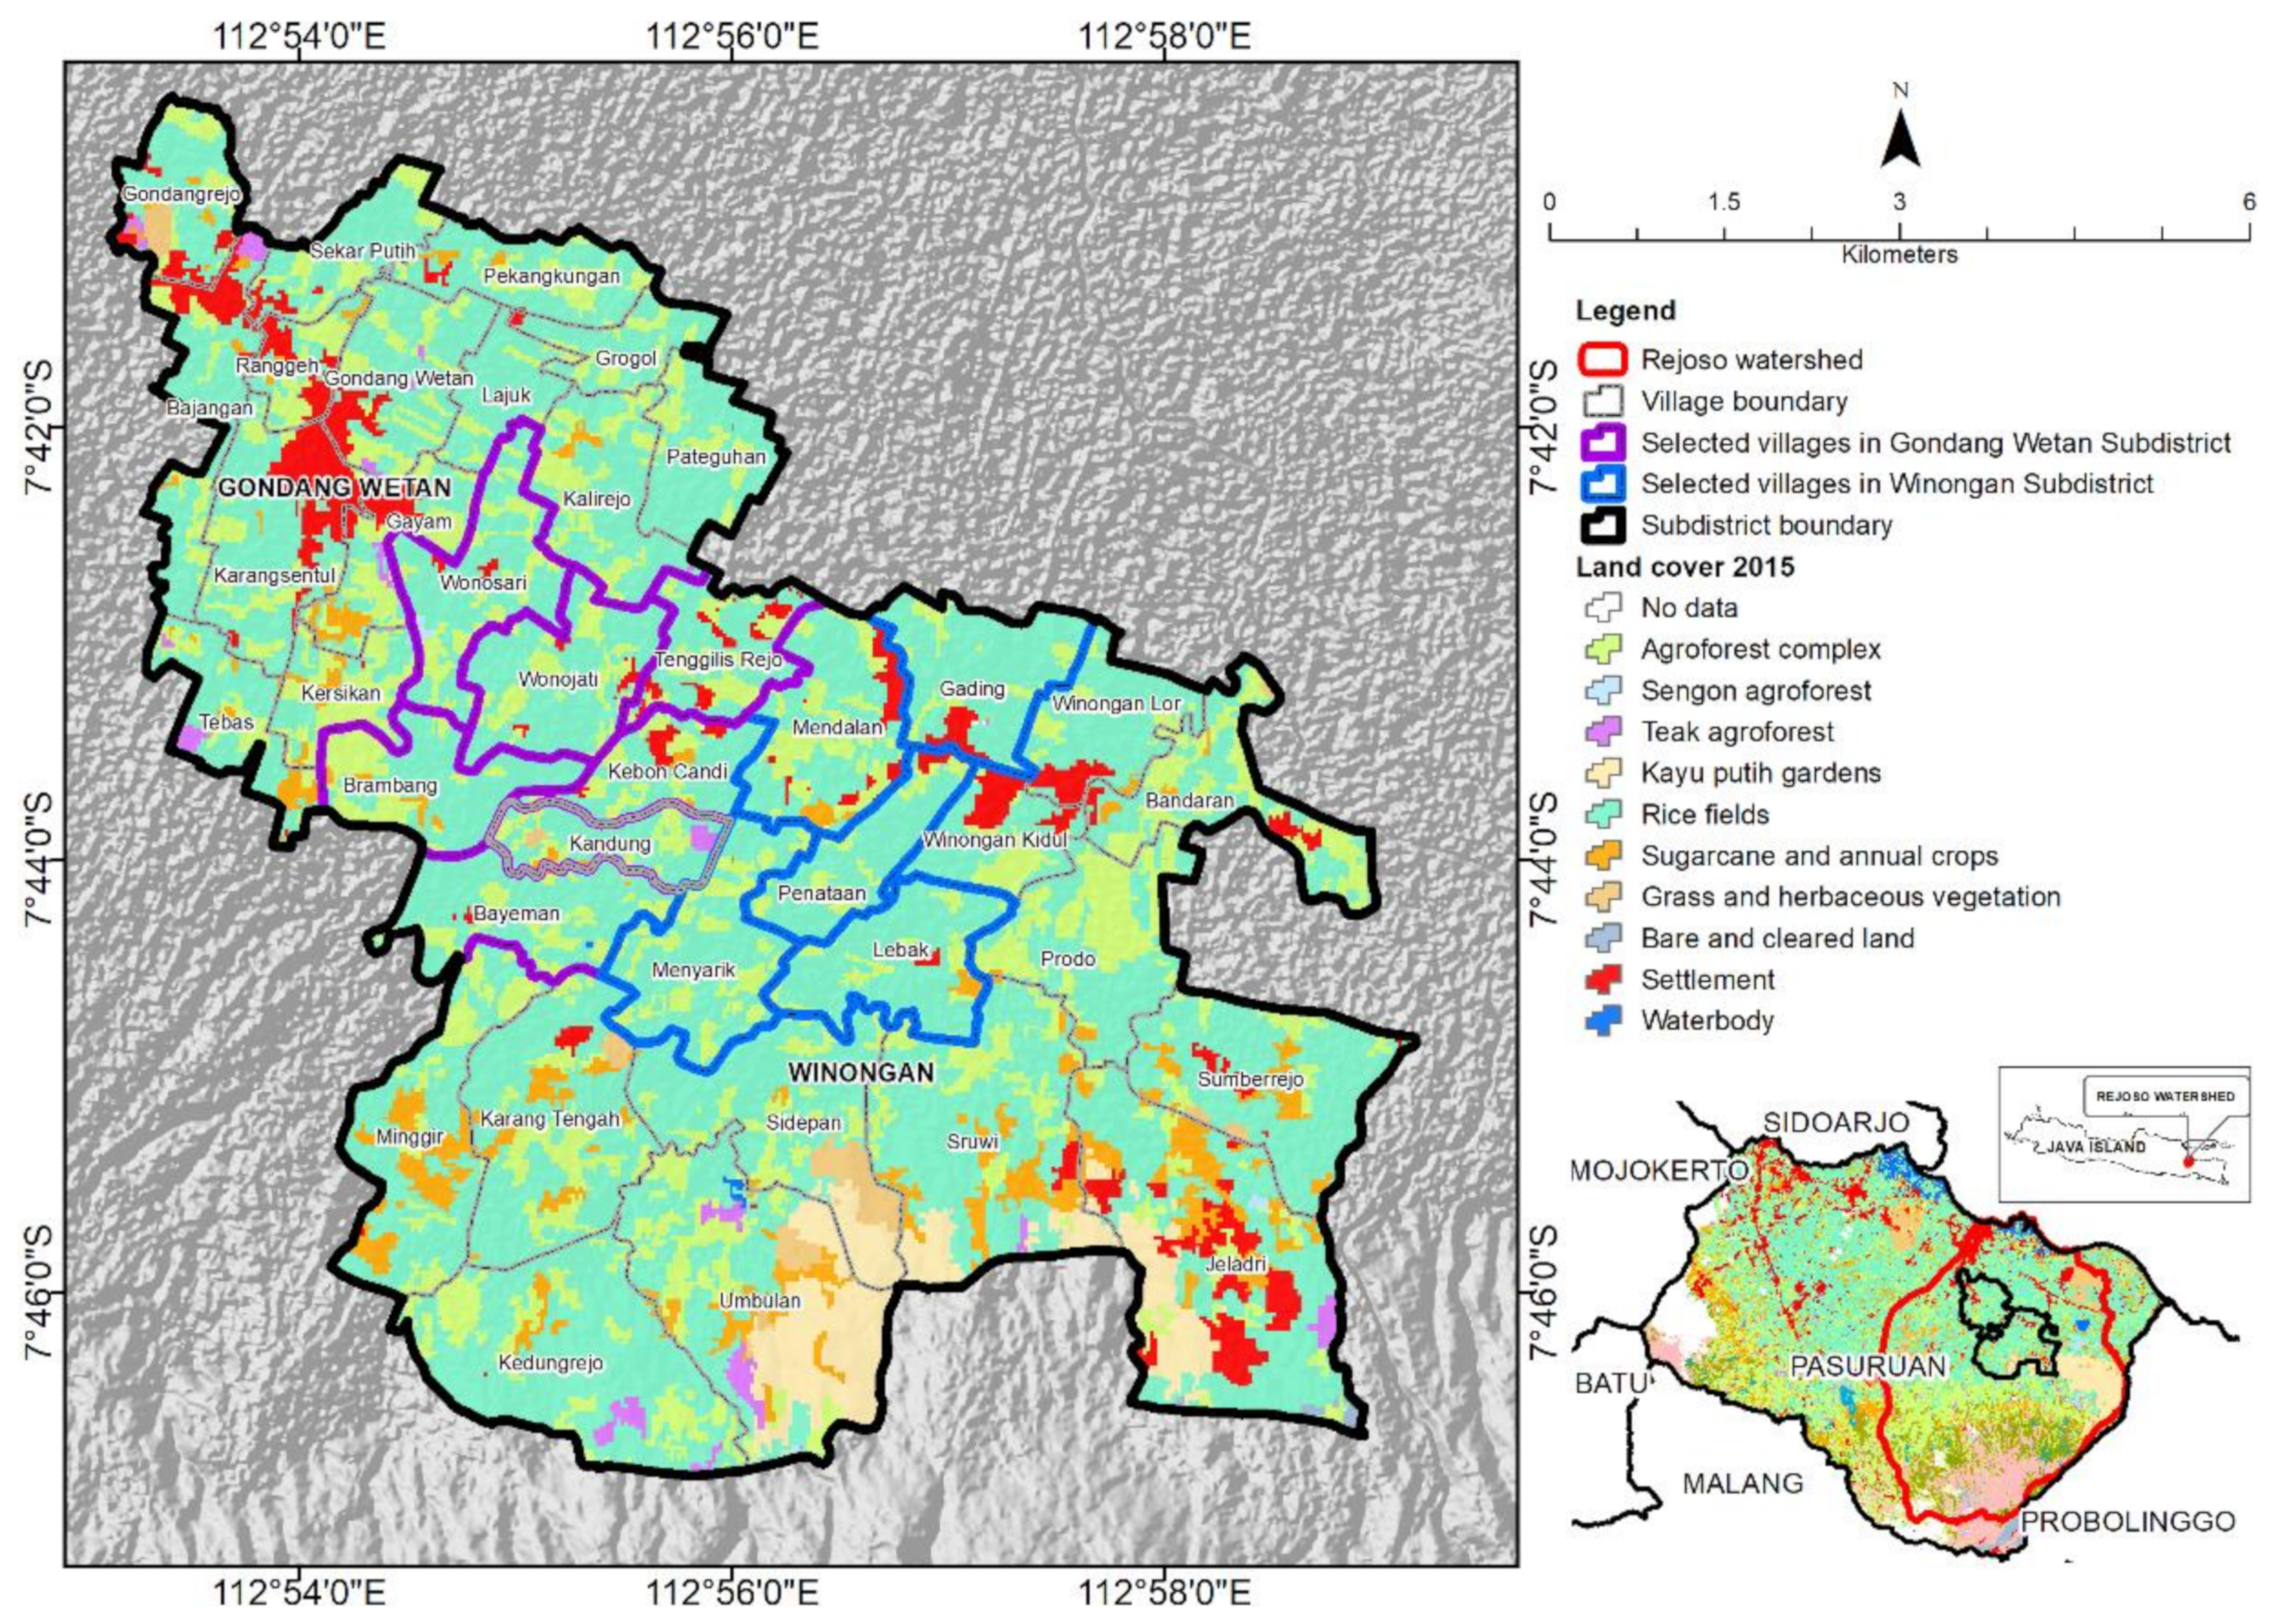
2.1. The Rejoso Watershed

The Rejoso watershed has an area of 62,773 ha based on the boundaries set by the Watershed Management Agency (BPDAS). It covers 17 sub-districts: Bugul Kidul, Gading Rejo, Gondang Wetan, Grati, Kejayan, Kraton, Lekok, Lumbang, Nguling, Pasrepan, Pohjentrek, Purworejo, Puspo, Rejoso, Tosari, Tutur, and Winongan, on the lower, middle and upper slopes of Mount Bromo-Tengger, East Java, Indonesia. The artesian spring Umbulan is located in the lowland part of the watershed (Winongan sub-district).
Paddy fields and sugarcane plantations are dominant land covers in the lowland area, complex agroforest dominates in the mid-stream area, and horticulture and pine plantation are mostly found in the upland area of the watershed [15]. Inceptisols are the dominant soil type in the upland, midstream to the lowland area; a small area of Entisols is found in the lowland area.
Complementing studies in the middle and higher zones, our study developed a characteristic of paddy farming for the lowland area of the watershed, specifically, in the eleven villages of two sub-districts (Figure 2), Winongan (4,341 ha) and Gondang Wetan (2,692 ha) sub-districts (07°42′30–07°43′30″ NL and 112°54′30–112°57′0″ LE). The two sub-districts were selected based on parameters: the (high) number of artesian wells as one of the main sources to irrigate paddy fields, (high) area of paddy fields, and (low) yield. Artesian wells, flowing twenty-four hours per day are a specificity of the volcanic study area as the hydrogeology is represented by a shallow artesian basin.

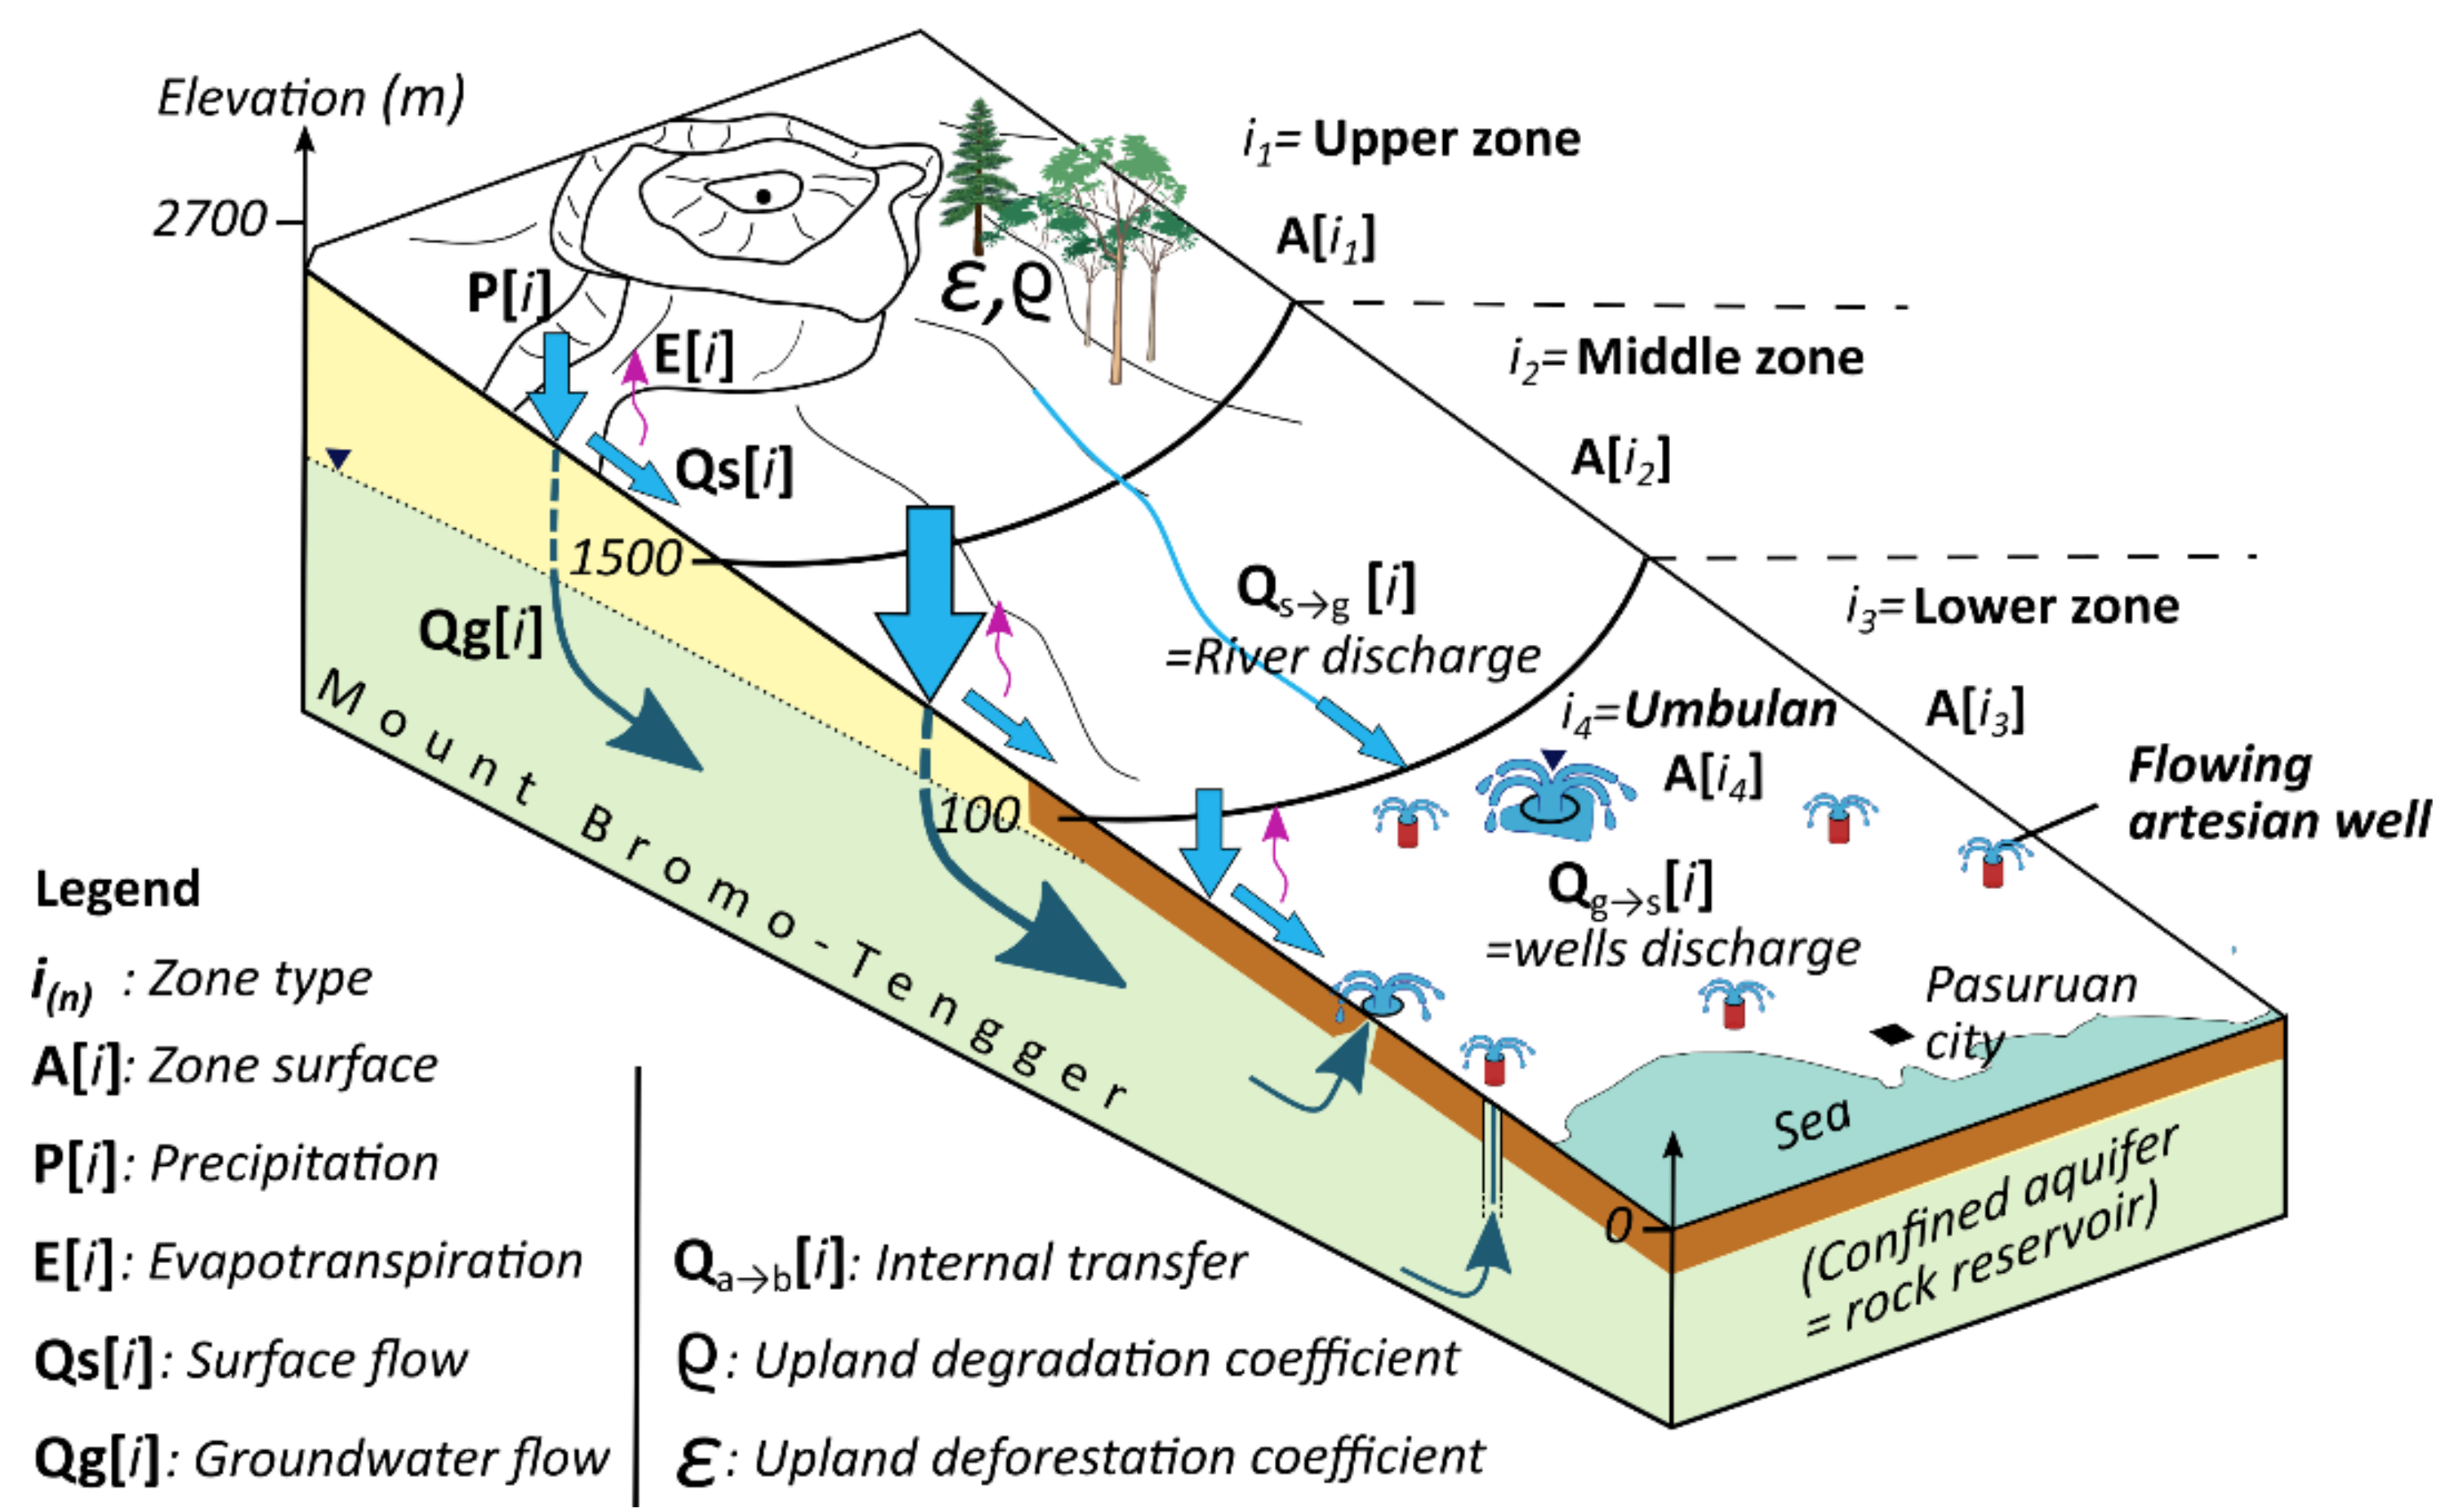
2.2. Annual Water Balance Model of Rejoso Watershed

A simple water balance has at the minimum to include precipitation (P), evapotranspiration (E), and runoff (river flow; Qs), with changes in soil moisture storage potentially negligible at annual time steps (Figure 3). Evapotranspiration can be expressed as a vegetation-dependent fraction ε of the climate-driven potential value Epot and be further constrained by the fraction of P that infiltrates into the soil. Runoff can be estimated as an infiltration-limited (or Hortonian) fraction ρ of P, plus a saturation-excess amount max (0; P (1 − ρ) − ε Epot). This is an alternative (first used in [24]) to the commonly used Fuh–Budyko equation, which tends to underestimate discharge under low rainfall conditions.
For the current analysis, a distinction is needed between surface flows (QS) and groundwater flows (QG) based on three possible transfers between surface and groundwater: deep infiltration (as fraction of water infiltrated, and reducing the saturation-excess river flow), seepage of water already on the river, and the resurfacing of groundwater in springs and wells. The annual water balance model (assuming no change in storage terms, expressed per unit area) linked four zones i (n = 1 to 4), respectively, labelled Upper, Middle, Lower, and Umbulan spring zone (with areas A[i] in (km²)), and computed as follows:
QSoutflow[i] + QGoutflow[i] = P[i] − E[i] + Qsinflow [i] + QGinflow [i]
with as inputs for each zone i,
P[i] = precipitation (mm/y),
Qsinflow [i] = incoming surface flow (river) corrected for the relative areas of adjacent zones, defined as (A[i − 1]/A[i]) × QS[i − 1]) (mm/y),
QGinflow [i] = incoming groundwater flow corrected for the relative areas of adjacent zones, defined as (A[i − 1]/A[i]) × QG[i − 1]) (mm/y),
and as outputs:
E[i] = evapotranspiration defined as ε[i] × Epot[i] with the Eact/Epot ratio ε[i] dependent on tree cover and crop type (mm/y),
QSoutflow[i] = outgoing surface flow (river) (mm/y),
QGoutflow[i] = outgoing groundwater flow (mm/y),
and as internal transfers from groundwater to surface water or vice versa:
QG[i] = A[i − 1]/A[i]) × QG[i − 1] − QGS[i] + QSG[i]
In such a framework, we can represent “upland deforestation” as a decrease in ε and “upland degradation” as an increase in ρ. The shift from upland crops to paddy in the lowland as an increase in ε, plus wells that transfer ground to surface water. Estimates of the net transfers from surface to groundwater flows Qs→g[i] in the Upper and Middle zone were based on measured river discharge at the transition from Middle to Lower zone. Estimates of the net transfers from groundwater to surface flows Qg→s[i] in the Lower zone was derived from measured artesian well distribution and flow rates (Figure 4).
After parameterizing this simple model (Appendix A), we compared five scenarios: (A) a historical reference scenario, (B) upland degradation, (C) lowland conversion to paddy with uncontrolled artesian wells, (D) combining the changes of (B + C, E) a restoration scenario with agroforestry in upper and middle zones and reduced groundwater use in the lowland paddy zone (Table 1).

2.3. Selected Villages for the Lowland Characteristic

The selection of the villages was based on the number of artesian wells, area of paddy fields and its yield, number of low-income families, and number of families with members of the family as farm labour. The eleven villages were Wonosari, Wonojati, Tenggilis Rejo, Kebon Candi, Brambang and Bayeman in Gondang Wetan Sub-district, and Gading, Mendalan, Penataan, Menyarik, and Lebak in Winongan Sub-district (Figure 2). Based on data of fourteen rainfall stations, the mean annual rainfall is approximately 1350 mm with relative humidity ranges from 68% to 83%. The rainfall is distributed with a peak in January and a dry season in August, and the annual mean of maximum and minimum air temperatures are 20 °C and 34 °C, respectively.

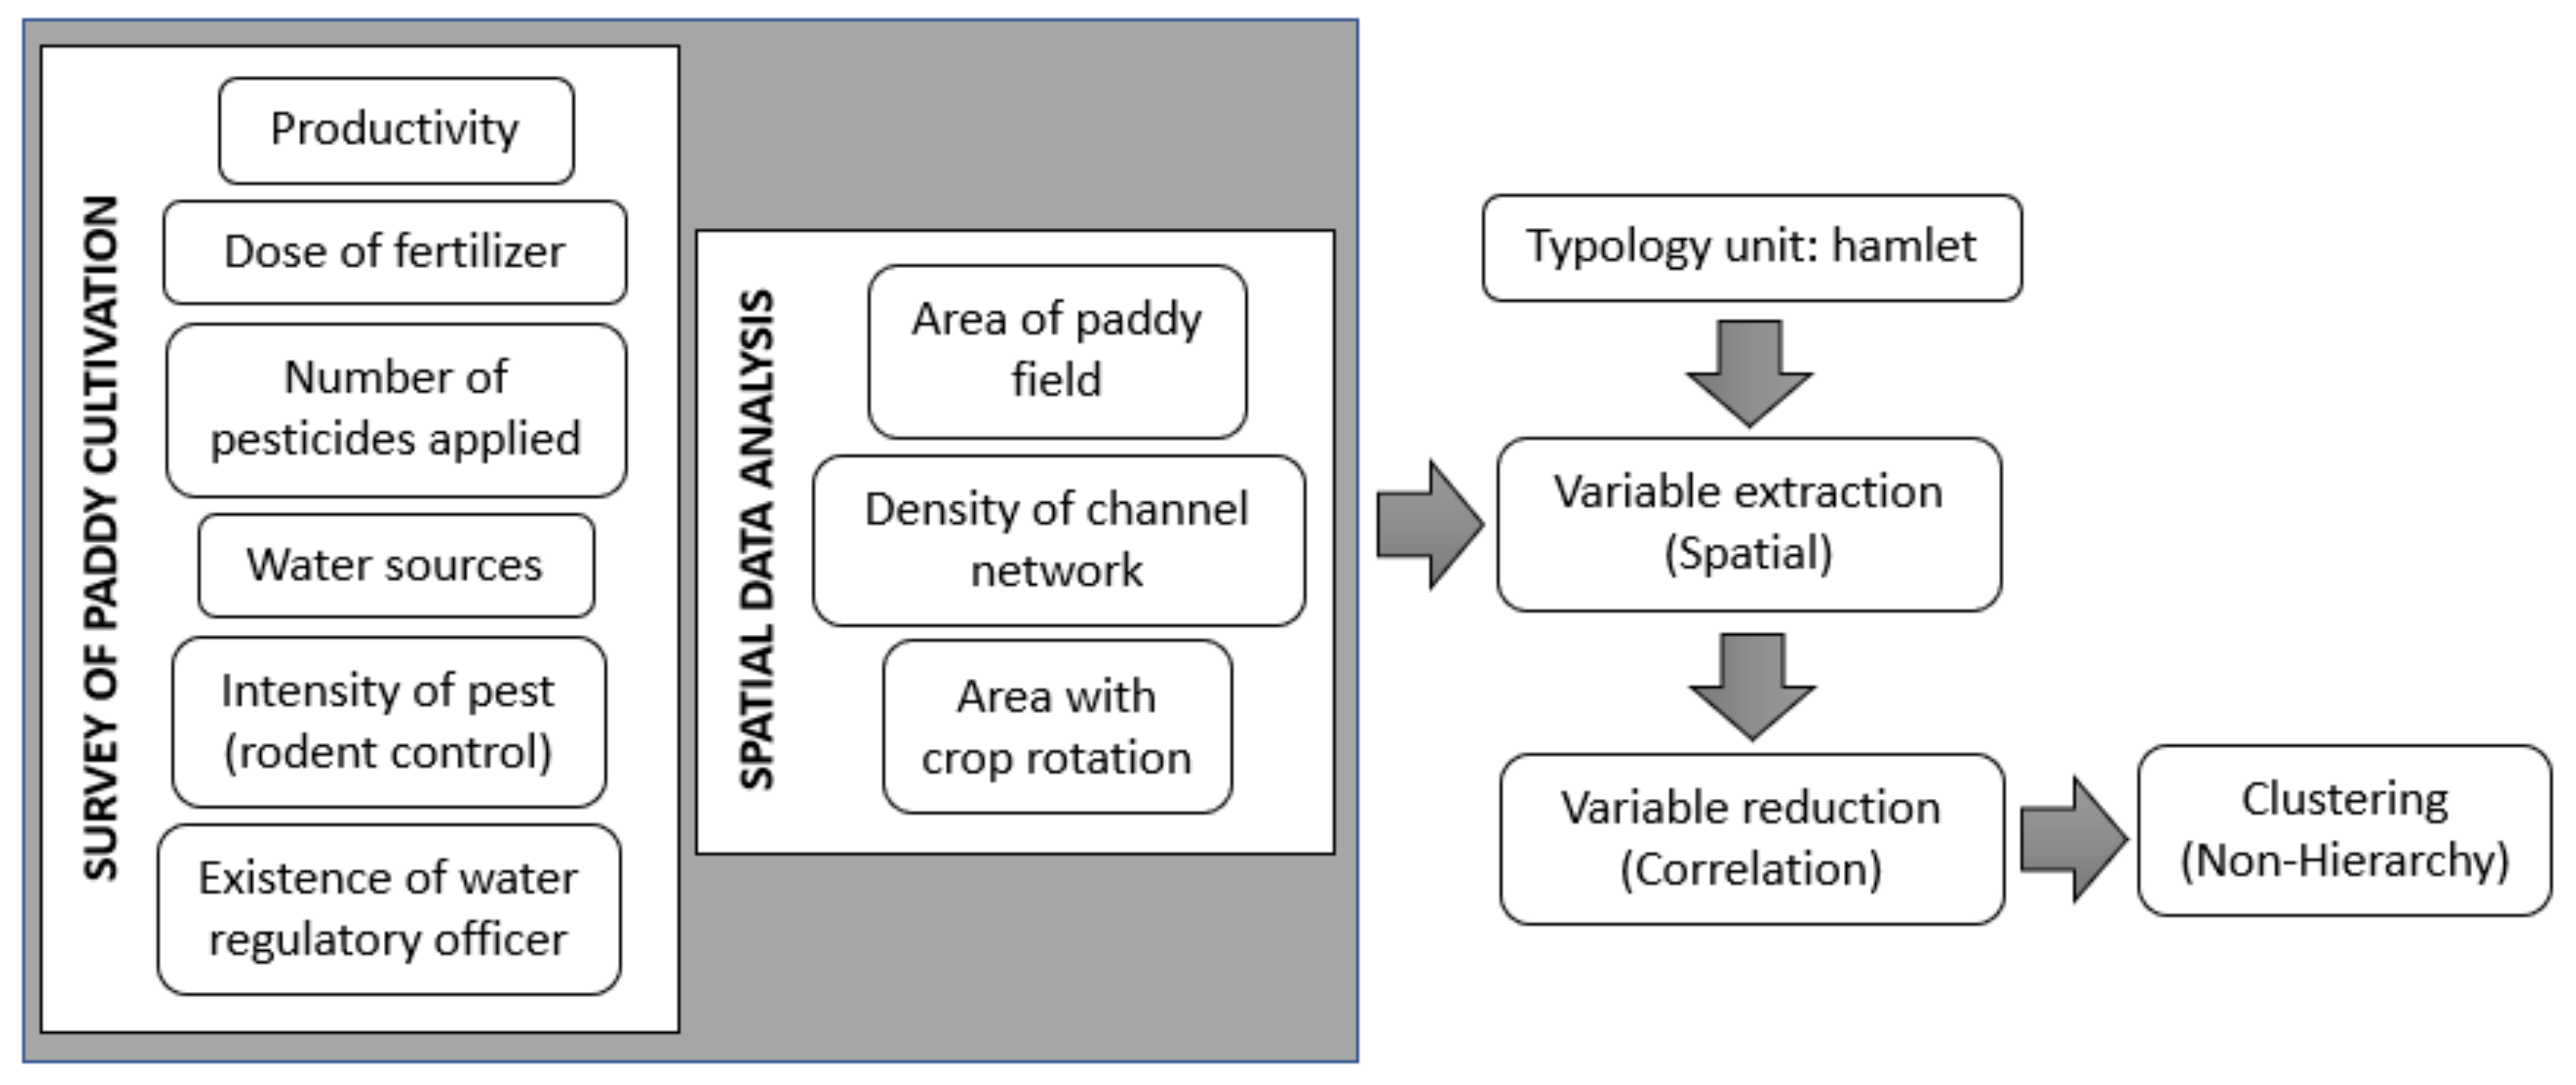
2.4. Development of Paddy Farming Characteristic

Figure 5 presents the flow of development of paddy farming characteristic. The development of paddy farming characteristic used the cluster analysis approach. A cluster analysis is a process of grouping a set of parameters in such a way that parameters in the same group (a cluster) are more similar to each other than to those in other groups. Twelve parameters were collected through spatial data analysis and survey of paddy cultivation that both were verified through a participatory process reflecting the variability of the paddy field, farmers characteristics and their cultivation practices in the lowland area of the Rejoso watershed. These parameters were (1) area of paddy fields, (2) density of the channel network, (3) fraction of area with crop rotation, (4) intensity of pest (rodents), (5) rice yield, (6) dose of urea (46% N) fertiliser, (7) dose of compound fertiliser (15% of N, 15% of P, and 15% of K), (8) number of pesticide types applied, (9) existence of a water regulatory officer (ulu-ulu), (10) number of artesian wells, (11) river as the main water source, and (12) number of water sources. The development of paddy farming characteristic emphasises on the landscape-approach as the methods applied in this study engage the direct stakeholders, i.e., smallholders with multiple objectives of positive environmental impacts with substantial livelihood improvement reflecting by the selections of identified and analysed parameters, as part of the more comprehensive picture of the Rejoso watershed.

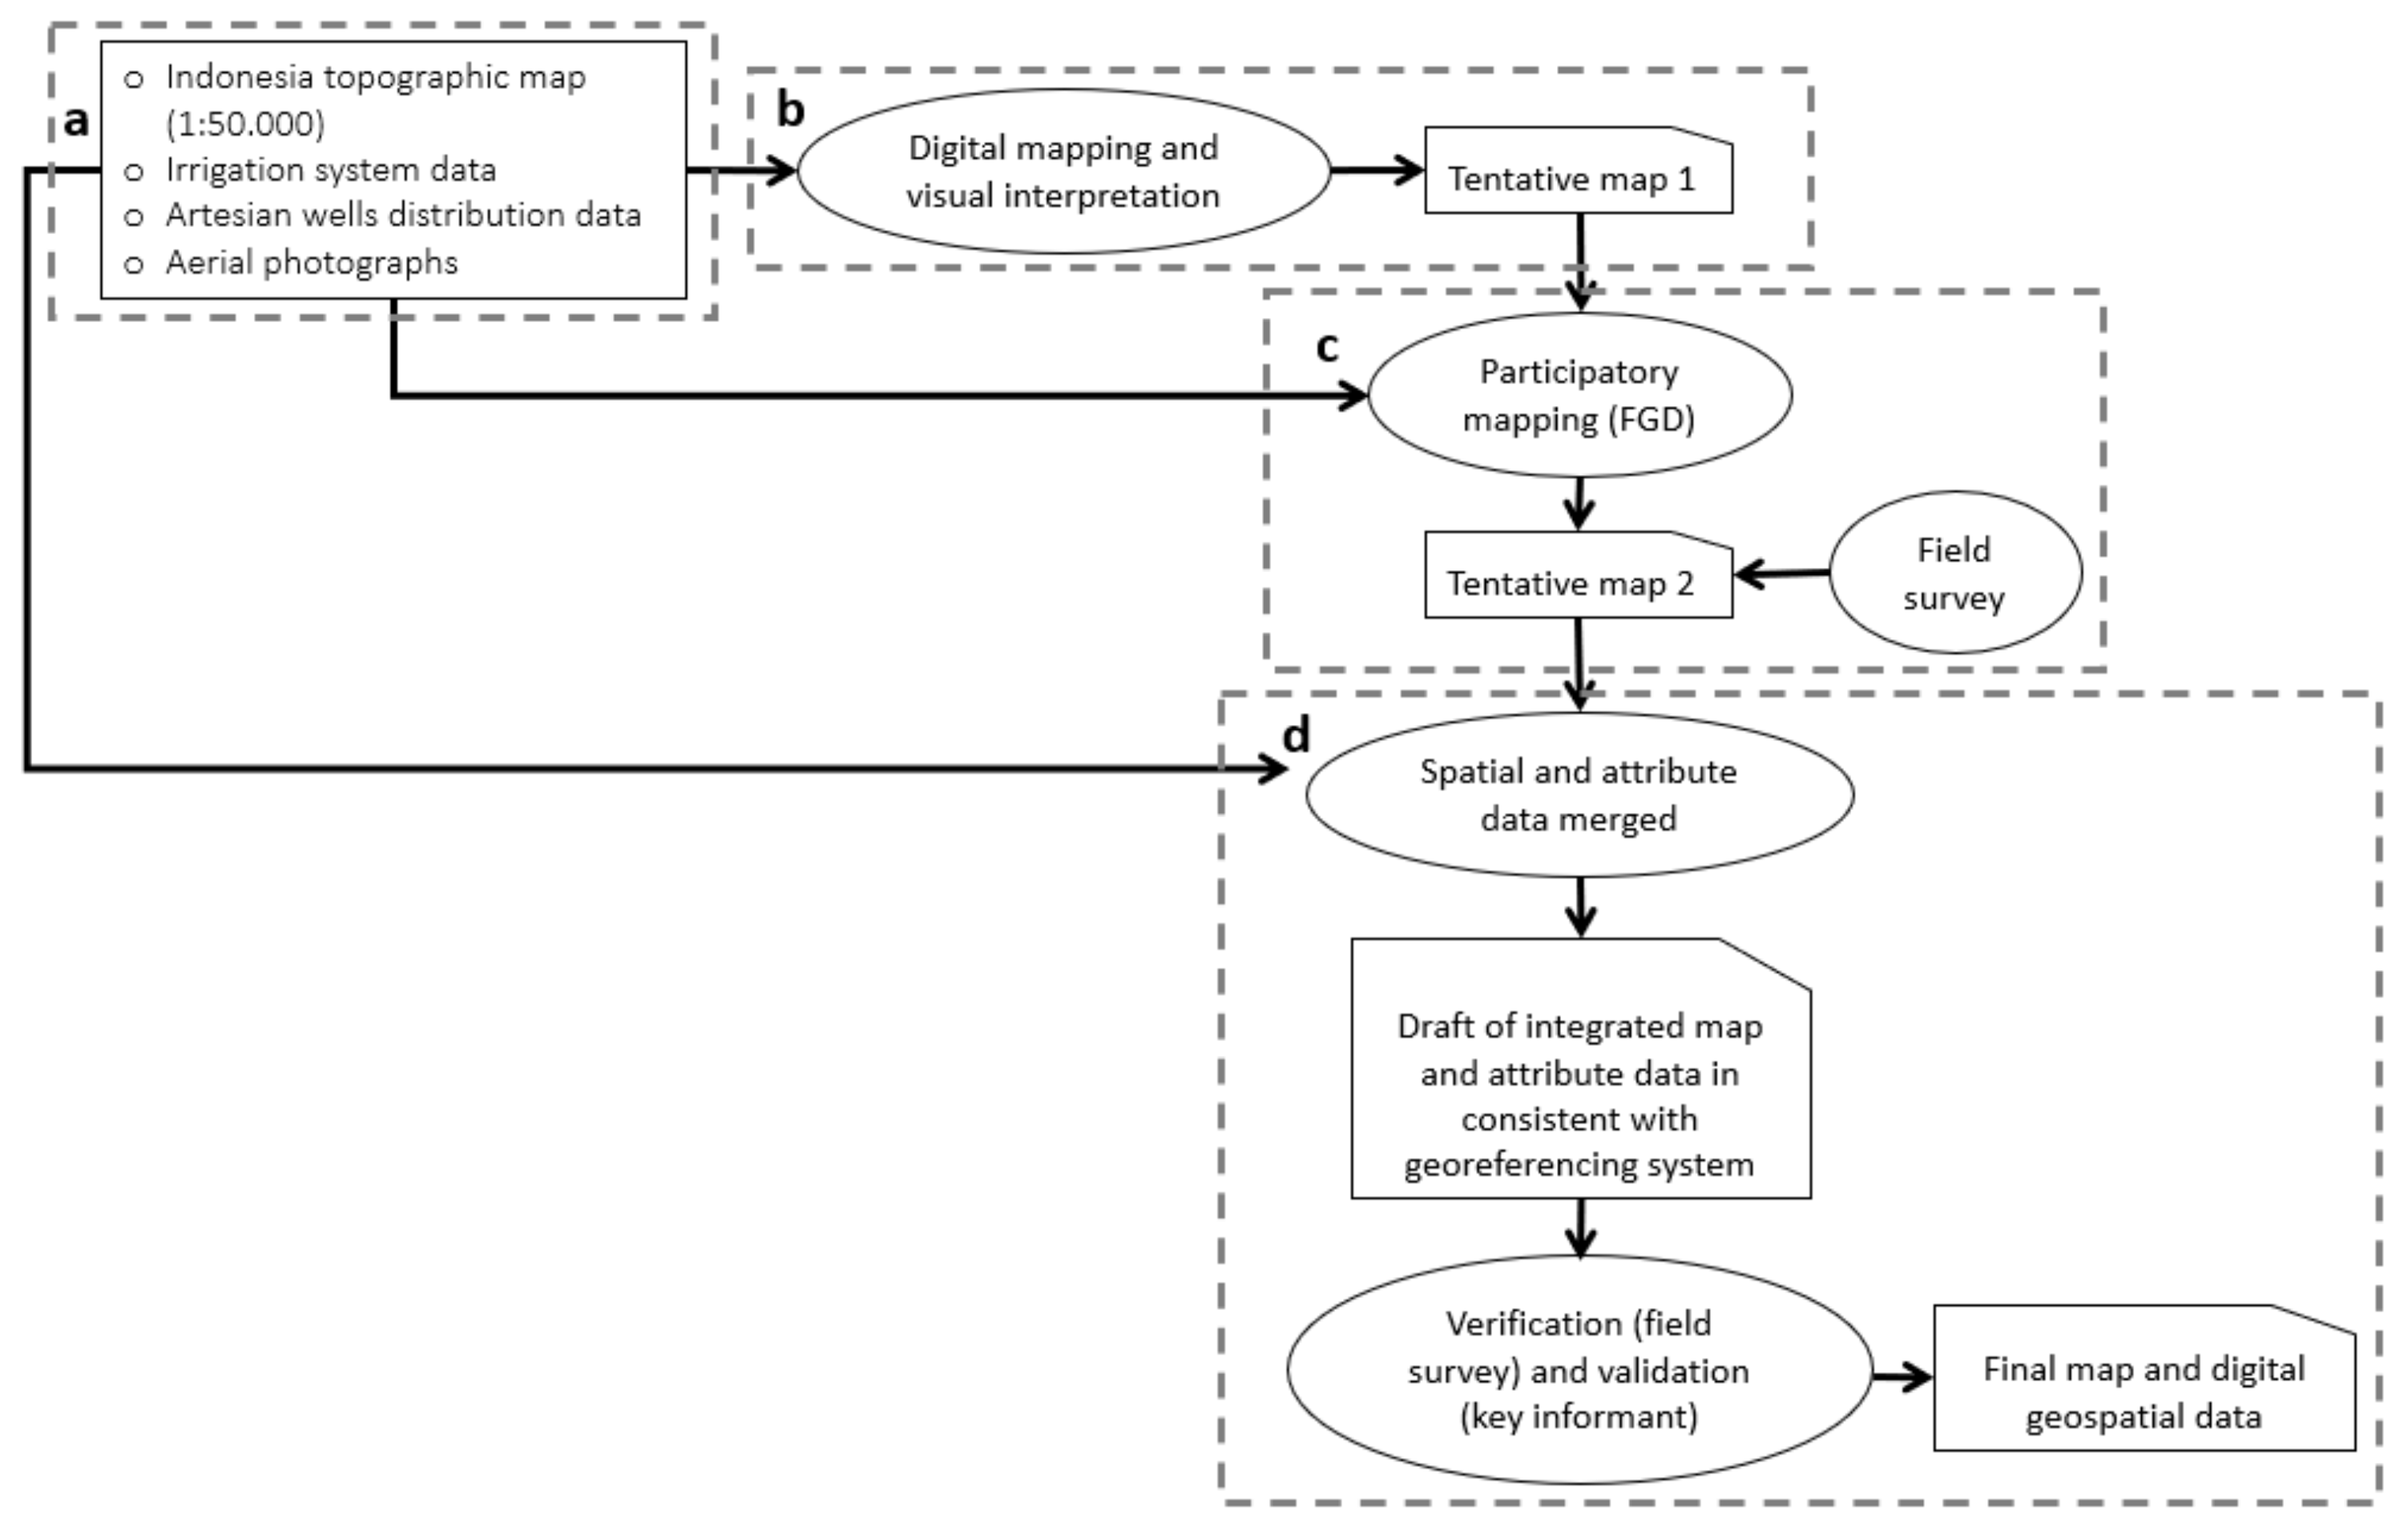
2.4.1. Spatial Data Analysis

Figure 6 presents the workflow of paddy field and irrigation system mapping that consists of four main steps: (a) data gathering, (b) visual interpretation, (c) participatory mapping, (d) data analysis, and visualisation.
Primary data collected through a survey and participatory approach and secondary data were two main data used for the mapping. A drone survey was conducted to obtain aerial photographs of paddy field, while focus group discussions (FGD) and key informant interviews were the approaches to obtain locations of artesian wells and detailed information of paddy fields. The secondary data were topographic maps at 1:50.000 scale [25], irrigation systems data [26], and artesian well distribution [16].
Data on the area of paddy fields, the area with crop rotation, and irrigation system data were extracted from the aerial photographs through visual interpretation and convergence of the evidence approach. To correctly identify surface objects, several visual interpretation elements such as tone/colour, shape, size, pattern, texture, shadow, site, and associations were considered [27]. Artesian wells, irrigation systems, and paddy field data were overlaid with a topographic map and visualised at the village scale to optimise the information extraction process. The result of this process led to a first tentative map that was completed and validated through FGD. The FGD was attended by 128 participants (mostly male) from eleven discussions in eleven villages.
Participatory mapping is a map-making process that attempts to make visible the association between land and local communities by using the commonly understood and recognised language of cartography [28]. The participatory mapping method in this study used a 2D map to allow two-way dialogues between researchers and key informants to minimise distortions of mapped information [29]. This discussion was focused on information such as the location of artesian wells, irrigation system, hamlet boundaries, paddy fields and their owners, crop rotation, and the existence of farmer groups.
Detailed information gathered from the participatory mapping was used as an input for data compilation and first tentative map improvement in digital format using GIS (Figure 6). The process included (1) scanning the result of participatory mapping; (2) georeferencing; (3) reinterpreting data; (4) and inputting attribute data. The results of this process were tentative map 2, which was then validated by eleven key informants from eleven villages. The validated spatial data was compiled as geodatabase for further analysis.
The spatial data resulted from participatory mapping were (1) hamlets boundary, (2) percentage of paddy field area in each hamlet, (3) percentage of crop rotation area per paddy field area in each hamlet, (4) drainage density in each hamlet, (5) and the number of artesian wells in each hamlet. The length of the channel network was classified by channel width. Channels with less than 1 m widths were identified as trenches, while channels with more than 1 m widths were identified as irrigation channels and rivers. The rivers that cross the study areas are Kedung River, Palembon River, Sumbermade River, and Umbulan River. Drainage density is defined as the total length of channels (trench, irrigation channels, and river) per unit area of hamlet.

2.4.2. Survey of Paddy Cultivation
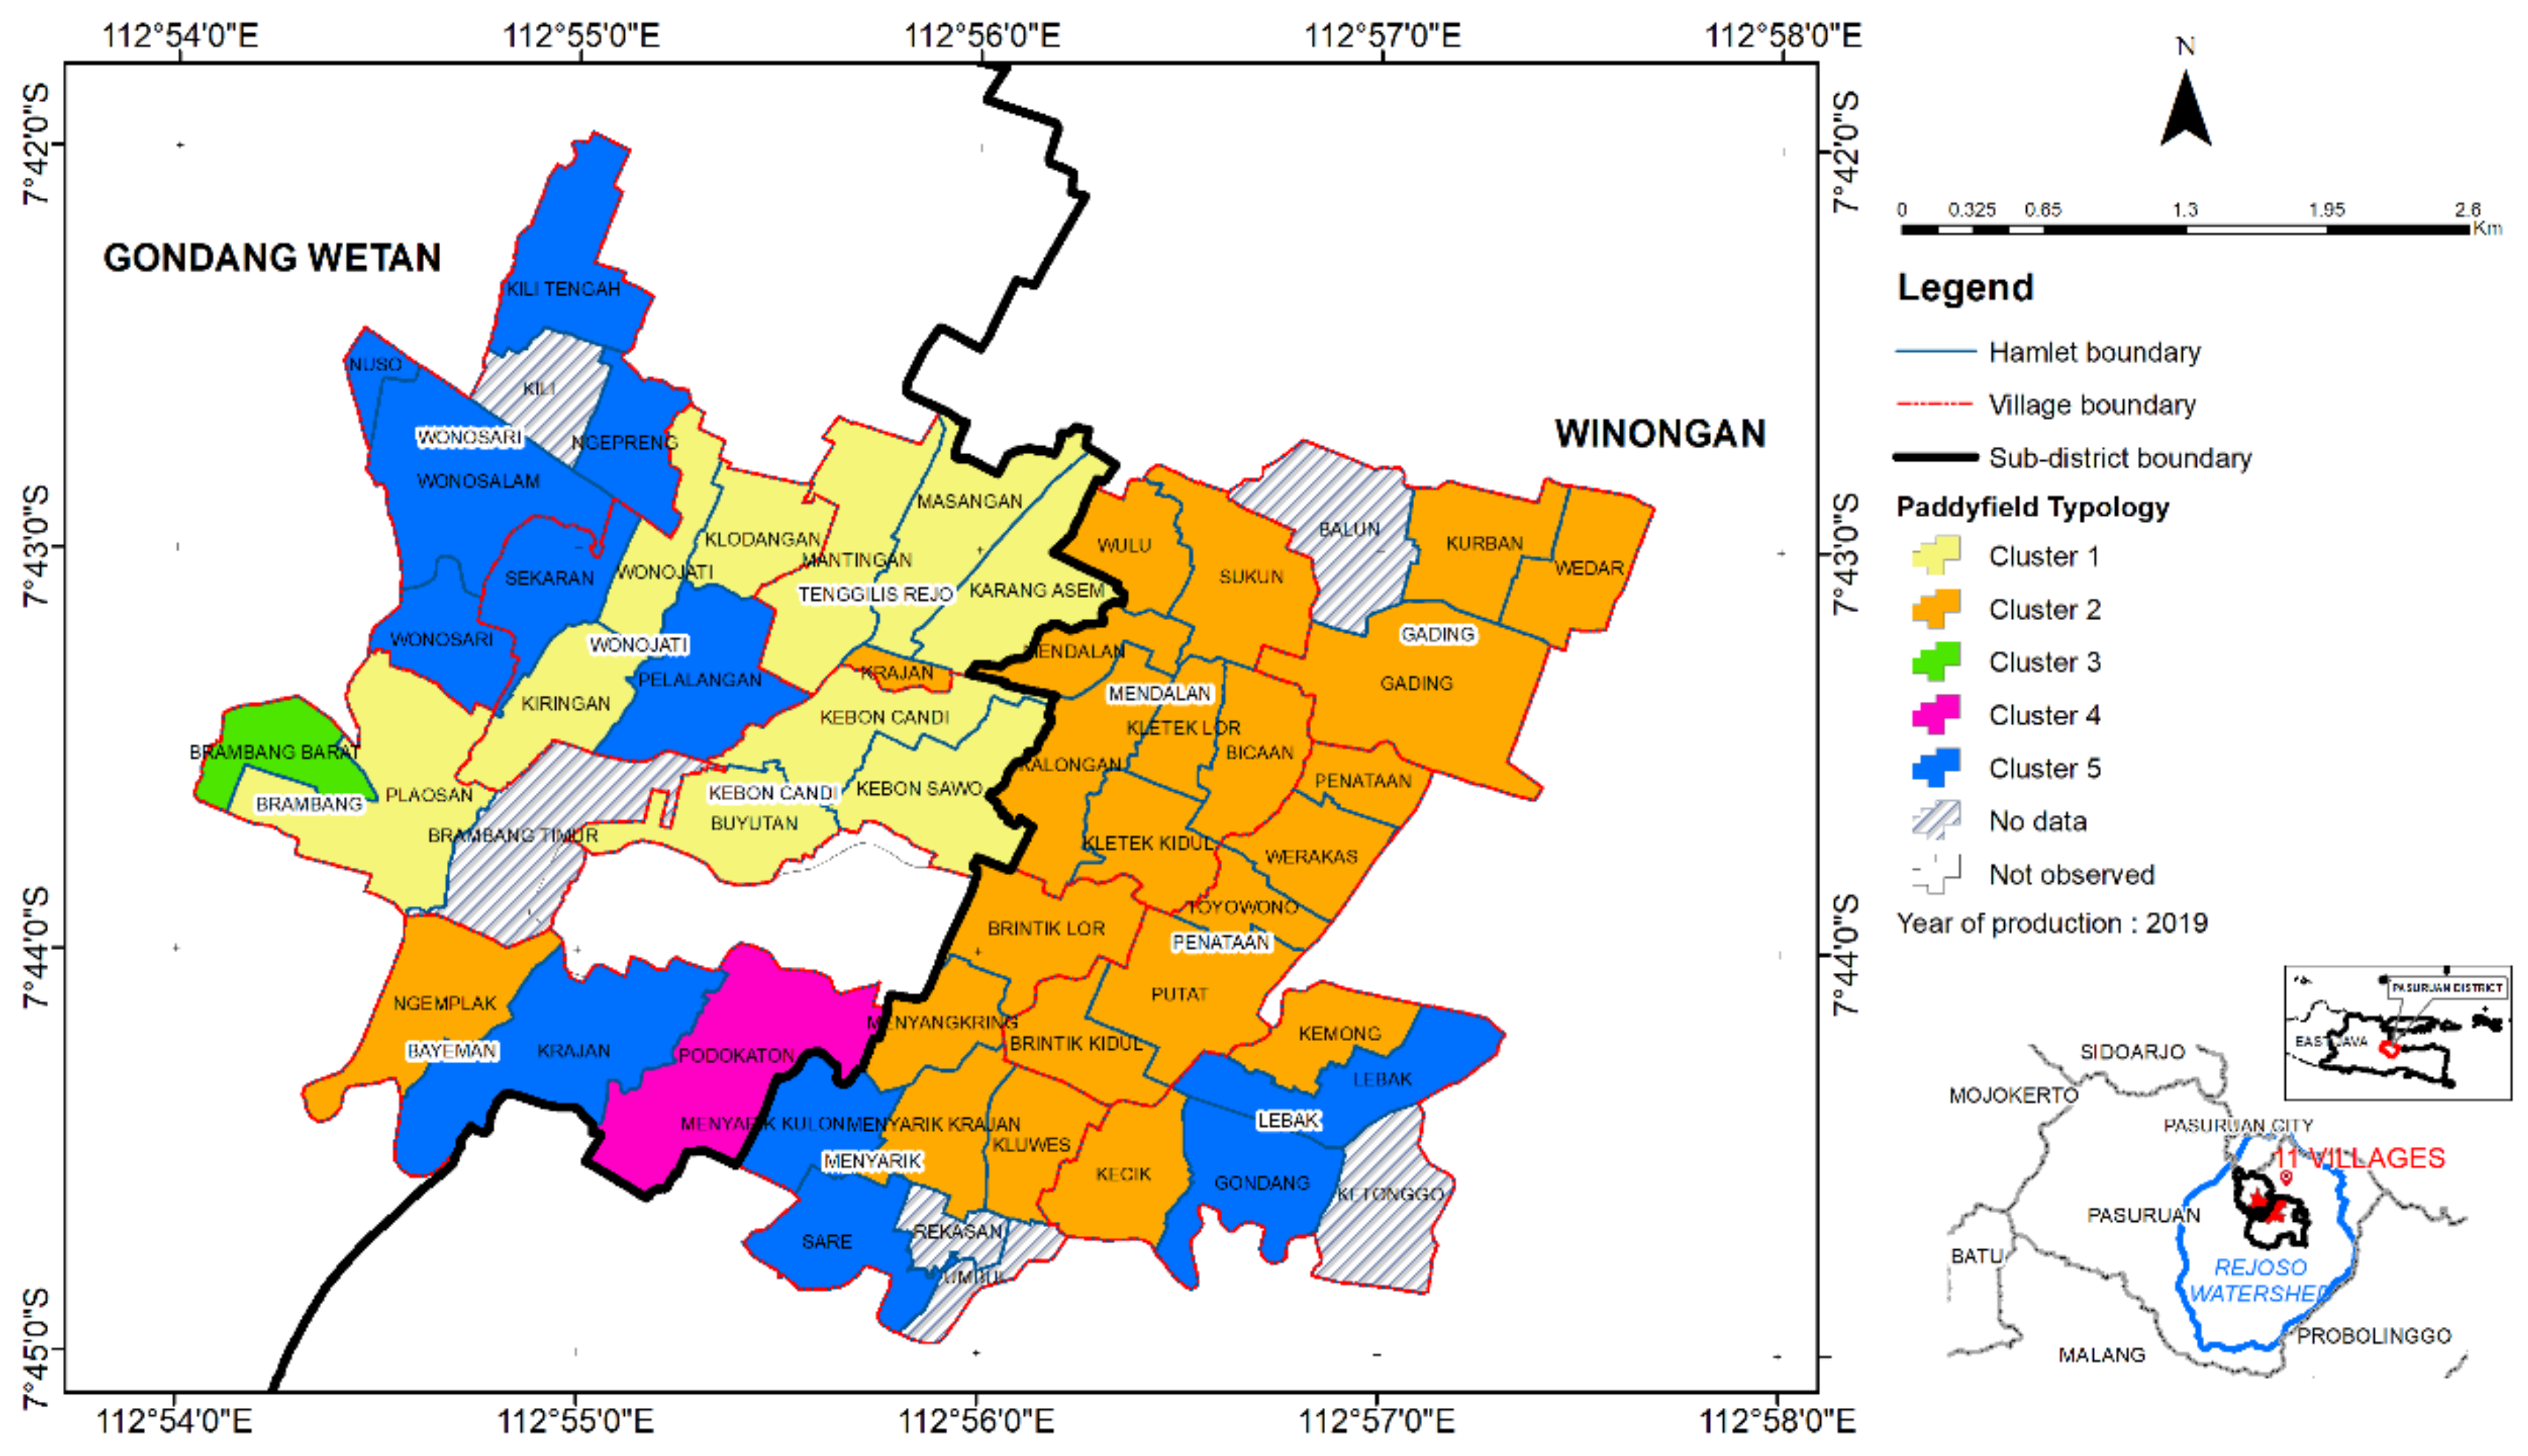
The survey of paddy cultivation aimed to gather information about paddy cultivation practices and related issues in the eleven villages of the two sub-districts, Gondang Wetan and Winongan. The survey was conducted from August to October 2019. The survey consisted of (1) survey preparation including the development of survey questionnaire and training on interview technique, (2) respondent selection and interview process, and (3) data cleaning and analysis.
The questionnaire was designed to survey five main parameters related to paddy cultivation practices and its issues: (1) yield, (2) dose of fertiliser, (3) number of pesticide types, (4) water sources, and (5) intensity of pest (rodents). For further analysis, the dose of fertiliser was divided into (a) urea fertiliser (46% of nitrogen) and (b) compound fertiliser (15% of nitrogen, 15% of phosphate and 15% of potassium), while water source parameter was divided into (a) river as the main water source, (b) number of water resources, and (c) existence of a water regulatory officer (ulu-ulu).
Table 2 presents the distribution and characteristics of respondents by village, age, and number and size of plots/fields owned/managed. In total, there were 461 respondents, the respondent’s information gathered from chairs of farmer groups, and applying a snowball technique. The age of respondents varied from 22 to 83 years old and was 56 years old on average. The respondents of this study at least owned/managed one plot. The maximum number of plots owned/managed was 25. The average area owned/managed by the respondents was 0.25 ha. The smallest was 0.05 ha, and the largest was 2.25 ha.

2.5. Data Analysis

For paddy cultivation data, data analysis was performed after data cleaning is completed. The cleaning included filtering location of paddy field and domicile of farmers/respondents. We only considered respondents who stay and manage the farm in the eleven villages. In the data analysis process, the basic statistical analysis was used to analyse and explore the variation of the data at sub-district, village and hamlet scale. The basic statistical analysis included an average of yield, dose of fertiliser and number of types of pesticide; percent of respondents with perception on high intensity of rodent and use of artesian wells. Once the analysis completed, the result was interpreted by sub-district, village, and hamlet. Then, we used hamlet as the unit of cluster analysis considering the social characteristic of paddy cultivation management, the existence of farmer group and water regulatory officer in each hamlet. The information on hamlet was described on the spatial maps under the Results section.
As we worked with extensive data set, for the cluster analysis, we applied the K-means approach to cluster the data and used the elbow method to find the optimum number of clusters [30]. Before we clustered the data, we conducted a correlation analysis of the twelve parameters that were extracted at the hamlet level to verify the statistical independence of the twelve parameters used (Figure 5).

3. Results

3.1. Water Balance

Parameters for the water balance model were adjusted to account for the approximately 5000 L/s Umbulan spring flow in reference scenario A (see results in Table 3). Upland degradation alone (Scenario B) would likely lead to increased river flow (due to increased runoff triggered by lower evapotranspiration in the uplands) and some decrease of the Umbulan spring flow (due to lower infiltration, i.e., lower recharge on the mountain slope). Lowland conversion to paddy with current artesian wells (Scenario C) would decrease both river flow and Umbulan spring flow.
Combining the changes of scenario B and C (Scenario D), river flow would approximate that of scenario B, but the Umbulan flow would be reduced to approximately the level currently observed (31% reduction). Attribution of this reduction (A – D), with 1.3% interaction, would be for about 15% to the middle and upper zone, and 17% to the lowland. The restoration potential in Scenario E is estimated to nearly 4500 L/s, at which the planned offtake of 4000 L/s still leaves sufficient discharge for local use.

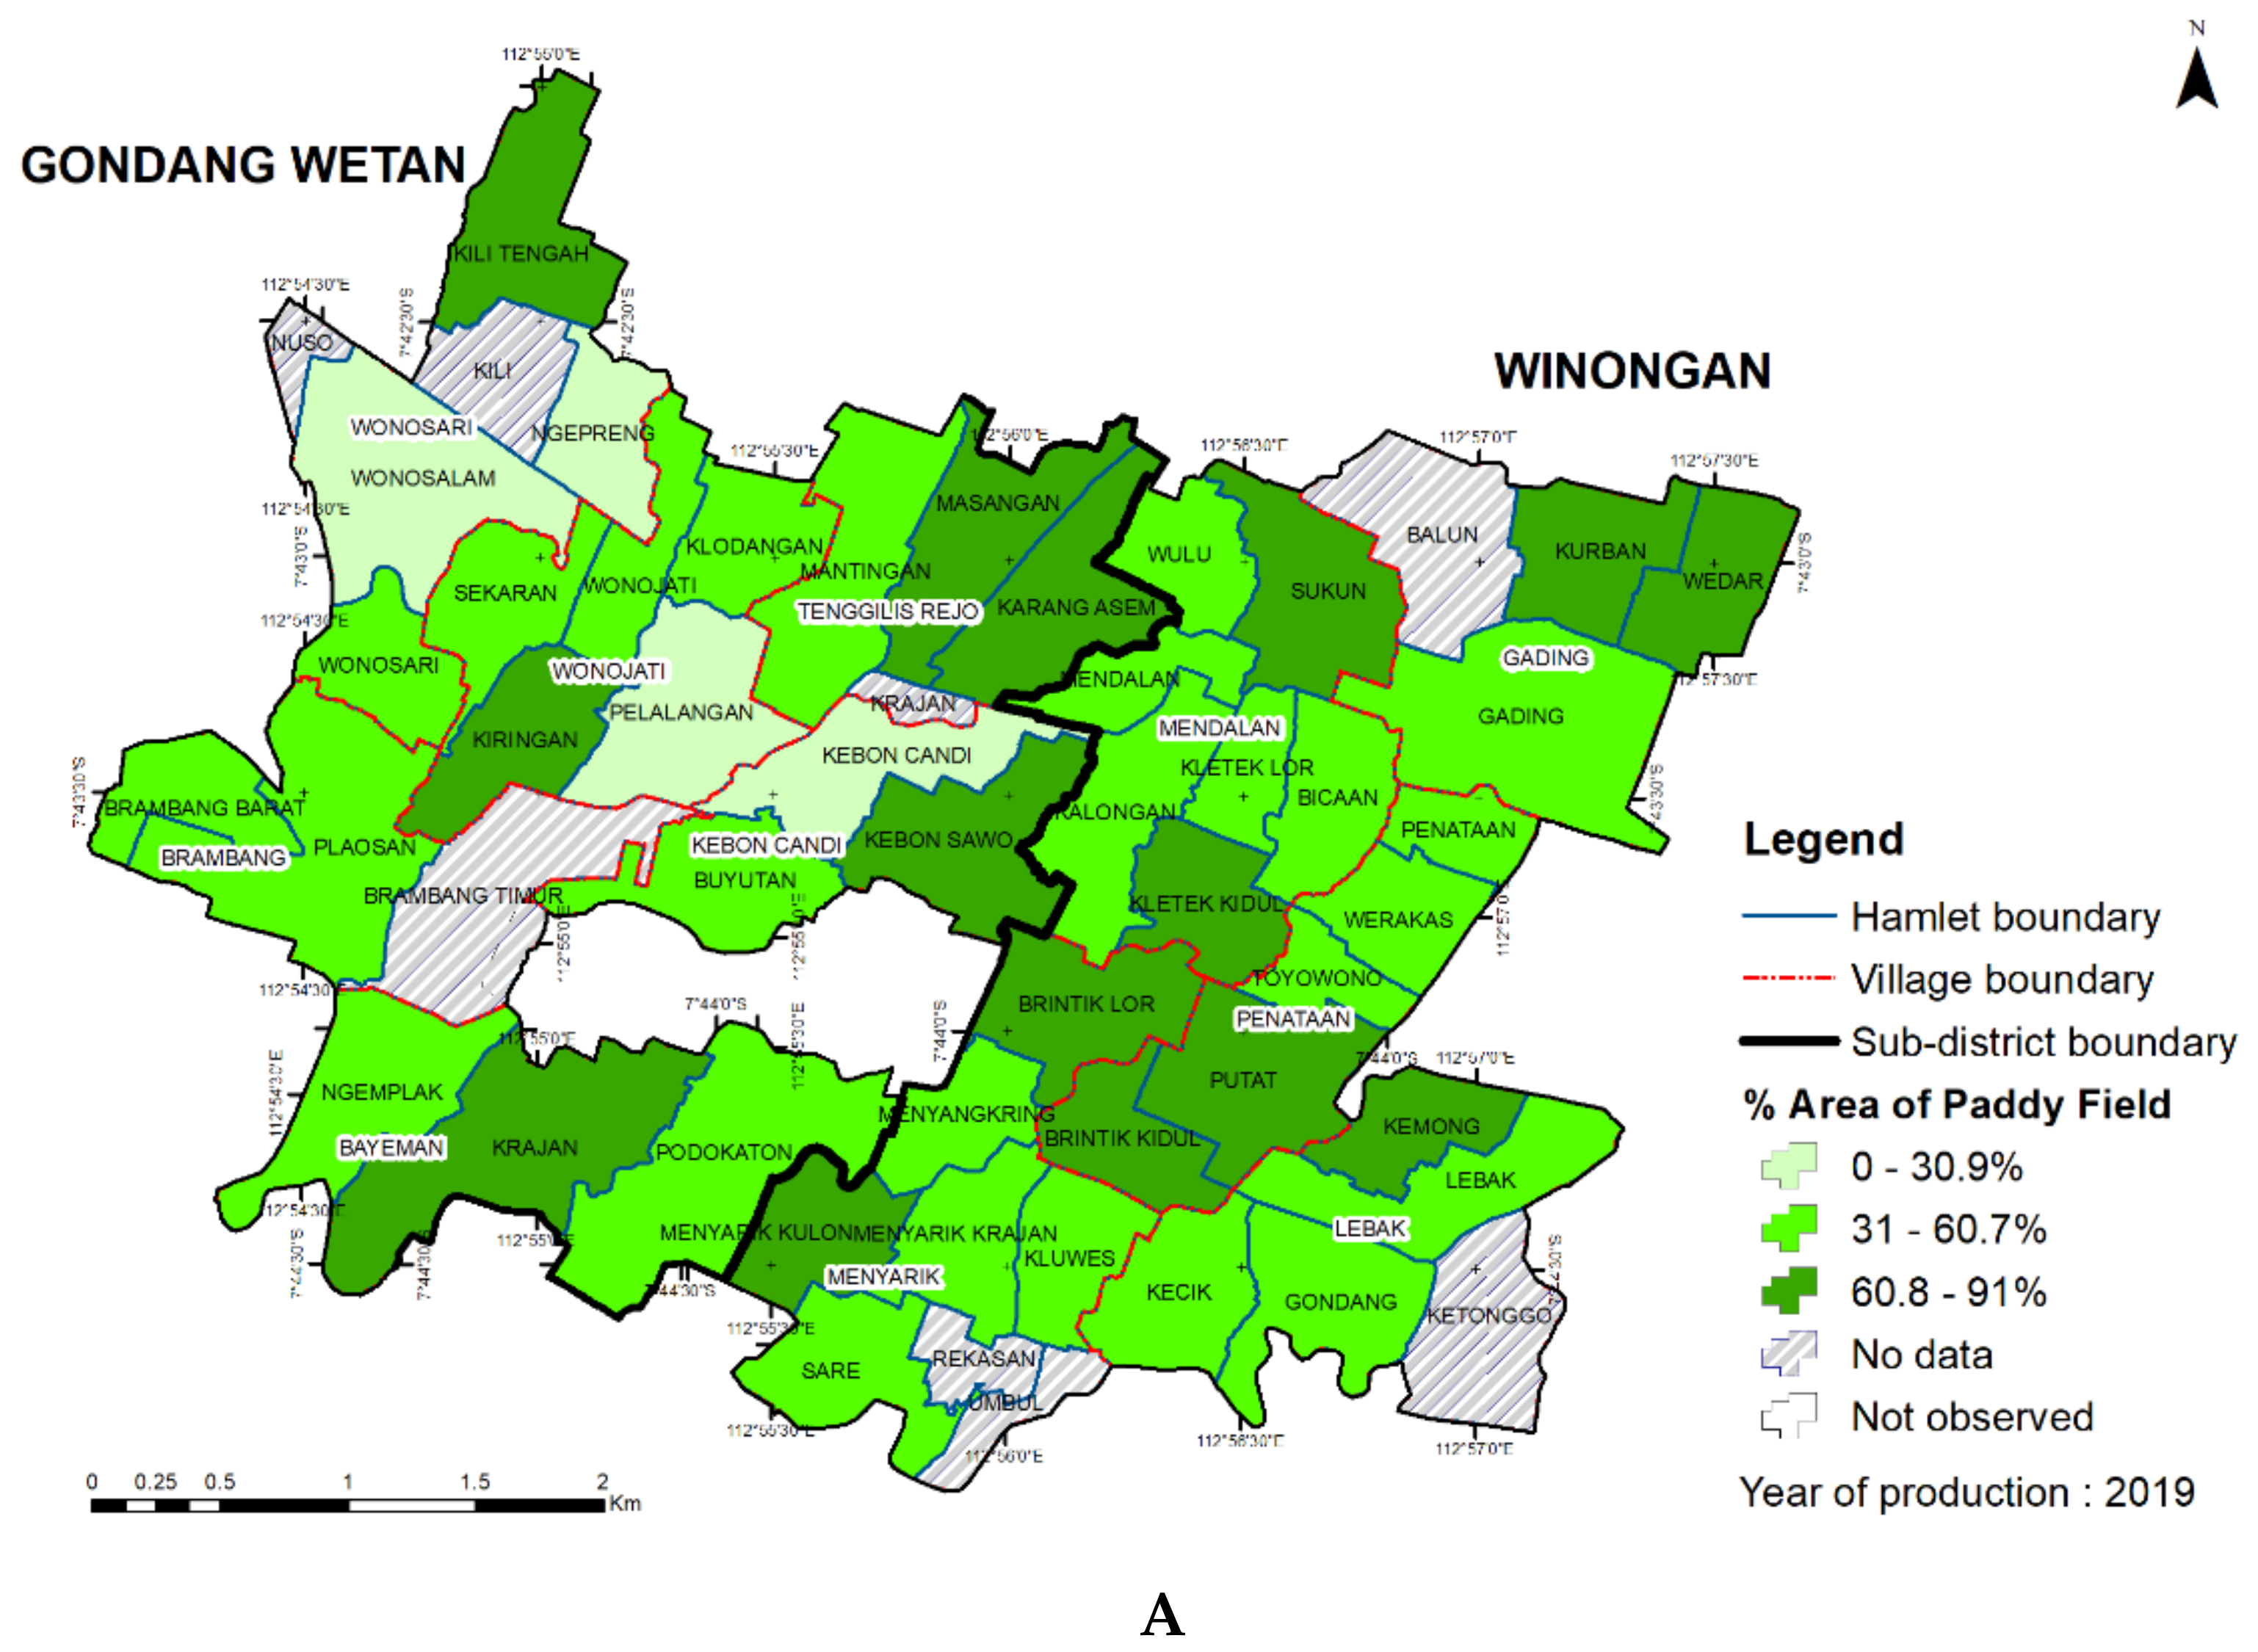
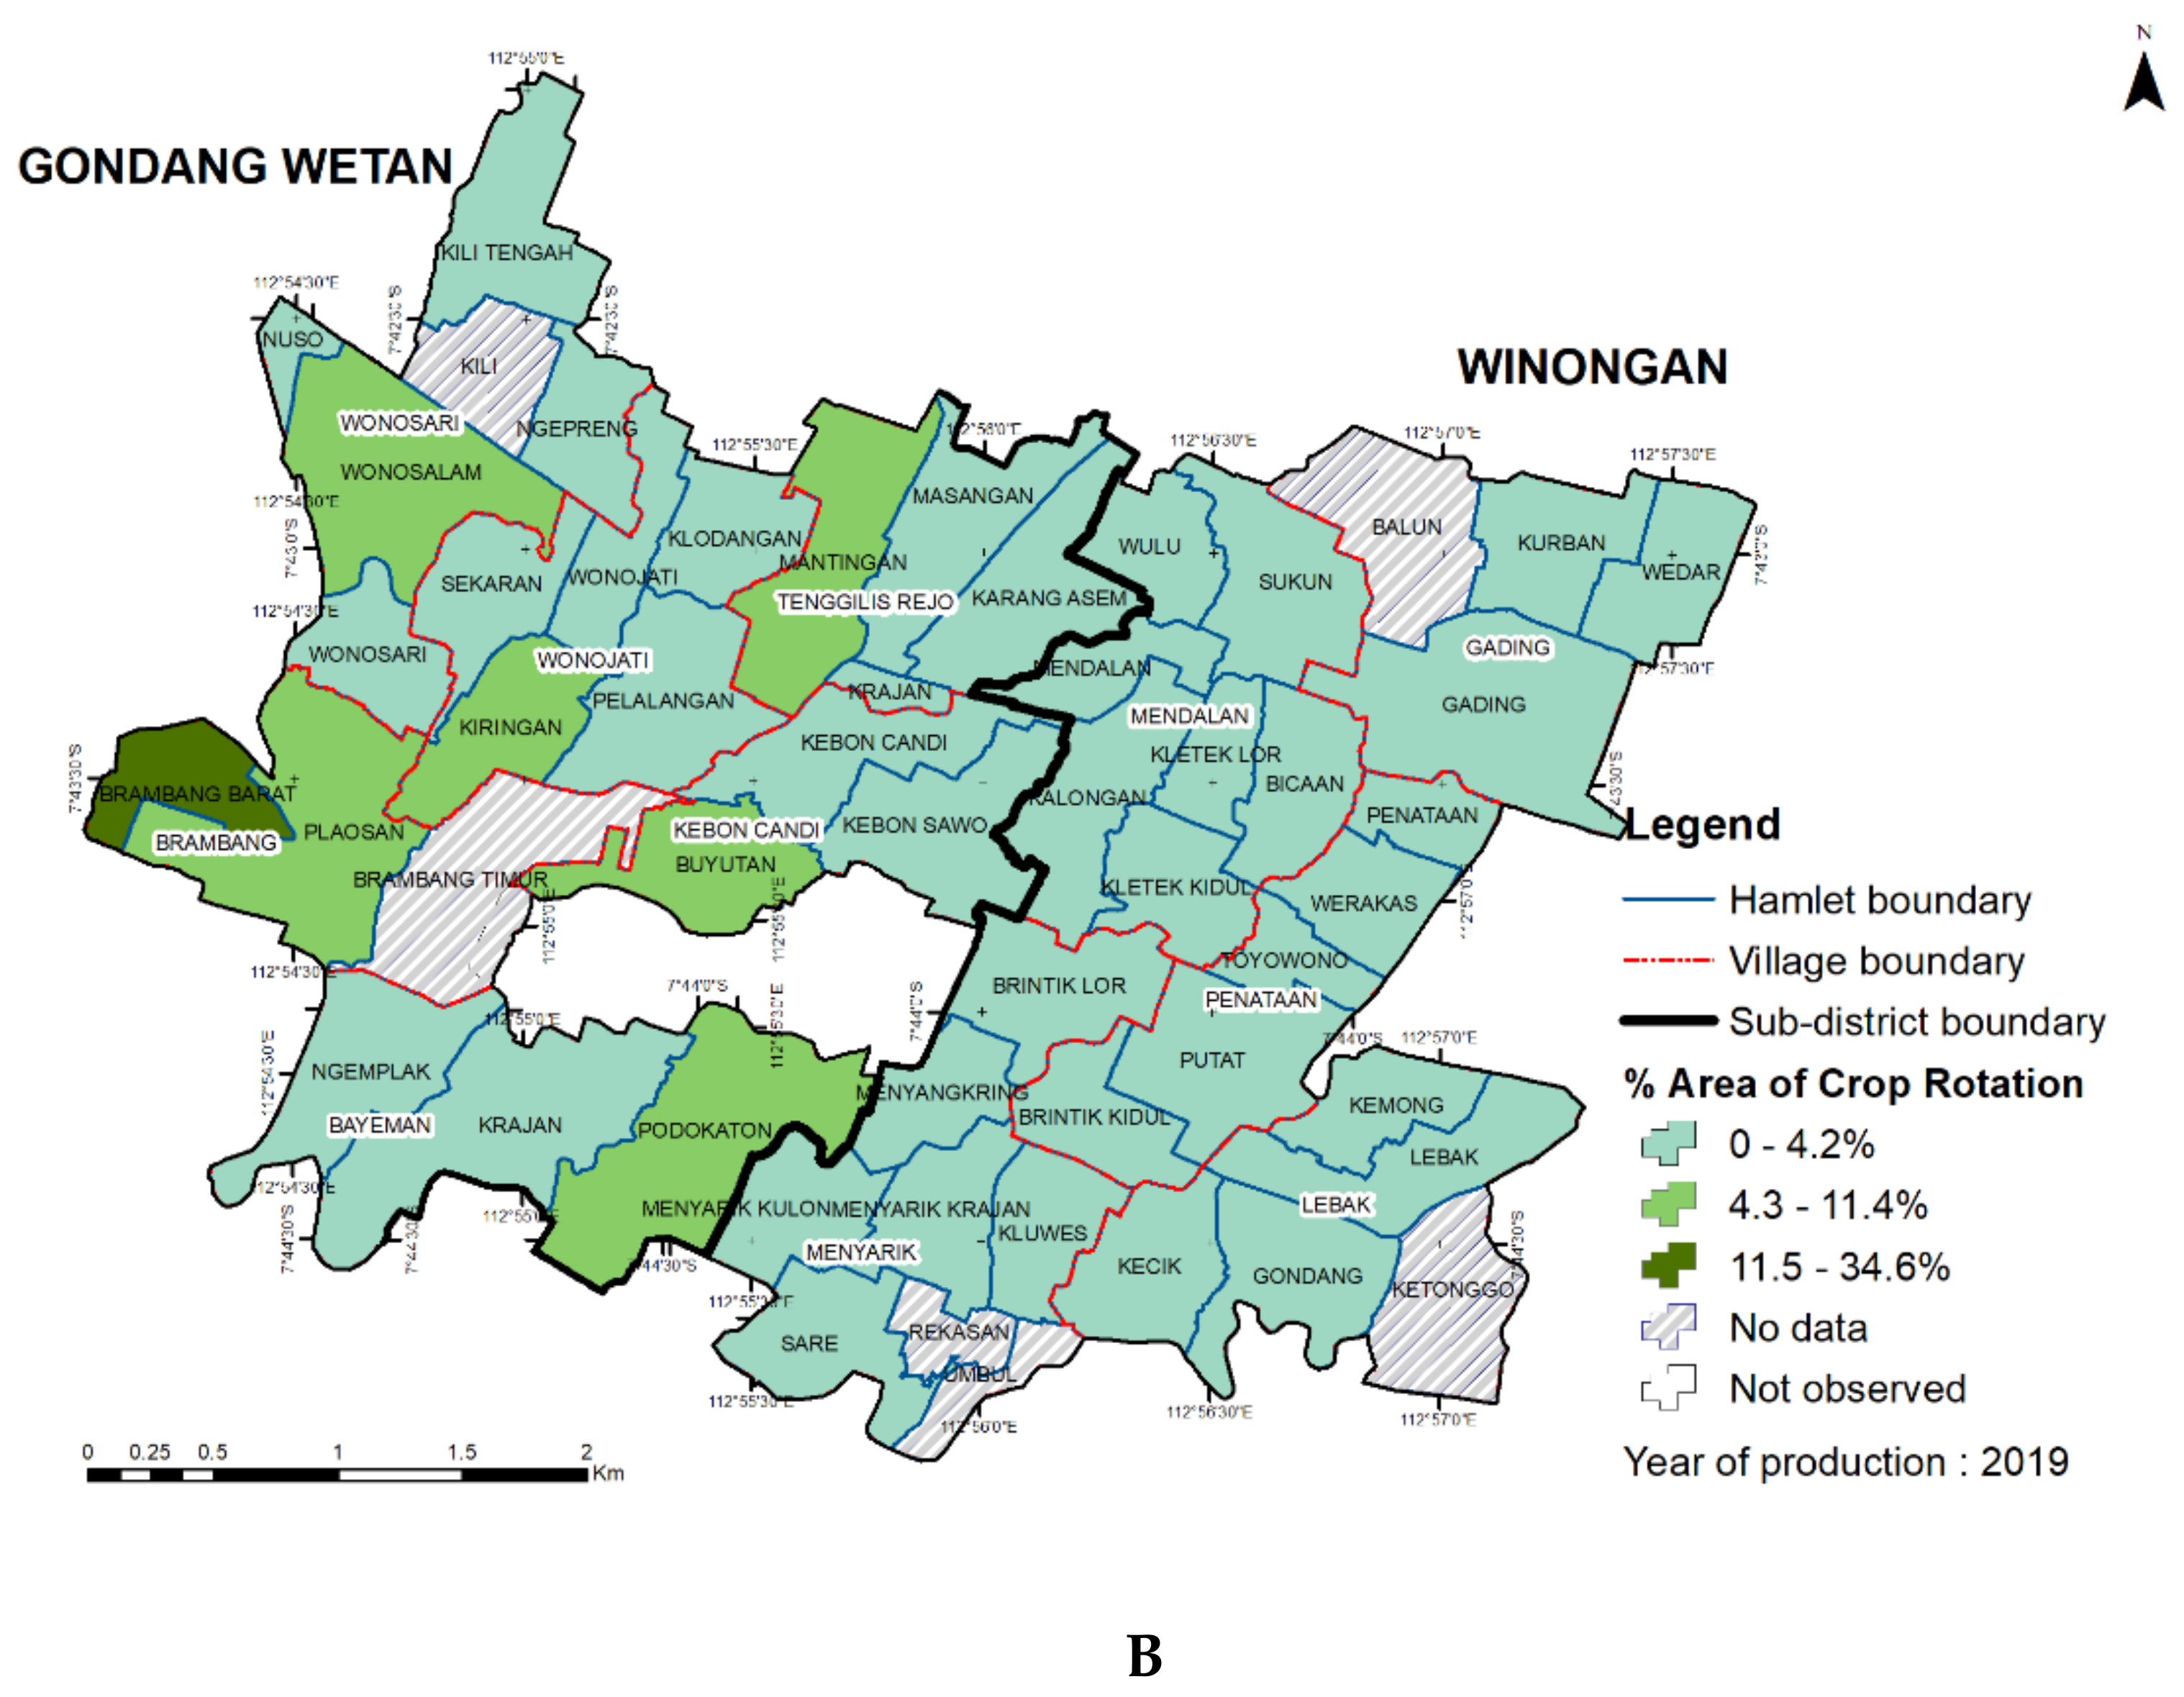
3.2. Area of Paddy Field and Crop Rotation

The paddy fields in eleven villages reached 980.2 ha in both targeted sub-districts, with 536.1 ha (54.7%) in Winongan Sub-district. The villages Gading, Mendalan, and Menyarik in Winongan Sub-district had the largest area of paddy fields, with 119.6 (12.2%), 118.7 (12.1%), and 118.6 (12.1%) ha, respectively. On the other hand, Kebon Candi Village in Gondang Wetan Sub-district had 56.4 ha of paddy fields, the smallest among all other villages (Table 4). At the hamlet level, Kemong Hamlet in Lebak Village (Winongan Sub-district) had the largest percentage of paddy fields reaching 91%, which meant that only 9% of the area was used for non-agricultural activities. Areas with smaller percentages of paddy fields were in Gondang Wetan Sub-districts, starting from 0 to 30.9% (Figure 7A).
Crop rotation is a vital paddy farming practice to reduce the intensity of pests and diseases, and to improve soil fertility. Different crops rotated with paddy included corn, beans, taro, chilli, and other crops. Villages in Gondang Wetan Sub-district tended toward crop rotating more often compared to those in Winongan Sub-district. The area of crop rotation reached 30.1 ha, and 26.6 ha of it (88.5%) was found in Gondang Wetan Sub-district. Brambang Village in Gondang Wetan Sub-district was the village with the largest area of crop rotation with 10.9 ha, while Penataan Village in Winongan Sub-district had only 0.34 ha, the smallest area compared to other villages (Table 5). At the hamlet level, Brambang Barat Hamlet in the village of Brambang had the largest area of crop rotation, reaching 34.6% of the total paddy field area (Figure 7B). Hamlets in Gondang Wetan Sub-district had a percentage of area with crop rotation between 4.3–11%. Other hamlets were classified as having a low rotation area, which was less than or the same as 4.2% and it was relatively common in Winongan Sub-district.

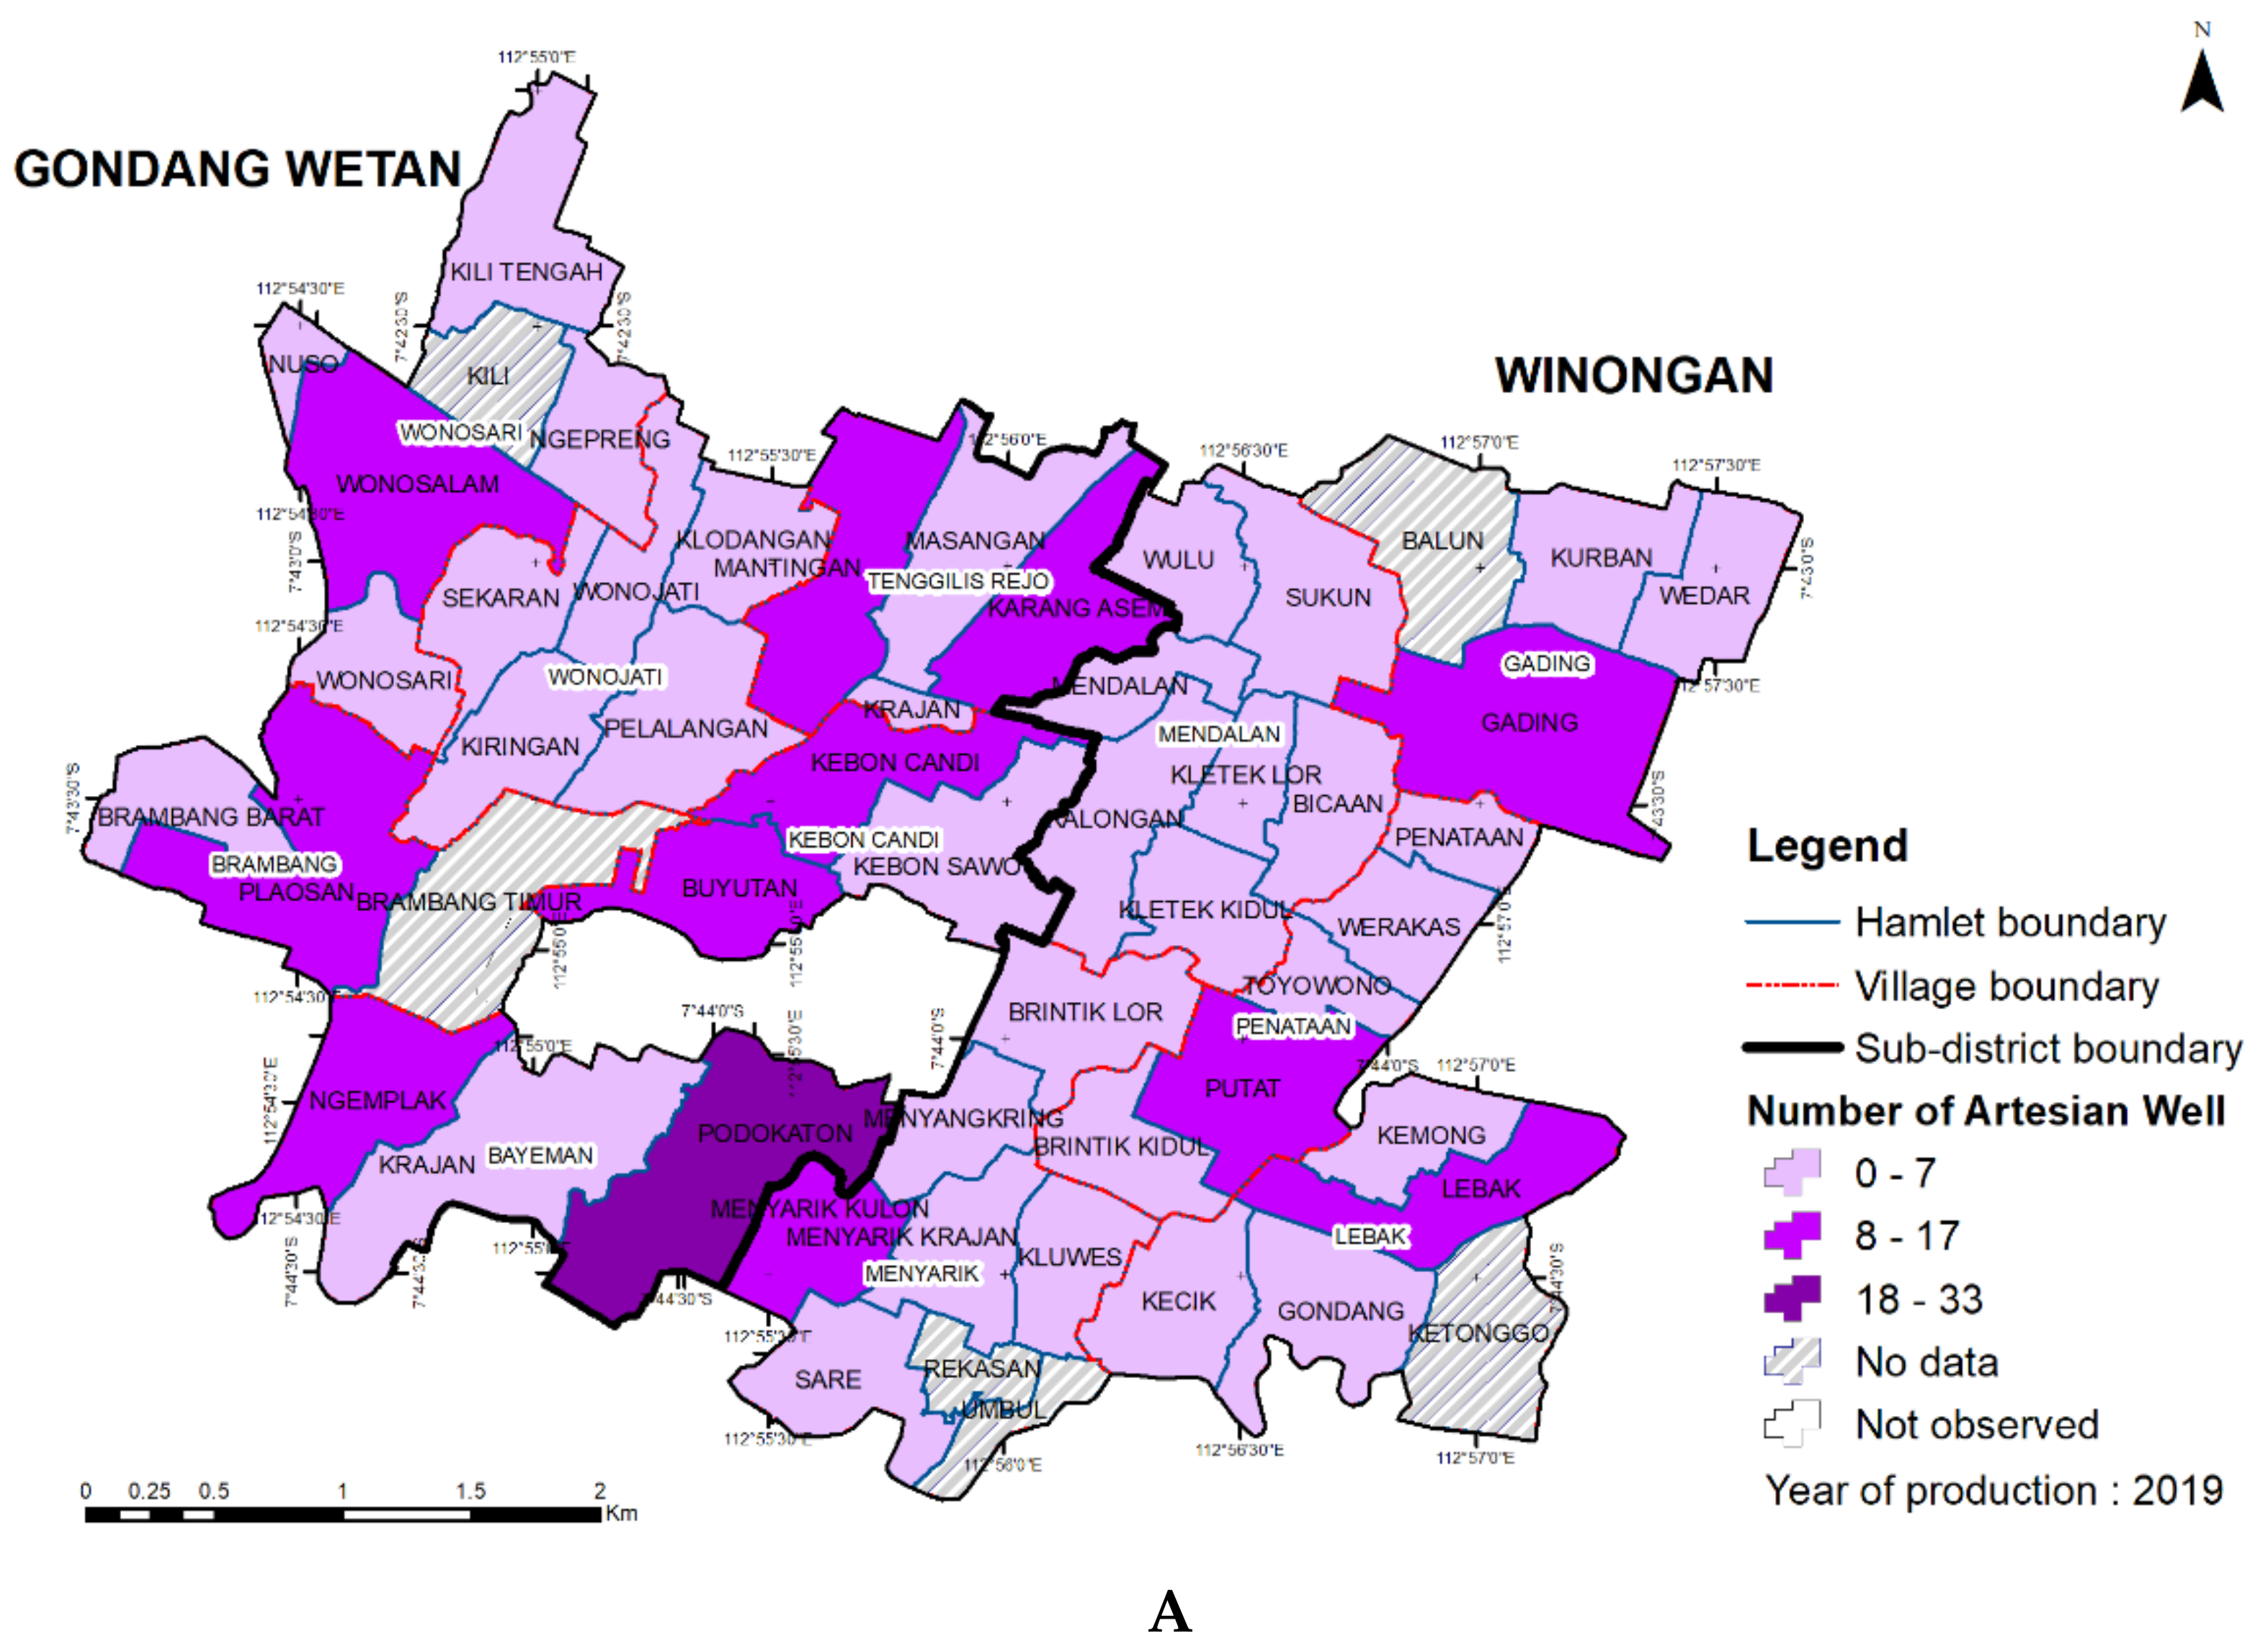
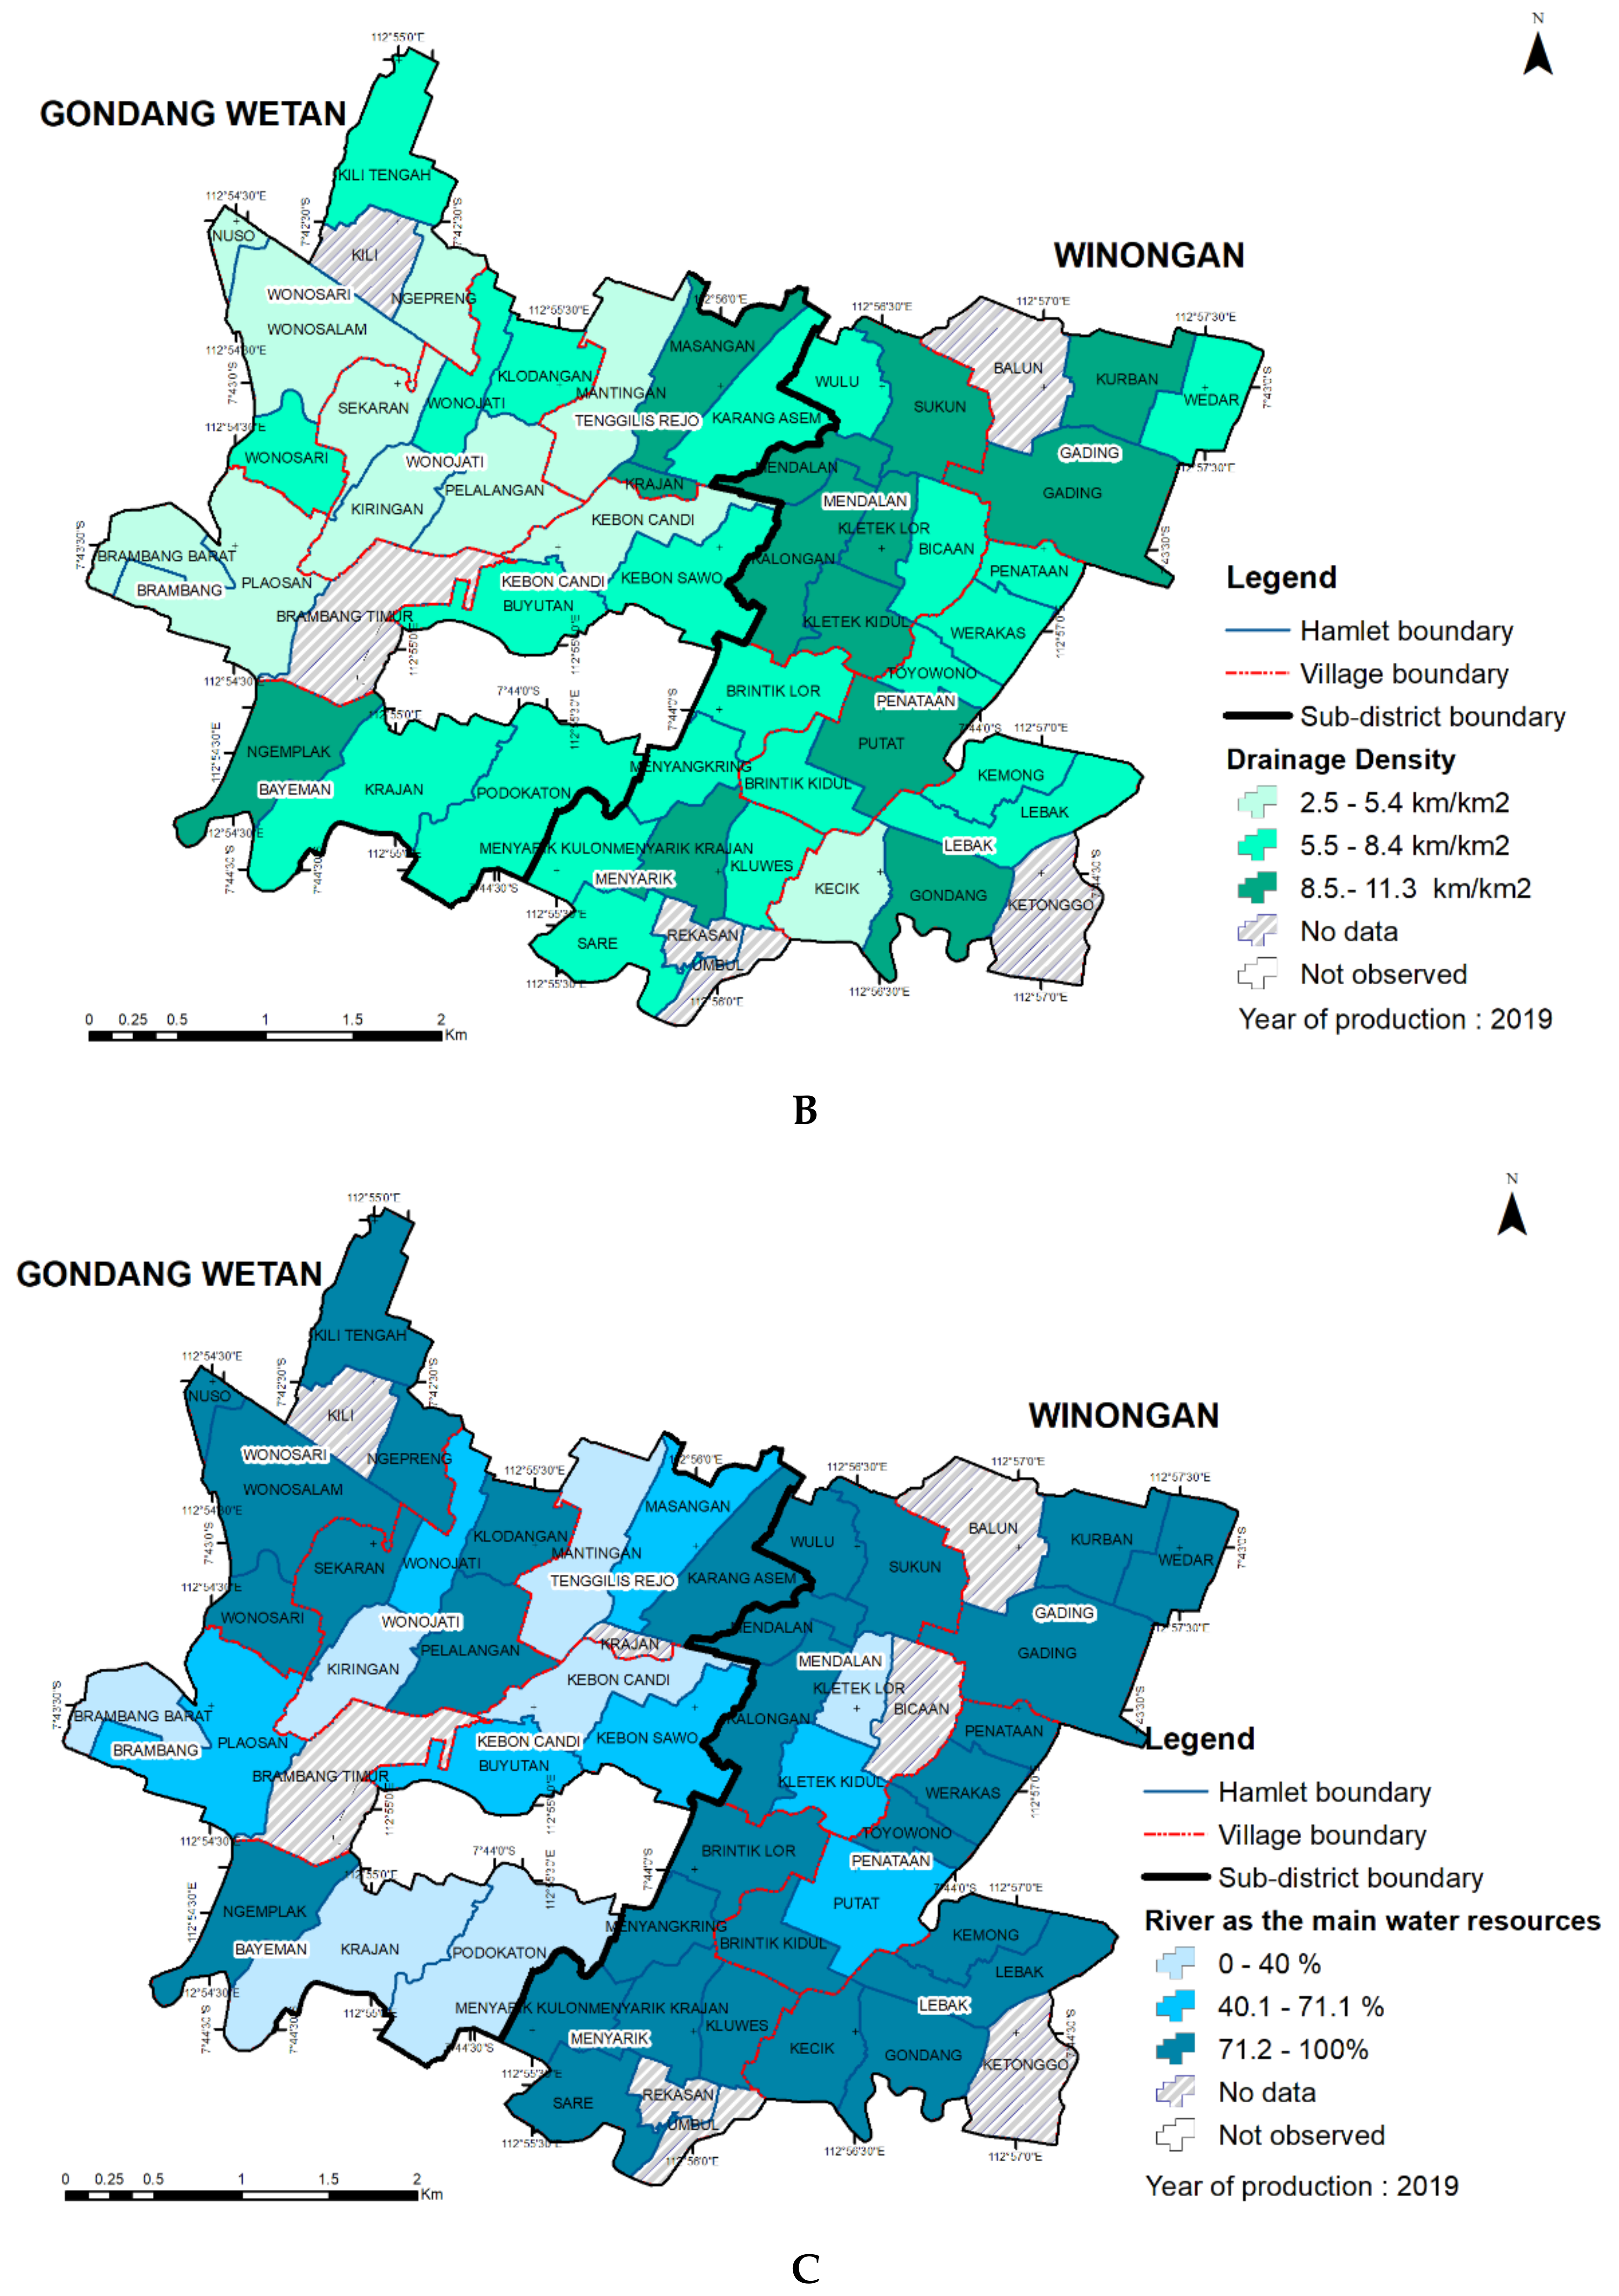
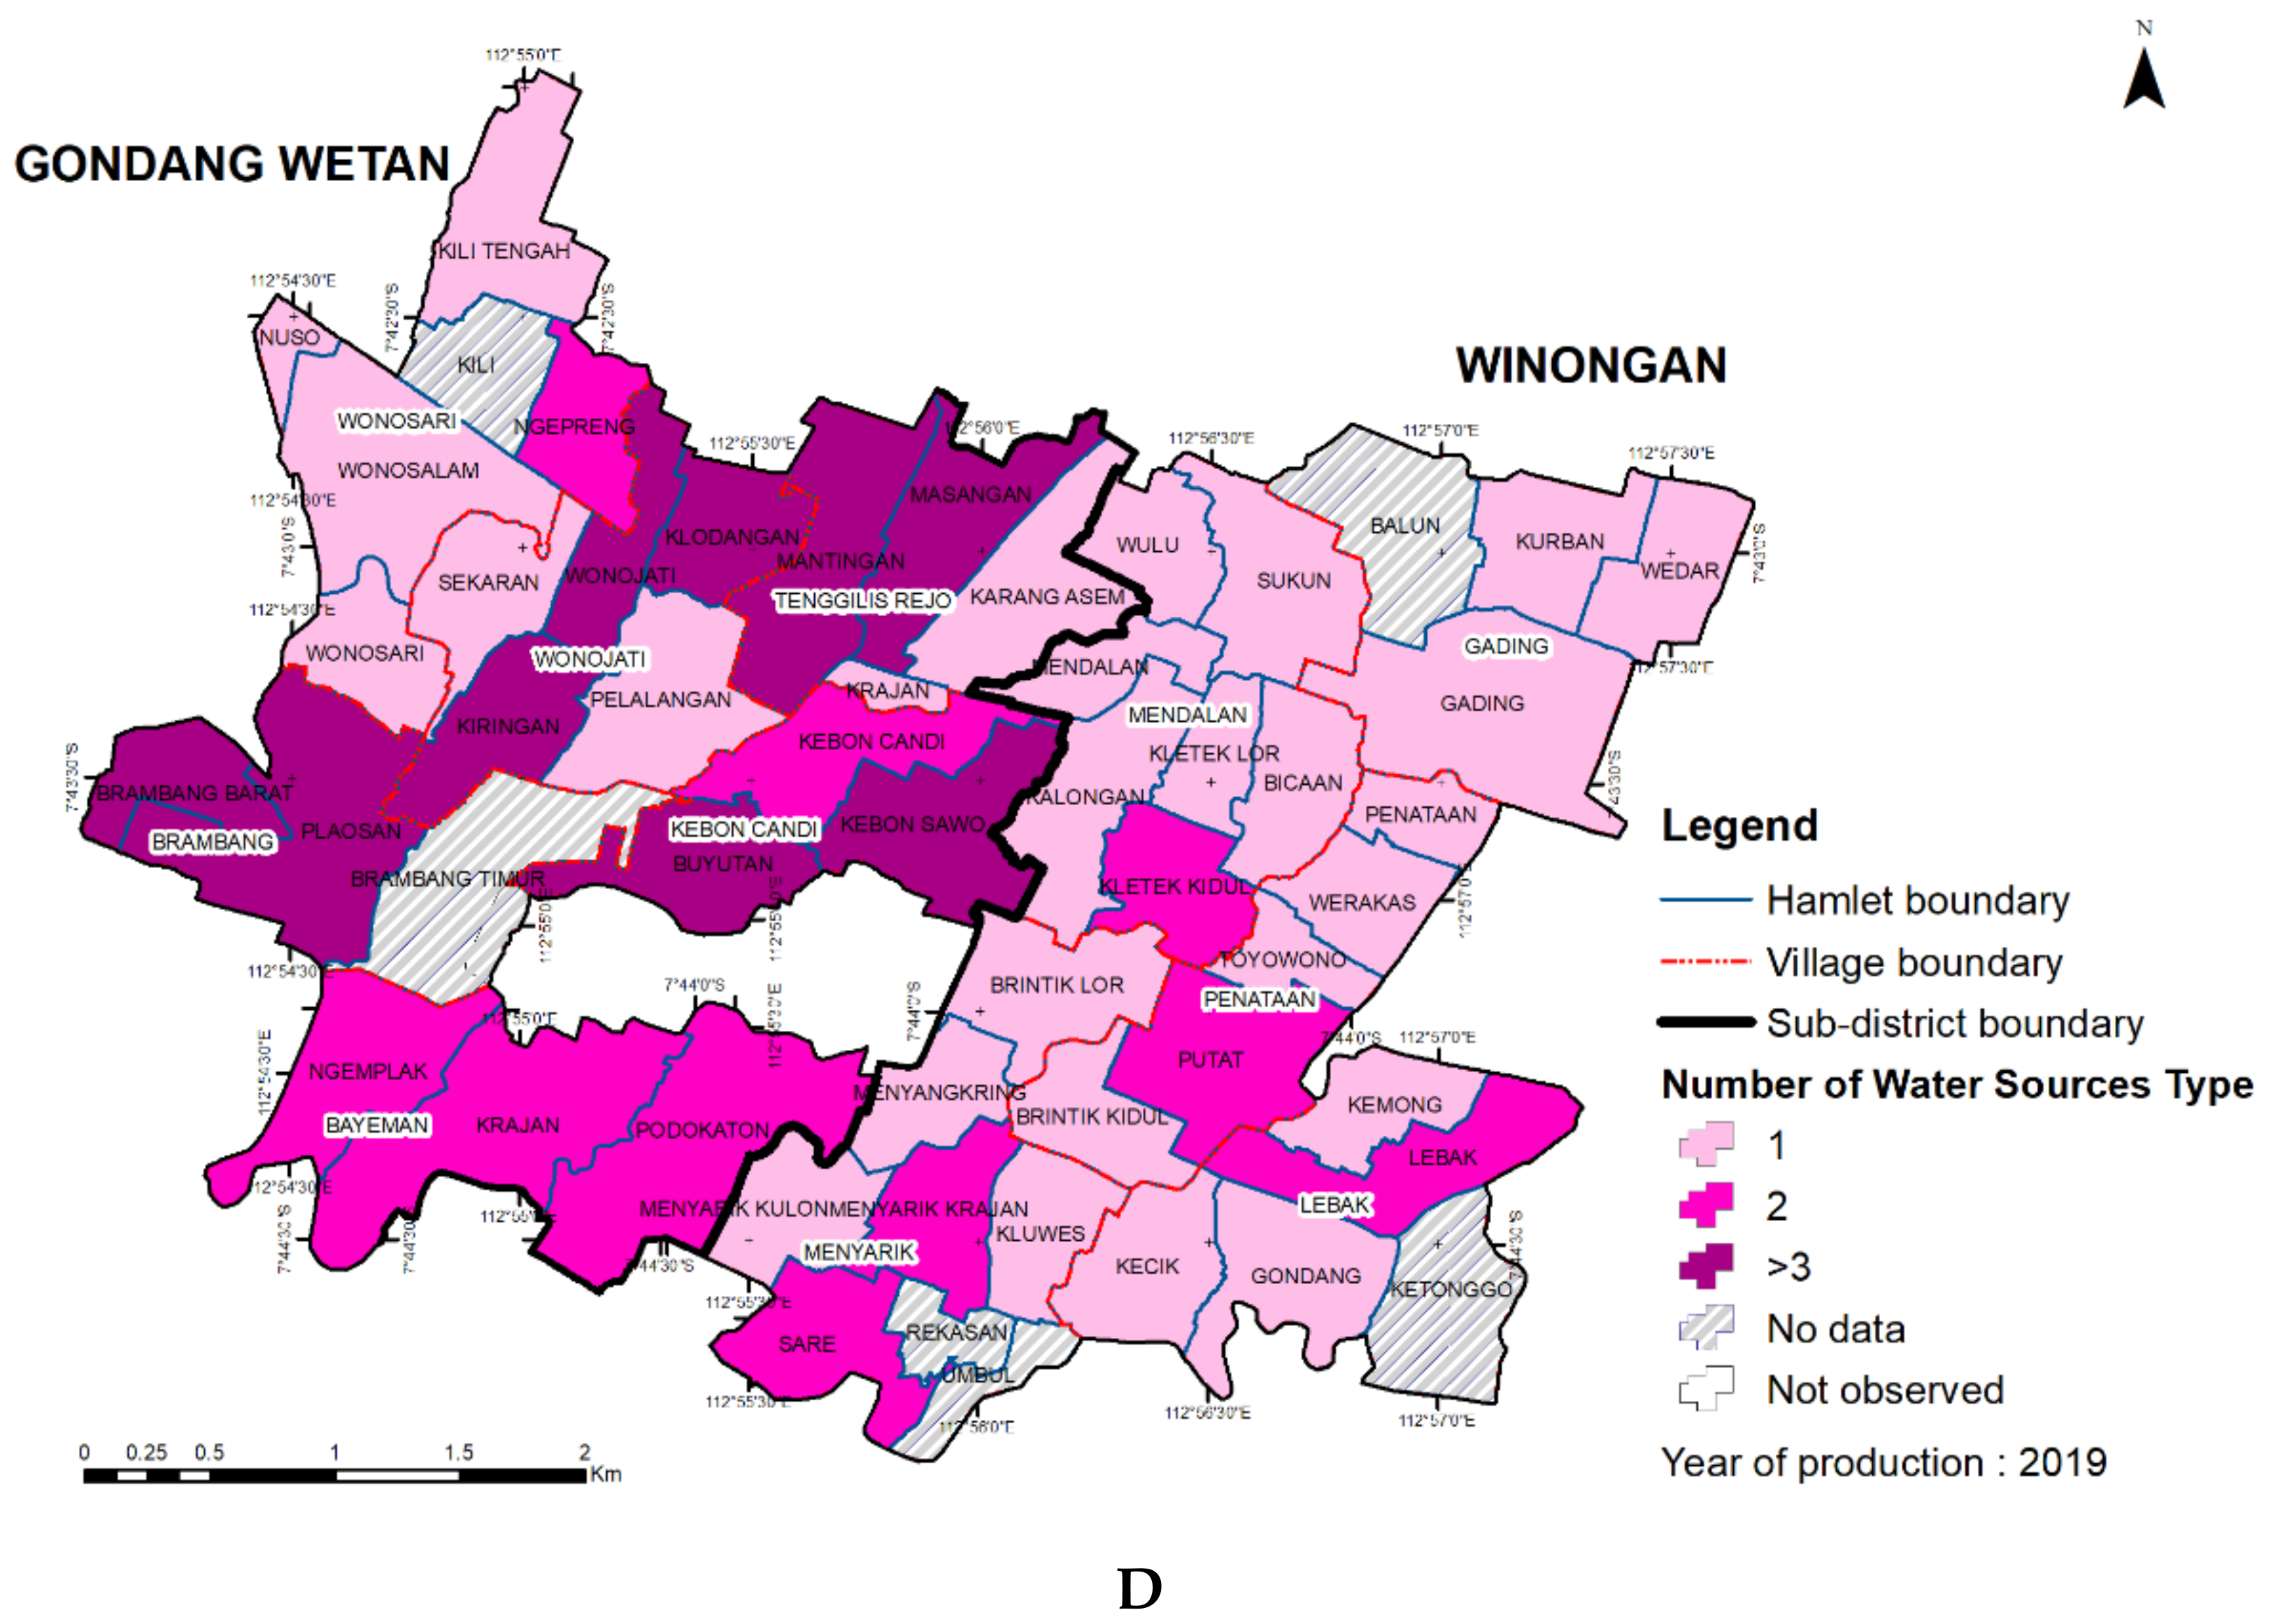
3.3. Water Sources and Irrigation Systems

Rivers and artesian wells were two primary water sources to irrigate paddy fields in Gondang Wetan and Winongan Sub-districts. Water from those two sources flowed into the irrigation channel, but in some cases, the artesian wells were located inside the paddy fields itself. The total number of artesian wells reached 318 points spread across 11 villages, and 63% of it was found in Gondang Wetan Sub-district (Table 4). In line with this distribution, 89% of respondents in Winongan Sub-district mentioned that the river was more dominant than artesian wells as a water source to irrigate their paddy fields, while in Gondang Wetan Sub-district, they were only 61% of respondents (Table 4). Brambang Village was the village with the lowest percentage of respondents that mentioned river water as the primary source. Therefore, one paddy field could use river water and more than two artesian wells (shared with other farmers) (Figure 8D). At the hamlet level, most artesian wells were found in Podokaton Hamlet of Bayeman Village of Gondang Wetan Sub-district. Some hamlets were identified to have artesian wells between 8 to 17 wells. Other hamlets had less than eight wells. Nuso Hamlet at Wonosari Village was the only hamlet without artesian wells for irrigation, relying almost 100% on river water to irrigate paddy fields (Figure 8A,C).
Winongan Sub-district had more extended irrigation channels compared to Gondang Wetan Sub-district, reaching 76.6 km in length (Table 4). Mendalan Village in Winongan Sub-district was the area with the most elongate irrigation channels (20.3 km). Kebon Candi Village in Gondang Wetan Sub-district had the shortest channels compared to other villages (7.27 km). At hamlet level, hamlets in Winongan Sub-districts such as Mendalan, Sukun, Kurban, Gading, Kalongan, Kletek Lor, Kletek Kidul, Putat, Krajan, Gondang, and two hamlets in Gondang Wetan Sub-district such as Karangasam and Ngemplak were classified as the highest drainage density, i.e., 8.5–11.3 km/km2 (Figure 8B).

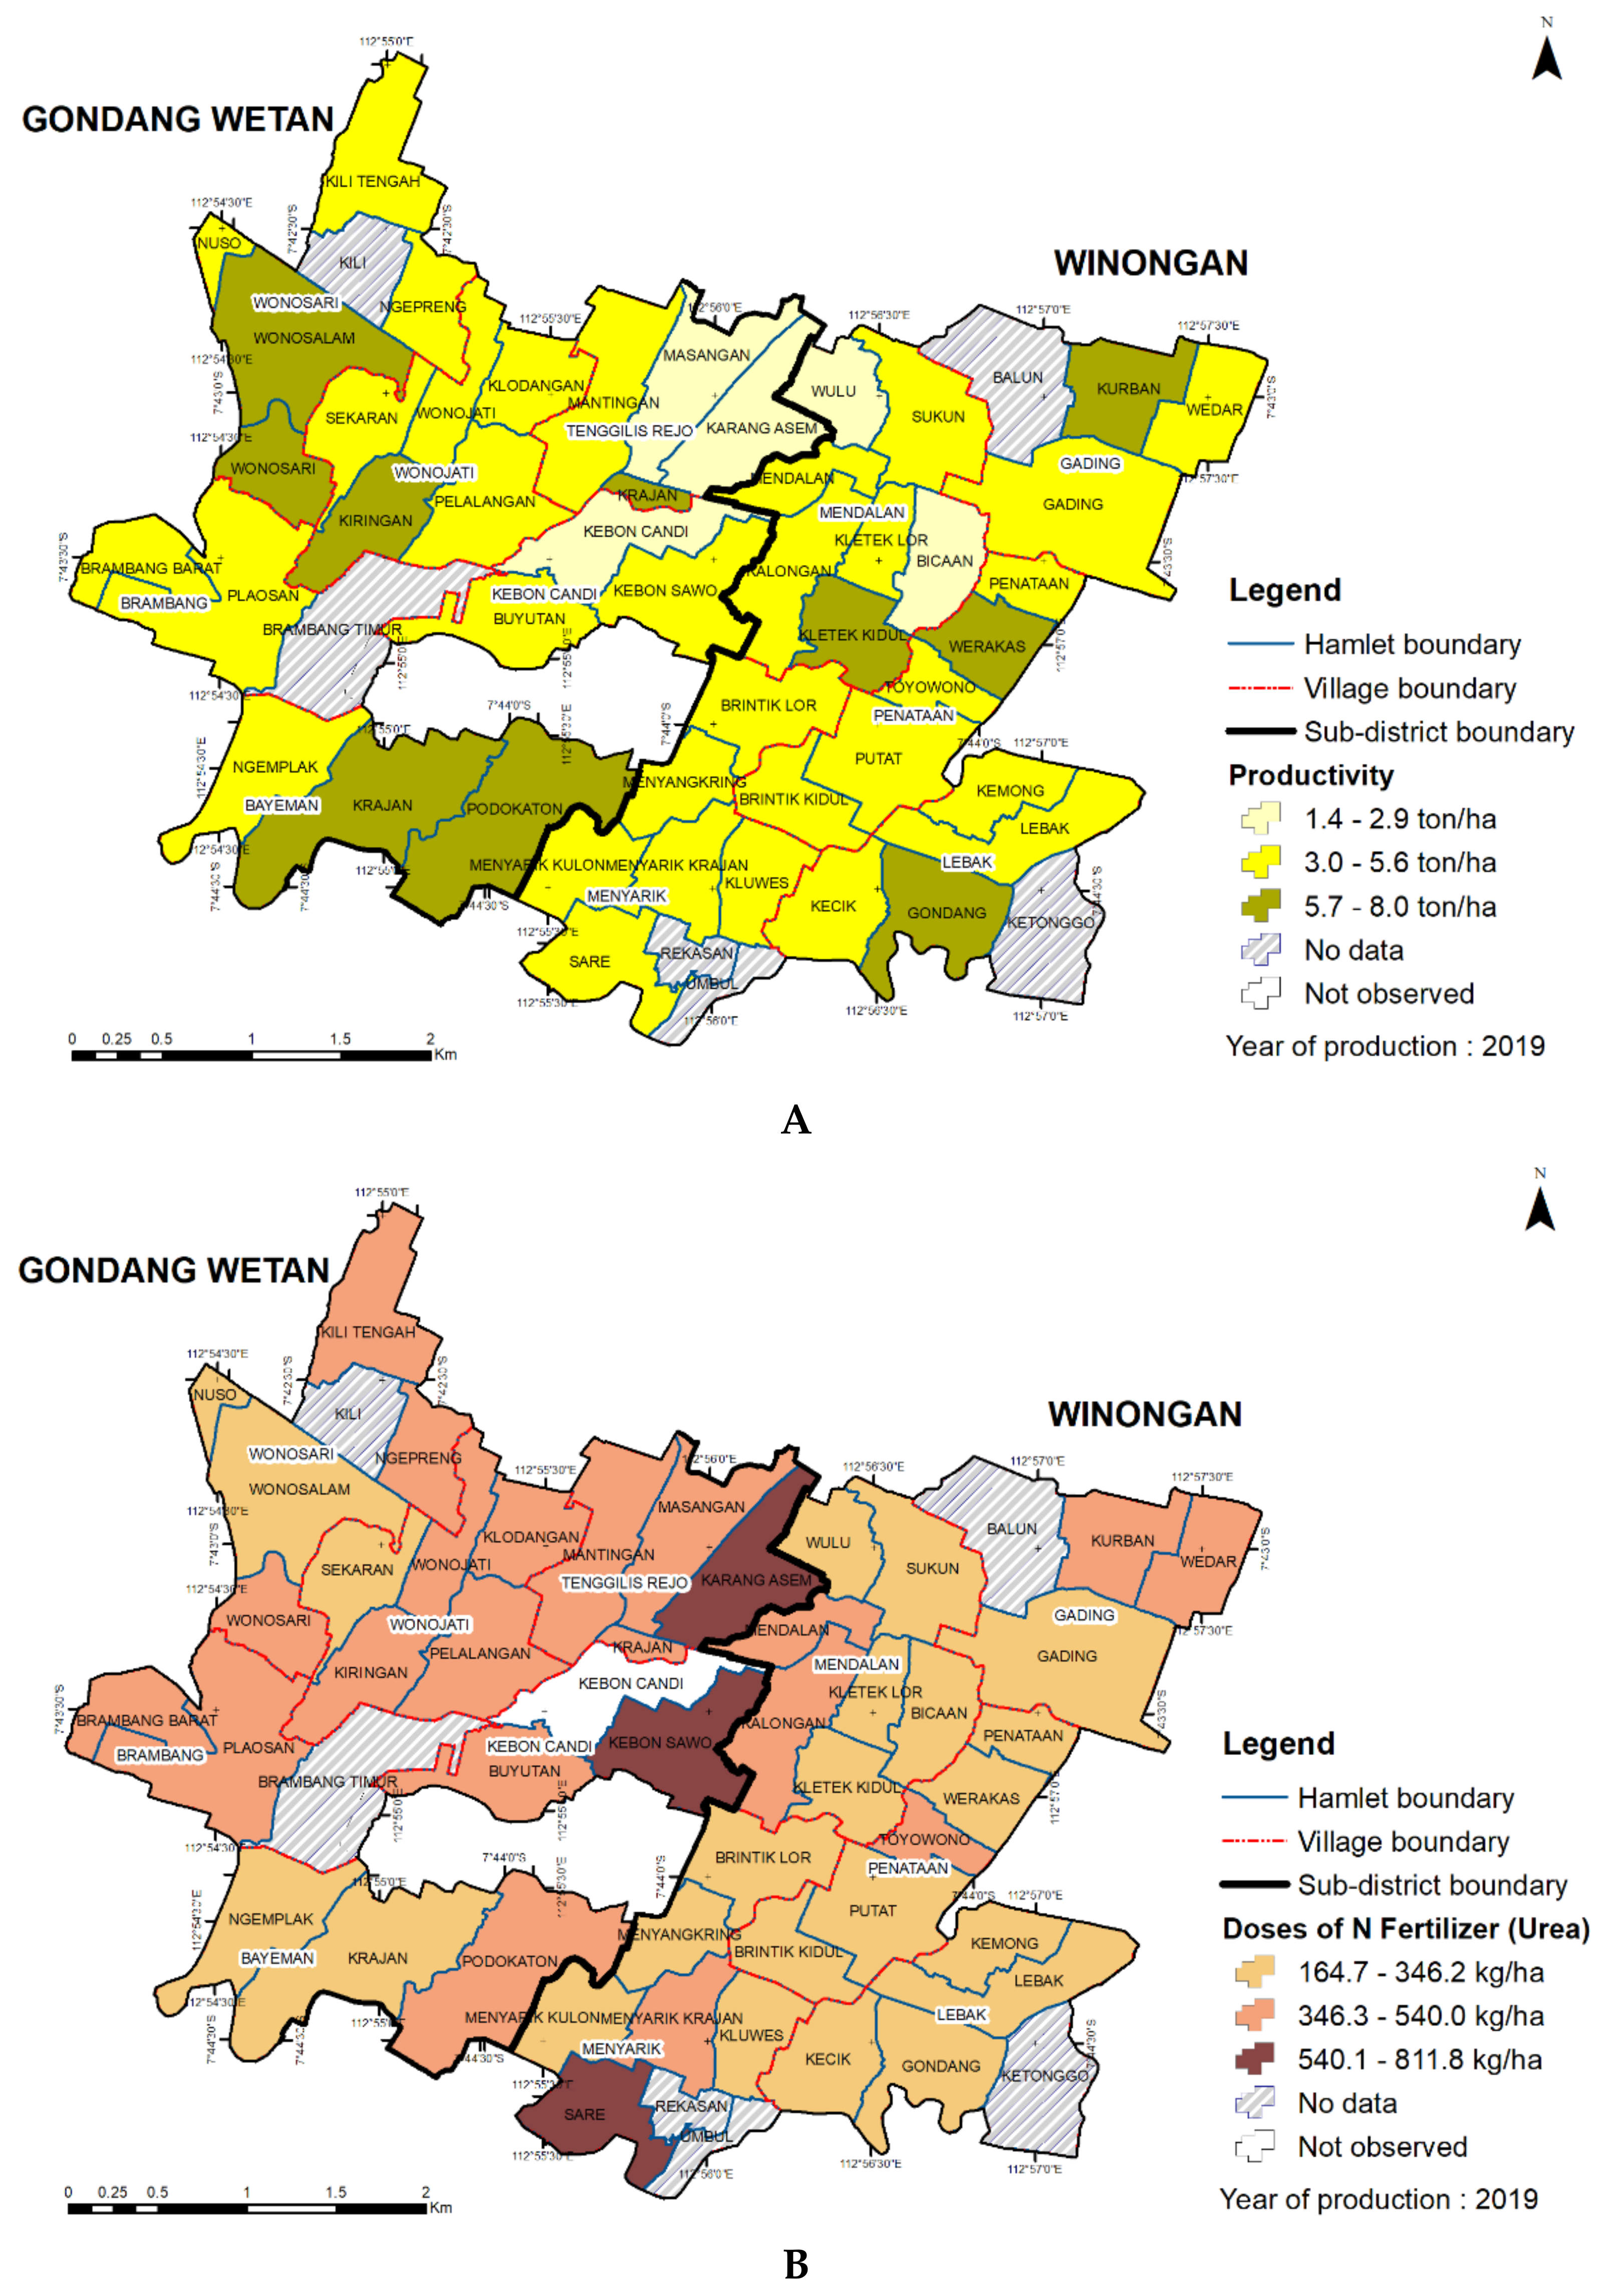
3.4. Rice Yield and Fertiliser Application

Farmers in Gondang Wetan Sub-district tended to apply a higher dose of fertiliser compared to farmers in the Winongan Sub-district (Table 5). The average dose of N fertiliser (Urea) applied by farmers in Gondang Wetan was 436 kg/ha/season and 322 kg/ha/season for compound fertiliser (NPK), while farmers in Winongan Sub-district applied N fertiliser about 343 kg/ha/season and compound fertiliser about 266 kg/ha/season. However, Gondang Wetan and Winongan Sub-districts had the same average of rice yield of 4.9 tons/ha/season, with distribution between 4.1-6.7 tons/ha/season (Table 5). Bayeman in Gondang Wetan and Gading in Winongan were villages that had the highest average of yield. Tenggilis Rejo in Gondang Wetan Sub-district was the village with the highest use of fertiliser, which was almost 600 kg/ha/season for N fertiliser and 370 kg/ha/seasons for compound fertiliser. It was indicated that high yield did not necessarily depend on high fertiliser rates (Table 5).
At the hamlet level, Krajan in Bayeman Village and Kurban in Gading Village were hamlets with the highest rice yield (almost 8 tons/ha/season) (Figure 9A). Karang Asem and Krajan in Tenggilis Rejo Village, and Kebon Sawo in Kebon Candi Village were some hamlets with the highest use of urea (above 540 kg/ha/season) and compound fertiliser (more than 348 kg/ha/season) (Figure 9B,C). Hamlets with low yield were Masangan, Karang Asem, Wulu, Bicaan, and Kebon Candi (Figure 9A).

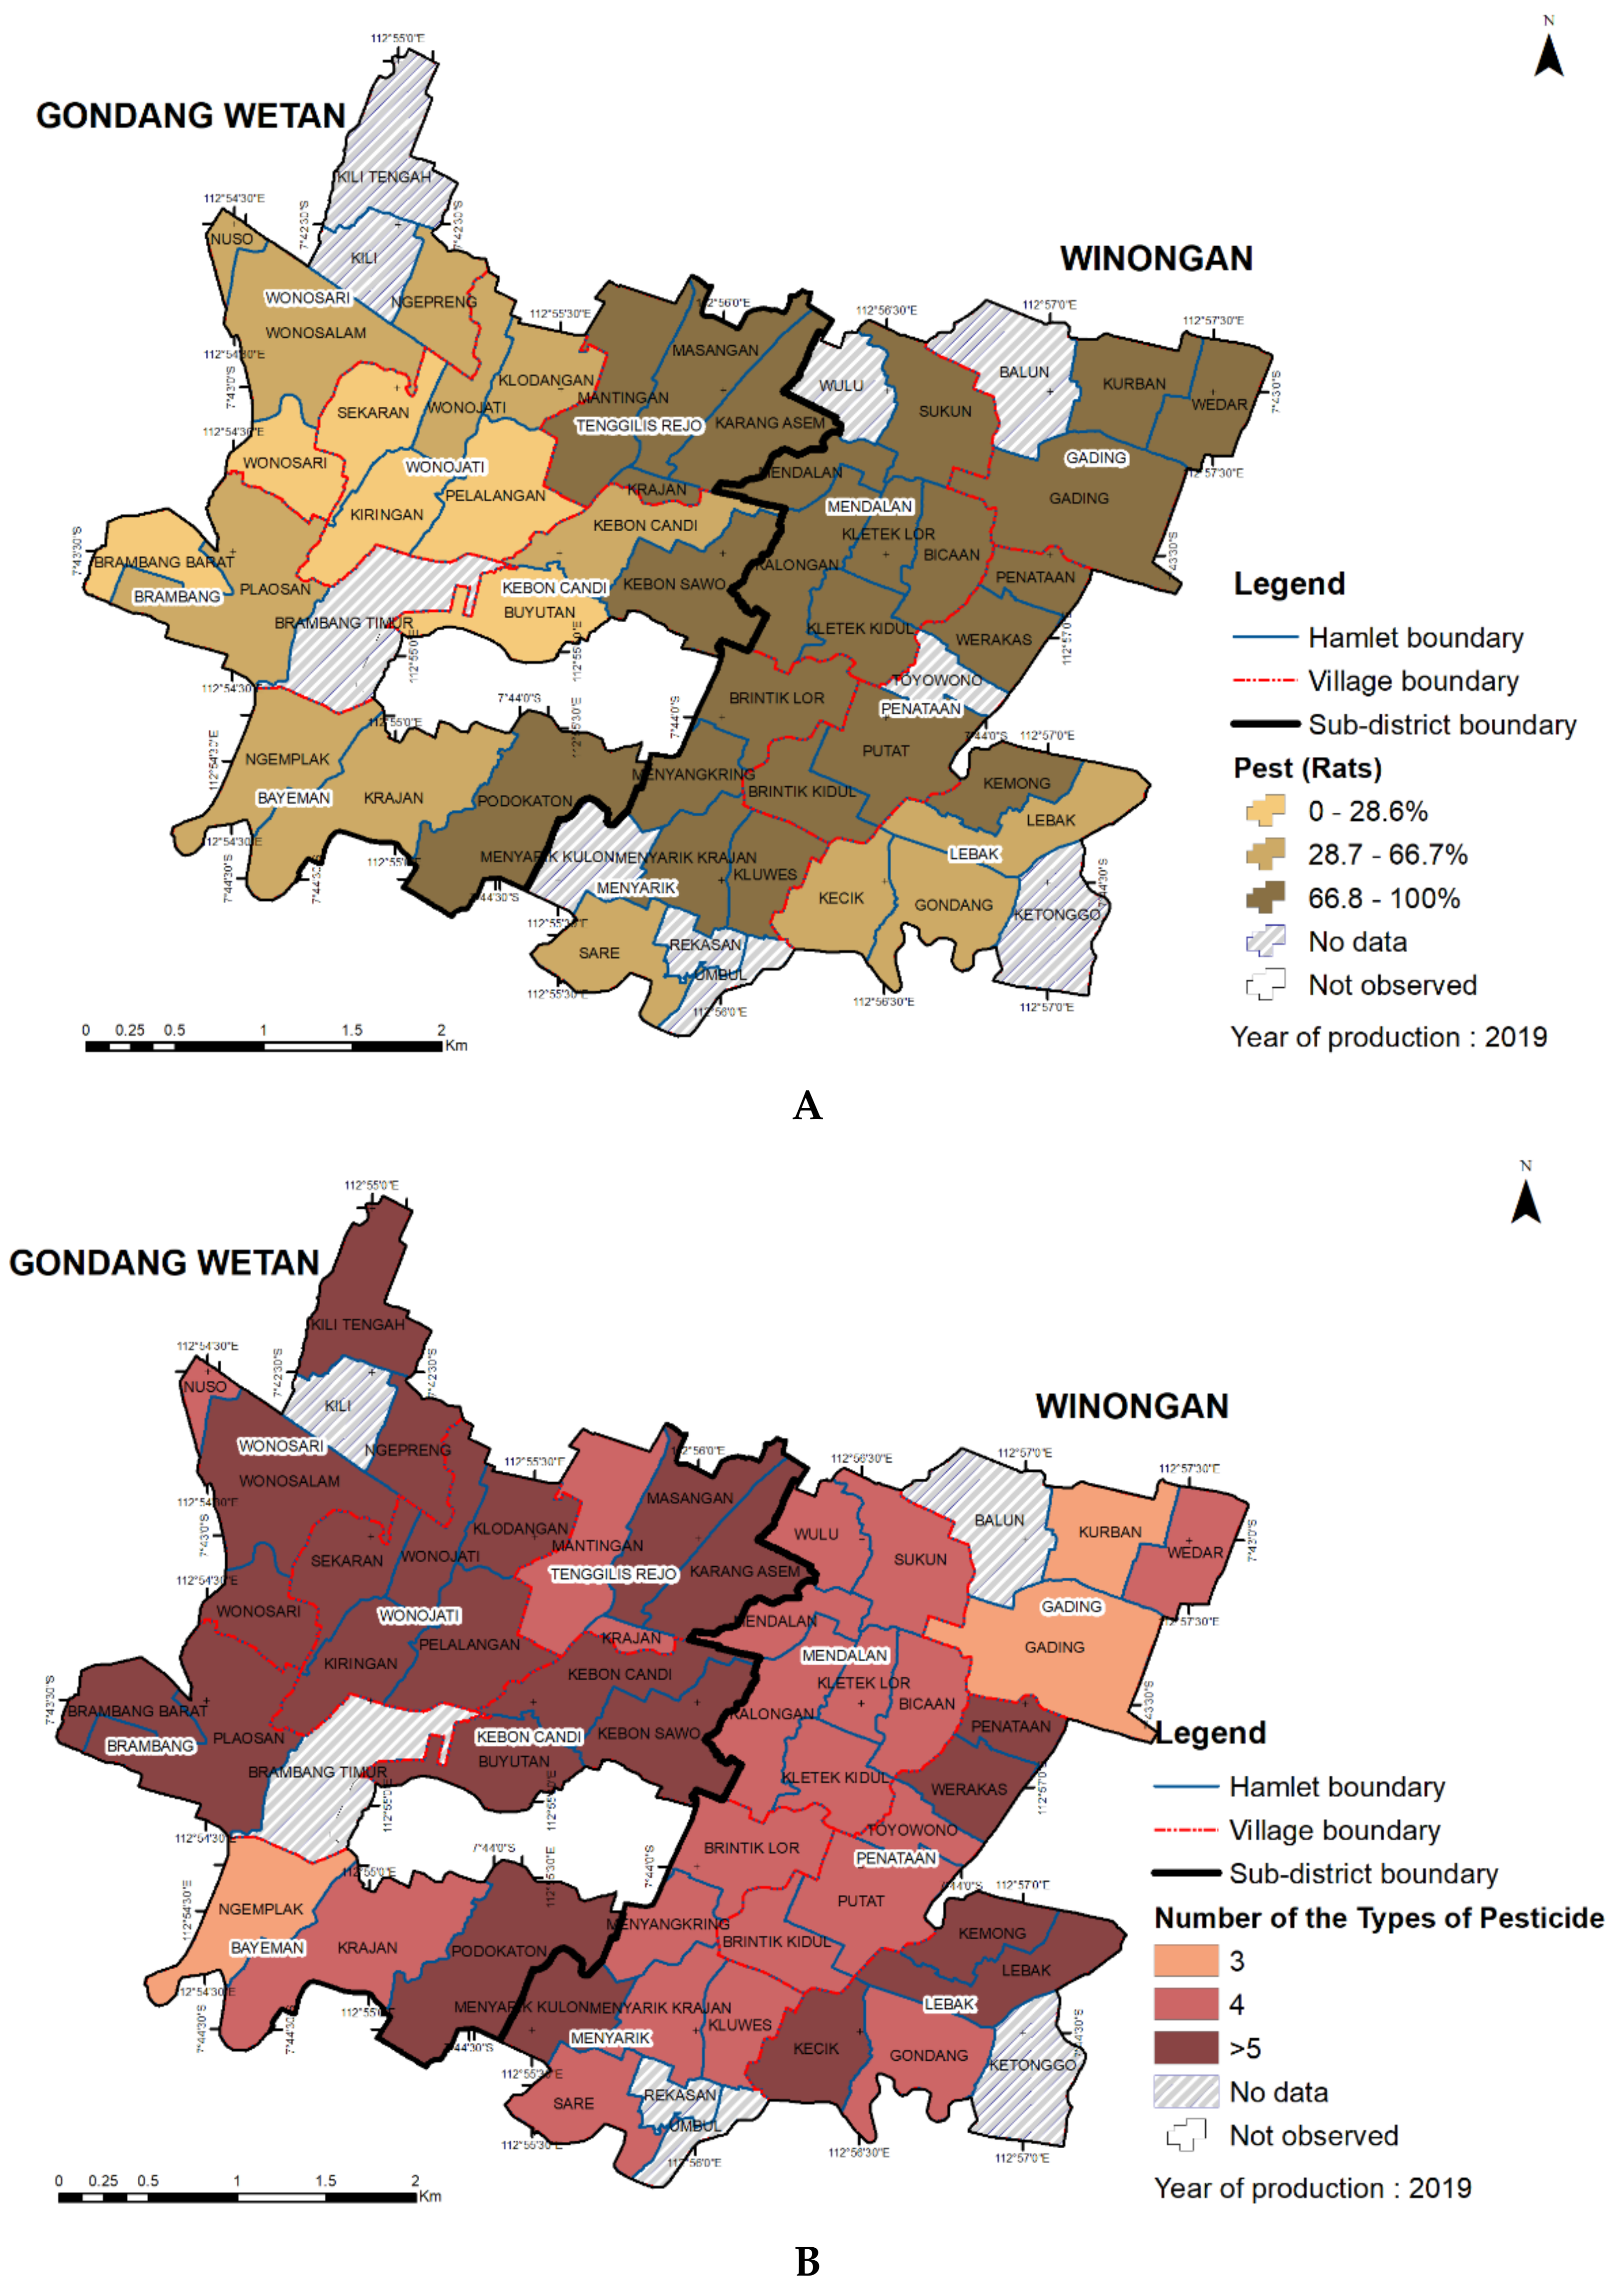
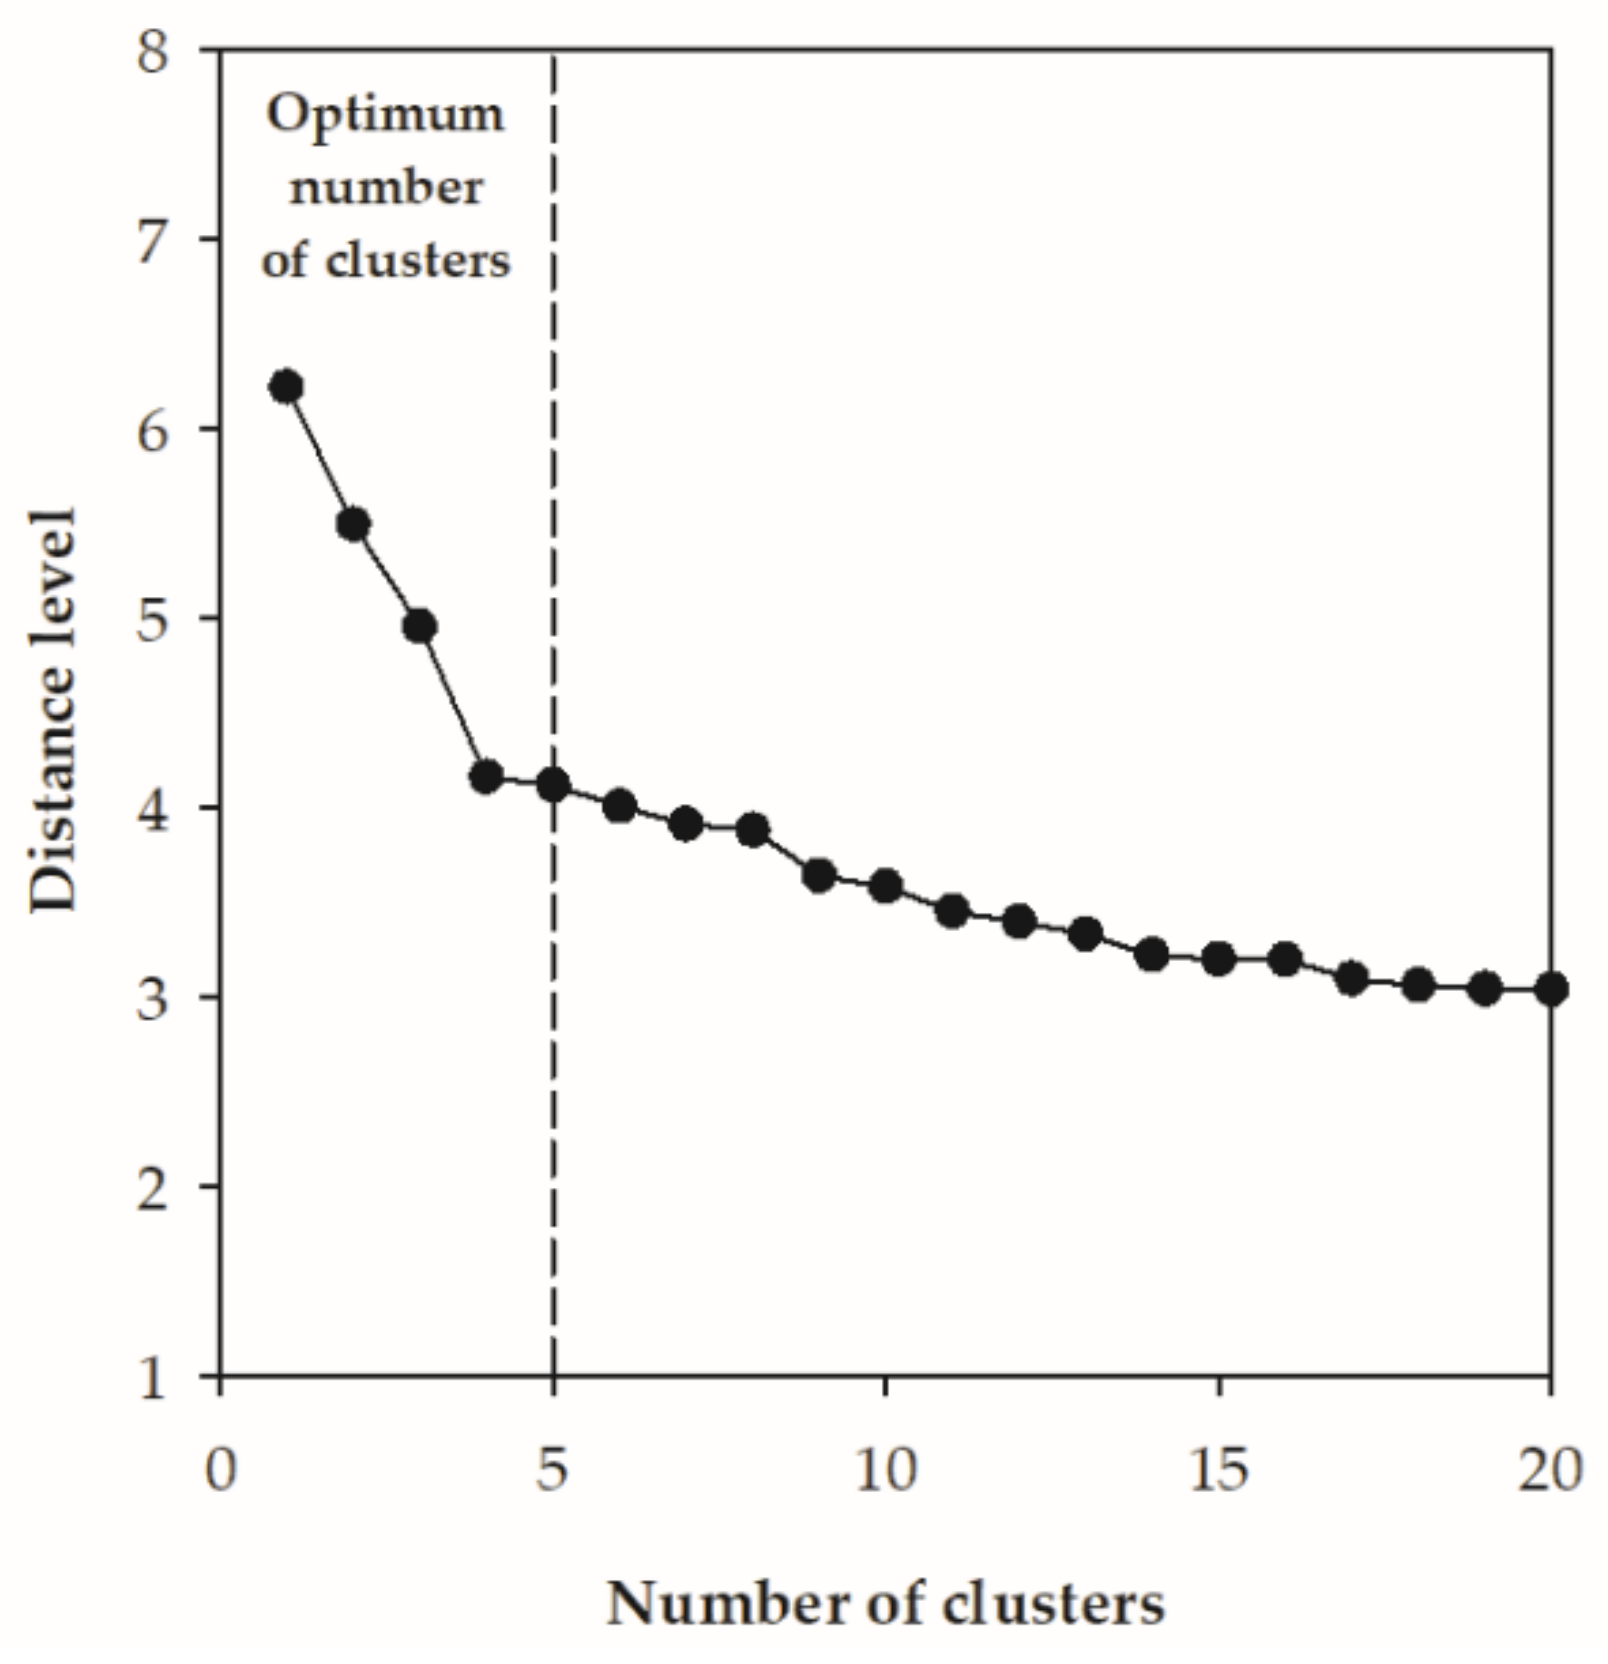
3.5. Intensity of Pest/Rodents and Number of Type of Pesticides Applied

Regarding the main problem of paddy cultivation, farmers in both Gondang Wetan and Winongan Sub-districts agreed that the high intensity of rodent attacks was the major problem in need of immediate attention. However, the respondents in Winongan Sub-district mentioned that rodents were the main problem, and their condition was worse than in Gondang Wetan (Table 5). Figure 10A shows that most paddy fields in Winongan Sub-district suffered from rodents. In Gondang Wetan Sub-district, only paddy fields in hamlets or villages next to Winongan Sub-district had a high intensity of rodent attacks, especially during rainy season. Until this study was undertaken, farmers were still struggling with how to deal with rodents. In terms of pests and disease control, there were more than 100 brands of pesticides used by farmers. Farmers in Gondang Wetan and Winongan Sub-districts used at least three brands, but some applied more than seven brands of pesticides in one season. In general, farmers in Gondang Wetan Sub-district applied more brands of pesticides compared to farmers in Winongan Sub-district (Figure 10B).

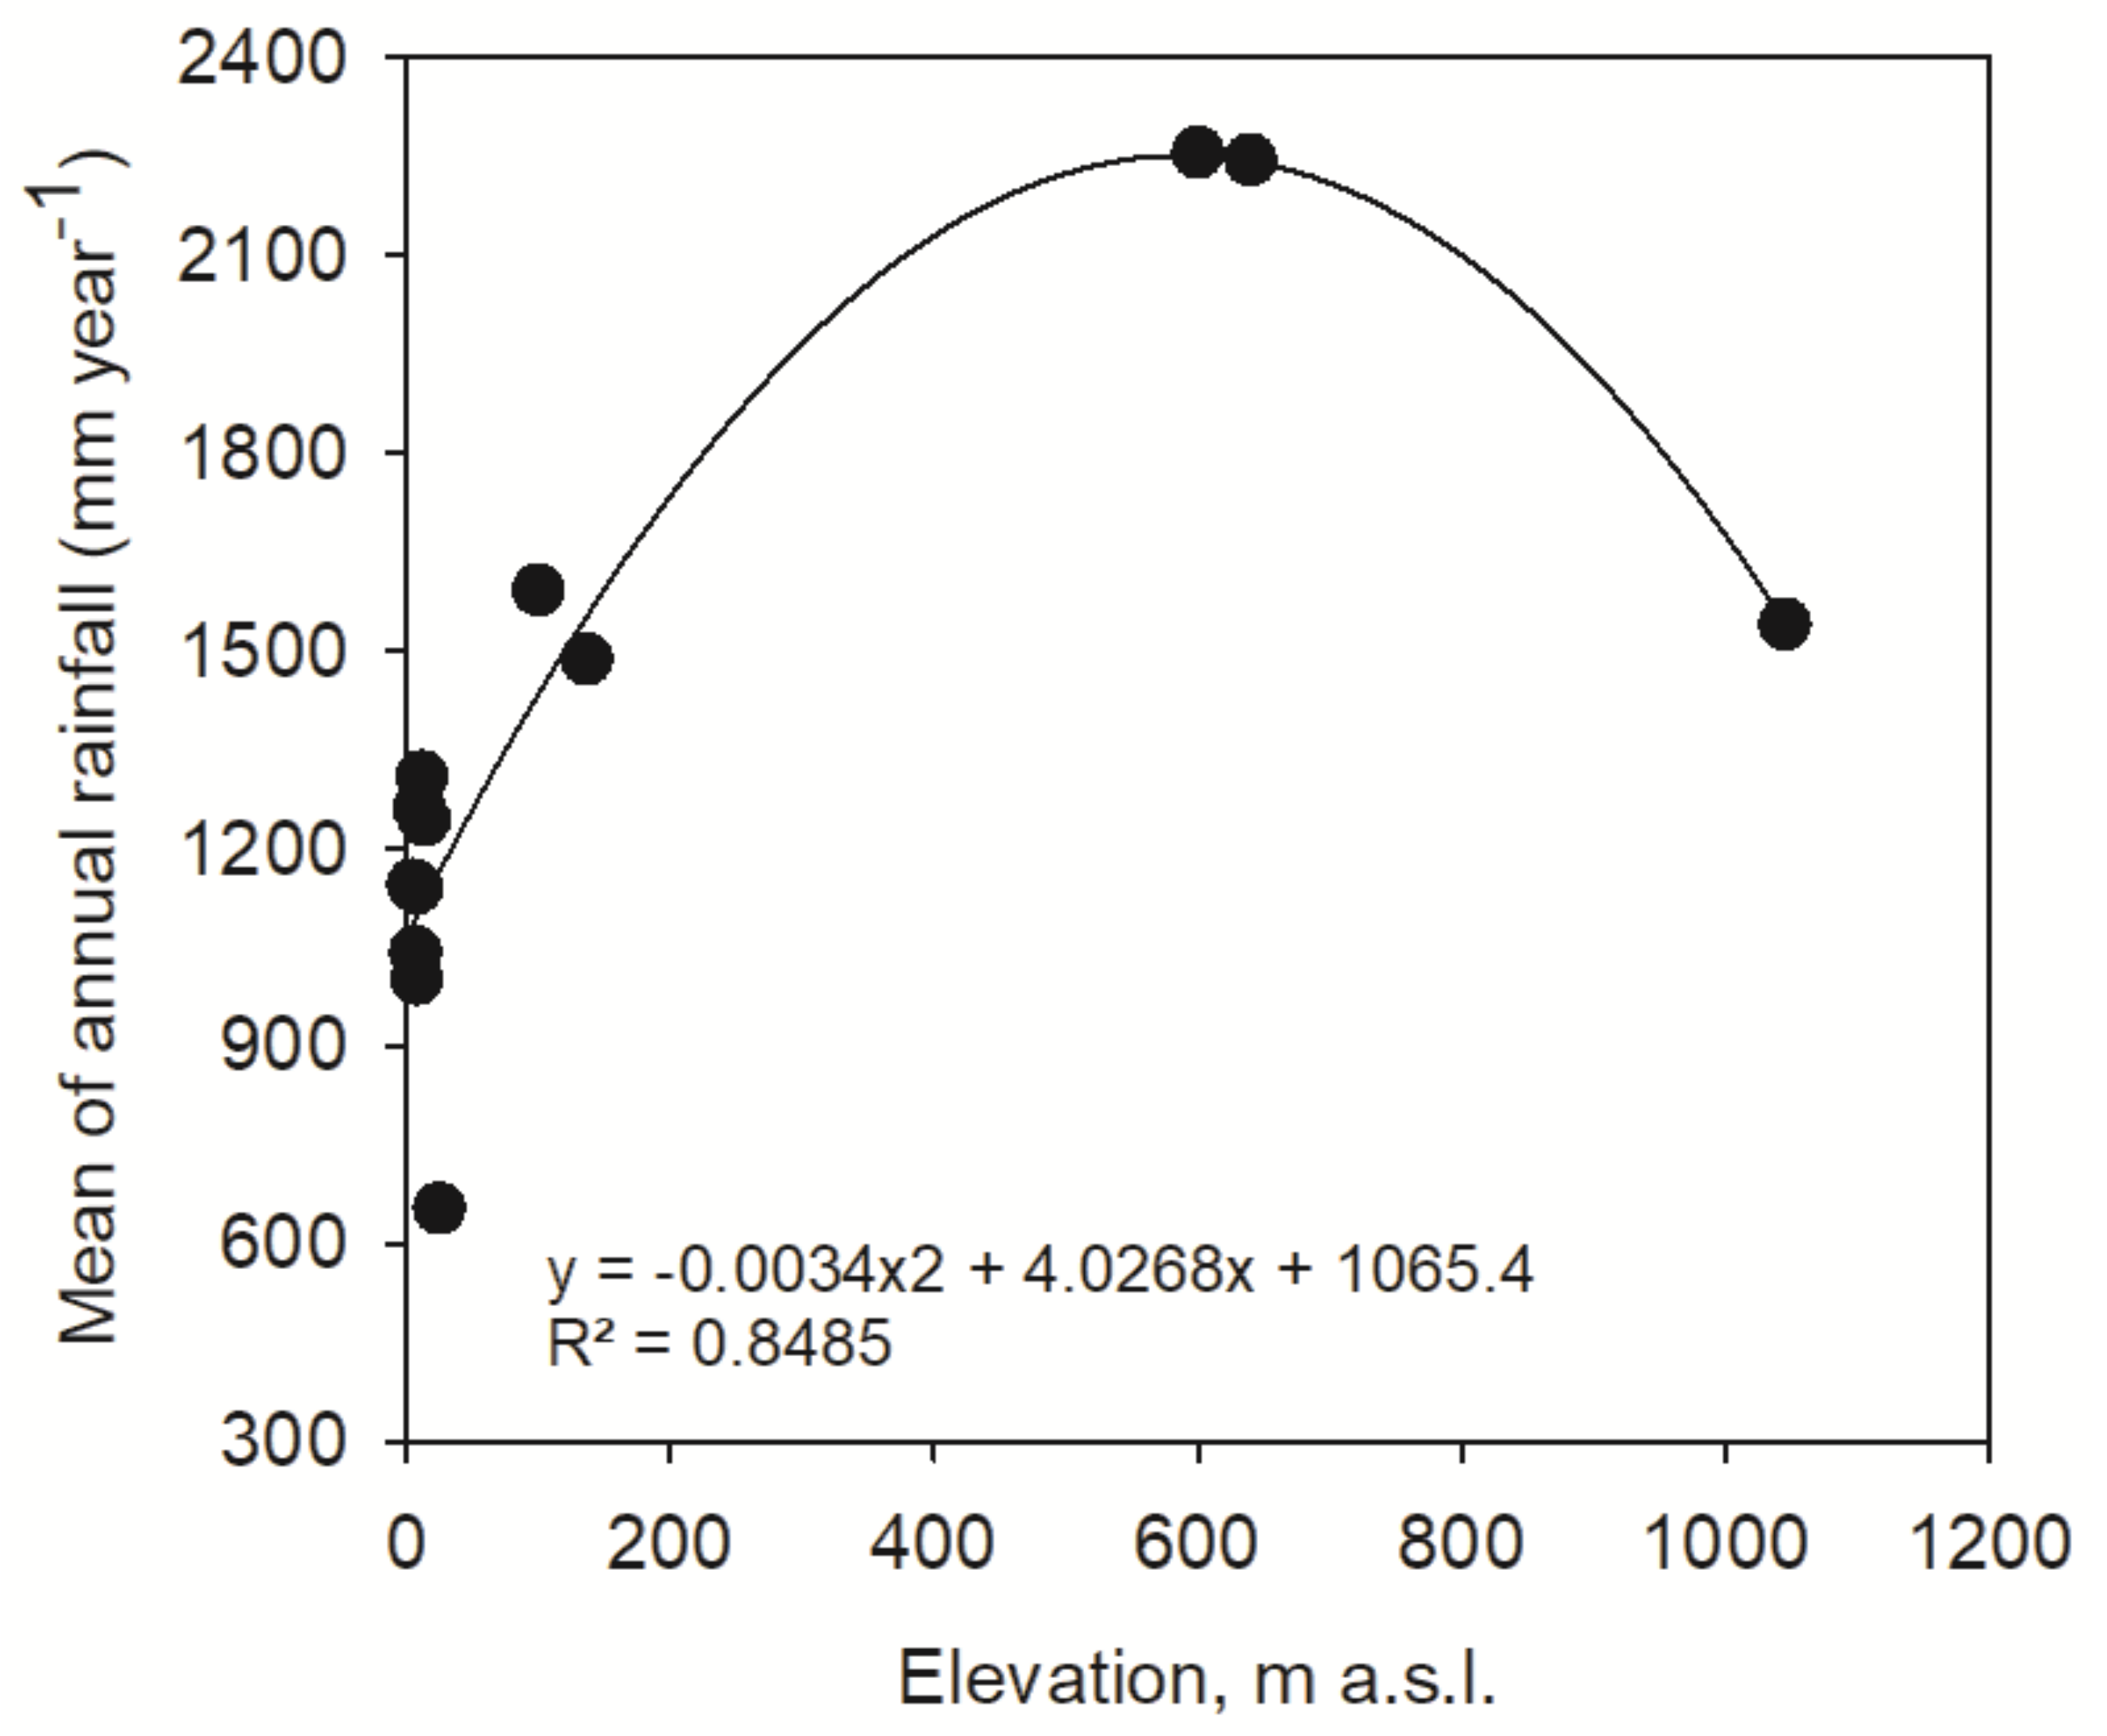
3.6. Characteristic of Paddy Farming

The twelve parameters (paddy field area, drainage density, number of artesian wells, the dose of N fertiliser, the dose of compound fertiliser, number of pesticide types, yield, the area with crop rotation, the intensity of rodents attack, number of water sources, river as the primary water source and presence of water regulatory officer) are independent to each other. The cluster analysis of the twelve parameters and the elbow method (Figure 11) allows us to have five clusters of paddy fields in eleven villages of Gondang Wetan and Winongan Sub-districts. Figure 12 presents the map of the resulting characteristic of paddy farms in eleven villages, and Table 6 and Table 7 describe the characteristics of each cluster. Cluster 1 was in Gondang Wetan Sub-district, cluster 2 was mostly in Winongan Sub-district, and cluster 5 was spread evenly in both sub-districts (Figure 12). Meanwhile, clusters 3 and 4 consisted of only 1 hamlet, which was located in Gondang Wetan Sub-district.

4. Discussion

4.1. Relevance of Reducing Groundwater Use in Lowland Zone

Our first question was seeking quantitative evidence that the lowland practices are co-responsible for the decrease of the Umbulan spring’s discharge. The estimated total outflow of the artesian wells (over 2400 L/s in 450 measured wells; currently there may be 600 wells) does not fully account for the observed decline in the Umbulan spring flow record (from 5000 to 3500 L/s with a declining trend). The water balance results of Table 3 suggest that the lowland paddy production through its reliance on unconstrained artesian wells has been the major contributor to the observed decline of the Umbulan spring, but changes in the upper and middle zone also contribute. The water balance model includes some interactions between surface and groundwater flows, but models at a higher temporal resolution that include seasonal patterns of rainfall could refine the results in future. The attribution of effects as 55% lowlands, 49% upland and 4% interaction is, at the current level of detail in the analysis, only indicative; however, it is consistent with process understanding. Models that operate on a daily time step and at higher spatial resolution will be needed [31,32], but tend to require parametrization efforts that challenge current data availability.

4.2. Groundwater-Wasting Irrigation Methods: Understanding Farmer Decisions

The second question sought relevant geographic variation between villages and hamlets in the farmer’s practices in managing land and water in cultivating paddy. The shift from rainfed sugarcane to irrigation-based paddies in Pasuruan district got a boost when relatively cheap groundwater drilling with bore holes of 10–100 m (or more) provided additional water, year-round. Without any control valve to manage the well’s flow, excess groundwater was channelled back to the river and then lost to the sea. Agronomically, the water supply is considerably in excess of crop demand, with the average 10 mm/day of well supply per unit paddy area, two to three times the potential evapotranspiration rate, even without accounting for rainfall and river-based irrigation water. The high crop frequency, approaching three crops per year and currently reaching five crops per two years leaves short time for a break between crops. As the landscape as a whole is permanently saturated, the rice crop does not ripen off well and the harvested product is only of medium quality. Crop rotations with other crops are applied to only a small part of the area. Despite abundant water availability and intensive fertilization, however, rice yields of around 5 ton per ha in the survey were below the 5.8 ton per ha reported for the district [19] and representing a nearly 50% yield gap relative to the potential yield for irrigated rice in Indonesia of around 9.5 ton per ha [33]. Within our data, there was no indication that variation in yields were related to variation in fertilizer level (either Urea or compound fertilizer, the two were strongly correlated). Rodents were widely seen by farmers as the main yield-reducing factor, and despite ample use of pesticides, could not be controlled at farmer level. It appears that the current intensification pathway is reaching a dead end, where they produce large volumes of a medium quality product at considerable environmental costs and, even if these externalities are ignored, modest farmgate profitability.
Investment in closing the existing wells and replacing them by wells with improved design that can be turned off when not needed appears to be a cost-effective way for external stakeholders to recover the flow at the Umbulan spring (and the millions of households that can thus be supported). In addition, the irrigation from artesian wells only during the night can avoid water wasting from evaporation process during the day. A substantial reduction of groundwater wasting seems to be feasible without risking water shortages in critical periods for the crop. However, for a free flowing well the only decision is in its construction, whereas a controlled well requires agreements among farmers about when it will be opened.

4.3. Collective Action Aspects of Solutions

The third question was whether a participatory survey of paddy cultivation and spatial data analysis for the development of characteristic can identify options by context for upscaling sustainable paddy cultivation. Sustainable agriculture within a sustainable landscape context is beyond food production, it safeguards the increasing capacity of rural people to be self-reliant and resilient when facing changes and shocks and building strong rural institutions, including landscape governance, and their economies [34]. A well-known analysis of the Bali water temples in Indonesia, or ‘subak’ in the local language, highlights the importance of local institutions that secured synchronous rice planting [35]. Synchronous rice planting ensured landscape-wide breaks between cropping seasons in the traditional system, that effectively controlled rodents. When the water temples were abandoned and technical irrigation allowed for an increased cropping frequency, rodent problems came to the fore in Bali. It appears that with the unconstrained artesian wells in Rejoso, an even easier year-round availability of habitat and food supports rat populations beyond control.
Following this line of interpretation, we suggest that in the Rejoso watershed context, the lack of strong farmer institutions imply an inability to synchronise planting calendars and that this has become one of the principal causes of aggravating rodent pest attack. When farmers can collectively dry their paddy field, this cycle of fallow can reduce the rodent pressures. Thus, the management of rodent pest problems (which directly link to yield and income) can be considered as a collective driver to strengthen local institutions, which at the end leads to better water management and may allow win–win solutions of water-saving and yield increase to be feasible.

4.4. Sustainable Paddy Cultivation and Its Relevance to Global Agenda and Practices

Our efforts to understand existing constraints to a sustainable production landscape in the Rejoso watershed showed that among the eleven villages in the Gondang Wetan and Winongan Sub-districts, a substantial variation in farmer’s practices in managing the land could already be found. Given this variation, a one-size-fits-all solution is not likely to work. Our current understanding of such variations of the paddy field enables the landscape managers and decision-makers to identify the potential area for upscaling specific solutions and to ensure that the adoptions of interventions run smoothly because the process has embraced potential constraints and solutions according to the perspectives of smallholders and local communities.
Our approach aligns with a global agenda. The innovations of sustainable production landscape management consider the dual goals of reducing environmental impacts while increasing productivity. Discussion of the interconnected dimensions of sustainable production landscape is not new, while understandings and solutions towards actions to transform the environmentally sustainable food production systems are still unresolved [36].
The research by Pretty et al. [37] on the adoption of practices and technologies for environmentally sustainable with substantial benefits for the rural poor hold promising advances. The 208 projects were derived from 52 countries of the South resulted in approximately 8.98 million household farming 28.92 million ha representing 3.0% of the 960 million ha of arable and permanent crops in Africa, Asia and Latin America, adopted and practised sustainable agriculture. Knowledge from the literature confirms that increasing paddy productivity while reducing environmental impacts is doable. Likewise, it is attainable that farmers practice more efficient water use [38] and emit less CH4 and N2O [39,40].

4.5. Potential of Development of Paddy Farming Characteristic for Intervention Scenario and Upscaling

The five clusters identified here represent variation of farmer’s practices in managing the land and cultivating paddy. Each cluster provides unique information with different degrees of the constituent parameters, yet still presenting the whole targeted landscape. Intervention scenarios might include incentives for sustainable cultivation, such as insurance of stable agricultural inputs, microcredit, agricultural insurance, market transparency, and capacity strengthening in farmer group management. Table 8 presents the analysis and the risks for intervention and upscaling in each paddy field cluster. Clusters with high risk, when targeted for conducting innovative interventions, will provide ‘gold standards’ of success, compared to the ones with low risks.
The proposed characteristic of paddy farming that considers the variation of farmer’s practices in managing the land and cultivating paddy corresponds to the requirement to implement an ‘options by context’ approach [8]. Rather than selections based on proximity to the central power, or ‘low-hanging fruit’ ones, we expect that through the ‘options by context’, a more robust selection of locations and intervention scenarios allow for higher adoption rates with expected results and calculated risks of the innovations at each cluster. However, ongoing implementation efforts will have to provide the test of effectiveness. We identified some limitations in the methods applied.

4.6. Implications for Methodology

From the survey of paddy cultivation, identification of respondents by combining available information of farmer group and its member and a snowball technique is an ideal approach. However, the unavailability of up-to-date farmer group data was a challenge, and the impacts were on the length of time in finding a respondent and level of respondent representation in each hamlet. During the data analysis, the domicile of the farmer and the location of the paddy field can be unmatched. The domicile of some respondents can be outside of the eleven villages. Considering that the interventions would be delineated according to the sub-district jurisdictional boundary, the data of seven percent of the respondents who stayed outside the eleven villages were eliminated. Hence, we suggested that the filtering process in selecting respondents should be better from the beginning, and the number of respondents in each hamlet should be adequately represented if resources allow. Apart from the above limitation, we ensured that information gained from the farmer representatives were well obtained, and a structured questionnaire complemented the interviews.
Analysis of spatial data based on aerial photograph/drones produced a high-resolution image. However, the direct georeferencing method that we applied referred that orthorectification was processed without ground control point (GCP) and independent checkpoints (ICP), resulting in a mild shift of location and take effect of Root Mean Square Error (RMSE) value. Although the shifting is about 2–2.5 m compared to orthorectification using GCP and ICP [41], in the future, we suggested applying GCP and ICP for similar analysis to increase geometric accuracy when resources allow. Other analyses to increase the degree of spatial data accuracy focused on verification of the area of paddy fields with annual crop rotation. Multi-temporal images should be used, or a detailed survey of farmers should be conducted to obtain more accurate area estimates of paddy fields with annual crop rotation.

5. Conclusions

The production landscape of the Rejoso watershed has problems of unsustainable agricultural development, particularly on its lowland part, where paddy is the primary land use. The unrestricted use of artesian wells to irrigate rice paddies is reducing the pressure on and water yield of artesian wells for urban water users, while the actual rice yields achieved are below potentials achieved elsewhere. The introduction of water-saving technology, with modification of conventional paddy cultivation, and better design and management of artesian wells more control over the wells, can target yield improvement as well as positive environmental impacts. Considerable variation was found to exist within this paddy-dominant production landscape. Our analysis of the variation of farmer’s practices in managing the land and cultivating paddy was based on a survey of paddy cultivation and spatial data analysis complemented and verified by the participatory approach indicating the application of landscape-approach in its development. The characteristics of paddy farming as the results reflect the requirement to implement an ‘option by context’ approach within a landscape for targeting effective, yet efficient, interventions and upscaling technological improvement. The characteristic of paddy farming encompassed five clusters of paddy farms. Clusters were characterised based on the relative area of paddy fields, the density of irrigation networks, area with crop rotation, rice yield, the dose of fertiliser, number of pesticide types, water sources, and the intensity of pests/rodents. Hamlets within a cluster are similar in characteristics of farmer’s practices and have unique, contextual conditions. We discussed the potentials and risks of such characteristics for further implementation and upscaling. Clusters with high risk, when targeted for conducting innovative interventions, will provide ‘gold standards’ of success, compared to the ones with low risks. The information is expected to be useful for the landscape managers and decision-makers in targeting, considering, and budgeting the interventions that are relevant for sustainable landscape management. Future applications of a spatially differentiated intervention approach to innovate in the direction of sustainable paddy cultivation based on water saving is expected to reduce environmental impacts while increasing productivity. On-the-ground empirical action research activities engaging research organisations, private sectors and financing institutions are ongoing.

Author Contributions

N.K., L.T., and B.L. designed the study. L.D.Y.P. collected and analysed spatial data and was supervised by A.H. and M.T.Z. F.M. and E.P. collected paddy cultivation data and were supervised by L.T. L.T. analysed paddy cultivation data. N.K., L.T., L.D.Y.P., A.H., M.T.Z. writing the original draft. N.K., B.L., L.T., and M.v.N. shaped the original draft into the manuscript, which was approved by all co-authors, A.T. provided the ecohydrological backgrounds of the Rejoso watershed to improve the manuscript. All authors have read and agreed to the published version of the manuscript.

Funding

The research was funded by the Danone Ecosystem Fund through “Sustainable, Low Carbon Emissions and Water-Efficient Agriculture of Rejoso Watershed” project.

Conflicts of Interest

The authors declare no conflict of interest.

Appendix A. Calibrating the Annual Water Balance Model

Data for mean of annual precipitation (P) were obtained from 13 rainfall stations in lower zone (7 stations), middle zone (5 stations) and upper zone (1 station) (Table A1). Precipitation for each zone (lower zone < 100 m a.s.l., middle zone 100–1000 m a.s.l. and upper zone m a.s.l.) was then generated based on correlation of elevation and annual mean of rainfall (Figure A1). Potential evapotranspiration Epot were generated using Thornthwaite equation using temperature data of Accu weather (Table A2).
Table A1. Mean of annual rainfall for 13 rainfall stations.
StationsZoneElevation (m a.s.l.)Mean of Annual Rainfall (mm/year) *)
P3GILower51143.49
KedawungLower71041.40
Gondang wetanLower81000.30
Kawis rejo-RejosoLower81138.33
WinonganLower101259.06
Gading-WinonganLower121307.53
Ranu GratiLower141242.07
Sidepan-Umbulan-WinonganLower25652.33
Wonorejo-LumbangMiddle1001590.71
LumbangMiddle1371485.71
Panditan-RejosoMiddle6002255.14
PuspoMiddle6402243.86
TosariUpper10451539.27
*) 1990–2015.
Figure A1. Correlation between mean of annual rainfall and elevation of 13 rainfall stations.
Land 10 00586 g0a1
Table A2. Potential evapotranspiration of three zones.
ZonesMean of Annual Temperature (°C)Total Potential Evapotranspiration (mm year−1)
199020152020199020152020
Upper171717770.4770.4770.4
Middle2525251367.81367.81367.8
Lower2727271726.81726.81726.8
Parameter estimates for actual/potential evapotranspiration (ε) and runoff coefficient (ρ) were derived as area-weighted average from estimate for the specific land use types in the GenRiver model, calibrated for a number of Indonesian watersheds [29].

References

  1. Millennium Ecosystem Assessment. A Report of the Millennium Ecosystem Assessment. Ecosystems and Human Well-Being; Island Press: Washington, DC, USA, 2005. [Google Scholar]
  2. Costanza, R.; d’Arge, R.; deGroot, R.; Farber, S.; Grasso, M.; Hannon, B.; Limburg, K.; Naeem, S.; Oneill, R.V.; Paruelo, J.; et al. The value of the world’s ecosystem services and natural capital. Nature 1997, 387, 253–260. [Google Scholar] [CrossRef]
  3. Olsson, L.; Barbosa, H.; Bhadwal, S.; Cowie, A.; Delusca, K.; Flores-Renteria, D.; Hermans, K.; Jobbagy, E.; Kurz, W.; Li, D.; et al. Land Degradation. In Climate Change and Land an IPCC Special Report on Climate Change, Desertification, Land Degradation, Sustainable Land Management, Food Security, and Greenhouse Gas Fluxes in Terrestrial Ecosystems; Shukla, P.R., Skea, J., Buendia, E.C., Masson-Delmotte, V., Pörtner, H.-O., Roberts, D.C., Zhai, P., Slade, R., Connors, S., van Diemen, R., et al., Eds.; IPCC: Geneva, Switzerland, 2019; in press. [Google Scholar]
  4. Minang, P.A.; van Noordwijk, M.; Freeman, O.E.; Mbow, C.; de Leeuw, J.; Catacutan, D. (Eds.) Climate-Smart Landscapes: Multifunctionality in Practice; World Agroforestry Centre (ICRAF): Nairobi, Kenya, 2015; p. 405. Available online: http://www.worldagroforestry.org/publication/climate-smart-landscapes-multifunctionality-practice (accessed on 12 November 2020).
  5. Estrada-Carmona, N.; Hart, A.K.; Declerck, F.A.J.; Harvey, C.A.; Milder, J.C. Integrated landscape management for agriculture, rural livelihoods, and ecosystem conservation: An assessment of experience from Latin America and the Caribbean. Landsc. Urban Plan. 2014, 129, 1–11. [Google Scholar] [CrossRef] [Green Version]
  6. Wu, J. Landscape sustainability science: Ecosystem services and human well-being in changing landscapes. Landsc. Ecol. 2013, 28, 999–1023. [Google Scholar] [CrossRef]
  7. Van Noordwijk, M.; Leimona, B.; Jindal, R.; Villamor, G.B.; Vardhan, M.; Namirembe, S.; Catacutan, D.; Kerr, J.; Minang, P.A.; Tomich, T.P. Payments for environmental services: Evolution toward efficient and fair incentives for multifunctional landscapes. Annu. Rev. Environ. Resour. 2012, 37, 389–420. [Google Scholar] [CrossRef]
  8. Sinclair, F.; Coe, R. The options by context approach: A paradigm shift in agronomy. Exp. Agric. 2019, 55, 1–13. [Google Scholar] [CrossRef] [Green Version]
  9. Díaz, S.; Settele, J.; Brondízio, E.; Ngo, H.; Guèze, M.; Agard, J.; Arneth, A.; Balvanera, P.; Brauman, K.; Butchart, S.; et al. Summary for Policy Makers of the Global Assessment Report on Biodiversity and Ecosystem Services of the Intergovernmental Science-Policy Platform on Biodiversity and Ecosystem Services; IPBES: Bonn, Germany, 2020. [Google Scholar]
  10. Van Noordwijk, M.; Speelman, E.; Hofstede, G.J.; Farida, A.; Abdurrahim, A.Y.; Miccolis, A.; Hakim, A.L.; Wamucii, C.N.; Lagneaux, E.; Andreotti, F.; et al. Sustainable agroforestry landscape management: Changing the game. Land 2020, 9, 243. [Google Scholar] [CrossRef]
  11. Swallow, B.M.; Garrity, D.P.; van Noordwijk, M. The effects of scales, flows and filters on property rights and collective action in watershed management. Water Policy 2002, 3, 457–474. [Google Scholar] [CrossRef] [Green Version]
  12. van Noordwijk, M.; Van Roode, M.; McCallie, E.L.; Lusiana, B. Erosion and sedimentation as multiscale, fractal processes: Implications for models, experiments and the real world. In Soil Erosion at Multiple Scales; CAB International: Wallingford, UK, 1998; pp. 223–253. [Google Scholar]
  13. van Noordwijk, M.; Poulsen, J.G.; Ericksen, P.J. Quantifying off-site effects of land use change: Filters, flows and fallacies. Agric. Ecosyst. Environ. 2004, 104, 19–34. [Google Scholar] [CrossRef] [Green Version]
  14. van Noordwijk, M. Integrated natural resource management as pathway to poverty reduction: Innovating practices, institutions and policies. Agric. Syst. 2019, 172, 60–71. [Google Scholar] [CrossRef]
  15. Amaruzaman, S.; Khasanah, N.; Tanika, L.; Dwiyanti, E.; Lusiana, B.; Leimona, B.; Janudianto, N. Landscape Characteristics of Rejoso Watershed: Assessment of Land Use—Land Cover Dynamic, Farming System and Community Resilience; World Agroforestry Centre (ICRAF) Southeast Asia Regional Program: Bogor, Indonesia, 2018. [Google Scholar]
  16. Toulier, A.; Baud, B.; de Montety, V.; Lachassagne, P.; Leonardi, V.; Pistre, S.; Dautria, J.; Hendrayana, H.; Fajar, M.; Muhammad, A.; et al. Multidisciplinary study with quantitative analysis of isotopic data for the assessment of recharge and functioning of volcanic aquifers: Case of Bromo-Tengger volcano, Indonesia. J. Hydrolol. Reg. Stud. 2019, 26, 100634. [Google Scholar] [CrossRef]
  17. Scott, C.A.; Shah, T. Groundwater overdraft reduction through agricultural energy policy: Insights from India and Mexico. Int. J. Water Resour. Dev. 2004, 20, 149–164. [Google Scholar] [CrossRef]
  18. Toulier, A. Multidisciplinary Study for the Characterization of Volcanic Aquifers Hydrogeological Functioning: Case of Bromo-Tengger Volcano (East Java, Indonesia). Ph.D. Thesis, Montpellier University, Montpellier, France, 2019. [Google Scholar]
  19. Leimona, B.; Khasanah, N.; Lusiana, B.; Amaruzaman, S.; Tanika, L.; Hairiah, K.; Suprayogo, D.; Pambudi, S.; Negoro, F.S. A Business Case: Co-Investing for Ecosystem Service Provisions and Local Livelihoods in Rejoso Watershed; World Agroforestry Centre: Bogor, Indonesia, 2018. [Google Scholar]
  20. Suprayogo, D.; van Noordwijk, M.; Hairiah, K.; Meilasari, N.; Rabbani, A.L.; Ishaq, R.M.; Widianto, W. Infiltration-friendly agroforestry land uses on volcanic slopes in the Rejoso Watershed, East Java, Indonesia. Land 2020, 9, 240. [Google Scholar] [CrossRef]
  21. The Central Statistics Agency. Provinsi Jawa Timur Dalam Angka; BPS Jawa Timur: Surabaya, Indonesia, 2020. [Google Scholar]
  22. The Central Statistics Agency. Luas Panen dan Produksi Padi di Indonesia 2019 No. 16/02/Th. XXIII; BPS—Statistics Indonesia: Jakarta Pusat, Indonesia, 2020. [Google Scholar]
  23. Khumairoh, U. On Complex Rice Systems. Ph.D. Thesis, Wageningen University, Wageningen, The Netherlands, 2019. [Google Scholar]
  24. Creed, I.F.; van Noordwijk, M. Forest and Water on a Changing Planet: Vulnerability, Adaptation and Governance Opportunities. A Global Assessment Report; IUFRO World Series 38; IUFRO: Vienna, Austria, 2018. [Google Scholar]
  25. Geospatial Information Agency. Peta Digital Rupa Bumi Indonesia Skala 1:50,000; Geospatial Information Agency: Bogor, Indonesia, 2014. [Google Scholar]
  26. Pasuruan District Water-Related Public-Works Agency. Irrigation network of Pasuruan District; Pasuruan District Water-Related Public-Works Agency: Pasuruan, Indonesia, 2019. [Google Scholar]
  27. Lillesand, T.M.; Kiefer, R.W. Remote Sensing and Image Interpretation, 6th ed.; Wiley India Pvt: New Delhi, India, 2011. [Google Scholar]
  28. IFAD. Good Practices in Participatory Mapping: A Review Prepared for the International Fund for Agricultural Development (IFAD); IFAD: Rome, Italy, 2009. [Google Scholar]
  29. Cadag, J.R.; Gaillard, J.C. Integrating knowledge and actions in disaster risk reduction: The contributiin of participatory mapping. R. Geogr. Soc. Area 2011, 44, 100–109. [Google Scholar] [CrossRef]
  30. Kassambara, A. Practical Guide to Cluster Analysis in R: Unsupervised Machine Learning. Available online: http://www.sthda.com/english/2017 (accessed on 30 December 2020).
  31. van Noordwijk, M.; Tanika, L.; Lusiana, B. Flood risk reduction and flow buffering as ecosystem services-Part 2: Land use and rainfall intensity effects in Southeast Asia. Hydrol. Earth Syst. Sci. 2017, 21, 2341–2360. [Google Scholar] [CrossRef] [Green Version]
  32. Arnold, J.G.; Moriasi, D.N.; Gassman, P.W.; Abbaspour, K.C.; White, M.J.; Srinivasan, R.; Santhi, C.; Harmel, R.D.; van Griensven, A.; Van Liew, M.W.; et al. SWAT: Model use, calibration, and validation. Am. Soc. Agric. Biol. Eng. 2012, 55, 1491–1508. [Google Scholar]
  33. Agus, F.; Andrade, J.F.; Edreira, J.I.R.; Deng, N.; Purwantomo, D.K.; Agustiani, N.; Aristya, V.E.; Batubara, S.F.; Hosang, E.Y.; Krisnadi, L.Y.; et al. Yield gaps in intensive rice-maize cropping sequences in the humid tropics of Indonesia. Field Crops Res. 2019, 237, 12–22. [Google Scholar] [CrossRef]
  34. Van Mansvelt, J.D.; van der Lubbe, M.J. Checklist for Sustainable Landscape Management: Final Report of the EU Concerted Action AIR3-CT93-1210: The Landscape and Nature Production Capacity of Organic/Sustainable Types of Agriculture; Elsevier: Amsterdam, The Netherlands, 1999. [Google Scholar] [CrossRef]
  35. Lansing, J.S.; Thérèse, A. The functional role of Balinese water temples: A response to critics. Hum. Ecol. 2012, 40, 453–467. [Google Scholar] [CrossRef]
  36. Beddington, J.; Asaduzzaman, M.; Clark, M.; Fernández, A.; Guillou, M.; Jahn, M.; Erda, L.; Mamo, T.; Van Bo, N.; Nobre, C.A.; et al. Achieving Food Security in the Face of Climate Change: Final Report from the Commission on Sustainable Agriculture and Climate Change; CGIAR Research Program on Climate Change, Agriculture and Food Security (CCAFS): Copenhagen, Denmark, 2012. [Google Scholar]
  37. Pretty, J.N.; Morison, J.I.L.; Hine, R.E. Reducing food poverty by increasing agricultural sustainability in developing countries. Agric. Ecosyst. Environ. 2003, 95, 217–223. [Google Scholar] [CrossRef]
  38. Subari, S.; Joubert, M.D.; Sofiyuddin, H.A.; Triyono, J. Pengaruh Perlakuan Pemberian Air Irigasi pada Budidaya SRI, PTT dan Konvensional terhadap Produktivitas Air. J. Irig. 2012, 7, 28–42. [Google Scholar] [CrossRef]
  39. Cai, Z.; Xing, G.; Yan, X.; Xu, H.; Tsuruta, H.; Yagi, K.; Minami, K. Methane and nitrous oxide emissions from rice paddy fields as affected by nitrogen fertilizers and water management. Plant Soil 1997, 196, 7–14. [Google Scholar] [CrossRef]
  40. Wang, C.; Lai, D.Y.F.; Sardans, J.; Wang, W.; Zeng, C.; Peñuelas, J. Factors Related with CH4 and N2O Emissions from a Paddy Field: Clues for Management implications. PLoS ONE 2017, 12, e0169254. [Google Scholar] [CrossRef] [Green Version]
  41. Widyaningrum, E.; Fajari, M.; Octariady, J. Accuracy Comparison of VHR Systematic ortho Satellite Imageries Against VHR Orthorectified Imageries Using GCP. Int. Arch. Photogramm. Remote Sens. Spat. Inf. Sci. ISPRS Arch. 2016, 41, 305–309. [Google Scholar] [CrossRef] [Green Version]
Figure 1. The simplified block diagram of the landscape and zone-specific water balance, illustrating (A): the historical reference scheme 1980, and (B): the current situation in 2020.
Land 10 00586 g001
Figure 2. Delineation of the study area.
Land 10 00586 g002
Figure 3. Simplified schema of the water balance components.
Land 10 00586 g003
Figure 4. Measured flow of around 450 artesian wells in lowland Rejoso area; data source: [16].
Land 10 00586 g004
Figure 5. Flow diagram of cluster analysis to develop paddy farming characteristic.
Land 10 00586 g005
Figure 6. The workflow of participatory mapping scaled 2D mapping techniques.
Land 10 00586 g006
Figure 7. Spatial distribution of the percentage of paddy field area (A) and area with crop rotation (B) at hamlet level.
Land 10 00586 g007aLand 10 00586 g007b
Figure 8. Spatial distribution of the number of artesian wells (A), drainage density (B), the hamlets that use the river as the main water resource (C), and the number of water resources (D) at hamlet level.
Land 10 00586 g008aLand 10 00586 g008bLand 10 00586 g008c
Figure 9. Spatial distribution of rice yield (A), urea application (B), and compound fertiliser (C) at hamlet level.
Land 10 00586 g009aLand 10 00586 g009b
Figure 10. Spatial distribution of the intensity of pest/rodents (A) and number of types of pesticide applied (B) at hamlet level.
Land 10 00586 g010
Figure 11. Dependence of distance level on the number of clusters as basis for elbow method of optimal cluster number to be used for the characteristic of paddy farming.
Land 10 00586 g011
Figure 12. Characteristic of paddy farming in Gondang Wetan and Winongan Sub-districts.
Land 10 00586 g012
Table 1. Scenarios of the Rejoso water balance model; tw indicates the fraction of time the artesian wells are flowing; the evapotranspiration ratio ε was estimated from land cover composition and known temporal dynamics of Leaf Area Index of the vegetation; the ρ coefficient from existing runoff data.
Scenario, DescriptionGeographical Zoningερ#Wells (Number)tw
A. Baseline; using landcover data from 1990, before the expansion of paddy rice cultivation in the lowlands, and with a higher forest fraction in the middle and upper zone.Upper0.710.15
Middle0.720.15
Lower0.810.05101
B. Upland degradation; keeping lowland conditions as in 1990, but reflecting the hydrological degradation in the upland and middle parts of the watershed that are caused by conversion of forest to horticulture and agroforestry.Upper0.710.23
Middle0.760.23
Lower0.810.05101
C. Lowland dominated by paddy field and artesian wells; paddy field and unmanaged and unregulated artesian wells in the lowland, combined with upland conditions of 1990.Upper0.710.15
Middle0.720.15
Lower0.800.056001
D. Upland degradation and intensive lowland for agriculture; using landcover data from 2015 for all zones, along with the artesian wells in the lowlandsUpper0.710.23
Middle0.760.23
Lower0.800.056001
E. Applied sustainable interventions in lowland; as negotiated interventions payment for ecosystem services for tree-based farms and soil-water conservation techniques are introduced in upland and middle parts. Water efficient and low emissions paddy cultivation, and good management of artesian wells are introduced and practiced.Upper0.710.19
Middle0.760.19
Lower0.800.056000.2
Table 2. Respondent distribution and characteristic of paddy cultivation survey.
Sub-DistrictsVillagesNumber of RespondentsAge DistributionNumber of Plots Owned/Managed per RespondentOwned/Managed Area per Plot (ha)
MaxMinAvgMaxMinAvgMaxMinAvg
Gondang Wetan Bayeman 348031596130.800.100.26
Brambang327026518142.250.100.27
Tengglis Rejo3879356010150.600.100.23
Kebon candi677433558130.500.060.22
Wonojati93832254171182.000.050.27
Wonosari3180285712140.850.070.28
WinonganGading3170335525180.500.050.18
Lebak337325516131.100.090.35
Mendalan3470405613130.600.070.24
Menyarik327029576121.330.080.20
Penataan368332565120.600.100.26
Table 3. Predicted discharge of the Umbulan spring, river and groundwater flow for five land use scenarios: A) a historical reference scenario, B) upland degradation, C) lowland conversion to paddy with uncontrolled artesian wells, D) combining the changes of B + C, and E) a restoration scenario with agroforestry in upper and middle zones and reduced groundwater use in the lowland paddy zone.
ScenarioPredicted
Umbulan (L/s)
Predicted Mean River Flow, (m3/s)Predicted Groundwater Flow, (m3/s)
UpperMiddleLowerUpperMiddleLower
A50872.56.712.41.55.30.05
B43102.77.312.11.34.40.04
C42062.56.712.51.55.30.04
D34962.77.312.11.34.40.03
E44682.66.912.11.44.70.04
Table 4. Distribution of area of paddy field (ha), the area with crop rotation (ha), number of artesian wells, and drainage density (km/km2) in each village in two sub-districts.
Sub-Dis-
Tricts
VillagesArea of Paddy (ha)Artesian Wells per Ha PaddyArtesian Well
Water #, mm/Day
Length of Channels (km)Drainage Density (km/km2)Main Water Sources (% Respondents)
RiverArtesian Wells
Gondang
Wetan
Bayeman97.50.7317.613.77.45842
Tenggilis Rejo80.10.4510.911.27.94654
Wonosari74.30.358.58.45.9991
Brambang60.50.4110.08.35.63862
Kebon Candi56.40.419.97.36.15446
Wonojati75.30.256.19.65.97030
WinonganLebak91.40.337.911.26.59010
Penataan87.80.338.010.17.9919
Gading119.60.184.218.510.41000
Menyarik118.60.184.316.68.1946
Mendalan118.70.143.520.310.06733
# Assuming a constant (24/365) median well flow rate of 2.8 L/s.
Table 5. Distribution of rice yield (ton/ha), fertiliser application (kg/ha), number of type of pesticides applied, water sources (% respondent), and intensity of rodents (% respondent) in each village in two sub-districts.
Sub-DistrictsVillagesRice Yield (Ton/ha/Cropping Season)Fertilizer Application (kg/ha)Area with Crop Rotation (ha)Number of Type of Pesticides AppliedIntensity of Rodents (% Respondents)
Urea Compound
Gondang WetanBayeman6.73543084.7461
Tenggilis Rejo4.16013702.5596
Wonosari5.13752992.5537
Brambang5.142531510.9627
Kebon Candi4.24613482.3655
Wonojati4.54082933.9636
WinonganLebak4.52572311.0552
Penataan5.03182520.3571
Gading6.24112680.9492
Menyarik4.73963090.4570
Mendalan4.33322680.7494
Table 6. The result of cluster analysis and characteristic results for the 12 parameters.
NoParametersUnitClusters
12345
1Area of paddy field%High
(218 ha)
High
(407 ha)
Low
(9 ha)
Low
(29 ha)
Medium
(230 ha)
2Flow density (irrigation, river and trench)km/km2MediumHighLowMediumLow
3Area with crop rotation%MediumLowHighHighLow
4Intensity of pest (rodents)% respondentsMediumHighLowHighLow
5Rice yieldTon/haLowLowMediumHighMedium
6Dose of urea fertiliser (46% of N)kg/haHighLowMediumHighLow
7Dose of compound fertiliser (15% of N, 15% of P, and 15% of K)kg/haMediumLowHighHighLow
8Types of applied pesticideNumberMediumLowMediumMediumMedium
9The presence of ‘Ulu-ulu’ as a water regulatory officerExisting/not existingExistNot existExistNot existExist
10Artesian wellsNumberHighMediumLowHighMedium
11River as the main water source% of respondentsMediumHighLowLowHigh
12Types of water sourcesNumberHighLowHighMediumLow
Table 7. Description of each paddy field type.
ClustersDescription
1High paddy field fraction, medium drainage density, and a high number of artesian wells. The dose of application of N fertiliser is high, and use of compound fertiliser is medium, but rice yield is low. The number of pesticide types is medium. The area with crop rotation and intensity of pests (rodents) is medium. The paddy field area with rivers as the main sources of water is medium, but still have a high number of water resources. There is an ‘Ulu-ulu’ as the water regulatory officer.
2High paddy field fraction and drainage density, with a medium number of artesian wells. Doses of application N and compound fertiliser are low and rice yield is relatively low. The number of pesticide types is low. The area with crop rotation is low, hence the intensity of pests (rodents) is high. The rivers have a very important role as the main water source so that the number of other water sources is low. There is no ‘Ulu-ulu’ as the water regulatory officer.
3Low paddy field fraction, low drainage density, and few artesian wells. Doses of application of N fertiliser are medium and those of compound fertiliser high while yield is at a medium level. The number of pesticide types is medium. The area with crop rotation area is high, and the intensity of pests (rodents) is low. The rivers have a small role as a source of water so that the number of other water sources is high. There is an ‘Ulu-ulu’ as the water regulatory officer.
4Low paddy field fraction, with medium drainage density and a high number of artesian wells. The rate of application of N and compound fertiliser is high and followed by high yield. The number of pesticide types is medium. The area with crop rotation is high, but the intensity of pests (rodents) is still high. Rivers have a small role as a source of water, but the number of other water sources is medium. There is no ‘Ulu-ulu’ as the water regulatory officer.
5Medium paddy field fraction, with low drainage density and a medium number of artesian wells. The dose of application of N and compound fertiliser is low, but yield is medium. The number of pesticide types is medium. The area with crop rotation is low, hence the intensity of pests (rodents) is low. The rivers have a critical role as the main water source so that the number of other water sources is low. There is an ‘Ulu-ulu’ as a water regulatory officer.
Table 8. Analysis and risk for intervention and upscaling of each paddy field cluster, based on feedback in local focus group discussions.
ClustersAnalysis and Risk
1Analysis: Cluster 1 has the potential for upscaling as there are large areas of paddy fields and high numbers of artesian wells. Another interesting fact is to understand the high level of fertiliser use, but the yield is low. The risk of technology failure due to pest is medium, and there is a potential for crop rotation to increase soil fertility. Institutionally, the potential for better water management can be explored by the presence of an ‘Ulu-ulu’.
The risk for intervention and upscaling: Medium to low.
2Analysis: Similar to Cluster 1, Cluster 2 has the potential for upscaling. Contrary to Cluster 1, Cluster 2 is lower in yield as most of the agricultural inputs are low, but the pest prevalence is high. There is no ‘Ulu-ulu’ in this area.
The risk for interventions and upscaling: High, but when the intervention is successful, this will provide a high standard for successful upscaling as well.
3Analysis: With less paddy field area, low drainage density, and a low number of artesian wells, Cluster 3 might not be promising for intervention and upscaling. No obvious challenges regarding paddy cultivation.
The risk for interventions and upscaling: Medium to low, but with a limited area of paddy field, interventions might not be attractive.
4Analysis: Similar to Cluster 3, the size of the paddy field area is the limiting factor for upscaling. Factors contributing to high yield interesting to analyse: is it about the fertiliser? Or crop rotation? Cluster 4 may function as a learning site, especially for the application of crop rotation.
The risk for interventions and upscaling: High to medium due to pest intensity.
5Analysis: Cluster 5 can provide another option for intervention and for upscaling with average, mild conditions on several aspects of paddy cultivation. The role of ‘Ulu-ulu’ might be interesting to be observed.
The risk for interventions and upscaling: Low.
Publisher’s Note: MDPI stays neutral with regard to jurisdictional claims in published maps and institutional affiliations.

