Article

Analysis of Characteristics and Driving Factors of Wetland Landscape Pattern Change in Henan Province from 1980 to 2015

1
College of Environment and Planning, Henan University, Kaifeng 475004, China
2
Key Laboratory of Geospatial Technology for the Middle and Lower Yellow River Regions, Henan University, Ministry of Education, Kaifeng 475004, China
3
Henan Industrial Technology Academy of Spatio-Temporal Big Data, Henan University, Zhengzhou 450000, China
4
Key Laboratory of Urban Land Resources Monitoring and Simulation, Ministry of Natural Resources, Shenzhen 518034, China
*
Author to whom correspondence should be addressed.
Land 2021, 10(6), 564; https://doi.org/10.3390/land10060564
Submission received: 19 April 2021 / Revised: 20 May 2021 / Accepted: 25 May 2021 / Published: 27 May 2021
(This article belongs to the Special Issue Dynamic of Natural Ecosystems under Anthropogenic Disturbances)

Abstract

:
The study of the temporal and spatial evolution of wetland landscapes and its driving factors is an important reference for wetland ecological restoration and protection. This article utilized seven periods of land use data in Henan Province from 1980 to 2015 to extract the spatial distribution characteristics of wetlands and analyze the temporal and spatial changes of wetlands in Henan Province. Transfer matrix, landscape metrics, correlation analysis, and redundancy analysis were applied to calculate and analyze the transformation types and area of wetland resources between all consecutive periods, and then the main driving factors of wetland expansion/contraction were explored. First, the total wetland area in Henan Province increased by 28% from 1980 to 2015, and the increased wetland area was mainly constructed wetlands, including paddy field, reservoir and pond, and canal. Natural wetlands such as marsh, lake, and floodplain decreased by 74%. Marsh area declined the most during 1990–1995, and was mainly transformed into floodplain and “Others” because of agricultural reclamation, low precipitation, and low Yellow River runoff. The floodplain area dropped the most from 2005 to 2010, mainly converted to canals and “Others” because of reclamation, exploitation of groundwater, the construction of the South–to–North Water Transfer Project, and recreational land development. Second, the results of correlation analysis and redundancy analysis indicated that economic factors were positively correlated with the area of some constructed wetlands and negatively correlated with the area of some natural wetlands. Socioeconomic development was the main driving factors for changes in wetland types. The proportion of wetland habitat in Henan Province in 2015 was only 0.3%, which is low compared to the Chinese average of 2.7%. The government should pay more attention to the restoration of natural wetlands in Henan Province.

1. Introduction

Wetlands are called the “kidneys of the earth” and serve important ecological functions, such as water conservation, water purification, flood storage and drought resistance, climate regulation, and biodiversity protection [1,2]. Given the rapid socioeconomic development in recent years, wetland landscapes have become fragmented due to agricultural reclamation, water facility construction, and climate change [3]. Especially for Henan Province of China, as a big agricultural province, there has been excessive utilization of wetland resources. For example, land reclamation, illegal occupation of floodplain or marsh, and sand mining have caused the conversion of some wetlands into drylands, paddy fields, or aquaculture ponds. Consequently, wetlands are seriously degraded and shrinking, and the area of wetlands has been significantly reduced in Henan Province [4]. It is very important to understand the factors driving the spatial and temporal distribution of wetland changes in Henan Province to help mitigate both current and future environmental challenges.
Since the 18th National Congress of the Communist Party of China in 2012, with increasing emphasis on the construction of ecological civilization, the People’s Government of Henan Province has published the Notice on Strengthening Wetland Protection and Management and issued a number of policies, including the Henan Province Wetland Protection and Restoration System Implementation Plan. The report of the 19th National Congress of the Communist Party of China in 2017 pointed out that it is necessary to increase the protection of ecosystems and strengthen the protection and restoration of wetlands [5]. Therefore, quantitative analysis of the change characteristics, transformation mechanism, and driving mechanism of wetland landscape patterns is essential to the protection and utilization of wetland resources.
Landscape pattern refers to the spatial distribution and configuration of landscape elements of different types, sizes, and shapes [6]. The landscape metrics area series of indices describes the characteristics of this spatial structure, including patch area, patch density, and mean patch fractal dimension [7]. It can summarize landscape pattern information and reflect certain characteristics of its structural composition and spatial configuration [8]. Earlier studies quantified the landscape pattern of the wetlands along the Yellow River in Henan Province based on the landscape metrics. They suggested that substantial landscape fragmentation has occurred and that the changed landscape pattern was the result of the combined effects of natural and socioeconomic factors [9,10]. However, there are many wetlands in Henan Province. Besides the wetlands along the Yellow River, other wetlands in Henan Province are also worthy of attention. Existing studies on wetlands in Henan Province have mainly focused on qualitative analysis, such as the status of wetland resource utilization and protection measures [5,11]. By analyzing the distribution and changes of wetlands in Henan Province over three periods in 1990–2007, Liang et al. reported that the marsh area has shrunk significantly and the pond area has increased significantly [12]. However, they did not specify what type of land use the marsh was converted to, and what type of land use was converted to pond. The land use transition matrix comes from the quantitative description of system state and state transfer in system analysis, and such a matrix can clearly show the change and transformation of landscape types in different periods [13,14,15]. However, few studies have examined the change and transformation of wetland landscape types in Henan Province. Generally, the evolution of landscape patterns should be driven by natural ecological processes or socioeconomic activities. Current research methods on the driving forces of landscape pattern evolution include qualitative and quantitative analyses. Quantitative analysis primarily includes regression analysis, correlation analysis, principal component analysis, and back propagation neural network analysis [16,17,18,19,20,21,22].
The objectives of this study were to: (1) investigate the changes of Wetland Landscape Pattern in Henan Province; and (2) explore the driving forces of these changes. Therefore, we established a wetland landscape dataset over 35 years, and the transformation characteristics of the wetlands landscape were obtained and driving forces were investigated by using the method transfer matrix and statistical analysis. This study can provide scientific insight into the protection and management of wetlands in Henan Province.

2. Study Area and Data Sources

Henan Province (Latitude: 31°23′ N–36°22′ N, Longitude: 110°21′ E–116°39′ E) is in central-eastern China (Figure 1). The province has a land area of 167,000 km2. There are many rivers in the province, for a total of more than 1500 large and small rivers that belong to four major water systems: the Yellow River, Huai River, Haihe River, and Yangtze River [23]. The province is in the southern warm temperate zone and northern subtropical region. The landform types are diverse, the geographical environment is complex, and the climate has obvious transitional characteristics. With reference to the China Wetlands Resources (Henan Volume), and combined with the feasibility of interpretation, we divided the wetlands in Henan Province into six categories: paddy field, canal, lake, reservoir and pond, marsh, and floodplain, as shown in Table 1 [12,23]. In this study, canal is assigned to constructed wetland, although it includes rivers and ditches. Marsh, lake, and floodplain belong to natural wetlands, and canal, reservoir and pond, and paddy field belong to constructed wetlands.
The wetland landscape data used in this study were downloaded from the national land use data provided by the scientific data sharing platform of the middle and lower reaches of the Yellow River (http://henu.geodata.cn/, accessed on 1 May 2017). A hierarchical classification system of 25 land-cover classes was applied to the Landsat TM/ETM (Enhanced Thematic Mapper) data (Table 2). The 25 classes of land cover were further grouped into 6 aggregated classes of land cover: croplands, woodlands, grasslands, water bodies, built-up areas, and unused land. The land use classification system was according to Liu et al. [24]. According to the administrative boundary of Henan Province, the land use data of Henan Province in 1980, 1990, 1995, 2000, 2005, 2010, and 2015 were extracted. We extracted all types of wetlands from land use data, merged other types into “Others”, and generated a new raster file. After that, they were converted into vector data via ArcGIS 10.3 and converted into a unified coordinate system WGS1984 at 50° N.
The socioeconomic data were gathered from the “Statistical Yearbook of Henan Province (1985–2019)”. The observational data of precipitation and temperature were obtained from the monthly dataset (spatial resolution: 0.5° × 0.5°) produced by the China Meteorological Data Service Center. The annual regional average in Henan Province was used as the annual average temperature in Henan Province from 1980 to 2015.

3. Research Methods

To analyze the distribution and change characteristics of the wetland landscape pattern in Henan Province from 1980 to 2015, this study used seven periods of national land use data to generate a wetland landscape vector dataset in Henan Province and calculated the patch area, patch density, and mean patch fractal dimension to analyze the temporal and spatial distribution characteristics of the wetland landscape. The transfer matrix method was applied to analyze the characteristics of transfer and change between different types of wetland landscapes and between wetland landscapes and “Others”. Considering the number and characteristics of variables, the driving force of wetland landscape evolution in Henan Province was studied by combining qualitative and quantitative methods. Judgement analysis, which belongs to qualitative method, was selected to build a set of driving force variables of landscape pattern from natural views and economic ones according to the previous literatures, while correlation analysis and redundancy analysis, which belong to quantitative analysis, were employed to find out which variables were real influence factors of landscape pattern.

3.1. Landscape Metrics

In this study, patch area (PA), patch density (PD), and mean patch fractal dimension (MPFD) were selected to reflect the characteristics of landscape fragmentation and degree of human disturbance, respectively. The meaning of the specific formula and the calculation method are shown in Table 3 [6,25,26]. The three metrics were calculated by combining the spatial statistical analysis function of ArcGIS 10.3 and Microsoft Excel 2010.

3.2. Landscape Transfer Matrix

The transfer matrix can reflect the conversion between land use types in two periods, including the transfer source, destination, quantity, and other information. It was first applied to land use changes and was also used to analyze changes in wetland types [27]. Its mathematical expression is:
S i j = | S 11 S 12 S 1 n S 21 S 22 S 2 n S n 1 S n 2 S n n |
where S is the area of wetland type, n is the total number of wetland types, and Sij represents the area of type i wetland converted to type j wetland from the beginning to the end of the study period. The sum of each row of the transfer matrix represents the total area of the wetland type at the beginning of the study period, and each row value represents the transfer area to other wetland type; the sum of each column represents the total area of the wetland type at the end of the study, and each column value represents the transferred area from other wetland type.
To calculate the transfer matrix of wetland types, it is necessary to use the overlay analysis module of ArcGIS 10.3 to intersect the land use data of different years, calculate the area and export the attribute table, and complete the data extraction of the transfer matrix in Microsoft Excel 2010. To ensure the integrity of land use data in Henan Province, all land use types (except the wetland types listed in Table 1) were integrated into the “Others” category when calculating the transfer matrix.

3.3. Statistical Analysis

The measured landscape metrics were analyzed by one-way ANOVA to test the significant differences between the constructed wetlands and natural wetlands [28]. Meanwhile, the Pearson correlation analysis was employed to explore the significant relationship between economic indicators and landscape metrics [29]. Based on the indicators selected by Pearson correlation coefficient at p = 0.05, redundancy analysis (RDA) was applied to clarify the relationship between landscape pattern and economic development [30]. All data analyses were carried out in SPSS 20.0 for Windows software package and Canoco 5.0 for Windows software package.

4. Results and Analysis

4.1. Analysis of the Wetland Landscape Pattern in Henan Province
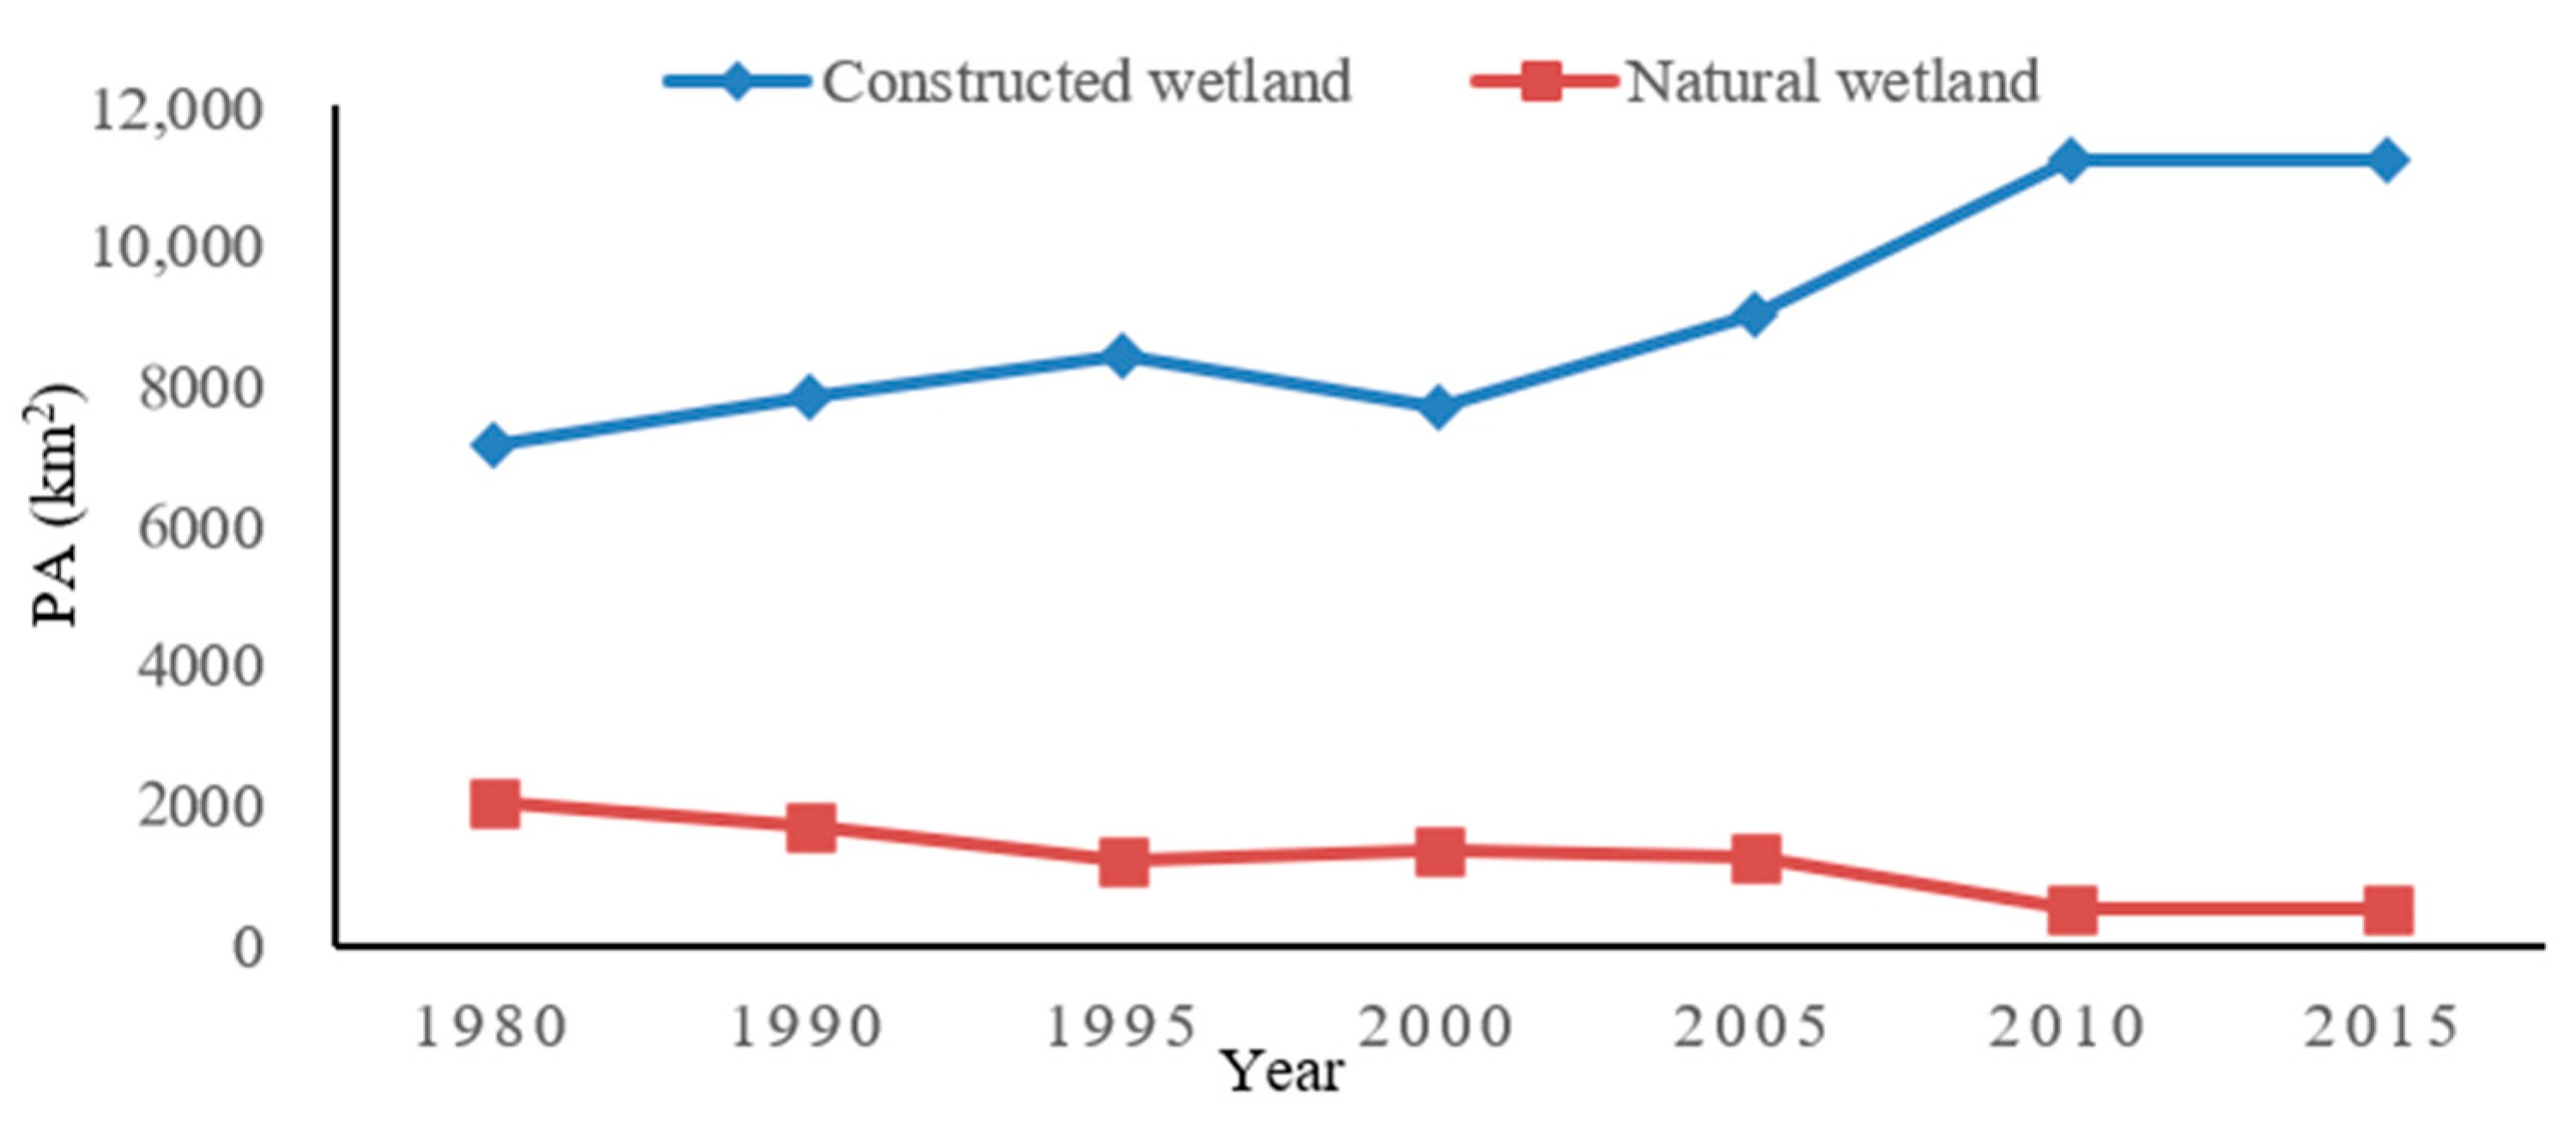
4.1.1. PA Analysis

From Figure 1, paddy fields were the main wetland type and distributed mostly in the south of Henan Province. Canals were distributed throughout the study area. There were several big reservoirs and ponds distributed in the west and south of Henan Province. Marshes were north of the Yellow River. Lakes were mostly on the eastern boundary of Henan Province.
The total wetland area of Henan Province increased by 28% from 1980 to 2015, despite some fluctuation (Figure 2), which was mainly driven by the conversion of “Others” into constructed wetlands (represented by the increase of paddy fields, reservoirs, and ponds). The paddy field area was the largest at 7699.11 km2 (a significant increase from 4970.54 km2 in 1980). From Figure 1 and Figure 2, we can see that paddy fields were the dominant wetland landscape in Henan Province and were mainly distributed in Xinyang City, while the proportions of other types of wetlands were small. The total area of natural wetlands was 537.75 km2, which was only 7% of the paddy field area. It decreased by 74% from 1980–2015 (Figure 3). The marsh area was the smallest at 1.38 km2 (a significant degradation from 59.5 km2 in 1980). The area of reservoir and pond increased by 61%. The canal area increased by 64%.

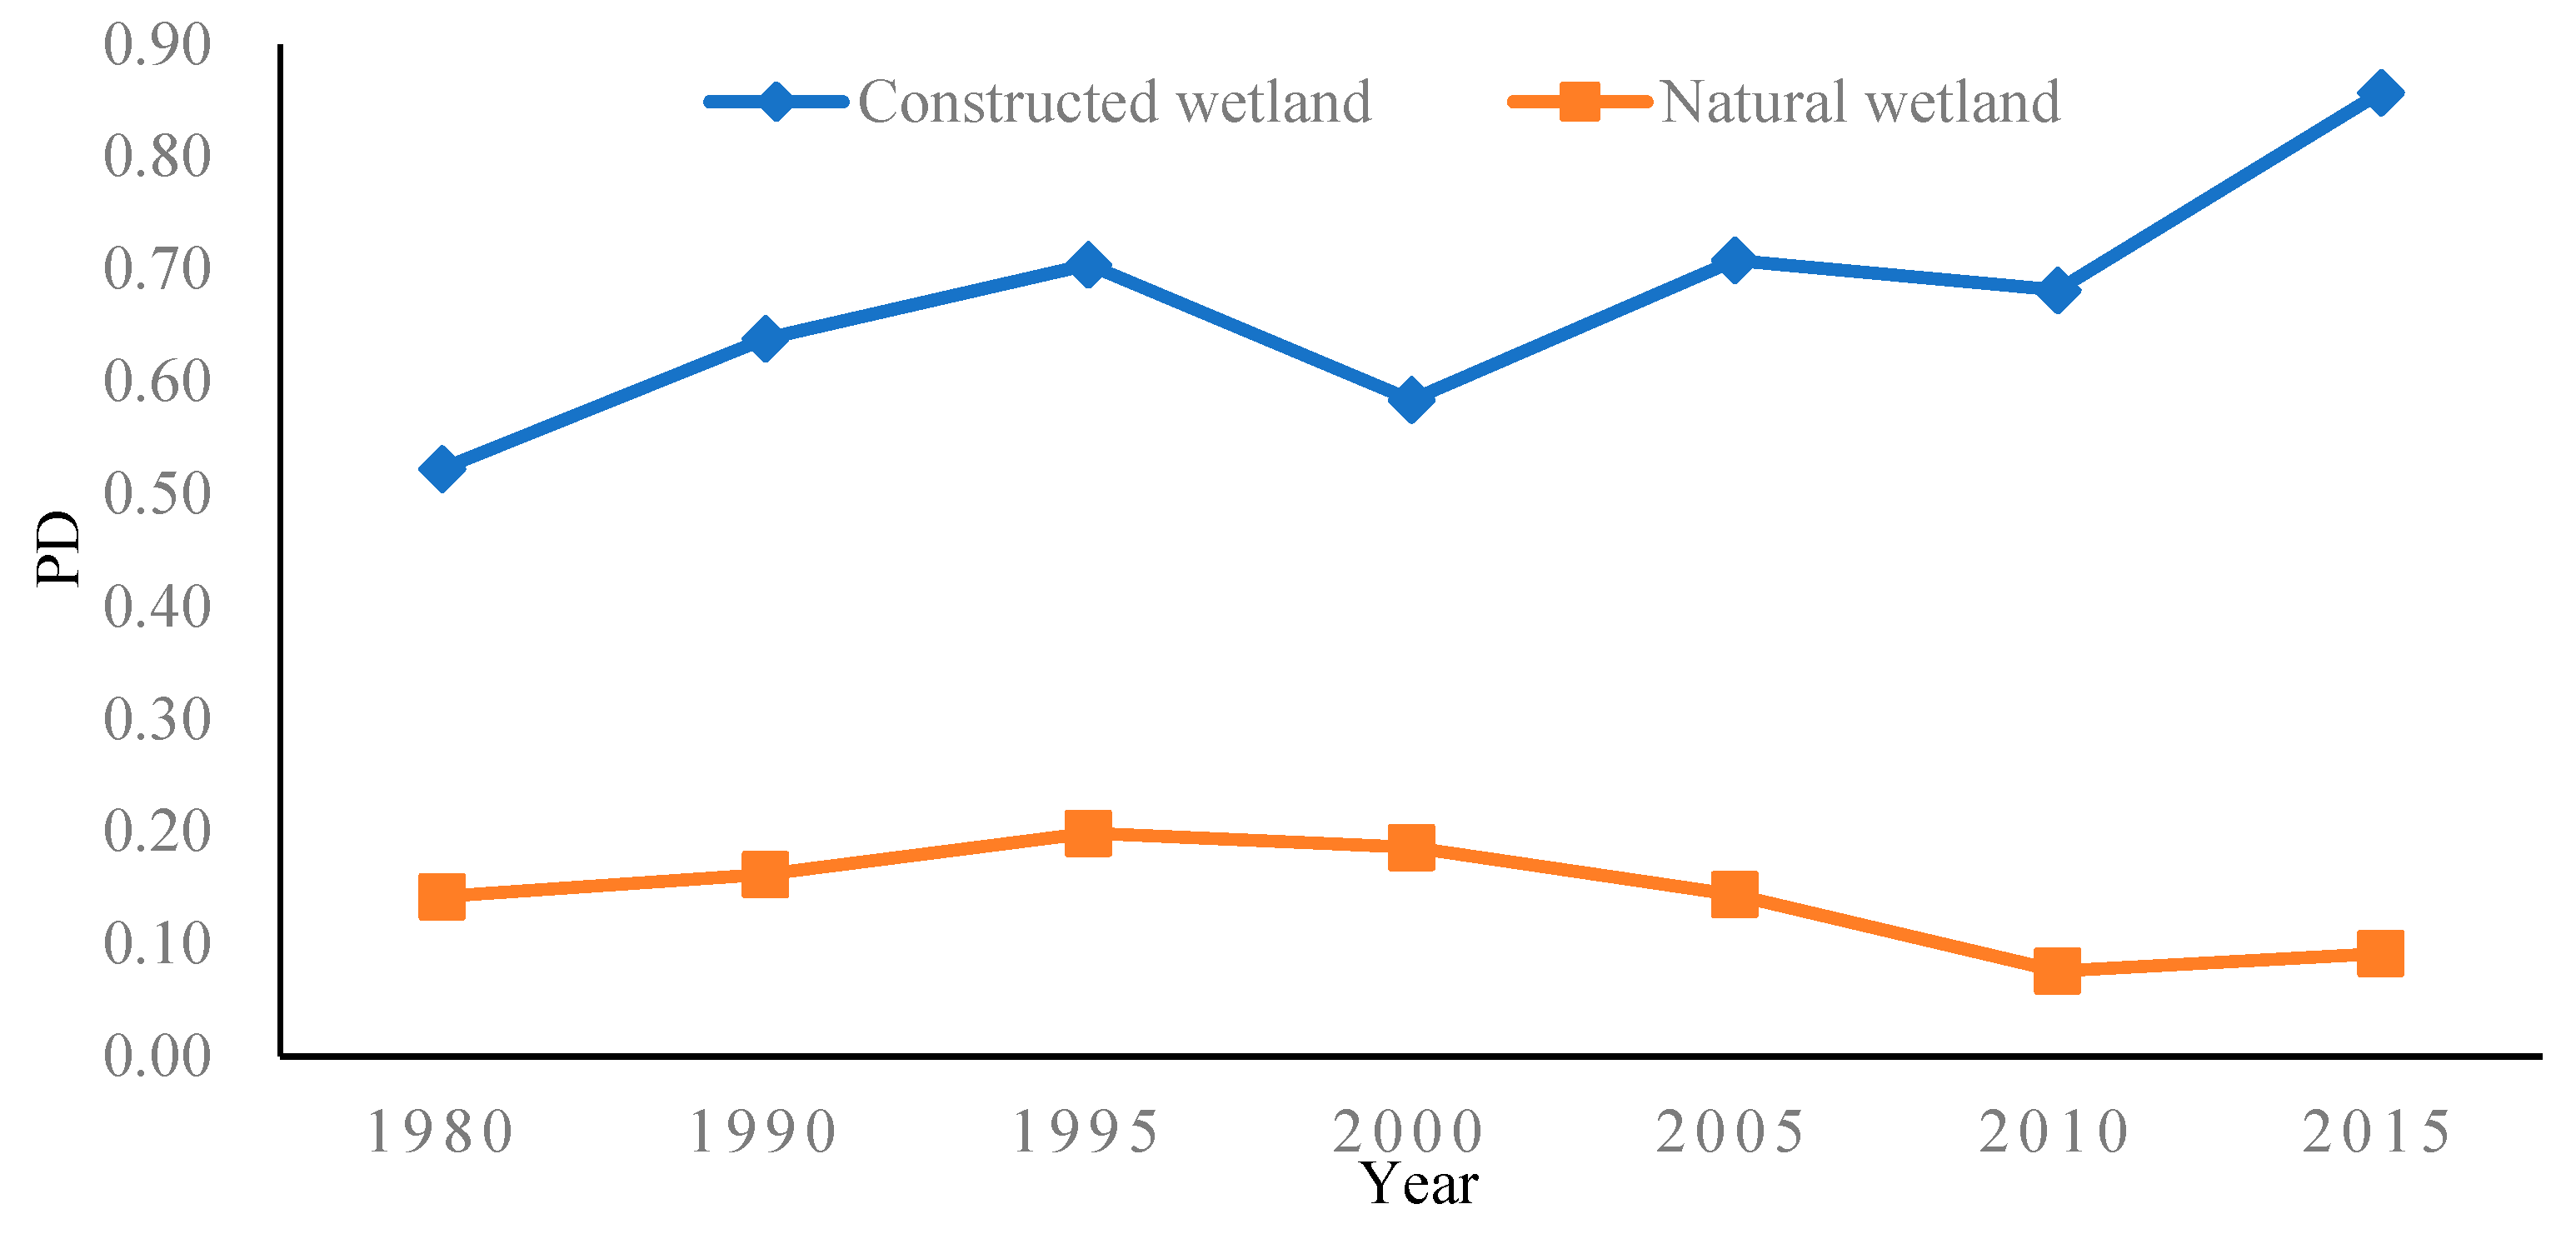
4.1.2. PD and MPFD Analysis

The patch density of the wetland landscapes in Henan Province are shown in Figure 4. The PD values of constructed wetlands (paddy field and reservoirs and pond) were relatively high, indicating high degree of landscape fragmentation. Combined with Figure 3, the PA values of constructed wetland increased year by year, the number of patches also increased.
The mean patch fractal dimension (MPFD) reflects the impact of human activities on the landscape pattern (Figure 5). The closer its value is to 1, the greater the effect of human activities have on the landscape. The results indicated that constructed wetlands were significantly impacted by human activities.
The one-way ANOVA test indicated that the landscape metrics between constructed wetlands and natural wetlands had significant differences. Therefore, two categories of wetlands were analyzed from different perspectives in Section 4.3.

4.2. Analysis of the Transformation Characteristics of Wetland Landscapes

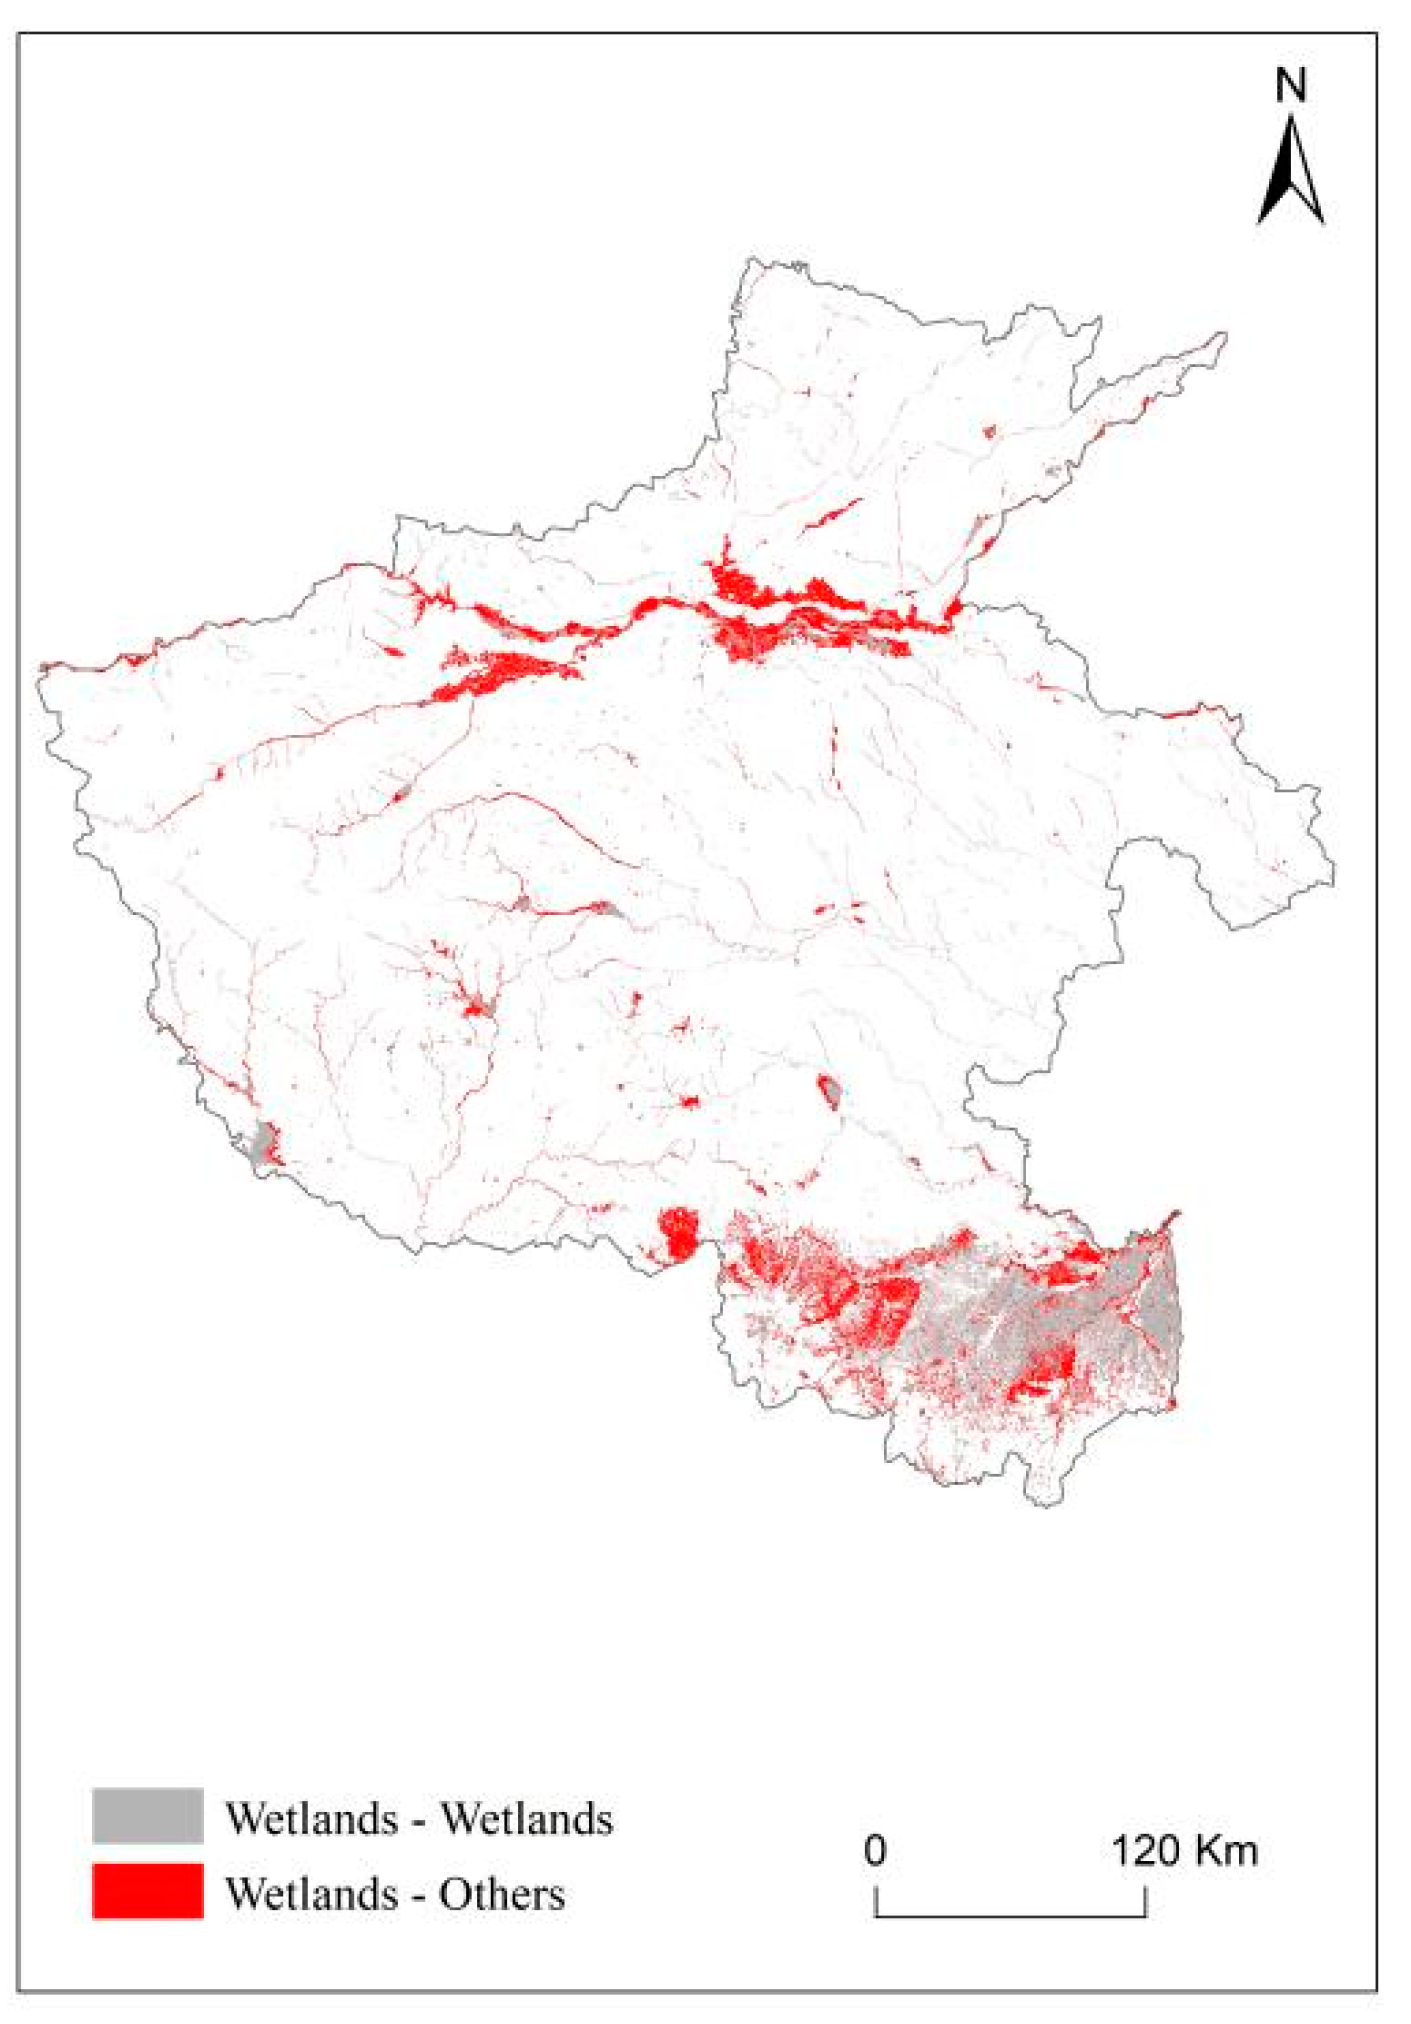
4.2.1. Transformation Characteristics of Wetland Landscape between 1980 and 2015

The transfer matrix of wetland landscape types from 1980 to 2015 is displayed in Table 4. In this period, the total wetland area in Henan Province increased by 2580.46 km2. The increased wetland area was mainly composed of constructed wetlands. The area of the three wetland types increased by 4076.57 km2. Natural wetlands such as marsh, lake, and floodplain decreased by 1496.11 km2. Marsh area decreased 98%, and floodplain area decreased by 73%. The marsh area was mainly converted to “Others” and reservoir and pond (Figure 6). The floodplain area was transformed to “Others”, canal, and reservoir and pond. It can be concluded that with the increase of constructed wetland area, the natural wetland area decreased (Figure 7).

4.2.2. Transformation Characteristics of Wetland Landscapes between All Consecutive Periods

From 1980 to 1990, the paddy fields increased by 431.91 km2, due to the conversion from “Others”. With the expansion of the Banqiao Reservoir, the reservoir area increased by 170.97 km2, primarily from the conversion of floodplain and “Others”. The floodplain area declined by 349.70 km2, which was largely converted into canals and “Others”. The main reason for the degradation of floodplain is that the runoff of the Yellow River decreased continuously in the 1980s and 1990s [31]. In particular, after the Longyangxia Reservoir was put into operation in 1986, the water and sediment in the lower reaches dropped sharply. This caused sediment deposition on the lower riverbed and the intensification of the “second-level suspended river” phenomenon in the lower reaches of the Yellow River. During this period, the wetland landscapes were seriously fragmented [32,33].
From 1990 to 1995, the paddy field area increased by 1151.75 km2, of which the conversion of “Others” into paddy fields accounted for the greatest proportion, followed by the conversion of floodplain and reservoir and pond. The increased paddy field was the application of new technology in rice planting. The marsh area decreased by 59.68 km2 (or a decrease of 99%), which was mainly converted into floodplain and “Others”. By analyzing the change trend of the annual precipitation and the Yellow River runoff from 1990 to 1995, we can see that the precipitation and runoff experienced a decreasing trend [34]. The marshes did not receive water replenishment and gradually dried up in that period. Then they were turned into dryland or other landscapes because of agricultural reclamation.
The paddy field area decreased rapidly by 1092.84 km2 from 1995 to 2000 (mainly converted to “Others”). The decreased paddy fields were the failure of the promotion of new rice planting technology. The canal area increased by 335.17 km2, mainly due to the conversion of “Others”, followed by floodplain. The marsh area increased by 20.59 km2 (mainly transformed from floodplain and “Others”), mostly concentrated in the vicinity of the Yellow River. The increase in the areas of most wetlands (such as canal, marsh, and floodplain) was related to the abundant precipitation during 1995–2000.
From 2000 to 2005, the reservoir and pond area increased by 482.08 km2 because of the operation of the Xiaolangdi Reservoir and the construction of the Yanshan Reservoir. The lands used to construct these reservoirs were mainly from “Others”.
The paddy field area increased by 1455.22 km2 from 2005 to 2010, most of which was converted from “Others”. The main reason for this was that Duliang rice from Kaifeng was gradually packaged and branded after 2003. Especially in 2007 and 2008, Duliang rice became well-known at home and abroad, and its output and area increased [35]. The canal area rose by 795.87 km2, mainly from the conversion of floodplain and “Others”. The key reason for the increase of the canal area was that the Henan section of the main canal of the first phase of the middle route of the South–to–North Water Transfer Project was constructed in 2006, and most parts of the canal were open channels. The marsh area decreased from 21.99 km2 to 6.30 km2, mainly converted into “Others” and reservoir and pond. This was caused by both reclamation and the exploitation of groundwater. The drop in water level led to the drying up and disappearance of marshes. The floodplain area dropped by 751.64 km2, which was mainly converted into canal and “Others”. In general, the mutual transformation between canal and floodplain was mainly caused by changes in water volume. The decreased area of floodplain was also related to the construction of the South–to–North Water Transfer Project. In addition, reclamation and recreational land development occupied a large area of the floodplain. Natural wetlands declined considerably in this period, especially for marshes.
From 2010 to 2015, Xixiayuan Reservoir was put into use and the land used for its construction was mainly non-wetland type land. The construction of reservoir blocked the surface water supply to marshes. With the drop of the groundwater level, hygrophytes and aquatic plants were gradually replaced by xerophytes. The marsh area was reduced from 6.30 km2 to 1.38 km2, and marshes were degraded into drylands.

4.3. Analysis of Driving Forces of Wetland Changes

4.3.1. Natural Driving Force

Based on the annual precipitation and temperature data of the China Meteorological Data Service Center, we plotted the change curve of precipitation and temperature in the study area from 1980 to 2015 (Figure 8). From 1980 to 2015, the annual average temperature of Henan Province fluctuated and trended upward (R2 = 0.6, p < 0.01), while the annual precipitation fluctuated slightly with no upward trend. With the increase in temperature, transpiration of wetland vegetation escalated [36], but precipitation did not increase significantly, which caused the shortage of water supply to wetland vegetation and the shrinkage of the wetland area.

4.3.2. Human Driving Force

The analysis in Section 4.3 indicated that human activities such as water conservancy facilities and agricultural reclamation were the key driver of wetland transformation. These activities contributed to socioeconomic development. Meanwhile, economic development has promoted the excessive use of wetland resources, such as overfishing, cutting reeds, overgrazing, and caused ecological imbalance of wetlands. Therefore, economic indicators, including gross domestic product (GDP), total population, primary industry value (PIV), and urbanization rate (urban population divided by total population) from 1985 to 2015 were selected to analyze the relationship between socioeconomic and wetland area transformation. The effect of various economic indicators on the evolution of the landscape pattern is shown in Table 5. Table 5 reveals that GDP, total population, PIV, and urbanization rate were positively correlated with PA, PD, MPFD of constructed wetland. These four economic indicators were negatively correlated with PA, PD, MPFD of natural wetland. The correlation coefficients between PA of natural wetland and GDP, total population, PIV, and urbanization rate were −0.902 (p < 0.01), −0.943 (p < 0.01), −0.943 (p < 0.01), and −0.910 (p < 0.01), respectively. Floodplain and marshes belonging to natural wetlands were very suitable for agricultural reclamation because of their rich nutrition, and they were also suitable for urban construction because of their convenient water supply and beautiful landscapes. Therefore, the correlation coefficients of natural wetland landscape metrics to the four economic indicators were all strongly negative except MPFD. The values of MPFD of natural wetland and constructed wetland are similar to each other in different periods. Therefore, the correlation coefficient did not pass the t test. The paddy planting was a part of the agriculture in Henan Province. It contributed to PIV directly. Hence, the correlation coefficient of PA of constructed wetland and PIV is larger than that of PA of constructed wetland and GDP. Apparently, socioeconomic development has promoted the expansion of the constructed wetlands while causing precipitous reduction of natural wetlands.
Furthermore, RDA was performed to explore the relationship between landscape metrics and economic indicators. As shown in Figure 9, the first two axes cumulatively explained 93.81% of the variation of landscape pattern, which indicates that the first two axes can fully explain the relationship between landscape pattern changes and economic indicators. From 1980 to 2015, the landscape pattern indicators PDCW, PACW, and MPFDCW are positively correlated with economic parameters, whereas the indicators PDNW, PANW, and MPFDNW are negatively correlated.

5. Discussion and Conclusions

5.1. Discussion

Socioeconomic development has damaged the ecological functions of wetlands from different aspects.
The construction of water conservancy projects has destroyed the original ecological balance of wetlands, cut off the water source of natural wetlands, and caused natural wetlands to shrink and degrade. Although the construction of the South–to–North Water Transfer Project and other water diversion and irrigation projects has promoted the expansion of canal area, the construction of cement dams has cut off the lateral hydrological connectivity, resulting in the degradation of the floodplain due to water shortages [37].
Unreasonable reclamation, excessive grazing, and illegal construction are the direct causes of the degradation of floodplain and marsh. Industrial and agricultural production, domestic water use, and over-exploitation of groundwater have reduced water resources in wetlands. Since the water resources of wetlands cannot be effectively recharged, they have dried up on a large scale. Economic development has promoted the excessive use of wetland resources, such as overfishing, cutting reeds, and overgrazing, and caused ecological imbalance of wetlands. The promotion of branded rice has promoted economic development, and rice paddy area has increased significantly. Most constructed wetlands (e.g., paddy field and pond) need water supply. However, it can be found that water resources from runoff of the Yellow River and precipitation are not adequate to guarantee supply to both the natural environment and human beings [38].
In view of this, the government of Henan Province has been vigorously promoting wetland protection measures. As of 2014, the government has built 25 wetland nature reserves and established 8 wetland parks, according to the second survey of wetland resources in Henan Province [23]. The wetland protection rate was 30.56%. Previous studies have examined the wetland restoration models of nature reserves. Different wetland restoration models should be adopted according to the local conditions for different wetland nature reserves [39]. The total wetland area was about 7% of the total area of Henan Province in 2015. However, the natural wetland area was only 0.3%. Although the constructed wetlands increased the proportion of the total wetland, they are the result of social and economic development. In the long run, they are not conducive to the healthy development of the ecological environment. For such a large agricultural province, the best way to balance the relationship between cultivated land and the ecological environment needs to be studied carefully.

5.2. Conclusions

Socioeconomic development has brought great challenges to the wetland ecological environment, especially in large agricultural provinces such as Henan Province. This study used seven periods of national land use data to generate a wetland landscape dataset in Henan Province over 35 years. The spatiotemporal variation characteristics of wetlands, the transformation types and areas of wetland resources between all consecutive periods, and the driving factors were obtained.
We found that the paddy field area was largest among the wetland landscapes, and it was mainly distributed in the south of Henan Province. The wetland landscape with the smallest area was the marsh, and as of 2015, the marsh area was only 1.38 km2. It was mainly distributed north of the Yellow River. The proportions of natural wetland were very small in the seven periods. The natural wetland decreased by 74%, while the constructed wetland increased by 57%. The conversion mostly occurred between the wetland types and “Others”. Through the detailed analysis between all consecutive periods, we found that precipitation, the runoff from the Yellow River, the construction of reservoirs, the South–to–North Water Transfer Project, and the promotion of brand rice were the driving forces to wetland change, and the dominant factor was different in different periods. The correlation analysis and redundancy analysis indicated that socioeconomic development has promoted the expansion of constructed wetlands while causing the precipitous reduction of natural wetlands. The development of social economy promoted the construction of water conservancy facilities and the cultivation of paddy fields, which increased PIV and GDP. However, it caused wetland fragmentation and even shrinkage and degradation of natural wetlands. Natural wetland restoration should be paid more attention to while developing economy. This study can serve as a reference for the balance between the socioeconomic development and ecological environments protection.

Author Contributions

Conceptualization, methodology, and writing—original draft preparation, H.L.; writing—review and editing, J.Z.; visualization, supervision, and funding acquisition, J.W.; formal analysis, F.Q.; investigation, J.H.; data curation, Z.Z. All authors have read and agreed to the published version of the manuscript.

Funding

The Project Supported by the Open Fund of Key Laboratory of Urban Land Resources Monitoring and Simulation, Ministry of Natural Resources (Grant No. KF-2020-05-037), and National Natural Science Foundation of China (Grant No. 42005031).

Institutional Review Board Statement

Not applicable.

Informed Consent Statement

Not applicable.

Data Availability Statement

Not applicable.

Conflicts of Interest

The authors declare no conflict of interest.

References

  1. Liu, H.Y.; Li, Y.F.; Cao, X.; Hao, J.; Hu, J.; Zheng, N. The current problems and perspectives of landscape research of wetlands in China. Acta Geogr. Sin. 2009, 64, 1394–1401. [Google Scholar]
  2. Zhang, A.J. Studies on the Driving Mechanism of Hydrological Processes on the Landscape Pattern Evolution of the Yellow River Estuary Wetland; China Institute of Water Resources and Hydropower Research: Beijing, China, 2013. [Google Scholar]
  3. Byun, E.; Sato, H.; Cowling, S.A.; Finkelstein, S.A. Extensive wetland development in mid-latitude North America during the Bølling–Allerød. Nat. Geosci. 2020. [Google Scholar] [CrossRef]
  4. Liu, J.P. Current status and protection measures of wetland in Henan. Cent. S. For. Inventory Plan. 2014, 33, 35–37. [Google Scholar]
  5. Deng, T.; Wang, P.J.; Deng, Z.D. Problems and Countermeasures of Wetland Protection and Sustainable Utilization in Henan Province. J. Anhui Agric. Sci. 2020, 48, 76–77. [Google Scholar]
  6. Bojie, F.; Liding, C.; Keming, M. Principle and Application of Landscape Ecology; Science Press: Beijing, China, 2001; pp. 86–94. [Google Scholar]
  7. Bu, H.; Meng, W.; Zhang, Y.; Wan, J. Relationships between land use patterns and water quality in the Taizi River basin, China. Ecol. Indic. 2014, 41, 187–197. [Google Scholar] [CrossRef]
  8. Wu, J.G. Landscape Ecology—Pattern, Process, Scale and Hierarchy; Higher Education Press: Beijing, China, 2000. [Google Scholar]
  9. Ding, S.Y.; Liang, G.F. Landscape pattern change of regional wetland along the Yellow River in Henan Province in the last two decades. Acta Geogr. Sin. 2004, 59, 653–661. [Google Scholar]
  10. Xu, W.Q.; Tang, Q.; Ding, S.Y. Landscape pattern dynamic of Xinxiang Yellow River wetland bird national nature reserve, Henan province. Wetl. Sci. 2016, 14, 235–241. [Google Scholar]
  11. Liang, H.W.; Xing, W. Current situation and protection countermeasures of wetland resources in Henan province. Xiandai Nongye Keji 2019, 22, 153–154. [Google Scholar]
  12. Liang, S.M.; Li, C.L.; Li, C.F.; Ren, J.; Song, L.S.; Qiao, X.N. Distribution and Change of wetlands in Henan province in 1990, 2000, and 2007. Wetl. Sci. 2011, 9, 94–96. [Google Scholar]
  13. Tian, Y. Mapping Suburbs Based on Spatial Interactions and Effect Analysis on Ecological Landscape Change: A Case Study of Jiangsu Province from 1998 to 2018, Eastern China. Land 2020, 9, 159. [Google Scholar] [CrossRef]
  14. Riitters, K.; Schleeweis, K.; Costanza, J. Forest Area Change in the Shifting Landscape Mosaic of the Continental United States from 2001 to 2016. Land 2020, 9, 417. [Google Scholar] [CrossRef]
  15. Xiong, Y.; Zhou, J.; Chen, L.; Jia, B.; Sun, N.; Tian, M.; Hu, G. Land Use Pattern and Vegetation Cover Dynamics in the Three Gorges Reservoir (TGR) Intervening Basin. Water 2020, 12, 2036. [Google Scholar] [CrossRef]
  16. Niu, Z.; Zhang, H.; Wang, X.; Yao, W.; Zhou, D.; Zhao, K.; Zhao, H.; Li, N.; Huang, H.; Li, C.; et al. Mapping wetland changes in China between 1978 and 2008. Chin. Sci. Bull. 2012, 57, 1400–1411. [Google Scholar] [CrossRef] [Green Version]
  17. Liu, G.; Zhang, L.; Zhang, Q.; Musyimi, Z.; Jiang, Q. Spatio-Temporal Dynamics of Wetland Landscape Patterns Based on Remote Sensing in Yellow River Delta, China. Wetlands 2014, 34, 787–801. [Google Scholar] [CrossRef]
  18. van Vliet, J.; de Groot, H.L.; Rietveld, P.; Verburg, P.H. Manifestations and underlying drivers of agricultural land use change in Europe. Landsc. Urban Plan. 2015, 133, 24–36. [Google Scholar] [CrossRef] [Green Version]
  19. Bürgi, M.; Bieling, C.; von Hackwitz, K.; Kizos, T.; Lieskovský, J.; García Martín, M.; Printsmann, A. Processes and driving forces in changing cultural landscapes across Europe. Landsc. Ecol. 2017, 32, 2097–2112. [Google Scholar] [CrossRef] [Green Version]
  20. Gedan, K.B.; Epanchin-Niell, R.; Qi, M. Rapid Land Cover Change in a Submerging Coastal County. Wetlands 2020, 40, 1717–1728. [Google Scholar] [CrossRef]
  21. Sabas, B.Y.S.; Danmo, K.G.; Madeleine, K.A.T.; Jan, B. Cocoa Production and Forest Dynamics in Ivory Coast from 1985 to 2019. Land 2020, 9, 524. [Google Scholar] [CrossRef]
  22. Kupková, L.; Bičík, I.; Jeleček, L. At the Crossroads of European Landscape Changes: Major Processes of Landscape Change in Czechia since the Middle of the 19th Century and Their Driving Forces. Land 2021, 10, 34. [Google Scholar] [CrossRef]
  23. State Forestry Administration of the People’s Republic of China. China Wetlands Resources (Henan Volume); China Forestry Publishing House: Beijing, China, 2015; pp. 25–42.
  24. Liu, J.; Liu, M.; Tian, H.; Zhuang, D.; Zhang, Z.; Zhang, W.; Tang, X.; Deng, X. Spatial and temporal patterns of China’s cropland during 1990–2000: An analysis based on Landsat TM data. Remote Sens. Environ. 2005, 98, 442–456. [Google Scholar] [CrossRef]
  25. Botequilha, L.A.; Ahern, J. Applying landscape ecological concepts and metrics in sustainable landscape planning. Landsc. Urban Plan. 2002, 59, 65–93. [Google Scholar] [CrossRef]
  26. Wu, J.G. Effects of changing scale on landscape pattern analysis: Scaling relations. Landsc. Ecol. 2004, 19, 125–138. [Google Scholar] [CrossRef]
  27. Zhang, Y.M.; Cheng, W.M.; Liu, H.J.; Cao, Y.R. Analysis on changes in land use structure in Henan province from 2005 to 2010. Res. Soil Water Conserve. 2015, 22, 258–263. [Google Scholar]
  28. Xie, X.; Xiang, Q.; Wu, T.; Zhu, M.; Xu, F.; Xu, Y.; Pu, L. Impacts of Agricultural Land Reclamation on Soil Nutrient Contents, Pools, Stoichiometry, and Their Relationship to Oat Growth on the East China Coast. Land 2021, 10, 355. [Google Scholar] [CrossRef]
  29. Zhang, P.; Li, Y.; Jing, W.; Yang, D.; Zhang, Y.; Liu, Y.; Geng, W.; Rong, T.; Shao, J.; Yang, J.; et al. Comprehensive Assessment of the Effect of Urban Built-Up Land Expansion and Climate Change on Net Primary Productivity. Complexity 2020, 8489025. [Google Scholar] [CrossRef]
  30. Aubakirova, M.; Krupa, E.; Mazhibayeva, Z.; Isbekov, K.; Assylbekova, S. The Role of External Factors in the Variability of the Structure of the Zooplankton Community of Small Lakes (South-East Kazakhstan). Water 2021, 13, 962. [Google Scholar] [CrossRef]
  31. Xu, W.K. The Evolution of Water and Sediment in Lower Yellow River and Dynamic Geomorphology in Yellow River Delta to Water-Sediment Modulation; East China Normal University: Shanghai, China, 2016. [Google Scholar]
  32. Shi, F.; Liu, S.; An, Y.; Sun, Y.; Zhao, S.; Liu, Y.; Li, M. Spatio-Temporal Dynamics of Landscape Connectivity and Ecological Network Construction in Long Yangxia Basin at the Upper Yellow River. Land 2020, 9, 265. [Google Scholar] [CrossRef]
  33. Heng, Y. Study on the Process and Countermeasures of Reconstructing Bed in the Fengqiu Reach of the Lower Yellow River since Xiaolangdi Reservoir Was Put into Use; North China University of Water Resources and Electric Power: Zhengzhou, China, 2019. [Google Scholar]
  34. Li, B.; Mu, X.M.; Gao, P.; Zhao, G.J.; Sun, W.Y. New characteristics of temporal and spatial changes of runoff in the mainstream of Yellow River from 1956 to 2017. Res. Soil Water Conserve. 2019, 26, 120–126. [Google Scholar]
  35. Yue, W.M.; Liu, Y. Kaifeng “local products” (middle). Kaifeng Daily, 13 June 2012; 6. [Google Scholar]
  36. Zhang, Y.; Zheng, X.L.; Wu, C.C.; Li, Q. Simulation Experiment about Transpiration Characteristics of Phragmites australis Leaf in Liaohe Estuary Wetlands. Wetl. Sci. 2011, 9, 227–232. [Google Scholar]
  37. Li, H.; Zhou, D.; Hu, S.; Zhang, J.; Jiang, Y.; Zhang, Y. Barrier-based Longitudinal Connectivity Index for Managing Urban Rivers. Water 2018, 10, 1701. [Google Scholar] [CrossRef] [Green Version]
  38. Liu, C.M. Some understanding of ecological protection and high-quality development in the Yellow River Basin. Yellow River 2019, 41, 158. [Google Scholar]
  39. Zhang, M.X.; Zhang, Y.W.; Zhu, W.X.; Liao, C.Z.; Zhao, S.C. Wetland restoration models in Zhengzhou Yellow River Nature Reserve, Henan Province. Wetl. Sci. 2010, 8, 67–73. [Google Scholar]
Figure 1. Wetlands spatial distribution in Henan Province of 2015.
Land 10 00564 g001
Figure 2. Change in areas of six wetland types from 1980–2015.
Land 10 00564 g002
Figure 3. Patch area (PA) of constructed and natural wetland from 1980 to 2015.
Land 10 00564 g003
Figure 4. Patch density (PD) of constructed and natural wetland from 1980 to 2015.
Land 10 00564 g004
Figure 5. The mean patch fractal dimension (MPFD) of constructed and natural wetland from 1980 to 2015.
Land 10 00564 g005
Figure 6. Transformation between wetlands and “Others” from 1980–2015.
Land 10 00564 g006
Figure 7. Transformation between constructed wetlands and natural wetlands from 1980–2015.
Land 10 00564 g007
Figure 8. Trend lines of annual average temperature and annual precipitation from 1980 to 2015.
Land 10 00564 g008
Figure 9. Coordination biplots of redundancy analysis (RDA) displaying the relationship between economic indicators and landscape metrics. Landscape metrics are response variables, and economic indicators are explanatory variables. The positive and negative correlation between two different indicators depends on the same or opposite direction of arrows, and the correlation is determined by the projection length of the arrows of two different indicators. PIV: primary industry value; UR: urbanization rate; PDCW: patch density of constructed wetland; PDNW: patch density of natural wetland; PACW: patch area of constructed wetland; PANW: patch area of natural wetland; MPFDCW: mean patch fractal dimension of constructed wetland; and MPFDNW: mean patch fractal dimension of natural wetland.
Land 10 00564 g009
Table 1. Wetland type and description.
Wetland TypeDescription
Paddy fieldCultivated land with water source guarantee and irrigation facilities, which can be irrigated normally and is used to grow aquatic crops such as rice and lotus root; it also includes cultivated land with rice and dry land crop rotation.
CanalNatural or artificially excavated canals including rivers and ditches. Artificial canals include embankment in this study.
LakeLand covered by lakes.
Reservoir and PondMan-made facilities for water reservation.
MarshLand with a permanent mixture of water and herbaceous or woody vegetation that cover extensive areas.
FloodplainLand between normal water level and flood level.
Table 2. The land use classification system.
1st Level Classes2nd Level Classes
CroplandPaddy field, dry land
WoodlandForest, shrub, woods, others
GrasslandDense grass, moderate grass, sparse grass
Water bodyStreams, rivers and canals, lakes, reservoirs and ponds, permanent ice and snow, beach and shore, bottomland
Built-up landUrban build-up, rural settlements, others
Unused landSandy land, gobi, salina, marsh, bare soil, bare rock, others
Table 3. Landscape metrics used in this study.
Landscape Metrics (Abbreviation)Description and Calculation
Patch area (PA)This is the area of each patch and can be measured by ArcGIS 10.3 by calculating geometry.
Patch density(PD)Number of patches per unit area (number per km) is a description of the degree of fragmenta-tion, with a greater degree of fragmentation represented by a higher value of PD, PD > 0 .
Mean patch fractal dimension (MPFD)To a certain extent, it reflects the impact of human activities on landscape pattern, with a greater degree of human interference represented by a lower value of MPFD. Its calculation formula is M P F D = i = 1 m j = 1 n [ 2 ln ( 0.25 P i j ) ln ( a i j ) ] N , Pij is perimeter of patchij, aij is area of patchij, N   is   the   number   of   patches , 1 MPFD 2 .
Table 4. Transfer matrix of wetland changes from 1980 to 2015. km2.
YearWetland Type2015
Paddy fieldOthersCanalsLakeReservoir and pondMarshFloodplainTotal
1980Paddy field3873.97989.4811.020.0089.810.006.204970.48
Others3768.98151,879.61283.740.04479.970.05121.31156,533.71
Canals9.37332.75753.230.0340.300.0070.341206.02
Lake0.010.610.032.380.080.000.003.11
Reservoir and Pond23.54135.7427.970.04764.750.0025.43977.46
Marsh0.2240.470.030.0015.331.332.1359.50
Floodplain5.73574.58898.150.00184.310.00305.561968.33
Total7681.82153,953.251974.172.491574.541.38530.97165,718.61
Table 5. Correlation analysis of wetland landscape and economic indicators.
PA of Constructed Wetland (km2)PA of Natural Wetland (km2)PD of Constructed WetlandPD of Natural WetlandMPFD of Constructed WetlandMPFD of Natural Wetland
GDP (100 million yuan)Pearson correlation0.940 **−0.902 **0.809 *−0.807 *0.557−0.278
p (2-tailed)0.0020.0050.0280.0280.1940.546
N777777
Total populationPearson correlation0.880 **−0.943 **0.794 *−0.5960.673−0.337
p (2-tailed)0.0090.0010.0330.1580.0970.459
N777777
PIV (100 million yuan)Pearson correlation0.955 **−0.943 **0.793 *−0.790 *0.621−0.274
p (2-tailed)0.0010.0010.0330.0350.1370.552
N777777
Urbanization ratePearson correlation0.934 **−0.910 **0.770 *−0.799 *0.655−0.186
p (2-tailed)0.0020.0040.0430.0310.1100.689
N777777
**. p < 0.01 level (2-tailed). *. p < 0.05 level (2-tailed).
Publisher’s Note: MDPI stays neutral with regard to jurisdictional claims in published maps and institutional affiliations.

