Article

Changes in Land-Use and Ecosystem Service Value in Guangdong Province, Southern China, from 1990 to 2018

1
College of Natural Resources and Environment, South China Agricultural University, Guangzhou 510642, China
2
Guangdong Provincial Key Laboratory of Eco–Circular Agriculture, South China Agricultural University, Guangzhou 510642, China
3
Guangdong Engineering Research Center for Modern Eco-agriculture and Circular Agriculture, South China Agricultural University, Guangzhou 510642, China
4
Key Laboratory of Agro-Environment in the Tropics, Ministry of Agriculture and Rural Affairs, Guangzhou 510642, China
5
College of Forestry and Landscape Architecture, South China Agricultural University, Guangzhou 510642, China
*
Author to whom correspondence should be addressed.
Land 2021, 10(4), 426; https://doi.org/10.3390/land10040426
Submission received: 16 March 2021 / Revised: 8 April 2021 / Accepted: 13 April 2021 / Published: 16 April 2021
(This article belongs to the Special Issue Exploring the Relationships between Land Use and Ecosystem Services)

Abstract

:
Land-use/cover is one of the major factors that affect the ecosystem and the services it provides. The impact of land-use change on ecosystem service value is a hotspot in developing countries, especially China—a region with rapid economic development and rapid population growth. As the leading area of China’s reform and opening-up, Guangdong province in southern China is subjected to land-use conversion that significantly alters the capacity of natural ecosystem to provide ecosystem services supporting human well-being. We analyzed the characteristics of land-use changes from 1990 to 2018 using the four-phase land-use data interpreted from Landsat satellite images. We estimated the ecosystem service value through a well-established benefit transfer method using modified local value coefficients, analyzed the trade-offs and synergies among ecosystem services through ecosystem service trade-off degree, and compared the relationship between ecosystem services value, economic development, and population in Guangdong province. The results indicated that the following: (1) Built-Up Area drastically expanded from 6783.1 km2 in 1990 to 13,142.0 km2 in 2018 (93.7%), especially in the Pearl River Delta, where the growth rate of Built-Up Area expansion was up to 169.0%. The other land-use types were all contracted as Cropland (−10.9%), Forestland (−1.0%), Grassland (−4.0%), Water Body (−2.1%), and Unused Land (−24.4%). (2) Total ecosystem service value decreased from US$121,666 billion in 1990 to US$116,432 billion in 2018 (−4.3%). Cropland, Forestland, and Water Body played the most important roles for the total ecosystem service value. Water supply experienced the largest declines in ecosystem services value (US$ −1866.3 million, −10.1%), followed by waste treatment (7.6%) and gas regulation (−4.9%). (3) Synergy was the dominant relationship among ecosystem services. The above results can not only serve as reference case for other provinces/regions/countries/ to carry out relevant research work but also provide much focus on land-use planning to manage the impacts of land-use change on regional ecosystem services function.

1. Introduction

Ecosystem services are the benefits and functions that ecosystems provide to human beings [1,2,3], which include ecosystem products (e.g., food production, raw material, clean water, etc.) and services (e.g., waste treatment, gas regulation, recreation and culture, etc.). Land is the basic carrier of socioeconomic activities [4]. Land-use practices are the most important factors affecting the multiple ecosystem services provided by land through changing biodiversity, ecosystem structures, habitats, etc., [5]. However, humans are prone to exerting pressures on land-use through maximizing the provision of one of the few ecosystem services, which lead to a decline or loss of many others [6]. This phenomenon is widespread around the globe, and particularly severe in the regions with rapid economic development [7,8,9] and highly urbanization areas [10,11]. As the Dasgupta Review indicates, human demand far exceeds nature’s capacity to supply us with goods and services and calls on policymakers to fully account for the impact of our interactions with the natural ecosystem [12]. Fortunately, the contribution of the majority of ecosystem services for human wellbeing has been considered in recent years, and people have been trying to better coordinate the relationship between human activities and the ecological environment.
Ecosystem services have been a hot topic in ecological and environmental studies [13,14]. To guarantee and improve regional ecosystem services in the context of rapid economic development and urbanization [15], the Chinese government has implemented a variety of ecological restoration projects and environmental protection policies, such as the Grain for Green Project [16], the Ecological Redline Policy [17], etc., and achieved good performances [18,19]. Some studies have indicated that the value of ecosystem services per unit area in China shows obvious spatial characteristics: increasing from the north to the south and from the west to the east and gradually increasing from the northwest to southeast for the different climate [20], vegetation coverage, and urbanization level [11,21]. Meanwhile, many studies have shown that ecosystem services have often been valued using land-use data [22] through the benefit transfer method, building on the methodology of Costanza et al. [1]. The value of ecosystem services per-unit area from land-use is derived using a range of economic valuation methods supported by models and data [2,23,24]. In China, Xie et al. [25,26] modified the value coefficients in Chinese terrestrial ecosystems, which have been used in a large number of studies in different scale in China such as the city scale [27,28], urban agglomeration [5,11,29],and the provincial scale [4,30].
Trade-offs and synergies, which are widely presented among ecosystem services [31,32], are the core of ecosystem management and have become important topics in the realm of ecosystem services research in recent years [33,34,35]. Studies have found that the relationship is different among ecosystem services [36] and between regions [37,38,39]. For example, there are the trade-offs between food production and soil formation and protection [40], while there are synergies among soil formation and protection, carbon sequestration, and gas regulation [41,42]. The main reasons are the difference in landscape structure and human activities between regions [43]. As ecosystem services change in time and space, the trade-offs and synergies are also assessed on a spatio-temporal scale [44]. At present, the studies on the trade-offs and synergies of ecosystem services emphasize that discrimination and correlation analysis are the most common methods for establishing relationships [45]. Some researchers also use the trade-off model to quantify relationships among ecosystem services [46]. On the research scale, it involves the global [47] and regional scale [48], watershed [49], important economic zones [36], protected areas [50], and cultivated land [45]. Most of the researches are mainly focused on the impact of land-use changes on these trade-offs and synergies [36,37].
In this study, we quantified and valued the changes in land-use and ecosystem service value in Guangdong province in southern China from 1990 to 2018 and analyzed the trade-offs and synergies among ecosystem services. As the leading area of China’s reform and opening-up since 1978, Guangdong province, especially its Pearl River Delta area, has experienced rapid urbanization and most of the natural and seminatural lands have been developed to satisfy the needs of accelerated urbanization and development [51,52,53]. We mapped the spatial distribution of six major land-use types using four-phase land-use data collected from the Resources and Environmental Scientific Data Center (RESDC) of the Chinese Academy of Sciences (CAS) (http://www.resdc.cn/Default.aspx (accessed on 15 June 2020)) in 1990, 2000, 2010, and 2018 and analyzed the land-use change characteristics using the single land-use dynamic degree and the land-use transfer matrix. We quantified the value of the nine ecosystem services from each land-use type using the established benefit transfer method based on value coefficients [1,25,26] tailored to Guangdong province [5]. We analyzed the trade-offs and synergies among ecosystem services using the ecosystem service trade-off degree. We then analyzed the relationship of the ecosystem service value, economic development, and the population in Guangdong province. Based on these findings, we discussed meaningful suggestions for future development in Guangdong province, which would serve reference cases for other regions to carry out relevant research work.

2. Materials and Methods
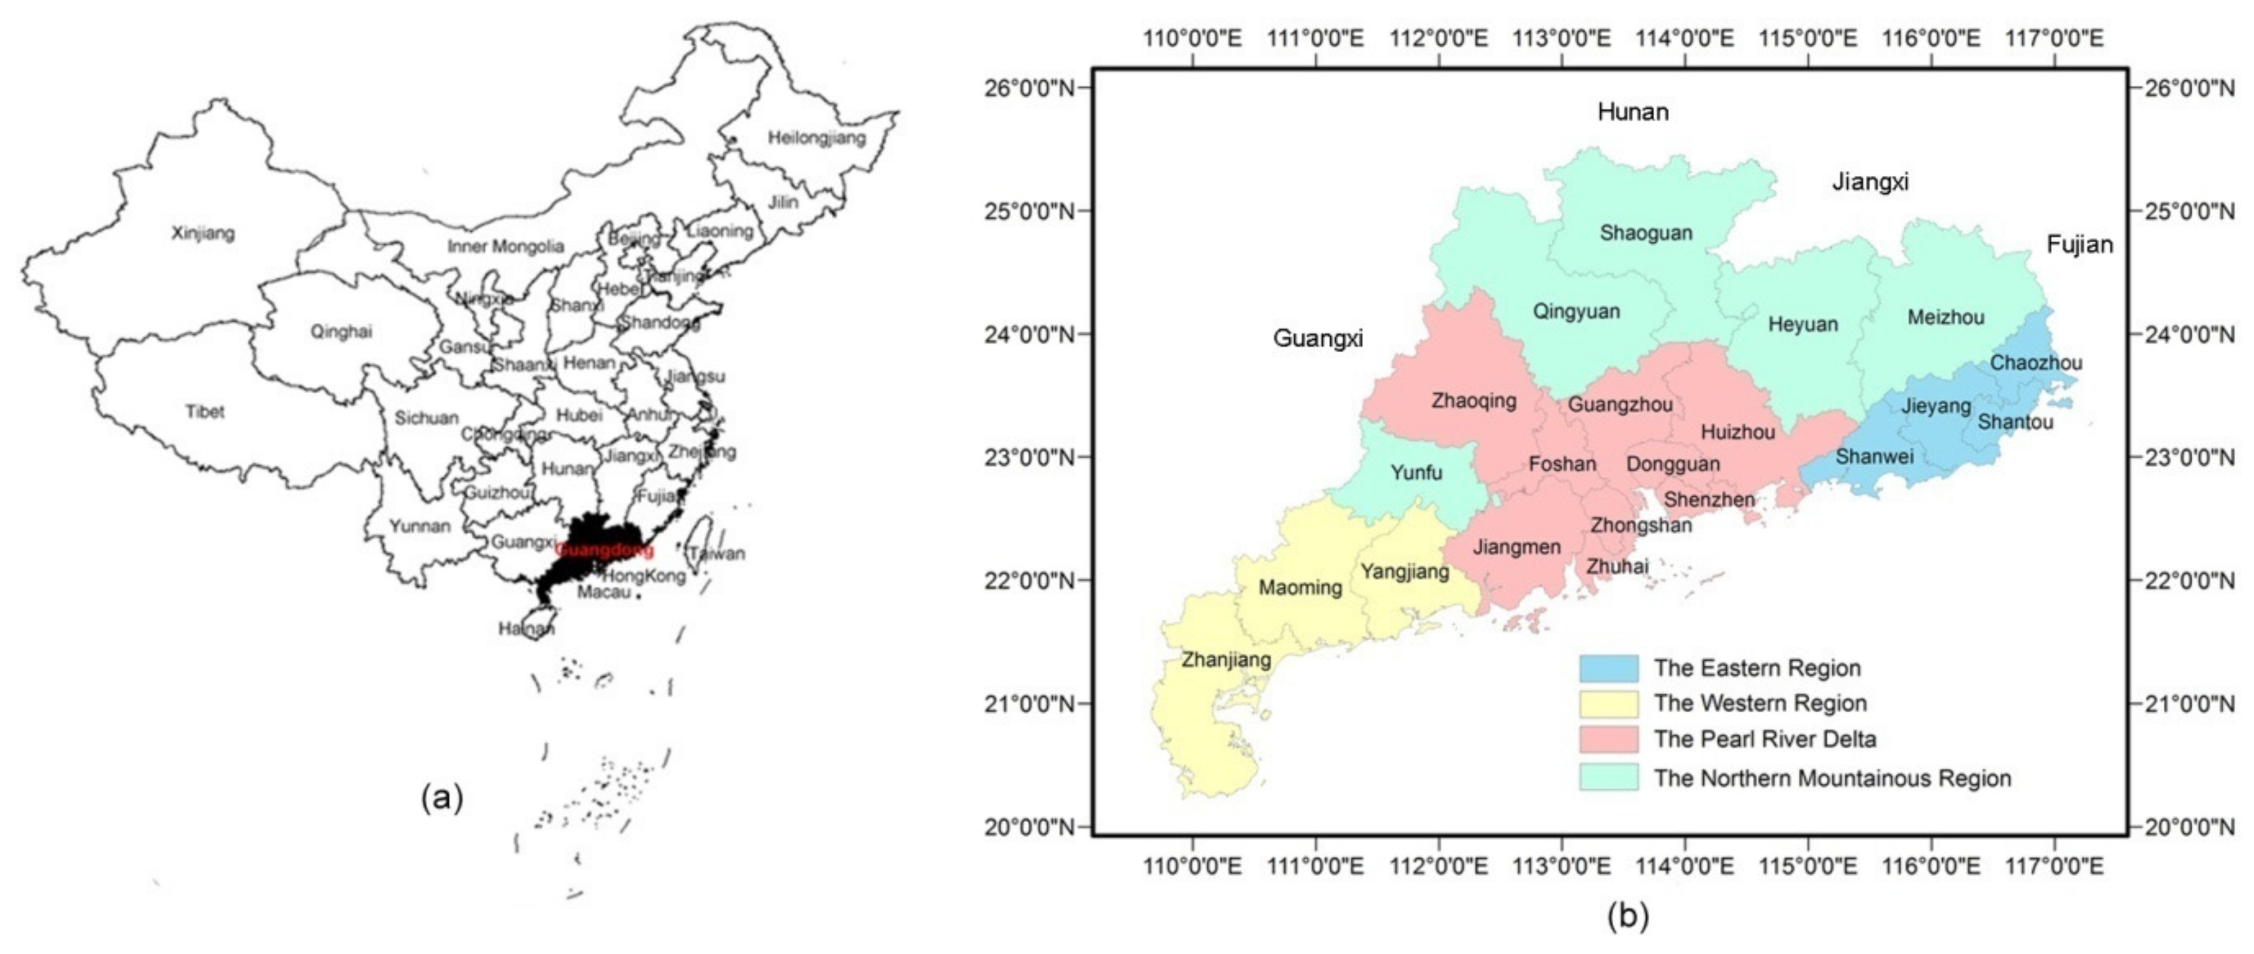
2.1. Study Area

Guangdong province (20°12′–5°31′ N, 109°45′–117°20′ E), one of the most productive economic provinces in China, is located in the southern part of the Chinese mainland. It adjoins Fujian province in the east and Jiangxi and Hunan provinces in the north. To the west is the Guangxi Zhuang Autonomous region, and to the south is the South China Sea and where it is also adjacent to Hong Kong and Macao (Figure 1a). It covers a total landmass of approximately 178,260 km2, and approximately 1448 km2 is land. It features a mid-subtropical monsoon climate, a south subtropical monsoon climate, and a tropical monsoon climate from north to south, with an annual average temperature between 19 and 24 °C, an annual duration of sunshine varying from less than 1500 h to more than 2300 h, and an annual average rainfall ranging from 1400 to 2000 mm.
Guangdong province has 21 prefecture-level cities (i.e., prefectures, which are the administrative units directly below the provincial level) and features a wide variety of landforms such as mountains, hills, terraces, and plains for China’s second-largest river—the Pearl River, which flows through it. High mountains stretch across the north, northeast, and west of Guangdong while the central and southern coastal regions are characterized by lowlands, terraces, and plains. According to the landmass and sea location, and economic development status, Guangdong province was divided into four regions (Figure 1b), the Eastern Region (with the cities Shantou, Chaozhou, Jieyang, and Shanwei), the Northern Mountainous Region (with Meizhou, Heyuan, Shaoguan, Qingyuan, and Yunfu), the Western Region (with Yangjiang, Maoming, and Zhanjiang), and the Pearl River Delta (with Guangzhou, Shenzhen, Zhuhai, Foshan, Jiangmen, Zhaoqing, Huizhou, Dongguan, and Zhongshan). The Pearl River Delta is a major part of Guangdong province, Hong Kong and the Macao Greater Bay Area—one of the world’s largest megacities [36].
Guangdong province is one of the leading areas of China’s reform and opening-up. Since 1978, Guangdong has experienced rapid urbanization and economic development, especially in the Pearl River Delta. The permanent resident population in Guangdong province was increased from 62.46 million (23.7% of the urban population) in 1990 to 113.5 million in 2018 (70.7%). The population density has increased from 351 persons per square kilometer in 1990 to 627 persons per square kilometer in 2018, which is far higher than the national population density of 145 persons per square kilometer in China [52]. The gross domestic product (GDP) of Guangdong province was increased from 155.9 billion yuan in 1990 to 9727.8 billion yuan in 2018 [54], and its total economic volume has ranked first in China for 30 consecutive years [55].

2.2. Data Collection and Land-Use Classification

In our study, the land-use data in 1990, 2000, 2010, and 2018 with a 30 × 30 ms patial resolution were collected from the Resources and Environmental Scientific Data Center (RESDC) of the Chinese Academy of Sciences (CAS) (http://www.resdc.cn/Default.aspx (accessed on 15 June 2020)), which were obtained by a man–machine interactive visual interpretation based on Landsat remote sensing image, and local land-use maps and ground-truth survey were employed as references for visual interpretation to enhance classification accuracy. The auxiliary map was the latest provincial and municipal administrative division map of Guangdong province in 2015. We used the six first-level land-use types based on the land-use’s primary classification scheme of RESDC (Table 1). We then graphed and mapped land-use change and analyzed the land-use transition in the four regions in Guangdong province between 1990 and 2018.

2.3. Research Methods

2.3.1. Single Dynamic Index of Land-Use

The single dynamic index of land-use refers to the rate of regional land-use change [56], which plays an important role in comparing regional differences and analyzing trends in land-use changes [30]. The single dynamic index is calculated using Equation (1):
K = A i , t e A i , t b A i , t b × 1 T × 100 %
where K is the single dynamic index of land-use; Ai,tb and Ai,te are the area of land-use type i at the beginning time tb of the study period and that at the ending time te, respectively; and T is the research period. In this study, T is set to year, and K is the annual change rate of the land-use type i in the study area.

2.3.2. Calculation of Ecosystem Service Value

We calculated the ecosystem service value of the six land-use types (Table 1) in Guangdong province using Equation (2):
E S V s , i , t = A i , t × V C s , i , t
where Ai,t is the area of land-use type i at time t, and VCs,i,t is the per-hectare value’s coefficient of each ecosystem service s provided by each land-use type i at time t, which was derived from the standardized value coefficients by Xie et al. [25] and was tailored to the study area and expressed in 2018 US$ ha−1.
The total value of ecosystem services was then aggregated for each time period t, overall land-use types, and ecosystem service s supplied by all land-use types (ESVt):
E S V t = i s E S V s , i , t
The ecosystem service value coefficients were also modified by Ye et al. [5,57]. The final locally adapted ecosystem service value coefficients are presented in Table 2.

2.3.3. Assignment of Ecosystem Service Value

We used the crops’ minimum purchase price in 2018 of 2.52 yuan kg−1 (0.38 US$ kg−1) [54] based on the average exchange rate of US$ to RMB in 2018 of 6.6174 to calculate the reference value. Then, we used the ratio of 1/7 to represent the proportion of food production value from Cropland following Xie et al. [58]. Thus, the ecosystem service value of per hectare for Guangdong province was calculated as 306.23 US$ ha−1 (i.e., 5641 kg ha−1 × 0.38 US$ kg−1/7). The per-unit ecosystem service values supplied by different land-use type are listed in Table 3.

2.3.4. Ecosystem Services Trade-Offs Degree

To evaluate the trade-offs and synergies among ecosystem services, we used the ecosystem service trade-off degree, an approach based on the linear fitting of data to reflect the direction and degree of interaction among ecosystem services [59,60], which can provide a valuable direction for the future consideration of ecosystem services. If the degree is negative, then the relationship is a trade-off; if the degree is positive, then the relationship is synergistic [61]. The calculation of the ecosystem service trade-off degree (Equation (4)) [59] is as follows:
E S T D i , j = E S V i , t 1 E S V i , t 2 E S V j , t 1 E S V j , t 2
where ESTDi,j is the ecosystem service trade-off degree between ecosystem service i and j; ESVi,t1 and ESVi,t2 are the value of ecosystem service i at time t1 and t2, respectively; and ESVj,t1 and ESVj,t2 are the value of ecosystem service j at time t1 and t2, respectively. The absolute value of the ecosystem service trade-off degree represents the degree of change in ecosystem service type i compared with that of type j.

3. Results

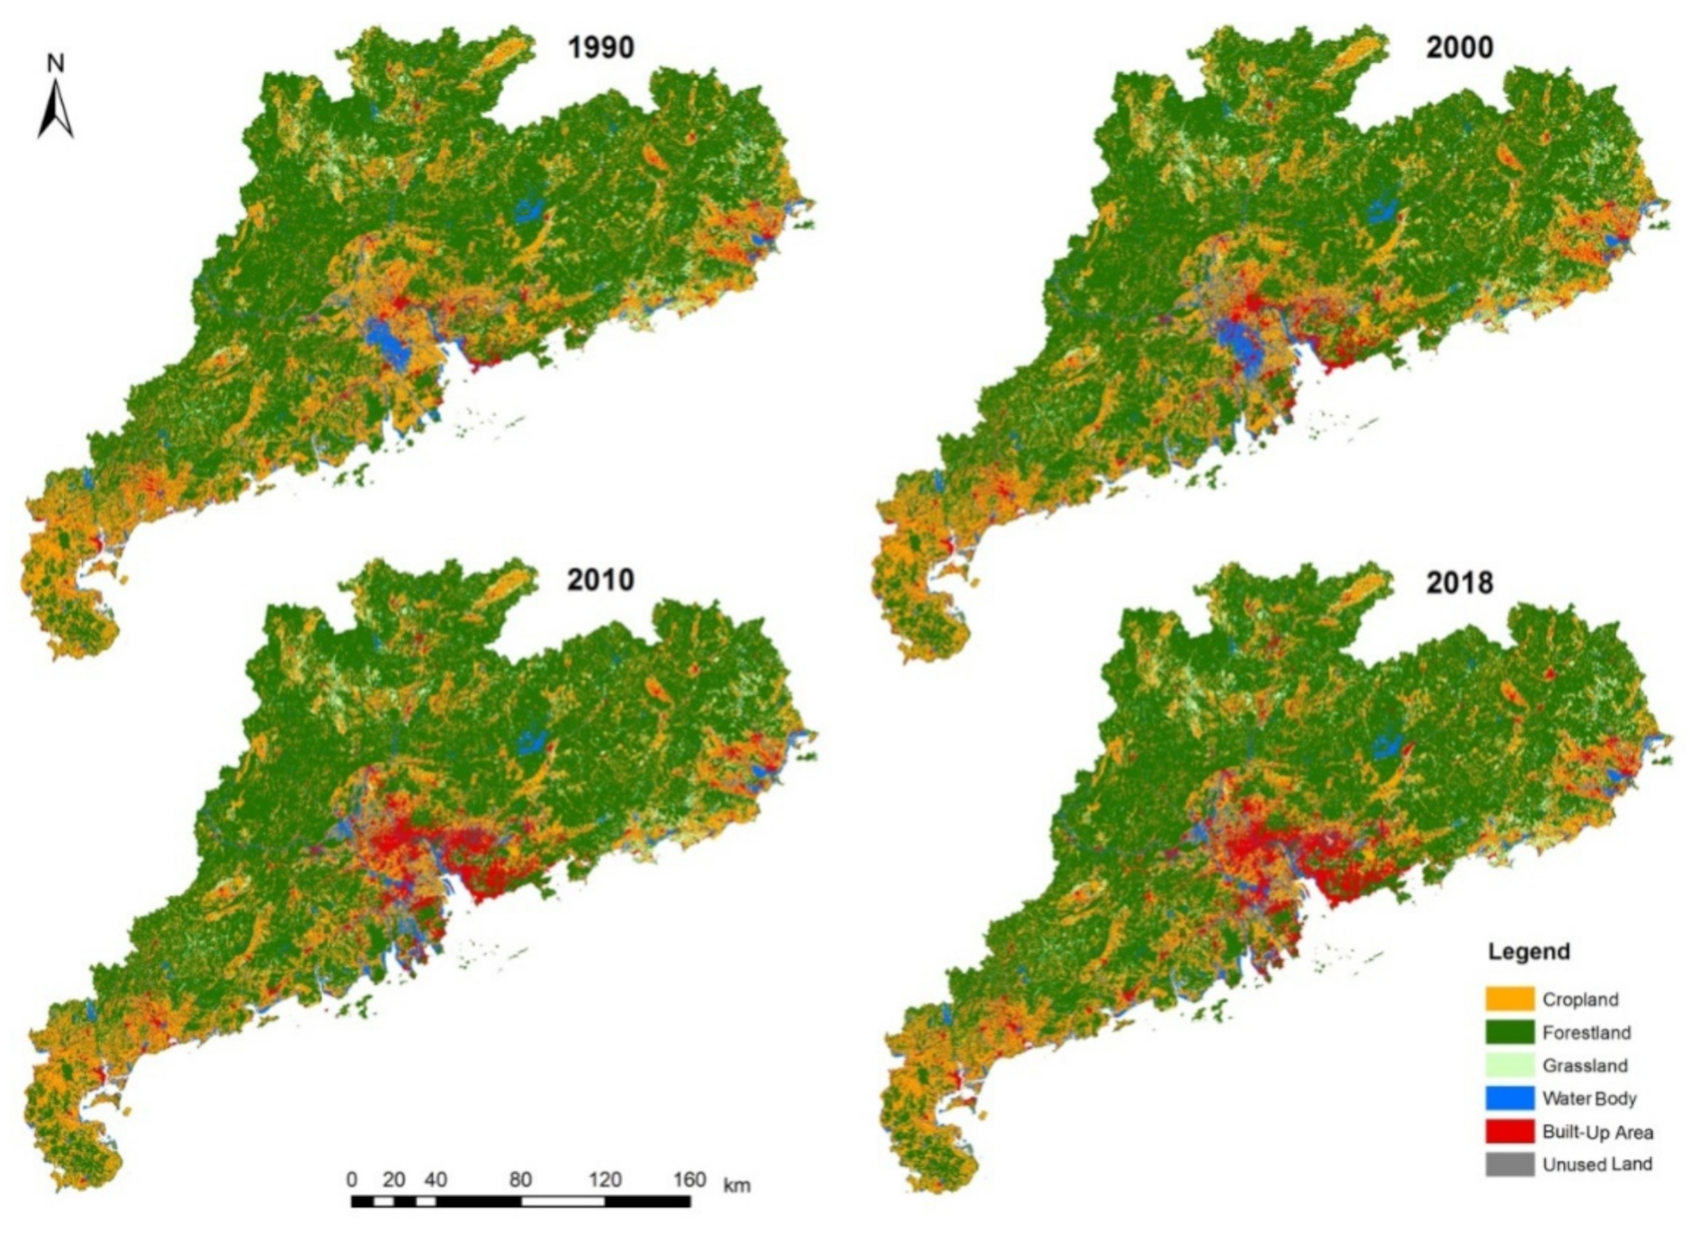
3.1. Changes of Land-Use

The land-use changes in Guangdong province over the 28 years from 1990 to 2018 are shown in Table 4 and Figure 2. Forestland was the largest occupied area in Guangdong province, which accounted for more than 60% of the total land-use area in the whole research period. Followed by Cropland, its proportion is 26.6, 25.5, 24.2, and 23.9% in 1990, 2000, 2010, and 2018, respectively. The total proportion of Built-Up Area, Grassland, Water body, and Unused Land is lower than 16%. During the research period, Cropland experienced the greatest decrease in area (−4750.5 km2, −10.9%), followed by Forestland (−1087.8 km2, −1.0%), Grassland (−319.9 km2, −4.0%), and Water Body (−162.7 km2, −2.1%). On the contrary, Built-Up Area showed the greatest increase (6358.9 km2, 93.7%) during the whole period.
As the four regions in Guangdong province are concerned, the trend of land-use change is roughly similar to the overall trend. Figure 2 and Table 5 showed that Forestland is mainly concentrated in the Northern Mountainous Region, the northern part of the Pearl River Delta and the Western Region, and the northwest part of the Eastern Region, accounting for 72.51%, 49.92%, 53.61%, and 42.34%, respectively, in 2018. Cropland is mainly concentrated in the coastal area of Western Region and the coastal area of Eastern Region and the Pearl River Delta, accounting for 36.74%, 31.97%, and 22.82%, respectively in 2018.
In Table 5, we can also see that the land-use change has different characteristics in the four regions. Cropland and Forestland decreased the most in the Pearl River Delta, a decrease of 3489.6 and 1232.6 km2, respectively, in the past 28 years. However, in the Eastern Region and the Western Region, Forestland increased 16.5 and 257.4 km2, respectively. Except for in the Pearl River Delta, Water Body increased in the rest three regions. Among them, Water Body in the Pearl River Delta decreased by 107.7 km2 from 1990 to 2018, a decrease of 2.5%. It is noteworthy that the Built-Up Area in Guangdong province had shown a significant increase in the four regions. Among them, the Pearl River Delta has a larger increased area of 4993.8 km2, followed by the Northern Mountainous Region of 828.8 km2, the Western region of 304.9 km2, and the Eastern Region of 198.9 km2. As for Grassland, the area decreased in all the four regions to varying degrees. Among them, Grassland in the Eastern Region decreased the most. Overall, Built-Up Area in all regions of Guangdong province increased the most obviously, which occupied the space of other land-use types to a certain extent, ultimately affecting the distributing pattern of the land-use type.
As for the leading area in implementing the reform and opening-up in China, Guangdong province, especially its Pearl River Delta region, experienced large-scale economic development, population growth, and urban sprawl, which led to rapid industrialization and urbanization and subsequently land-use change. The land-use transition (Table 6) shows that most converted Cropland became Built-Up Area or Water Body, especially in the Pearl River Delta and the Eastern Region. For example, there were 845 km2 of Cropland converting to Built-Up Area from 1990 to 2000 in the Pearl River Delta, 1761 km2 from 2000 to 2010, and 250 km2 from 2010 to 2018. During 1990–2000 and 2000–2010, there were 726 and 233 km2, respectively, of Cropland converted to Water Body in the Pearl River Delta. The lost Forestland was converted primarily to Built-Up Area during 1990–2010, while between 2010 and 2018, it was mainly converted to Grassland and Built-Up Area in the Pearl River Delta. The new Built-Up Area in the Pearl River Delta occurred primarily on Cropland and Forestland, and some of the new Built-Up Area occurred in a Water Body. However, new Water Body areas occurred primarily in former Cropland areas. As for the Western Region, there were 207.3 km2 of Cropland converting to Forestland through the Grain for Green Project from 1990 to 2000 and 105.1 km2 from 2000 to 2010. Cropland of 147.1 km2 from 1990 to 2000 and 45.5 km2 from 2000 to 2010 were converted to Built-Up Area. Between 2010 and 2018, 44.7 km2 of Forestland was converted to Built-Up Area. The Northern Mountainous Region was mainly characterized by the conversion of Forestland and Cropland to Built-Up Area during the research period. During 2010–2018, there was 199.7 km2 of Forestland converting to Grassland in the Northern Mountainous Region.

3.2. Changes in Land-Use Dynamic Degree

To analyze the speed of land-use change, we used Equation (1) to calculate the single dynamic degree of land-use. The land-use’s single dynamic degree of various land-use types was significantly different during the study period. From 1990 to 2018, the dynamic degree of Built-Up Area reached 5.21%, while Unused Land was −1.35%, followed by Cropland (−0.56%), Grassland (−0.22%), Forestland (−0.12%), and Water Body (−0.06%), which further proved that Built-Up Area greatly increased.

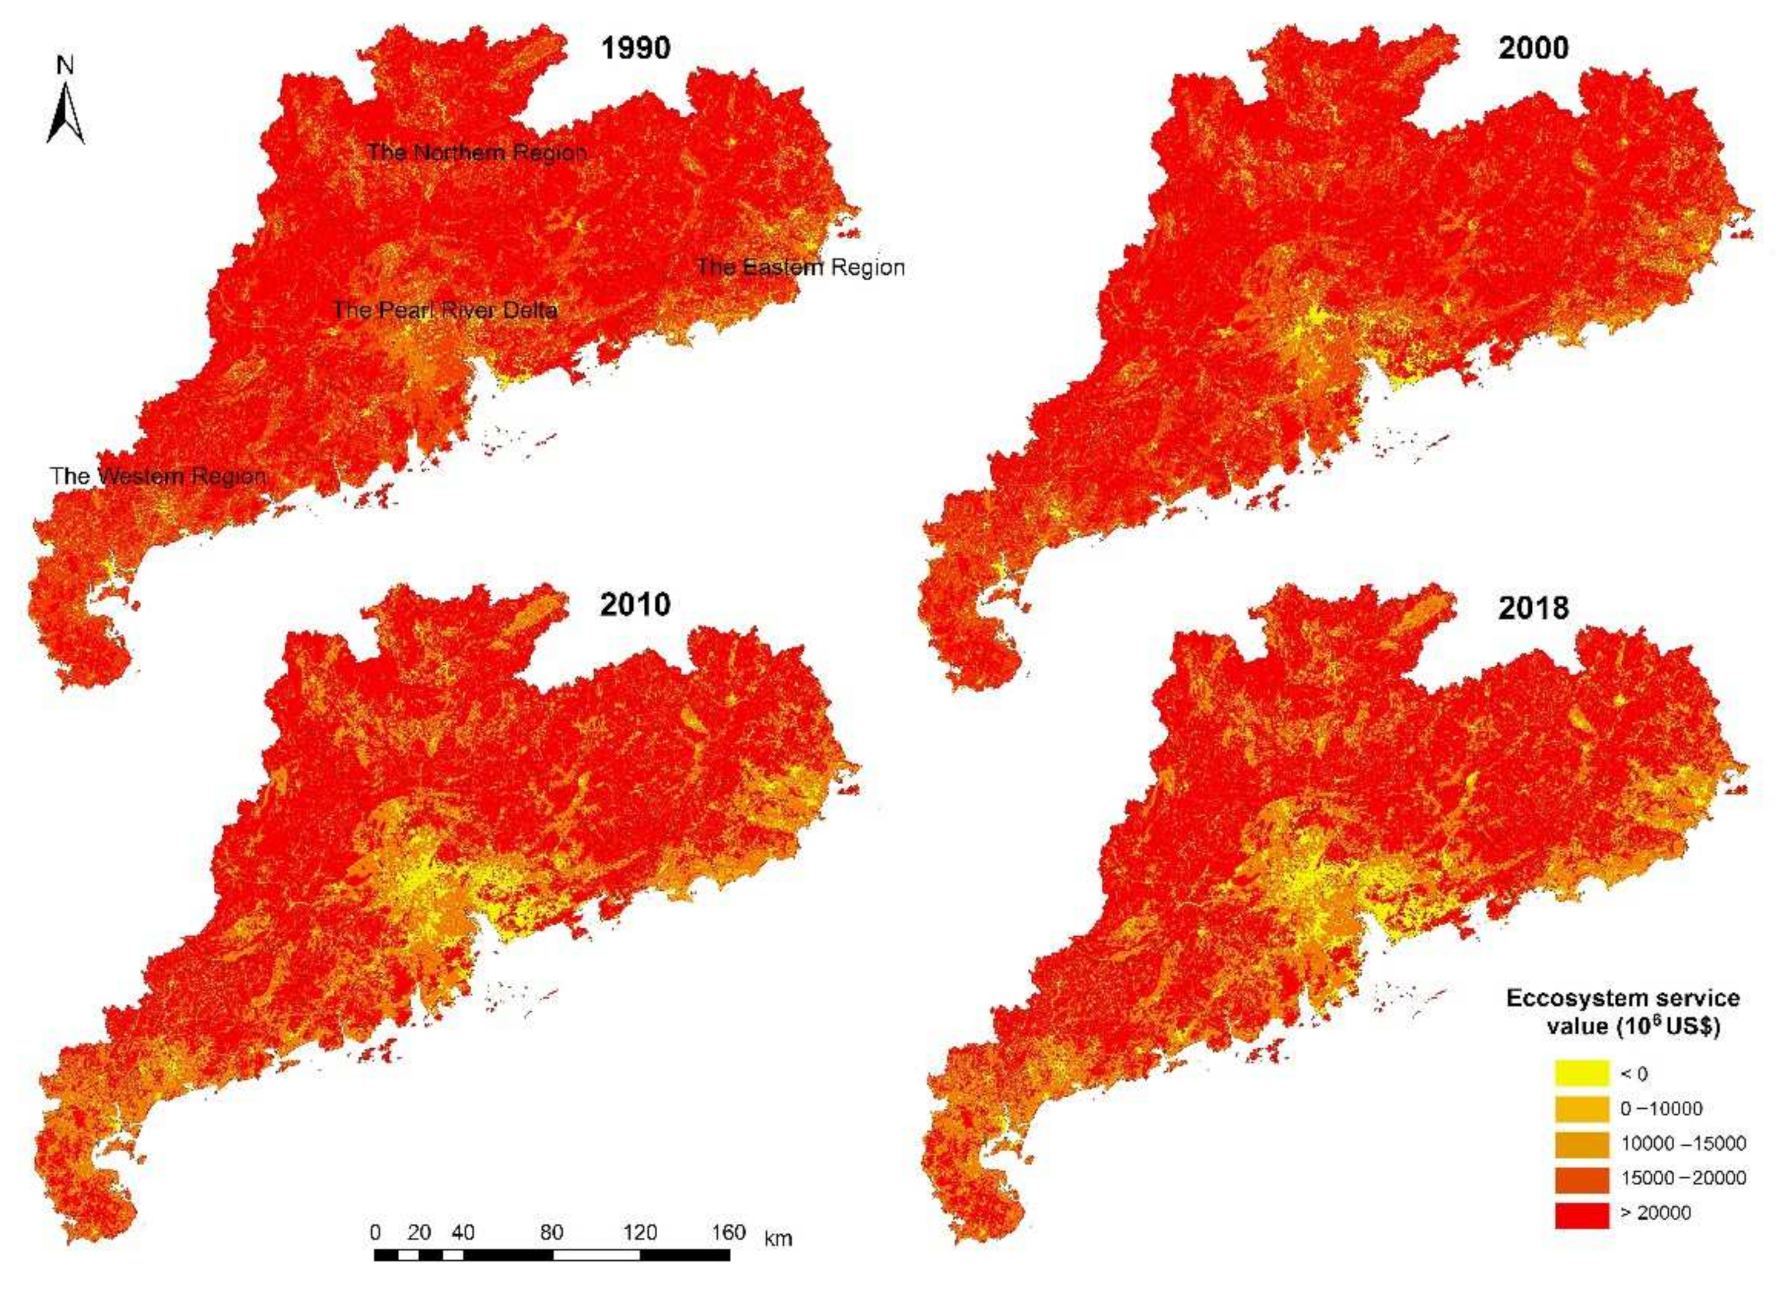
3.3. Changes in Ecosystem Service Value

3.3.1. Ecosystem Service Value of Different Land-Use Types

Table 7 lists the values of ecosystem services in Guangdong province from 1990 to 2018. The total ecosystem service value decreased from US$121,666 billion in 1990 to US$116,423 billion in 2018 (−4.3%). From 1990 to 2018, Forestland was the major ecosystem services contributor among the six land-use types in Guangdong province, as it covered the largest area (Table 4) and had the second highest value coefficient (Table 2). The proportion of ecosystem service value from Forestland was 77.8% of the total ecosystem service value in 1990 and then increased to 80.5% in 2018. Cropland, the second largest area, produced the second highest ecosystem service value in 1990, 2000, 2010, and 2018 (13.2, 12.7, 12.4, and 12.4% of the total ecosystem services value, respectively). Water Body, the area of which is 3.8, 4.7, 6.5, and 7.4% of the total area, accounted for the third largest proportion of the total ecosystem service value (approximately 8.7, 9.4, 9.1, and 8.9% of the total value in 1990, 2000, 2010, and 2018, respectively) with its high value coefficient. Due to the small area proportion, Grassland and Unused Land accounted for a small proportion of the total ecosystem service value. Built-Up Area increased by 6358.9 km2 and contributed a loss of ecosystem service value of US$14,632.9 million from 1990 to 2018.
Ecosystem service values differed spatially over the study area. In the Northern Mountainous Region, the northwest part and northeast part of the Pearl River Delta, and the northeast part of the Western Region, the ecosystem service value was higher mainly due to the extent of Forestland. Ecosystem service value was low in the Pearl River Delta mainly due to the expansion of Built-Up Area under rapid urbanization, and immediately surrounding the urban areas were the areas of medium-value Cropland and Water Body (Figure 3).

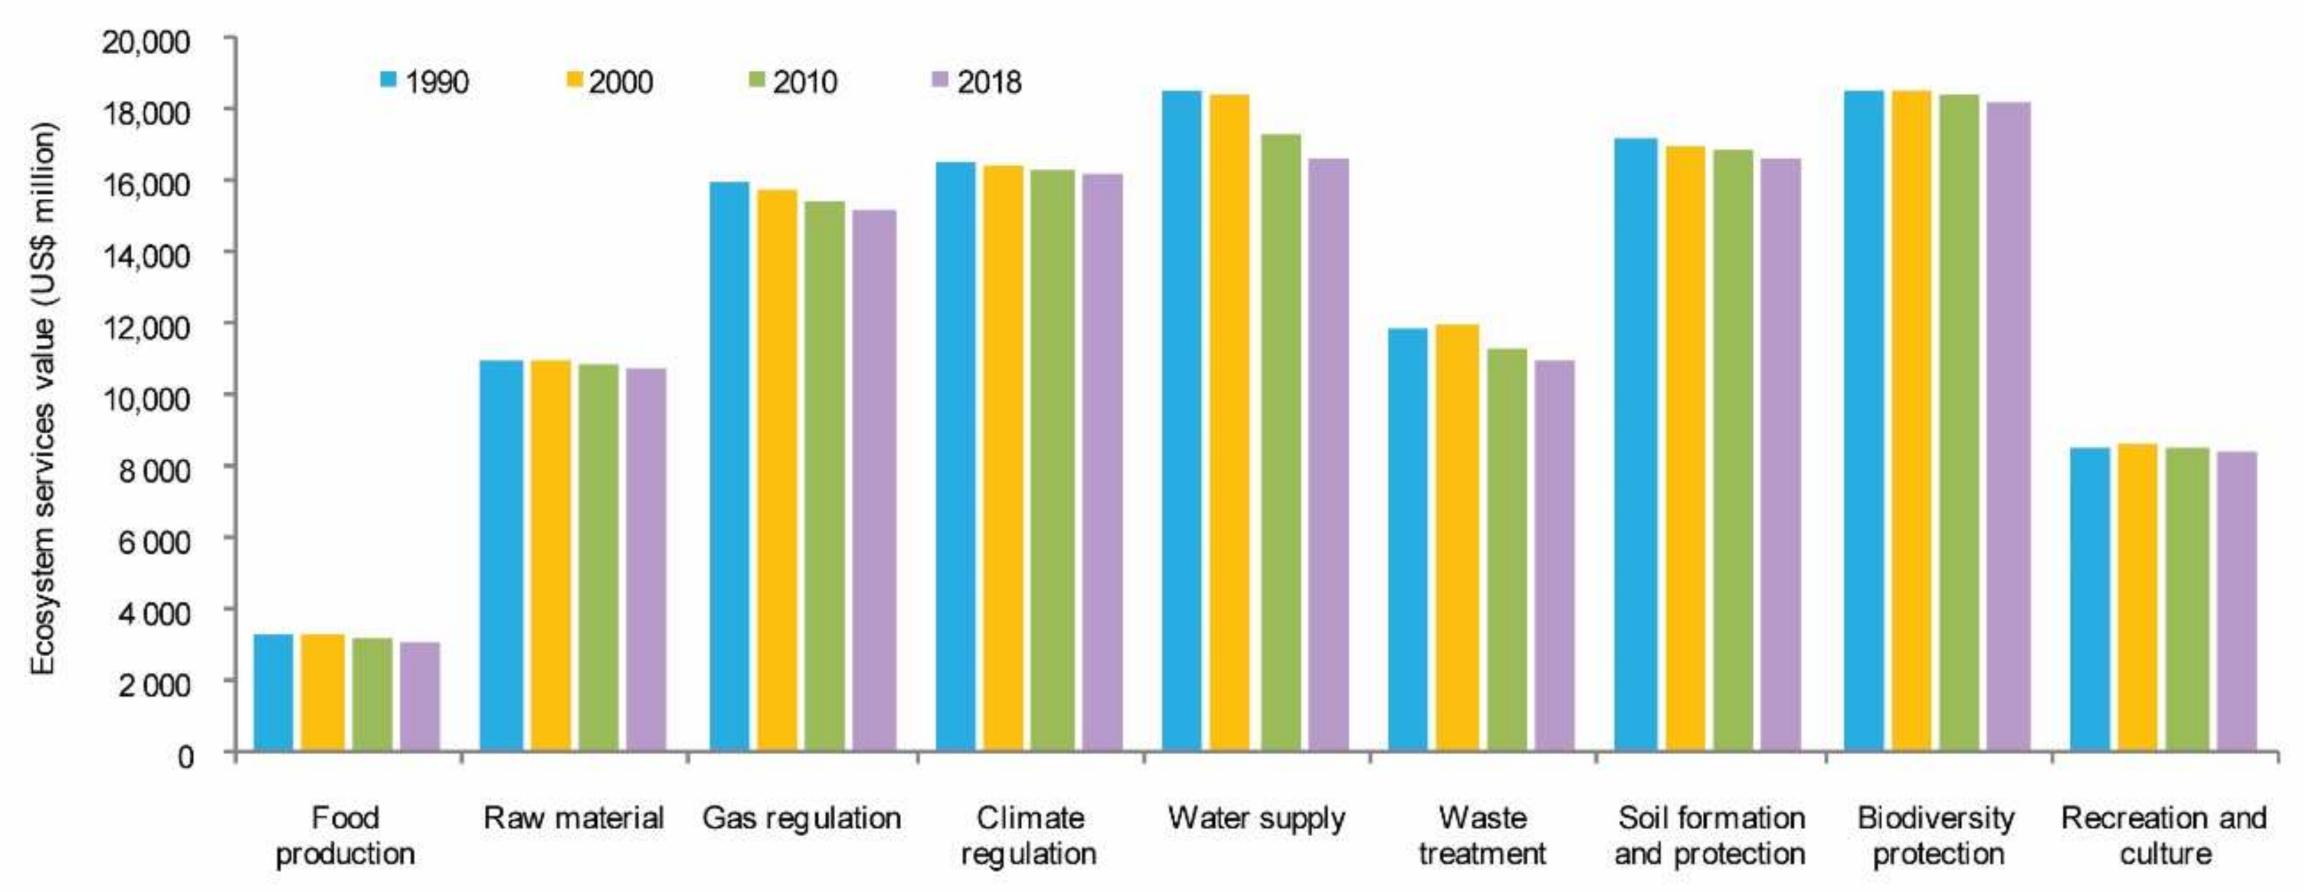
3.3.2. Value of Individual Ecosystem Service

The individual ecosystem service values in Guangdong province in 1990, 2000, 2010, and 2018 are shown in Figure 4, which shows that the overall rank of the contributions from each ecosystem service to the total ecosystem service value was relatively constant. As for the rank order, Biodiversity protection was highest, followed by water supply, soil formation and retention, climate regulation, gas regulation, waste treatment, raw material, recreation and culture, and food production.
The distribution of values for individual ecosystem services supplied by each land-use type is presented in (Figures S1–S4), which shows that Forestland was the major contributor to ecosystem service values, with a substantial impact on biodiversity, soil formation and retention, water supply, climate regulation, gas regulation, and raw material in the four regions of Guangdong province. However, there were also some differences in the four regions. In the Northern Mountainous Region, most of the individual ecosystem service value was offered by Forestland, while in the Eastern region, Forestland, Cropland, Water Body, and Grassland also offered certain proportions of individual ecosystem services. In the Western Region, this role was played by Cropland and Water Body, and in the Pearl River Delta, it was performed by the Water Body and Cropland.

3.4. Ecosystem Service Trade-Off Degree

The ecosystem service trade-off degree of Guangdong province from 1990 to 2018 is shown in Table S1, showing that the primary relationship among ecosystem services in Guangdong province is synergy during 1990–2018, the synergistic degree between the climate regulation and recreation and culture was the highest. During the period of 1990–2000, 53 pairs of ecosystem service trade-off degrees are positive (i.e., synergies), and 28 pairs are negative (i.e., trade-offs), mainly because of the drastic change of land-use dynamics from 1990 to 2000 (Figure 2). We can also see that the trade-off mainly existed in both waste treatment and recreation and culture. During 1990–2000, the trade-off degree between gas regulation and waste treatment was the lowest (−5.06), and the synergistic degree between gas regulation and biodiversity protection was the highest (8.47). During 2000–2018, the relationships among ecosystem services were all positive, the highest synergistic degree between 2000 and 2010 was 19.90 between waste treatment and raw material, and the highest synergistic degree between 2010 and 2018 was 19.40 between waste treatment and food production.

3.5. Relationships of Ecosystem Service Value and Economic Development

Figure S5a shows that, in Guangdong province, the GDP increased by a factor of 62.4-fold from 1990 to 2018, with a yearly growth rate of 16.5%. At the same time, the total ecosystem service value decreased by 4.3% from 1990 to 2018. Similarly, the population increased by a factor of 1.7 times from 1990 to 2018, with a yearly growth rate of 2.0% (Figure S5b), which indicates that regional economic development and the increasing population had a negative impact on the ecosystem service value in the whole province. However, from the perspective of the four regions in Guangdong province, the total ecosystem service value decreased obviously with the increase in the GDP both in the part of the Pearl River Delta (Figure S6a) and in the part of the Northern Mountainous Region (Figure S6d) due to the inter-conversion between the different land-use types’ adjust when the economy develops to a certain degree, and there is no correlation between the GDP and the ecosystem service value in the medium developing area in the Eastern Region (Figure S6b) and in the Western Region (Figure S6c). On the regional scale, there is no obvious correlation between the population and the ecosystem service value (Figure S7). Although the Built-Up Area would be increased when the population reaches a certain level and would lead to the decrease in ecosystem service value, a negative correlation is found only in a specific stage of population development (Figure S7a).

4. Discussion

4.1. Main Reasons of Decreasing Ecosystem Service Value in Guangdong Province

Our study clearly presented the net decline in the ecosystem service value (US$5.234 billion, −4.3%) over the whole period between 1990 and 2018 resulting from the land-use change. One of the reasons for the increase in Built-Up Area was that Guangdong province is the leading area of the reform and opening-up policy in China and its economy and population grew rapidly since the 1990s, which led to the gradually rise of industry and commerce, and thus the infrastructure and road network. At the same time, the agricultural population became nonagricultural, which also promoted the transformation of agricultural land (e.g., Cropland and Water body) into Built-Up Area [51]. Another main reason is that the comparative economic benefit of Built-Up Area is higher than that of traditional agricultural land, which also leads to the loss of Cropland, Water Body, etc.
As for the regional feature, we established relationship figures between the ecosystem service value and Built-Up Area, Water Body, Cropland, and Forestland to show the changing characteristics. Figure 5 shows that, in the Pearl River Delta and the Northern Mountainous Region, the changing trends of the ecosystem service value are almost the same as those of Guangdong province, i.e., the ecosystem service value decreased with the increase in Built-Up Area and decrease in Water Body, Cropland, and Forestland. Meanwhile, in the Eastern Region and the Western Region, as the Built-Up Area increased and the Cropland decreased, the ecosystem service value increased. The main reason is that, in the two Regions, there was a large area of Cropland that converted to Forestland for the Grain for Green Project [51], especially in the Western Region, and the government of Guangdong province also required Forestland to be stable. Thus, the Forestland was increased from 1990 to 2010 in the Eastern Region, the Western Region, and even the Northern Mountainous Region, followed by a slight decrease from 2010 to 2018 for conversion to Built-Up Area. We can also see that the changing trends between the ecosystem service value and Forestland, GDP, and population are highly consistent (Figures S6b,c and S7b,c), which indicates that the ecosystem service value in the Western Region and the Eastern Region was mainly impacted by Forestland.

4.2. Strong Impact on Ecosystem Services of Land-Use Changes

Increasing human activities worldwide have significantly altered the natural ecosystems. Land-use change is an important human activity that has strong impacts on ecosystem services, consequently [62,63,64]. Thus, to prevent consequences such as climate crisis, environmental pollution, and species extinction, which are caused by the abuse of natural resources, the United Nations adopted a landmark framework called SEEA-EA (The System of Integrated Environmental and Economic Accounting-Ecosystem Accounting) in March 2021 to integrate natural capital in economic reporting. Hence, the ecosystem service value is becoming part of the mandated accounting system for economic progress in a global sense [65]. There are many studies that estimate the impacts of land-use change on a wide range of ecosystem services. Some studies have indicated that land-use change attributed to natural factors and human activities have led to the loss of ecosystem services [4,30,64,66], while others show an increase [62,63,67]. Our study revealed that the ecosystem service values in Guangdong province changed US$121.67 billion, US$121.20 billion, US$118.41 billion, and US$116.42 billion from 1990 to 2018, a downward trend in land-use change on the whole. Table 4 shows that the trends in land-use change in Guangdong province have undergone a decrease in Cropland, Forestland, Water Body, Grassland, and Unused Land, which led to a decline in ecosystem service value of US$1611.8 million, US$950.4 million, US$226.0 million, US$114.3 million, and US$1.6 million, respectively. There was also a decrease in ecosystem service value of US$2338.7 million due to the increase of Built-Up Area. This result is similar to most studies, which have predominantly found a decline in ecosystem service value in term of land-use change [4,5,27,30,64,67]. Meanwhile, some studies have found an increase of ecosystem service value [62,63,68,69]. However, the changes in specific land-use types leading to the increase or decrease of ecosystem service value are different. For example, Arowolo et al. [62] found a total increase of 1.51 billion (2007 US$) in Nigeria from 2000 to 2010, 97.38% of which was contributed by Cropland expansion, and Shrestha et al. [63] found an increase of US$ 1.59 × 10⁶ in the Transboundary Karnali River Basin, Central Himalayas from 2000 to 2017 due to the increases in Grassland, Cropland, and Water Body. In Jiangxi province, China [4], in the middle reach of the Heihe River Basin, China [67], and in the Kilombero Valley Floodplain, southeastern Tanzania [66], Cropland increases cannot make up for the decrease in ecosystem service value caused by the decrease of other land-uses or the increase of Built-Up Area. Studies also indicated that a decrease of ecosystem services value resulted either by the loss of Cropland [70], or to the loss of Forestland and the sprawl of Cropland, and Built-Up Area [64]. Furthermore, there were different changing trends in ecosystem service value in different periods. For example, although the total ecosystem service value increased by 17.55% in Northeastern China, it decreased from 1990 to 2000 due to Cropland reclamation and to Forestland and Wetland degradation and increased from 2000 to 2015 due to land retirement and afforestation programs [71]. In brief, land-use change has a strong impact on ecosystem services and different land-use change leads to different changing trend of ecosystem services value.

4.3. Suitable Methods for Ecosystem Service Valuation

Ecosystem service valuation has become a popular topic and has been widely used to estimate the multiple benefits provided by different ecosystems [30] through different methods [5]. The Intergovernmental Science Policy Platform on Biodiversity and Ecosystem Services (IPBES) has encouraged the use of modeling approaches to estimate the ecosystem services [72]. Many models, such as the Artificial Intelligence for Ecosystem Services (ARIES) model [73,74], the Land Utilization and Capability Indicator (LUCI) model [75], the InVEST model [76], and the Spatial Assessment and Optimization Tool for Regional Ecosystem Services(SAORES) model [77], have been widely used in ecosystem service estimation and in public- and private-sector decision making [72]. Unfortunately, each of the above models has different strengths and weaknesses depending on which regions and ecosystem services are being considered, and different ecosystem service models have different parameterization requirements [78]. Furthermore, different elements, such as market price, inflation rate, value coefficients, the degree of willingness to pay, the ability to pay, and land-use data [79,80], can influence the estimation of ecosystem service value and can considerably affect its accuracy [30].
Considering the above reasons, in our study, we still selected the well-established benefit transfer method originally developed by Costanza et al. [1] and modified by Xie et al. through 700 ecologists and economists [25,58], which is the most popular in the Chinese context [5] and has been widely used [2,13,80,81]. Although the benefit transfer has been criticized for the coarse scale and potential for double counting [81], and for the nonlinear nature of the system [82], we made a significant effort to tailor the value coefficients to our study area based on data, which would improve the accuracy of result to a certain extent. In brief, compared with previous studies [4,30,83], one of the greatest features of this study is that the difference in location conditions and its four regions in different developing level are considered. That is, since the rate of multiple cropping is higher in our research areas than other area in China, we used the average food production of Cropland in Guangdong province to tailor the equivalent coefficient of ecosystem service value per unit area, which can better reflect the truth of the ecosystem service value in our study area. We should note that the monetary expression of ecosystem services does not necessarily mean that these can be considered as market products [2,30] for benefit transfer that only gives an idea of potential ecosystem services. For example, everybody can benefit from gas regulation and climate regulation, and we call them public property, which is to say they cannot be private property. However, we have to admit that the monetization of ecosystem service value can help raise people’s awareness of the importance of ecosystem services to society, and it is vital to aid policymakers to formulate different decision-making strategies for land-use change planning [30]. For example, considering the ecosystem service value, the governmental planning measures of the National Territory Spatial Planning System, which not only optimizes the layout of ecological, agricultural, and urban spaces, but also pays attention to the ecological protection and regional characteristics, is now in full operation in China [84,85] and can be conversely used to help manage the land-use and its impact on ecosystem services. Meanwhile, the consideration of ecosystem service value can also be mandated in laws and regulations in China [86]. The 18th National Congress of the Communist Party of China made it clear that resources, environment, and ecology should be included in the evaluation system of economic and social development, and in 2013, the first gross ecosystem product (GEP) mechanism, which was proposed and advocated by IUCN, was implemented in Inner Mongolia in Northern China [87]. In August 2020, the first ecosystem services assessment platform in China, which provides new support for coordinating urban construction and ecological environment protection, was launched in Shenzhen city, one of the fastest growing metropolitan areas in China located in the Pearl River Delta [88]. Therefore, we believe that the importance of ecosystem services to society will be widely known and aid in the formulation of decision-making strategies for land-use and eco-environmental protection.

5. Conclusions

We have examined changes in land-use and ecosystem service values in Guangdong province in southern China, from 1990 to 2018 based on four-phase land-use data. As the leading area of the deepening reform and opening-up in China, the land-use dynamics of Guangdong province have been significantly changed due to the massive expansion of Built-Up Area resulting in the widespread conversion of Cropland, Forestland, and other land. Large areas of Cropland and Forestland were converted to Built-Up Areafrom1990 to 2010, there was a slowdown after 2010, and there were other significant land-use changes as well: e.g., Cropland was converted to Water Body between 1990 and 2010, Water Body was converted to Built-Up Area between 2000 and 2010, and a conversion occurred from Forestland to Grassland between 2010 and 2018. The land-use variation in the Pearl River Delta was fast, the variation in the Eastern Region of Guangdong was moderate, and it was comparatively stable in the Western Region and the Northern Mountainous Region.
The total ecosystem service value decreased (US$5.234 billion, −4.3%) over the whole period between 1990 and 2018 as a result of the increase in Built-Up Area and the decrease in Cropland, Forestland, and Water Body. Biodiversity protection, soil formation and protection, water supply, climate regulation, and gas regulation are the top5 services, and the proportion of their ecosystem service value to the total was between 13% and 15%. Water supply is the dominant type of ecosystem service value that has declined (US$ 1866.26 million, −10.1%), followed by waste treatment (US$908.226 million, −7.6%) and food production (US$219.584 million, −6.5%). As for the ecosystem service trade-off degree, we can see that synergy was the primary relationship among ecosystem services in Guangdong province during the whole study period, and the highest degree was between climate regulation and recreation and culture. However, during 1990–2000, 28 pairs of ecosystem services were trade-offs, which were mainly in both waste treatment and recreation and culture. After 2000, the relationships among ecosystem services were synergistic.
We believe that this study is a great reference for provincial scale research on assessing the regional ecosystem service value. Defining the scope and degree of different ecosystem service actions in different regions will play a positive role in further clarifying the spatial-temporal evolution law of regional development, the supply and demand of different ecosystem services, and the quality of the regional environment can be improved. It can lead to more practical guidance for regional development through measures such as ecological compensation between regions. It is possible to provide a case study that can be applied to other provincial areas in China with unbalanced regional development and even to other parts of the world.

Supplementary Materials

The following are available online at https://www.mdpi.com/article/10.3390/land10040426/s1. Figure S1: The ecosystem service value in the Pear River Delta of Guangdong from 1990 to 2018. Figure S2: The ecosystem service value in the Eastern Region of Guangdong from 1990 to 2018. Figure S3: The ecosystem service value in the Northern Mountainous Region of Guangdong from 1990 to 2018. Figure S4: The ecosystem service value in the Western Region of Guangdong from 1990 to 2018. Figure S5: Relationship between (a) total ecosystem service value and GDP (US$ in 2018), (b) total ecosystem service value and population in Guangdong province from 1990 to 2018. Figure S6: Relationship between total ecosystem service value and GDP (US$ in 2018) in the four regions in Guangdong province from 1990 to 2018. Figure S7: Relationship between total ecosystem service value and population in the four regions in Guangdong province from 1990 to 2018. Table S1: Ecosystem service trade-off degree in Guangdong province from 1990 to 2018.

Author Contributions

Conceptualization, Y.Y. and J.Z. methodology, Y.Y. and T.W.; software, Y.Y. and H.B.; validation, Y.Y. and J.Z.; formal analysis, Y.Y., T.W., H.B. and X.W.; resources, H.B., W.Z. and X.W. data curation, Y.Y. and J.Z. writing—original draft preparation, Y.Y. and T.W.; writing—review and editing, Y.Y., J.Z. and H.B.; visualization, Y.Y. and W.Z.; supervision, J.Z.; project administration, Y.Y. and J.Z.; funding acquisition, J.Z. All authors have read and agreed to the published version of the manuscript.

Funding

This research was funded by the National Natural Science Found of China, Grant 31300405 and the Guangdong Modern Agricultural Technology Innovation Team Construction Project, Grant 2018LM1100.

Data Availability Statement

The data used to support the findings of this study are available from the corresponding author upon request.

Conflicts of Interest

All authors declare no conflict of interest.

References

  1. Costanza, R.; d’Arge, R.; de Groot, R.; Farber, S.; Grasso, M.; Hannon, B.; Limburg, K.; Naeem, S.; O’Neill, R.V.; Paruelo, J.; et al. The value of the world’s ecosystem services and natural capital. Nature 1997, 387, 256–260. [Google Scholar] [CrossRef]
  2. Costanza, R.; de Groot, R.; Sutton, P.; van der Ploeg, S.; Anderson, S.J.; Kubiszewski, I.; Farber, S.; Turner, R.K. Changes in the global value of ecosystem services. Glob. Environ. Chang. 2014, 26, 152–158. [Google Scholar] [CrossRef]
  3. Daily, G.C.; Matson, P. Ecosystem services: From theory to implementation. Proc. Natl. Acad. Sci. USA 2008, 105, 9455–9456. [Google Scholar] [CrossRef] [PubMed] [Green Version]
  4. Zhang, X.M.; Xin, H.L.; Shi, J.Y.; Lv, T.G.; Zhou, C.H.; Liu, W.D. Assessing changes in ecosystem service values in response to land cover dynamics in Jiangxi Province, China. Int. J. Environ. Res. Public Health 2020, 17, 3018. [Google Scholar] [CrossRef] [PubMed]
  5. Ye, Y.Q.; Bryan, B.A.; Zhang, J.E.; Connor, J.D.; Cheng, L.L.; Qin, Z.; He, M.Q. Changes of land-use and ecosystem services in the Guangzhou-Foshan Metropolitan Area in southern China between 1990 and 2010: Implications for sustainability under rapid urbanization. Ecol. Indic. 2018, 93, 930–941. [Google Scholar] [CrossRef]
  6. Gaglio, M.; Aschonitis, V.G.; Mancuso, M.M. Changes in land use and ecosystem services in tropical forest areas: A case study in the Andes mountains of Ecuador. Int. J. Biodivers. Sci. Ecosyst. Serv. Manag. 2017, 13, 264–279. [Google Scholar] [CrossRef] [Green Version]
  7. Lawler, J.; Lewis, D.J.; Nelson, E.; Plantinga, A.J.; Polasky, S.; Withey, J.C.; Helmers, D.P.; Martinuzzi, S.; Pennington, D.; Radeloff, V.C. Projected land-use change impacts on ecosystem services in the United States. Proc. Natl. Acad. Sci. USA 2014, 111, 7492–7497. [Google Scholar] [CrossRef] [Green Version]
  8. Yang, Y.Y.; Bao, W.K.; Li, Y.H.; Wang, Y.S.; Chen, Z.F. Land use transition and its eco-environmental effects in the Beijing–Tianjin–Hebei Urban Agglomeration: A production—living—ecological perspective. Land 2020, 9, 285. [Google Scholar] [CrossRef]
  9. Wang, W.J.; Wu, T.; Li, Y.Z.; Xie, S.L.; Han, B.L.; Zheng, H.; Ouyang, Z.Y. Urbanization Impacts on Natural Habitat and Ecosystem Services in the Guangdong-Hong Kong-Macao “Megacity”. Sustainability 2020, 12, 6675. [Google Scholar]
  10. Bryan, B.A.; Ye, Y.Q.; Zhang, J.E.; Connor, J.D. Land-use change impacts on ecosystem services value: Incorporating thescarcity effects of supply and demand dynamics. Ecosyst. Serv. 2018, 32, 144–157. [Google Scholar] [CrossRef]
  11. Liu, W.; Zhan, J.Y.; Zhao, F.; Yan, H.M.; Zhang, F.; Wei, X.Q. Impacts of urbanization-induced land-use changes on ecosystem services: A case study of the Pearl River Delta Metropolitan Region, China. Ecol. Indic. 2019, 98, 228–238. [Google Scholar] [CrossRef]
  12. Dasgupta, P. The Economics of Biodiversity: The Dasgupta Review; HM Treasury: London, UK, 2021. [Google Scholar]
  13. Jiang, W. Ecosystem services research in China: A critical review. Ecosyst. Serv. 2017, 26, 10–16. [Google Scholar] [CrossRef]
  14. Zhang, X.M.; Estoque, R.C.; Xie, H.L.; Murayama, Y.; Ranagalage, M.; Bianchi, C.N. Bibliometric analysis of highly cited articles on ecosystem services. PLoS ONE 2019, 14, e0210707. [Google Scholar] [CrossRef]
  15. Wu, X.T.; Wang, S.; Fu, B.J.; Liu, Y.; Zhu, Y. Land use optimization based on ecosystem service assessment, a case study in the Yanhe watershed. Land Use Policy 2018, 72, 303–312. [Google Scholar] [CrossRef]
  16. Deng, L.; Shangguan, Z.P.; Li, R. Effects of the Grain-for-Green program on soil erosion in China. Int. J. Sediment Res. 2012, 27, 120–127. [Google Scholar] [CrossRef]
  17. Bai, Y.; Jiang, B.; Wang, M.; Li, H.; Alatalo, J.M.; Huang, S.F. New ecological redline policy (ERP) to secure ecosystem services in China. Land Use Policy 2016, 55, 348–351. [Google Scholar] [CrossRef] [Green Version]
  18. Ouyang, Z.Y.; Zheng, H.; Xiao, Y.; Polasky, S.; Liu, J.G.; Xu, W.H.; Wang, Q.; Zhang, L.; Xiao, Y.; Rao, E.; et al. Improvements in ecosystem services from investments in natural capital. Science 2016, 352, 1455–1459. [Google Scholar] [CrossRef]
  19. Bryan, B.A.; Gao, L.; Ye, Y.Q.; Sun, X.F.; Connor, J.D.; Crossman, N.C.; Stafford-Smith, M.; Wu, J.G.; He, C.Y.; Yu, D.Y.; et al. China’s response to a national land-system sustainability emergency. Nature 2018, 559, 193–204. [Google Scholar] [CrossRef]
  20. Xie, G.D.; Zhang, C.X.; Xiao, Y.; Lu, C.X. The value of ecosystem services in China. Resour. Sci. 2015, 37, 1740–1746. (In Chinese) [Google Scholar]
  21. Chen, F.Y.; Li, L.; Niu, J.Q.; Lin, A.W.; Chen, S.Y.; Hao, L. Evaluating ecosystem services supply and demand dynamics and ecological zoning management in Wuhan, China. Int. J. Environ. Res. Public Health 2019, 16, 2332. [Google Scholar] [CrossRef] [Green Version]
  22. Estoque, R.C.; Murayama, Y. Quantifying landscape pattern and ecosystem service value changes in four rapidly urbanizing hill stations of Southeast Asia. Landsc. Ecol. 2016, 31, 1481–1507. [Google Scholar] [CrossRef]
  23. Viglizzo, E.F.; Frank, F.C. Land-use options for Del Plata Basin in South America: Tradeoffs analysis based on ecosystem service provision. Ecol. Econ. 2006, 57, 140–151. [Google Scholar] [CrossRef]
  24. An, W.M.; Li, Z.S.; Wang, S.; Wu, X.; Fu, B.J. Exploring the effects of the “Grain for Green” program on the differences in soil water in the semi-arid Loess Plateau of China. Ecol. Eng. 2017, 107, 144–151. [Google Scholar] [CrossRef]
  25. Xie, G.D.; Zhen, L.; Lu, C.X.; Xiao, Y.; Chen, C. Expert knowledge based valuation method of ecosystem services in China. J. Nat. Resour. 2008, 23, 911–919. (In Chinese) [Google Scholar]
  26. Xie, G.D.; Zhang, C.X.; Zhang, L.M. Improvement of the evaluation method for ecosystem service value based on per unit area. J. Nat. Resour. 2015, 30, 1243–1254. (In Chinese) [Google Scholar]
  27. Wu, K.Y.; Ye, X.Y.; Qi, Z.F.; Zhang, H. Impacts of land use/land cover change and socioeconomic development on regional ecosystem services: The case of fast-growing Hangzhou metropolitan area, China. Cities 2013, 31, 276–284. [Google Scholar] [CrossRef]
  28. Su, S.; Li, D.; Hu, Y.N.; Xiao, R.; Zhang, Y. Spatially non-stationary response of ecosystem service value changes to urbanization in Shanghai, China. Ecol. Indic. 2014, 45, 332–339. [Google Scholar] [CrossRef]
  29. Chen, F.; Li, H.B.; Zhang, A.L. Ecological risk assessment based on terrestrial ecosystem services in China. Acta Geogr. Sin. 2019, 74, 432–445. (In Chinese) [Google Scholar]
  30. Su, K.; Wei, D.Z.; Lin, W.X. Evaluation of ecosystem services value and its implications for policy making in China—A case study of Fujian province. Ecol. Indic. 2020, 108, 105752. [Google Scholar] [CrossRef]
  31. Iniesta-Arandia, I.; García-Llorente, M.; Palomo, I.; Casado-Arzuaga, I.; Amo, D.G.D.; Gómez-Baggethun, E.G.; Oteros-Rozas, E.G.; Palacios-Agundez, I.; Willaarts, B. Uncovering ecosystem service bundles through social preferences. PLoS ONE 2012, 7, e38970. [Google Scholar]
  32. Lamsal, P.; Pant, K.P.; Kumar, L.; Atreya, K. Sustainable livelihoods through conservation of wetland resource: A case of economic benefits from Ghodaghodi Lake, western Nepal. Ecol. Soc. 2015, 20, 10. [Google Scholar] [CrossRef] [Green Version]
  33. Lee, H.; Lautenbach, S. A quantitative review of relationships between ecosystem services. Ecol. Indic. 2016, 66, 340–351. [Google Scholar] [CrossRef]
  34. Li, B.Y.; Wang, W. Trade-offs and synergies in ecosystem services for the Yinchuan Basin in China. Ecol. Indic. 2018, 84, 837–846. [Google Scholar] [CrossRef]
  35. Yang, S.Q.; Zhao, W.W.; Liu, Y.X.; Wang, S.; Wang, J.; Zhai, R.J. Influence of land use change on the ecosystem service trade-offs in the ecological restoration area: Dynamics and scenarios in the Yanhe watershed, China. Sci. Total Environ. 2018, 644, 556–566. [Google Scholar] [CrossRef]
  36. Wang, S.H.; Huang, L.; Xu, X.L.; Xu, S.W. Spatial and temporal evolution of ecosystem services and its trade-offs and synergies in Guangdong-Hong Kong-Macao Greater Bay Area. Acta Ecol. Sin. 2020, 40, 8403–8416. (In Chinese) [Google Scholar]
  37. Li, J.; Li, H.Y.; Zhang, L. Ecosystem service trade-offs in the Guanzhong—Tianshui Economic region of China. Acta Ecol. Sin. 2016, 3, 3053–3062. (In Chinese) [Google Scholar]
  38. Raudsepp-Heame, C.; Peterson, G.D.; Bennett, E.M. Ecosystem service bundles for analyzing tradeoffs in diverse landscapes. Proc. Natl. Acad. Sci. USA 2010, 107, 5242–5247. [Google Scholar] [CrossRef] [Green Version]
  39. Bai, Y.; Zhuang, C.; Ouyang, Z.; Zheng, H.; Jiang, B. Spatial characteristics between biodiversity and ecosystem services in a human-dominated watershed. Ecol. Complex. 2011, 8, 177–183. [Google Scholar] [CrossRef]
  40. Ailery, M.; Shoemaker, R.; Caswell, M. Agriculture and ecosystem restoration in South Florida: Assessing trade-offs from water-retention development in the Everglades agricultural area. Am. J. Agric. Econ. 2001, 83, 183–195. [Google Scholar] [CrossRef]
  41. Egoh, B.N.; Reyers, B.; Rouget, M.; Bode, M.; Richardson, D.M. Spatial congruence between biodiversity and ecosystem services in South Africa. Biol. Conserv. 2009, 142, 553–562. [Google Scholar] [CrossRef]
  42. Chisholm, R.A. Trade-offs between ecosystem services: Water and carbon in a biodiversity hotspot. Ecol. Econ. 2010, 69, 1973–1987. [Google Scholar] [CrossRef]
  43. Dai, E.F.; Wang, X.L.; Zhu, J.J.; Gao, J.B. Progress and Perspective on Ecosystem Services Trade-offs. Adv. Earth Sci. 2015, 30, 1250–1259. (In Chinese) [Google Scholar]
  44. Li, S.C.; Zhang, C.Y.; Liu, J.L.; Zhu, W.B.; Ma, C.; Wang, Y. The trade-offs and synergies of ecosystem services: Research progress, development trend, and themes of geography. Geogr. Res. 2013, 32, 1379–1390. (In Chinese) [Google Scholar]
  45. Shui, W.; Du, Y.; Wang, Y.N.; Yang, H.F.; Fu, Y.; Fan, B.X.; Huang, M.Y. Spatio-temporal dynamics and scenarios simulation of trade-offs between ecosystem services in Min Delta urban Agglomeration. Acta Ecol. Sin. 2019, 39, 5188–5197. (In Chinese) [Google Scholar]
  46. Asadolahi, Z.; Salmanmahiny, A.; Sakieh, Y.; Mirkarimi, S.H.; Baral, H.; Azimi, M. Dynamic trade-off analysis of multiple ecosystem services under land use change scenarios: Towards putting ecosystem services into planning in Iran. Ecol. Complex. 2018, 36, 250–260. [Google Scholar] [CrossRef]
  47. Cordingley, J.E.; Newton, A.C.; Rose, R.J.; Clarke, R.T.; Bullock, J.M. Can landscape-scale approaches to conservation management resolve biodiversity-ecosystem service trade-off? J. Appl. Ecol. 2016, 53, 96–105. [Google Scholar] [CrossRef] [Green Version]
  48. Nelson, E.; Mendoza, G.; Regetz, J.; Polasky, S.; Tallis, H.; Cameron, D.R.; Chan, K.M.A.; Daily, G.C.; Goldstein, J.; Kareiva, P.M.; et al. Modeling multiple ecosystem services, biodiversity conservation, commodity production, and trade-offs at landscape scales. Front. Ecol. Environ. 2009, 7, 4–11. [Google Scholar] [CrossRef]
  49. Lan, Z.C.; Jia, L.; Cheng, Y. The ecosystem services evaluation and trade-off in Min River Basin. Acta Ecol. Sin. 2020, 40, 3909–3920. (In Chinese) [Google Scholar]
  50. Mcnally, C.G.; Uchida, E.; Gold, A.J. The effect of a protected area on the tradeoffs between short-run and long-run benefits from mangrove ecosystems. Proc. Natl. Acad. Sci. USA 2011, 108, 13945–13950. [Google Scholar] [CrossRef] [Green Version]
  51. Liu, Z.J.; Liu, L.; Sun, W.; Zhao, X.J.; Hu, Y.M. Analysis of Temporal and Spatial Patterns and Driving Forces of Land Use Change in Guangdong Province. Jiangsu Agric. Sci. 2018, 46, 253–260. (In Chinese) [Google Scholar]
  52. Jiang, C.; Gong, J.Z.; Chen, X.Y.; Sun, J.R. Discussion on the characteristics of land use stage and dynamic research framework in Guangdong Province. Guangdong Agric. Sci. 2019, 46, 146–157. (In Chinese) [Google Scholar]
  53. Liang, Y.Z.; Zhang, S.Y. Research on Land Use Efficiency and its Spatial Consistency with Economic Development in Guangdong Province. Mod. Urban Res. 2019, 6, 31–38. (In Chinese) [Google Scholar]
  54. Statistics Bureau of Guangdong Province. Guangdong Statistical Yearbook; China Statistics Press: Beijing, China, 1991–2019. (In Chinese) [Google Scholar]
  55. Lv, S.G.; Jiang, X.D.; Xia, F. Guangdong’s Total Economic Output Ranks First in China for 30 Consecutive Years (In Chinese). 2019. Available online: http://news.china.com/domesticgd/10000159/20190128/35101735_all.html (accessed on 15 August 2020).
  56. Redo, D.J.; Aide, T.M.; Clark, M.L.; Andrade-Núñez, M.J. Impacts of internal and external policies on land change in Uruguay, 2001–2009. Environ. Conserv. 2012, 39, 122–131. [Google Scholar] [CrossRef]
  57. Ye, Y.Q.; Zhang, J.E.; Bryan, B.A.; Gao, L.; Qin, Z.; Chen, L.L.; Yang, J.Y. Impacts of rapid urbanization on ecosystem services along urban-rural gradients: A case study of the Guangzhou-Foshan Metropolitan Area, South China. Écoscience 2018, 25, 235–247. [Google Scholar] [CrossRef]
  58. Xie, G.D.; Lu, C.X.; Leng, Y.F.; Zheng, D.; Li, S.C. Ecological assets valuation of the Tibetan Plateau. J. Nat. Resour. 2003, 18, 189–196. (In Chinese) [Google Scholar]
  59. Gao, X.; Shen, J.Q.; He, W.J.; Sun, F.H.; Zhang, Z.F.; Zhang, X.; Zhang, C.C.; Kong, Y.; An, M.; Yuan, L.; et al. Changes in ecosystem services value and establishment of watershed ecological compensation standards. Int. J. Environ. Res. Public Health 2019, 16, 2951. [Google Scholar] [CrossRef] [PubMed] [Green Version]
  60. Gong, J.; Liu, D.Q.; Zhang, J.X.; Xie, Y.C.; Cao, E.; Li, H.Y. Tradeoffs/synergies of multiple ecosystem services based on land use simulation in a mountain-basin area, western China. Ecol. Indic. 2019, 99, 283–293. [Google Scholar] [CrossRef]
  61. Essington, T.E.; Munch, S.B. Trade-offs between supportive and provisioning ecosystem services of for age species in marine food webs. Ecol. Appl. 2014, 24, 1543–1557. [Google Scholar] [CrossRef]
  62. Arowolo, A.O.; Deng, X.; Olatunji, O.A.; Obayelu, A.E. Assessing changes in the value of ecosystem services in response to land-use/land-cover dynamics in Nigeria. Sci. Total Environ. 2018, 636, 597–609. [Google Scholar] [CrossRef] [PubMed]
  63. Shrestha, B.; Ye, Q.H.; Khadka, N. Assessment of Ecosystem Services Value Based on Land Use and Land Cover Changes in the Transboundary Karnali River Basin, Central Himalayas. Sustainability 2019, 11, 3183. [Google Scholar] [CrossRef] [Green Version]
  64. Tolessa, T.; Senbeta, F.; Kidane, M. The impact of land use/land cover change on ecosystem services in the central highlands of Ethiopia. Ecosyst. Serv. 2017, 23, 47–54. [Google Scholar] [CrossRef]
  65. United Nations. System of Environmental-Economic Accounting—Ecosystem Accounting. 2021. Available online: https://seea.un.org/introduction-to-ecosystem-accounting (accessed on 25 March 2021).
  66. Msofe, N.K.; Sheng, L.X.; Li, Z.X.; Lyimo, J. Impact of Land Use/Cover Change on Ecosystem Service Values in the Kilombero Valley Floodplain, Southeastern Tanzania. Forests 2020, 11, 109. [Google Scholar] [CrossRef] [Green Version]
  67. Li, H.J.; Li, Z.H.; Li, Z.H.; Yu, J.; Liu, B. Evaluation of ecosystem services: A case study in the middle reach of the Heihe River Basin, Northwest China. Phys. Chem. Earth 2015, 89–90, 40–45. [Google Scholar] [CrossRef]
  68. Fang, X.; Tang, G.A.; Li, B.C.; Han, R.M. Spatial and temporal variations of ecosystem service values in relation to land use pattern in the loess plateau of china at town scale. PLoS ONE 2014, 9, e110745. [Google Scholar] [CrossRef] [Green Version]
  69. Li, T.H.; Ding, Y. Spatial disparity dynamics of ecosystem service values and GDP in Shaanxi Province, China in the last 30 years. PLoS ONE 2017, 12, e0174562. [Google Scholar] [CrossRef] [Green Version]
  70. Zhang, G.S.; Zheng, D.; Xie, L.; Zhang, X.; Wu, H.J.; Li, S. Mapping changes in the value of ecosystem services in the Yangtze River Middle Reaches Megalopolis, China. Ecosys. Serv. 2021, 48, 101252. [Google Scholar] [CrossRef]
  71. Zhan, J.Y.; Chu, X.; Li, Z.H.; Jia, S.Q.; Wang, G.F. Incorporating ecosystem services into agricultural management based on land use/cover change in Northeastern China. Technol. Forecast. Soc. Chang. 2019, 144, 401–411. [Google Scholar] [CrossRef]
  72. Ferrier, S.; Ninan, K.N.; Leadley, P.; Alkemade, R.; Acosta, L.A.; Akcakaya, H.; Brotons, R.L.; Cheung, W.W.L.; Christensen, V.; Harhash, K.A.; et al. IPBES: The Methodological Assessment Report on Scenarios and Models of Biodiversity and Ecosystem Services; Secretariat of the Intergovernmental Science-Policy Platform on Biodiversity and Ecosystem Services: Bonn, Germany, 2016; Available online: http://zenodo.org/record/3235429 (accessed on 3 February 2021).
  73. Bagstad, K.J.; Semmens, D.J.; Winthrop, R. Comparing approaches to spatially explicit ecosystem service modeling: A case study from the San Pedro River, Arizona. Ecosyst. Serv. 2013, 5, 40–50. [Google Scholar] [CrossRef]
  74. Villa, F.; Bagstad, K.J.; Voigt, B.; Johnson, G.W.; Portela, R.; Honz′ak, M.; Batker, D. A methodology for adaptable and robust ecosystem services assessment. PLoS ONE 2014, 9, e91001. [Google Scholar] [CrossRef]
  75. Jackson, B.; Pagella, T.; Sinclair, F.; Orellana, B.; Henshaw, A.; Reynolds, B.; McIntyre, N.; Wheater, H.; Eycott, A. Polyscape: A GIS mapping framework providing efficient and spatially explicit landscape-scale valuation of multiple ecosystem services. Landsc. Urban Plan. 2013, 112, 74–88. [Google Scholar] [CrossRef]
  76. Sharp, R.; Douglass, J.; Wolny, S.; Arkema, K.; Bernhardt, J.; Bierbower, W.; Chaumont, N.; Denu, D.; Fisher, D.; Glowinski, K.; et al. InVEST 3.8.7 User’s Guide. 2020. Available online: http://releases.naturalcapitalproject.org/invest?userguide/latest/index.html (accessed on 15 February 2021).
  77. Hu, H.T.; Fu, B.J.; Lü, Y.H.; Zheng, Z.M. SAORES: A spatially explicit assessment and optimization tool for regional ecosystem services. Landsc. Ecol. 2015, 30, 547–560. [Google Scholar] [CrossRef] [Green Version]
  78. Dang, A.N.; Jackson, B.M.; Benavidez, R.; Tomscha, A.S. Review of ecosystem service assessments: Pathways for policy integration in Southeast Asia. Ecosys. Serv. 2021, 49, 101266. [Google Scholar] [CrossRef]
  79. Cao, S.J.; Li, C.; Cao, S.H. Change in ecosystem service value arising from land consolidation planning in Anhui province. Asian Agric. Res. 2013, 5, 13–16. [Google Scholar]
  80. Li, F.; Zhang, S.W.; Yang, J.C.; Chang, L.P.; Yang, H.J.; Bu, K. Effects of land use change on ecosystem services value in West Jilin since the reform and opening of China. Ecosyst. Serv. 2018, 31, 12–20. [Google Scholar]
  81. Fu, B.J.; Su, C.H.; Wei, Y.P.; Willett, I.R.; Lu, Y.H.; Liu, G.H. Double counting in ecosystem services valuation: Causes and countermeasures. Ecol. Res. 2011, 26, 1–14. [Google Scholar] [CrossRef]
  82. Koch, E.W.; Barbier, E.B.; Silliman, B.R.; Reed, D.J.; Perillo, G.M.E.; Hacker, S.D.; Granek, E.F.; Primavera, J.H.; Muthiga, N.; Polasky, S.; et al. Non-linearity in ecosystem services: Temporal and spatial variability in coastal protection. Front. Ecol. Environ. 2009, 7, 29–37. [Google Scholar] [CrossRef]
  83. Mamat, A.; Halik, Ü.; Rouzi, A. Variations of ecosystem service value in response to land-use change in the Kashgar Region, Northwest China. Sustainability 2018, 10, 200. [Google Scholar] [CrossRef] [Green Version]
  84. Jing, Y.X. China to Improve National Territory Spatial Planning System: Official. 2019. Available online: http://www.ecns.cn/news/society/2019-05-28/detail-ifziqifn8554562.shtml (accessed on 15 October 2020).
  85. Zheng, X.H.; Lin, X.H.; Shen, J. The National Territory Spatial Planning System Based on “Three in One”: A Case Study on Nanjing’s Spatial Planning from Zoning to Managing. Urban. Rural Plann. 2019, 3, 17–24. (In Chinese) [Google Scholar]
  86. Schaefer, M.; Goldman, E.; Bartuska, A.M.; Sutton-Grier, A.; Lubchenco, J. Nature as capital: Advancing and incorporating ecosystem services in United States federal policies and programs. Proc. Natl. Acad. Sci. USA 2015, 112, 7383–7389. [Google Scholar] [CrossRef] [Green Version]
  87. Liu, Y.L. Launching of China’s first gross ecosystem product (GEP) assessment project. For. Hum. 2013, 3, 7. (In Chinese) [Google Scholar]
  88. Zhang, D.C. The First Ecosystem Service Assessment Platform in China was Launched in Shenzhen City. 2020. Available online: http://static.nfapp.southcn.com/content/202008/08/c3872737.html?group_id=1 (accessed on 20 December 2020). (In Chinese).
Figure 1. Location of Guangdong province, China. (a) Map of China (source: www.travelchinaguide.com (accessed on 20 June 2020)); (b) Four regions of 21 prefecture-level cities of Guangdong province.
Land 10 00426 g001
Figure 2. Spatial distribution of land-use in Guangdong province from 1990 to 2018.
Land 10 00426 g002
Figure 3. Maps of the total ecosystem service value in Guangdong province from 1990 to 2018.
Land 10 00426 g003
Figure 4. Value of individual ecosystem services of Guangdong province from 1990 to 2018.
Land 10 00426 g004
Figure 5. Relationship between total ecosystem service value and Built-Up Area, Cropland, Water Body, and Forestland in the four regions in Guangdong province from 1990 to 2018.
Land 10 00426 g005
Table 1. Definition of land-use types.
TypesDefinition
CroplandMainly rice paddies as well as dry land and irrigated crops including vegetables, soybean, sugarcane, peanuts, cassavas, and melon-fruits
ForestlandEvergreen broad-leaf forest including land under natural reserve and forest park protection, forest along roads and railways
Water BodyRivers, streams, lakes, reservoirs, and fish ponds culturing fish, shrimps, prawns, crabs, and shell-fish
GrasslandNatural grass land and constructed grass land and meadow
Built-Up AreaLand used for industrial, commercial, residential, and transportation purposes
Unused LandLands unused or difficult to use, mainly include the intertidal zone between flood and the normal water level of rivers and lakes
Table 2. Locally adapted value coefficients of ecosystem services per unit area for Guangdong.
Ecosystem Service TypeCroplandForestlandWater BodyGrasslandUnused LandBuilt-Up Area
Food production1.400.330.530.430.020.01
Raw material0.553.020.350.360.040
Gas regulation1.014.380.511.50.06−2.42
Climate regulation1.364.132.061.560.130
Water supply1.084.1518.771.520.07−7.51
Waste treatment1.951.7514.851.320.26−2.46
Soil formation and retention2.064.080.412.240.170.02
Biodiversity protection1.434.583.431.870.40.34
Recreation and culture0.242.114.440.870.240.01
Table 3. Locally adapted per-unit ecosystem service value for Guangdong in 2018 US$ ha−1.
Ecosystem Service TypeCroplandForestlandWater BodyGrasslandUnused LandBuilt-Up Area
Food production428.72101.06162.30131.686.123.06
Raw material168.43924.81107.18110.2412.250.00
Gas regulation309.291341.29156.18459.3518.37−741.08
Climate regulation416.481264.73630.83477.7239.810.00
Water supply330.731270.865747.94465.4721.44−2299.79
Waste treatment597.15535.904547.52404.2279.62−753.33
Soil formation and retention630.831249.42125.55685.9552.066.12
Biodiversity protection437.911402.531050.37572.65122.49104.19
Recreation and culture73.50646.151359.66266.4273.503.06
Total3393.038736.7413887.533573.70425.66−3677.82
Table 4. Proportion of land-use types in Guangdong province from 1990 to 2018 (unit:%).
YearCroplandForestlandWater BodyGrasslandUnused LandBuilt-Up AreaTotal
199026.5560.764.284.520.093.81100
200025.5060.744.614.400.094.66100
201024.2160.694.374.170.076.48100
201823.8960.154.194.340.077.37100
Table 5. Area of land-use types in the four regions of Guangdong province from 1990 to 2018 (unit: 104 ha2).
Year CroplandForestlandWater BodyGrasslandUnused LandBuilt-Up AreaTotal
1990Pearl River Delta158.71303.2141.0211.180.2429.59543.95
2000143.97300.3946.2810.660.2342.41
2010126.36295.1340.599.60.1172.16
2018124.02291.4437.7310.950.0879.74
1990Eastern Region51.6164.758.8517.790.3910.27153.66
200051.3764.799.0317.570.3910.5
201049.765.7710.116.710.3810.99
201849.1165.0510.0816.750.3712.29
1990Western Region122.03154.612.97.680.9217.42315.54
2000118.44156.8713.386.760.9619.13
2010116.82158.5814.226.580.7718.59
2018115.92157.4914.116.740.7120.58
1990Northern Mountainous Region140.99560.5113.4943.890.0210.55769.45
2000140.82560.6513.5643.420.0210.98
2010138.66561.6613.0441.530.0214.54
2018136.78558.2213.1142.910.0118.43
Table 6. Land-use transitions in the four regions of Guangdong from 1990 to 2018 (km2).
1990–2000
RegionsC→FC→WC→BF→CF→GF→BG→FG→BW→CW→B
ER0.018.312.74.00.05.010.46.61.01.0
WR207.328.5147.120.623.717.8104.20.01.04.8
NR3.212.917.55.98.03.028.62.86.30.0
PR37.9725.6845.344.88.5300.422.435.6107.4130.1
Total248.4785.31022.675.340.2326.2165.645115.7135.9
2000–2010
RegionsC→FC→WC→BF→GF→WF→BW→CW→BU→FU→W
ER3.119.3138.20.01.313.40.03.9006.8
WR105.116.345.53.18.223.80.02.118.89.1
NR0.011.1150.22.114.8113.70.02.10.00.0
PR10.2233.41760.22.118.1565.716.1413.20.00.0
Total118.4280.12094.17.342.4716.616.1421.318.815.9
2010–2018
RegionsC→WC→BF→CF→GF→WF→BG→FG→BW→GW→B
ER3.129.92.229.80.027.917.014.00.04.3
WR1.058.43.021.90.044.71.02.03.111.9
NR1.0125.125.4199.71.0129.2120.726.90.04.0
PR3.2250.44.9142.84.1158.924.911.54.198.9
Total8.3463.835.5394.25.1360.7163.654.47.2119.1
Note: ER—the Eastern Region; WR—the Western Region; NR—the Northern Mountainous Region; PR—the Pearl River Delta; C—Cropland; F—Forestland; W—Water Body; G—Grassland; B—Built-Up Area; and U—Unused Land.
Table 7. Total ecosystem service value in Guangdong province from 1990 to 2018 (US$ million).
CroplandForestlandWater BodyGrasslandUnused LandBuilt-Up AreaTotal
ES valueProportion(%)ES valueProportion(%)ES valueProportion(%)ES valueProportion(%)ES valueProportion(%)ES valueProportion(%)
199016,060.613.2094,625.277.7710,590.08.702878.22.376.70.01−2494.7−2.05121,666.0
200015,424.812.7394,592.778.0511,422.99.412800.12.316.80.01−3056.5−2.52121,190.8
201014,642.312.3794,523.679.8310,824.69.142659.42.255.50.01−4248.3−3.59118,407.1
201814,448.712.4193,674.980.4610,364.18.902763.92.375.00.01−4833.4−4.15116,423.2
Publisher’s Note: MDPI stays neutral with regard to jurisdictional claims in published maps and institutional affiliations.

