Article

A High–Resolution Accumulation Record of Arsenic and Mercury after the First Industrial Revolution from a Peatland in Zoige, Qinghai–Tibet Plateau

1
CAS Key Laboratory of Mountain Ecological Restoration and Bioresource Utilization & Ecological Restoration Biodiversity Conservation Key Laboratory of Sichuan Province, Chengdu Institute of Biology, Chinese Academy of Sciences, Chengdu 610041, China
2
Zoige Peatland and Global Change Research Station, Chinese Academy of Sciences, Hongyuan 624400, China
3
University of Chinese Academy of Sciences, Beijing 100049, China
4
CAS Center for Excellence in Tibetan Plateau Earth Sciences, Chinese Academy of Sciences, Beijing 100101, China
*
Author to whom correspondence should be addressed.
Both authors equally contribute to this work.
Land 2021, 10(11), 1241; https://doi.org/10.3390/land10111241
Submission received: 27 September 2021 / Revised: 10 November 2021 / Accepted: 11 November 2021 / Published: 12 November 2021

Abstract

:
The impacts of human activities on Zoige peatlands are poorly documented. We determined the concentrations and accumulation rates of As and Hg in a 210Pb-dated peat profile collected from this area and analyzed the correlations between accumulation rates of both As and Hg and other physicochemical properties. To reconstruct recent conditions of As and Hg, we analyzed peat sediments of Re’er Dam peatland in Zoige using 210Pb and 137Cs dating technologies. The concentrations of total As (86.38 to 174.21 μg kg−1) and Hg (7.30 to 32.13 μg kg−1) in the peat profile clearly increased after the first industrial revolution. From AD 1824 to AD 2010, the average accumulation rates were 129.77 μg m−2 yr−1 for As and 18.24 μg m−2 yr−1 for Hg. Based on our results, anthropogenic emissions significantly affected the atmospheric fluxes of As and Hg throughout the past 200 years, and As was also likely to be affected by other factors than atmospheric deposition, which needs further identification by future studies. The historical variations in As and Hg concentrations in Re’er Dam peatland in Zoige mirror the industrial development of China.

1. Introduction

Arsenic (As) and mercury (Hg) are two widely occurring contaminants with high toxicity, persistence, and mobility [1,2]. Natural sources of As and Hg include black shales, young sediments with low flushing rates, gold mineralization, mantle degassing, and geothermal processes [3,4,5], whereas anthropogenic sources include mining, coal burning, animal husbandry, pesticides, arsenic-containing waste, and mercury-containing waste [6,7,8].
Several pathways can lead to As and Hg accumulation in soil, such as local waste disposal from domestic and industrial activities, plant uptake, long-range transport of Hg via atmospheric circulation, and deposition by precipitation and/or aerosols, some of which are affected by human activities [9,10,11,12]. Previous studies have shown that peat is a good medium to absorb and complex Hg, mainly in organic matter-rich, anoxic, and acidic environments [13,14]. This makes peatlands excellent archives for studies on the atmospheric deposition of environmental pollutants [15,16,17,18,19]. Studies have further highlighted the post-depositional mobility and diagenetic alteration of As and Hg [1,6,20,21].
The 210Pb and 137Cs dating methods can provide high-resolution chronologies for over a century of sediment formation [22], facilitating the evaluation of recent deposition fluxes of atmospheric As and Hg in peat profiles. Using this method, investigations of the deposition history of As and Hg in peatlands have been widely used in the past few decades [21,23,24,25,26]. However, these studies mainly focused on European peatlands, whereas little information is available about the atmospheric As or Hg fluxes of peatlands in China [27,28]. Zoige peatlands, located on the north-eastern margin of the Qinghai–Tibet Plateau, are some of the largest peat distribution areas in China; however, the biogeochemical processes are still unclear. Despite enhanced human activities in this area since the early 1960s, the environmental impacts of these activities are poorly documented. By establishing an accurate chronology for a peat profile, in this study, we estimated high-resolution atmospheric As and Hg deposition records since the first industrial revolution and analyzed the anthropogenic contributions to peat sediments. We also investigated the relationships between the physicochemical properties of peat and the deposition of As and Hg.

2. Materials and Methods

2.1. Study Site

The Zoige Plateau, located in the north-western part of Sichuan Province, China, covers an area of 20,000 km2 (100°26′–103°15′ E, 31°55′–34°39′ N, Figure 1). Geographically, it is a subsidence area formed via the intensive Quaternary uplift on the north-eastern Qinghai–Tibet Plateau (Figure 1a), surrounded by alpine mountains [29], at an elevation from 3000 to 4000 m above sea level (MASL). The White River and the Black River, two tributaries of the upper Yellow River, flow across this area. The climate is characterized as a sub-humid temperate continental monsoon climate with long and cold winters. Mean annual precipitation is between 650 and 760 mm, concentrated from June to September. Mean annual temperature is −0.7–1.1 °C, with the lowest monthly mean temperature (−10.7 °C) in January and the highest (10.9 °C) in July. The growing season lasts for 150 days (daily mean temperature ≥5 °C). The distinctive climatic conditions on the Zoige Plateau impede the decomposition of plant residues, thus accelerating the formation and accumulation of peat [30]. Peatlands on the Zoige Plateau (which are typical alpine peatlands) cover an area of 4605 km2, making them some of the largest alpine peatlands in the world [31,32]. Peat sedimentation started in the late Pleistocene for an average thickness of 1.39 m and a maximum of up to 10 m [33,34].
Our sampling site (Figure 1b) was located in the Re’er Dam peatland (445 km2), the only lacustrine plain peatland on the Zoige Plateau, with an average thickness of peat layer of 1.50 m [31]. Vegetation coverage is approximately 95%; the dominant species are Carex muliensis Hand.-Mazz., Kobresia tibetica S. R. Zhang, Polygonum amphibium (L.) S. F. Gray, Potentilla anserine L., Elymus nutans Griseb., and Poa annua L. This area exhibits a large number of fossil river courses with poor drainage due to the uplift of the Qinghai-Tibet Plateau, which provides an adequate condition for peatland development. In addition, precipitation and aboveground water are the main water sources, whereas chemical sources are mainly rainfall due to element deficiency condition [31,35].

2.2. Sample Collection and Preparation

Using a stainless-steel knife sampler, we dug a peat hole (about 50 × 50 × 50 cm3) in August 2014 at 33°55′ 08″N, 102°52′08″E, 3434 MASL. The profile contained continuous deposition layers of peat and large amounts of undecomposed plant residues. Based on the color and grain parameters, the peat profile consisted of three sections: grassroot layer (upper 4 cm): 80% of plant tissues with intensive roots, humus layer (4–14 cm): dark brown loam with many roots, and peat layer (14–50 cm depth): dark brown to black clay with few roots.
Peat samples were collected by sectioning the profile into 1-cm intervals, using a stainless–steel band in situ. The obtained slices were packed into polyethylene plastic zip–lock bags, brought to the laboratory, and stored frozen at −80 °C. Before analyzing, part of the peat sample was air-dried at room temperature, and large roots were removed manually. Samples were sieved through a 0.150-mm mesh and homogenized. Every 1-cm slice was both used for peat dating and soil property analysis.

2.3. Physical and Chemical Analyses

The pH was measured using an acidity meter (Sartorius PB–10, Göttingen, Germany) with a water to soil ratio of 4:1 (M/V). Mass water content (WAT, %) and dry bulk density (DBD, g cm−3) were determined through weighing a volumetric subsample of each fresh slice before and after drying at 105 °C overnight. The WAT was calculated from the mass difference, and DBD was obtained from the stable weight and the known volume [36]. Total carbon content (TC), total organic carbon content (TOC), and total nitrogen content (TN) were determined using the Elementar Vario MICRO cube elemental analyzer, and the C/N ratio was calculated as the ratio of TC to TN. The TC, TOC, and TN measurements were calibrated by periodic analysis of a certified brown soil reference material [GBW07401 (GSS–1), Institute of Geophysical and Geochemical Exploration, Langfang, China], with an error <1%. Peat samples were digested in NaOH (8%), and subsequently, the degree of peat humification (HUM) was measured by UV–absorbance values of the alkaline extraction liquid with a spectrophotometer detector (UV–2500, Shimadzu Corporation, Japan) at wavelengths of 540 and 400 nm [37].

2.4. Total As and Hg Analysis

For the digestion of total Hg and As, we adopted the method described in Bao [38]. First, 500 mg of the sample was placed into a 50-mL conical flask, and a small amount of water (2–3 mL) was added to generate a slurry. Subsequently, 10 mL of double-diluted aqua regia (mixed solution of 38.1% GR HCl and 65% GR HNO3, 3:1) was added, and the flask was covered with a short-handled filter cup and heated in a boiling water bath for 2 h to digest the organic matter. During this period, the flask was shaken 2–3 times to ensure complete reaction. Finally, the solution was transferred into a 25–mL volumetric flask after cooling, diluted with deionized water to the 25-mL mark, and kept overnight until analysis. We used an AFS–8230 dual-channel atomic fluorescence spectrophotometer (Beijing Jitian Instrument Co., Ltd., Beijing, China) to determine the concentrations of As and Hg in the solution; accuracy (>90%) was checked with duplicate testing, and the recoveries for standard materials were satisfactory with this protocol, within 90–110%.

2.5. Age Dating Using 210Pb and 137Cs

Samples (5 g) for total 210Pb and 137Cs activity determination were dried at 105 °C for 12 h and analyzed at the State Key Laboratory of Lake Science and Environment, Nanjing Institute of Geography and Limnology, Chinese Academy of Sciences, using a low–background γ–ray spectrometer with a high–purity Ge gamma spectrometry system (EG&G ORTEC, HPGe GWL–120–15). Radioactivity levels of 210Pb (half–life of 22.3 years) were determined via gamma emission at 46.5 keV, whereas those of 137Cs (half–life of 30.2 years) were measured with the 662-keV photo peak. Standard sources and sediment samples of known activity were provided by the China Institute of Atomic Energy and used to calibrate the absolute efficiencies of the detectors. Counting times of 137Cs and 210Pb were typically in the range of 50,000–86,000 s, with a measurement error between ±5 and ±10% at a 95% confidence level. Unsupported 210Pb arising from atmospheric fallout was determined from the difference between total 210Pb and supported 210Pb activity, which was used to calculate the chronology [39].

2.6. Calculations of As and Hg Chronology and Accumulation Rates

The 210Pb–chronology of the peat profile was determined according to Equation (1) with the application of the constant rate of the supply model (CRS) [22], assuming that the supply of 210Pb to the peatland is dominated by atmospheric fallout:
T = λ 1   ln   A ( 0 ) A ( h )
where T is the age of each 1-cm peat layer (yr), A(0) represents the total unsupported 210Pb activities (210Pbex, Bq cm−2), A(h) represents the unsupported 210Pb activities under the depth of h cm (210Pbex, Bq cm−2), and λ is the radioactive decay constant of 210Pb (λ = 0.031 yr−1).
The peat sedimentation rate (PSR, cm yr−1) was calculated based on depth δ (cm), and peat age was inferred by 210Pb (Equation (2)) [22,39]. The validity of peat dating was checked against the 137Cs activity profile as an independent time stratigraphic, using the following equation:
PSR = δ/T
The accumulation rates of As (RAAs) and Hg (RAHg) (g m−2 yr−1) were calculated for each piece (1 cm apart) by PSR (cm yr−1), DBD (g m−3), and the concentrations of As and Hg (μg kg−1 dry weight soil), respectively, using the equations below; 105 is a unit conversion constant:
RAAs = PSR× DBD × As × 105
RAHg = PSR × DBD × Hg × 105
The correlations between the accumulation rates of both As and Hg and the basic physicochemical properties, as well as the humification degree, were also analyzed.

3. Results

3.1. Physicochemical Properties

We measured high levels of mass water (112.17% on average) and total organic carbon (83.09 mg g−1) in this peat profile (Table 1 and Table S4). The pH value (6.58 on average) indicated weak acidic conditions. Both DBD (0.28 g cm−3 on average) and C/N (14.64 on average) increased slightly with depth. The UV-absorption showed an average humification degree of 33.71% (400 nm) or 24.06% (540 nm).

3.2. Peat Chronology

Unsupported 210Pb activities showed an exponential decay trend with soil depth, reaching negligible concentrations at 30 cm (Figure 2). For this reason, the results for the 30–50-cm peat section are not discussed. Continuous chronologies from AD 1824 to AD 2011 were reconstructed through the CRS model (Table S5). Based on the chronologies, the calculated average rate of peat growth was 0.16 cm yr−1 (n = 30), and the PAR was estimated as 0.095 g cm−2 yr−1 (n = 30). The 137Cs records showed more than two distinct peaks (Figure 2). The major 137Cs peak at 8 cm was the AD 1986 marker, according to the widespread fallout of 137Cs in the Northern Hemisphere after the Chernobyl reactor accident [40]. The older peak at 13 cm was identified as a record of the global fallout maximum in AD 1963 due to atmospheric testing of nuclear weapons [41].

3.3. Concentrations of As and Hg

The concentration of As ranged between 86.38 and 174.21 μg kg−1, which is considerably higher than that of Hg (Figure 3), with obvious fluctuations; there was a remarkable peak at around AD 2000. Concentrations of other elements were shown in Figures S1 and S2.
The concentration of Hg showed a generally increasing trend from the deeper part of the profile to the surface, ranging from 6.40 to 32.13 μg kg−1. Three periods were recognized from this profile. During the first period from AD 1824 to AD 1889, the Hg concentration remained relatively stable, with an average value of 7.64 μg kg−1 (n = 3). In the second period, during AD 1889 to AD 1970, the Hg concentration increased first and then decreased, with an average value of 11.91 μg kg−1 (n = 11). In the final period, starting in AD 1970, the Hg level strongly increased, reaching an average value of 25.09 μg kg−1 (n = 16). Similar to As, the greatest Hg concentration was also found at around AD 2000.

3.4. Accumulation Rates of As and Hg

From AD 1824 to AD 2010, the average accumulation rate was 129.77 μg m−2 yr−1 for As and 18.24 μg m−2 yr−1 for Hg (Figure 4). In general, the accumulation rate of As was considerably higher than that of Hg, similar to the concentration. Notable increases were found in the accumulation rates of both As and Hg in the peat profile after the first industrial revolution. Before AD 1900, the As and Hg accumulation rates were relatively steady with average fluxes of 58.18 and 4.01 μg m−2 yr−1, respectively (n = 3). In the following few decades, both accumulation rates increased continuously.
The largest increases of the accumulation rates of both As and Hg occurred during AD 1980–1990, leading to a maximum in AD 1990 of 146.97 and 22.30 μg m−2 yr−1, respectively (n = 5), almost twice to fivefold higher than those before AD 1900.

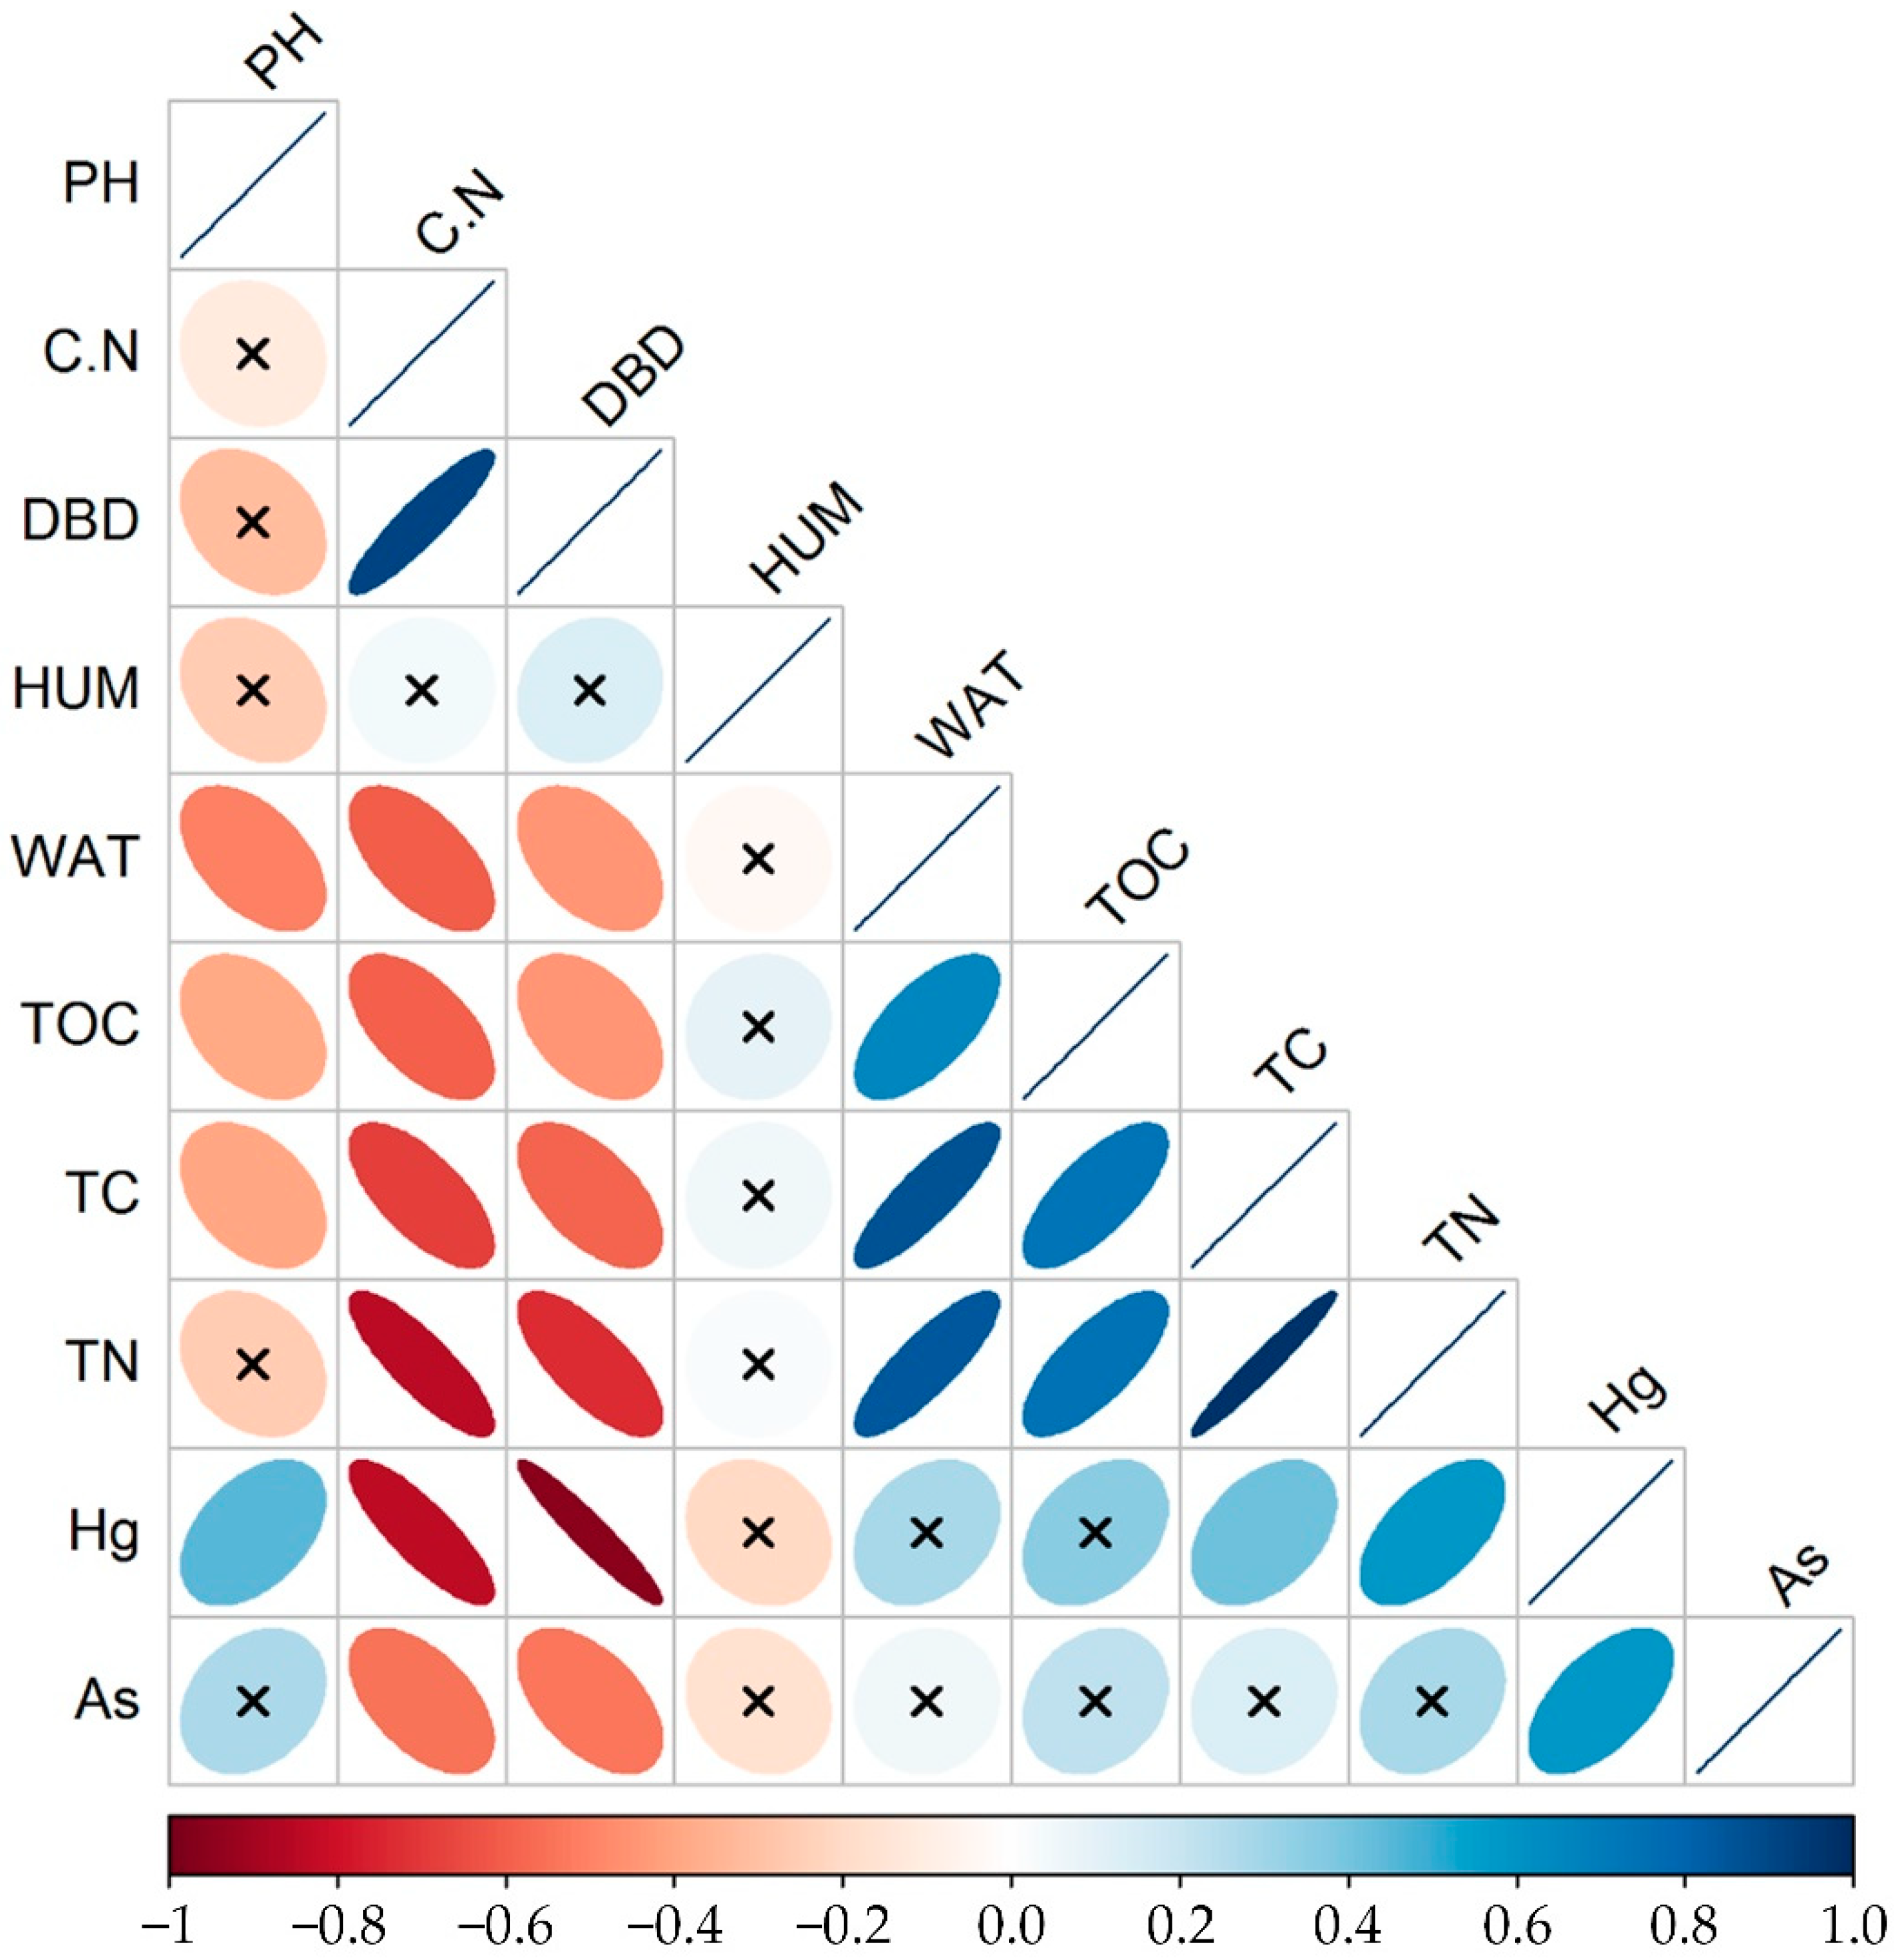
3.5. Accumulation Rates of As and Hg in Relation to Peat Physicochemical Properties

The relationships among As, Hg, and soil physicochemical properties were examined using correlation analysis (Figure 5). Based on the results, there was a positive relationship between the accumulation rates of As and Hg, whereas negative relationships were found between Hg and C/N and between Hg and DBD. However, pH, TC, and TN were positively correlated with Hg. No significant correlations were found between the accumulation rates of As and other physicochemical properties, except for negative relationships between As and C/N and between As and DBD.

4. Discussion

4.1. Peat Chronology

We found a significant discrepancy between peat chronostratigraphic dates determined by the 210Pb dating CRS model and the 137Cs time marker, with the result of the latter decades (ca. 30 years in our study) earlier than that of the former [42]. Based on previous studies, 137Cs is a typical anthropogenic radionuclide that has been released into the atmosphere since nuclear weapon invention and testing. Figure 2 shows three significant time points for 137Cs release (1952 yr—20 cm, beginning of extensive nuclear testing; 1963 yr—13 cm, peak of nuclear testing; 1986 yr—8 cm, Chernobyl incident) [43,44]. Although 137Cs showed significant trends reflecting radioactivity incidences worldwide, previous studies indicate significant challenges when reconstructing the recent chronology by this method, probably due to the mobility and diffusion of 137Cs, which is especially the case in minerotrophic peatland [42,43,45,46]. Besides, the calculated peat accumulation rate here was less than 1 cm yr−1, which is unsuitable for dating by 137Cs in such peatlands [47]. In contrast, the 210Pb dating technology is generally considered to be more stable and precise in terms of reconstructing the peat chronology for the past 150 years [43,48]. Here, we accepted the assumptions that constant precipitation from the atmosphere is the main source of 210Pb in peat sedimentation, that the post-depositional mobility of 210Pb is limited since precipitation is the main water source in this peatland, and that the water flow below the surface can be considerably limited in this area. Besides, this region is sparsely populated, with insignificant disturbance [49]. Therefore, the CRS model was chosen to reconstruct the peat chronology [44,49,50]. The peat sedimentation rate (mean = 0.16 cm yr−1) derived from 210Pb dating for this peat profile over the past 200 years was in accordance with the peat sedimentation rate since AD 1963, reported for the same peatland area using 137Cs dating [51]. The average peat sedimentation rate of a peat profile in Ruoergai County was 0.15 cm yr−1 in the past 72 years, determined by the 210Pb CRS model [48]. For peat cores obtained from Hongyuan County, the value was 0.16 cm yr−1 between AD 1851 and AD 2006, estimated by the 210Pb CIC model [52]. These results were in good agreement with our findings, providing further evidence that the chronology established from 210Pb dating is consistent and reliable [53].

4.2. As and Hg Accumulation Rates in Relation to Peat Physicochemical Properties

According to the results of the correlation analysis (Figure 5), the overall impacts caused by these proxies are highly limited, especially for As. Humification had no significant influence on the accumulation rates of both As and Hg. Bao et al. [28] and Biester et al. [54] found similar relationships in ombrotrophic peatlands, suggesting that the processes included in humification had little effects on As and Hg accumulation rates in such ecosystems. However, the potential impacts caused by humification cannot be completely excluded as the values were not corrected for mineral contents [55]. No correlation was found between As accumulation rate and TOC, which is in agreement with previous studies [56,57,58]. It was clear that C/N largely affected the As and Hg accumulation rates in this site (Figure 5). The C/N reflects peat decomposition with carbon mineralization intensity compared to nitrogen [54], and it can be inferred that the accumulation rates of As and Hg were significantly influenced by peat decomposition, indicating that diagenetic processes are also important factors controlling As and Hg accumulation, whereas local anthropogenic emissions of these two trace metals had limited impacts compared to peat decomposition [54]. Furthermore, the correlation between As and Hg accumulation rates provides indirect evidence that they are absorbed with similar mineral particles [54,59]. However, it cannot be completely excluded that As and Hg also bonded with organic matter due to the richness of organic substrates in peatlands. Further studies should be carried out to determine the dominant forms of As and Hg in such peatlands.

4.3. Concentrations of As and Hg

Similar previous studies have demonstrated that atmospheric deposition is the main source of trace metal accumulation in soils, and human activities largely impact this process [60,61]. The As concentrations showed a wide range, with considerable fluctuation (Figure 3) in the study area in the past 200 years, indicating that the associated biogeochemical processes were active and sensitive to climatic changes throughout history [54]. Although we observed limited influences of soil properties on As concentration, previous studies have identified multiple factors that can easily affect the As concentration in a soil profile, such as mineral matter, organic sulfur, and metal-reducing bacteria [26,56,62,63]. Besides, freeze–thaw cycles also play an important role in controlling the form and concentration of As by altering soil characteristics [64]. This leads us to infer that As sedimentation in this area is possibly controlled by various biogeochemical processes, but the predominant mediation factor remains unknown. The time intervals between each adjacent 1-cm peat fraction in the deep layer were considerably larger than those in the shallow layer, most likely because of the compression effect. Thus, the fluctuation of the As concentration appeared to be much more obvious and intensive in more recent ages, partly reflecting the disturbance from more severe human activities at local and regional levels. Although it has recently been proposed that As mobility can be mostly constrained in organic-matter-rich and anaerobic environments where sulfur plays a key role [62,63], our results indicate a relatively strong mobility of As, possibly induced by climate and/or geochemistry. For example, the period of freeze-thaw affects the release and sedimentation of As [64], and other mineral elements and organic compounds contribute to the binding and desorption of As [63,65,66]. Further studies identifying the processes associated with either mobility or immobility of As are therefore urgently needed.
The concentration of Hg was relatively low and stable in the study area before AD 1900, which is consistent with the findings of a previous study [23], showing a clear increase in recent years. Unlike As, Hg is much more sensitive to global anthropogenic sources due to complete cycling with various processes, containing emission to and deposition from the atmosphere [67,68,69]. According to a previous study, anthropogenic sources can be identical to natural sources of Hg in the atmosphere [23]. The sharp increase since around 1960 is probably related to anthropogenic emissions of Hg. During early industrialization in Europe and North America, the effects were only small, and Hg in peat mainly originated from natural sources. With the acceleration of industrialization in Europe and North America since AD 1900, the influence of the Western Industrial Revolution gradually became more profound, leading to significant increases in Hg concentrations in peat. The emission of Hg in Europe and North America probably improved the Hg concentration in ambient air in the study area through long-range transportation in the atmosphere [23]. In our study, the Hg concentrations in the shallower peat layers showed a significant increase at around AD 2000 (Figure 3) compared to those in the deeper peat layers. So far, no natural geochemical process has been described to explain this phenomenon. Therefore, we conclude that it reflects the increasing rate of atmospheric Hg deposition caused by human activities directly and/or indirectly.

4.4. Accumulation Rates of As and Hg

The atmospheric Hg accumulation rate in AD 1824 (4.1 μg m−2 yr−1) was comparable to the assumed pre-industrial Hg values obtained from the peatlands in the Greater Khingan Mountains (7.2 ± 0.9 μg m−2 yr−1), the Lesser Khingan Mountains (5.7 μg m−2 yr−1), and the Belgian Hautes Fagnes Plateau (1.8 ± 1 μg m−2 yr−1) [19,28,70]. The Hg accumulation rate was relatively constant before AD 1950 but significantly increased between AD 1970 and 1990, which is comparable to that of some lake sediments on the Qinghai–Tibet Plateau [71].
The major peak of As and Hg accumulation rates near surface layers of Re’er Dam peatland (around 2000) occurred 20 years later than those in north-eastern China [28,70] and 40 years later than those in Europe and North America [72], suggesting that regional industrial development has a huge impact on As and Hg accumulation. We also observed that industrial development had a hysteretic effect on As and Hg accumulation, which may be explained by the development sequence. Early developed regions, such as the west and north-eastern China, discharged massive amounts of pollutants that carried As and Hg into the atmosphere, distributing them globally via long-distance transport, and then slowly deposited to the environment in the area such as Zoige Plateau [69,73]. Furthermore, this is an expansion process for these contaminants from industrialized areas to undisturbed regions (such as Re’er Dam peatland) over time via atmospheric circulation, deposition, and re-emission processes [69]. Therefore, together with relatively late industrial development, the peak of accumulation rates of As and Hg in peatlands on Zoige Plateau can be decades later than that in early-developed regions.
In contrast to the 210Pb and 137Cs activities in peatlands, As and Hg accumulation rates can reflect the industrial development at local or regional scales, and peak delays can be attributed to delays in industrial development and/or long-range transport combined with atmosphere deposition of Hg from other areas of China (such as north-eastern China and Chongqing, with early industrial development) [23,74]. The 210Pb and 137Cs activities mirror the atmospheric deposition of radioactive elements and human activities at a global level, with comparatively constant and rapid responses [43,44]. Using a combination of these elements, together with dating information, enabled us to reconstruct the different kinds of effects and corresponding ages of peat on local, region, and global scales.
Elevated As and Hg concentrations and increased accumulation rates occurred as results of the extensive drainage across Zoige peatlands in the 1970s [75]. Coincidentally, an increased sedimentation of Hg in two forest lakes in Finland has also been reported, most likely due to drainage manipulation [14]. Artificial drainage on the Zoige Plateau in the 1970s doubled the area for cultivation, resulting in a rapid expansion of the livestock number [76]. From AD 1964 to 1990, the population of Hongyuan County and Ruoergai County also increased by 36,640 (73.62%), with intensified human disturbance to the regional environment. The rapid socio-economic development of the Zoige Plateau was another possible reason for the rapid accumulation of Hg and As, since the middle of the last century, with negative impacts of road construction, vehicular traffic, tourism, fuel combustion, and an increased frequency of forest fires [60]. Besides, alpine regions, such as our research area, are also considered to be the main sinks of pollutants, amplifying the effects on the accumulation rates of both As and Hg [60,61,77,78]. At a national scale, the As accumulation rate peaked around the Chinese steelmaking movement in the late 1950s. Several other peaks appeared after 1978, the year of the reform and opening-up in China. In addition, the air pollution caused by coal combustion has been a common problem since the economic reforms in the 1980s [79]. Based on these findings, the atmospheric deposition of Hg and As is affected by global atmospheric circulation to some extent and is susceptible to human activities. As a sink area located on the north-eastern Qinghai-Tibet Plateau, the Zoige Plateau is at a relatively low elevation and therefore more affected by the east Asian monsoon and less by the Indian monsoon and the westerlies.
In conclusion, the Hg and As accumulation rates were more sensitive to anthropogenic emissions in China. There was a decrease for As and Hg accumulation rates at the surface of the profile (0–4 cm), possibly resulting from the increasingly intense control on pollutant emissions regionally and globally [80]. Similar patterns have been observed in ombrotrophic peatlands in the Lesser Khingan Mountains [70] and the Greater Khingan Mountains [28], main mountain ranges in north-eastern China, as well as the Harz Mountains in Germany [54], indicating advances in environmental management.
Although several studies have investigated Hg deposition in peatlands in China after the 19th century (Tables S1 and S2), As deposition has been largely neglected (Table S3) [28,58,70,81,82,83]. Compared to the peatlands in north-eastern China, the As and Hg concentrations and accumulation rates in Re’er Dam peatland are relatively low. When compared with findings from other peatlands in the Northern Hemisphere, the values found in our study are still relatively low. For example, the Hg concentration of peatlands in western Ireland and Florida, USA, can reach up to hundreds μg kg−1 [84,85], whereas in a peatland in the Czech Republic, more than 1000 μg kg−1 could be measured [86]. In similar studies, the Hg accumulation rate and flux in peatlands located in Minnesota, USA, and south-central Sweden ranged from 20 to 30 μg m−2 yr−1 [87,88], whereas peatlands in central Yukon, Canada, showed significantly higher values [20].
These substantial differences among peatlands in different regions can be explained by differences in industrial development and other human activities, and further studies in this field are needed to predict the dynamics in various peatlands against the background of a changing climate.

5. Conclusions

Our results reveal that As concentrations largely fluctuate with soil depth, whereas Hg concentrations showed an increasing trend in recent years. Both As and Hg accumulation rates also showed increasing trends, indicating impacts by atmosphere deposition and human activities. The different lag times of trace metal accumulation trends for Re’er Dam peatland and other, more developed regions, suggest different historical development levels and human disturbances among regions, as well as the global influences of atmospheric circulation and deposition. As studies on heavy metal accumulation in peatlands are scarce, further experiments are needed to provide evidence on the dynamics of heavy metals and contaminants in peatlands, especially in areas vulnerable to climate change.

Supplementary Materials

The following are available online at https://www.mdpi.com/article/10.3390/land10111241/s1: Figure S1: Main trace metal elements concentrations along peat profile; Figure S2. Main trace metal elements concentrations and dry bulk density along peat profile; Table S1: Concentration of Hg in peatlands in China; Table S2: Recent accumulation rate (AR) of total Hg in peatlands in China; Table S3: Concentration of total As in peatlands in China; Table S4: TN, TC, and TOC of every 1 cm soil layer along peat profile with triplicate samples; Table S5: 210Pb radioactivity specific activity degree along depth and mass depth.

Author Contributions

Conceptualization, H.C. and D.X.; methodology, X.C. and Q.S.; software, X.C. and Q.S.; validation, X.C. and D.X.; formal analysis, X.C. and Q.S.; investigation, Q.S. and D.X.; resources, Q.S. and D.X.; data curation, H.C. and D.X.; writing—original draft preparation, X.C. and Q.S.; writing—review and editing, X.C. and D.X.; visualization, X.C. and Q.S.; supervision, H.C. and D.X.; project administration, H.C.; funding acquisition, H.C. and D.X. All authors have read and agreed to the published version of the manuscript.

Funding

This study was supported by the Second Tibetan Plateau Scientific Expedition: 2019OZKK0304; National Natural Science Foundation of China: 42001093; National Natural Science Foundation of China: 91851108; Key R&D Program of Sichuan Province: 2020YFS0024 and Chinese Academy of Sciences Light of West China Program: 2018XBZG_XBQNXZ_B_008.

Data Availability Statement

The data presented in this study are available in the article and supplementary material.

Acknowledgments

The authors give special thanks to Wan Xiong for editing and valuable comments on the manuscript.

Conflicts of Interest

The authors declare no conflict of interest.

References

  1. Shotyk, W.; Goodsite, M.E.; Roos-Barraclough, F.; Frei, R.; Heinemeier, J.; Asmund, G.; Lohse, C.; Hansen, T.S. Anthropogenic contributions to atmospheric Hg, Pb and As accumulation recorded by peat cores from southern Greenland and Denmark dated using the 14C “bomb pulse curve”. Geochim. Cosmochim. Acta 2003, 67, 3991–4011. [Google Scholar] [CrossRef]
  2. Eisler, R. Mercury Hazards to Living Organisms; CRC Press: Boca Raton, FL, USA, 2006; pp. 1–312. [Google Scholar] [CrossRef]
  3. Fendorf, S.; Michael, H.A.; van Geen, A. Spatial and Temporal Variations of Groundwater Arsenic in South and Southeast Asia. Science 2010, 328, 1123–1127. [Google Scholar] [CrossRef] [Green Version]
  4. Cai, Y. Biogeochemistry of environmentally important trace elements: Overview. In Biogeochemistry of Environmentally Important Trace Elements; ACS Symposium Series; Cai, Y., Braids, O.C., Eds.; American Chemical Society: Washington, DC, USA, 2003; Volume 835, pp. 1–10. [Google Scholar] [CrossRef] [Green Version]
  5. Nriagu, J.; Becker, C. Volcanic emissions of mercury to the atmosphere: Global and regional inventories. Sci. Total Environ. 2003, 304, 3–12. [Google Scholar] [CrossRef]
  6. Nordstrom, D.K. Public health—Worldwide occurrences of arsenic in ground water. Science 2002, 296, 2143–2145. [Google Scholar] [CrossRef] [PubMed]
  7. Polya, D.; Charlet, L. Environmental science Rising arsenic risk? Nat. Geosci. 2009, 2, 383–384. [Google Scholar] [CrossRef]
  8. Pacyna, E.G.; Pacyna, J.M.; Sundseth, K.; Munthe, J.; Kindbom, K.; Wilson, S.; Steenhuisen, F.; Maxson, P. Global emission of mercury to the atmosphere from anthropogenic sources in 2005 and projections to 2020. Atmos. Environ. 2010, 44, 2487–2499. [Google Scholar] [CrossRef]
  9. Schroeder, W.H.; Munthe, J. Atmospheric mercury—An overview. Atmos. Environ. 1998, 32, 809–822. [Google Scholar] [CrossRef]
  10. Boening, D.W. Ecological effects, transport, and fate of mercury: A general review. Chemosphere 2000, 40, 1335–1351. [Google Scholar] [CrossRef]
  11. Cheng, M.D.; Schroeder, W.H. Potential atmospheric transport pathways for mercury measured in the Canadian high arctic. J. Atmos. Chem. 2000, 35, 101–107. [Google Scholar] [CrossRef]
  12. Fitzgerald, W.F.; Engstrom, D.R.; Hammerschmidt, C.R.; Lamborg, C.H.; Balcom, P.H.; Lima-Braun, A.L.; Bothner, M.H.; Reddy, C.M. Global and Local Sources of Mercury Deposition in Coastal New England Reconstructed from a Multiproxy, High-Resolution, Estuarine Sediment Record. Environ. Sci. Technol. 2018, 52, 7614–7620. [Google Scholar] [CrossRef]
  13. Madsen, P.P. Peat bog records of atmospheric mercury deposition. Nature 1981, 293, 127–130. [Google Scholar] [CrossRef]
  14. Simola, H.; Lodenius, M. Recent increase in mercury sedimentation in a forest lake attributable to peatland drainage. Bull. Environ. Contam. Toxicol. 1982, 29, 298–305. [Google Scholar] [CrossRef] [Green Version]
  15. Shotyk, W.; Weiss, D.; Kramers, J.D.; Frei, R.; Cheburkin, A.K.; Gloor, M.; Reese, S. Geochemistry of the peat bog at Etang de la Gruere, Jura Mountains, Switzerland, and its record of atmospheric Pb and lithogenic trace metals (Sc, Ti, Y, Zr, and REE) since 12,370 C-14 yr BP. Geochim. Cosmochim. Acta 2001, 65, 2337–2360. [Google Scholar] [CrossRef]
  16. Weiss, D.; Shotyk, W.; Rieley, J.; Page, S.; Gloor, M.; Reese, S.; Martinez-Cortizas, A. The geochemistry of major and selected trace elements in a forested peat bog, Kalimantan, SE Asia, and its implications for past atmospheric dust deposition. Geochim. Cosmochim. Acta 2002, 66, 2307–2323. [Google Scholar] [CrossRef]
  17. Hansson, S.; Bindler, R.; Vleeschouwer, F. Using Peat Records as Natural Archives of Past Atmospheric Metal Deposition; Springer: Dordrecht, The Netherlands, 2015; pp. 323–354. [Google Scholar] [CrossRef]
  18. Cortizas, A.M.; Gayoso, E.G.R.; Weiss, D. Peat bog archives of atmospheric metal deposition. Sci. Total Environ. 2002, 292, 1–5. [Google Scholar] [CrossRef]
  19. Allan, M.; Pinti, D.L.; Ghaleb, B.; Verheyden, S.; Mattielli, N.; Fagel, N. Reconstruction of Atmospheric Lead Pollution During the Roman Period Recorded in Belgian Ombrotrophic Peatlands Cores. Atmosphere 2018, 9, 253. [Google Scholar] [CrossRef] [Green Version]
  20. Bandara, S.; Froese, D.G.; St Louis, V.L.; Cooke, C.A.; Calmels, F. Postdepositional Mercury Mobility in a Permafrost Peatland from Central Yukon, Canada. ACS Earth Space Chem. 2019, 3, 770–778. [Google Scholar] [CrossRef]
  21. Pontevedra-Pombal, X.; Mighall, T.M.; Novoa-Munoz, J.C.; Peiteado-Varela, E.; Rodriguez-Racedo, J.; Garcia-Rodeja, E.; Martinez-Cortizas, A. Five thousand years of atmospheric Ni, Zn, As, and Cd deposition recorded in bogs from NW Iberia: Prehistoric and historic anthropogenic contributions. J. Archaeol. Sci. 2013, 40, 764–777. [Google Scholar] [CrossRef]
  22. Appleby, P.G.; Oldfield, F. The calculation of lead-210 dates assuming a constant rate of supply of unsupported 210Pb to the sediment. Catena 1978, 5, 1–8. [Google Scholar] [CrossRef]
  23. Farmer, J.G.; Anderson, P.; Cloy, J.M.; Graham, M.C.; MacKenzie, A.B.; Cook, G.T. Historical accumulation rates of mercury in four Scottish ombrotrophic peat bogs over the past 2000 years. Sci. Total Environ. 2009, 407, 5578–5588. [Google Scholar] [CrossRef]
  24. Biester, H.; Martinez-Cortizas, A.; Birkenstock, S.; Kilian, R. Effect of peat decomposition and mass loss on historic mercury records in peat bogs from Patagonia. Environ. Sci. Technol. 2003, 37, 32–39. [Google Scholar] [CrossRef]
  25. Martinez-Cortizas, A.; Pontevedra-Pombal, X.; Garcia-Rodeja, E.; Novoa-Munoz, J.C.; Shotyk, W. Mercury in a Spanish peat bog: Archive of climate change and atmospheric metal deposition. Science 1999, 284, 939–942. [Google Scholar] [CrossRef]
  26. Shotyk, W.; Cheburkin, A.K.; Appleby, P.G.; Fankhauser, A.; Kramers, J.D. Two thousand years of atmospheric arsenic, antimony, and lead deposition recorded in an ombrotrophic peat bog profile, Jura Mountains, Switzerland. Earth Planet. Sci. Lett. 1996, 145, E1–E7. [Google Scholar] [CrossRef]
  27. Liu, R.H.; Wang, Q.C.; Lu, X.G.; Fang, F.M.; Wang, Y. Distribution and speciation of mercury in the peat bog of Xiaoxing’an Mountain, northeastern China. Environ. Pollut. 2003, 124, 39–46. [Google Scholar] [CrossRef]
  28. Bao, K.; Shen, J.; Wang, G.; Sapkota, A.; McLaughlin, N. Estimates of recent Hg pollution in Northeast China using peat profiles from Great Hinggan Mountains. Environ. Earth Sci. 2016, 75, 536. [Google Scholar] [CrossRef]
  29. Luo, L.; Yang, Y. The geomophogensis on the Western Sichuan and Northern Yunnan Plateau. Collect. Pap. Geogr. 1963, 5, 1–57. [Google Scholar]
  30. Chai, X.; Jin, S. Types, occurrence and development of peatlands in Zoige Plateau. Acta Geogr. Sin. 1963, 29, 219–240. [Google Scholar]
  31. Sun, G. A study on the mineral formation law, classification and reserves of the peat in the Ruoergai Plateau. J. Nat. Resour. 1992, 4, 334–346. [Google Scholar]
  32. Sun, G.; Zhang, W. Old channels of the Huanghe River on Ruoergai Plateau and it’s palaeogeographic significence. Sci. Geogr. Sin. 1987, 7, 266–272. [Google Scholar]
  33. Chen, H.; Yang, G.; Peng, C.; Zhang, Y.; Zhu, D.; Zhu, Q.; Hu, J.; Wang, M.; Zhan, W.; Zhu, E.; et al. The carbon stock of alpine peatlands on the Qinghai-Tibetan Plateau during the Holocene and their future fate. Quat. Sci. Rev. 2014, 95, 151–158. [Google Scholar] [CrossRef]
  34. Sun, G.; Luo, X.; Turner, R.E. A study on peat deposition chronology of Holocene of Zoige Plateau in the Northeast Qinghai-Tibetan Plateau. Acta Sedimentol. Sin. 2001, 19, 177–181. [Google Scholar]
  35. Tang, W. The environmental geochemical characters and studies of RUOERGAI pasture. Comput. Tech. Geophys. Geochem. Explor. 2001, 23, 353–356. [Google Scholar]
  36. Givelet, N.; Le Roux, G.; Cheburkin, A.; Chen, B.; Frank, J.; Goodsite, M.E.; Kempter, H.; Krachler, M.; Noernberg, T.; Rausch, N.; et al. Suggested protocol for collecting, handling and preparing peat cores and peat samples for physical, chemical, mineralogical and isotopic analyses. J. Environ. Monit. 2004, 6, 481–492. [Google Scholar] [CrossRef]
  37. Aaby, B.; Tauber, H. Rates of peat formation in relation to local environment as shown by studies of a raised bog in Denmark. Boreas 2008, 4, 1–17. [Google Scholar] [CrossRef]
  38. Bao, S.D. Soil and Agricultural Chemistry Analysis; Agriculture Publication: Beijing, China, 2000; pp. 300–356. [Google Scholar]
  39. Appleby, P.G.; Shotyk, W.; Fankhauser, A. Lead-210 age dating of three peat cores in the Jura Mountains, Switzerland. Water Air Soil Pollut. 1997, 100, 223–231. [Google Scholar] [CrossRef]
  40. Cambray, R.S.; Cawse, P.A.; Garland, J.A.; Gibson, J.A.B.; Johnson, P.; Lewis, G.N.J.; Newton, D.; Salmon, L.; Wade, B.O. Observations on radioactivity from the chernobyl accident. Nucl. Energy-J. Br. Nucl. Energy Soc. 1987, 26, 77–101. [Google Scholar]
  41. Appleby, P.G.; Richardson, N.; Nolan, P.J. 241am dating of lake-sediments. Hydrobiologia 1991, 214, 35–42. [Google Scholar] [CrossRef]
  42. Li, H.; Wang, J.; Sun, J.; Chou, C.; Li, H.; Xia, Y.; Zhao, H.; Yang, Q.; Kashyap, S. Study of Jinchuan Mire in NE China I: AMS 14C, 210Pb and 137Cs dating on peat cores. Quat. Int. 2019, 528, 9–17. [Google Scholar] [CrossRef]
  43. Ali, A.A.; Ghaleb, B.; Garneau, M.; Asnong, H.; Loisel, J. Recent peat accumulation rates in minerotrophic peatlands of the Bay James region, Eastern Canada, inferred by Pb-210 and Cs-137 radiometric techniques. Appl. Radiat. Isot. 2008, 66, 1350–1358. [Google Scholar] [CrossRef]
  44. Li, C.; Le Roux, G.; Sonke, J.; van Beek, P.; Souhaut, M.; Van der Putten, N.; De Vleeschouwer, F. Recent Pb-210, Cs-137 and Am-241 accumulation in an ombrotrophic peatland from Amsterdam Island (Southern Indian Ocean). J. Environ. Radioact. 2017, 175, 164–169. [Google Scholar] [CrossRef] [Green Version]
  45. Sholkovitz, E.R.; Cochran, J.K.; Carey, A.E. Laboratory studies of the diagenesis and mobility of PU-239,PU-240 and CS-137 in nearshore sediments. Geochim. Cosmochim. Acta 1983, 47, 1369–1379. [Google Scholar] [CrossRef]
  46. Oldfield, F.; Richardson, N.; Appleby, P.G. Radiometric dating (PB-210, CS-137, AM-241) of recent ombrotrophic peat accumulation and evidence for changes in mass-balance. Holocene 1995, 5, 141–148. [Google Scholar] [CrossRef]
  47. Ritchie, J.C.; McHenry, J.R. Application of radioactive fallout cesium-137 for measuring soil-erosion and sediment accumulation rates and patterns—A review. J. Environ. Qual. 1990, 19, 215–233. [Google Scholar] [CrossRef] [Green Version]
  48. Olid, C.; Diego, D.; Garcia-Orellana, J.; Martinez Cortizas, A.; Klaminder, J. Modeling the downward transport of Pb-210 in Peatlands: Initial Penetration-Constant Rate of Supply (IP-CRS) model. Sci. Total Environ. 2016, 541, 1222–1231. [Google Scholar] [CrossRef] [PubMed]
  49. Gao, J.; Ouyang, H.; Wang, G.; Xu, X. Recent peat accumulation rates in Zoige peatlands, eastern Tibet, inferred by Pb-210 and Cs-137 radiometric techniques. In International Conference on Ecological Informatics and Ecosystem Conservation; Procedia Environmental Sciences; Yang, Z., Chen, B., Eds.; Elsevier Science B.V.: Amsterdam, The Netherlands, 2010; Volume 2, pp. 1927–1933. [Google Scholar]
  50. MacKenzie, A.B.; Hardie, S.M.L.; Farmer, J.G.; Eades, L.J.; Pulford, I.D. Analytical and sampling constraints in Pb-210 dating. Sci. Total Environ. 2011, 409, 1298–1304. [Google Scholar] [CrossRef] [PubMed]
  51. Wang, M.; Chen, H.; Wu, N.; Peng, C.; Zhu, Q.; Zhu, D.; Yang, G.; Wu, J.; He, Y.; Gao, Y.; et al. Carbon dynamics of peatlands in China during the Holocene. Quat. Sci. Rev. 2014, 99, 34–41. [Google Scholar] [CrossRef]
  52. Zhou, H.; Hu, J.; Ming, L.; Peng, P.; Zhang, G. Branched glycerol dialkyl glycerol tetraethers and paleoenvironmental reconstruction in Zoig peat sediments during the last 150 years. Chin. Sci. Bull. 2011, 56, 2456–2463. [Google Scholar] [CrossRef] [Green Version]
  53. Su, Q. Environmental Changes Revealed by Peat Deposition in Huahu Peatland in the Zoige Plateau. Master’s Thesis, Northwest A&F University, Xianyang, China, 2016. [Google Scholar]
  54. Biester, H.; Hermanns, Y.M.; Cortizas, A.M. The influence of organic matter decay on the distribution of major and trace elements in ombrotrophic mires—A case study from the Harz Mountains. Geochim. Cosmochim. Acta 2012, 84, 126–136. [Google Scholar] [CrossRef]
  55. Chambers, F.M.; Beilman, D.W.; Yu, Z. Methods for determining peat humification and for quantifying peat bulk density, organic matter and carbon content for palaeostudies of climate and peatland carbon dynamics. Mires Peat 2010, 7, 1–10. [Google Scholar]
  56. Islam, F.S.; Gault, A.G.; Boothman, C.; Polya, D.A.; Charnock, J.M.; Chatterjee, D.; Lloyd, J.R. Role of metal-reducing bacteria in arsenic release from Bengal delta sediments. Nature 2004, 430, 68–71. [Google Scholar] [CrossRef]
  57. Campbell, K.M.; Malasarn, D.; Saltikov, C.W.; Newman, D.K.; Hering, J.G. Simultaneous microbial reduction of iron(III) and arsenic(V) in suspensions of hydrous ferric oxide. Environ. Sci. Technol. 2006, 40, 5950–5955. [Google Scholar] [CrossRef] [PubMed]
  58. Neumann, R.B.; Ashfaque, K.N.; Badruzzaman, A.B.M.; Ali, M.A.; Shoemaker, J.K.; Harvey, C.F. Anthropogenic influences on groundwater arsenic concentrations in Bangladesh. Nat. Geosci. 2010, 3, 46–52. [Google Scholar] [CrossRef]
  59. Weiss, D.; Shotyk, W.; Appleby, P.G.; Kramers, I.D.; Cheburkin, A.K. Atmospheric Ph deposition since the industrial revolution recorded by five Swiss peat profiles: Enrichment factors, fluxes, isotopic composition, and sources. Environ. Sci. Technol. 1999, 33, 1340–1352. [Google Scholar] [CrossRef]
  60. Wu, Y.; Liang, J.; Bing, H.; Wang, J.; Zhou, J.; Sun, H. Seasonal and spatial distribution of trace metals in alpine soils of Eastern Tibetan Plateau, China. J. Mt. Sci. 2017, 14, 1591–1603. [Google Scholar] [CrossRef]
  61. Stromsoe, N.; Callow, J.N.; McGowan, H.A.; Marx, S.K. Attribution of sources to metal accumulation in an alpine tarn, the Snowy Mountains, Australia. Environ. Pollut. 2013, 181, 133–143. [Google Scholar] [CrossRef]
  62. Gonzalez, Z.I.; Krachler, M.; Cheburkin, A.K.; Shotyk, W. Spatial distribution of natural enrichments of arsenic, selenium, and uranium in a minerotrophic peatland, Gola di Lago, Canton Ticino, Switzerland. Environ. Sci. Technol. 2006, 40, 6568–6574. [Google Scholar] [CrossRef] [PubMed]
  63. Langner, P.; Mikutta, C.; Kretzschmar, R. Arsenic sequestration by organic sulphur in peat. Nat. Geosci. 2012, 5, 66–73. [Google Scholar] [CrossRef]
  64. Sun, Y.; Tian, T.; He, N.; Ye, Z.; Sun, M.; Yang, D. Effects of freeze-thaw on soil characters and arsenate adsorption and desorption. Ecol. Environ. Sci. 2016, 25, 724–728. [Google Scholar]
  65. Eberle, A.; Besold, J.; Ninin, J.M.L.; Kerl, C.F.; Kujala, K.; Planer-Friedrich, B. Potential of high pHand reduced sulfur for arsenicmobilization-Insights from a Finnish peatland treating mining waste water. Sci. Total Environ. 2021, 758, 13. [Google Scholar] [CrossRef]
  66. Reithmaier, G.M.S.; Knorr, K.H.; Arnhold, S.; Planer-Friedrich, B.; Schaller, J. Enhanced silicon availability leads to increased methane production, nutrient and toxicant mobility in peatlands. Sci. Rep. 2017, 7, 8. [Google Scholar] [CrossRef] [Green Version]
  67. Mason, R.P.; Fitzgerald, W.F.; Morel, F.M.M. The biogeochemical cycling of elemental mercury—Anthropogenic influences. Geochim. Cosmochim. Acta 1994, 58, 3191–3198. [Google Scholar] [CrossRef]
  68. Morel, F.M.M.; Kraepiel, A.M.L.; Amyot, M. The chemical cycle and bioaccumulation of mercury. Annu. Rev. Ecol. Syst. 1998, 29, 543–566. [Google Scholar] [CrossRef] [Green Version]
  69. Selin, N.E. Global Biogeochemical Cycling of Mercury: A Review. Annu. Rev. Environ. Resour. 2009, 34, 43–63. [Google Scholar] [CrossRef] [Green Version]
  70. Tang, S.; Huang, Z.; Liu, J.; Yang, Z.; Lin, Q. Atmospheric mercury deposition recorded in an ombrotrophic peat core from Xiaoxing’an Mountain, Northeast China. Environ. Res. 2012, 118, 145–148. [Google Scholar] [CrossRef]
  71. Yang, H.; Battarbee, R.W.; Turner, S.D.; Rose, N.L.; Derwent, R.G.; Wu, G.; Yang, R. Historical Reconstruction of Mercury Pollution Across the Tibetan Plateau Using Lake Sediments. Environ. Sci. Technol. 2010, 44, 2918–2924. [Google Scholar] [CrossRef]
  72. Shotyk, W.; Goodsite, M.E.; Roos-Barraclough, F.; Givelet, N.; Le Roux, G.; Weiss, D.; Cheburkin, A.K.; Knudsen, K.; Heinemeier, J.; Van der Knaap, W.O.; et al. Accumulation rates and predominant atmospheric sources of natural and anthropogenic Hg and Ph on the Faroe Islands. Geochim. Cosmochim. Acta 2005, 69, 1–17. [Google Scholar] [CrossRef]
  73. Gonzalez-Raymat, H.; Liu, G.; Liriano, C.; Li, Y.; Yin, Y.; Shi, J.; Jiang, G.; Cai, Y. Elemental mercury: Its unique properties affect its behavior and fate in the environment. Environ. Pollut. 2017, 229, 69–86. [Google Scholar] [CrossRef]
  74. Liu, J.; Wang, Z.C.; Zhao, H.Y.; Peros, M.; Yang, Q.N.; Liu, S.S.; Li, H.K.; Wang, S.Z.; Bu, Z.J. Mercury and arsenic in the surface peat soils of the Changbai Mountains, northeastern China: Distribution, environmental controls, sources, and ecological risk assessment. Environ. Sci. Pollut. Res. 2018, 25, 34595–34609. [Google Scholar] [CrossRef] [PubMed]
  75. Sun, G.; Zhang, W.; Zhang, J.; Luo, J.; Yang, F. A study of ecological environment and rational exploitation of the mires in Ruoergai Plateau. J. Nat. Resour. 1987, 2, 359–368. [Google Scholar]
  76. Zhang, X.; Liu, H.; Xing, Z. Challenges and Solutions for Sustainable Land Use in Ruoergai-the Highest Altitude Peatland in Qinhai-Tibetan Plateau, China. In Proceedings of the International Conference on Energy, Environment and Development (ICEED), Kuala Lumpur, Malaysia, 8–9 December 2010; pp. 1019–1025. [Google Scholar]
  77. Yang, Y.; Wang, Y.; Wen, T.; Li, W.; Zhao, Y.N.; Li, L. Elemental composition of PM2.5 and PM10 at Mount Gongga in China during 2006. Atmos. Res. 2009, 93, 801–810. [Google Scholar] [CrossRef]
  78. Zhang, R.; Shen, Z.; Zou, H. Atmospheric Pb levels over Mount Qomolangma region. Particuology 2009, 7, 211–214. [Google Scholar] [CrossRef]
  79. He, K.; Huo, H.; Zhang, Q. Urban air pollution in China: Current status, characteristics, and progress. Annu. Rev. Energy Environ. 2002, 27, 397–431. [Google Scholar] [CrossRef]
  80. Mercury Emissions: The Global Context. Available online: https://www.epa.gov/international-cooperation/mercury-emissions-global-context (accessed on 6 May 2021).
  81. Zhang, J. Study on Environmental Geochemistry of Heavy Metals in Lake Wuliangsuhai. Master’s Thesis, Inner Mongolia University, Hohhot, China, 2013. [Google Scholar]
  82. Shi, W.; Feng, X.; Zhang, G.; Ming, L.; Yin, R.; Zhao, Z.; Wang, J. High-precision measurement of mercury isotope ratios of atmospheric deposition over the past 150 years recorded in a peat core taken from Hongyuan, Sichuan Province, China. Chin. Sci. Bull. 2011, 56, 877–882. [Google Scholar] [CrossRef] [Green Version]
  83. Xu, J. The Relationship between Climate Change and Atmospheric Deposit on Flux of Mercury Recorded by Ombrotrophic Peat in the Tanghongling of Xiaoxinganling; Henan Polytechnic University: Jiaozuo, China, 2010. [Google Scholar]
  84. Julian, P.; Gu, B.H.; Wright, A.L. Mercury stoichiometric relationships in a subtropical peatland. Water Air Soil Pollut. 2016, 227, 472–488. [Google Scholar] [CrossRef]
  85. Coggins, A.M.; Jennings, S.J.; Ebinghaus, R. Accumulation rates of the heavy metals lead, mercury and cadmium in ombrotrophic peatlands in the west of Ireland. Atmos. Environ. 2006, 40, 260–278. [Google Scholar] [CrossRef]
  86. Coufalik, P.; Zverina, O.; Komarek, J. Atmospheric mercury deposited in a peat bog, the Jeseniky Mountains, Czech Republic. J. Geochem. Explor. 2013, 132, 120–124. [Google Scholar] [CrossRef]
  87. Grigal, D.F.; Kolka, R.K.; Fleck, J.A.; Nater, E.A. Mercury budget of an upland-peatland watershed. Biogeochemistry 2000, 50, 95–109. [Google Scholar] [CrossRef]
  88. Hansson, S.V.; Kaste, J.M.; Olid, C.; Bindler, R. Incorporation of radiometric tracers in peat and implications for estimating accumulation rates. Sci. Total Environ. 2014, 493, 170–177. [Google Scholar] [CrossRef]
Figure 1. Maps of the study area showing the five main counties (red circles) and the sampling site (red triangle) on the Zoige Plateau (b) on the Qinghai–Tibet Plateau (a). Different colors represent different altitudes.
Land 10 01241 g001
Figure 2. Unsupported 210Pb (a) and 137Cs (b) activities in the peat profile. The blue circles indicate two representative radioactive incidents: the peaks indicating nuclear tests at 13 cm in 1963 and the Chernobyl incident at 8 cm in 1986.
Land 10 01241 g002
Figure 3. Variations in As (black lines) and Hg (blue lines) concentrations in the peat profile with depth (a) and dating (b).
Land 10 01241 g003
Figure 4. Historical records of accumulation rates of Hg (grey part) and As (blue part).
Land 10 01241 g004
Figure 5. Correlation analysis between accumulation rates of As and Hg and other soil physicochemical properties, respectively. Blue and red indicate positive and negative correlations, respectively. The depths of the colors indicate correlation coefficients with either higher (darker) or lower (lighter) values. Shapes more elliptical or round represent lower or higher values of the significance level of p, respectively. The cross (×) represents the significance level p ≥ 0.05. PH, C.N, DBD, WAT, TOC, TC, TN, Hg, and As represent pH, the ratio of total carbon content to total nitrogen content, dry bulk density, mass water content, total organic carbon content, total carbon content, total nitrogen content, and accumulation rates of Hg and As, respectively.
Land 10 01241 g005
Table 1. Physical and chemical properties of peat soils, including mass water content (WAT), pH, dry bulk density (DBD), total organic carbon content (TOC), total nitrogen content (TN), and the ratio of total carbon to total nitrogen (C/N), in different layers of the peat profile.
LayerDepth
(cm)
WAT
(%)
pHDBD
(g cm−3)
TOC
(mg g−1)
TN
(mg g−1)
C/N
Grassroots layer0–4114.486.750.2484.6211.7413.78
Humus layer4–14120.836.560.2695.1712.0514.01
Peat layer14–30106.186.550.2975.169.5715.24
-Average112.176.580.2883.0910.6814.64
Note: All values were calculated as averages based on every 1-cm soil fraction of the corresponding layers. TOC and TN were based on dry soil mass. For details on TN, TC, and TOC, see Table S4 in the Supplementary Material.
Publisher’s Note: MDPI stays neutral with regard to jurisdictional claims in published maps and institutional affiliations.

