Article

Integrated Evaluations of Resource and Environment Carrying Capacity of the Huaihe River Ecological and Economic Belt in China

1
School of Urban and Environmental Science, Huaiyin Normal University, Huai’an 223300, China
2
Key Research Base of Philosophy and Social Sciences in Jiangsu Universities-Research Institute of Huaihe River Eco-Economic Belt, Huai’an 223300, China
3
School of Architecture and Urban Planning, Suzhou University of Science and Technology, Suzhou 215000, China
4
Department of Leisure Management, Minghsin University of Science and Technology, Hsinchu 30401, Taiwan
5
College of Architecture & Design, Chung Hua University, Hsinchu 30012, Taiwan
*
Author to whom correspondence should be addressed.
Land 2021, 10(11), 1168; https://doi.org/10.3390/land10111168
Submission received: 21 September 2021 / Revised: 28 October 2021 / Accepted: 29 October 2021 / Published: 31 October 2021

Abstract

:
The evaluations of resource and environment carrying capacity and territorial development suitability, also referred to as “double evaluations”, have been taken by China as an important direction in territorial space planning. Based on the evaluation of resource and environment carrying capacity, the double evaluations can contribute to protecting ecological safety and territorial safety and promoting regional sustainable development. The focus of this study was to integratedly evaluate the resource and environment carrying capacity of the Huaihe River Ecological and Economic Belt. First, the overall weights of the factors at the dimension level and the index level in the established integration evaluation system were calculated with the fuzzy analytical hierarchy process (FAHP) method; and then, using the linear weighted function, the overall resource and environment carrying capacities of 25 cities in the belt were calculated. On that basis, the resource and environment carrying capacity evaluation model was established. Through model analysis, this study comprehensively investigated the resource and environment carrying capacity of the Huaihe River Eco-economic Belt and provided a foundation for the future territorial space planning and layout of the Huaihe River Eco-economic Belt.

1. Introduction

As China’s urbanization process enters the middle- and later-phase of high-speed development, the conventional and extensive development mode can no longer meet the requirements in urban development. Urbanization development mode has gradually been transformed into high-quality development mode, which means that China’s spatial planning attribute has gradually entered into resource management planning at the stable stage of urbanization. Scholars have proposed to perform double evaluations in territorial space planning in the compilation of territorial spatial planning, the main idea of which was to perform evaluations on the resource and environment carrying capacity as well as the territorial development suitability [1]. On that basis, some suggestions and countermeasures such as sticking to the bottom-line thought in resource utilization, dividing the resource and environment into urban land, agricultural land and ecological space, and determining the ecological conversation line, permanent prime farmland and urban development boundary, were put forward. The implementation of double evaluations was helpful to maintain regional security and enhance the utilization efficiency of resources, thereby meeting the intensive and high-efficiency standards [2,3,4].
Since China proposed the planning scheme of the Huaihe River Eco-economic Belt, this region has become an important practice place for territorial space development due to its abundant and concentrated ecological resources and low land-use intensity [5,6]. From the perspective of evaluation object, the studies on resource and environment carrying capacity include not only single classification but also comprehensive investigations [7,8]. The resource and environment carrying capacity refers to the sustainable population and economic scale under the premise of maintaining a certain resource environment and environmental capacity, and there is no damage to the natural ecological system. Based on previous literature, this study improved the integrated evaluation index system of resource and environment carrying capacity by using the fuzzy analytical hierarchy process (FAHP) method and explained the judgement criterion of positive and negative indexes, which is expected to provide a reference for effective implementation of eco-economic spatial strategy in the Huaihe River Eco-economic Belt.
Early studies regarding the carrying capacity are tightly correlated with the development of ecology. The concept of resource and environment carrying capacity began to take shape at the beginning of the 20th Century [9]. The carrying capacity includes a series of extension methods for better understanding the biological interaction in the ecological system, which is generally applied without clear consideration of historical origin [10]. Since the end of the 20th Century, the resource- and environment-oriented man-earth relationship has become important propositions in geography and ecology [11,12,13]. Resource and environmental issues have gradually become the hotspots investigated by many scholars in geography and environmental sciences [14]. Under the premise of maintaining structural stability and complete functions of the ecological system, the effects of human activities that the whole biosphere can bear on the environment are the thresholds of velocity, scale and intensity [15]. Territoriality, comprehensiveness, and man-earth relationship are the important parts for theories and practices in the studies on overall resource and environmental carrying capacity. The research frontiers on resource and environment carrying capacity mainly lie in the development and comprehensiveness of the evaluation indicator system and the spatial-temporal dynamics of the carrying capacity [16]. Currently, the hotspots on resource and environment carrying capacity have focused on how to establish the overall evaluation indicator system and extensively apply the system to studies and practices.
Territorial space planning in China includes overall planning, detailed planning, and related special planning. The related special planning refers to the special arrangement for space development, protection, and utilization with the aim of reflecting particular functions in specific regions (watersheds) and domains, which is also the special planning related to space utilization. Therefore, the main purpose of this study included: (1) Conduct fuzzy evaluation of expert group cognition by introducing fuzzy theory with fuzzy semantic scales to reduce the subjective differences induced by individual fuzzy semantics; accordingly, experts can judge the problems, establish resource and environment carrying capacity evaluation system and related indexes in a more humanized way; (2) Solve the problems of lacking representativeness of the evaluation system and operating regional environment planning system, and establish the quantitative evaluation and planning control tool of future regional governance; (3) Use the established evaluation system to verify the development levels of resource and environment carrying capacity of the cities in the Huaihe River Eco-economic Belt. Overall, this study has established a systematical evaluation system by simplifying complex factors, which can provide urban decision-makers with a fundamental evaluation of resource and environment carrying capacity based on stratification and the weights of related indexes. As regard to cross-basin governance for larger cities in the basin, this study can also provide significant references for territorial space planning based on the current development conditions of various cities. The structure of this study was organized as follows. The literature background is described in Section 2, the materials and methods are illustrated in Section 3, the results and discussion are given in Section 4, and finally, the conclusions are drawn in Section 5.

2. Literature Background

The evaluation of resource and environment carrying capacity is the premise of territorial space planning and utilization control. Resource allocation and environmental capacity are the basic conditions restricting the regional development [3]. Investigating resource and environment carrying capacity in regional development planning has been heavily restricted by natural resources. Resource abundance and environmental carrying capacity are tightly related to the factors of cultivated land, water resource, construction land and environment. Environment capacity is affected by the factors of forest land, population density and urbanization rate. In this study, based on the resource abundance and environmental capacity, the research processes of resource and environment carrying capacity were systematically analyzed, aiming to promote the standardized evaluation of resource and environment carrying capacity.

2.1. Developing History of Environment Carrying Capacity

Sustainability assessment (SA) is a complex evaluation method used for supporting the decision- and policymaking under extensive environmental, economic, and social backgrounds, which has exceeded the purely technical and scientific evaluation. In addition, it also can be defined as a method for helping decision- and policy-makers to determine what factors should be adopted and cannot be adopted, thereby achieving sustainable social development [17]. Since the 1960s, under the background of the global resource and environment crisis, the concept of carrying capacity has been used to solve the pressing resource and environment problems facing our society. Based on research objects, contents and application domains, two branches of carrying capacity, i.e., resource and environment, have been derived, mainly including soil resource carrying capacity [18,19], water resource carrying capacity [20,21], ecological resource carrying capacity [22,23], and overall environment carrying capacity [24,25]. Before the 1990s, scholars mainly focused on soil resource carrying capacity [3]. In the late 1990s, environment and water resource carrying capacity have been the emphasis in many studies. Since the 21st century, the studies regarding ecological carrying capacity, urban carrying capacity and tourist traffic have risen gradually. More scholars began to examine theory and methods of overall carrying capacity investigation and made attempts to the applications in many fields such as soil, urban and basin governance, and environmental protection. Over the past few decades, China has been implementing large-scale urbanization and will continue the urbanization in the future, which has brought about favorable benefits for social and economic development in China and simultaneously posed serious challenges such as air pollution and land resource overload to resource and environment carrying capacity [26].
Resource and environment carrying capacity is an overall measurement index that can reflect sustainable urban development attribute in urban social, environmental and economic aspects [27,28,29]. Scholars have proposed various definitions and connotations for resource and environment carrying capacity [24,30,31]. For example, Liu and Borthwick (2011) defined resource and envrionment carrying capacity as the limit of adverse changes induced by human activities, assuming that certain environmental resources restrict the urban development [24]. Ye et al. (2016) expressed resource and environment carrying capacity as the limit at which human activity will lead to undesirable changes to the environment, assuming there are certain limits the environment itself imposes on development [29]. Essentially, resource and environment carrying capacity can be explained as the limit or the maximum value of urban population and human activities that a city can support under specific resource and environment conditions without irreversible deterioration and damages.

2.2. Evaluation of Resource and Environment Carrying Capacity

Under the overall evaluation of the natural environment and ecological environment, the evaluation of resource and environment carrying capacity is the foundation of territorial development, which determines the carrying capacity levels at different functional directions such as ecological protection, agricultural production, and urban construction. Resource and environment carry capacity includes multiple factors, i.e., resource, environment, society, and economy. These factors impose influences and restrictions on each other, thereby forming a complex system. Therefore, the integrated evaluation of resource and environment carrying capacity of the Huaihe River Eco-economic Belt is the overall evaluation based on the studies on land resources [32,33], water resources [34,35], and environmental evaluations [3,36].
The evaluation contents of resource and environment carrying capacity include the evaluation of land resources, the evaluation of water resources, environmental evaluation, and disaster evaluation.
  • Evaluation of Land Resources
Due to the finiteness and irreplaceability, land resources show a limited carrying capacity of human activities. William Vogt proposed the concept of land resource carrying capacity and the computing formula [37]. The studies on the carrying capacity of land resources in China appeared in the 1980s [38], and mainly focused on the concept connotation and evaluation methods of land resource carrying capacity. Land resource carrying capacity refers to the maximum scale and intensity of various human activities that the land can bear at a certain spatial-temporal scale under the premise of ensuring normal utilization of land and virtuous cycle of ecological environment.
2.
Evaluation of Water Resources
Water resource carrying capacity refers to the amount of available ecological water that can maintain limited development goals of population, resource and environment for meeting the maximum social-economic scale at a certain development and utilization phase of water resource [35,39]. The systematical study method can be used to analyze the conception, essence, functions and quantitative expression methods of water resource carrying capacity [40].
3.
Environmental Evaluation
The environmental evaluation mainly refers to the effects of regional economic and social activities on the regional environment, the regional environment’s carrying capacity of various pollutants, and the supporting capacity of providing the environmental conditions including light, heat, ventilation, ocean environment, and agricultural development for urban construction. According to the directions of agricultural function, urban function, agricultural production climate and environmental condition, the urban environment condition is adopted as the evaluation index, which can be reflected by the environmental capacity of air, water, soil, light and heat.
4.
Disaster Evaluation
The disaster evaluation refers to the evaluation of the effects of regional disasters on normal urban construction and daily agricultural production. The evaluation index of the effect on agricultural production can select the meteorological disasters as the main evaluation objects, which, overall, can be reflected by the effects of disasters such as drought, flood, and cold waves. The disaster evaluation can be comprehensively reflected by the influences and the probabilities of the geological disasters including moving fault, collapse, landslide, and debris flow.
Over the past two decades, multi-criteria decision-making methods have experienced rapid development and extensive applications in design, selection, and evaluation. Based on the multi-criteria evaluation, when the alternative solutions are known, decision-makers first express their preference structures, and then non-inferior solutions are solved, or alternative schemes are ordered by quality. Yoon and Hwang (1995) applied a multi-criteria evaluation method for differentiation according to data type or the preference of decision-makers. In terms of the type of processed data, multi-criteria evaluation methods mainly include the qualitative multi-criteria evaluation method for qualitative evaluation, the quality mediation method between qualitative and quantitative evaluation, the quantitative multi-criteria evaluation method for quantitative evaluation, and the evaluation by considering qualitative and quantitative evaluation simultaneously. In terms of preference structures of decision-makers, multi-criteria decision-making methods can be classified in accordance with two stages. The first stage considers whether the information related to any decision criteria can be provided for decision-makers, while the second stage considers which type of information related to evaluation criteria can be provided for decision-makers [41]. It should be noted that too many factors under consideration are unfavorable for the establishment of hierarchical structure. For a simple evaluation system of resource and environment carrying capacity, due to research limits, environment and resources were selected as subjects, and the evaluation indexes were selected from the perspective of per capita environment and resources. Some factors such as disaster, water quality and air quality were ignored in this study. The suitability of the multi-criteria decision-making method will be introduced in the next section.

3. Materials and Methods
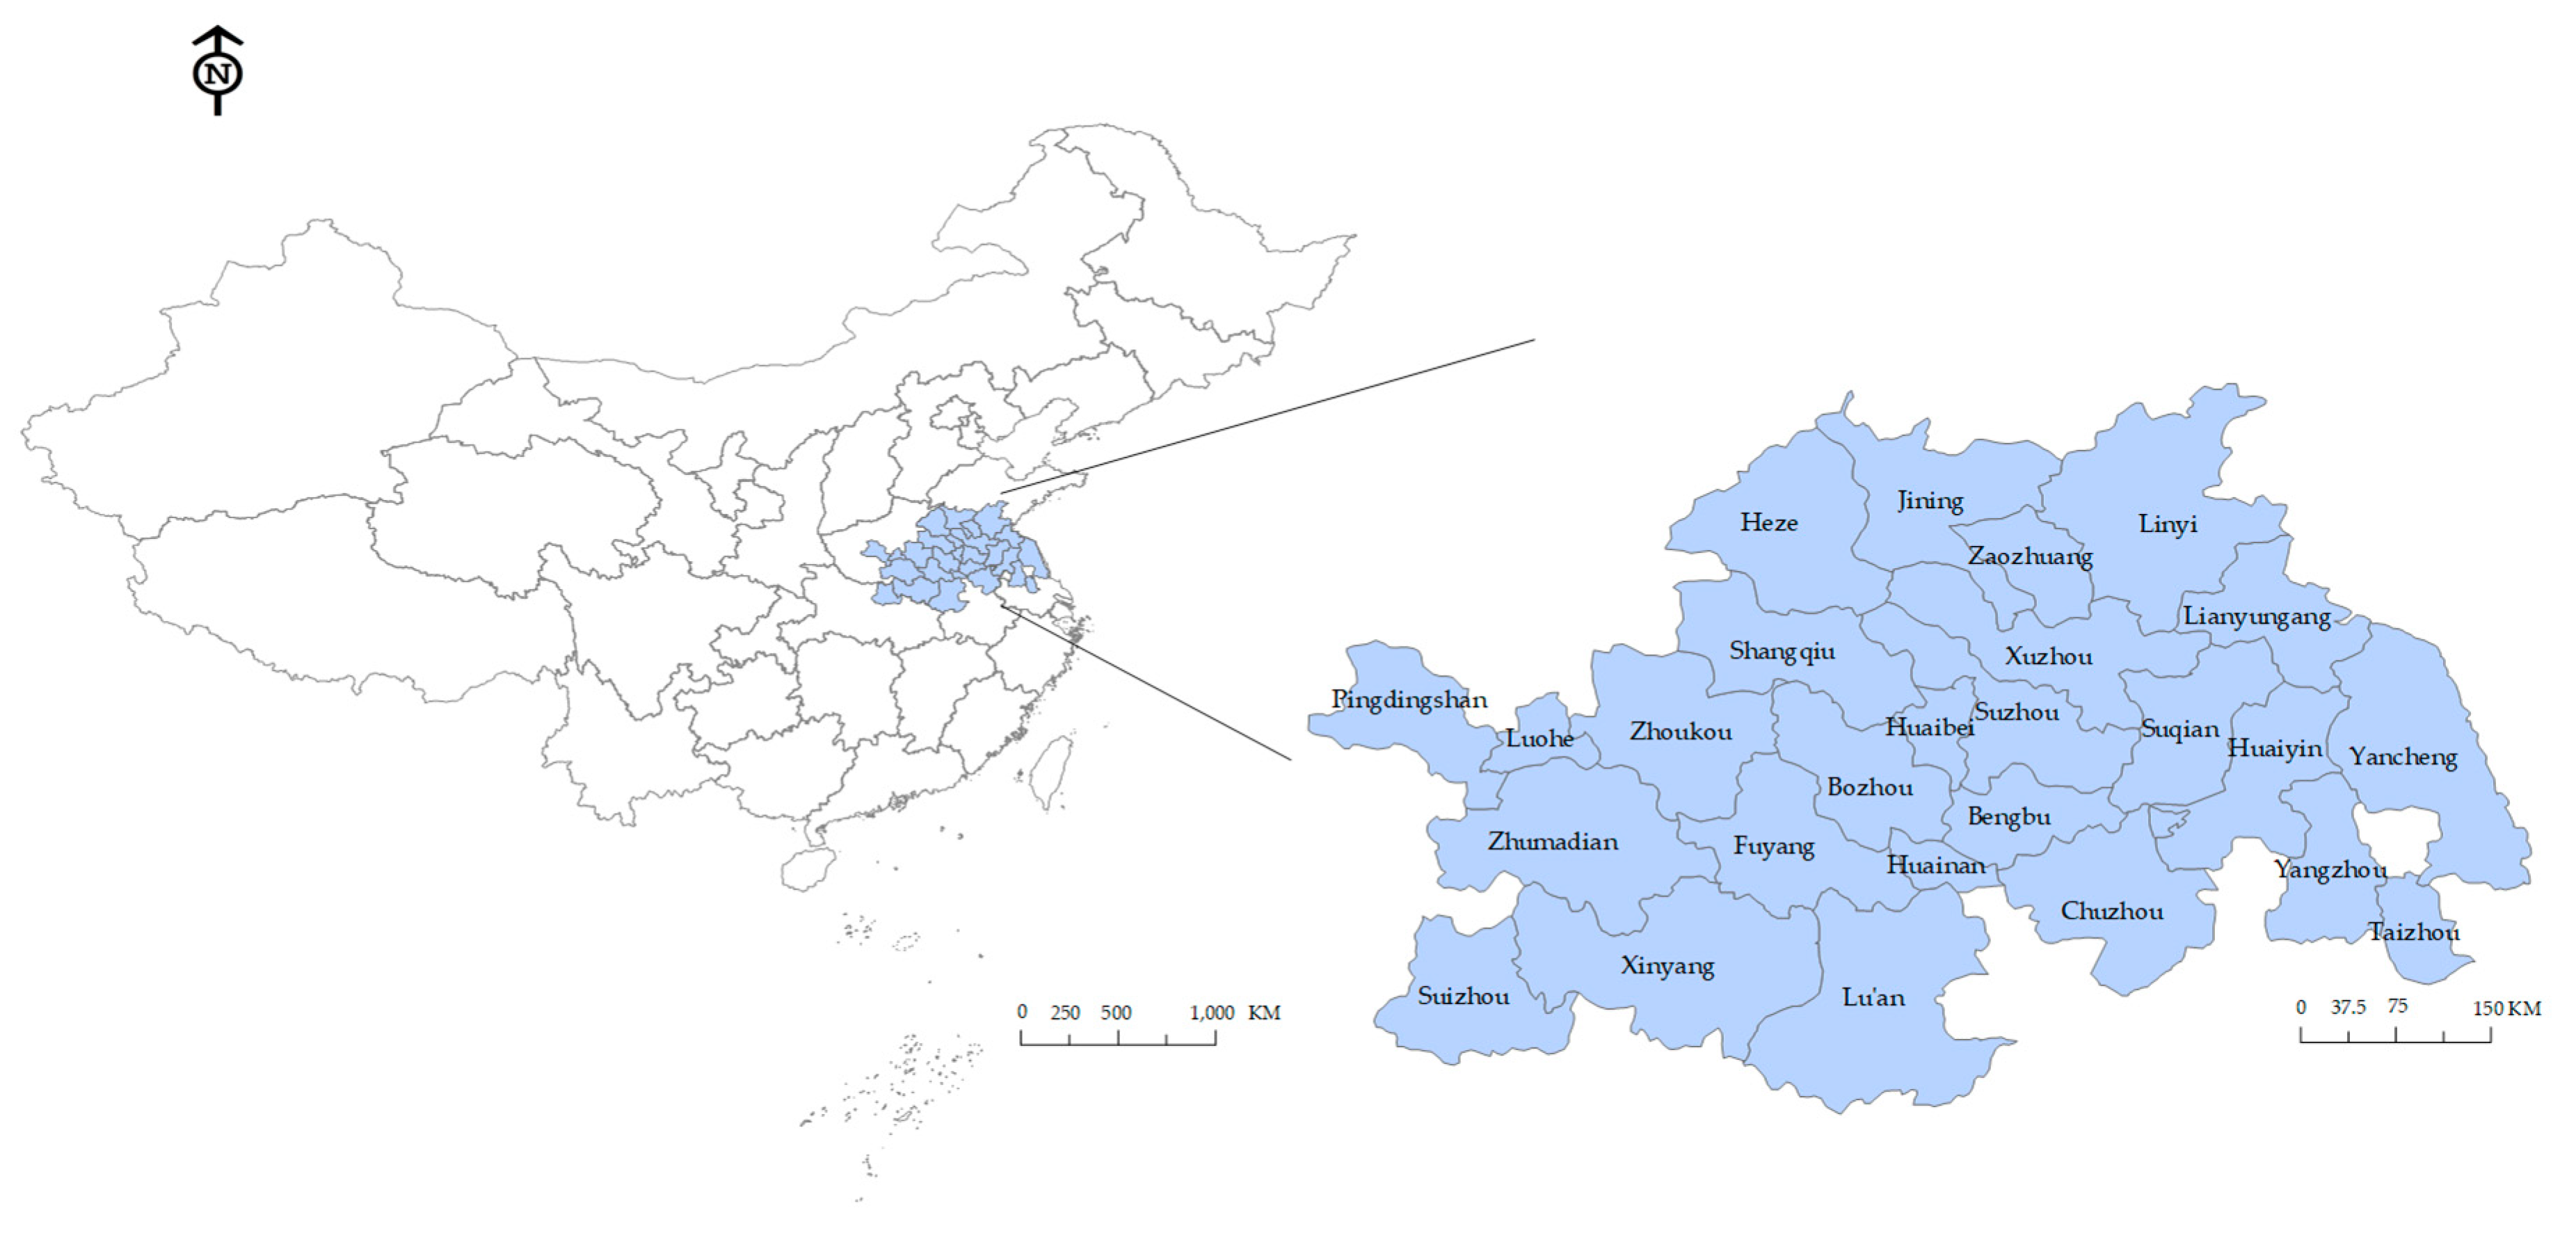
3.1. Research Area

This study selected the Huaihe River Eco-economic Belt as the study area. There are 5 provinces and 25 cities in the area, as shown in Figure 1. This area covers the region of the mainstream of Huaihe River, the first-level tributaries, and the Yi Shu Si River basin in the lower reaches of Huaihe River. It passes through the provinces of Jiangsu, Shandong, Anhui, Henan and Hubei, and has a planning area of 243,000 km2 [5]. Huaihe River Eco-economic Belt located between the Yangtze River Basin and Yellow River Basin and is one of the most promising development regions in central and east China [5,42]. In terms of regional condition, the Huaihe River Eco-economic Belt runs through Huang-Huai Plain and connects the central and east region, which is also connected with the Yangtze River Economic Belt and crosses multiple key railways including Beijing-Shanghai, Beijing-Kowloon, Beijing-Guangzhou and Lianyungang-Lanzhou Railways. The Huaihe River route reaches up to 2300 km.
The Beijing-Hangzhou Grand Canal, and the mainstream and tributaries of Huaihe River all have developed shipping systems [43]. The belt is located in the climate transitional zone between north and south China, with abundant natural endowments and biodiversity, vast plain area, and stable ecological system. As a major grain-producing area in China, there are a large number of lakes and possesses a well-developed water system, huge potentials in the aquaculture industry and animal husbandry, and abundant mineral resource reserves in this area [44]. Meanwhile, the belt is also rich in human resources and has great potentials in urbanization and the consumer market. Moreover, the belt shows perfect commercial system and obvious advantages in the industrial cluster and develops rapidly in high-technology industry and strategic emerging industries. The belt adjoins some economically developed areas in China such as the Yangtze River Delta, with favorable basic conditions of undertaking industry transfer [45]. Overall, the study of this area is of great significance to regional governance and space planning.

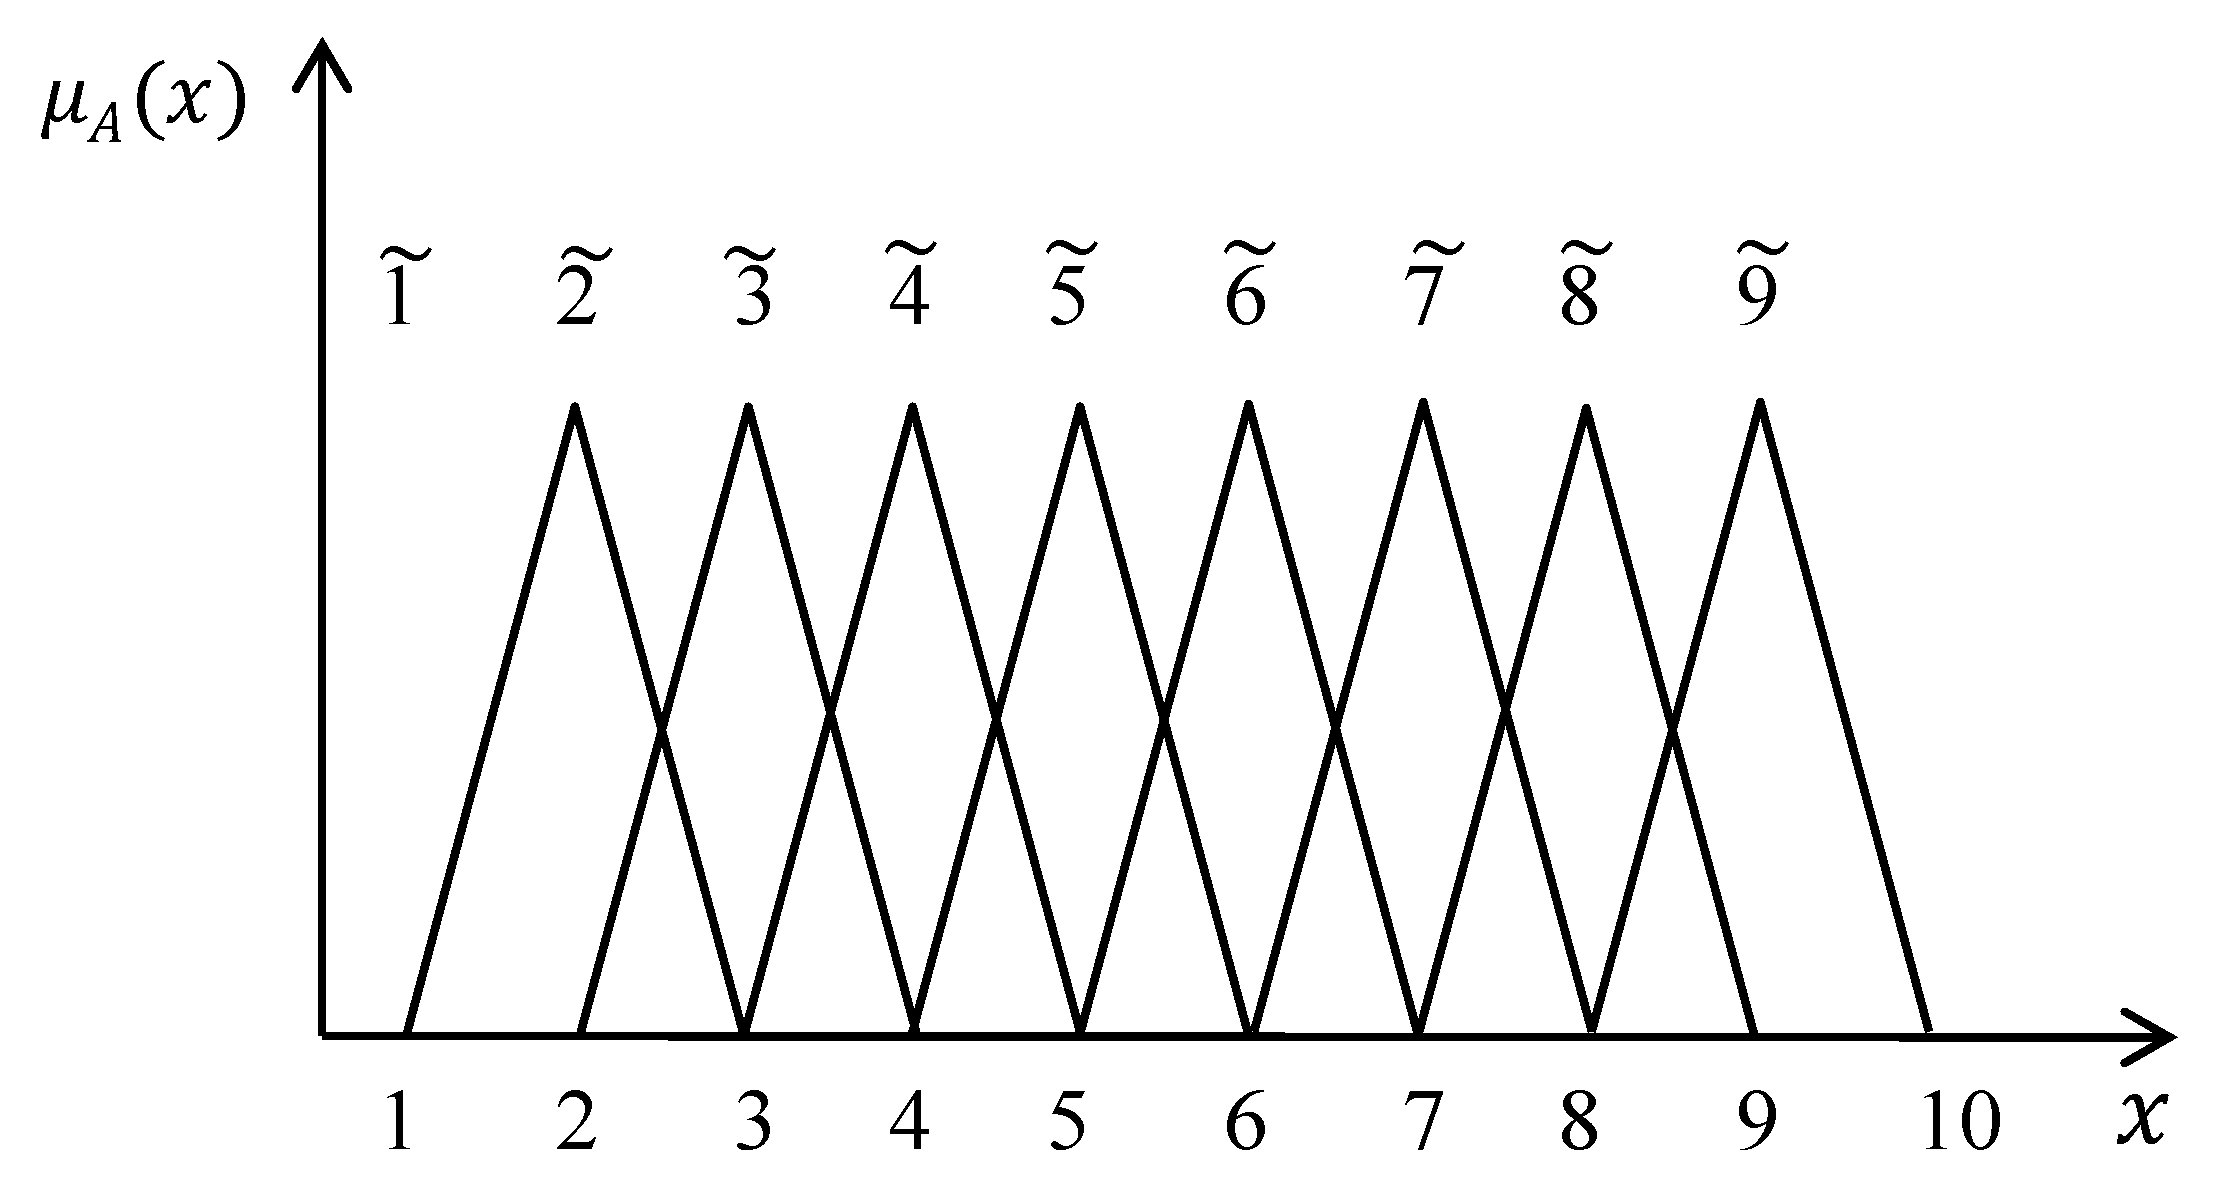
3.2. Fuzzy Analytical Hierarchy Process (FAHP) Method

FAHP method is developed on the basis of the AHP method accompanied with the development of fuzzy theory. AHP has been extensively applied for multi-criteria decision-making and successfully solved many actual decision problems [46]. In spite of great popularity, AHP has been criticized frequently since it cannot fully process and map the perception of decision-makers to inherent uncertainties and inaccuracy related to precise numbers [47]. According to the traditional AHP formula, human judgments are described as precise values (or clear values, according to fuzzy logic terms). However, the human preference model is generally unclear in many actual cases. Decision-makers are likely not willing to or cannot assign specific values for comparison [48]. On account of incomplete and inaccurate information, decision-makers generally cannot determine their preference levels in evaluation. Since some evaluation criteria are subjective and qualitative, decision-makers can hardly express the preference degree and provide accurate pairwise comparison judgment.
The main purpose of this study was to propose a new method under the AHP framework for evaluating the uncertainty and inaccuracy of the system. To be specific, the comparative judgments of decision-makers can be described as fuzzy triangular numbers. Using this new fuzzy prioritizing method, clear priority can be derived from a consistent and inconsistent fuzzy comparison matrix (the standard weight and the scores of evaluating city). Fuzzy modification on AHP is taken as an evaluation technique of urban resource and environment carrying capacity, has been validated by a case study.
FAHP method adopts the membership function to replace the definite values in the traditional AHP method and gives the comparison values between any two factors under the evaluation framework [49]. This study adopted the FAHP method and fuzzy computing to calculate the weighted scores of various factors at different levels. By combining various estimation dimensions, the standard weights and the estimated values using different schemes, the objective evaluation can be obtained.
  • Step 1: Question Description
Using the AHP method, the question that the decision-maker wanted, i.e., the solution or the essence of the object, should first be determined. The aim of this study was to determine the integrated evaluation system of resource and environment carrying capacity. The question can be analyzed in-depth only if have a clear understanding of the nature of the question [50].
  • Step 2: Establishment of the Hierarchical Structure
The hierarchical structure is helpful to analyze the objective problem and determine the evaluation factors at all levels. By selecting the important evaluation factors that satisfy the objective problems, the hierarchical structure can be established based on the interview of experts, questionnaire survey, expert scores, and literature reviews.
  • Step 3: Establishment of Fuzzy Pairwise Comparison Matrix
The questionnaire was scored based on the expert’s subjective opinion in the one-to-one in-depth interviews. The score, ranging from 1 to 9 (Table 1), can be divided into three grades, i.e., low, medium, and high scores, respectively, which also represents the fuzzy membership function (Figure 2). The scores for different semantics can be overlapped. The grading logic in the expert interview should be clarified to avoid recursive errors.
The matrix is established based on the relative importance between any two factors [46,51,52]. The weights of various items of the criterion are measured by fuzzy variables.
A pairwise comparison matrix A is obtained by pairwise comparison of any two factors. Accordingly, n(n−1)/2 pairwise comparisons are required for n factors in the index system. If a ˜ i j denotes the ratio of the factor i to the factor j, the ratio of the factor j to the factor i can be written as the reciprocal of a ˜ i j . Likewise, the lower triangular part of the pairwise matrix is the reciprocal of the triangular part, as shown in Equation (1):
A = [ a ˜ i j ] = [ 1 a ˜ 12 a ˜ 1 n 1 a ˜ 12 1 a ˜ 2 n 1 a ˜ 1 n 1 a ˜ 2 n 1 ]  
According to the expert questionnaire and the evaluation results based on the evaluation criterion, the comparison results of many experts at the same dimension or criterion can be calculated via geometric averaging, as shown in Equation (2):
a ˜ i j = ( a ˜ i j 1 a ˜ i j 2 a ˜ i j k ) 1 k  
where a ˜ i j k denotes the fuzzy number of the k-th expert at the i-th row and the j-th column in the fuzzy matrix, and a ˜ i j denotes the fuzzy number at the i-th row and the j-th column in the fuzzy matrix after expert group decision-making.
  • Step 4: Calculation of the fuzzy weights
The weight of a factor is called the eigenvector. The weights of a triangular fuzzy positive reciprocal matrix can be calculated via the normalization of the geometric mean of column vectors, as shown in Equations (3) and (4):
r ˜ i = ( a ˜ i 1 a ˜ i 2 a ˜ i 1 n ) 1 n
w ˜ i = ( r ˜ 1 r ˜ 2 r ˜ 3 r ˜ n ) 1
where a ˜ i j denotes the fuzzy number at the i-th row and the j-th column in the fuzzy matrix, r ˜ i denotes the column-vector mean of fuzzy numbers, and w ˜ i denotes the fuzzy weight of the i-th factor.
  • Step 5: Fuzzy consistency test
In 1985, Buckley put forward the consistency test method of the fuzzy matrix A ˜ obtained by the traditional AHP-based consistency test proposed by Saaty et al. [46,52], and calculated the median matrix of the fuzzy numbers. When A = [ a i j ] passes the consistency test, that is, when C.I. < 0.1, it can be derived that A ˜ = [ a i j ˜ ] in FAHP shows a similar consistency.
Because the values in the pairwise comparison matrix are generated based on the subjective opinions of experts, establishing consistency between the values is difficult. Therefore, consistency tests must be conducted on these values to obtain the consistency index (C.I.). The C.I. can then be used to examine whether the pairwise comparison generated from the experts’ answers is a consistent matrix.
The C.I. is as derived as follows, as shown in Equation (5):
C . I . = λ m a x n n 1
The maximum eigenvalue of matrix A is λ m a x , and n is the number of evaluation elements.
When the value of C . I . is equal to 0, this indicates that under certain criteria, the importance levels of the nth number of elements are completely identical.
A C . I . value larger than 0 indicates a divergence in the experts’ judgment: the smaller the C . I . values, the more similar the experts’ answers. The optimal C . I . value, as suggested by Saaty, is less than 0.1, and the maximum tolerable deviation is 0.2.
The positive reciprocal matrix generated from the 1-to-9 scale has different random index values R . I . under different levels. Table 2 presents the random index value for each level of AHP.
As shown in (9), for matrices with the same number of levels, the ratio of their C.I. and R.I. is the consistency ratio (C.R.), as shown in Equation (6)
C . R . = C . I . R . I .
When C . R . < 0 . 1 , the consistency level of the matrix is relatively high.
  • Step 6: Fuzzy Solution
Based on the calculation of fuzzy values, each factor is set to a triangular fuzzy number for further analysis. However, since the fuzzy number is not an exact value, the obtained fuzzy numbers should be defuzzified in accordance with fuzzy ranking. The centroid method can effectively solve the problem in most studies. Considering the simplicity and convenience, the centroid method was used in this study. The key to the centroid method is to find the central point of each triangular region, and the representative value is the area central point of fuzzy numbers, as shown in Equation (7):
B N P = [ ( U w i ˜ L w i ˜ ) + ( M w i ˜ L w i ˜ ) ] ÷ 3 + L w i ˜ , i
where i denotes the code of the criterion;
L w i ˜ denotes the low-score mean of the weights of the i-th criterion given by the expert group;
M w i ˜ denotes the medium-score mean of the weights of the i-th criterion given by the expert group;
U w i ˜ denotes the high-score mean of the weights of the i-th criterion given by the expert group.
  • Step 7: Connection of the hierarchies in series and the rank of the schemes
The overall evaluation results of various structures, denoted as R, can be obtained by multiplying the obtained structural selection values E with the calculated weights W, as shown in Equation (8):
R = W × E  
Based on the calculated results of R, the schemes were ranked and evaluated.

3.3. Determination of Evaluation Units

Currently, many methods including the superposition method, grid method and parcel division method have been extensively applied to the divided evaluation units. Reasonable division of evaluation units imposes quite important effects on the evaluation precision [53,54]. Decision-making based on the actual condition of the Huaihe River Eco-economic Belt can contribute to making better urban construction planning and administration. In this study, 25 representative urban administrative districts in the belt were selected as the evaluation units.

3.4. Establishment of the Index System

According to the actual condition of the Huaihe River Eco-economic Belt, this study followed the principles of scientificity and regionality, referred to different evaluation index systems all over the world and investigated the resource status from three aspects. In this stage, the evaluation indexes can be summarized based on literature reviewing and used as the questions in FAHP expert questionnaire. The questionnaire was designed and distributed for inferring the main decision criteria of the current evaluation index system of regional resource and environment carrying capacity. As regard to the selection of expert group, Dalkey et al. pointed out that the group with at least 10 experts can reduce the group error to the minimum. The group with high homogeneity should include 15~30 experts, while the high-heterogeneity group with 5~10 experts is sufficient [55].
In this study, there were 15 experts in the expert group, including 3 experts from urban and rural planning government departments, 4 experts from the industrial circle (local opinion leaders) or familiar with the related business fields, 4 PhD students regarding territorial space planning, environmental landscape and reginal development, and 4 experts in academic circles of environmental resource, landscape, regional development and metering method. The 15 experts all understood the local range in the case study and the evaluation of resource and environment carrying capacity to a certain degree. In the interview of index selection, the experts in the planning committee hope the complex system can be simplified and the simple indexes can be provided from the perspectives of urban decision-makers for the evaluation of regional environment resource carrying capacity.
The evaluation index system of regional resource and environment carrying capacity is established based on the natural environment and social and economic conditions. The objective layer of resource and environment carrying capacity mainly reflects the adjustment between society and resources.
The reference basis of the evaluation indices were the National Environmental Protection Standards of the People’s Republic of China-Technical Criterion for Ecosystem Status Evaluation (HJ 192—2015) [56]. The dimension layer includes the resource abundance and the environmental capacity. The resource abundance reflects a city’s resource carrying capacity. In terms of land indexes, the cultivated and construction lands are tightly correlated with people’s production and lives, and water resources are the foundation and key of urban and rural development [57]. Therefore, this index system started from three perspectives, i.e., cultivated land, construction land and water resources, and set three indexes at the index layer, i.e., per capita cultivated land, per capita construction land, and per capita water resource. The environmental capacity represents a city’s ecological carrying capacity. Environmental conditions mainly include the natural environment and economic and social conditions. The natural environment acts as the main index at the dimension layer of environment capacity [58], and per capita forest land area was selected as the main research object [59]. In terms of the social and economic environment, population density and urbanization rate were selected as main indexes. Table 3 lists the integrated evaluation index system of resource and environment carrying capacity in detail [60].

3.5. Data Source and Standardized Processing of the Indexes

The data for integrated evaluation of resource and environment carrying capacity of the Huaihe River Eco-economic Belt is mainly sourced from the 2020 Statistical Yearbooks of Jiangsu, Anhui, Shandong, Henan and Hubei, and the 2020 Stational Yearbooks of the prefecture-level city in the belt [61].
Many indexes involved in the evaluation of resource and environment carrying capacity differ greatly in the unit and cannot be directly and effectively compared. In combination with actual characteristics, this study used the maximum standardization method for original data processing. First, the positive and negative inclination of each index should be determined. Based on expert discussions, with a certain range of resource and environment carrying capacity, the regional resource and environment carrying capacity is positively correlated with the region’s cultivated land quantity, water resource capacity, forestland area, construction land area and urbanization, but shows a negative correlation with the region’s population density. The positive and negative tendency indexes can be calculated as below:
The positive-tendency index can be calculated as:
N i = M i M m a x
The negative-tendency index can be calculated as:
N i = M m i n M i
where Mi denotes the original value of the index before normalization, Ni denotes the value of the index after positive and negative normalization, Mmin denotes the minimum among the same types of indexes and Mmax denotes the maximum among the same types of indexes. Based on the maximum standardization method, the processed data were calculated according to Equations (9) and (10), and the results are listed in Table A2 (Appendix A).

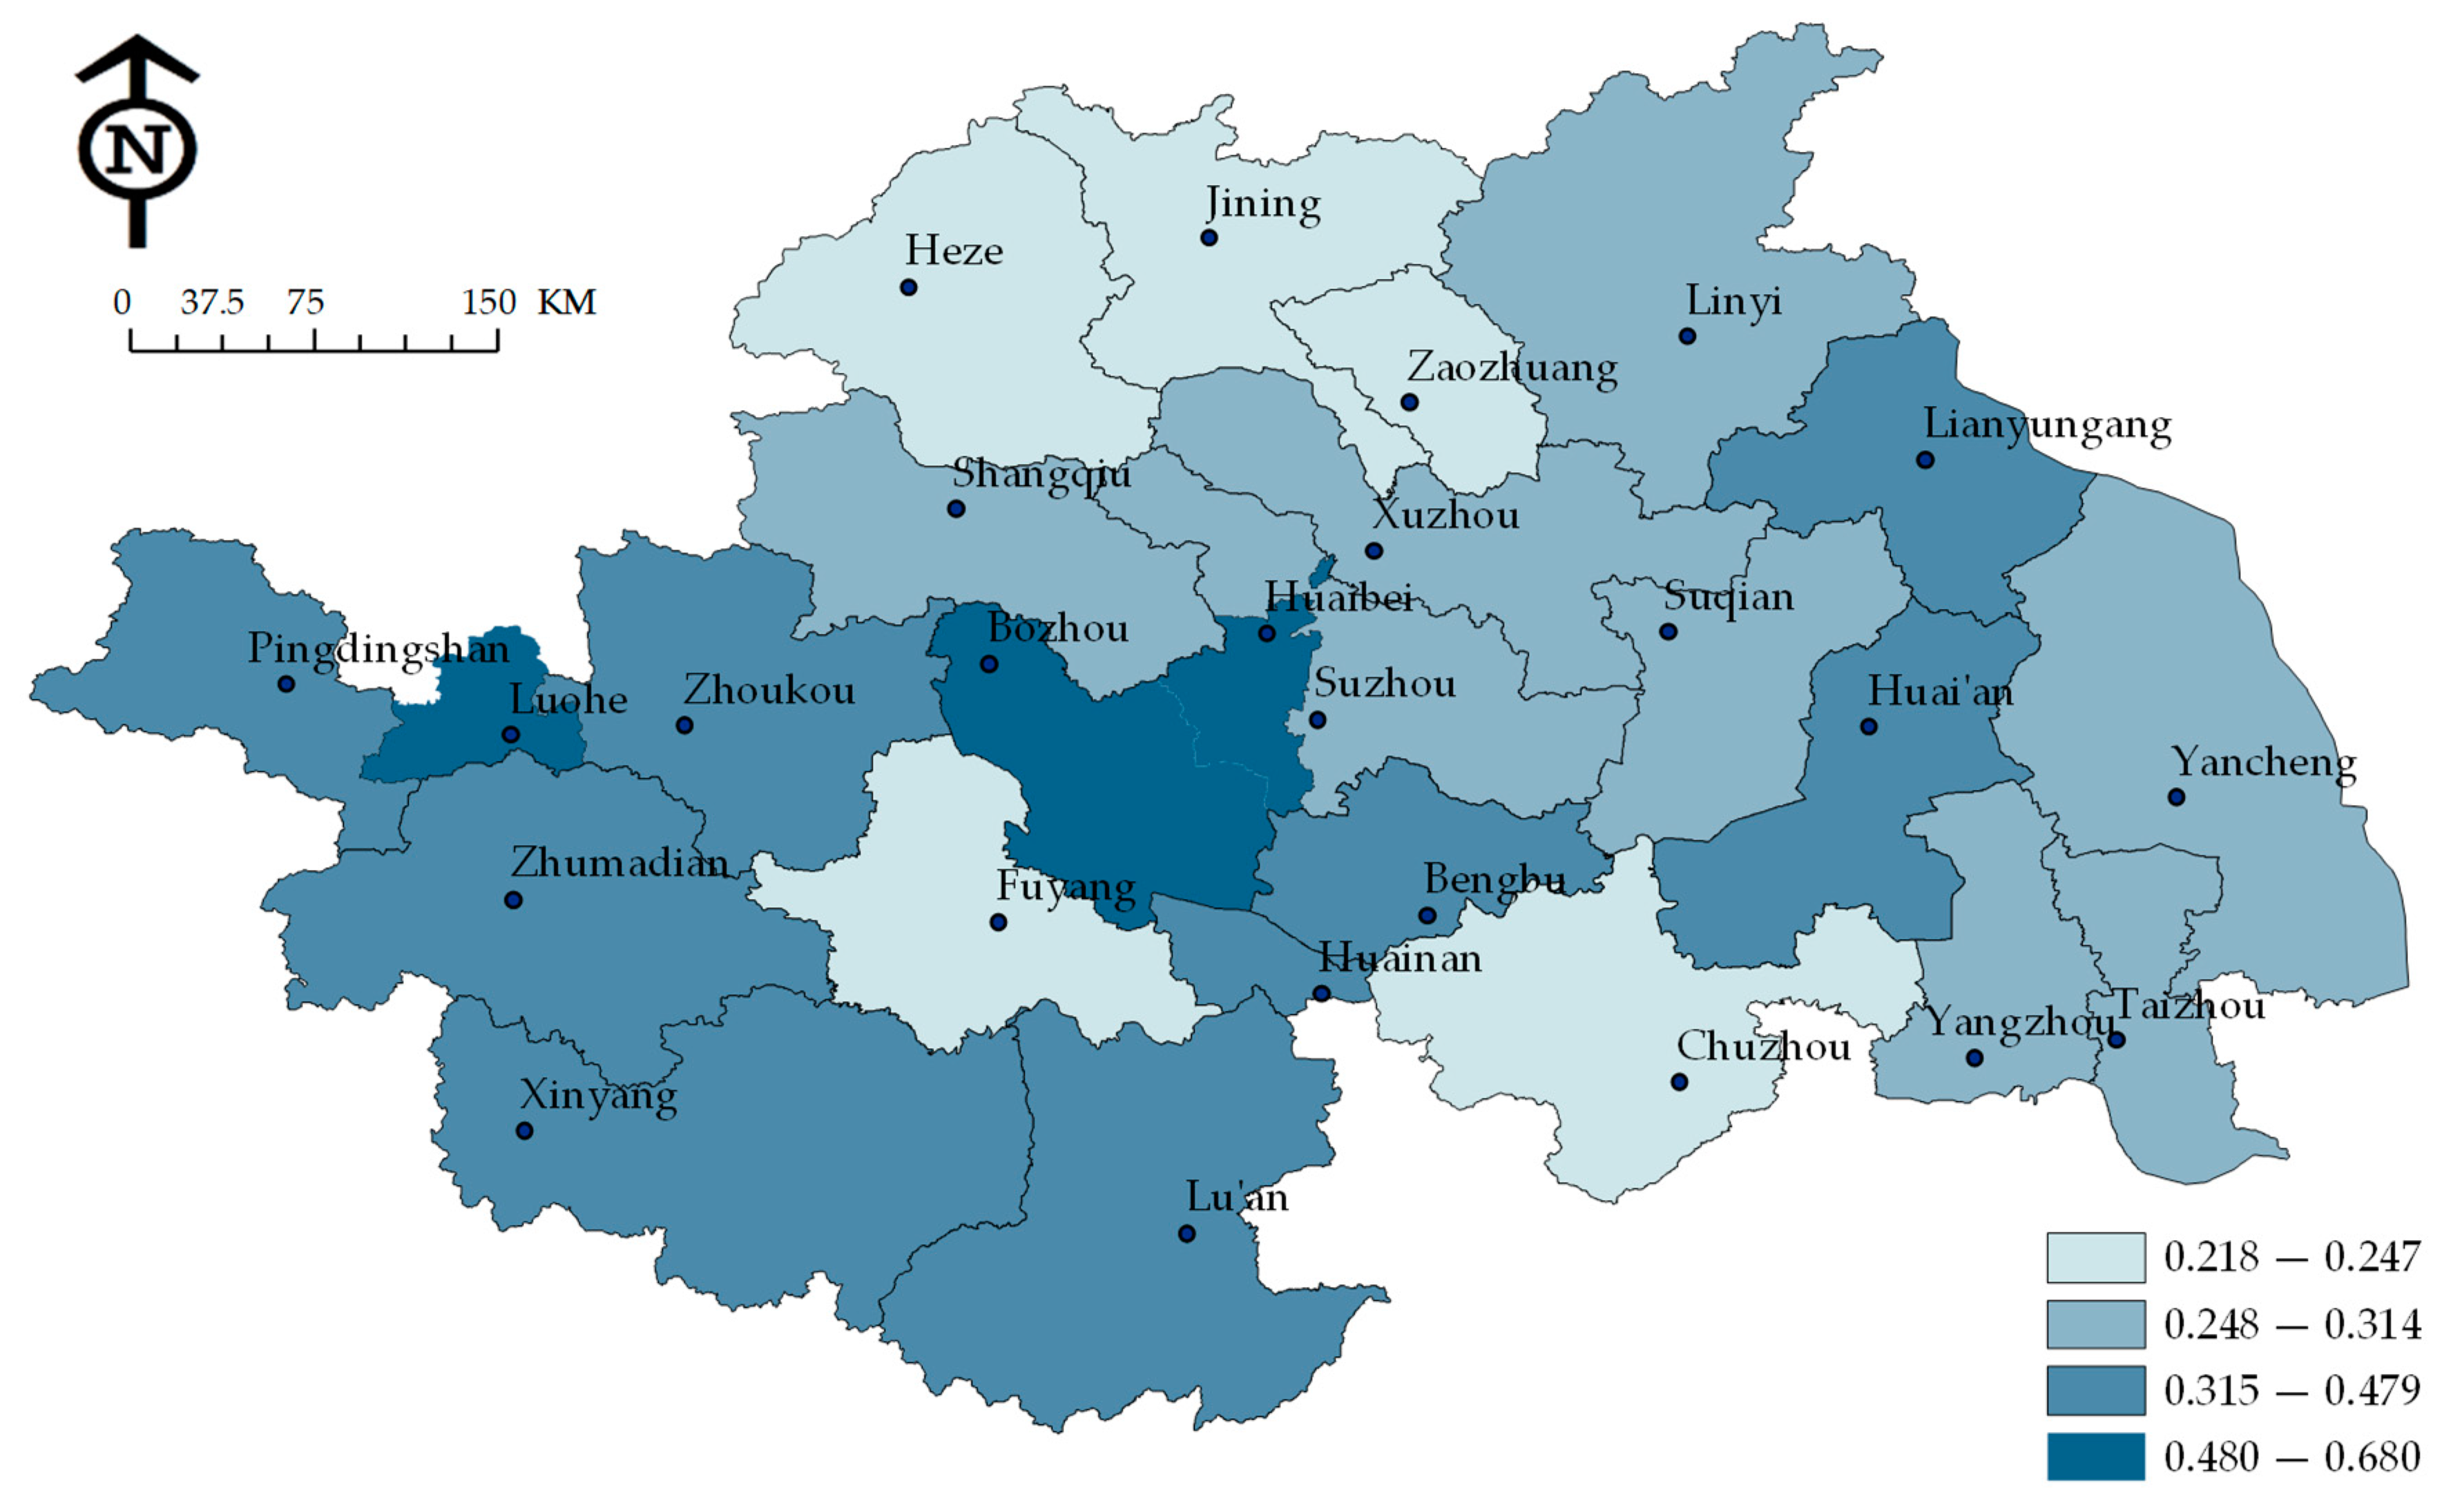
4. Results and Discussions

We compared Shen et al.’s urban carrying capacity evaluation system [62], Song et al.’s Water Resources Carrying Capacity system [39], and Lv et al.’s regional resource carrying capacity. We found that the above scholars only pay attention to a single resource, such as water resources [35], urban green space system [11,63,64], urban land expansion, [9,31,58] and ecological system [22,23] isometric. After compiling the literature and interviewing with expert groups, we have summarized a new evaluation system. In this section, the integrated evaluations of resource and environment carrying capacity are analyzed by four aspects: index weights, resource condition, natural environment and urbanization development.

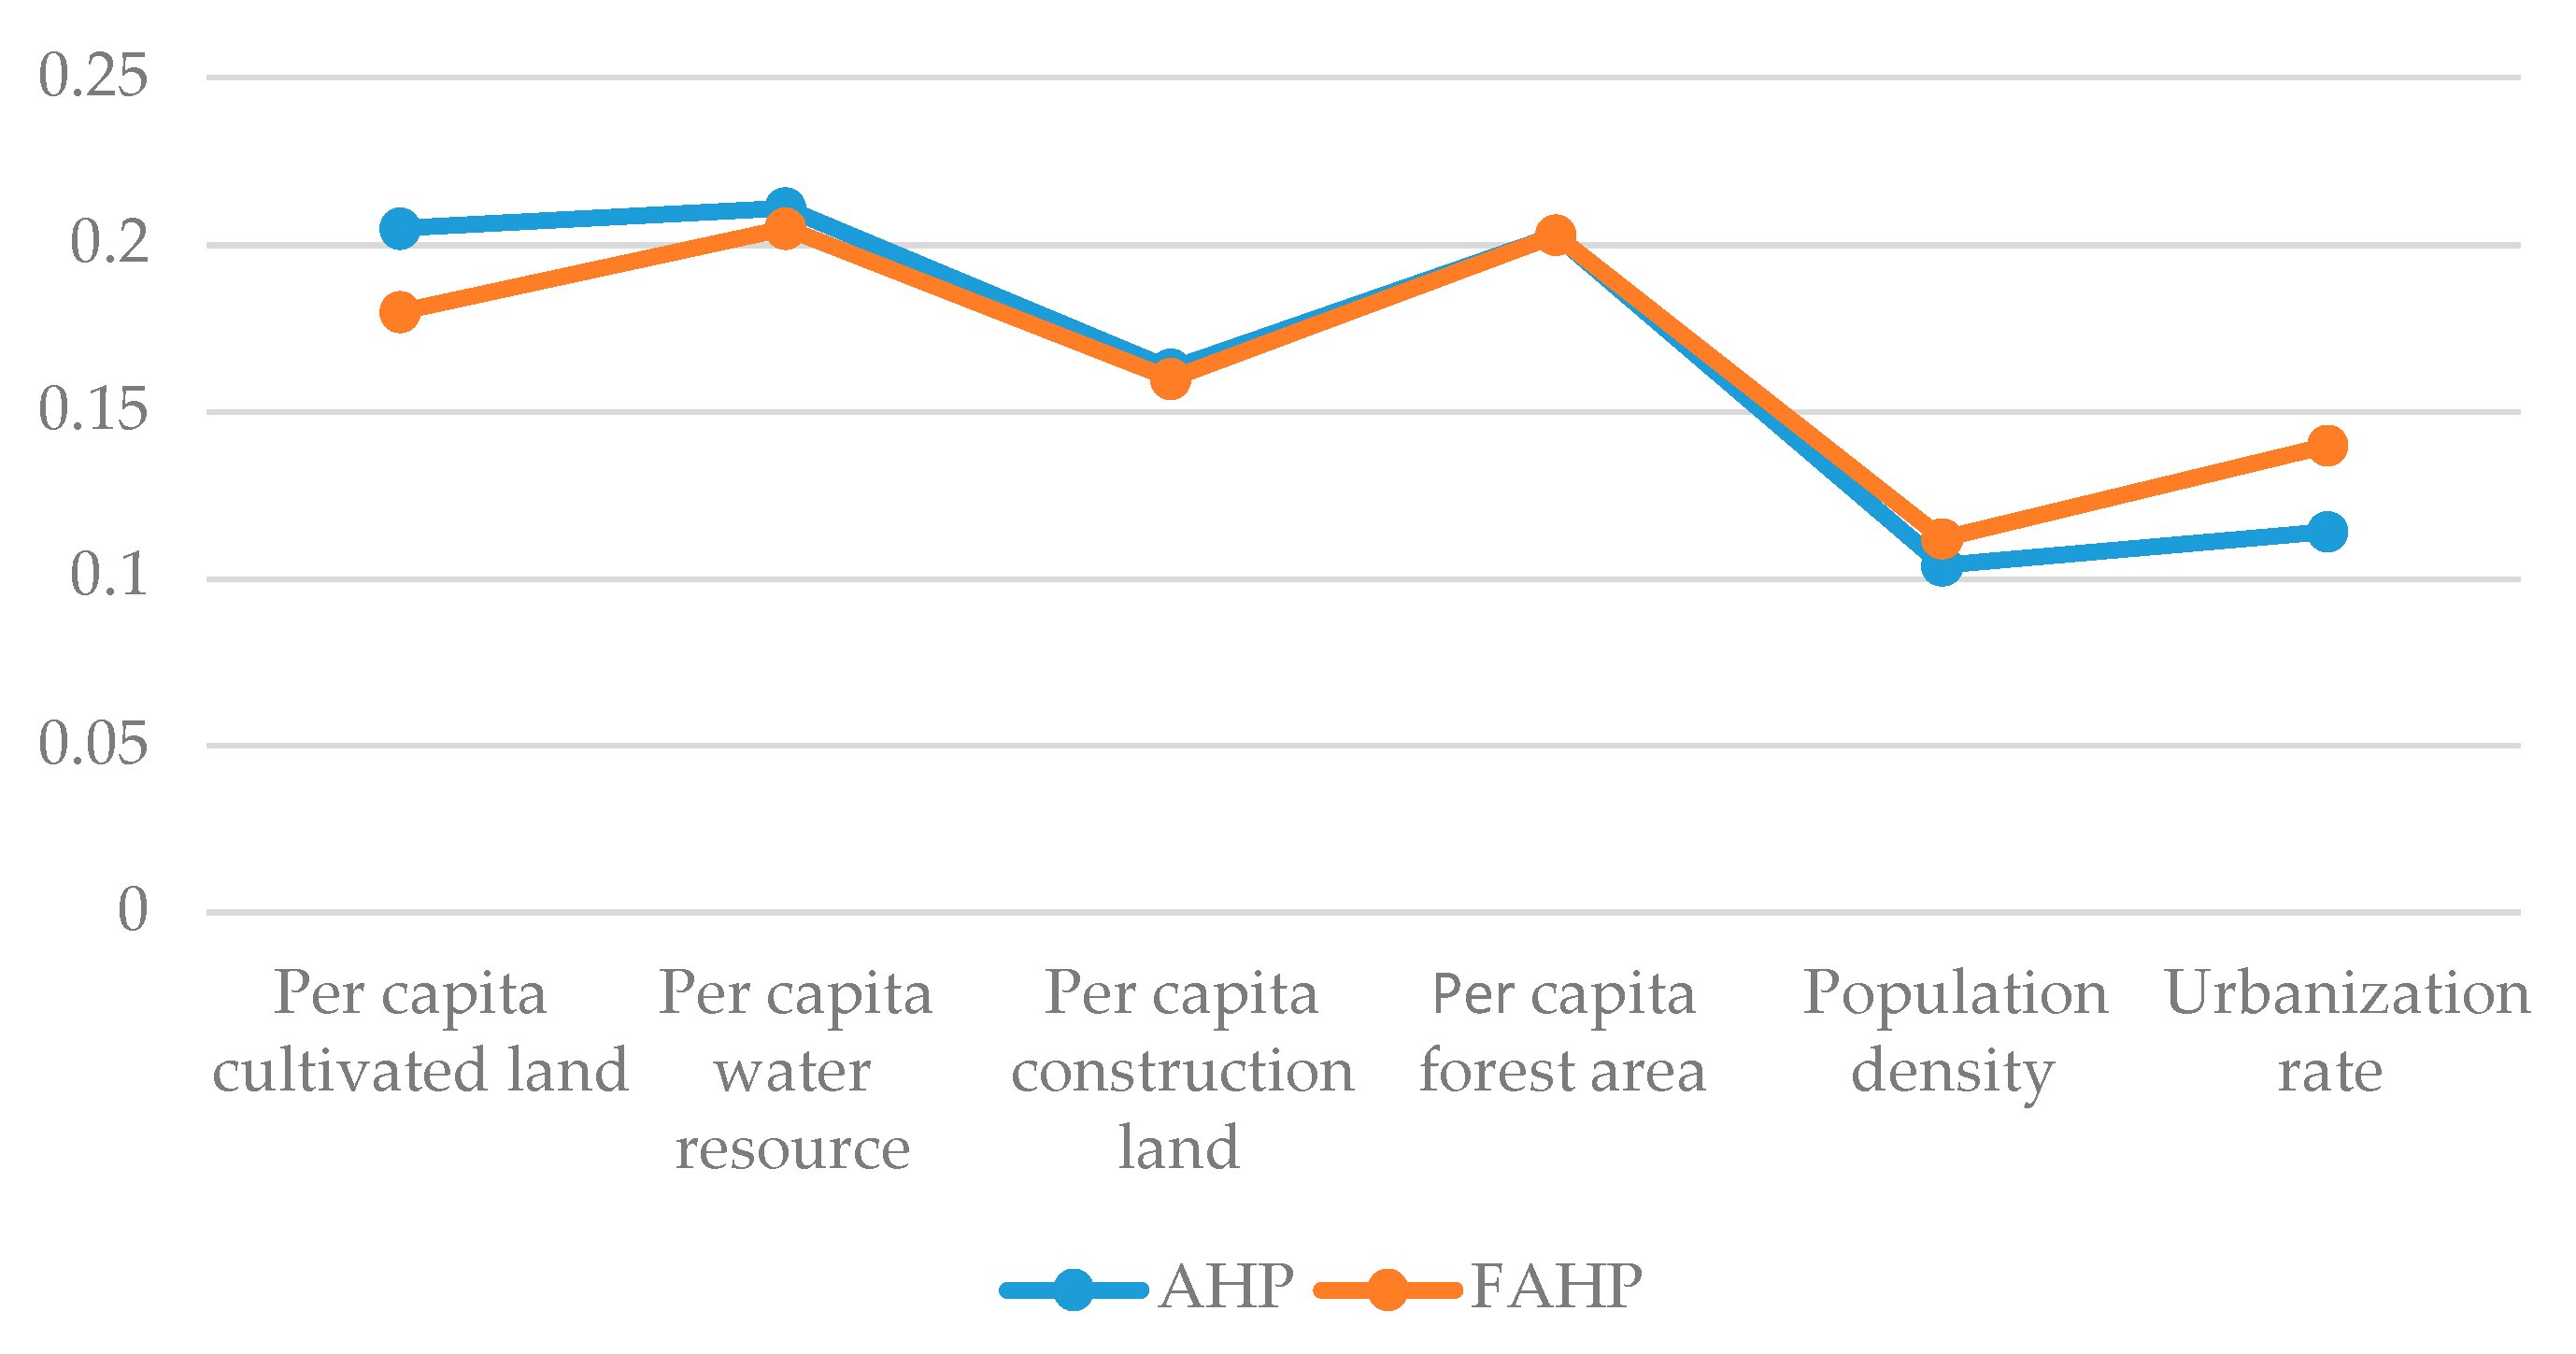
4.1. Determination of the Index Weights

The current urban sustainability assessment and grading tools were proposed in 2004, and then a series of grading tools such as the British assessment and award scheme for improving sustainability in civil engineering and the public realm (CEEQUAL, UK) [65], China’s Ecological Cities, China’s Ecological Garden, Enterprise and Green Neighborhood were introduced. In 2006, Communities, Comprehensive Assessment System for Built Environment Efficiency (Comprehensive Assessment System for Built Environment Efficiency, Tokyo, Japan) and EnviroDevelopment (Urban Development Institute of Australia, Brisbane, Australia) were proposed. Different grading systems in different countries were established based on the early building rating systems, i.e., Building Research Establishment Environmental Assessment Method (Dutch Green Building Council, Haag, The Netherland), Leadership in Energy and Environmental Design (Green Building Council, Dubai, Emirates) and Green Star (Green Building Council, Cape Town, South Africa). The above-described applications have been developed on a global scale for environment analysis [28]. In terms of method application, typical grading tools or systems by previous scholars in the existing literature mainly include the item lists in accordance with main category organizations such as site (position, relation, planning and sustainability), resources (energy, water and materials), infrastructure, waste management, transport, land use planning, social and economic welfare and innovation (design and technology), which can evaluate the sustainability of development. Different grading methods have different methods, to be specific, the sustainability evaluation in most grading systems is performed based on a 100-score or higher-score system, with the use of identical or different weighting methods, while some systems adopt the percentages of scores. The qualitative methods for determining which category and standard should be included in the system and weight distribution are subjective, lacking of objectivity [64].
Firstly, the overall evaluation index system was divided into three levels, i.e., objective layer, dimension layer, and index layer. By comparing the importance between every two indexes, the determination matrix of the eigenvectors corresponding to the maximum eigenvalues was established, and the weight of the importance of each scheme was determined. Then, the language survey results at an individual scale were fuzzified and the weights corresponding to the importance degrees of the schemes were obtained so as to provide a more humanized foundation for the optimization of the scheme. Table 4 lists the weights of various evaluation factors in the index system of resource and environment carrying capacity.
Comparing the AHP and FAHP sensitivity analysis results, it can be seen that, a larger proportion of resource abundance than environment capacity overall remained unchanged on the dimension scale; while on the index level, the weights of per capita cultivated land, per capita water resource, and per capita construction land decreased by 0.025, 0.006 and 0.003, respectively; the proportion of per capita forest area remained unchanged; the weights of population density and urbanization rate increased by 0.008 and 0.026, respectively. The urbanization rate, per capita cultivated land, and population density showed the most significant changes. Figure 3 reflects the sensitivity of the differences of various indexes, from which it can be observed that the weights calculated by fuzzy membership function with FAHP can well reproduce true decision-making and thinking process of experts.
The calculation results with FAHP were selected for further analysis since they were closer to true decision-making results by the expert group. From Table 4, it can be seen that the weight of the resource abundance at the dimension layer equals 0.545, which exceeds the weight of the environment capacity of 0.455, suggesting greater importance of the resource abundance than the environmental capacity at the dimension layer. The resource endowment should be attached with great importance when formulating the countermeasures for the resource and environment carrying capacity in the belt.
The city with a higher resource endowment shows greater resource and environment carrying capacity. To be specific, the weight of per capita water resource is highest among the values of all factors at the index layer, followed by the weight of per capita forest area and the weight of per capita cultivated land area, which are 0.205, 0.203 and 0.180, respectively. Accordingly, the index of per capita water resource is quite important for the evaluation of resource and environment carrying capacity, and great attention should be paid to the development and protection of water resources when overall enhancing the regional resource and environment carrying capacity.
In this study, using the linearly weighted sum method, the standardized results and the weights calculated via the AHP method were combined to calculate the comprehensive index values. The overall resource and environment carrying capacities of 25 cities in the Huaihe River Eco-economic Belt were calculated. Meanwhile, using the Jenks natural breaks classification method [66], In ArcGIS, a geographic information system (GIS) software [67], classification can be conducted based on inherent natural grouping of data. Then, identifying the classification interval can achieve the most appropriate grouping of similar values so as to maximize the difference among different classes [68]. In addition, factors will be divided into several categories and the boundaries are set at the positions with great difference [69,70].
The calculated overall carrying capacities can be divided into four grades, i.e., high (0.480~0.680), medium (0.314~0.479), medium-to-low (0.247~0.313), and low (0.217~0.246). Table 5 shows the calculated evaluation indexes of resource and environment carrying capacity, as well as the grading results.
From Table 5, it can be seen the overall resource and environment carrying capacity of Huaibei is highest, 0.680, and ranks at an advanced level in the whole Huaihe River Eco-economic Belt. The advanced experiences can be used for reference by the other cities. The overall resource and environment carrying capacity of Bozhou is 0.610 and ranks second. The overall resource and environment carrying capacity of Heze is the lowest, 0.218.
Figure 4 shows the visual processing results of geo-spatial variation using In ArcGIS. Among the 25 cities in the Huaihe River Eco-economic Belt under evaluation, Huaibei, Bozhou and Luohe, which are in a high-level space, are located in the middle reaches of Huaihe River, as listed in Table A3 of Appendix A.
The three cities rank the first level in terms of overall resource and environment carrying capacity by taking into account various indexes rather than a single index. For example, Huaibei, with the highest overall evaluation score of 0.68, ranks first among all cities in the belt in terms of score distribution uniformity. Bozhou, with an overall evaluation score of 0.61, ranks second place and shows absolute advantages in terms of per capita water resources (0.205), suggesting that the industrial policies related to water resource should be actively developed in this city. Luohe, with an overall consideration score of 0.606, ranks third place and shows absolute advantages in terms of per capita construction land (0.205); however, the construction land in Luohe reduces the score of per capita forest area. Considering the weak position of forest area, it is recommended to utilize urban road greenbelts and parks and reduce the density of buildings for enhancing Luohe’s overall resource and environment carrying capacity. Jining, Fuyang and Heze, at low levels, are classified into low-potential regions because of the limitations in various indexes. The improvement direction in making policies can be adjusted in accordance with the present index system.

4.2. Resource Condition

As described above, the resource abundance at the dimension layer in the integrated evaluation system includes threes indexes, i.e., per capita cultivated land, per capita water resource, and per capita construction land, which suggests that resource endowment can significantly affect the regional resource and environment carrying capacity, as listed in Table A1 of Appendix A. In 2019, per capita cultivated land, per capita water resource, and per capita construction land of Huaibei are 0.254 hectares/person, 1300 m3/person, and 86.34 hectares/10,000 person, respectively. These three high-level indexes rank the first among the 25 cities in the belt, with remarkable advantages. The three indexes of Bozhou in 2019 are 0.099 hectares/person, 1600 m3/person, and 171.22 hectares/10,000 person, respectively, which are also at a high level and rank second place. The third is Luohe, with the values of per capita cultivated land, per capita water resource, and per capita construction land of 0.332 hectares/person, 1000 m3/person, and 511.16 hectares/10,000 person, respectively. Overall, the weights of per capita water resource and per capita cultivated land are large in the integrated evaluation system of resource and environment carrying capacity. Huaibei, Bozhou and Luohe show certain advantages in resource endowment.

4.3. Natural Environment

The forest area within a certain region can reflect the assimilation capacity of the natural environment on air pollution in this region. In the present integrated evaluation system, the weight of per capita forest area occupies 20.3% of the overall weight and ranks second among all indexes, fully confirming its important effect on resource and environment carrying capacity. From the Table A1 of Appendix A, in 2019, the per capita forest areas of Huaibei and Bozhou are 0.142 hectares/person and 0.137 hectares/person, respectively, ranking the top two places among 25 cities. However, the per capita forest areas of Fuyang and Taizhou are only 0.0008 hectares/person and 0.0005 hectares/person, respectively, with a great difference from the condition in Huaibei. Overall, Huaibei and Bozhou exhibit significant advantages in natural resources.

4.4. Analysis of Urbanization Development

Resource and environment carrying capacity is subjected to the effect of social and economic development level to a certain degree. When the social and economic development level exceeds the intensity of territorial development, the environment will get steadily worse and the ecological system will be destroyed, thereby reducing the resource and environment carrying capacity. According to the analysis of the urbanization rate, when the construction land plan cannot be properly matched with the population, it will cause waste of land resources and population loss and will also have a certain impact on the carrying capacity of resources and the environment. Resource and environment carrying capacity can be stable only with consistency between social and economic development level and territorial development intensity. From the Table A1 of Appendix A, in 2019, the urbanization rate of Yangzhou is 68.2%, which ranks the first among the 25 cities, followed by Taizhou and Xuzhou, with the urbanization rate of 66.8% and 66.7%, respectively. By contrast, the urbanization rate of Bozhou is only 42.44%, which lags far behind the advanced level. Overall, the urbanization rates of the three cities are at a medium level, and high-quality urbanization will be the focus in the future.

5. Conclusions

The integrated resource and environment carrying capacity evaluation started from the perspective of per capita environment and resource. A concise evaluation system was established by overall considering the opinions of the expert group. The present evaluation system can adopt annual statistics by the government sectors as a measurement basis. Urban decision-makers can conveniently use this study for the timely evaluation of regional governance. The evaluation results can provide guidance for the decision-making on urban development.
This study selected the Huaihe River Eco-economic Belt for empirical study. According to the natural, resource and environmental conditions of 25 cities in the Huaihe River Eco-economic Belt, the integrated evaluation index system consisting of two factors at the dimension level, i.e., resource abundance and environmental capacity, was established. Then, 6 specific indexes were selected for calculation based on the FAHP method and linear weighting. After empirical research, the complex system can be simplified, and the simple indexes can be provided from the perspectives of urban decision-makers for the evaluation of regional environment re-source carrying capacity. Finally, the overall evaluation results were obtained. The results displayed the resource and environment carrying capacities of 25 cities such as Huai’an, Bengbu and Xinyang, and reflected the social and economic development and resource and environment carrying capacities of regional representative cities.
Based on the overall resource and environment evaluation results, it can be observed that Huaibei, Bozhou and Luohe show certain advantages, with high resource and environment carrying capacity; Zhumadian, Xinyang, Huai’an, Zhoukou, Lianyungang, Huainan, Bengbu, Pingdingshan and Lu’an are at a moderate level. Through analysis, it can be concluded that resource, natural environment, and social and economic conditions significantly affect the resource and environment carrying capacity. Therefore, more emphasis should be laid on the resource and environment carrying capacity of the Huaihe River Eco-economic Belt from the perspective of resource, environment, and economy.
Water resource protection system should be perfected and the ecological network framework with compound functions should be established. Urban water pollution prevention system should be improved, while wastewater and pollution treatment efficiency and the recycling level of reuse water should be enhanced. By effectively controlling water pollution resources, the water ecosystem should be gradually restored and protected to constantly improve water quality in the rivers and enhance the sustainability of the regional resources. The development and utilization of land resources should follow the principle of making innovation on increments and optimizing the inventory, make efforts to promote the transfer of land factors in rural-urban continuums and rural areas, achieve the optimal allocation of rural land resources, and solve a series of problems induced by Rural Workers into Cities such as resident, employment and social insurance. The construction land should be developed more intensively and finely. Smart growth should be encouraged, and city boundaries should be strictly controlled.
From the analysis of urbanization development, the future planning of the Huaihe River Eco-economic Belt should comprehensively consider the regional social and economic development level as well as the consistency of population size and distribution with resource and environment and formulate the plans suitable for regional development. In terms of resource, environment and ecological protection, the government should actively promulgate the policies related to protection and treatment, enlarge public participation, and broaden supervision and administration platforms.
This study adopted the fuzzy analytic hierarchy process (FAHP) to overcome the limitations in the traditional AHP framework. In addition, the concept of membership function was used for replacing traditional clear values and expressing semantic feedback of expert decisions. By introducing fuzzy theory with fuzzy semantics scale, fuzzy evaluation of expert group cognition was used to lower the subjective difference and preference induced by individual semantic fuzziness. Using the proposed method, expert group decision-making can grasp and master decision-making problems in a more humanized way, thereby making the overall evaluation results much closer to true results. However, the present evaluation was still based on the overall subjective preferences of all experts. In future studies, it is suggested that more experts in different domains should be invited for group decision-making. Meanwhile, more complex social and economic factors can be qualitatively analyzed to overcome the shortcomings of quantitative analysis.
In this study, the hierarchical framework, the dimensions and the indexes of resource and environment carrying capacity were determined via data collection and investigation. On that basis, the feasibility of the established evaluation framework of the 25 cities in the Huaihe River Eco-economic Belt for the empirical study was validated. The empirical results of the evaluation indexes weights can help to promote cross-city governance in the future from the aspects of resource and environment. The present evaluation system can also provide an important basis for the government sectors in analyzing urban resource and environment carrying capacity.

Author Contributions

Conceptualization, W.-L.H. and C.Z.; Formal analysis, X.S.; Funding acquisition, W.-L.H., H.X. and C.Z.; Investigation, X.S. and Y.-C.S.; Methodology, H.X., C.Z. and H.-L.L.; Project administration, W.-L.H.; Resources, C.Z. and H.-L.L.; Software, H.X., H.-L.L. and Y.-C.S.; Supervision, W.-L.H.; Writing—original draft, X.S.; Writing—review & editing, Y.-C.S. All authors have read and agreed to the published version of the manuscript.

Funding

Humanities and Social Sciences Foundation of the Chinese Ministry of Education (Grant No.20YJAGAT002, 20YJA630087, 21YJCZH156); 2020 Major Project about the Philosophy and Social Sciences of Higher education in Jiangsu Province, China. (Grant Number:2020SJZDA043).

Institutional Review Board Statement

Not applicable.

Informed Consent Statement

Not applicable.

Data Availability Statement

The data presented in this study are available on request from the corresponding author.

Acknowledgments

We would like to thank anonymous reviewers for their valuable comments and suggestions for improving this paper.

Conflicts of Interest

The authors declare no conflict of interest.

Appendix A

Table A1. Raw data of various indicators of the evaluation cities.
CityPer Capita Cultivated Land
(ha/Person)
Per Capita Water Resource (HUNDRED Million m3/Person)Per Capita Construction Land (ha/per Ten Thousand Person)Per Capita Forest Area (ha/per Ten Thousand Person)Population Density (ha/per Ten Thousand Person)Urbanization Rate
(%)
Huai’an963.710.0740280.6840.082033.3263.50
Yancheng1155.980.072121.0917.022348.6264.90
Suqian873.190.052818.2237.661725.8661.10
Xuzhou692.470.053828.8928.101333.0466.70
Lianyungang868.120.0326400.0032.331688.1063.60
Yangzhou627.680.054335.8311.141448.8968.20
Taizhou635.740.040335.165.031248.2566.80
Zaozhuang600.900.025236.1096.791159.4259.20
Ji’ning704.950.012421.9069.801302.9459.69
Linyi785.840.043018.75178.811611.6152.75
Heze941.620.01016.7463.541393.6950.63
Bengbu1108.560.059262.59416.871744.0658.58
Huainan1083.780.057961.19407.561705.0865.04
Fuyang412.570.030318.288.51669.9444.62
Lu’an945.310.075590.70422.182076.3747.09
Bozhou992.840.1648171.221368.042935.7842.22
Suzhou1209.650.052828.49290.531469.1243.96
Huaibei2535.370.131286.341424.584311.4565.88
Chuzhou406.170.019231.4119.39660.9654.54
Xinyang1108.980.0973281.16273.372073.9948.98
Zhumadian1205.900.0979308.65607.522684.4044.63
Zhoukou1097.300.0785235.97186.451740.8844.36
Luohe3222.520.1004511.16150.064479.7853.97
Shangqiu260.500.007197.719.41367.2644.83
Pingdingshan1414.190.0356245.36146.392128.0355.50
Table A2. Standardized results of the evaluation indexes of resource and environment carrying capacity.
CityC1C2C3C4C5C6
Huai’an0.300.450.550.030.180.93
Yancheng0.360.440.040.010.160.95
Suqian0.270.320.040.030.210.90
Xuzhou0.210.330.060.020.280.98
Lianyungang0.270.200.780.020.220.93
Yangzhou0.190.330.070.010.251.00
Taizhou0.200.240.070.000.290.98
Zaozhuang0.190.150.070.070.320.87
Ji’ning0.220.080.040.050.280.88
Linyi0.240.260.040.130.230.77
Heze0.290.090.030.040.260.74
Bengbu0.340.360.120.290.210.86
Huainan0.340.350.120.290.220.95
Fuyang0.130.180.040.010.550.65
Lu’an0.290.460.180.300.180.69
Bozhou0.311.000.330.960.130.62
Suzhou0.380.320.060.200.250.64
Huaibei0.790.800.171.000.090.97
Chuzhou0.130.120.060.010.560.80
Xinyang0.340.590.550.190.180.72
Zhumadian0.370.590.600.430.140.65
Zhoukou0.340.480.460.130.210.65
Luohe1.000.611.000.110.080.79
Shangqiu0.080.040.190.011.000.66
Pingdingshan0.440.220.480.100.170.81
Table A3. Evaluation index value and grade of resource and environment carrying capacity (index level).
OrderCityC1C2C3C4C5C6Overall Values
1Huaibei0.1420.1630.0270.2030.0100.1350.680
2Bozhou0.0550.2050.0540.1950.0140.0870.610
3Luohe0.1800.1250.1600.0210.0090.1110.606
4Zhumadian0.0670.1220.0970.0870.0150.0920.479
5Xinyang0.0620.1210.0880.0390.0200.1010.430
6Huai’an0.0540.0920.0880.0060.0200.1300.390
7Zhoukou0.0610.0970.0740.0270.0240.0910.374
8Lianyungang0.0490.0400.1250.0050.0240.1310.374
9Huainan0.0610.0720.0190.0580.0240.1340.367
10Bengbu0.0620.0740.0200.0590.0240.1200.358
11Pingdingshan0.0790.0440.0770.0210.0190.1140.354
12Lu’an0.0530.0940.0280.0600.0200.0970.352
13Yancheng0.0650.0900.0070.0020.0180.1330.314
14Suzhou0.0680.0660.0090.0410.0280.0900.302
15Xuzhou0.0390.0670.0090.0040.0310.1370.286
16Yangzhou0.0350.0670.0110.0020.0280.1400.284
17Suqian0.0490.0660.0060.0050.0240.1250.275
18Taizhou0.0360.0500.0110.0010.0330.1370.267
19Linyi0.0440.0530.0060.0260.0260.1080.263
20Shangqiu0.0150.0090.0310.0010.1120.0920.259
21Zaozhuang0.0340.0310.0110.0140.0360.1220.247
22Chuzhou0.0230.0240.0100.0030.0620.1120.233
23Jining0.0390.0150.0070.0100.0320.1230.226
24Fuyang0.0230.0380.0060.0010.0610.0920.221
25Heze0.0530.0170.0050.0090.0300.1040.218

References

  1. Wang, Z. Land Spatial Development Based on Carrying Capacity, Land Development Potential, and Efficiency of Urban Agglomerations in China. Sustainability 2018, 10, 4701. [Google Scholar] [CrossRef] [Green Version]
  2. Gluch, P.; Månsson, S. Taking Lead for Sustainability: Environmental Managers as Institutional Entrepreneurs. Sustainability 2021, 13, 4022. [Google Scholar] [CrossRef]
  3. Li, R.-m.; Yin, Z.-q.; Wang, Y.; Li, X.-l.; Liu, Q.; Gao, M.-m. Geological resources and environmental carrying capacity evaluation review, theory, and practice in China. China Geol. 2018, 1, 556–565. [Google Scholar] [CrossRef]
  4. Liu, Y.; Zhou, Y. Territory spatial planning and national governance system in China. Land Use Policy 2021, 102, 105288. [Google Scholar] [CrossRef]
  5. Zhang, C.; Wang, C.; Mao, G.; Wang, M.; Hsu, W.-L. An Empirical Study on the Ecological Economy of the Huai River in China. Water 2020, 12, 2162. [Google Scholar] [CrossRef]
  6. Wang, C.; Long, R.; Mao, G.; Cao, L.; Hsu, W.-L. Spatiotemporal Sensitivity Characteristics of Water Resources in Huai River Ecological–Economic Belt, China. Sens. Mater. 2021, 33, 1473–1483. [Google Scholar] [CrossRef]
  7. Zhang, G.; Luo, S.; Jing, Z.; Wei, S.; Ma, Y. Evaluation and Forewarning Management of Regional Resources and Environment Carrying Capacity: A Case Study of Hefei City, Anhui Province, China. Sustainability 2020, 12, 1637. [Google Scholar] [CrossRef] [Green Version]
  8. Liu, Z.; Ren, Y.; Shen, L.; Liao, X.; Wei, X.; Wang, J. Analysis on the effectiveness of indicators for evaluating urban carrying capacity: A popularity-suitability perspective. J. Clean. Prod. 2020, 246, 119019. [Google Scholar] [CrossRef]
  9. Rees, W.E. Ecological footprints and appropriated carrying capacity: What urban economics leaves out. Environ. Urban. 1992, 4, 121–130. [Google Scholar] [CrossRef]
  10. Chapman, E.J.; Byron, C.J. The flexible application of carrying capacity in ecology. Glob. Ecol. Conserv. 2018, 13, e00365. [Google Scholar] [CrossRef]
  11. Sayre, N.F. The Genesis, History, and Limits of Carrying Capacity. Ann. Assoc. Am. Geogr. 2008, 98, 120–134. [Google Scholar] [CrossRef]
  12. Zimmerer, K.S. Human Geography and the “New Ecology”: The Prospect and Promise of Integration. Ann. Assoc. Am. Geogr. 1994, 84, 108–125. [Google Scholar] [CrossRef] [Green Version]
  13. Price, D. Carrying capacity reconsidered. Popul. Environ. 1999, 21, 5–26. [Google Scholar] [CrossRef]
  14. Farsund, A.A.; Daugbjerg, C.; Langhelle, O. Food security and trade: Reconciling discourses in the Food and Agriculture Organization and the World Trade Organization. Food Secur. 2015, 7, 383–391. [Google Scholar] [CrossRef]
  15. Yu, D.; Mao, H.; Gao, Q. Study on regional carrying capacity: Theory, method and example—take the Bohai-Rim area as example. Geogr. Res. 2003, 22, 201–210. (In Chinese). Available online: http://www.dlyj.ac.cn/CN/lexeme/showArticleByLexeme.do?articleID=9186 (accessed on 23 July 2021).
  16. Lv, Y.; Fu, W.; Li, T.; Liu, Y. Progress and prospects of research on integrated carrying capacity of regional resources and environment. Prog. Geogr. 2018, 31, 130–136. (In Chinese) [Google Scholar] [CrossRef] [Green Version]
  17. Devuyst, D.; Hens, L.; De Lannoy, W.; de Lannoy, W. How green is the city?: Sustainability Assessment and the Management of Urban Environments; Columbia University Press: New York, NY, USA, 2001. [Google Scholar]
  18. Johnson, S.; Wang, G.; Howard, H.; Anderson, A.B. Identification of superfluous roads in terms of sustainable military land carrying capacity and environment. J. Terramech. 2011, 48, 97–104. [Google Scholar] [CrossRef]
  19. Mondino, E.B.; Fabrizio, E.; Chiabrando, R. A GIS Tool for the Land Carrying Capacity of Large Solar Plants. Energy Procedia 2014, 48, 1576–1585. [Google Scholar] [CrossRef] [Green Version]
  20. Richter, B.D.; Mathews, R.; Harrison, D.L.; Wigington, R. Ecologically sustainable water management: Managing river flows for ecological integrity. Ecol. Appl. 2003, 13, 206–224. [Google Scholar] [CrossRef]
  21. Bernhardt, E.; Bunn, S.; Hart, D.D.; Malmqvist, B.; Muotka, T.; Naiman, R.J.; Pringle, C.; Reuss, M.; Wilgen, B.v. Perspective: The challenge of ecologically sustainable water management. Water Policy 2006, 8, 475–479. [Google Scholar] [CrossRef] [Green Version]
  22. Byron, C.; Link, J.; Costa-Pierce, B.; Bengtson, D. Modeling ecological carrying capacity of shellfish aquaculture in highly flushed temperate lagoons. Aquaculture 2011, 314, 87–99. [Google Scholar] [CrossRef]
  23. David, G.S.; Carvalho, E.D.; Lemos, D.; Silveira, A.N.; Dall’Aglio-Sobrinho, M. Ecological carrying capacity for intensive tilapia (Oreochromis niloticus) cage aquaculture in a large hydroelectrical reservoir in Southeastern Brazil. Aquacult. Eng. 2015, 66, 30–40. [Google Scholar] [CrossRef]
  24. Liu, R.Z.; Borthwick, A.G.L. Measurement and assessment of carrying capacity of the environment in Ningbo, China. J. Environ. Manag. 2011, 92, 2047–2053. [Google Scholar] [CrossRef] [PubMed]
  25. Fu, J.; Zang, C.; Zhang, J. Economic and resource and environmental carrying capacity trade-off analysis in the Haihe River basin in China. J. Clean. Prod. 2020, 270, 122271. [Google Scholar] [CrossRef]
  26. Liao, S.; Wu, Y.; Wong, S.W.; Shen, L. Provincial perspective analysis on the coordination between urbanization growth and resource environment carrying capacity (RECC) in China. Sci. Total Environ. 2020, 730, 138964. [Google Scholar] [CrossRef] [PubMed]
  27. Feng, Z.; Sun, T.; Yang, Y.; Yan, H. The Progress of Resources and Environment Carrying Capacity: From Single-factor Carrying Capacity Research to Comprehensive Research. J. Resour. Ecol. 2018, 9, 125–134. [Google Scholar] [CrossRef]
  28. Kaur, H.; Garg, P. Urban sustainability assessment tools: A review. J. Clean. Prod. 2019, 210, 146–158. [Google Scholar] [CrossRef]
  29. Ye, W.; Xu, X.; Wang, H.; Wang, H.; Yang, H.; Yang, Z. Quantitative assessment of resources and environmental carrying capacity in the northwest temperate continental climate ecotope of China. Environ. Earth Sci. 2016, 75, 868. [Google Scholar] [CrossRef]
  30. Irankhahi, M.; Jozi, S.A.; Farshchi, P.; Shariat, S.M.; Liaghati, H. Combination of GISFM and TOPSIS to evaluation of Urban Environment Carrying Capacity (Case study: Shemiran City, Iran). Int. J. Environ. Sci. Technol. 2017, 14, 1317–1332. [Google Scholar] [CrossRef]
  31. Zhu, X.; Li, Y.; Zhang, P.; Wei, Y.; Zheng, X.; Xie, L. Temporal–spatial characteristics of urban land use efficiency of China’s 35mega cities based on DEA: Decomposing technology and scale efficiency. Land Use Policy 2019, 88, 104083. [Google Scholar] [CrossRef]
  32. Zhang, H.; Wang, Z.; Liu, J.; Chai, J.; Wei, C. Selection of targeted poverty alleviation policies from the perspective of land resources-environmental carrying capacity. J. Rural Stud. 2019. [Google Scholar] [CrossRef]
  33. Xie, X.; Li, X.; He, W. A Land Space Development Zoning Method Based on Resource–Environmental Carrying Capacity: A Case Study of Henan, China. Int. J. Environ. Res. Public Health 2020, 17. [Google Scholar] [CrossRef] [PubMed] [Green Version]
  34. Attwa, M.; El Bastawesy, M.; Ragab, D.; Othman, A.; Assaggaf, H.M.; Abotalib, A.Z. Toward an Integrated and Sustainable Water Resources Management in Structurally-Controlled Watersheds in Desert Environments Using Geophysical and Remote Sensing Methods. Sustainability 2021, 13, 4004. [Google Scholar] [CrossRef]
  35. Ren, Q.; Li, H. Spatiotemporal Effects and Driving Factors of Water Pollutants Discharge in Beijing–Tianjin–Hebei Region. Water 2021, 13, 1174. [Google Scholar] [CrossRef]
  36. Widodo, B.; Lupyanto, R.; Sulistiono, B.; Harjito, D.A.; Hamidin, J.; Hapsari, E.; Yasin, M.; Ellinda, C. Analysis of Environmental Carrying Capacity for the Development of Sustainable Settlement in Yogyakarta Urban Area. Procedia Environ. Sci. 2015, 28, 519–527. [Google Scholar] [CrossRef] [Green Version]
  37. Vogt, W.; Baruch, B.M.; Freeman, S.I. Road to Survival; W. Sloane Associates: New York, NY, USA, 1948; Available online: https://detopia.de/1940/1948-Vogt-William-Die-Erde-raecht-sich-Road-to-Survival.pdf (accessed on 23 July 2021).
  38. Guo, X.-R.; Mao, X.-Q. Review of land carrying capacity calculating methods chin. Adv. Earth Sci. 2000, 15, 705–711. (In Chinese). Available online: http://www.adearth.ac.cn/CN/10.11867/j.issn.1001-8166.2000.06.0705 (accessed on 23 July 2021).
  39. Song, X.-m.; Kong, F.-z.; Zhan, C.-s. Assessment of Water Resources Carrying Capacity in Tianjin City of China. Water Resour. Manag. 2011, 25, 857–873. [Google Scholar] [CrossRef]
  40. Yang, Z.; Song, J.; Cheng, D.; Xia, J.; Li, Q.; Ahamad, M.I. Comprehensive evaluation and scenario simulation for the water resources carrying capacity in Xi’an city, China. J. Environ. Manag. 2019, 230, 221–233. [Google Scholar] [CrossRef] [PubMed]
  41. Yoon, K.P.; Hwang, C.-L. Multiple Attribute Decision Making: An Introduction; Sage Publications: Thousand Oaks, CA, USA, 1995. [Google Scholar]
  42. Song, M.; Xie, Q. Evaluation of Urban Competitiveness of the Huaihe River Eco-Economic Belt Based on Dynamic Factor Analysis. Comput. Econ. 2021, 58, 615–639. [Google Scholar] [CrossRef]
  43. Dai, C.; Qin, X.S.; Lu, W.T.; Huang, Y. Assessing adaptation measures on agricultural water productivity under climate change: A case study of Huai River Basin, China. Sci. Total Environ. 2020, 721, 137777. [Google Scholar] [CrossRef] [PubMed]
  44. Lu, Y.; Qin, F.; Chang, Z.; Bao, S. Regional Ecological Risk Assessment in the Huai River Watershed during 2010–2015. Sustainability 2017, 9, 2231. [Google Scholar] [CrossRef] [Green Version]
  45. Ruan, J.; He, G. Comprehensive evaluation of water resources security of the Huaihe Eco-economic Belt. Water Supply 2021. [Google Scholar] [CrossRef]
  46. Saaty, T.L. Decision making with the analytic hierarchy process. Int. J. Serv. Sci. 2008, 1, 83–98. Available online: https://www.inderscienceonline.com/doi/abs/10.1504/IJSSci.2008.01759 (accessed on 23 July 2021). [CrossRef] [Green Version]
  47. Deng, H. Multicriteria analysis with fuzzy pairwise comparison. Int. J. Approx. Reason. 1999, 21, 215–231. [Google Scholar] [CrossRef] [Green Version]
  48. Mikhailov, L.; Tsvetinov, P. Evaluation of services using a fuzzy analytic hierarchy process. Appl. Soft Comput. 2004, 5, 23–33. [Google Scholar] [CrossRef] [Green Version]
  49. Vinogradova-Zinkevič, I.; Podvezko, V.; Zavadskas, E.K. Comparative Assessment of the Stability of AHP and FAHP Methods. Symmetry 2021, 13, 479. [Google Scholar] [CrossRef]
  50. Saaty, T.L. How to make a decision: The analytic hierarchy process. Eur. J. Oper. Res. 1990, 48, 9–26. [Google Scholar] [CrossRef]
  51. Hsu, W.-L.; Tsai, F.-M.; Shiau, Y.-C. Planning and assessment system for light rail transit construction in Taiwan. Microsyst. Technol. 2021, 27, 1051–1060. [Google Scholar] [CrossRef]
  52. Buckley, J.J. Fuzzy hierarchical analysis. Fuzzy Sets Syst. 1985, 17, 233–247. [Google Scholar] [CrossRef]
  53. Smirnova, O.; Kazanskaya, L.; Koplík, J.; Tan, H.; Gu, X. Concrete Based on Clinker-Free Cement: Selecting the Functional Unit for Environmental Assessment. Sustainability 2021, 13, 135. [Google Scholar] [CrossRef]
  54. Chen, F.-H.; Liu, H.-R. Evaluation of Sustainable Development in Six Transformation Fields of the Central Taiwan Science Park. Sustainability 2021, 13, 4336. [Google Scholar] [CrossRef]
  55. Dalkey, N. An experimental study of group opinion: The Delphi method. Futures 1969, 1, 408–426. [Google Scholar] [CrossRef]
  56. Ministry of Ecology and Environment, P. National Environmental Protection Standards of the People’s Republic of China-Technical Criterion for Ecosystem Status Evaluation (HJ 192–2015); Ministry of Ecology and Environment, PRC: Beijing, China, 2015. Available online: https://www.mee.gov.cn (accessed on 23 July 2021).
  57. Marull, J.; Pino, J.; Mallarach, J.M.; Cordobilla, M.J. A Land Suitability Index for Strategic Environmental Assessment in metropolitan areas. Landsc. Urban Plann. 2007, 81, 200–212. [Google Scholar] [CrossRef]
  58. Zhou, Y.; Sharma, A.; Masud, M.; Gaba, G.S.; Dhiman, G.; Ghafoor, K.Z.; AlZain, M.A. Urban Rain Flood Ecosystem Design Planning and Feasibility Study for the Enrichment of Smart Cities. Sustainability 2021, 13, 5205. [Google Scholar] [CrossRef]
  59. Ling, T.-Y.; Hung, W.-K.; Lin, C.-T.; Lu, M. Dealing with Green Gentrification and Vertical Green-Related Urban Well-Being: A Contextual-Based Design Framework. Sustainability 2020, 12, 10020. [Google Scholar] [CrossRef]
  60. Zheng, Y.; Li, R.-r. Evaluation of Resource and Environment Carrying Capacity-Taking Si County of Anhui Province as an Example. J. Huaiyin Inst. Technol. 2019, 28, 56–60. Available online: http://www.cnki.com.cn/Article/CJFDTotal-JSHY201901012.htm (accessed on 23 July 2021).
  61. Statistical Communiqué of the People’s Republic of China on the 2020 National Economic and Social Development. Available online: http://www.stats.gov.cn/ (accessed on 5 April 2021).
  62. Shen, L.; Shu, T.; Liao, X.; Yang, N.; Ren, Y.; Zhu, M.; Cheng, G.; Wang, J. A new method to evaluate urban resources environment carrying capacity from the load-and-carrier perspective. Resour. Conserv. Recycl. 2020, 154, 104616. [Google Scholar] [CrossRef]
  63. Green Cities Declaration. Available online: https://www.fundacionciudad.org.ar/pdf/SanFranciscoAccords2005.pdf (accessed on 5 April 2021).
  64. Retzlaff, R.C. Green Building Assessment Systems: A Framework and Comparison for Planners. J. Am. Plan. Assoc. 2008, 74, 505–519. [Google Scholar] [CrossRef]
  65. CEEQUAL–Sustainability Assessment and Awards for Civil Engineering, Infrastructure, Landscaping and the Public Realm. Available online: https://www.ceequal.com/ (accessed on 18 October 2021).
  66. Jenks, G.F. The Data Model Concept in Statistical Mapping. Int. Yearb. Cartogr. 1967, 7, 186–190. Available online: https://ci.nii.ac.jp/naid/10021899676/ (accessed on 23 July 2021).
  67. ArcGIS. Available online: https://www.esri.com/en-us/arcgis/about-arcgis/overview?rsource=%2Fsoftware%2Farcgis (accessed on 23 July 2021).
  68. McMaster, R. In Memoriam: George F. Jenks (1916–1996). Cartogr. Geogr. Inf. Syst. 1997, 24, 56–59. [Google Scholar] [CrossRef]
  69. De Smith, M.J.; Goodchild, M.F.; Longley, P. Geospatial Analysis: A Comprehensive Guide to Principles, Techniques and Software Tools; Troubador Publishing Ltd.: Leicester, UK, 2007. [Google Scholar]
  70. McMaster, R.; McMaster, S. A History of Twentieth-Century American Academic Cartography. Cartogr. Geogr. Inf. Sci. 2002, 29, 305–321. [Google Scholar] [CrossRef]
Figure 1. Range of the Huaihe River Eco-economic Belt.
Land 10 01168 g001
Figure 2. Illustration of the variation of fuzzy meanings.
Land 10 01168 g002
Figure 3. Sensitivity analysis of the AHP results.
Land 10 01168 g003
Figure 4. Grading results based on the calculated resource and environment carrying capacity.
Land 10 01168 g004
Table 1. Fuzzy meanings in FAHP.
Fuzzy NumberMeaning
1 ˜ = (1, 1, 1)Equally important
2 ˜ = (1, 2, 3)Between equally important and slightly more important
3 ˜ = (2, 3, 4)Slightly more important
4 ˜ = (3, 4, 5)Between slightly more important and rather important
5 ˜ = (4, 5, 6)Rather important
6 ˜ = (5, 6, 7)Between rather important and quite important
7 ˜ = (6, 7, 8)Quite important
8 ˜ = (7, 8, 9)Between quite important and extremely important
9 ˜ = (8, 9, 10)Extremely important
Table 2. Random index value for each level of AHP.
Level123456789
R . I . 0.000.000.580.901.121.241.321.411.45
Table 3. Integrated evaluation index system of regional resource and environment carrying capacity.
Objective LayerDimension LayerIndex LayerDetailed Calculated MethodLabel
Resource and environment carrying capacityResource abundancePer capita cultivated landRatio of the total area of cultivated land to total population in the region (ha/person)C1
Per capita water resourceRatio of the usable water amount to the regional total population (hundred million m3/person)C2
Per capita construction landRatio of the total area of construction land to the total population in the region (ha/person)C3
Environment capacityPer capita forest areaRatio of the total area of forest land to the total population in the region (ha/person)C4
Population densityRatio of the total population to the total area in the region (person/km2)C5
Urbanization rateRatio of regional urban population to total population in the region (%)C6
Table 4. Weights of various evaluation indexes of resource and environment carrying capacity.
Object LayerDimension LayerWeights (Dimension)Index LayerWeights (Index Layer)
AHPFAHPAHPFAHP
Resource and environment carrying capacity of the Huaihe River Eco-economic BeltResource abundance0.5790.545Per capita cultivated land0.2050.180
Per capita water resource0.2110.205
Per capita construction land0.1630.160
Environment capacity0.4210.455Per capita forest area0.2030.203
Population density0.1040.112
Urbanization rate0.1140.140
Table 5. Calculated values of resource and environment carrying capacity and the grading results.
OrderAdministrative UnitOverall Values of Resource and Environment Carrying CapacityGrades
1Huaibei0.680High
2Bozhou0.610High
3Luohe0.606High
4Zhumadian0.479Medium
5Xinyang0.430Medium
6Huai’an0.390Medium
7Zhoukou0.374Medium
8Lianyungang0.374Medium
9Huainan0.367Medium
10Bengbu0.358Medium
11Pingdingshan0.354Medium
12Lu’an0.352Medium
13Yancheng0.314Medium
14Suzhou0.302Medium-to-low
15Xuzhou0.286Medium-to-low
16Yangzhou0.284Medium-to-low
17Suqian0.275Medium-to-low
18Taizhou0.267Medium-to-low
19Linyi0.263Medium-to-low
20Shangqiu0.259Medium-to-low
21Zaozhuang0.247Low
22Chuzhou0.233Low
23Jining0.226Low
24Fuyang0.221Low
25Heze0.218Low
Publisher’s Note: MDPI stays neutral with regard to jurisdictional claims in published maps and institutional affiliations.

