Article

Impact of Urbanization and Industrial Structure on Carbon Emissions: Evidence from Huaihe River Eco-Economic Zone

Business School, Hohai University, Changzhou 213022, China
*
Author to whom correspondence should be addressed.
Land 2021, 10(11), 1130; https://doi.org/10.3390/land10111130
Submission received: 29 September 2021 / Revised: 17 October 2021 / Accepted: 20 October 2021 / Published: 25 October 2021
(This article belongs to the Topic Climate Change and Environmental Sustainability)

Abstract

:
Rapid urbanization in China greatly contributes to carbon emissions, while the industrial structure greatly contributes to changes in the variation of carbon emissions. This research addresses the impact of urbanization and industrial structure on carbon emissions from 2010 to 2018, by focusing on the Huaihe River Eco-economic Zone, which is an important economic corridor along the north–south division of China. Although many studies have focused on investigating the impact of urbanization or industrial structure on carbon emissions, few studies further addressed an analysis of the impact of both on carbon emissions, using multiple measurement models. This paper reveals the holistic and local impact of industrial structure and urbanization on carbon emissions, by integrating a threshold regression model with geographically weighted regression. The results are as follows: (1) From a holistic point of view, industrial structure and urbanization had both, single threshold, and double threshold effects on carbon emissions in the Huaihe River Eco-economic Zone. (2) From a regional perspective, the coefficients of industrial structure on carbon emissions were all positive, but the rate of increase gradually slowed down. The coefficients of urbanization on carbon emissions were all negative, reaching a maximum value of negative effect in 2013. Understanding the holistic and local impact of urbanization and industrial structure on carbon emissions provides governments with differentiated and forward-looking suggestions for mitigating carbon emissions in the Huaihe River Eco-economic Zone.

1. Introduction

The increase in carbon emissions has become a serious social problem, because it hinders the development of society and the global economy [1]. The upgrading of industrial structure and urbanization lead to an increase in carbon emissions. According to the World Bank, China’s carbon emissions have exceeded the sum of the European Union and the United States; the three territories with the highest carbon emissions in the world [2]. Their total carbon emissions accounted for more than half of the world. China’s carbon emissions reached 9.429 Gt in 2018, accounting for 27.8% of global carbon emissions [3]. As the largest developing country and the largest carbon emitter, China strives to achieve its promise to reach the peak of its total carbon dioxide emissions around 2030 and become carbon neutral by 2060 [4].
The Huaihe River Eco-economic Zone (HREZ) covers the provinces of Jiangsu, Henan, and Anhui. Accordingly, tertiary industry in the region accounts for about 10%, and the average annual growth rate of urbanization is about 3.56%. Specifically, the backward production pattern leads to increased carbon emissions in the zone. Furthermore, the carbon emissions of the HREZ are significantly higher than that of other regions. This study is conducive to a reduction of carbon emissions in the region, and even in China as a whole, as well as the early achievement of the carbon neutrality target. Therefore, it is imperative for the HREZ to focus on the impacts of urbanization and industrial structure on carbon emissions. At the same time, it is important to understand the internal mechanism of carbon emissions in the zone, which would be helpful to achieve China’s carbon emissions reduction commitments.
Urbanization and industrialization are the main characteristics of the economic growth in China and promote rapid increases in carbon emissions [5]. Many methods for urbanization and industrial structure, such as the STIRPAT model, the Kaya index method, the LDMI method, and the threshold model, have been used to study the influencing factors on carbon emissions [6]. The panel threshold regression model aims to incorporate a certain threshold value as an unknown variable in the regression model, and to empirically test and estimate the corresponding threshold and the effect of the threshold [7,8,9]. In addition, the STIRPAT equation helps to disaggregate the factors influencing carbon emissions. Many researchers have proposed the STIRPAT equation, to explore the impact of carbon emissions [10,11,12,13,14]. With the development of spatial measurement in recent years, several scholars have included spatial factors into the framework for consideration of carbon emission driving factors. According to Tobler’s first law of geography, all attribute values on a geographic surface are related to each other, but closer values are more strongly related than more distant ones [15]. Geographically weighted regression (GWR) is a local spatial regression technique for modeling the varying relationships in many application domains. Regression is a statistical method used to find the relationship between two or more variables that are interdependent and affected by one another.
Although the economy [16], technology [17], urbanization, industrial structure, trade openness [18,19,20], energy consumption [21,22,23], and financial development [11] have been considered in various previous studies, the analysis of both urbanization and industrial structure has not been addressed. Moreover, the optimization of urbanization and industrial structure can help achieve national targets for reducing carbon intensity.
Therefore, although urbanization and industrial structure are two important factors influencing carbon emissions, the combined impact of the two on carbon emissions is not fully understood. Second, the threshold model and GWR were not adequately combined to study carbon emissions in previous studies. The threshold model and GWR are beneficial for studying the carbon emissions of the whole region and each part of the region, respectively. Third, the HREZ has not been adequately addressed. It is one of the most promising areas in the east-central part of China, and the research of carbon emissions is of great value for its long-term development. This paper explores the holistic and local impact of industrial structure and urbanization on the carbon emissions of the HREZ from 2010 to 2018. We aimed to understand how they function, regarding carbon emissions. The main contributions are as follows: (1) This paper combines a threshold model with GWR, to study the impact of urbanization and industrial structure on carbon emissions, from both holistic and local perspectives. (2) Through research on the HREZ, relevant policies can be extended to other regions to mitigate environmental pressure.
With the development of a low carbon economy, the driving factors of carbon emissions have consistently been a research hotspot. Urbanization and industrialization are the main characteristics of economic growth in China and promote rapid increases in carbon emissions. At present, research on carbon emissions in combination with urbanization and industrial structure is mainly concentrated in three strands. The first strand is whether an environmental Kuznets curve (EKC) of carbon emissions exists. Namely, that carbon emissions will eventually appear as an inverted U-shaped curve with the development of urbanization and industrial structure [24,25,26,27,28]. For instance, [10] investigated the heterogeneous dynamic impacts of rural–urban migration and industrial agglomeration on environmental degradation. The combined impacts of both industrial agglomeration and rural–urban migration confirmed EKC in models of the tertiary sector. Reference [29] used the EKC to discuss the relationship between urbanization and carbon emissions in three typical models. The second strand is to use various models or methods to explore the causal relationship and driving factors among urbanization, industrial structure, and carbon emissions, such as cointegration analysis, structural decomposition models, decoupling theory, and LMDI [30,31,32,33,34], which showed that urbanization level is the main driving force promoting decoupling elasticity, both in the long-term and short-term, contributing to a significant increase in carbon emissions. Reference [35] explored the threshold effects of industrial structure and urbanization on carbon emissions. With an increase in the level of population aging, industrial structure and urbanization will lead to an increase in carbon emissions, but the relationship fluctuates in three intervals. The last strand is the exploration of carbon emission rights and carbon compensation to establish efficient and stable operations in the carbon market to achieve emissions reduction targets [36,37]. For example, [37] improved the calculation method of the interregional carbon compensation cost, based on the theoretical carbon deficit. While, reference [38] examined how the announcement of an organizational carbon offset program affected consumption in a CO2-intensive everyday activity. As for the impact of other factors on carbon emissions, foreign direct investment (FDI) has both a promoting and an inhibiting effect on carbon emissions performance [39,40]. There is a relationship among economic growth, energy consumption structure, and carbon emissions [41,42]. In terms of technology, low-carbon technology can increase the potential for carbon emissions reduction [43,44,45].
In terms of regional measurement, scholars have focused more on studies at the national provincial, national strategic regional, and municipal levels. Among the national strategic regions, scholars have measured the carbon efficiency and influencing factors of the Yangtze River Economic Belt [46,47,48], Beijing-Tianjin-Hebei Urban Agglomeration [29,49,50], Belt and Road Initiative [40,51], and Pearl River Delta [52]. Although the HREZ is very important to China’s economic development and for achieving goals for carbon abatement, there is currently a lack of research on such aspects.
Scholars have studied the influencing factors of carbon emissions more widely, and have made many achievements regarding the influencing factors on carbon emissions. However, there has been very little research on the HREZ. The government has not yet realized the importance of the study of carbon emissions in the HREZ for the national carbon abatement. The HREZ is located between the Yangtze River Economic Belt and the Huanghe River Basin, but its relative overall economic development is lagging. It is one of the regions with the greatest development potentials in the central and eastern part of China. For example, the GDP per capita was 49121 CNY/person in 2018, which is a fraction of the Yangtze River Economic Belt and the Huanghe River Basin. The HREZ, with a planned area of 243,000 square kilometers, has great development potential. This has important strategic significance for promoting the balanced development of China, such as being a bridge connecting the south regions to the north regions, and the east regions to the west regions. It includes several key development areas of heavy industry in China. Therefore, it is valuable to research the factors influencing carbon emissions in the HREZ. The HREZ overlaps with other important strategic regions in China, so its successful experience with carbon abatement could be applied to other geographical regions in China. As the goal of carbon emissions reduction is to set up joint efforts, with emissions mitigation suggestions for each region, it is thus necessary to identify changes of carbon emissions under the consideration of regional variations; however, to our knowledge, corresponding research on the HREZ from a differentiation perspective is absent. Thus, this paper has the following novel features: (1) From multiple perspectives, the article combines industrial structure and urbanization to study their impacts on carbon emissions. (2) The combination of a threshold model and GWR is conducive to analysis and research from both planar and spatial perspectives. (3) The HREZ is the research object, and currently lacks theoretical and empirical studies on improving carbon emissions efficiency in China. This is essential for China’s carbon emission reduction and regional development.

2. Methods and Data

2.1. Threshold Regression Model

Following [35], we apply the static panel threshold regression model proposed by [53] to attain the goal of this paper. According to the STIRPAT model, this paper selected variables of carbon emissions (C, tones), urbanization (U,%), industrial structure (M,%), structure of energy consumption (S,%), energy intensity (Q, tones/million CNY), and GDP per capita (Y, CNY/person) to construct the equation. In addition, industrial structure and GDP per capita reflect economic growth effects, energy intensity and energy consumption structure reflect technological advances, and urbanization reflects social effects. The static panel threshold regression models, in a form of STIRPAT, are as follows:
L n C i , t = μ + β 1 L n M i , t I ( L n X i , t γ ) + β 2 L n M i , t I ( L n X i , t > γ ) + β 3 L n S i , t + β 4 L n Q i , t + β 5 L n Y i , t + β 6 L n U i , t + ε L n C i , t = μ + β 1 L n U i , t I ( L n X i , t γ ) + β 2 L n U i , t I ( L n X i , t > γ ) + β 3 L n S i , t + β 4 L n Q i , t + β 5 L n Y i , t + β 6 L n M i , t + ε
where C i , t denotes carbon emissions (tones), M i , t denotes industrial structure (%), U i , t denotes urbanization (%), S i , t denotes energy consumption structure (%), Q i , t denotes energy intensity (tones/million CNY), Y i , t denotes GDP per capita (CNY/person), μ is a constant term, ε is a random disturbance term, subscripts i , t are prefecture-level administrative unit and year, L n X i , t is a threshold variable, γ is a threshold value, and I ( · ) is an indicator function; when L n X i , t γ , I ( · ) = 1 , when L n X i , t > γ , I ( · ) = 0 .

2.2. GWR Method

GWR relies on standard multiple parameter regression. Unlike classical regression, the coefficients are not constant in this technique. It is an effective technique for exploring spatial nonstationarity. GWR model is specified in the following form:
y i = β 0 ( u i , v i ) + j = 1 k β j ( u i , v i ) x i j + ε i i = 1 , 2 , , n
where y i is the value at location i , ( u i , v i ) are the geographic coordinates of position i , β 0 ( u i , v i ) and β j ( u i , v i ) are the intercept and local coefficients at location i , respectively, k is the number of factors, x i k is the explanatory variable at location i , and ε i accounts for the random error term at location i .

2.3. Data Sources and Processing

Referring to the relevant literature, it was found that scholars in various countries had different emphases in the selection of influencing factors of carbon emissions. This paper selected the variables of carbon emissions, urbanization, industrial structure, structure of energy consumption, energy intensity, and GDP per capita. These were all derived from the statistical yearbooks of cities in the HREZ.
This paper’s analysis covers 5 provinces (excluding Henan, Jiangsu, Anhui, Hubei, Shandong) in China. The related data of all variables, spanning 2010 to 2018, were sourced from the China Statistical Yearbook and China Energy Statistical Yearbook [54,55]. To eliminate the impact of price inflation, GDP per capita was converted into constant prices from 2010 using the corresponding indices. A long period can clearly see show an increasing or decreasing trend in carbon emissions. In 2018, the state compiled the “Development Plan of Huaihe River Eco-economic Zone”. Therefore, a summary of the development over a long period before 2018 is more conducive for the targeted measures for future carbon abatement.
There are two common methods to calculate carbon emissions. One is based on the reference method provided by the Intergovernmental Panel on Climate Change (IPCC) [56]. The IPCC is the United Nations body for assessing the science related to climate change. IPCC scientists provide a comprehensive summary of the drivers of climate change, its impacts, and future risks, and how adaptation and mitigation can reduce those risks [57]. The other is the input–output (I–O) method. The I–O method represents the economic dependencies between different sectors and uses matrix representations to describe the inter-industry relationships in the economy [58]. While, the input–output method is updated every five years, the method provided by the IPCC can better capture the impact of factors on regional carbon emissions on a year-by-year basis. The carbon emissions were calculated as follows:
C F = i = 1 8 E i × N C V i × C E F i
C E F i = C C i × C O F i × ( 44 / 12 ) × 10 3
where i is the fossil fuel type; E i is the terminal consumption of the i th fossil fuel (tones); N C V i is the average low calorific value (kj/kg); C E F i is the respective carbon emissions coefficient for the 8 fossil fuels (kg/tj); C C i is the carbon content (t/tj); C O F i is the carbon oxidation factor; and 44 and 12 are the molecular weights of CO2 and C, respectively.

3. Results

3.1. Results of the Threshold Regression Model

The results of the fixed effects model are as follows. The R2 value was 0.81 and the p-value also passed the test. The p-value of urbanization, industrial structure, energy intensity, and energy consumption structure were ≤1% or lower, and the p-value of GDP per capita was 0.028. Each variable passed the significance test in the model. The details are shown in the following, Table 1.
Then, we tested the threshold effect. We modified the threshold variables and the threshold explanatory variables. The results indicated the existence of single or multiple threshold effects with GDP per capita and energy intensity as threshold variables, respectively. First, the results of GDP per capita as a threshold variable are presented in Table 2. The p-value of urbanization, energy intensity, and energy consumption structure were all ≤1% or lower. From the significance of the model, each variable passed the significance test.
From the perspective of industrial structure, the threshold of L n Y i , t is −2.725. Before and after the threshold, each unit increase in industrial structure leads to a reduction of 0.35 units followed by an increase of 0.075 units in carbon emissions.
(1)
In the early stage of economic development, the HREZ was committed to developing strategic emerging industries. The region made use of new knowledge and technologies to develop the industrial structure in the direction of low consumption, low pollution, and high efficiency. Meanwhile, the HREZ emphasized the development of an ecological industry. Through the introduction of clean energy and advanced technology, the government aimed at transitioning the HREZ from resource-intensive industry to technology-intensive industry.
(2)
With the increase of GDP per capita, tertiary industry tended to be saturated. The zone relied on secondary industry, which is the traditionally preponderant industry. The development of secondary industry was more difficult to separate from the consumption of coal, which has the largest carbon emissions, compared with other kinds of energy. The development of tertiary industry could not make up for the high carbon emissions of secondary industry.
From the perspective of urbanization, the thresholds of L n Y i , t are −2.725 and −1.389. When the GDP per capita exceeds the first and second thresholds, each unit of urbanization, first makes carbon emissions decrease by 0.08, then increase by 0.08, and finally decline by 0.001.
(3)
Before the first threshold, the GDP per capita of the zone was low and the urbanization process was just beginning. The workforce moved from the countryside to the cities. The gathering of urban population reduced the cost of public goods. Along with the change of lifestyle in the zone, the quality of residents continued to improve. Residents have become more aware of environmental protection. The change of residents has greatly reduced the negative impact of urbanization on the environment.
(4)
Between the first and second thresholds, the urbanization process entered the middle stage and became the main driving factor affecting carbon emissions. The consumption structure and level of residents improved rapidly. The increasing use of energy-intensive products, such as cars and appliances led to high carbon emissions in the HREZ.
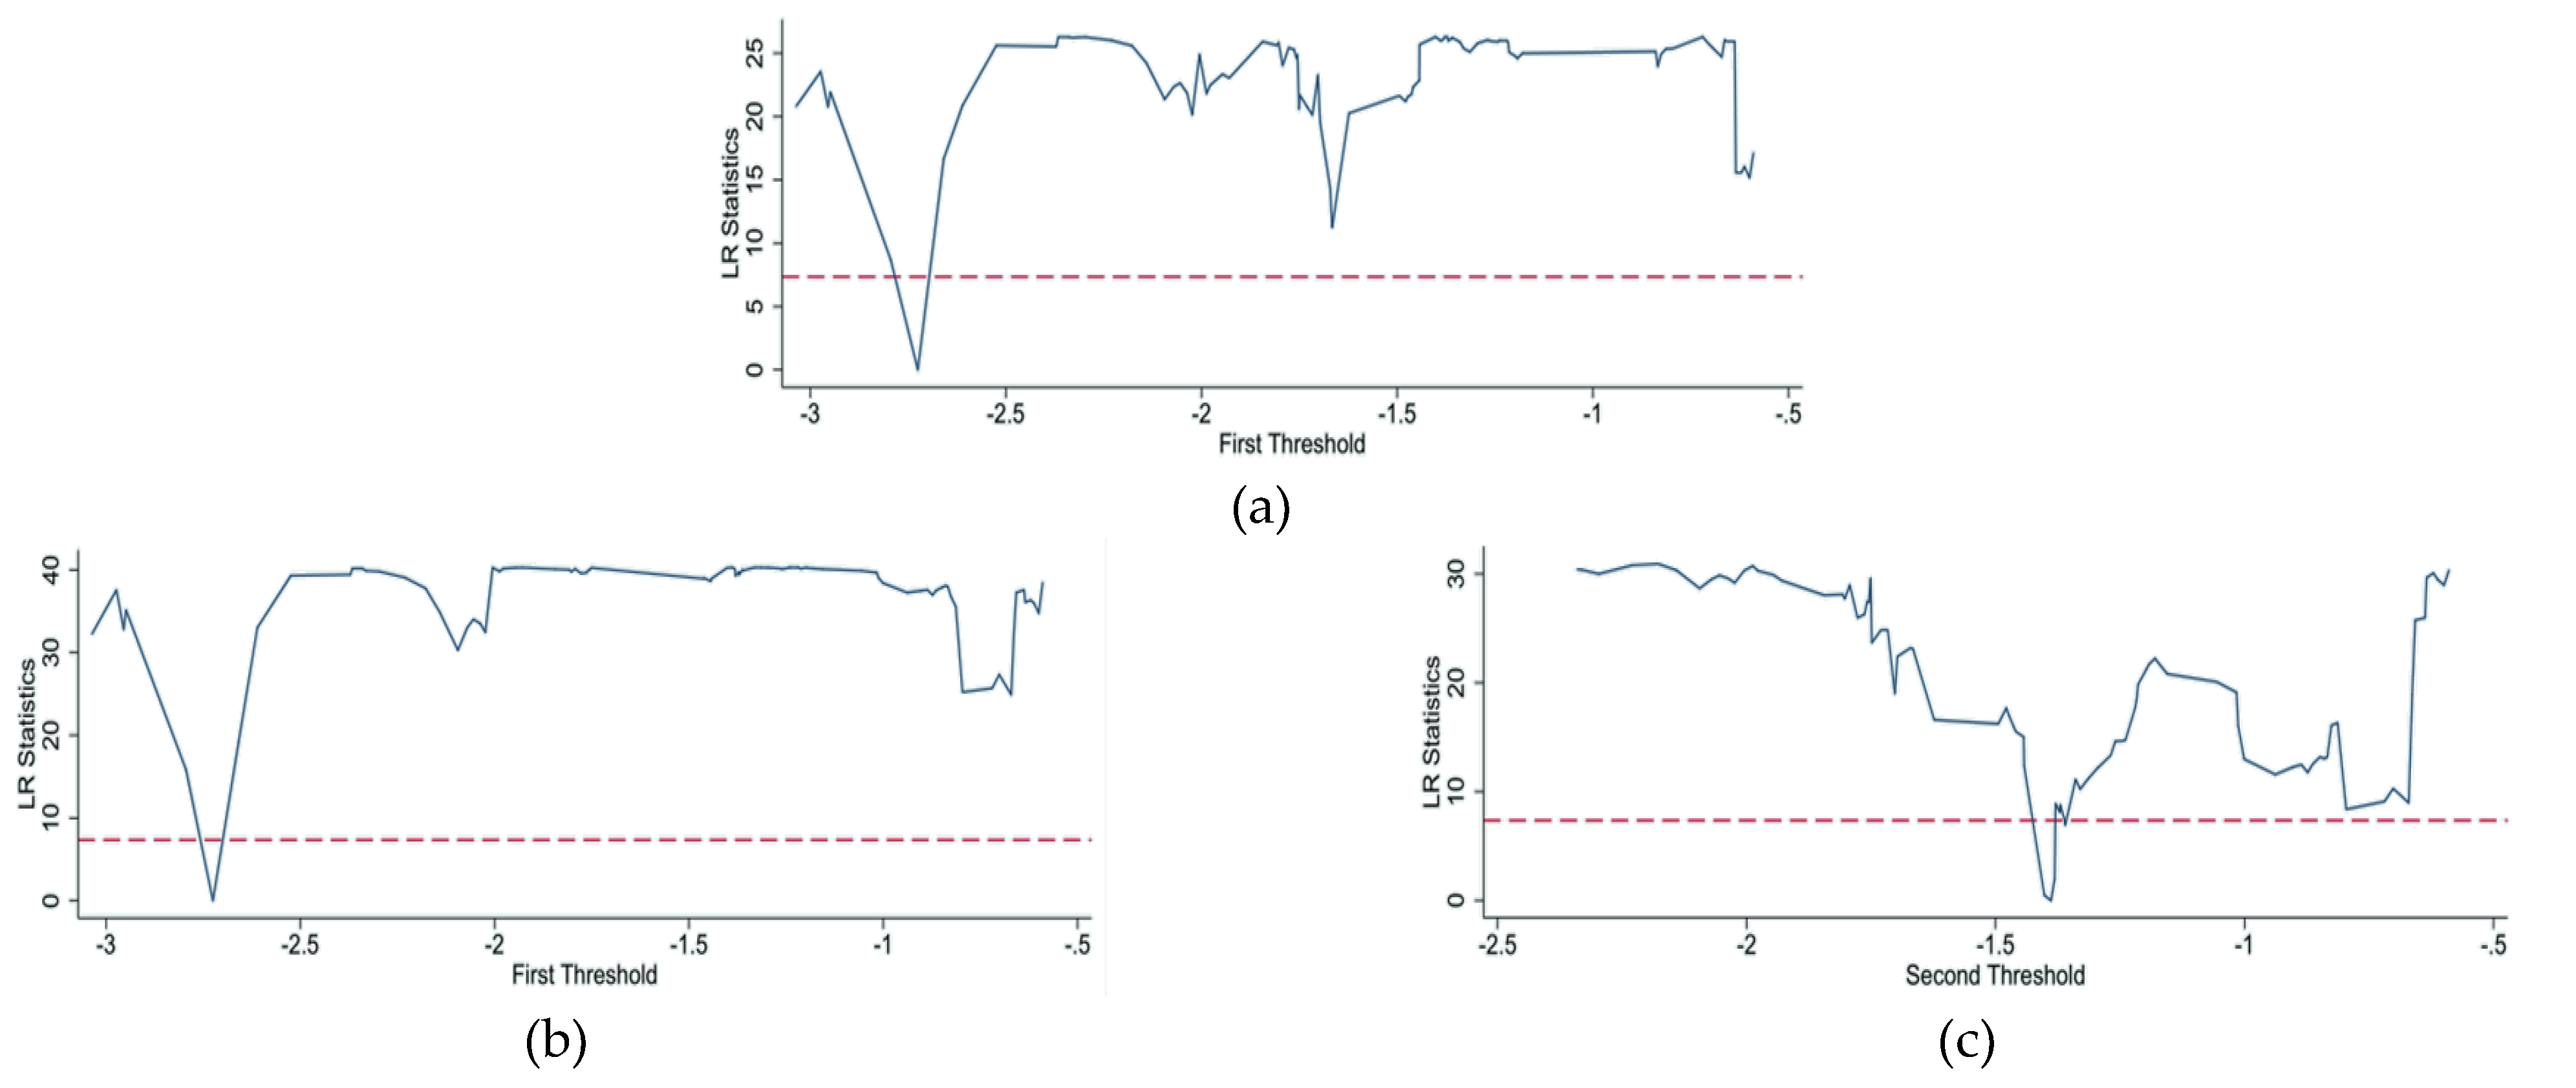
(5)
After the second threshold, the impact of urbanization on carbon emissions slowed down significantly. Despite the advanced economy, the spillover from industrial consumption was compensated by urbanization to a certain extent. The corresponding likelihood ratio function graphs, with GDP per capita as the threshold variable, are shown in Figure 1.
Moreover, the results of energy intensity as a threshold variable are shown in Table 3. The p-value of energy intensity and energy consumption structure are ≤1% or lower, and the p-value of urbanization is 0.042. However, the p-value of GDP per capita does not pass the significance test.
From the perspective of industrial structure, the thresholds of L n Q i , t are −2.013 and −2.410. As the energy intensity exceeded the first and the second thresholds, each unit of industrial structure made carbon emissions first decrease by 0.16, then increase by 0.13, and finally decrease by 0.01.
(1)
Originally, secondary industry was not the main force of economic development and was less dependent on energy consumption. Due to the low energy intensity, the upgrading of industrial structure meant more production resources were given to tertiary industry. The clean nature of tertiary industry led to a reduction in carbon emissions.
(2)
After the energy intensity exceeded the first threshold, the energy dependence of the zone was significantly higher than before. Industries with a high energy consumption and high emissions accounted for a large proportion of economic development. Some regions were relatively backward in technology, so the development of tertiary industry could not offset the high carbon emissions caused by the secondary industry.
(3)
With the further increase of energy intensity up to the second threshold, tertiary industry reached its heyday. The regional industrial structure was continuously optimized under the requirements of the new development concept. Green development of secondary industry and the low carbon consumption of tertiary industry compensated for the spillover from the high energy consumption of industry.
From the perspective of urbanization, the thresholds of L n Q i , t are −1.321 and −1.709. As the energy intensity exceeded the first and second thresholds, each unit of urbanization made carbon emissions, first decrease by 0.01, then increase by 0.08, and finally decrease by 0.03.
(1)
At the outset of the urbanization process, the increase of urbanization meant more rural populations moving to the cities. The industrial development of the zone was in the primary stage. A low energy intensity meant low carbon emissions. The positive impact was optimal when the first threshold was reached.
(2)
With the increase of energy intensity, energy-intensive industries in the HREZ developed rapidly. The lack of industrial innovation capacity and the pressure of economic transformation were the main problems of the development. With the migration of a large number of people, the economic development relied on high-consumption and high-pollution secondary industry. The high energy intensity led to a significant increase in carbon emissions in the HREZ.
(3)
After the energy intensity exceeded the second threshold, the industrial development reached a certain scale. The focus of development shifted to tertiary industry, which is dominated by the service industry. The tertiary sector emits fewer pollutants and has a suppressive effect on carbon emissions. The low carbon consumption of the tertiary sector compensated for the high carbon consumption of the secondary sector. Corresponding likelihood ratio function graphs, with energy intensity as the threshold variable, are shown in Figure 2.

3.2. Estimation Results of GWR Model

The Moran’s Index values obtained for all the years are greater than zero, which suggests that there is positive autocorrelation or a highly clustered pattern. The same is seen by looking at the p-values. The obtained p value is less than 0.05 for all the years, ruling out the basic assumption of randomness and independence in the data values. The results of Moran’s I are shown in Table 4.
To show the spatial heterogeneity of the impact of industrial structure on carbon emissions, the spatial impact of industrial structure from 2010 to 2018 is visualized. The results are shown in Figure 3a–d.
The positive influence of industrial structure on carbon emissions in the HREZ from 2010 to 2018 become more and more obvious, but the trend of growth slowed down. In general, it showed a decreasing trend from the northeast to the southwest, and a more obvious east–west gap.
The cities with high coefficients in 2010 were Suqian, Lianyungang, Huai’an, Yancheng, Yangzhou, and Taizhou. The positive influence on carbon emissions was significantly higher in the eastern cities than in the western cities. With their excellent location and resources, these cities seized the opportunity for development. The accelerated development of tertiary industry led to the accelerated flow of production factors to the tertiary industries, such as labor and land. In order to maintain the current scale of other industries, the production relied more on large mechanical production equipment and energy consumption. The coefficient was lower in Xiaogan, Suizhou, Nanyang, Xinyang, Zhumadian, Pingdingshan, Luohe, Zhoukou, Shangqiu, and Bozhou. These cities are deep inland and had a weak foundation in secondary industry. Due to the backwardness of their production, the reliance on mechanical equipment and energy was low. They relied more on labor for production, so the impact on carbon emissions was lower.
From 2012 to 2015, the trend was roughly the same as before. The coefficient increased significantly, especially in Jiangsu and Shandong Provinces, which were significantly higher than those in southwestern cities. Due to the development of transportation and high-tech industries, the rapid growth of the transportation sector made it the largest source of carbon emissions outside of industry. The negative effect of the transportation sector on carbon emissions was less significant in the central region, because of less convenient transportation and a lower population.
However, the cities in the southwestern zone underwent a rapid economic transformation after 2016. The government promoted the introduction of new industries. All cities reshaped industrial structures and promoted industrial clustering. Industrial restructuring drove down the growth rate of carbon emissions. The gap between the southwestern zone and other cities became smaller.
In summary, the government needs to avoid the negative influence of transportation and high-tech industries on carbon emissions. At the same time, traditional industries should be reformed and upgraded to avoid a reliance on large-scale equipment with high energy consumption.
Similarly, the spatial impacts of urbanization are shown in Figure 4a–d. The negative impact of urbanization on carbon emissions increased at first and then decreased. The growth of carbon emissions was inhibited by urbanization in the early stage. When urban development strategies and spatial layouts were adjusted, the energy-saving effects of urbanization became apparent.
The cities with low coefficients in 2010 were Xuzhou, Suqian, Lianyungang, Huai’an, Yancheng, Yangzhou, Taizhou, Linyi, Suzhou, and Chuzhou, all of which are located in the coastal region. With the input of production factors from abroad, the increase in urbanization rate made the industries gather in cities. Manufacturing industries with serious environmental pollution were gathered around cities. The increase in urbanization increased carbon emissions. While the northwestern cities, such as Zaozhuang, Huaibei, Fuyang, and Xinyang, had a less negative impact on carbon emissions. The urbanization of these cities started later and the urbanization process was much smaller than the eastern cities. Their development mostly relied on secondary industry, so urbanization could not offset the negative impact of secondary sector on carbon emissions.
The coefficient reached the minimum value in 2013. The coefficients of Jining, Zaozhuang, Linyi, Lianyungang, Xuzhou, Suizhou, Suqian, Huai’an, and Yancheng were significantly lower than the western cities. The distribution in the following two years was consistent with that in 2013. The boundary of Heze, Huaibei, and Suzhou showed a clear east–west gap, in which the correlation of urbanization with carbon emissions in the eastern zone was significantly smaller than in the western zone. The rapid urbanization of eastern cities led to a disorderly development and blind expansion of urban scale, which brought a series of problems in urban land and led to a significant increase in carbon emissions.
The coefficient continued to increase from 2016 to 2018. The zone attached importance to the transportation and tertiary industries. The government solved the problems of employment and resource allocation. However, the coefficient in 2018 was larger than in 2010. The negative effect of urbanization was significantly reduced. The rapid development of urbanization led to the concentration of the urban population and the growth of urban areas, which was a great test for the urban environmental situation. At the same time, urbanization brought an improvement in the living standard of residents and the quality of the population.
In a word, the zone was in the stage of urbanization development, from high speed to high quality. Developed cities should play a radiating role, to avoid the waste of resources and pollution caused by blind expansion. The economically backward regions should accelerate their urbanization process.

4. Discussion

In this paper, we analyzed the factors and spatial patterns influencing carbon emissions in the HREZ from 2010 to 2018. Our findings are summarized as follows:
(1)
Urbanization and industrial structure have double and single threshold effects on the carbon emissions, respectively, with GDP per capita as the threshold variable. Urbanization and industrial structure have double threshold effects on the carbon emissions, with energy intensity as the threshold variable.
(2)
The coefficients of industrial structure are all positive, but the rate of increase gradually decreases. They show a decreasing trend from northeast to southwest. Before 2016, the positive impact on carbon emissions in Jiangsu and Shandong provinces was significantly higher than in the southwestern cities. Cities bounded by Shangqiu, Huabei, Bengbu, and Huainan had developed tertiary industries and other industries relying on large machinery production equipment in order to compensate for the development of tertiary industry. After 2016, the zone began to move in a favorable direction, towards reducing carbon emissions, gradually meeting the low carbon development targets of the thirteenth Five-Year Plan of China.
(3)
The impacts of urbanization are all negative. The coefficients first decreased and then increased, reaching the maximum in 2013. Before 2013, the urbanization of most cities in Jiangsu and Anhui provinces had a significant negative correlation effect on carbon emissions, and the negative coefficient was smaller in the northwest of China, such as in Zaozhuang, Huaibei, Fuyang, and Xinyang. From 2013 to 2016, the negative coefficient of eastern cities was significantly higher than that of western cities, showing a significant east–west gap, bounded by Heze, Huaibei, and Suzhou, and the negative coefficient effect of urbanization on carbon emissions in some cities in Henan Province increased after 2016.
In order to improve the efficiency of carbon emissions and reduce the regional differences in the HREZ, some suggestions are proposed as follows:
(1)
The industrial structure and urbanization development speed of the HREZ need to be adjusted according to the thresholds. Local governments in the HREZ should adjust regional measures and policies according to the marginal benefits of industrial structure and urbanization.
(2)
Eastern cities in the zone need to avoid the adverse effects of transportation and high-tech industries on carbon emissions, due to the unreasonable development of industrial structure. In addition, it also needs to reduce the dependence of traditional industries on large equipment with a high energy consumption.
(3)
The areas with poor urbanization in the western region need to speed up the rate of urbanization and improve the quality of the population. The developed cities in the east need to control their urban development rate, to avoid the energy consumption caused by large population concentrations.

Author Contributions

Conceptualization, Q.P.; methodology, L.Z.; software, L.Z.; formal analysis, W.Z.; investigation, W.Z.; data curation, W.Z.; writing—original draft preparation, W.Z.; writing—review and editing, Q.P., T.Z. and L.Z.; visualization, T.Z.; supervision, Q.P.; project administration, Q.P.; funding acquisition, Q.P. All authors have read and agreed to the published version of the manuscript.

Funding

This research was funded by the Fundamental Research Funds for the Central Universities (No. B200203175), the Graduate Student Innovation Funds of Jiangsu Province (KYCX20_0524).

Acknowledgments

This research was funded by the Fundamental Research Funds for the Central Universities (No. B200203175), the Graduate Student Innovation Funds of Jiangsu Province (KYCX20_0524).

Conflicts of Interest

The authors declare no conflict of interest.

References

  1. Villoria-Sáez, P.; Tam, V.W.; del Río Merino, M.; Arrebola, C.V.; Wang, X. Effectiveness of greenhouse-gas Emission Trading Schemes implementation: A review on legislations. J. Clean. Prod. 2016, 127, 49–58. [Google Scholar] [CrossRef]
  2. World Bank. CO2 emissions (kt). 2016. Available online: https://data.worldbank.org/indicator/EN.ATM.CO2E.KT?View=chart (accessed on 21 October 2021).
  3. BP. BP Statistical Review of World Energy. Available online: https://www.bp.com/en/global/corporate/energyeconomics/statistical-review-of-world-energy/CO2-emissions.html/ (accessed on 21 October 2021).
  4. Xinhua, xinhuanet.com. 2021. Available online: http://www.xinhuanet.com/english/2021-03/20/c_139823518.htm (accessed on 16 October 2021).
  5. Tu, Z.; Shen, R. Industrialization’s, Urbanization’s Dynamic Marginal Carbon Emissions—The Analytical Framework Based on LMDI “Two-Level Perfect Decomposition”. Method. China Ind. Econ. 2013, 9, 31–43. [Google Scholar]
  6. Wang, Z.; Yin, F.; Zhang, Y.; Zhang, X. An empirical research on the influencing factors of regional CO2 emissions: Evidence from Beijing city. China Appl. Energy 2012, 100, 277–284. [Google Scholar] [CrossRef]
  7. Du, W.C.; Xia, X. How does urbanization affect GHG emissions? A cross-country panel threshold data analysis. Appl. Energy 2018, 229, 872–883. [Google Scholar] [CrossRef]
  8. Wang, X.; Shao, Q. Non-linear effects of heterogeneous environmental regulations on green growth in G20 countries: Evidence from panel threshold regression. Sci. Total Environ. 2019, 660, 1346–1354. [Google Scholar] [CrossRef] [PubMed]
  9. Valadkhani, A.; Smyth, R.; Nguyen, J. Effects of primary energy consumption on CO2 emissions under optimal thresholds: Evidence from sixty countries over the last half century. Energy Econ. 2019, 80, 680–690. [Google Scholar] [CrossRef]
  10. Ahmad, M.; Khan, Z.; Anser, M.K.; Jabeen, G. Do rural-urban migration and industrial agglomeration mitigate the environmental degradation across China’s regional development levels? Sustain. Prod. Consum. 2021, 27, 679–697. [Google Scholar] [CrossRef]
  11. Zaidi, S.A.H.; Zafar, M.W.; Shahbaz, M.; Hou, F. Dynamic linkages between globalization, financial development and carbon emissions: Evidence from Asia Pacific Economic Cooperation countries. J. Clean. Prod. 2019, 228, 533–543. [Google Scholar] [CrossRef]
  12. Hashmi, R.; Alam, K. Dynamic relationship among environmental regulation, innovation, CO2 emissions, population, and economic growth in OECD countries: A panel investigation. J. Clean. Prod. 2019, 231, 1100–1109. [Google Scholar] [CrossRef]
  13. Ehrlich, P.R.; Holdren, J.P. Impact of population growth. Science 1971, 171, 1212–1217. [Google Scholar] [CrossRef]
  14. York, R.; Rosa, E.A.; Dietz, T. STIRPAT, IPAT and ImPACT: Analytic tools for unpacking the driving forces of environmental impacts. Ecol. Econ. 2003, 46, 351–365. [Google Scholar] [CrossRef]
  15. Tobler, W.R. A Computer Movie Simulating Urban Growth in the Detroit Region. Econ. Geogr. 1970, 46, 234–240. [Google Scholar] [CrossRef]
  16. Saidi, K.; Omri, A. The impact of renewable energy on carbon emissions and economic growth in 15 major renewable energy-consuming countries. Environ. Res. 2020, 186, 109567. [Google Scholar] [CrossRef] [PubMed]
  17. Huang, J.; Chen, X.; Yu, K.; Cai, X. Effect of technological progress on carbon emissions: New evidence from a decomposition and spatiotemporal perspective in China. J. Environ. Manag. 2020, 274, 110953. [Google Scholar] [CrossRef]
  18. Wang, Q.; Zhang, F. The effects of trade openness on decoupling carbon emissions from economic growth—Evidence from 182 countries. J. Clean Prod. 2021, 279, 123838. [Google Scholar] [CrossRef]
  19. Du, K.; Yu, Y.; Li, J. Does international trade promote CO2 emission performance? An empirical analysis based on a partially linear functional-coefficient panel data model. Energy Econ. 2020, 92, 104983. [Google Scholar] [CrossRef]
  20. Khan, Z.; Ali, M.; Jinyu, L.; Shahbaz, M.; Siqun, Y. Consumption-based carbon emissions and trade nexus: Evidence from nine oil exporting countries. Energy Econ. 2020, 89, 104806. [Google Scholar] [CrossRef]
  21. Nathaniel, S.P.; Adeleye, N. Environmental preservation amidst carbon emissions, energy consumption, and urbanization in selected african countries: Implication for sustainability. J. Clean. Prod. 2021, 285, 125409. [Google Scholar] [CrossRef]
  22. Salari, M.; Javid, R.J.; Noghanibehambari, H. The nexus between CO2 emissions, energy consumption, and economic growth in the U.S. Econ. Anal. Policy 2021, 69, 182–194. [Google Scholar] [CrossRef]
  23. Ehigiamusoe, K.U.; Lean, H.H.; Smyth, R. The moderating role of energy consumption in the carbon emissions-income nexus in middle-income countries. Appl. Energy 2020, 261, 114215. [Google Scholar] [CrossRef]
  24. Kirikkaleli, D.; Kalmaz, D.B. Testing the moderating role of urbanization on the environmental Kuznets curve: Empirical evidence from an emerging market. Environ. Sci. Pollut. Res. 2020, 27, 38169–38180. [Google Scholar] [CrossRef] [PubMed]
  25. Chen, Q.; Taylor, D. Economic development and pollution emissions in Singapore: Evidence in support of the Environmental Kuznets Curve hypothesis and its implications for regional sustainability. J. Clean. Prod. 2020, 243, 118637. [Google Scholar] [CrossRef]
  26. Abdouli, M.; Kamoun, O.; Hamdi, B. The impact of economic growth, population density, and FDI inflows on CO_2 emissions in BRICTS countries: Does the Kuznets curve exist? Empir. Econ. 2018, 54, 1717–1742. [Google Scholar] [CrossRef]
  27. Xu, Q.; Dong, Y.; Yang, R. Urbanization impact on carbon emissions in the Pearl River Delta region: Kuznets curve relationships. J. Clean. Prod. 2018, 180, 514–523. [Google Scholar] [CrossRef]
  28. Rahman, M.M.; Kashem, M.A. Carbon emissions, energy consumption and industrial growth in Bangladesh: Empirical evidence from ARDL cointegration and Granger causality analysis. Energy Policy 2017, 110, 600–608. [Google Scholar] [CrossRef]
  29. Zhou, Y.; Chen, M.; Tang, Z.; Mei, Z. Urbanization, land use change, and carbon emissions: Quantitative assessments for city-level carbon emissions in Beijing-Tianjin-Hebei region. Sustain. Cities Soc. 2021, 66, 102701. [Google Scholar] [CrossRef]
  30. Li, X.; Wang, J.; Zhang, M.; Ouyang, J.; Shi, W. Regional differences in carbon emission of China’s industries and its decomposition effects. J. Clean. Prod. 2020, 270, 122528. [Google Scholar] [CrossRef]
  31. Wu, Y.; Tam, V.W.; Shuai, C.; Shen, L.; Zhang, Y.; Liao, S. Decoupling China’s economic growth from carbon emissions: Empirical studies from 30 Chinese provinces (2001–2015). Sci. Total Environ. 2019, 656, 576–588. [Google Scholar] [CrossRef]
  32. Feng, J.; Zeng, X.-L.; Yu, Z.; Bian, Y.; Li, W.-C.; Wang, Y. Decoupling and driving forces of industrial carbon emission in a coastal city of Zhuhai, China. Energy Rep. 2019, 5, 1589–1602. [Google Scholar] [CrossRef]
  33. Zheng, X.; Wang, R.; He, Q. A city-scale decomposition and decoupling analysis of carbon dioxide emissions: A case study of China. J. Clean. Prod. 2019, 238, 117824. [Google Scholar] [CrossRef]
  34. Wang, Q.; Su, M.; Li, R. Toward to economic growth without emission growth: The role of urbanization and industrialization in China and India. J. Clean. Prod. 2018, 205, 499–511. [Google Scholar] [CrossRef]
  35. Wang, Q.; Wang, L. The nonlinear effects of population aging, industrial structure, and urbanization on carbon emissions: A panel threshold regression analysis of 137 countries. J. Clean. Prod. 2021, 287, 125381. [Google Scholar] [CrossRef]
  36. Zhou, H.; Ping, W.; Wang, Y.; Wang, Y.; Liu, K. China’s initial allocation of interprovincial carbon emission rights considering historical carbon transfers: Program design and efficiency evaluation. Ecol. Indic. 2021, 121, 106918. [Google Scholar] [CrossRef]
  37. Yang, G.; Shang, P.; He, L.; Zhang, Y.; Wang, Y.; Zhang, F.; Zhu, L.; Wang, Y. Interregional carbon compensation cost forecast and priority index calculation based on the theoretical carbon deficit: China as a case. Sci. Total Environ. 2019, 654, 786–800. [Google Scholar] [CrossRef] [PubMed]
  38. Günther, S.A.; Staake, T.; Schöb, S.; Tiefenbeck, V. The behavioral response to a corporate carbon offset program: A field experiment on adverse effects and mitigation strategies. Glob. Environ. Chang. 2020, 64, 102123. [Google Scholar] [CrossRef]
  39. Song, W.; Mao, H.; Han, X. The two-sided effects of foreign direct investment on carbon emissions performance in China. Sci. Total Environ. 2021, 791, 148331. [Google Scholar] [CrossRef]
  40. Muhammad, S.; Long, X.; Salman, M.; Dauda, L. Effect of urbanization and international trade on CO2 emissions across 65 belt and road initiative countries. Energy 2020, 196, 117102. [Google Scholar] [CrossRef]
  41. Debone, D.; Leite, V.P.; Miraglia, S.G.E.K. Modelling approach for carbon emissions, energy consumption and economic growth: A systematic review. Urban Clim. 2021, 37, 100849. [Google Scholar] [CrossRef]
  42. Waheed, R.; Sarwar, S.; Wei, C. The survey of economic growth, energy consumption and carbon emission. Energy Rep. 2019, 5, 1103–1115. [Google Scholar] [CrossRef]
  43. Janzen, R.; Davis, M.; Kumar, A. Greenhouse gas emission abatement potential and associated costs of integrating renewable and low carbon energy technologies into the Canadian oil sands. J. Clean. Prod. 2020, 272, 122820. [Google Scholar] [CrossRef]
  44. Wang, S.; Tang, Y.; Du, Z.; Song, M. Export trade, embodied carbon emissions, and environmental pollution: An empirical analysis of China’s high- and new-technology industries. J. Environ. Manag. 2020, 276, 111371. [Google Scholar] [CrossRef]
  45. Ganda, F. The impact of innovation and technology investments on carbon emissions in selected organisation for economic Co-operation and development countries. J. Clean. Prod. 2019, 217, 469–483. [Google Scholar] [CrossRef]
  46. Liu, H.; Nie, J.; Cai, B.; Cao, L.; Wu, P.; Pang, L.; Wang, X. CO2 emissions patterns of 26 cities in the Yangtze River Delta in 2015: Evidence and implications. Environ. Pollut. 2019, 252, 1678–1686. [Google Scholar] [CrossRef] [PubMed]
  47. Zhang, S.; Li, H.; Zhang, Q.; Tian, X.; Shi, F. Uncovering the impacts of industrial transformation on low-carbon development in the Yangtze River Delta. Resour. Conserv. Recycl. 2019, 150, 104442. [Google Scholar] [CrossRef]
  48. Xu, X.; Yang, G.; Tan, Y.; Zhuang, Q.; Tang, X.; Zhao, K.; Wang, S. Factors influencing industrial carbon emissions and strategies for carbon mitigation in the Yangtze River Delta of China. J. Clean. Prod. 2017, 142, 3607–3616. [Google Scholar] [CrossRef]
  49. Fan, J.; Cao, Z.; Zhang, X.; Wang, J.-D. Comparative study on the influence of final use structure on carbon emissions in the Beijing-Tianjin-Hebei region. Sci. Total Environ. 2019, 668, 271–282. [Google Scholar] [CrossRef]
  50. Wang, C.; Zhan, J.; Bai, Y.; Chu, X.; Zhang, F. Measuring carbon emission performance of industrial sectors in the Beijing-Tianjin-Hebei region, China: A stochastic frontier approach. Sci. Total Environ. 2019, 685, 786–794. [Google Scholar] [CrossRef]
  51. Hussain, J.; Khan, A.; Zhou, K. The impact of natural resource depletion on energy use and CO2 emission in Belt & Road Initiative countries: A cross-country analysis. Energy 2020, 199, 117409. [Google Scholar]
  52. Chen, L.; Xu, L.; Yang, Z. Accounting carbon emission changes under regional industrial transfer in an urban agglomeration in China's Pearl River Delta. J. Clean. Prod. 2017, 167, 110–119. [Google Scholar] [CrossRef]
  53. Hansen, B.E. Sample splitting and threshold estimation. Econometrica 2000, 68, 575–603. [Google Scholar] [CrossRef] [Green Version]
  54. China Statistical Yearbook. 2018. Available online: http://www.stats.gov.cn/tjsj/ndsj/2018/notepyrightch.htm (accessed on 16 October 2021).
  55. China Energy Statistical Yearbook. 2018. Available online: https://data.cnki.net/trade/Yearbook/Single/N2019080025?z=Z024 (accessed on 16 October 2021).
  56. IPCC. IPCC Guidelines for National Greenhouse Gas Inventories; IPCC: Geneva, Switzerland, 2006. [Google Scholar]
  57. The Intergovernmental Panel on Climate Change (IPCC). 2021. Available online: https://www.ipcc.ch/about/.html (accessed on 14 October 2021).
  58. Zhou, X.; Gu, A. Impacts of household living consumption on energy use and carbon emissions in China based on the input-output model. Adv. Clim. Chang. Res. 2020, 11, 118–130. [Google Scholar] [CrossRef]
Figure 1. The likelihood ratio function graph with GDP per capita as the threshold variable. (a) Industrial structure (1); (b) urbanization (1); (c) urbanization (2).
Land 10 01130 g001
Figure 2. Likelihood ratio function graphs with energy intensity as the threshold variable. (a) Industrial structure (1); (b) industrial structure (2); (c) urbanization (1); (d) urbanization (2).
Land 10 01130 g002
Figure 3. Spatial impact of industrial structure.
Land 10 01130 g003
Figure 4. Spatial impact of urbanization.
Land 10 01130 g004
Table 1. The results of the fixed effect panel model.
Coef.95% Confidence Interval
L n M i , t −0.036 ***(0.67,0.76)
(−2.14)
L n U i , t 0.054 ***(−0.28, −0.19)
(3.95)
L n Q i , t 0.716 ***(−0.02, 0.14)
(30.28)
L n Y i , t 0.059 **(−0.07, 0)
(1.5)
L n S i , t −0.241 ***(0.03, 0.08)
(−11.03)
_ c o n s −1.264 ***(−1.42, −1.1)
(−15.15)
Note: values in parentheses are the T-statistics, **, *** denote significance at 10%, 5%, and 1% levels, respectively.
Table 2. Estimation of panel threshold model with GDP per capita as threshold variable.
ISU(1)U(2)
Threshold r −2.725−2.725−1.389
estimation95% confidence interval[−2.7939, −2.6587][−2.794, −2.659][−1.422, −1.382]
Other Variables L n Q i , t 0.716 ***0.730 ***
(30.41)(32.24)
L n S i , t −0.225 ***−0.200 ***
(−11.26)(−10.20)
L n U i , t 0.074 ***
(5.75)
L n M i , t −0.016
(−1.06)
Constant terms _ c o n s −1.263 ***−1.210 ***
(−15.13)(−14.13)
Note: values in parentheses are the T-statistics, *** denote significance at the 10%, 5%, and 1% levels, respectively.
Table 3. Estimation of panel threshold model with energy intensity as the threshold variable.
IS(1)IS(2)U(1)U(2)
Threshold estimation r −2.013−2.410−1.321−1.709
95% confidence interval[−2.024, −1.998][−2.448, −1.721][−1.617, −1.271][−1.909, −1.673]
Other Variables L n Y i , t 0.030.056 *
(0.85)(1.64)
L n S i , t −0.157 ***−0.209 ***
(−7.65)(−11.46)
L n U i , t 0.025 **
(1.94)
L n M i , t −0.018
(−1.3)
L n Q i , t 0.704 ***0.657 ***
(32.36)(29.53)
Constant terms _ c o n s −1.346 ***−1.418 ***
(−18.05)(−17.55)
Note: values in parentheses are the T-statistics,***, **, * denote significance at 1%, 5%, and 10% levels, respectively.
Table 4. Moran’s I test.
Carbon EmissionsUrbanizationIndustrial Structure
20100.0960.3270.345
20110.0760.3350.430
20120.0850.3070.433
20130.0900.2560.486
20140.1020.2480.323
20150.1070.3070.244
20160.0910.3050.202
20170.0810.3020.159
20180.0650.2990.105
Publisher’s Note: MDPI stays neutral with regard to jurisdictional claims in published maps and institutional affiliations.

