Article

Treatment of Oily Wastewater with Membrane Bioreactor Systems

DICAM, Università degli Studi di Palermo, Palermo 90100, Italy
*
Author to whom correspondence should be addressed.
Water 2017, 9(6), 412; https://doi.org/10.3390/w9060412
Submission received: 6 April 2017 / Revised: 5 June 2017 / Accepted: 6 June 2017 / Published: 9 June 2017
(This article belongs to the Special Issue Oily Water Treatment)

Abstract

:
The aim of the present work was to investigate the behavior of a membrane bioreactor (MBR) system for the treatment of oily wastewater. A bench scale MBR was fed with synthetic wastewater containing diesel fuel. Organic carbon, hydrocarbon and ammonium removal, kinetic constants, extracellular polymeric substances production, and membrane fouling rates were monitored. The MBR plant was operated for more than 200 days, and the results highlighted good carbon removal and nitrification, suggesting a sort of biomass adaptation to hydrocarbons. Membrane fouling analysis showed an increase in total resistance, likely due to hydrocarbons, which caused an irreversible fouling (pore blocking) mainly due to oil deposition.

1. Introduction

Nowadays, the growing sensitivity with respect to environmental protection has led to increasing regulatory pressure on wastewater treatment, imposing severe limitations on pollutant concentrations before discharge into the environment. In this context, one of the major challenges is represented by the biological treatment of oily wastewater.
Indeed, effective treatment of this petroleum-contaminated water is essential prior to its discharge into the environment, in order to prevent pollution problem for ecosystems as well as for human health.
Due to the high efficiency in recalcitrant compound removal, chemical-physical treatments are frequently adopted for the treatment of oil contaminated wastewater [1,2]. The main drawback of these technologies consists in high operative costs and in the formation of highly polluted by-products that need further treatment before disposal. For this reason, researchers’ interests have moved to the refinement of biological treatment as a potential affordable alternative.
The use of biological treatments is becoming increasingly popular in the field of oily wastewater characterized by high organic content and petroleum hydrocarbons [3,4,5,6,7,8,9], even if the presence of high concentrations of a separate oily phase usually requires proper pre-treatments. In recent years, membrane bioreactors (MBRs) have been applied for saline wastewater treatment (among others, [4,5,10,11]) since they feature high-quality effluent, a small footprint, and low sludge production rates [12]. MBR systems cope well with the features of oily wastewater originated from shipboard activities [4,5]. Indeed, membrane technology has been recently introduced as an efficient technique to separating oil/water mixture due to its ability to effectively remove the oil droplets when compared to the conventional technologies [13,14]. However, in the presence of recalcitrant or xenobiotic compounds and low aqueous solubility of hydrocarbon a modification of biomass biokinetic activity as well as sludge characteristics, such as viscosity and dewaterability features, may arise [5,14].
Indeed, hydrocarbons are characterized by a high molecular weight, thus making the activated sludge highly hydrophobic. The high hydrophobic value strongly influences flocculation, sedimentation, dewatering, and filterability in activated sludge during wastewater treatment [15]. This condition is of great importance, since microbial community characteristics can play an important role in membrane fouling, which still represents one of the major challenges for MBRs, hindering its extended application worldwide [16,17,18]. Studies have been recently performed in order to evaluate how the presence of oil (or hydrocarbon) influences the MBR performance especially in terms of membrane fouling [5,14,19,20]. However, these studies mainly focused on membrane material (such as hydrophobic surfaces versus hydrophilic, etc.).
Therefore, bearing in mind these considerations, the main object of the present work is the investigation of a hollow fiber MBR bench scale plant for the treatment of wastewater contaminated by petroleum hydrocarbons, in terms of removal efficiency, microbial activity, and membrane fouling.

2. Materials and Methods

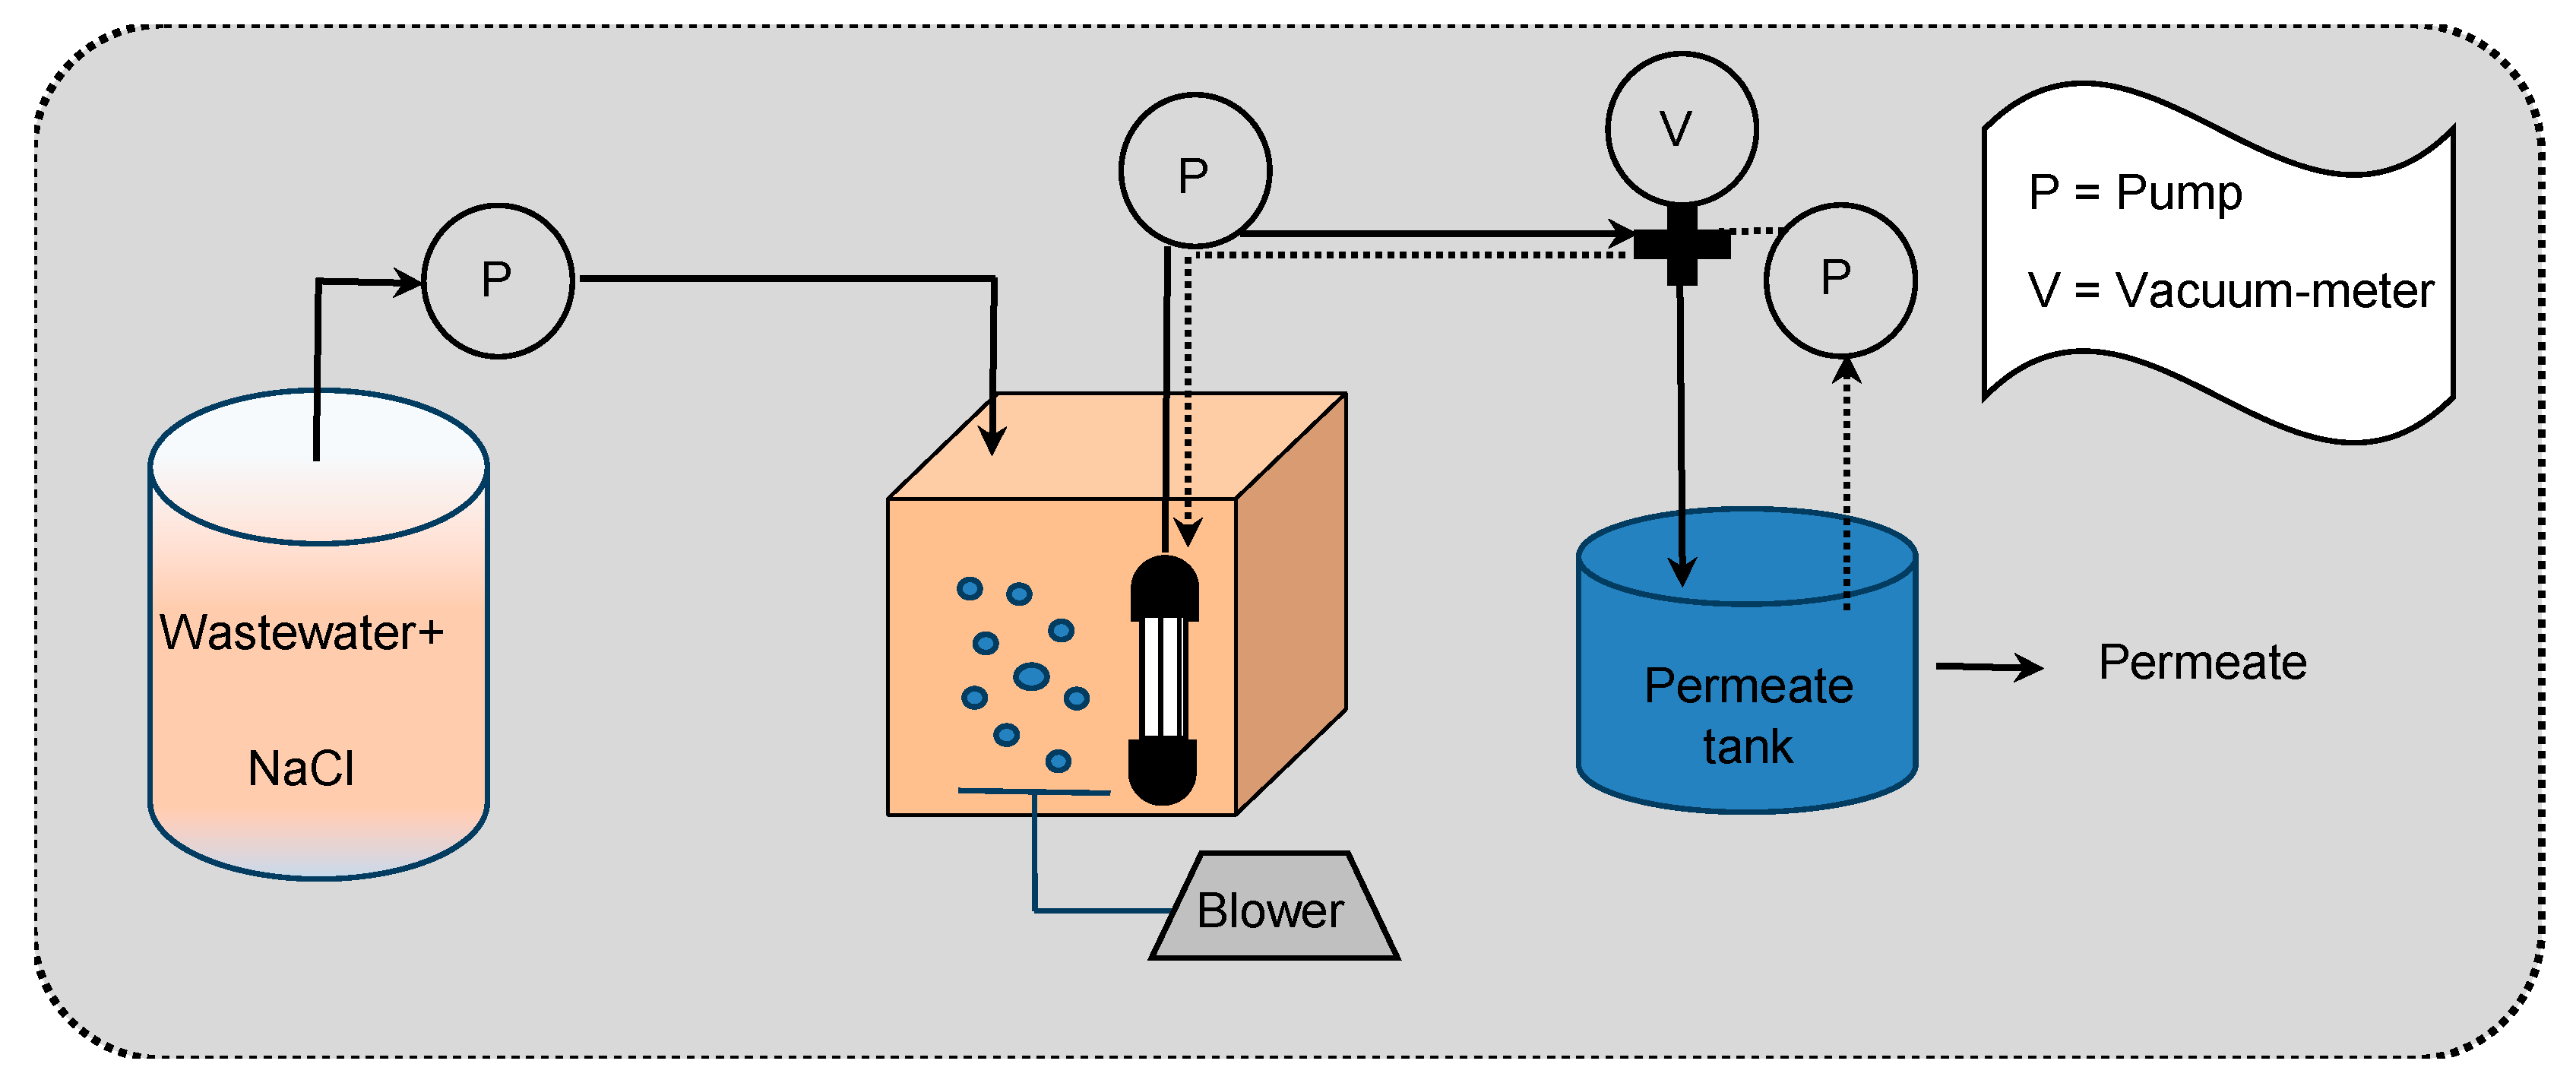
2.1. Pilot Plant Layout and Operative Conditions

AN MBR bench scale system was designed and realized at the Laboratory of Sanitary and Environmental Engineering of Palermo University. The MBR plant had a volume of 20 L, was fed with synthetic oily wastewater, and was equipped with an ultrafiltration (UF) hollow fiber membrane module (ZeeWeedTM01, with a specific area equal to 0.093 m2 and a nominal porosity of 0.04 µm) in a submerged configuration. The membrane flux was kept near 15 L·m−2·h−1, corresponding to a hydraulic retention time (HRT) equal to 27 h.
The membrane was periodically backwashed (every 4 min for a period of 1 min) by pumping a fraction of permeate back through the membrane module. Filtration was stopped almost every 15–20 days, or as soon as the transmembrane pressure (TMP) reached 60,000–70,000 Pa (value suggested by the membrane manufacturer). The membrane module was then subject to a physical cleaning, according to the procedure suggested by [21]. Briefly, the membrane module was extracted from the bioreactor and cleaned as follows: (a) rinsing with tap water at 0.4–0.5 bar for 15 min with mild mechanical cleaning; (b) mechanical agitation in water for 5 min; and (c) rinsing with ultrapure water at <0.2 bar for 5 min. Chemical cleaning (after physical cleaning) was carried out by immersing the membrane module for 12 h in a citric acid solution characterized by a pH of 2.5.
A schematic layout of the MBR plant is reported in Figure 1.
The whole experimental campaign had a duration of more than 200 days and MBR was operated under aerobic conditions throughout experiments. The laboratory scale plant was started up with activated sludge inoculum, withdrawn from Palermo Municipal wastewater treatment plant (WWTP), to obtain an initial Mixed Liquor Suspended Solids (MLSS) concentration of 4 g TSS·L−1.
The main features of the synthetic oily wastewater are reported in Table 1, whilst the main operational conditions are summarized in Table 2.
The synthetic oily wastewater was prepared with the aim to simulate a shipboard slops pre-treated by means of a de-oiling and coagulation/flocculation processes. Therefore, it contained residual metals (in the form of PbSO4, CuSO4, MnSO4, ZnSO4, and MgCl2), diesel fuel, surfactant (as sodium dodecylbenzenesulfonate), and organic substrate (acetate). The synthetic wastewater was characterized by 20 ppm of total petroleum hydrocarbons (TPHs). Briefly, hydrocarbons were dosed as a diesel fuel that was composed by a hydrocarbon mixture comprising the semi-volatile fraction ranging from C10 to C30 and including species with even as well as odd number of carbon atoms (typical diesel range organic (DRO) mix).
Moreover, nutrients (such as NH4Cl and K2HPO4) were added in order to prevent any limitation to the biological process. In order to prevent hydrocarbon volatilization, the synthetic oily wastewater was stored inside a mixed and covered feeding tank. The Quality Assurance/Quality Control (QA/QC) procedures as suggested by United States Environmental Protection Agency [22] have been here adopted during the whole experimental campaign.

2.2. Experimental Procedures

During plant operation, the influent wastewater, the mixed liquor and the membrane permeate were sampled every 3 days and analyzed for total and volatile suspended solid (TSS and VSS) concentrations, chemical oxygen demand (COD), biochemical oxygen demand (BOD), total organic carbon (TOC), aromatic hydrocarbons and total petroleum hydrocarbons (TPH), ammonium nitrogen (NH4–N), nitrite nitrogen (NO2–N), nitrate nitrogen (NO3–N), and total nitrogen (TN).
Moreover, COD was measured in samples collected from mixed liquor and from permeate. In details, the supernatant of samples collected from the mixed liquor was filtered (0.45 µm) before COD analysis. Therefore, it was possible to assess the COD biological removal (only due to the biomass activity, prior to physical membrane filtration) and the total COD removal (due to both biomass activity and membrane filtration). For further details on COD removal, the reader is addressed to literature [6].
Respirometric batch tests were carried out by means of a “flowing gas/static-liquid” type batch respirometer for the evaluation of biomass biokinetic parameters. The biomass samples were taken from the bioreactor of MBR plant and diluted with permeate in order to obtain an MLSS concentration in the range of 2–3 g TSS·L−1. Each respirometric batch test was carried out after a starvation period that guaranteed the endogenous condition within the batch reactor in accordance with the literature [23]. The samples were maintained at a constant temperature of 20 ± 1 °C with a thermostatic cryostat. The aeration intervals were set from 3 to 5 mg O2·L−1. Further details on the adopted procedure and experimental apparatus were described in [23,24].
The fouling analysis was carried out by measuring the total resistance to filtration (RT) according to the following equation:
R T = TMP μ J
where RT is the total fouling resistance (1012 m−1) calculated by the general form of Darcy’s Law, TMP is the transmembrane pressure (Pa), μ the permeate viscosity (Pa·s), and J the permeation flux (m·s−1).
With the aim to investigate the specific deposition mechanisms, it was employed the resistance-in-series (RIS) model based on cake layer removal with the “extraordinary physical cleaning” strategy [25,26]. The superficial cake layer deposition was analyzed by calculating a series of flux and transmembrane pressure (TMP) data before and after the cake layer removal from the membrane surface [27]. Specifically, the RIS model allowed the total resistance to filtration (RT) decomposition according to the following equation:
R T = R m + R PB + R C , irr + R C , rev
where Rm represents the intrinsic membrane resistance; RPB is the irreversible resistance due to particles deposition into the membrane pore; RC,irr is the fouling resistance related to irreversible superficial cake deposition (removable with extraordinary physical cleaning); RC,rev is the fouling resistance related to superficial cake deposition that can be removed by ordinary backwashing.
The Extracellular Polymeric Substances (EPSs) were also measured during the whole experimental campaign. Mixed liquor samples were subject to centrifugation (5000 rpm for 5 min); the supernatant was then analyzed for the soluble microbial product (SMP) content, while the biomass was re-suspended with deionized water and the bound EPS (EPSBound) content was extracted by means of the thermal extraction method [28]. The EPSBound and the SMP concentrations were measured in accordance with literature for both proteins and carbohydrates content [29,30].

3. Results and Discussion

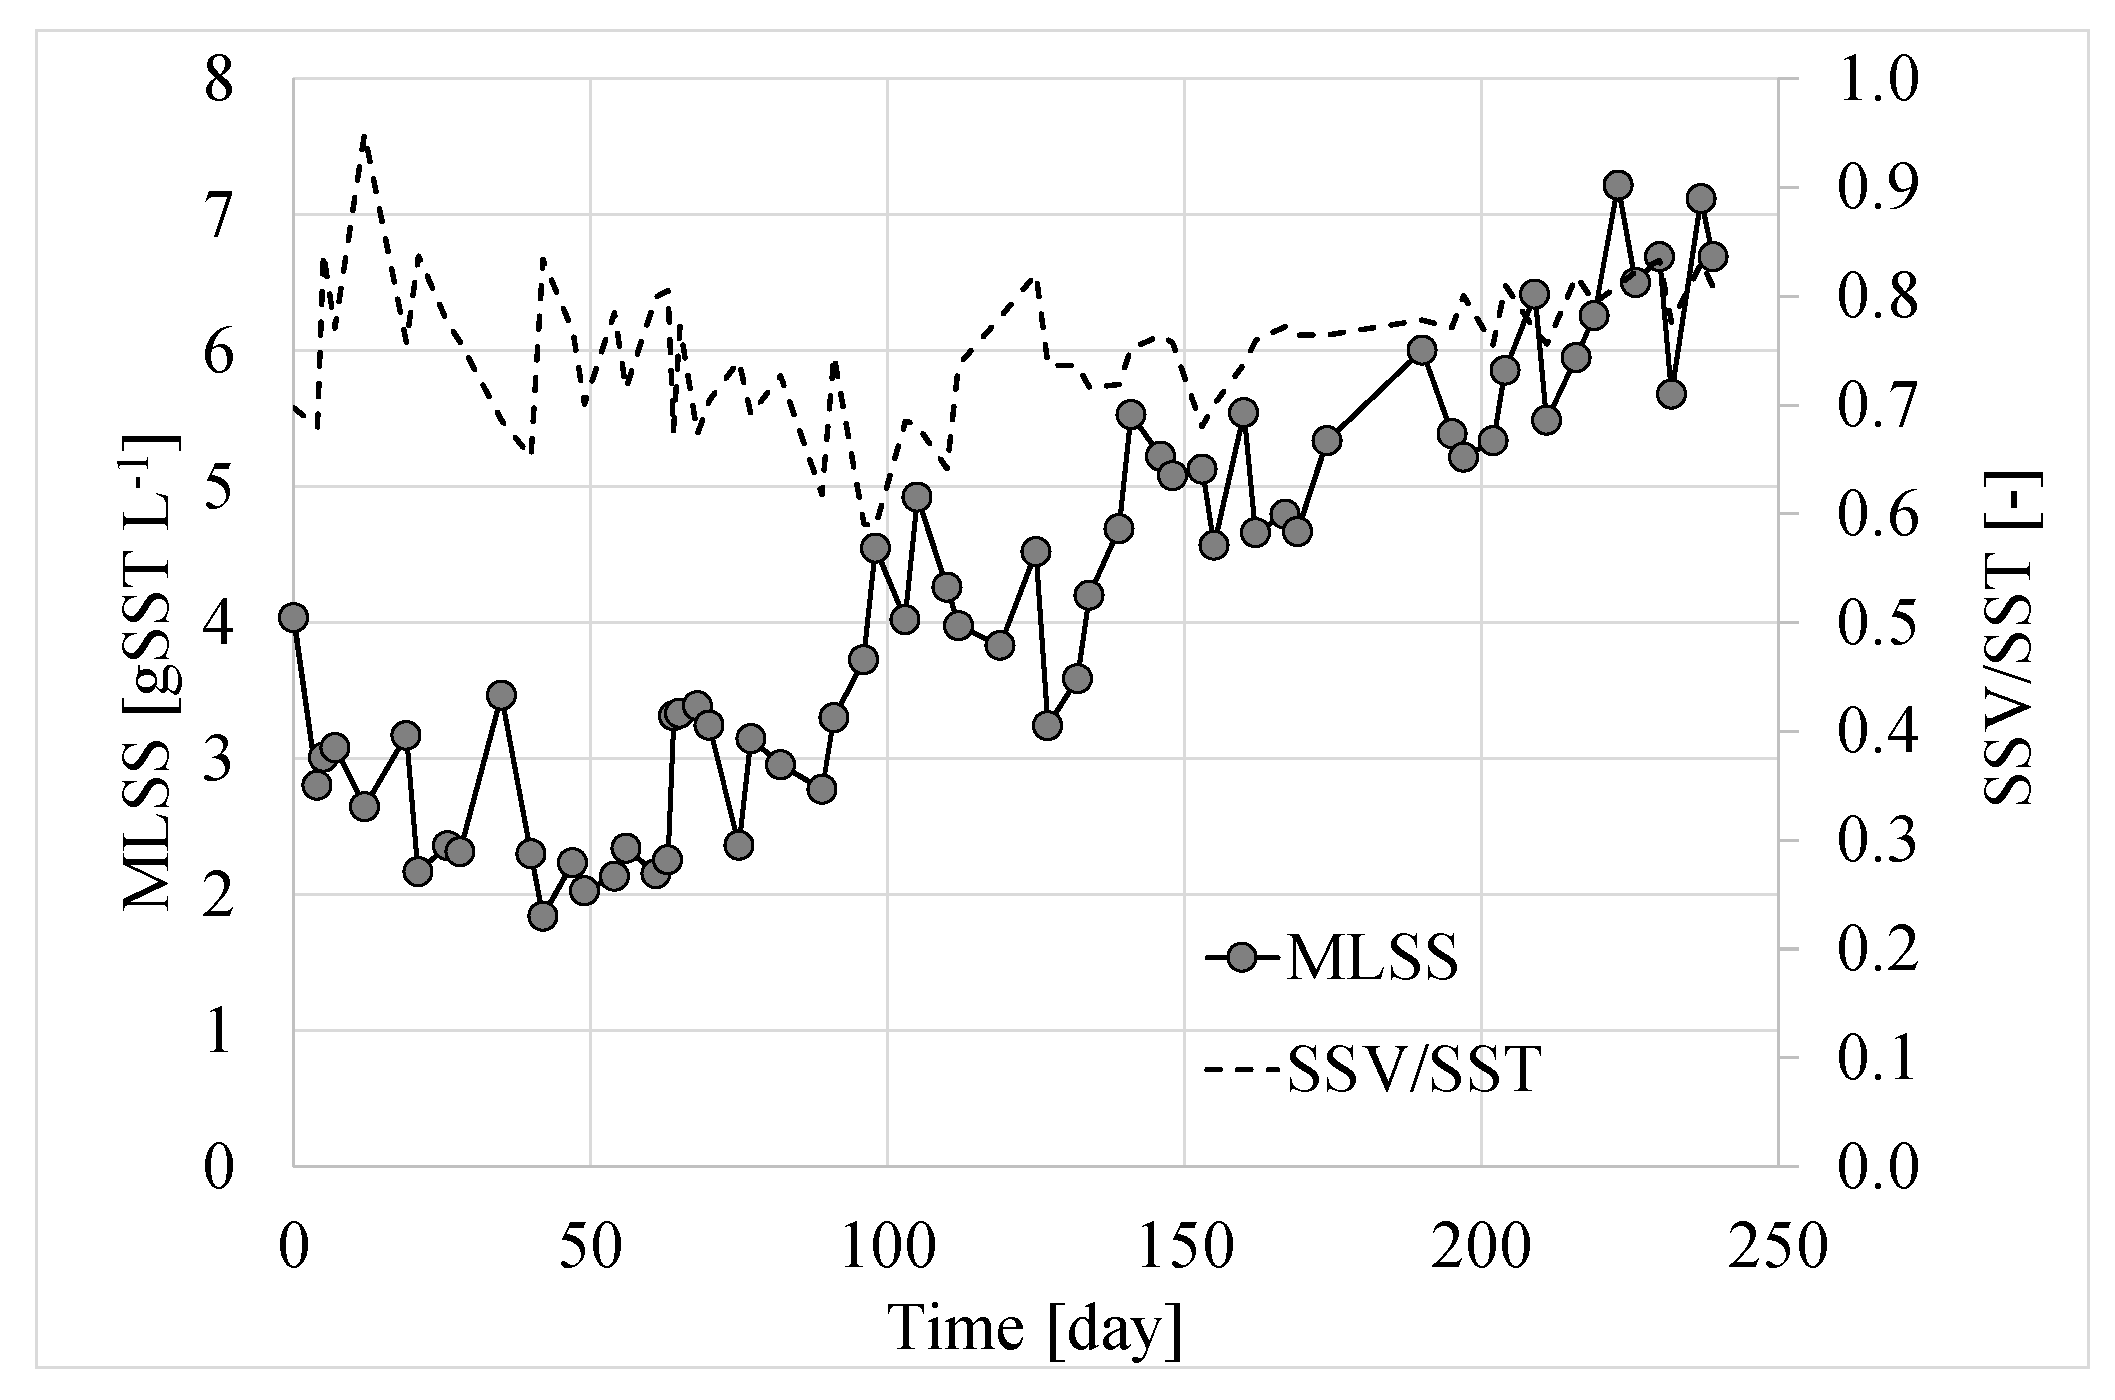
3.1. Suspended Biomass Growth

As aforementioned, the MBR plant was started up with a sludge inoculum, at an MLSS concentration of 4 g TSS·L−1. The suspended biomass trend as well as the VSS/TSS ratio are reported in Figure 2. From the observation of Figure 2, it is worth noting that, until Experimental Day 54, a decrease in suspended biomass was observed. Such a result could be likely related to the stress effect exerted by the hydrocarbons on the biomass that was not fully acclimated to this substrate (not easily biodegradable), according to previous results [31]. Therefore, in order to sustain the biomass activity toward a recalcitrant organic substrate, from Experimental Day 54, it was decided that sodium acetate (500 mg·L−1) would be added to the influent wastewater.
The suspended biomass of the MBR plant constantly increased up to 7 g TSS·L−1, thus suggesting a good acclimation level and development of biomass activity. Indeed, the VSS/TSS ratio reached a stable value at the end of the experiments, almost equal to 0.8, thus highlighting no accumulation of inert material and suggesting the achievement of a satisfying activity of the suspended biomass, as outlined in Section 3.4 below. The gradual acclimation to hydrocarbons is in good agreement with previous results [4].

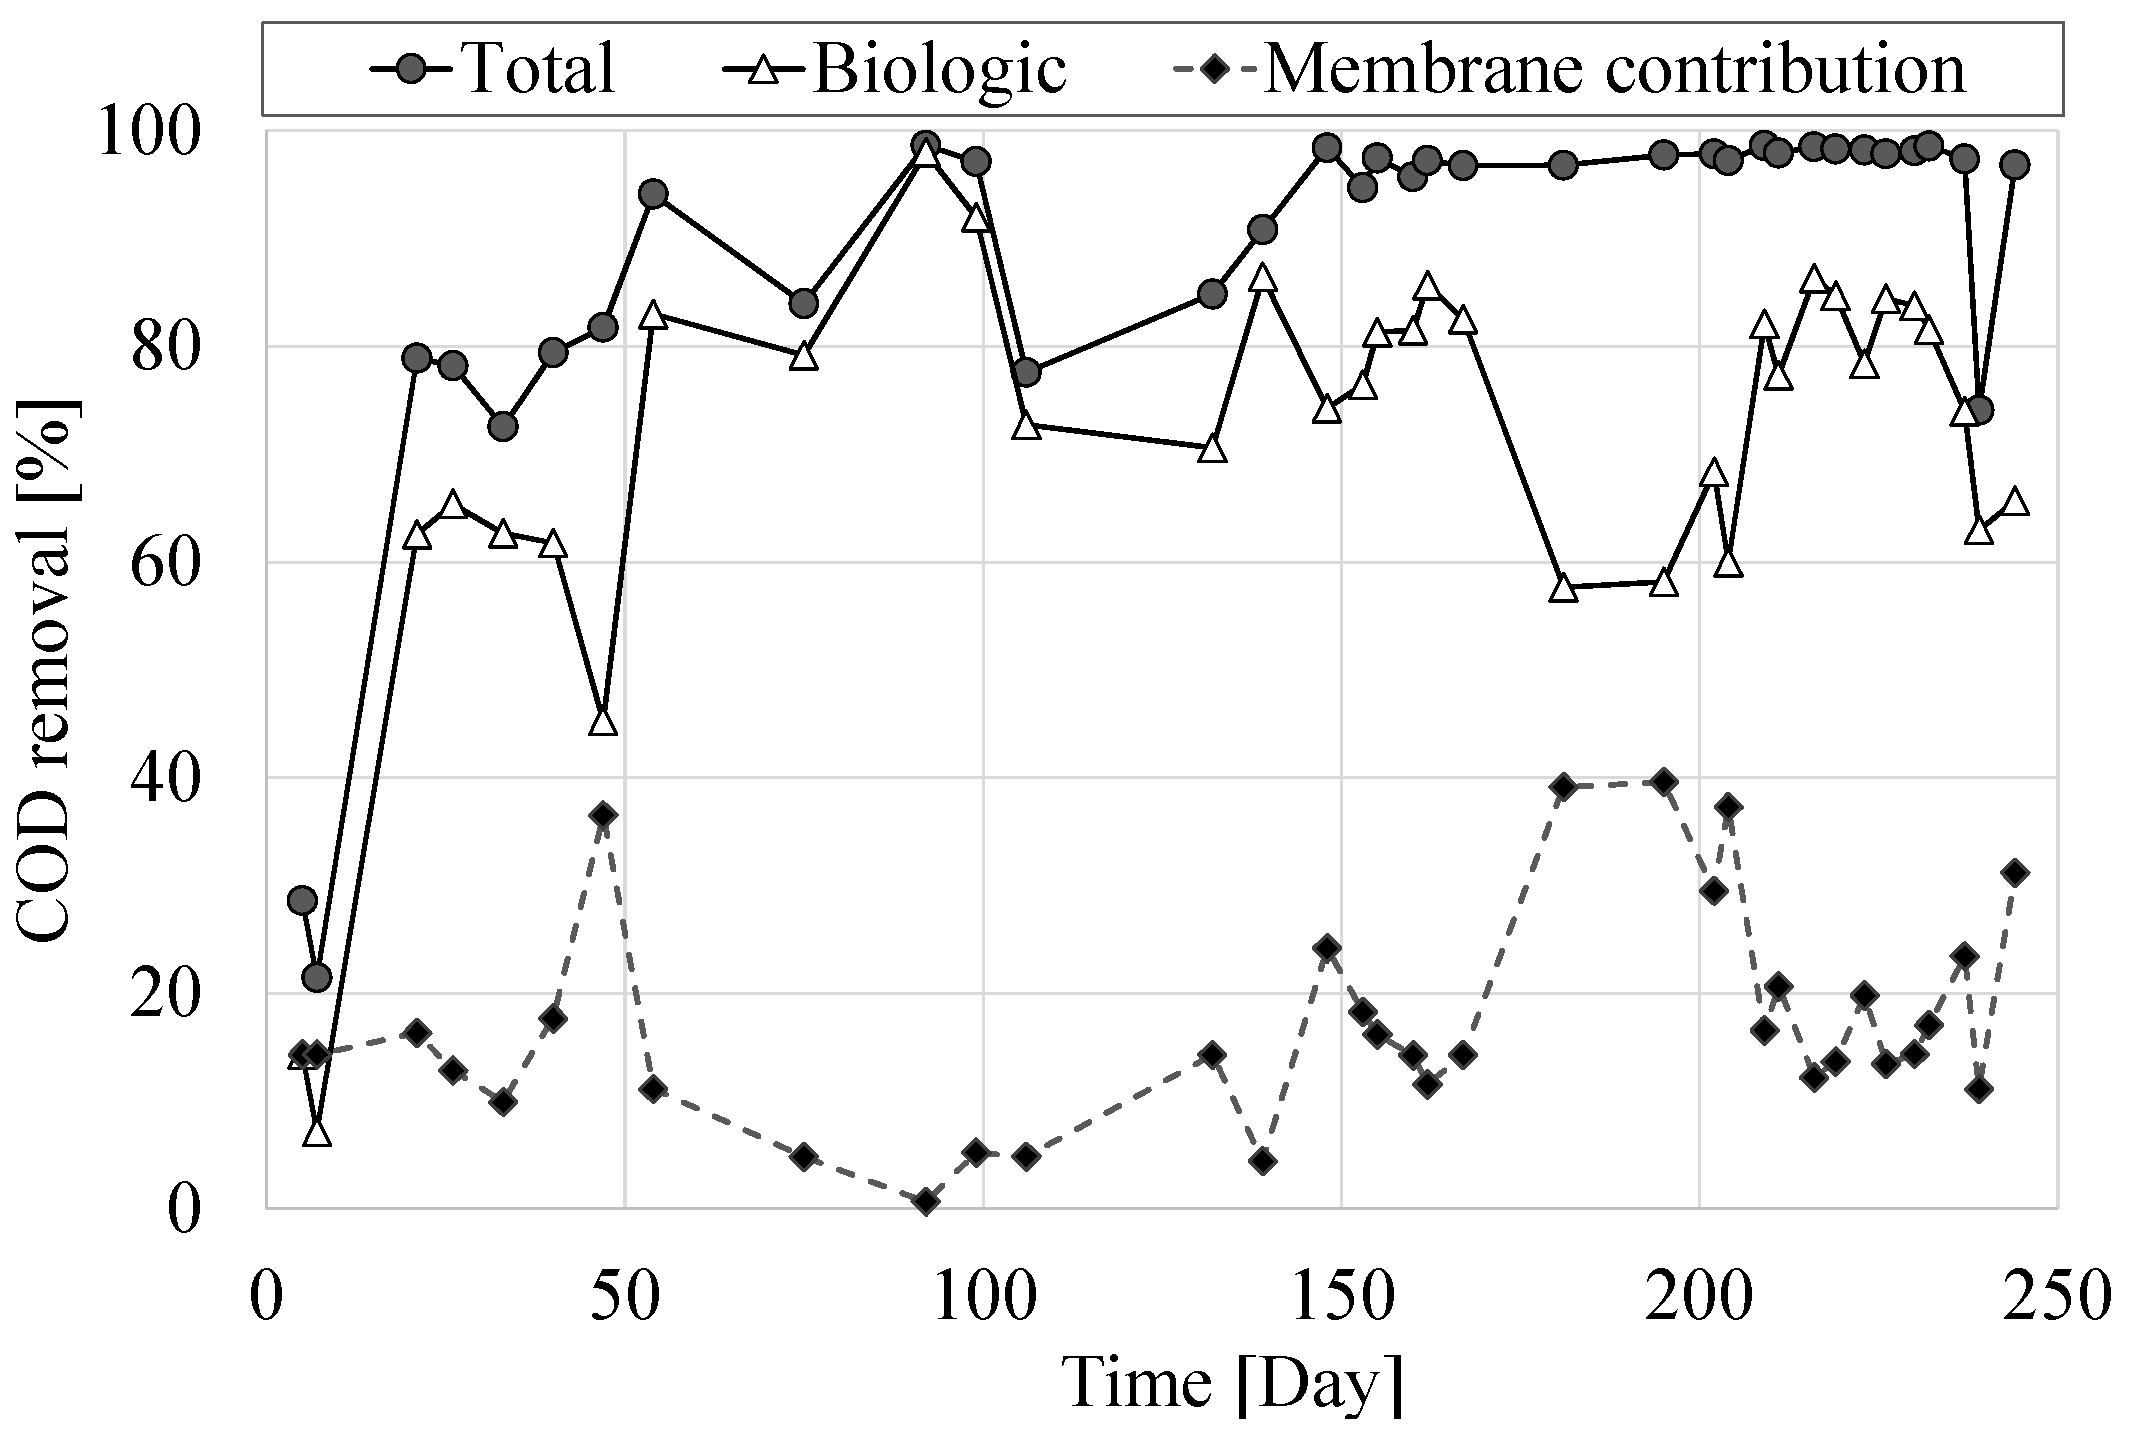
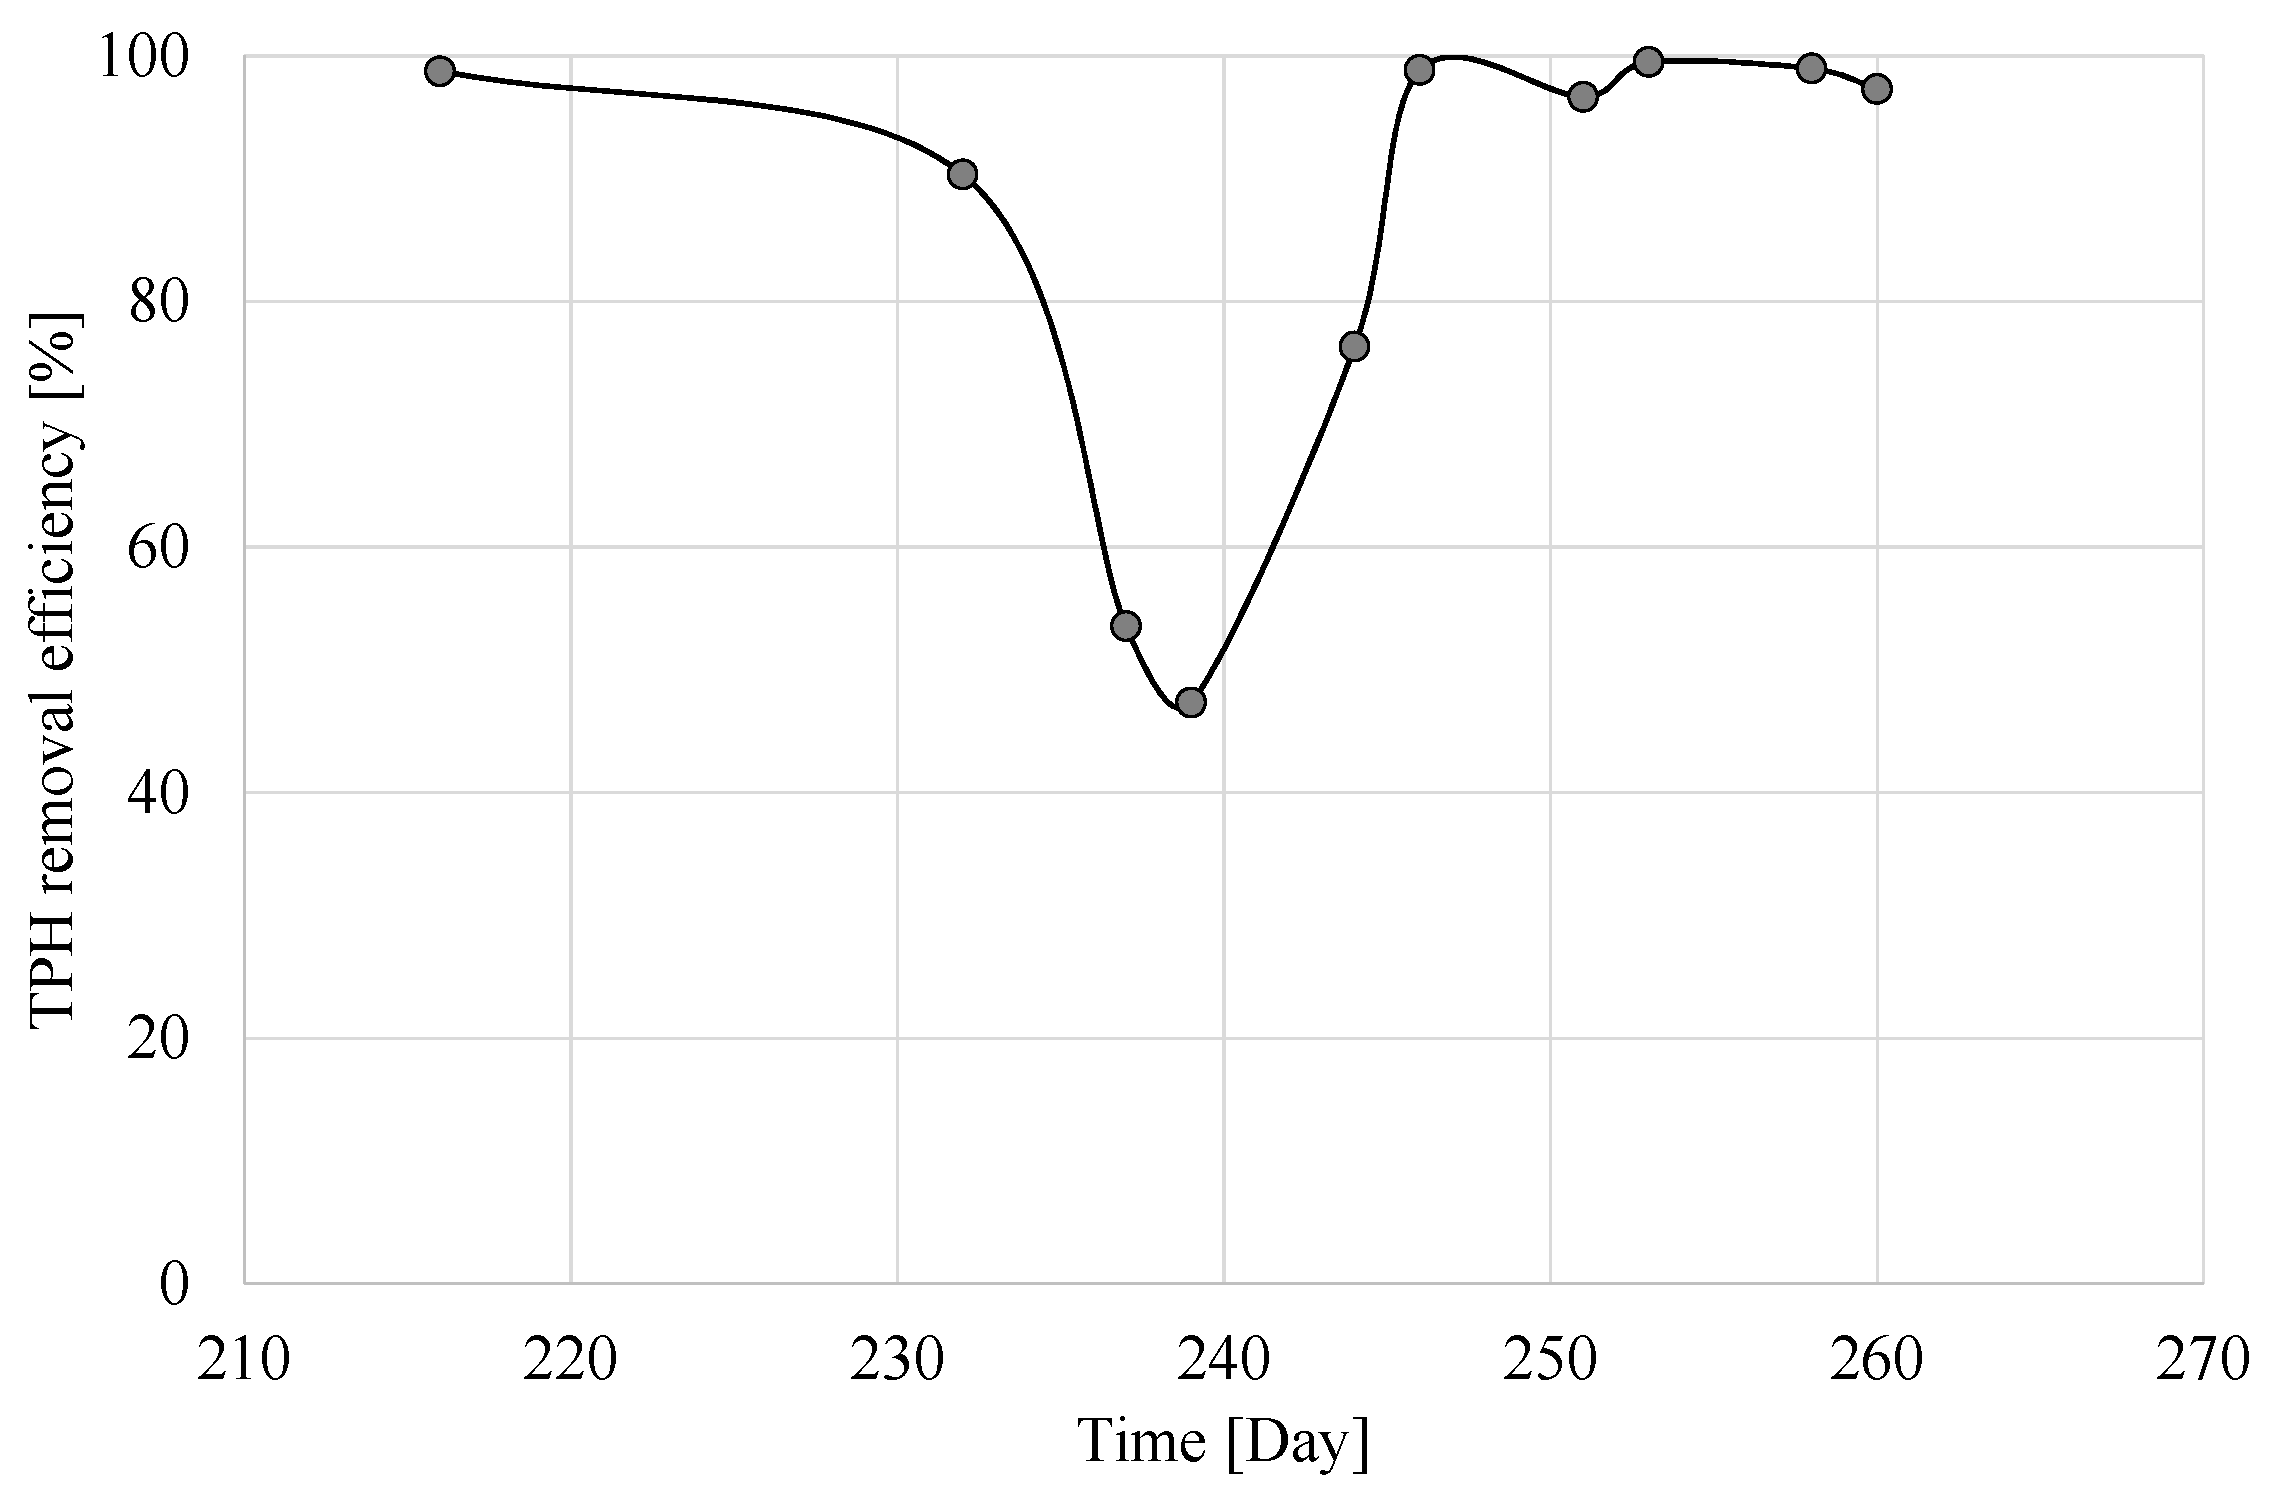
3.2. Organic Carbon and Hydrocarbons Removal

In Figure 3, the “total” and “biological” performances, together with the membrane contribution, are reported. The experimental results highlighted that the MBR system provided good COD removal efficiencies throughout experiments, especially in the last experimental days. Indeed, the total COD removal (average value) was close to 88%, confirming the robustness of MBR systems for the treatment of recalcitrant wastewater. Moreover, the biological contribution was also high, with an average value close to 70%, highlighting a good development of biomass activity, even in the presence of hydrocarbons. Nevertheless, the physical membrane contributed to a further increase in the overall COD removal efficiency by retaining inside the bioreactor all the particles characterized by a dimension higher than the membrane pore size (0.04 μm).
Regarding hydrocarbon removal, Figure 4 shows the aromatic hydrocarbons removal efficiency throughout experiments, evaluated through an ultraviolet analyzer able to measure the aromatic compounds in the collected samples. By analyzing Figure 4, it is possible to observe a substantially high removal efficiency until Day 100 (92% on average). Nevertheless, by Experimental Day 147, a substantial decrease in removal efficiency was noticed. This result can be related to a twofold reason: First, there was a worsening of biomass flocculation properties that affected the removal efficiency. Second, mixing problems occurred in the wastewater storage tank with separate product floating in the upper layer; as a result, the inlet TPH concentration feed to the pilot plant decreased, causing a decrease in TPH removal efficiencies. This aspect points out the importance of a proper pre-treatment of the oily wastewater; indeed, a physical oil and grease removal operations would provide useful results in terms of removal efficiency, simplifying also the biological treatment.
In Figure 5, the TPH removal efficiencies obtained during experiments are shown. Moreover, in the last portion of the experiments, TPH were also measured at the inlet and outlet of the MBR plant. Concerning the observed removal efficiency, the MBR system showed high performance, with an average value higher than 85%. Nevertheless, around Experimental Days 237 and 239, a significant decrease in removal efficiency was observed, down to 47% at Day 239. This result could be due to mixing problems in the wastewater storage tank. However, the overall performance of the MBR system towards TPH removal was satisfactory, thus suggesting a potential application of this configuration for the treatment of wastewater contaminated by hydrocarbons. It is worth noting that the TPH concentration in the permeate was always below the imposed limit of 5 ppm for discharge into the sea.

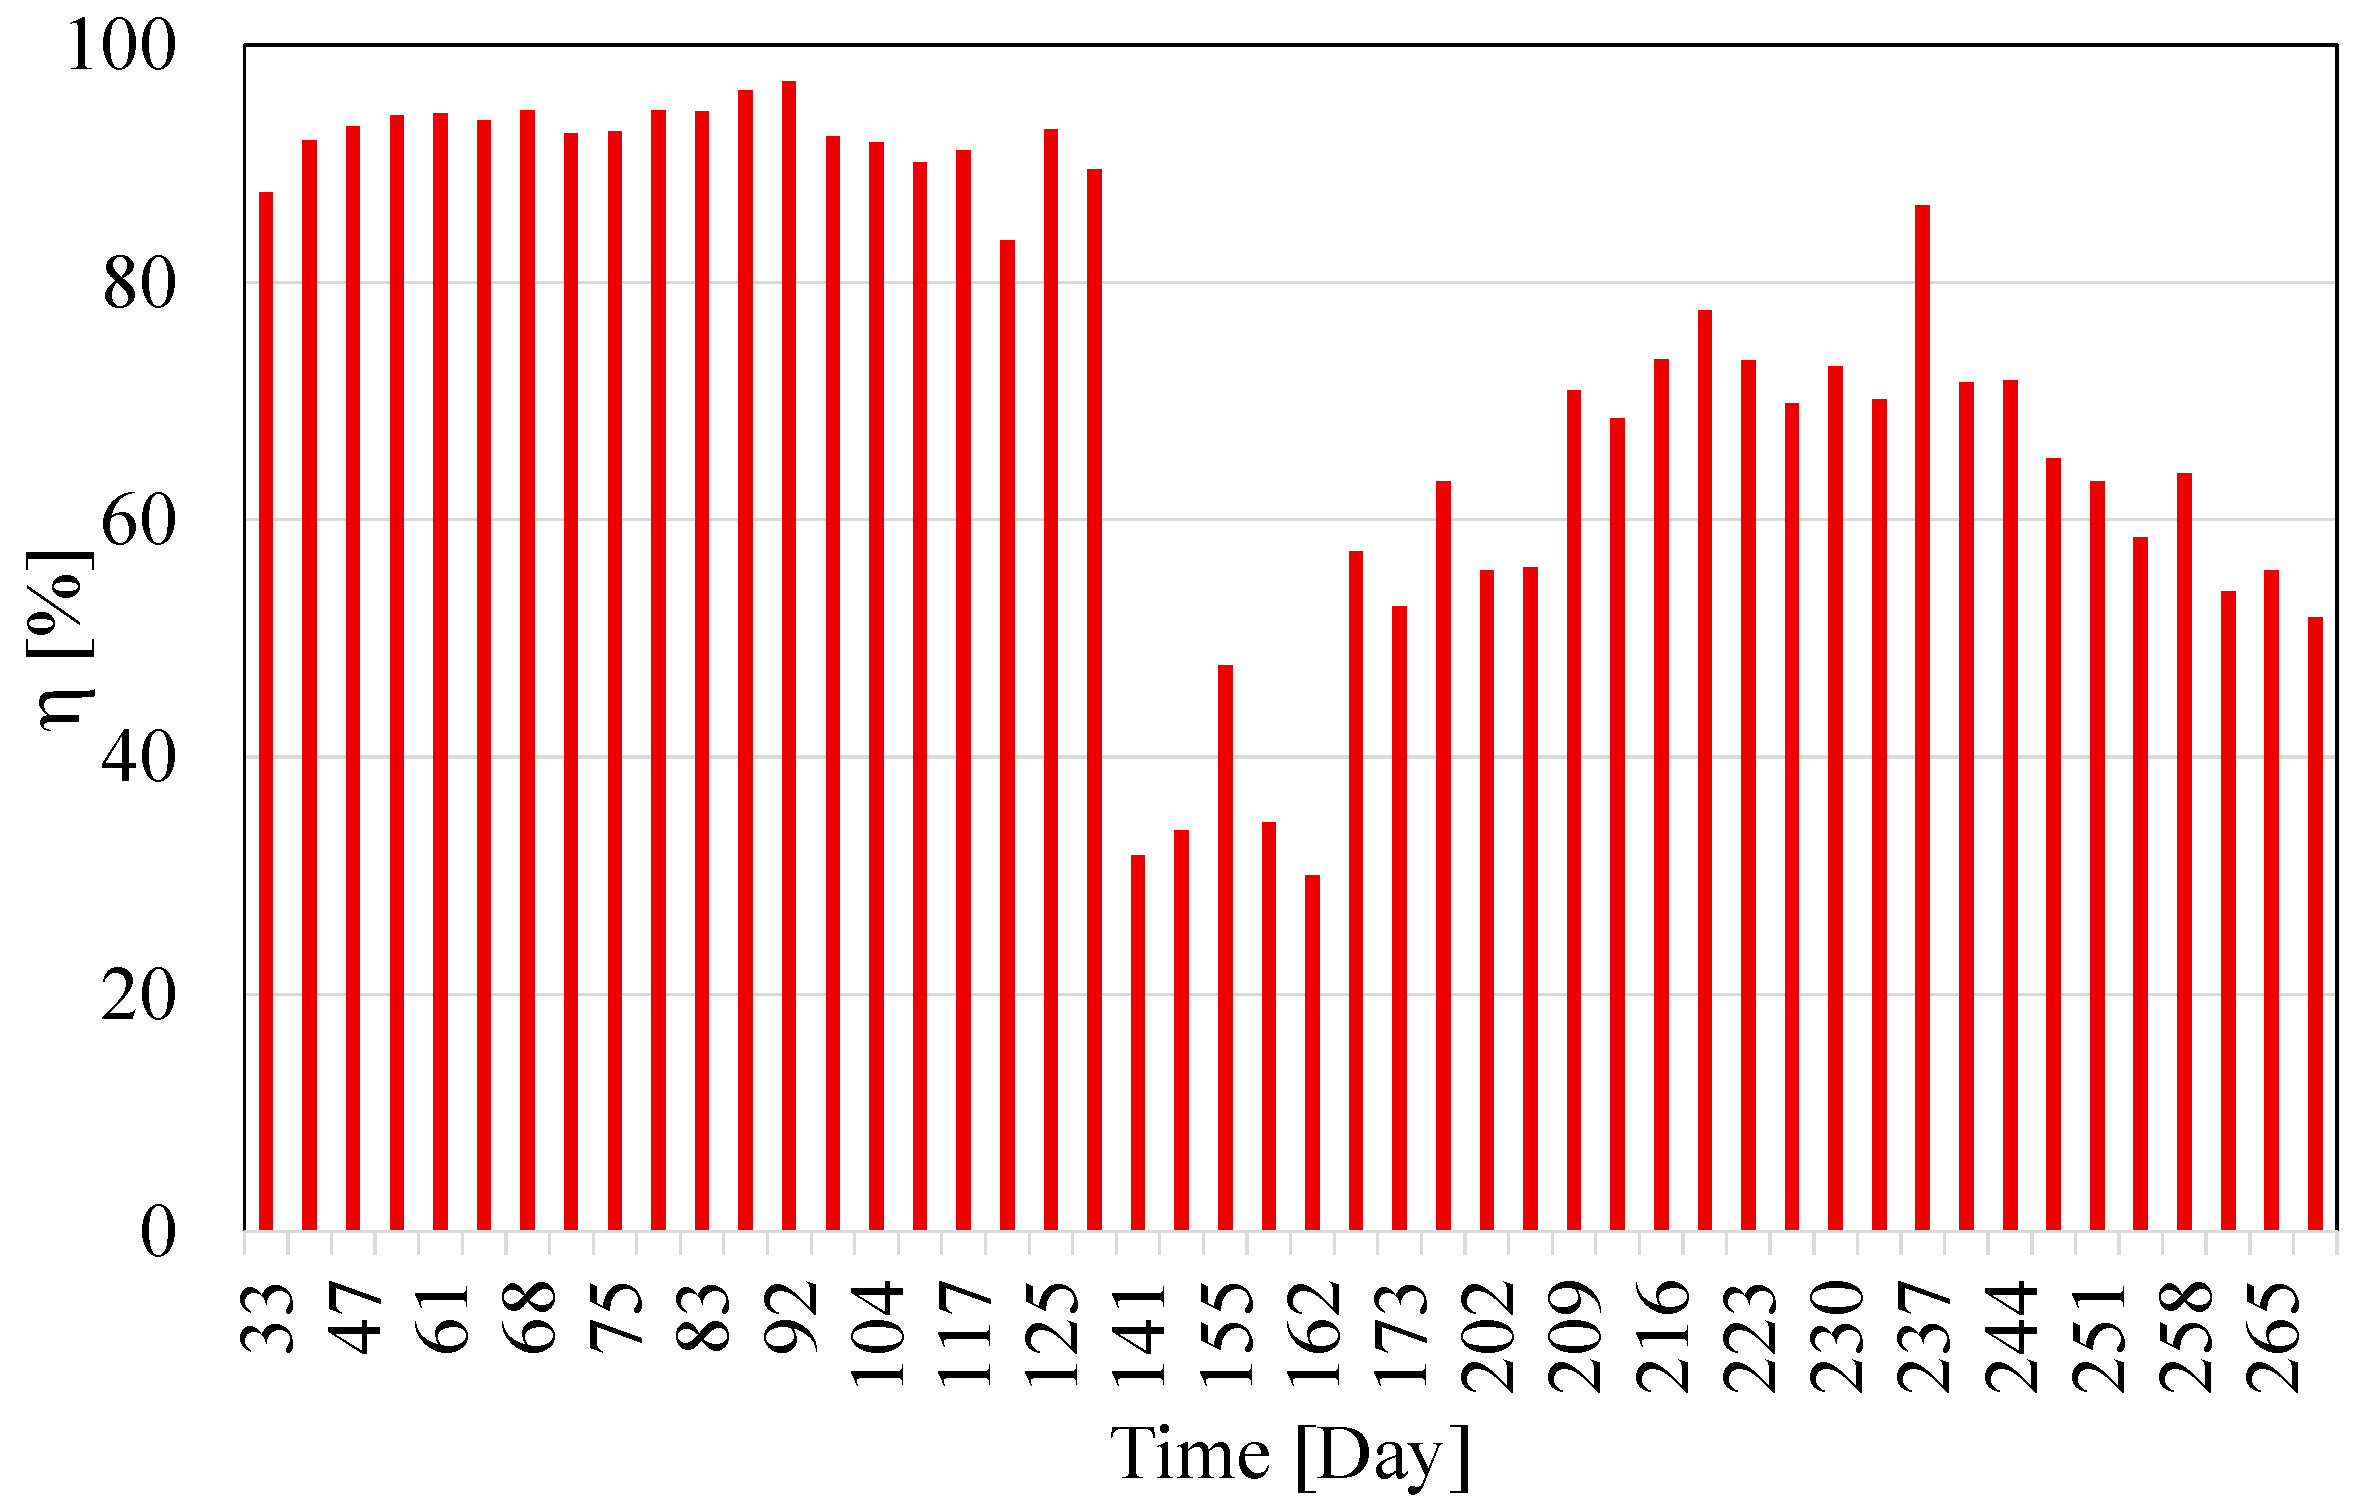
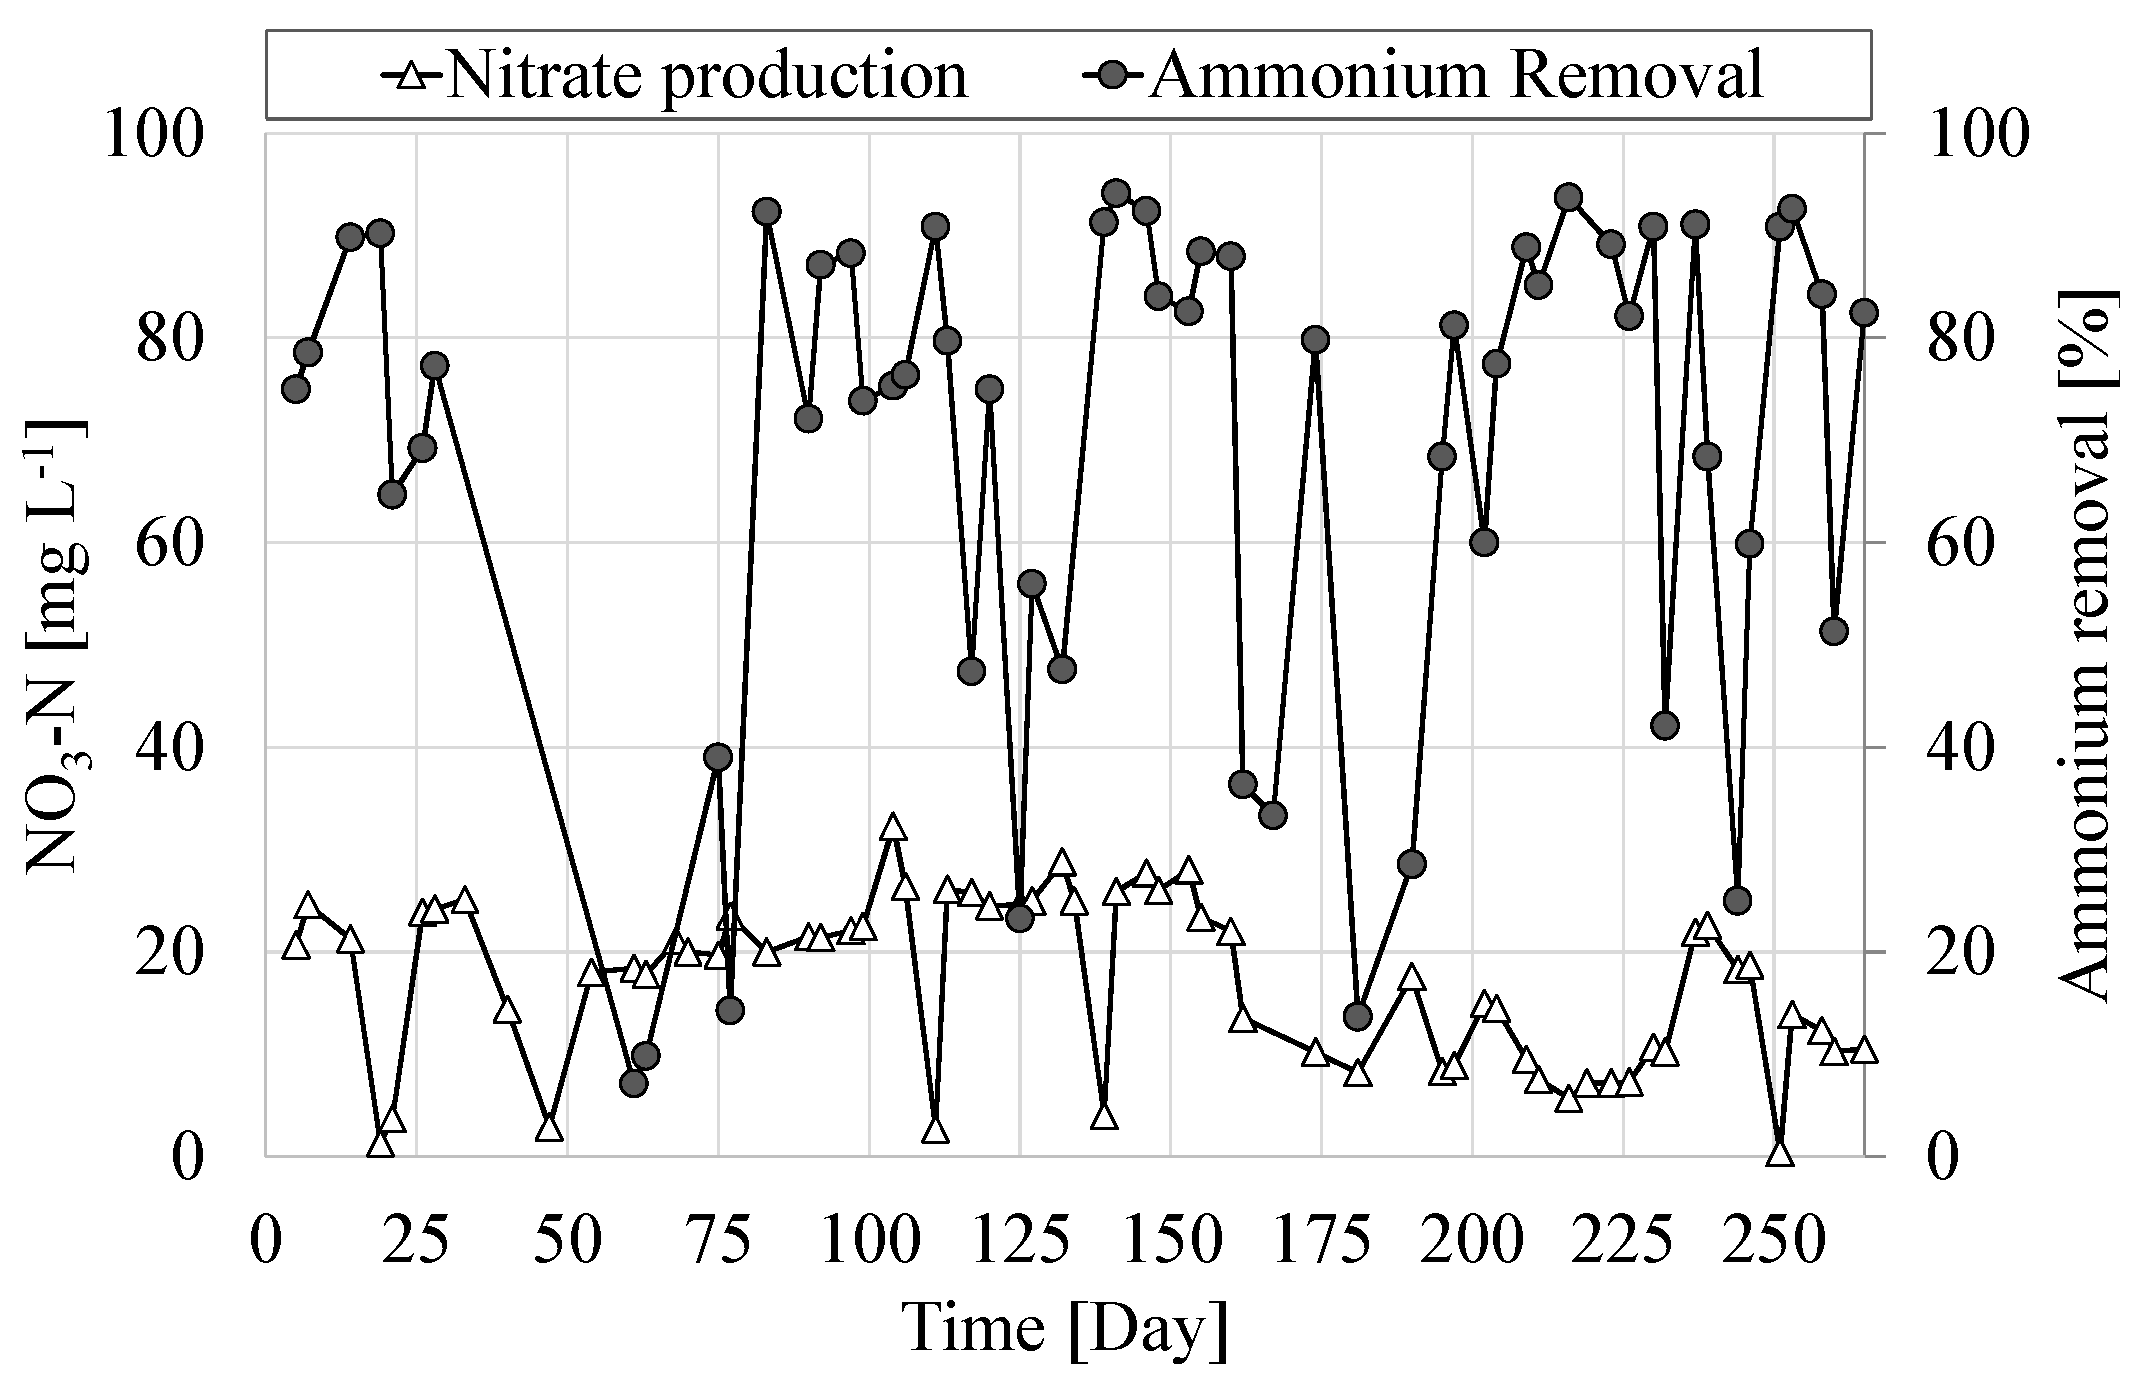
3.3. Nitrification Efficiency

Regarding nitrification, the average value of ammonium removal was close to 70% (Figure 6), highlighting a satisfactory activity of nitrifying species, also confirmed by respirometric batch tests, as better outlined in the following section. The removal efficiency showed slight fluctuations, mainly due to the reduction of the inlet NH4–N concentrations, related to a drawback within the wastewater storage tank. Moreover, the observed results highlighted the absence of nitrite accumulation, suggesting the occurrence of a complete nitrification process throughout experiments, with nitrogen as nitrate concentrations at the outlet generally consistent with the inlet nitrogen as ammonium (Figure 6).

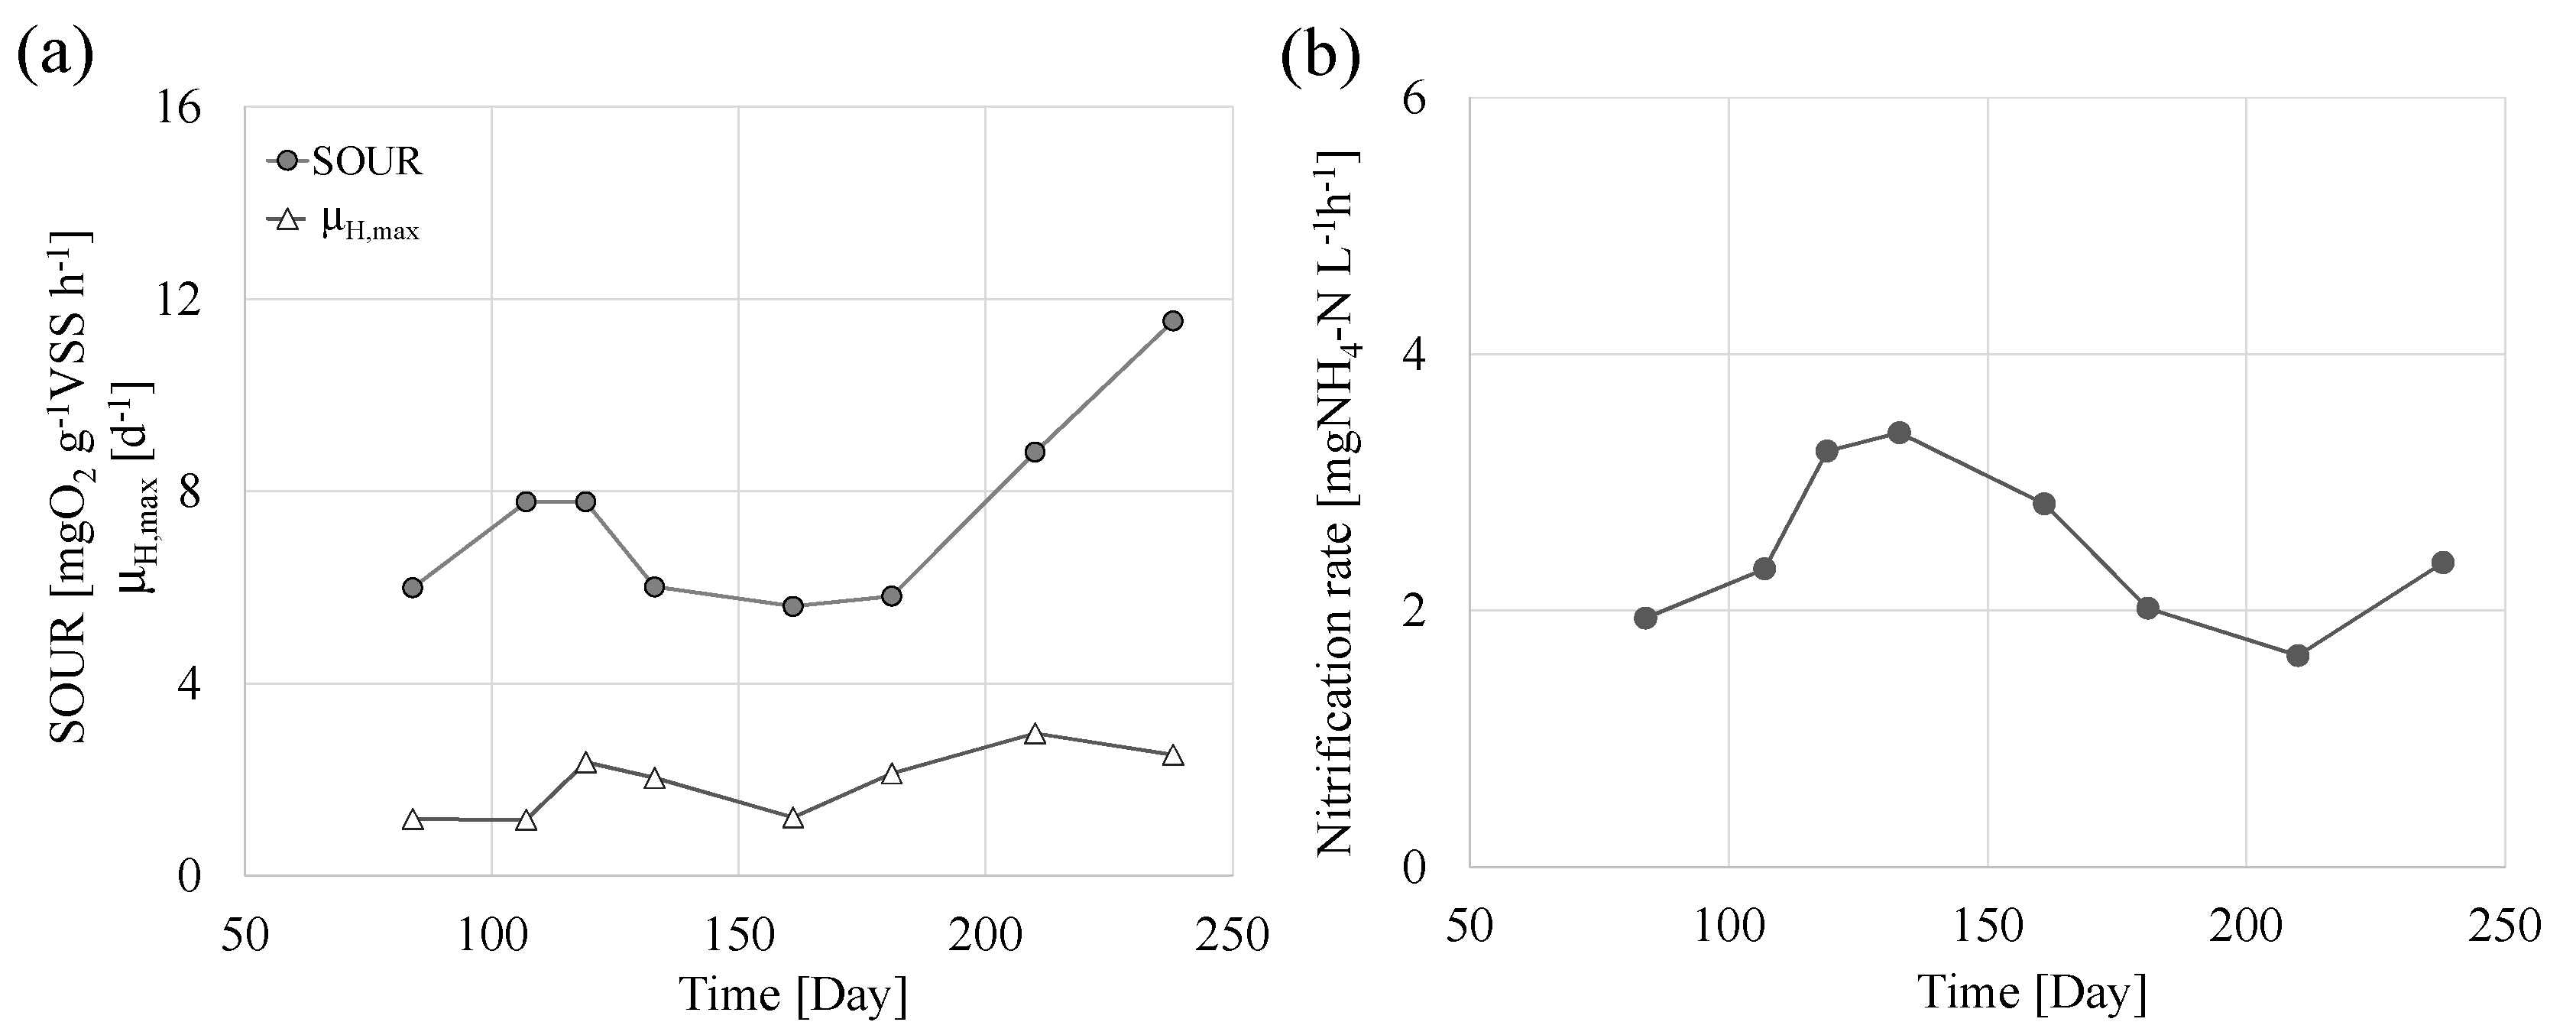
3.4. Biomass Biokinetic Parameters

Respirometric batch tests were carried out for measuring the biomass activity during the experimental campaign by evaluating the main kinetic and stoichiometric parameters of the MBR plant. The obtained kinetic and stoichiometric parameters are consistent with previous results reported in the technical literature for MBR systems that were operated in the presence of hydrocarbons as an organic substrate source [4,5,6]. Table 3 summarizes the average values of the biokinetic and stoichiometric parameters obtained during experiments. The obtained results were in good agreement with previous results obtained in an MBR system treating oily saline wastewater [4], highlighting no significant stress effects on the bacterial consortium due to hydrocarbon accumulation. Figure 7 reports the specific oxygen uptake rate (SOUR) values and the maximum growth rates (μH,max) for heterotrophs (Figure 7a) as well as the nitrification rates (Figure 7b) for nitrifying bacteria during experiments.

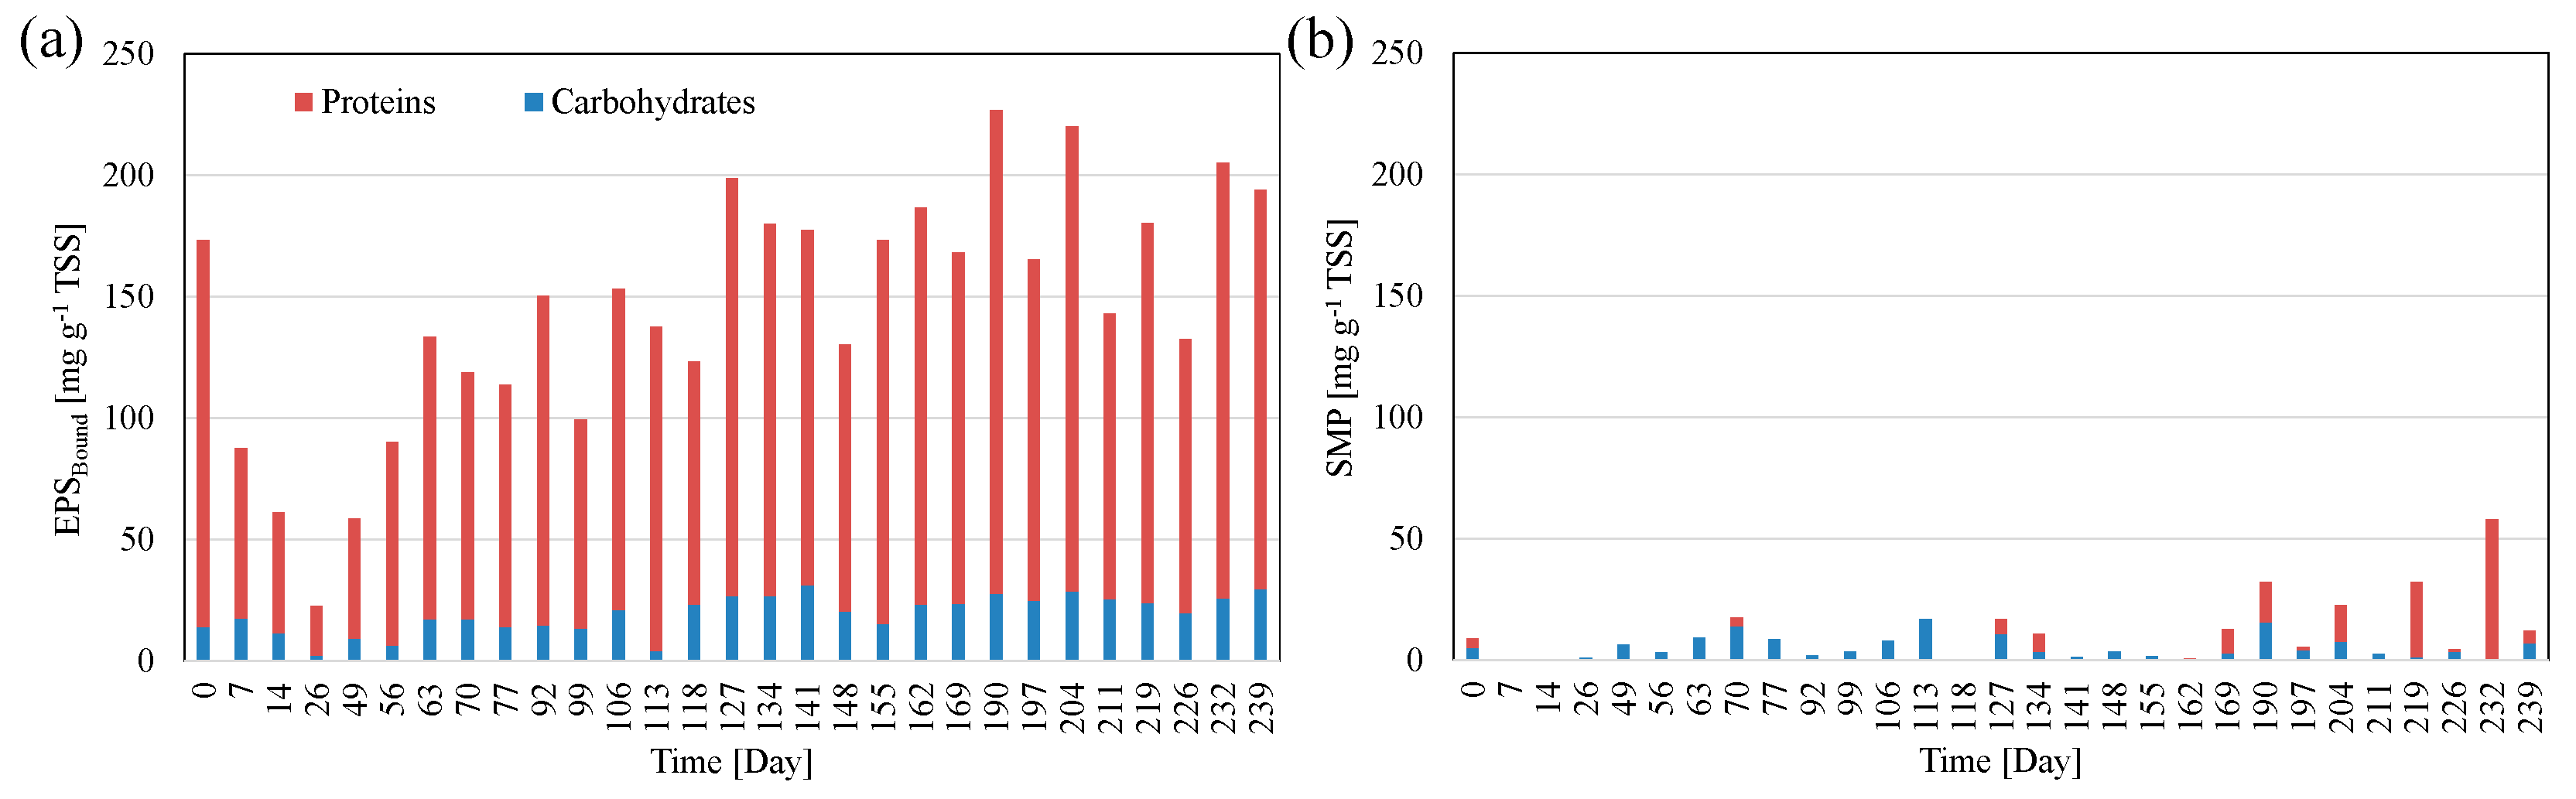
3.5. Extracellular Polymeric Substances Production

Figure 8 reports the EPSBound (Figure 8a) and the SMP (Figure 8b) concentrations during the overall experimental campaign. Regarding EPSBound, a slight decrease in the system up to Experimental Day 26 was noticed. This result could be related to a sort of inhibitory stress exerted by hydrocarbons, with a reduced metabolic activity, thus preventing the production of polymeric substances. Nevertheless, after sodium acetate was added in the influent as rapidly biodegradable substrate, a significant increase in EPSBound concentrations was observed in the MBR plant, mainly as proteins contribution. Conversely, the SMP production and release in the bulk liquid was almost negligible throughout experiments.

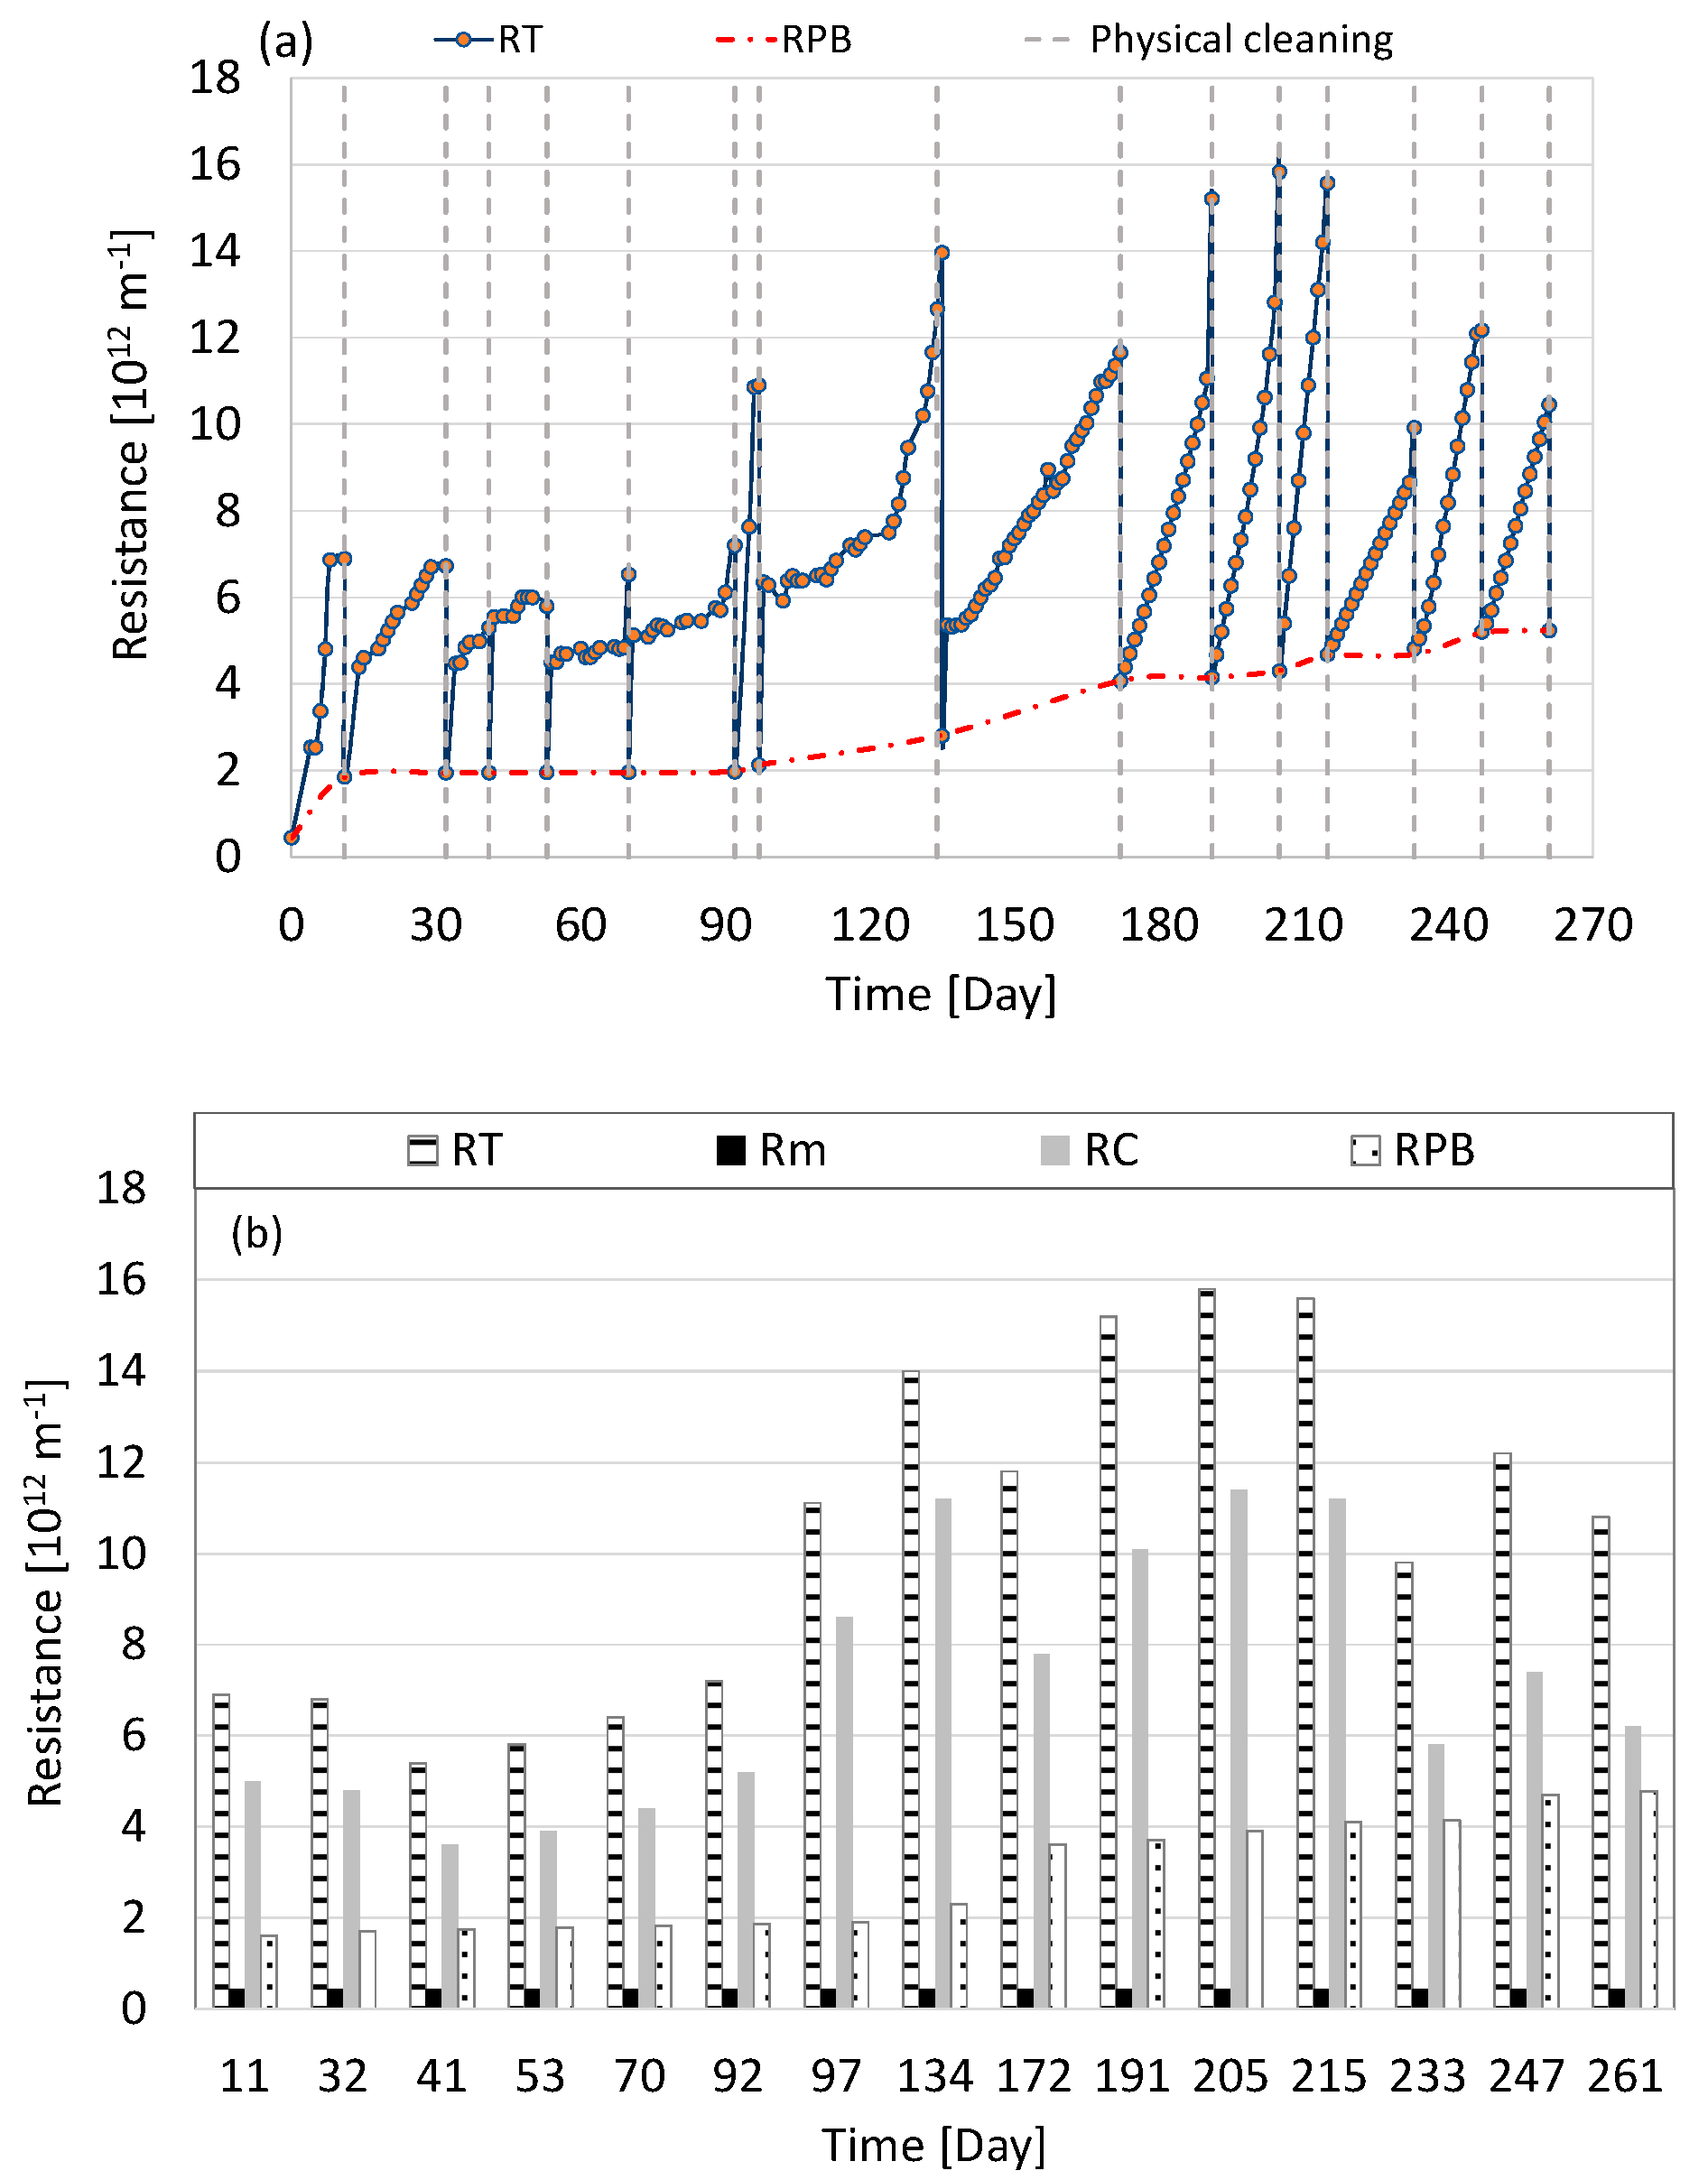
3.6. Membrane Fouling

In Figure 9, the results related to the fouling monitoring are reported. In particular, Figure 9a shows the total resistance over time, whereas Figure 9b reports the resistances related to specific fouling mechanisms, obtained from the application of the RIS model.
By analyzing Figure 9a, one can observe that the total resistance ranged between 0.45 × 10¹² m−1 and 15.9 × 10¹² m−1. An increase in RT until Experimental Day 215 was observed. Conversely, in the last 30 days, a decrease in the total resistance was observed. This result is likely due to the fact that oil fouling on the membrane surface has become less stable and started to be effectively removed by the shearing force from the high cross-flow fluid. Furthermore, a progressive pore fouling occurred as shown by the red line in Figure 9a. During laboratory scale operation, in order to limit the RT value (thus avoiding the critical flux achievement as suggested by the membrane manufacturer), 15 physical cleanings were carried out (Figure 9a,b). As reported in Figure 9b, the results of the RIS model application showed that the main fouling mechanism was due to cake deposition, which is removable with cleaning operations (either physical or chemical). Indeed, the major compound of RT is represented by the resistance due to the cake layer. However, a gradual transfer of foulants from the membrane surface (cake layer deposition) directly to the pores (pore blocking) was observed, with an increase in the resistance due to pore blocking (partially removable with chemical cleanings only).

4. Conclusions

The plant provided good performances both in terms of COD removal and nitrification, thus showing a sort of biomass adaptation to hydrocarbons. Such a result has also been confirmed by the biomass respirometric tests that highlighted a good development of biomass respiratory activity.
Membrane fouling analysis showed a reduction of the total resistance during the last period; this result was most likely due to the hydrocarbon, which caused an irreversible fouling due to the oil deposition on membrane surface.
As a final remark, we suggest that MBR systems might be applied for the treatment of hydrocarbon-contaminated wastewater. However, proper pre-treatments, such as oil and grease removal operation, might be required before the biological step, and a gradual increase in hydrocarbon content might be necessary to enhance biomass acclimation.

Acknowledgments

This research was funded by the National Operational Programme for Research and Competitiveness 2007–2013. Project STI-TAM (Sviluppo di Tecnologie Innovative per il trattamento di rifiuti liquidi della navigazione finalizzate alla Tutela dell’Ambiente Marino)—PON 02_00153_2849085—CUP B61C12000840005; Italian Ministry of Education, University and Research and Ministry of Economic Development.

Author Contributions

Marco Capodici, Alida Cosenza, and Daniele Di Trapani conceived and planned the experiments, designed the pilot plant, carried out the experiments and the relative analytical procedures, and co-authored the paper. Giorgio Mannina and Michele Torregrossa conceived the study, supervised the work, co-authored the paper, edited the English form, and edited figures. Gaspare Viviani conceived the study, supervised the work, and co-authored the paper.

Conflicts of Interest

The authors declare no conflict of interest. The founding sponsors had no role in the design of the study; in the collection, analyses, or interpretation of data; in the writing of the manuscript; or in the decision to publish the results.

References

  1. Di Bella, G.; Giustra, M.G.; Freni, G. Optimisation of coagulation/flocculation for pre-treatment of high strength and saline wastewater: Performance analysis with different coagulant doses. Chem. Eng. J. 2014, 254, 283–292. [Google Scholar] [CrossRef]
  2. Mancini, G.; Panzica, M.; Fino, D.; Cappello, S.; Yakimov, M.M.; Luciano, A. Feasibility of treating emulsified oily and salty wastewaters through coagulation and bio-regenerated GAC filtration. J. Environ. Manag. 2016, in press. [Google Scholar] [CrossRef] [PubMed]
  3. Reid, E.; Liu, X.; Judd, S.J. Effect of high salinity on activated sludge characteristics and membrane permeability in an immersed membrane bioreactor. J. Membr. Sci. 2006, 283, 164–171. [Google Scholar] [CrossRef]
  4. Di Bella, G.; Di Prima, N.; Di Trapani, D.; Freni, G.; Giustra, M.G.; Torregrossa, M.; Viviani, G. Performance of membrane bioreactor (MBR) systems for the treatment of shipboard slops: Assessment of hydrocarbon biodegradation and biomass activity under salinity variation. J. Hazard. Mater. 2015, 300, 765–778. [Google Scholar] [CrossRef] [PubMed]
  5. Mannina, G.; Cosenza, A.; Di Trapani, D.; Capodici, M.; Viviani, G. Membrane bioreactors for treatment of saline wastewater contaminated by hydrocarbons (diesel fuel): An experimental pilot plant case study. Chem. Eng. J. 2016, 291, 269–278. [Google Scholar] [CrossRef]
  6. Mannina, G.; Capodici, M.; Cosenza, A.; Di Trapani, D.; Viviani, G. Sequential batch membrane bio-reactor for wastewater treatment: The effect of increased salinity. Bioresour. Technol. 2016, 209, 205–212. [Google Scholar] [CrossRef] [PubMed]
  7. Campo, R.; Di Prima, N.; Gabriella Giustra, M.; Freni, G.; Di Bella, G. Performance of a moving bed-membrane bioreactor treating saline wastewater contaminated by hydrocarbons from washing of oil tankers. Desalin. Water Treat. 2016, 57, 22943–22952. [Google Scholar] [CrossRef]
  8. Campo, R.; Di Prima, N.; Freni, G.; Giustra, M.G.; Di Bella, G. Start-up of two moving bed membrane bioreactors treating saline wastewater contaminated by hydrocarbons. Water Sci. Technol. 2016, 73, 716–724. [Google Scholar] [PubMed]
  9. Cappello, S.; Volta, A.; Santisi, S.; Morici, C.; Mancini, G.; Quatrini, P.; Genovese, M.; Yakimov, M.M.; Torregrossa, M. Oil-degrading bacteria from a membrane bioreactor (BF-MBR) system for treatment of saline oily waste: Isolation, identification and characterization of the biotechnological potential. Int. Biodeter. Biodegrad. 2016, 110, 235–244. [Google Scholar] [CrossRef]
  10. Abdollahzadeh Sharghi, E.; Bonakdarpour, B.; Pakzadeh, M. Treatment of hypersaline produced water employing a moderately halophilic bacterial consortium in a membrane bioreactor: Effect of salt concentration on organic removal performance, mixed liquor characteristics and membrane fouling. Bioresour. Technol. 2014, 164, 203–213. [Google Scholar] [CrossRef] [PubMed]
  11. Di Trapani, D.; Di Bella, G.; Mannina, G.; Torregrossa, M.; Viviani, G. Comparison between moving bed-membrane bioreactor (MB-MBR) and membrane bioreactor (MBR) systems: Influence of wastewater salinity variation. Bioresour. Technol. 2014, 162, 60–69. [Google Scholar] [CrossRef] [PubMed]
  12. Judd, S. The MBR Book: Principles and Applications of Membrane Bioreactors in Water and Treatment, 2nd ed.; Elsevier: Oxford, UK, 2011. [Google Scholar]
  13. Singh, V.; Purkait, M.K.; Das, C. Cross-flowmicrofiltration of industrial oilywastewater: Experimental and theoretical consideration. Sep. Sci. Technol. 2011, 46, 1213–1223. [Google Scholar] [CrossRef]
  14. Padaki, M.; Surya Murali, R.; Abdullah, M.S.; Misdan, N.; Moslehyani, A.; Kassim, M.A.; Hilal, N.; Ismail, A.F. Membrane technology enhancement in oil–water separation. A review. Desalination 2015, 357, 197–207. [Google Scholar] [CrossRef]
  15. Jin, B.; Wilén, B.M.; Lant, P. Impacts of morphological, physical and chemical properties of sludge flocs on dewaterability of activated sludge. Chem. Eng. J. 2004, 98, 115–126. [Google Scholar] [CrossRef]
  16. Guo, W.; Ngo, H.H.; Li, J. A mini-review on membrane fouling. Bioresour. Technol. 2012, 122, 27–34. [Google Scholar] [CrossRef] [PubMed]
  17. Meng, F.; Chae, S.R.; Drews, A.; Kraume, M.; Shin, H.S.; Yang, F. Recent advances in membrane bioreactors (MBRs): Membrane fouling and membrane material. Water Res. 2009, 43, 1489–1512. [Google Scholar] [CrossRef] [PubMed]
  18. Gao, W.J.; Han, M.N.; Qu, X.; Xu, C.; Liao, B.Q. Characteristics of wastewater and mixed liquor and their role in membrane fouling. Bioresour. Technol. 2013, 128, 207–214. [Google Scholar] [CrossRef] [PubMed]
  19. Zhu, X.; Tu, W.; Wee, K.H.; Bai, R. Effective and low fouling oil/water separation by a novel hollow fiber membrane with both hydrophilic and oleophobic surface properties. J. Membr. Sci. 2014, 466, 36–44. [Google Scholar] [CrossRef]
  20. Dvořák, L.; Svojitka, J.; Wanner, J.; Wintgens, T. Nitrification performance in a membrane bioreactor treating industrial wastewater. Water Res. 2013, 13, 4412–4421. [Google Scholar] [CrossRef] [PubMed]
  21. Mannina, G.; Di Bella, G. Comparing two start-up strategies for MBRs: Experimental study and mathematical modelling. Biochem. Eng. J. 2012, 68, 91–103. [Google Scholar] [CrossRef]
  22. United States Environmental Protection Agency (EPA). Quality Assurance/Quality Control (QA/QC) for 301(h) Monitoring Programs: Guidance on Field and Laboratory Methods: Final Report; Tetra Tech Inc.: Bellevue, WA, USA, 1987.
  23. Capodici, M.; Corsino, S.F.; Di Pippo, F.; Di Trapani, D.; Torregrossa, M. An innovative respirometric method to assess the autotrophic active fraction: Application to an alternate oxic-anoxic MBR pilot plant. Chem. Eng. J. 2016, 300, 367–375. [Google Scholar] [CrossRef]
  24. Di Trapani, D.; Di Bella, G.; Mannina, G.; Torregrossa, M.; Viviani, G. Effect of C/N shock variation on the performances of a moving bed membrane bioreactor. Bioresour. Technol. 2015, 189, 250–257. [Google Scholar] [CrossRef] [PubMed]
  25. Meng, F.; Zhang, H.M.; Li, Y.S.; Zhang, X.W.; Yang, F.L.; Xiao, J.N. Cake layer morphology in microfiltration of activated sludge wastewater based on fractal analysis. Sep. Purif. Technol. 2005, 44, 250–257. [Google Scholar] [CrossRef]
  26. Meng, F.; Yang, F. Fouling mechanisms of deflocculated sludge, normal sludge, and bulking sludge in membrane bioreactor. J. Membr. Sci. 2007, 305, 48–56. [Google Scholar] [CrossRef]
  27. Di Bella, G.; Durante, F.; Torregrossa, M.; Viviani, G.; Mercurio, P.; Cicala, A. The role of fouling mechanisms in a membrane bioreactor. Water Sci. Technol. 2007, 55, 455–464. [Google Scholar] [CrossRef] [PubMed]
  28. Cosenza, A.; Di Bella, G.; Mannina, G.; Torregrossa, M. The role of EPS in fouling and foaming phenomena for a membrane bioreactor. Bioresour. Technol. 2013, 147, 184–192. [Google Scholar] [CrossRef] [PubMed]
  29. Lowry, O.H.; Rosebrough, N.J.; Farr, A.L.; Randall, R.J. Protein measurement with the Folin-Phenol Reagent. J. Biol. Chem. 1951, 193, 265–275. [Google Scholar] [PubMed]
  30. Dubois, M.; Gilles, K.A.; Hamilton, J.K.; Rebers, P.A.; Smith, F. Colorimetric Method for Determination of sugars and related substances. Anal. Chem. 1956, 28, 350–356. [Google Scholar] [CrossRef]
  31. Reza Razavi, S.M.; Miri, T. A real petroleum refinery wastewater treatment using hollow fiber membrane bioreactor (HF-MBR). J. Water Proc. Eng. 2015, 8, 136–141. [Google Scholar] [CrossRef]
Figure 1. Pilot plant schematic layout.
Water 09 00412 g001
Figure 2. Suspended biomass trend and volatile suspended solid/total suspended solid (VSS/TSS) ratio during the experiments.
Water 09 00412 g002
Figure 3. Chemical oxygen demand (COD) removal efficiency throughout experiments.
Water 09 00412 g003
Figure 4. Aromatic hydrocarbons removal efficiency throughout experiments.
Water 09 00412 g004
Figure 5. Total petroleum hydrocarbon (TPH) removal efficiency pattern during experiments.
Water 09 00412 g005
Figure 6. Nitrate production and ammonium removal efficiency throughout experiments.
Water 09 00412 g006
Figure 7. SOUR and maximum growth rates (a) for heterotrophic species and nitrification rates (b) for autotrophic species.
Water 09 00412 g007
Figure 8. Extracellular Polymeric Substance (EPS) (a) and soluble microbial product (SMP) (b) concentration during experiment.
Water 09 00412 g008
Figure 9. Trend of the total resistance (a); results related to the resistance-in-series (RIS) model application (b).
Water 09 00412 g009
Table 1. Average characteristics of the feeding wastewater.
ParameterUnitsValue
Chemical oxygen demand (COD)[mg·L−1]500
Total petroleum hydrocarbon (TPH)[ppm]20
Ammonium nitrogen (NH4–N)[mg·L−1]20
Conductivity[mS·cm−1]1.6
Table 2. Operational conditions.
ParameterUnitsValue
Permeate Flux[L·m−2·h−1]15
Flow rate[L·h−1]0.8
HRT[h]27
Table 3. Kinetic and stoichiometric parameters.
HeterotrophicYHµH maxKSOURmaxSOUR
mg VSS∙mg COD−1d−1mg COD∙L−1mg O2∙L−1∙h−1mg O2∙g VSS−1∙h−1
average0.641.9710.8817.207.28
St. deviation0.050.6510.885.231.95
AutotrophicYAµA maxKNOURmaxNitrification rate
mg VSS∙mg N−1d−1mg N∙L−1mg O2∙L−1∙h−1mg N∙L−1∙h−1
average0.200.230.1613.732.37
St. deviation0.090.090.113.320.66

