Article

The Usefulness of the Lombard Method for Analyzing the Hydrological Impacts of Dams: The Case of the Manouane River Diversion Dam, Quebec, Canada

by
Ali Arkamose Assani
Department of Environmental Sciences, University of Quebec at Trois-Rivières, 3351 Boulevard des Forges, Trois-Rivières, QC G9A 5H7, Canada
Water 2016, 8(9), 410; https://doi.org/10.3390/w8090410
Submission received: 23 June 2016 / Revised: 7 September 2016 / Accepted: 9 September 2016 / Published: 21 September 2016

Abstract

:
The goal of this study is to demonstrate the usefulness of the Lombard method for analyzing dam-induced hydrologic impacts. The method was used to accurately detect the effects of the construction of a diversion dam in 2003 on annual and seasonal maximum and minimum daily flows in the Manouane River, Quebec, Canada, measured from 1980 to 2014. The Lombard method yields results that are nearly identical to results obtained using the monitoring (Kruskal-Wallis test) and long-term trend (Mann-Kendall test) methods. The Lombard method revealed a shift in mean values of annual and seasonal minimum daily flows in 2003, the year the dam was built. This shift is sharp for all four seasons. The dam induced a significant decrease in minimum daily flows in all four seasons. As far as maximum daily flows are concerned, unlike the monitoring method, the Lombard method detected a significant decrease only in the mean values of annual and spring maximum daily flows. This decrease occurred two years prior to the construction of the diversion dam. Instead, this decrease is interpreted to be the result of a significant decrease in spring precipitation after 1997. These hydrological changes are different from those induced by other types of dams in Quebec.

1. Introduction

Four methods are generally used for analyzing the impacts of dams on streamflow [1]:
  • The monitoring station method, which consists of comparing the streamflow or water level before and after the construction of a dam. This is the most widely used method in the scientific literature to constrain the impacts of dams, and it is considered to be the most precise (e.g., [2,3,4,5,6,7,8,9,10]);
  • The control station method, which consists of comparing flows downstream from a dam with flows upstream from it or from another undammed natural stream (e.g., [11,12,13,14,15,16,17]). This method is used when flow measurements for the period prior to dam construction are lacking;
  • The natural flow reconstruction method, which consists of comparing flows reconstructed under natural conditions using a hydrological model (e.g., [18,19]) or from hydroelectricity production (e.g., [20]) with those observed after dam construction;
  • The long-term trend method, which consists of comparing the long-term trend of the temporal variability of flows before and after dam construction using the Mann-Kendall and/or linear regression methods (e.g., [21]).
These four methods, however, are plagued by several shortcomings both from a hydrological and a statistical standpoint:
  • They do not allow the accurate determination of the sharp or gradual nature of dam-induced changes in streamflow, a very important consideration in ecohydrology, because it affects the capacity of aquatic and semi-aquatic organisms to adapt to such changes. It is easy to understand that a sharp change in streamflow would not allow as much time for these organisms to adapt as a gradual change would. Thus, the ecological impacts induced by a sharp change in flows would be much greater than those induced by a gradual change;
  • They do not allow the statistically accurate assignment of hydrological impacts that occur after the construction of a dam to the presence of that dam. While it is reasonable to assign hydrological changes occurring immediately after construction of a dam to the dam itself, some hydrological changes may occur just before dam construction (due to climate change and/or change in land use) and later be amplified by the dam. In the case of gradual hydrological changes, the effects of dams may occur later, making it difficult to link them directly to dam construction;
  • They do not accurately distinguish the effects of various factors (dam construction, urbanization, land use change, climate change, etc.) in a watershed;
  • They do not allow the detection of multiple hydrological changes that may occur after the construction of a dam, including some that may not be induced by the dam itself. For instance, later climate change may dampen or amplify dam-induced hydrologic impacts.
To overcome these shortcomings and improve the performance of these four methods, we propose a complimentary analysis method as part of this study, namely the Lombard method. For illustration purposes, this method is used to analyze the impacts of a diversion dam built in 2003 on annual and seasonal maximum and minimum daily flows in the Manouane River, Quebec. These flow variables were selected because of their strong sensitivity to dam construction. In order to demonstrate the usefulness of the Lombard method for analyzing hydrologic impacts induced by dams, results obtained using this method are compared to those obtained using the monitoring and Mann-Kendall methods.

2. Methods

2.1. Study Site and Data Sources

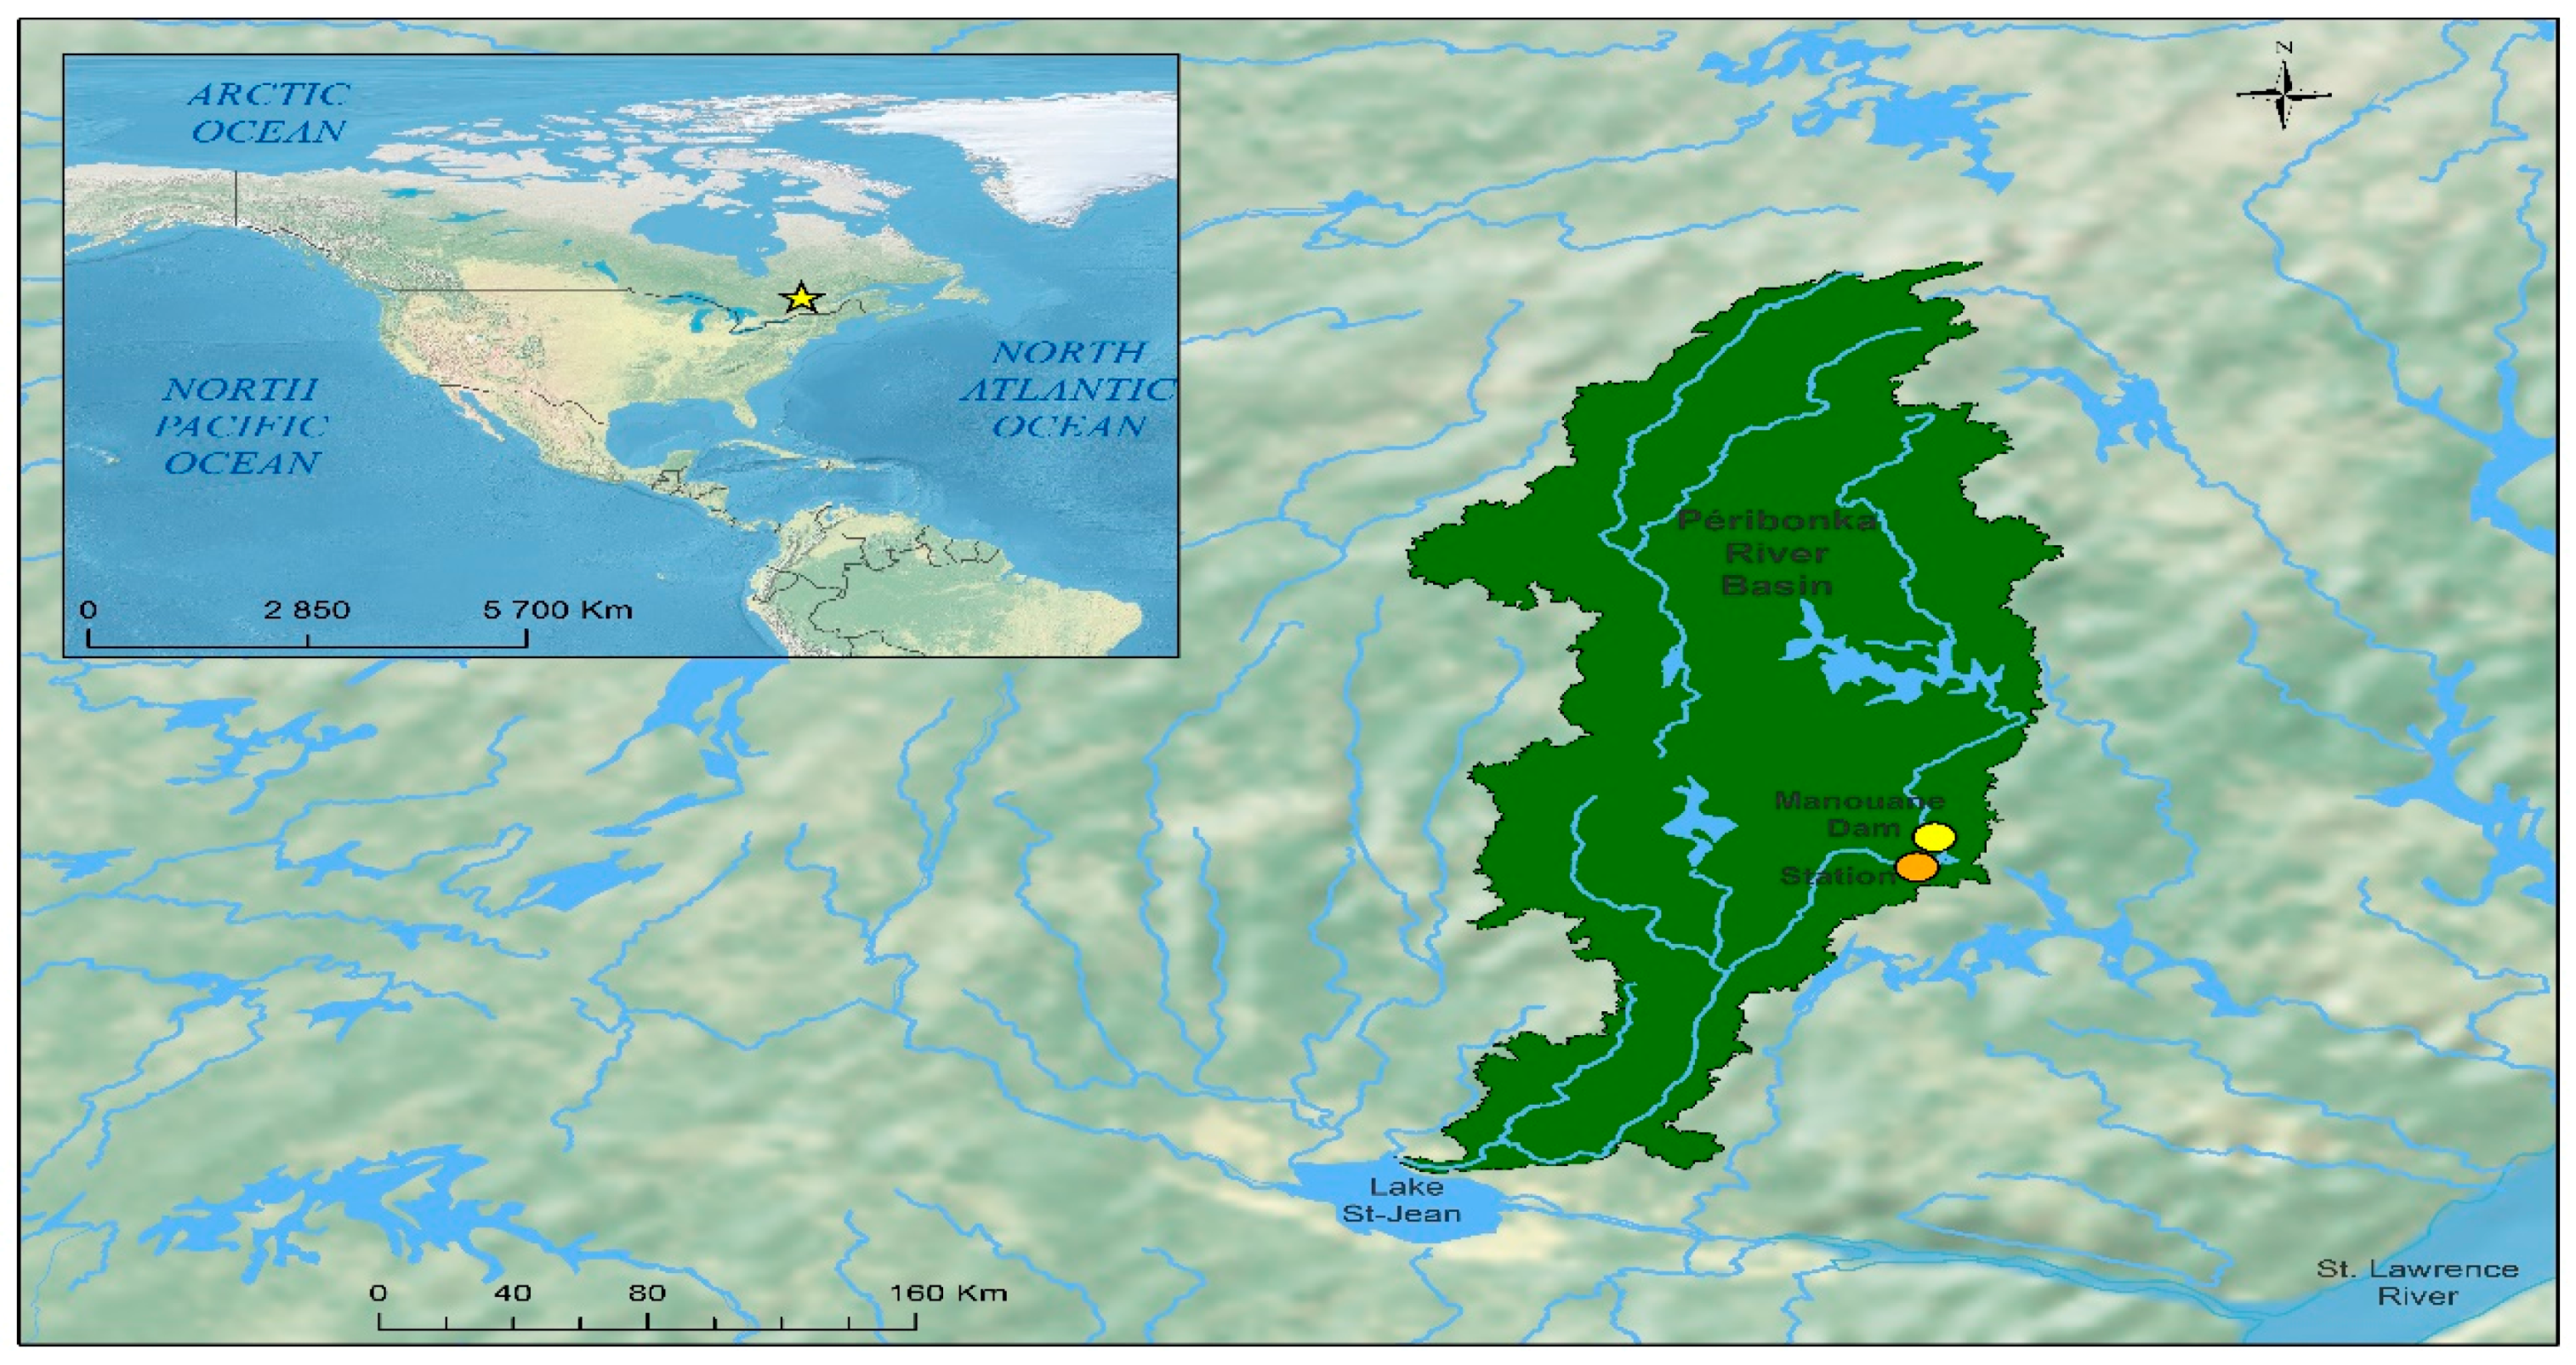
The Manouane River is sourced in its namesake lake and flows into the Peribonka River, which is the main tributary of Lake Saint-Jean. The Manouane River watershed is entirely comprised within the Canadian Shield, covering 9483 km2 (Figure 1). Two water diversion structures were built on the Manouane River: one in 1961 by Alcan, to feed into Peribonka Lake, and the second in 2003 by Hydro-Québec, to increase the capacity of the Pipmuacan reservoir, which supplies the Bersimis-1 and Bersimis-2 hydroelectric plants on the Betsiamites River.
The diversion dam built by Hydro-Québec on the Manouane River is 9 m high and 90 m long. The maximum surface covered by the related reservoir is 21 km2. Water diverted from the Manouane River to the Betsiamites River is first routed through a 7 km long channel then through the des Hirondelles Brook. Mean diverted flow is 30 m3/s and maximum flow through the channel is 80 m3/s. At the level of the dam, the Manouane River watershed covers 1717 km2 in surface area.
The station at which Manouane River flows are measured is located downstream from the diversion dam. Flow measurements at that station started towards the end of 1999 and continue uninterrupted to this day. The data were taken from the website of [22]. Between the station and the dam, the main tributary of the Manouane River, the Petite Manouane River (1445 km2) flows into it as well as several small tributaries, such that the watershed surface area at the level of the measurement station is 3600 km2. It should be kept in mind that the effects of the diversion dam on flows measured at the station are attenuated by inputs from these natural tributaries. This study only looks at the impacts produced by the latter diversion because no flow data are available for the period prior to the first diversion in 1961. It should also be pointed out that there are no temperature and precipitation measuring stations in the Manouane River watershed. The meteorological station of reference for this watershed is at the Bagotville military airport (48°20′ N; 71°00′ W).
The Manouane River was selected because of the availability of flow measurement data collected before and after construction of the diversion dam. Flow measurements began in late 1979 and are ongoing to this day. They therefore cover the periods both before (1980–2002) and after (2004–2014) construction of the dam.

2.2. Statistical Analysis

Three methods were used to analyze hydrologic impacts induced by the diversion dam: the monitoring method, which is based on a comparison of mean values of flows before (1980–2002) and after (2004–2014) dam construction using the non-parametric Kruskal-Wallis method; the analysis of the long-term trend of flows using the classic non-parametric Mann-Kendall method; and the non-parametric Lombard method, which allows the detection of shifts in mean values. The last two methods, which are briefly described below, were applied over the whole period of interest (1980–2014).
The Mann-Kendall test is widely used in hydrology. Given a sample ( X 1 , X 2 , ........ X n ) of values that are independent from a random variable X for which the stationarity or long-term trend must be assessed, the Mann-Kendall statistic is defined as follows:
S = i = 1 n 1 j = i + 1 n s i g ( X i X j )
where Xi and Xj are sequential values of X and n is the sample size. The test statistic is obtained by counting, for each ( X i X j ) i < j pair, the number of cases where the second value is greater than the first, and the number of cases where the second value is less than the first, then subtracting these two numbers. The presence of a statistically significant trend is assessed using the Z score value as follows:
Z = { S 1 v a r ( S )   i f   S > 0 0   i f   S = 0 S + 1 v a r ( S )   i f   S < 0
A positive (negative) Z score reflects an increasing (a decreasing) long-term trend, and its significance is compared with the critical value or significance threshold for the test. The critical Z score values when using a 95% confidence level are −1.96 and +1.96 standard deviations. The p-value associated with a 95% confidence level is 0.05. If Z score is between −1.96 and +1.96, p-value will be larger than 0.05, null hypothesis cannot be rejected.
The Lombard method can be used to detect the nature and timing of shifts in the mean and/or variance of a statistical series. Unlike other methods commonly used in hydrology (e.g., the Pettitt method), the Lombard method can distinguish between sharp and gradual shifts in mean and variance. It is therefore a more general method than the other methods, which only detect sharp changes. The mathematical basis for the Lombard method has been described in detail by [23] and [24]. In the present study, only the most important statistical aspects of the methods are described (e.g., [25,26]). Given a series of independent observations X 1 , ... , X n , where Xi is the observation taken at time T = i . A question that is often of interest is to assess whether the mean of this series has changed at some unknown time. To this end, one considers as a possible pattern for the mean of these observations the smooth-change model introduced by [23], where the mean of Xi is defined by
μ i = { θ 1 θ 1 θ 2 + ( i T 1 ) ( θ 2 θ 1 ) T 2 T 1 i f 1 i T 1 i f T 1 < i T 2 i f T 2 < i n
In other words, the mean changes gradually from θ 1 to θ 2 between the times T 1 and T 2 . As a special case, one has the usual abrupt-change model when T 2 = T 1 + 1 .
In order to test formally that the mean of a univariate series is stable, or on the contrary that is follows model (3), one can use the statistical procedure by [23]. To this end, let R i denote the rank of X i among X1,…,Xn and define the rank score of Xi by
Z i = 1 σ φ { φ ( R i n + 1 ) φ ¯ } ,     i { 1 , ... , n }
where φ ( u ) = 2 u 1 is Wilcoxon’s score function, while
φ = 1 n i = 1 n   φ   ( i n + 1 )  and  σ φ 2 = 1 n i = 1 n { φ i n + 1 φ ¯ } 2
Lombard’s test statistic is
S n = 1 n 5 T 1 = 1 n 1   T 2 = T 1 + 1 n   L T 1 T 2 2
where
L T 1 , T 2 = j = T 1 + 1 T 2   i = 1 j Z i
A value of Sn greater than 0.0403 derived for a series of observations indicates that there is a shift in the mean value of this series at the 5% probability level. This value of 0.0403 corresponds to the asymptotic theoretical (critical) value as obtained by [23]. Note that the test proposed by [23] in order to detect multiple abrupt changes in the mean was also performed; here again, the test concluded to a significant change in the mean. It is important to note that the independence assumption among the observations is necessary for the validity Lombard’s test [23,24].
The rate of variation R of the mean values before and after shifts detected using the Lombard method was derived using the following formula:
R = (M1M2)/M1
where M1 and M2 are, respectively, the mean values of flow before and after the shift, R being expressed as a percentage.
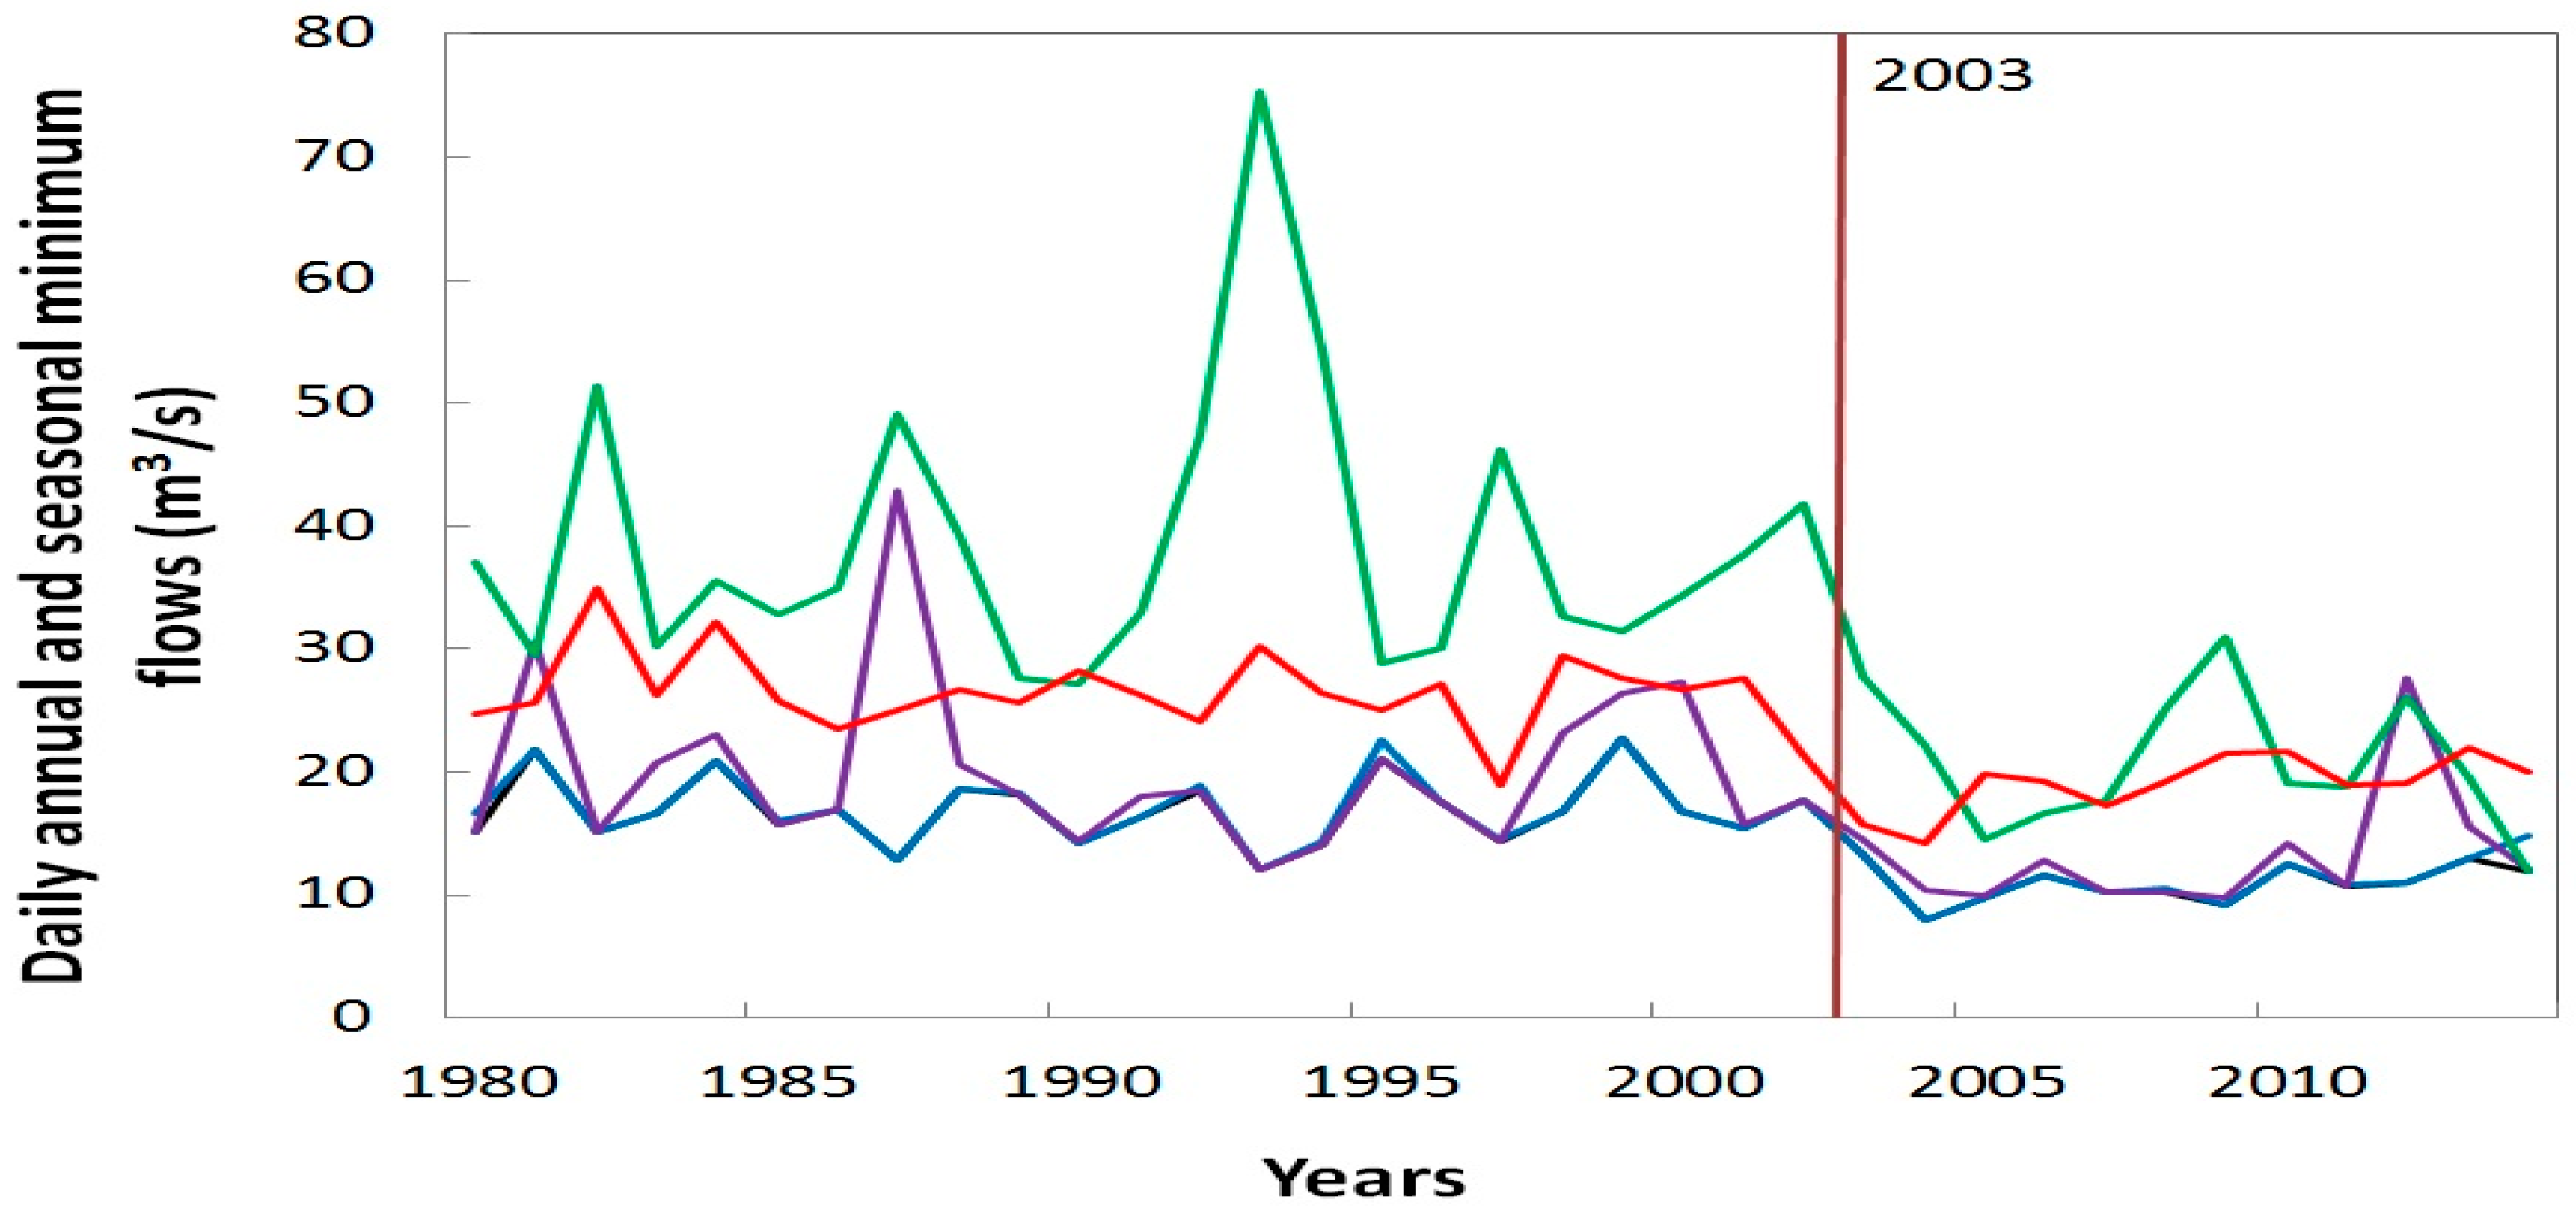
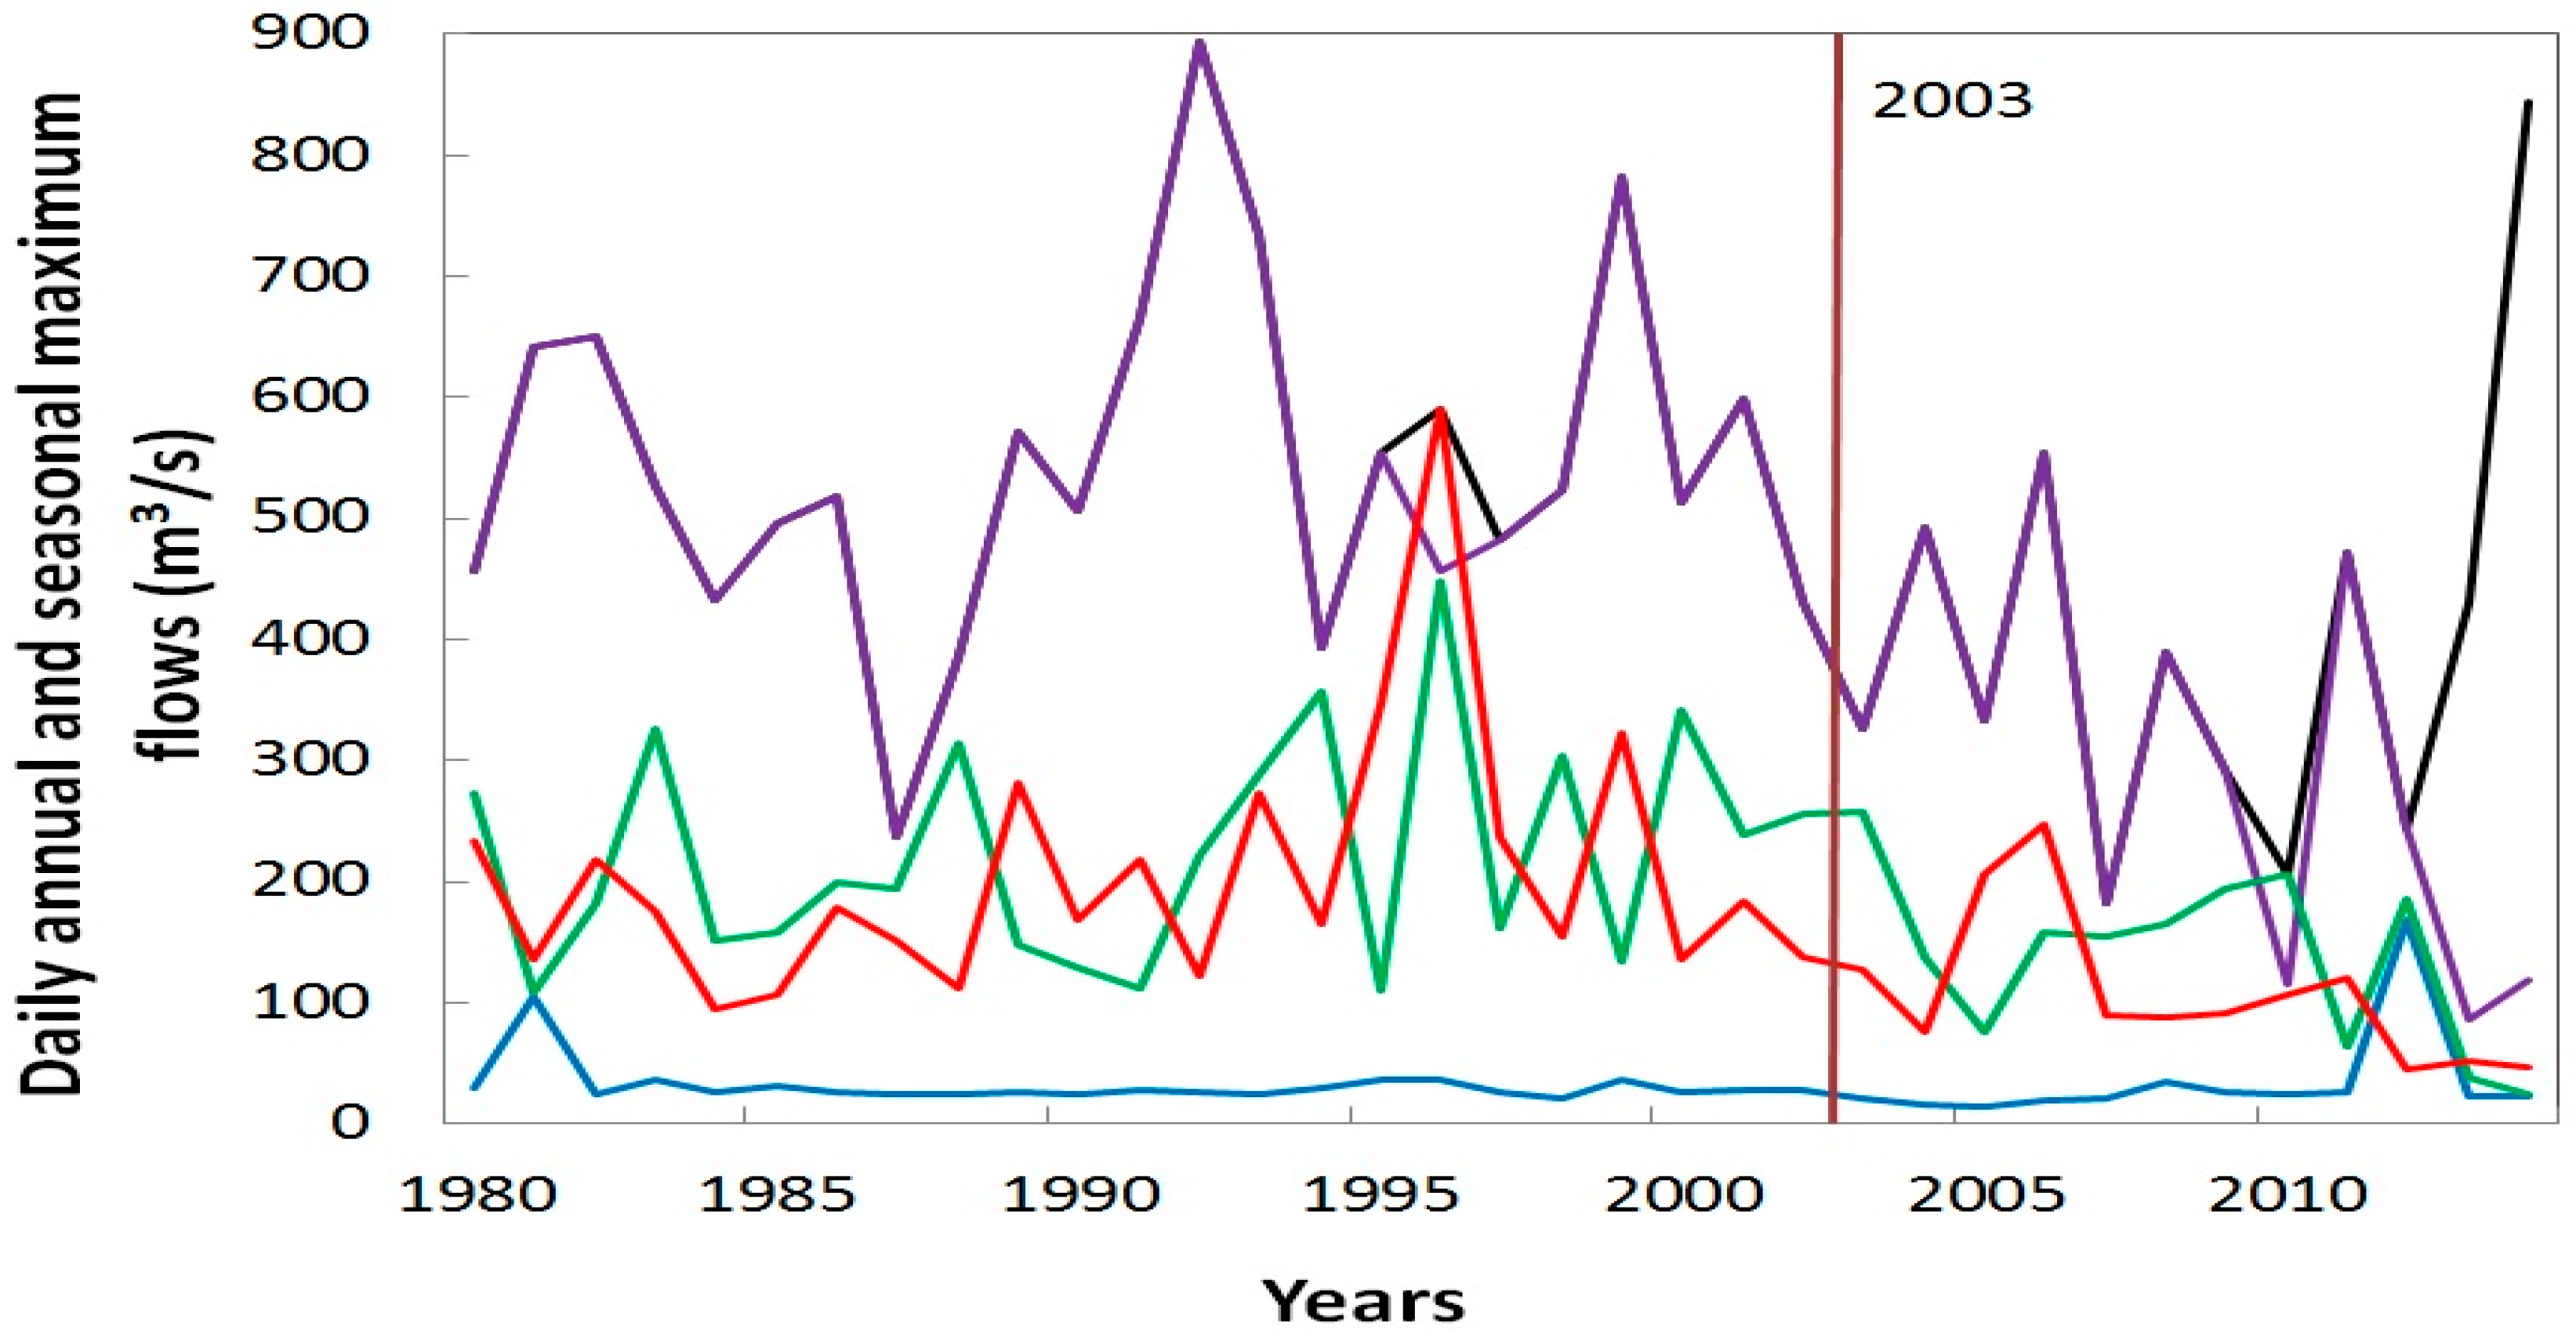
The three methods were applied to the following two types of series for the period from 1980 to 2014:
  • The series of annual maximum and minimum daily flows, which consist of the highest (maximum) and lowest (minimum) daily flow values measured each year (October to September) from 1980 to 2014;
  • The series of seasonal maximum and minimum daily flows, which consist of the highest (maximum) and lowest (minimum) daily flow values measured each season (winter: January to March; spring: April to June; summer: July to September; winter: October to December) from 1980 to 2014.

3. Results and Discussion

3.1. Annual and Seasonal Minimum Daily Flows

The results obtained using the three methods are presented in Table 1 (monitoring method based on the Krustal-Wallis test), Table 2 (long-term trend method based on the Mann-Kendall test), and Table 3 (Lombard method). The Kruskal-Wallis test (monitoring method) brought out a significant difference in the mean values of annual and seasonal minimum daily flows before and after the construction of the diversion dam, which reflects a significant decrease in the minimum daily flows after dam construction (Table 1 and Figure 2). The rate of the decrease of the minimum daily flow mean values ranges from 27.4% for the fall to 47.5% for summer. As far as the Mann-Kendall test is concerned, all long-term trends are statistically significant. Negative Z values reflect a decreasing trend of minimum daily flows (Table 2). The Lombard method (Table 3), for its part, brought out significant shifts in the mean values at the annual and seasonal scales. These shifts occurred in 2003, the year of the construction of the diversion dam. Thus, minimum daily flows decreased significantly after the construction of this dam, which is consistent with results obtained with the first two methods. It follows that the Lombard method is just as effective as the other two methods at detecting hydrologic impacts induced by a dam. In addition, that method holds two major advantages over the other two methods. First, by precisely constraining the years of shifts in mean values, it makes it possible to link rigorously and with certainty these shifts with the construction of the diversion dam in 2003. In addition, the Lombard method allows for the precise determination of the nature of the hydrological changes that occurred after dam construction. In the case analyzed, the shifts in mean values are all sharp, implying that the diversion dam led to an abrupt change in minimum daily flows. The other two methods cannot detect the nature of the hydrological changes that occurred after the construction of the diversion dam. In the case of the Mann-Kendall method, it cannot be used to establish robustly if the long-term trend of the variability of minimum flows started after the construction of the diversion dam.

3.2. Annual and Seasonal Maximum Daily Flows

The results obtained using the three methods are shown in Table 4, Table 5 and Table 6. Unlike the results for the minimum daily flows, the three methods did not yield similar results for the maximum daily flows. The Kuskal-Wallis test (monitoring method) revealed a significant difference in annual and seasonal maximum daily flows before and after dam construction, with the exception of summer maximum daily flows (Table 4). This difference also reflects a significant decrease in annual, spring and fall maximum daily flows, but a significant increase in winter maximum daily flows after dam construction. The Mann-Kendall test revealed a significant negative long-term trend only for annual and spring maximum daily flows at the 10% level. It should be recalled that, in Quebec, maximum daily flows occur in springtime, during snowmelt, which explains why values of annual and spring maximum daily flows are nearly identical. The Lombard method, for its part, revealed shifts in the mean values of annual and spring maximum daily flows. These results are consistent with the results obtained using the Mann-Kendall method, but unlike the other two methods, the Lombard method also shows that these shifts occurred prior to dam construction, more specifically in 2001. Thus, Figure 3 clearly shows that the decrease in annual and spring maximum daily flows started before dam construction, implying that this decrease was not induced by the dam, which only amplified it. In addition, this decrease is sharp. As for the increase in winter maximum daily flows after dam construction which the Kruskal-Wallis test revealed, it is not visible in Figure 3. A substantial increase in maximum daily flows is only observed in the winter of 2012 (Figure 3), suggesting that, unlike the other two methods, the Kruskal-Wallis test is sensitive to the presence of extreme values.
To constrain the factors that may account for the decrease in spring maximum daily flows, seasonal total precipitations (snow and rain) which produce spring floods were analyzed using the Lombard method. Results are shown in Table 7, which clearly shows that spring total precipitations decreased significantly during the period from 1980 to 2014. This decrease took place in 1997, six years before the construction of the diversion dam. No significant change in precipitation is observed for the other seasons during the same period. Thus, it is difficult to account for the changes detected with the Kruskal-Wallis test for these seasons, in particular the increase in winter maximum daily flows after construction of the dam.
From a hydrological standpoint, the impacts of dams generally result in a decrease in maximum daily flows, but an increase in minimum daily flows, resulting in lower intra- and inter-annual variability of flows [27,28]. Hydrological changes induced by the diversion dam built on the Manouane River are different from this general scheme, because that dam did not affect maximum daily flows, but produced a significant decrease in minimum daily flows. Previous work looking at the hydrological impacts of dams in Quebec distinguished three types of impacts, each corresponding to a specific dam management mode [1,29,30,31,32,33,34]. The first type of hydrological impact is characterized by a decrease in annual and seasonal maximum and minimum daily flows. This type of impact is observed downstream from dams that produce an inversion of the annual hydrological cycle of streamflow, with maximum flows in winter and minimum flows in the spring, during snowmelt. The second type of hydrological impact is characterized by a decrease in maximum daily flows, but an increase in minimum daily flows. Lastly, the third type of hydrological impact is characterized by an increase in minimum daily flows, whereas maximum daily flows are not affected. These three types of hydrological impacts differ from those induced by the diversion dam built on the Manouane River, which therefore make up a fourth type of dam-induced hydrological impact in Quebec.

4. Conclusions

All the methods used to date to quantify dam-induced hydrological impacts have several shortcomings. The Lombard method makes it possible to overcome these shortcomings and improve their performance. This method enables the accurate and precise determination of the impacts of dams and of other factors, such as climate change and/or changes in land use in the watershed, on the temporal variability of streamflow. It can also be used to determine whether changes in streamflow after the construction of a dam were sharp or gradual. This is very important to quantify the ecological impacts on aquatic and semi-aquatic organisms induced by changes in streamflow after the construction of a dam. To demonstrate the usefulness of the Lombard method, we applied it to the analysis of the impacts of a diversion dam built on the Manouane River in 2003 on annual and seasonal maximum and minimum daily flows during the period from 1980 to 2014. Results obtained using this method were identical to those obtained using the monitoring (Kruskal-Wallis test) and long-term trend (Mann-Kendall test) methods as far as minimum daily flows are concerned, indicating that the Lombard method is just as effective as the other two commonly used methods for analyzing the hydrological impacts of dams. All three methods highlighted a significant decrease in minimum daily flows for all four seasons after construction of the dam in 2003. However, only the Lombard method could link robustly and with certainty this decrease in minimum daily flows with dam construction. Moreover, the application of this method showed that this decrease in flows was sharp. In contrast, for maximum daily flows, the Lombard method detected a significant decrease only for spring flows, whereas the monitoring method detected a decrease in flows for the other seasons, with the exception of summer. However, application of the Lombard method showed that dam construction did not cause the decrease in spring and annual maximum daily flows, because this decrease occurred two years prior to dam construction. Instead, this decrease is due to a decrease in spring precipitation that started in 1997. This decrease was sharp for flows in all four seasons. Finally, from a regulated river restoration perspective, the existence of a fourth type of hydrological impact highlighted in this study is very important because it will enable the development of flow management standards specifically aimed at addressing the hydrological impacts of diversion dams in Quebec, given that these impacts are different from those induced by other types of dams. It follows that, from a hydrological standpoint, unlike other methods, the Lombard method makes it possible to determine with certainty the hydrological impacts induced by dams and climate variability. Moreover, it makes possible to determine whether these impacts are sharp or gradual, a feature that is particularly important in ecohydrology. As such, I contend that it is the most complete and precise method for analyzing the hydrological impacts of dams when appropriate data are available.

Author Contributions

Ali Arkamose Assani conceived and designed the experiments, performed the experiments, analyzed the data, and wrote the paper.

Conflicts of Interest

The author declares no conflict of interest.

References

  1. Assani, A.A.; Stichelbout, E.; Roy, A.G.; Petit, F. Comparison of impacts of dams on the annual maximum flow characteristics in three regulated hydrologic regimes in Quebec (Canada). Hydrol. Process. 2006, 20, 3485–3501. [Google Scholar] [CrossRef]
  2. Allan, J.D. Landscape and Riverscape: The influence of land use on stream ecosystems. Annu. Rev. Ecol. Syst. 2004, 35, 257–284. [Google Scholar] [CrossRef]
  3. Cowell, C.M.; Stoudt, R.T. Dam-induced modifications to upper Allegheny River streamflow patterns and their biodiversity implications. J. Am. Water Resour. Assoc. 2002, 38, 187–196. [Google Scholar] [CrossRef]
  4. Hu, W.W.; Wang, G.X.; Deng, W.; Li, S.N. The influence of dams on ecolohydrological conditions in the Huaihe River basin, China. Ecol. Eng. 2008, 33, 233–241. [Google Scholar] [CrossRef]
  5. Li, S.; Xiong, L.H.; Dong, L.H.; Zhang, J. Effects of Three Gorge reservoir on the hydrologic droughts at the downstream Yichang station during 2003–2011. Hydrol. Process. 2013, 27, 3981–3993. [Google Scholar] [CrossRef]
  6. Magilligan, F.J.; Nislow, K.H. Long-term changes in regional hydrologic regime following impoundment in a humid-climate watershed. J. Am. Water Resour. Assoc. 2002, 37, 1551–1569. [Google Scholar] [CrossRef]
  7. Magilligan, F.J.; Nislow, K.H. Changes in hydrologic regime by dams. Geomorphology 2005, 71, 61–78. [Google Scholar] [CrossRef]
  8. Richter, B.D.; Baumgarter, J.V.; Braun, D.P.; Powel, J. A spatial assessment of hydrologic alteration within ecosystem. Conserv. Biol. 1998, 10, 329–340. [Google Scholar]
  9. Zhang, Z.; Huang, Y.; Huang, J. Hydrologic alteration associated with dam construction in medium-sized coastal watershed of Southeast China. Water 2016, 8, 317. [Google Scholar] [CrossRef]
  10. Zhang, Q.; Zhou, Y.; Singh, V.P.; Chen, X.H. The influence of dam and lakes on the Yangtze River streamflow: Long-range correlation and complexity analyses. Hydrol. Process. 2012, 26, 436–444. [Google Scholar] [CrossRef]
  11. Assani, A.A.; Buffin-Bélanger, T.; Roy, A.G. Impacts of dam on the hydrologic regime of the Matawin river (Québec, Canada). J. Water Sci. 2002, 15, 557–574. (In French) [Google Scholar]
  12. Benn, P.C.; Erskine, W.D. Complex channel response to flow regulation: Cudgegong River below Windamere Dam, Australia. Appl. Geogr. 1994, 14, 153–168. [Google Scholar] [CrossRef]
  13. Fitzhugh, T.W.; Vogel, R.M. The impact of dams on flood flows in the United States. River Res. Appl. 2011, 27, 1192–1215. [Google Scholar] [CrossRef]
  14. Higgs, G.; Petts, G. Hydrological changes and river regulation in the UK. Regul. Rivers Res. Manag. 1988, 2, 349–368. [Google Scholar] [CrossRef]
  15. Moore, J.N.; Arrigoni, A.S.; Wilcox, A.C. Impacts of dams on flow regimes in three headwater subbasins of the Columbia River basin, United States. J. Am. Water Resour. Assoc. 2012, 48, 925–938. [Google Scholar] [CrossRef]
  16. Page, K.; Read, A.; Frazer, P.; Mount, N. The effect of alterd flow regime on the frequency and duration of bankfull discharge: Murrumbidgee River, Australia. River Res. Appl. 2005, 21, 567–578. [Google Scholar] [CrossRef]
  17. Poff, N.L.; Blesdoe, B.P.; Cuhaciyan, C.O. Hydrologic variation with land use across the contiguous United States: Geomorphologic and ecological consequences for stream ecosystems. Geomorphology 2006, 79, 264–285. [Google Scholar] [CrossRef]
  18. Kim, N.; Lee, J.; Kim, J. Assessment of flow regulation effects by dams in the Han River, Korea, on the downstream flow regimes using SWAT. J. Water Resour. Plan. Manag. 2012, 138, 24–35. [Google Scholar] [CrossRef]
  19. Maheshwari, B.L.; Walker, K.F.; McMahon, T.A. Effects of regulation on the flow regime of the River Murray, Australia. Regul. Rivers Res. Manag. 1995, 10, 15–38. [Google Scholar] [CrossRef]
  20. Assani, A.A.; Petit, F.; Mabille, G. Analysis of discharges of Warche River downstream Butgenbach and Robertville Reservoirs Belgian Ardenn). Geogr. Soc. Bull. Liège 1999, 36, 17–30. (In French) [Google Scholar]
  21. Zhao, Q.; Liu, S.; Deng, L.; Dong, S.; Yang, J.; Wang, C. The effects of dam construction and precipitation variability on hydrologic alteration in the Lacang River basin of southwest China. Stoch. Environ. Res. Risk Assess. 2012, 26, 993–1011. [Google Scholar] [CrossRef]
  22. Cehq. Water Levels and Streamflows. Available online: https://www.cehq.gouv.qc.ca/hydrometrie/ (accessed on 20 January 2015).
  23. Lombard, F. Rank tests for changepoint problems. Biometrika 1987, 74, 615–624. [Google Scholar] [CrossRef]
  24. Quessy, J.-F.; Saïd, M.; Favre, A.-C. Multivariate kendall’s tau for change-point detection in copulas. Can. J. Stat. 2012, 40, 1–18. [Google Scholar] [CrossRef]
  25. Beauchamp, M.; Assani, A.A.; Landry, R.; Massicotte, P. Temporal variability of the magnitude and timing of winter maximum flow in southern Quebec (Canada). J. Hydrol. 2015, 52, 410–417. [Google Scholar] [CrossRef]
  26. Guerfi, N.; Assani, A.A.; Mesfioui, M.; Kinnard, C. Comparison of the temporal variability of winter daily extreme temperatures and precipitations in southern Quebec (Canada) using the Lombard and copula methods. Int. J. Climatol. 2015, 35, 4237–4246. [Google Scholar] [CrossRef]
  27. Moyle, P.B.; Mount, J.F. Homogenous rivers, homogenous faunas. Proc. Natl. Acad. Sci. USA 2007, 104, 5711–5712. [Google Scholar] [CrossRef] [PubMed]
  28. Poff, N.L.; Olden, J.D.; Merritt, D.M.; Pepin, D.M. Homogenization of regional river dynamics by dams and global biodiversity implications. Proc. Natl. Acad. Sci. USA 2007, 104, 5732–5737. [Google Scholar] [CrossRef] [PubMed]
  29. Assani, A.A.; Gravel, E.; Buffin-Bélanger, T.; Roy, A.G. Impacts of dams on the annual minimum discharges according to artificialized hydrologic regimes in Quebec (Canada). J. Water Sci. 2005, 16, 103–127. (In French) [Google Scholar]
  30. Assani, A.A.; Lajoie, F.; Laliberté, C. The effects of dams on mean annual flow characteristics according to management mode and basin drainage in Québec. J. Water Sci. 2007, 20, 127–146. (In French) [Google Scholar]
  31. Lajoie, F.; Assani, A.A.; Matteau, M.; Mesfioui, M.; Roy, A.G. Comparison of ecological instream flow and release flow downstream of dams in Quebec: The effect of dam management practices, watershed size and the season. Water Qual. Resour. J. Can. 2006, 41, 263–274. (In French) [Google Scholar]
  32. Lajoie, F.; Assani, A.A.; Roy, A.G.; Mesfioui, M. Impacts of dams on monthly flow characteristics. The influence of watershed size and seasons. J. Hydrol. 2007, 334, 423–439. [Google Scholar] [CrossRef]
  33. Matteau, M.; Assani, A.A.; Mesfioui, M. Application of multivariate statistical analysis methods to the dam hydrologic impact studies. J. Hydrol. 2009, 371, 120–128. [Google Scholar] [CrossRef]
  34. Sylvain, J.-M.; Assani, A.A.; Landry, R.; Quessy, J.-F.; Kinnard, C. Comparison of the spatio-temporal variability of annual minimum daily extreme flow characteristics as a function of land use and dam management mode in Quebec, Canada. Water 2015, 7, 1232–1245. [Google Scholar] [CrossRef]
Figure 1. Location of the Manouane River watershed and diversion dam. The orange dot shows the location of the flow gauging station.
Water 08 00410 g001
Figure 2. Temporal variability of annual and seasonal daily minimum flows before and after construction of the diversion dam in 2003 (vertical line). This vertical line also represents the timing of the shift in mean values of the series. Annual = black curve; winter: blue curve; spring = purple curve; summer = green curve; fall = red curve.
Water 08 00410 g002
Figure 3. Temporal variability of annual and seasonal daily maximum flows before and after construction of the diversion dam in 2003 (vertical line). Annual = black curve; winter: blue curve; spring = purple curve; summer = green curve; fall = red curve.
Water 08 00410 g003
Table 1. Comparison of mean values of annual and seasonal minimum daily flows before (1980–2002) and after (2004–2014) construction of the diversion dam using the Kruskal-Wallis test. Monitoring method.
ScaleMW Statisticp-ValuesM1M2 R (%)
Year250.0000.0001710.8−36.7
Winter245.0000.00017.211.1−35.7
Spring222.5000.00020.313.1−35.6
Summer247.0000.00038.520.2−47.4
Fall241.5000.00026.719.4−27.4
Notes: Statistically significant p-values are shown in bold; MW statistic = Mann-Whitney statistic; M1 = mean value before 2003; M2 = mean value after 2003; − = decrease in mean value.
Table 2. Analysis of the long-term trend of annual and seasonal minimum daily flows using the Mann-Kendall method.
ScaleZ Statisticp-Value
Year−3.3670.001
Winter−3.1670.002
Spring−2.6710.008
Summer−3.5500.000
Fall−3.0260.002
Note: Statistically significant p-values at the 0.1% level are shown in bold.
Table 3. Analysis of the temporal variability of annual and seasonal minimum daily flows from 1980 to 2014 using the Lombard method.
ScaleSnT1T2M1 (m3/s)M2 (m3/s)R (%)
Annual0.1456200120031710.8−36.7
Winter0.13092001200317.211.1−35.7
Spring0.08782001200320.313.1−35.6
Summer0.14452001200338.520.2−47.4
Fall0.13902001200326.719.4−27.4
Notes: Lombard test Sn values > 0.0403 are statistically significant at the 5% level (these values are shown in bold); T1 and T2 are the years of start and end, respectively, of significant changes in mean and variance values of a given series; M1 = mean value before the shift (T1); M2 = mean value after the shift (T2); − = decrease in mean value.
Table 4. Comparison of mean values of annual and seasonal maximum daily flows before (1980–2002) and after (2004–2014) construction of the diversion dam using the Kruskal-Wallis test. Monitoring method.
ScaleMW Statisticp-ValuesM1 (m3/s)M2 (m3/s)R (%)
Year196.0000.011547.2403.7−26.2
Winter188.5000.02231.636+13.9
Spring193.0000.014541.4395.3−27.0
Summer171.0000.101
Fall189.0000.021206.1138.9−32.6
Notes: Statistically significant p-values are shown in bold; MW statistic = Mann-Whitney statistic; M1 = mean value before 2003; M2 = mean value after 2003; − = decrease in mean value; + = increase in mean values.
Table 5. Analysis of the long-term trend of annual and seasonal maximum daily flows using the Mann-Kendall method.
ScaleZ Statisticp-Value
Year−1.8750.061
Winter−1.5620.118
Spring−1.9310.053
Summer−0.4540.650
Fall−1.1930.233
Note: Statistically significant p-values at the 10% level are shown in bold.
Table 6. Analysis of the temporal variability of annual and seasonal maximum daily flows from 1980 to 2014 using the Lombard method.
ScaleSnT1T2M1 (m3/s)M2 (m3/s)R (%)
Annual0.043920002001552.2399.8−27.6
Winter0.0292
Spring0.044520002001545.5392.8−28.0
Summer0.0041
Fall0.0272
Notes: Lombard test Sn values > 0.0403 are statistically significant at the 5% level (these values are shown in bold); T1 and T2 are the years of start and end, respectively, of significant changes in mean and variance values of a given series; M1 = mean value before the shift (T1); M2 = mean value after the shift (T2); − = decrease in mean value.
Table 7. Analysis of the temporal variability of annual and seasonal total rainfall at the Bagotville station from 1980 to 2010 using the Lombard method.
ScaleSnT1T2M1 (mm)M2 (mm)R (%)
Annual0.0020
Winter0.0065
Spring0.072519961997243.7 (44.9)199.5 (41.4)−18.3
Summer0.0026
Fall0.0028
Notes: Lombard test Sn values > 0.0403 are statistically significant at the 5% level (these values are shown in bold); T1 and T2 are the years of start and end, respectively, of significant changes in mean and variance values of a given series; M1 = mean value before the shift (T1); M2 = mean value after the shift (T2); ( ) = standard deviation; − = decrease in mean value.

