Article

Historical Storminess and Hydro-Geological Hazard Temporal Evolution in the Solofrana River Basin—Southern Italy

by
Antonia Longobardi
1,*,
Nazzareno Diodato
2 and
Mirka Mobilia
1
1
Department of Civil Engineering, University of Salerno, 84084 Fisciano (SA), Italy
2
Met European Research Observatory, HyMex Mediterranean Experiment Network—Via Monte Pino, 82100 Benevento, Italy
*
Author to whom correspondence should be addressed.
Water 2016, 8(9), 398; https://doi.org/10.3390/w8090398
Submission received: 8 July 2016 / Revised: 7 September 2016 / Accepted: 8 September 2016 / Published: 13 September 2016

Abstract

:
Precipitation extremes have always been part of the Earth’s climate system and associated multiple damaging hydrological events (MDHEs), the simultaneous triggering of different types of phenomena (landslides and floods), affect an always-increasing portion of human settlement areas. This paper aims to investigate the relationship between the temporal evolution of severe geomorphological events and combined precipitation indices as a tool to improve understanding the hydro-geological hazard at the catchment scale. The case study is the Solofrana river basin, Southern Italy, and the focus is on four of main municipalities severely affected by natural disasters. Data for about 45 MDH events, spanning 1951–2014, have been collected and analyzed for this purpose. A preliminary monthly scale analysis of event occurrences highlights a pronounced seasonal characterization of the phenomenon, as about 60% of the total number of reported events take place during the period from September to November. Following, a statistical analysis clearly indicates a significant increase in the frequency of occurrences of MDHEs during the last decades. Such an increase appears to be related to non-stationary features of an average catchment scale rainfall-runoff erosivity index, which combines maximum monthly, maximum daily, and a proxy of maximum hourly precipitation data.

1. Introduction

Precipitation and precipitation extremes variability (storminess and drought) have always been part of the Earth’s climate system, and with them the frequently associated damages caused by flooding and soil erosion phenomena [1,2]. In addition to the natural systems, societal infrastructure is also becoming more sensitive to weather and climate extremes, exacerbated by climate variability and land-vulnerability [3,4,5,6]. As a result, peri-urban catchments, made of a mixture of natural or agricultural lands and urbanized areas, are always more frequently affected by the broad spectrum of multiple damaging hydrological events (MDHEs) [7], as a simultaneously triggering of different types of phenomena, such as landslides and floods. Hydro-geological hazard management in such areas, where, in some cases, the urban development occurs unregulated in flood-prone areas, is highly complex because of a tangled interaction between climate and socio-economic factors [8,9].
The power of the rainfall, named storm erosivity—or rainfall-runoff erosivity—is an important environmental indicator of multiple damaging hydrological phenomena [10,11,12,13]. The seasonal distribution of rainfall erosivity indicates that storm-erosivity power changes during the year, depending on duration, magnitude, and intensity of rainfall events. In particular, in the Southern Europe climate, the drop in erosion power is particularly severe during summer and early autumn months [14,15], while the surface runoff erosion power, a suitable indicator for hazardous hydrological processes, is larger during the autumn season, especially in late autumn [16,17]. Changes in the spatial and temporal features of rainfall patterns may then have important effects on the magnitude and timing of erosive storms-and-runoff, which will, in turn, result in changes in landslide and flood response [18].
At the global scale, research interest is actually devoted to the investigation of non-stationary features of extreme events, which appear to be increasing in frequency and severity [19]. Southern European countries appear among the most vulnerable regions with an expected increase in occurring damages of about 100% by the end of the century [20,21]. The Mediterranean basin is, in fact, a vulnerable environment, as it is characterized by a strong climatic variability, where dry periods are interrupted by pulsing rainstorms throughout the year. A high concentration of high magnitude and short duration rainfall events are, in fact, responsible for the largest rainfall erosivity and erosivity density values within Europe [22]. For this reason, regions located within the Mediterranean basin are particularly susceptible to erosive processes and associated multiple damaging hydrological events [23,24].
The area under investigation is the Solofrana peri-urban basin, located in a geographical area of Southern Italy characterized by a high density in landslides and flood occurrences, about ten times larger than at the Italian territory level [25]. Administrative boundaries of numerous municipalities are located within the catchment area but only four of them, Forino, Solofra, Montoro, and Mercato San Severino, have been seriously and consistently in time affected by natural disasters. A number of 45 events, affecting more than 50 people and causing severe, and costly, damages to urban infrastructures have been collected for the period between 1951 and 2014. Flooding and landslide event occurrence frequency appeared to be increasing in time, especially for what concerns the last decade [26,27]. Through the collection of information about the main historical MDHE events, where temporal and spatial occurrences are provided, the investigation of the their temporal characterization connected to combined climate indices, quantifying rainfall erosivity, represents the main aim of the current paper. The functional relationship between the temporal evolution of severe geomorphological events and the relative climate temporal evolution, would help in understanding the hydro-geological hazard for a particular area and help improve the methodologies for hydro-geological hazard management in the same territory which are, in the majority of cases, based on stationary climate scenarios.

2. Materials and Methods

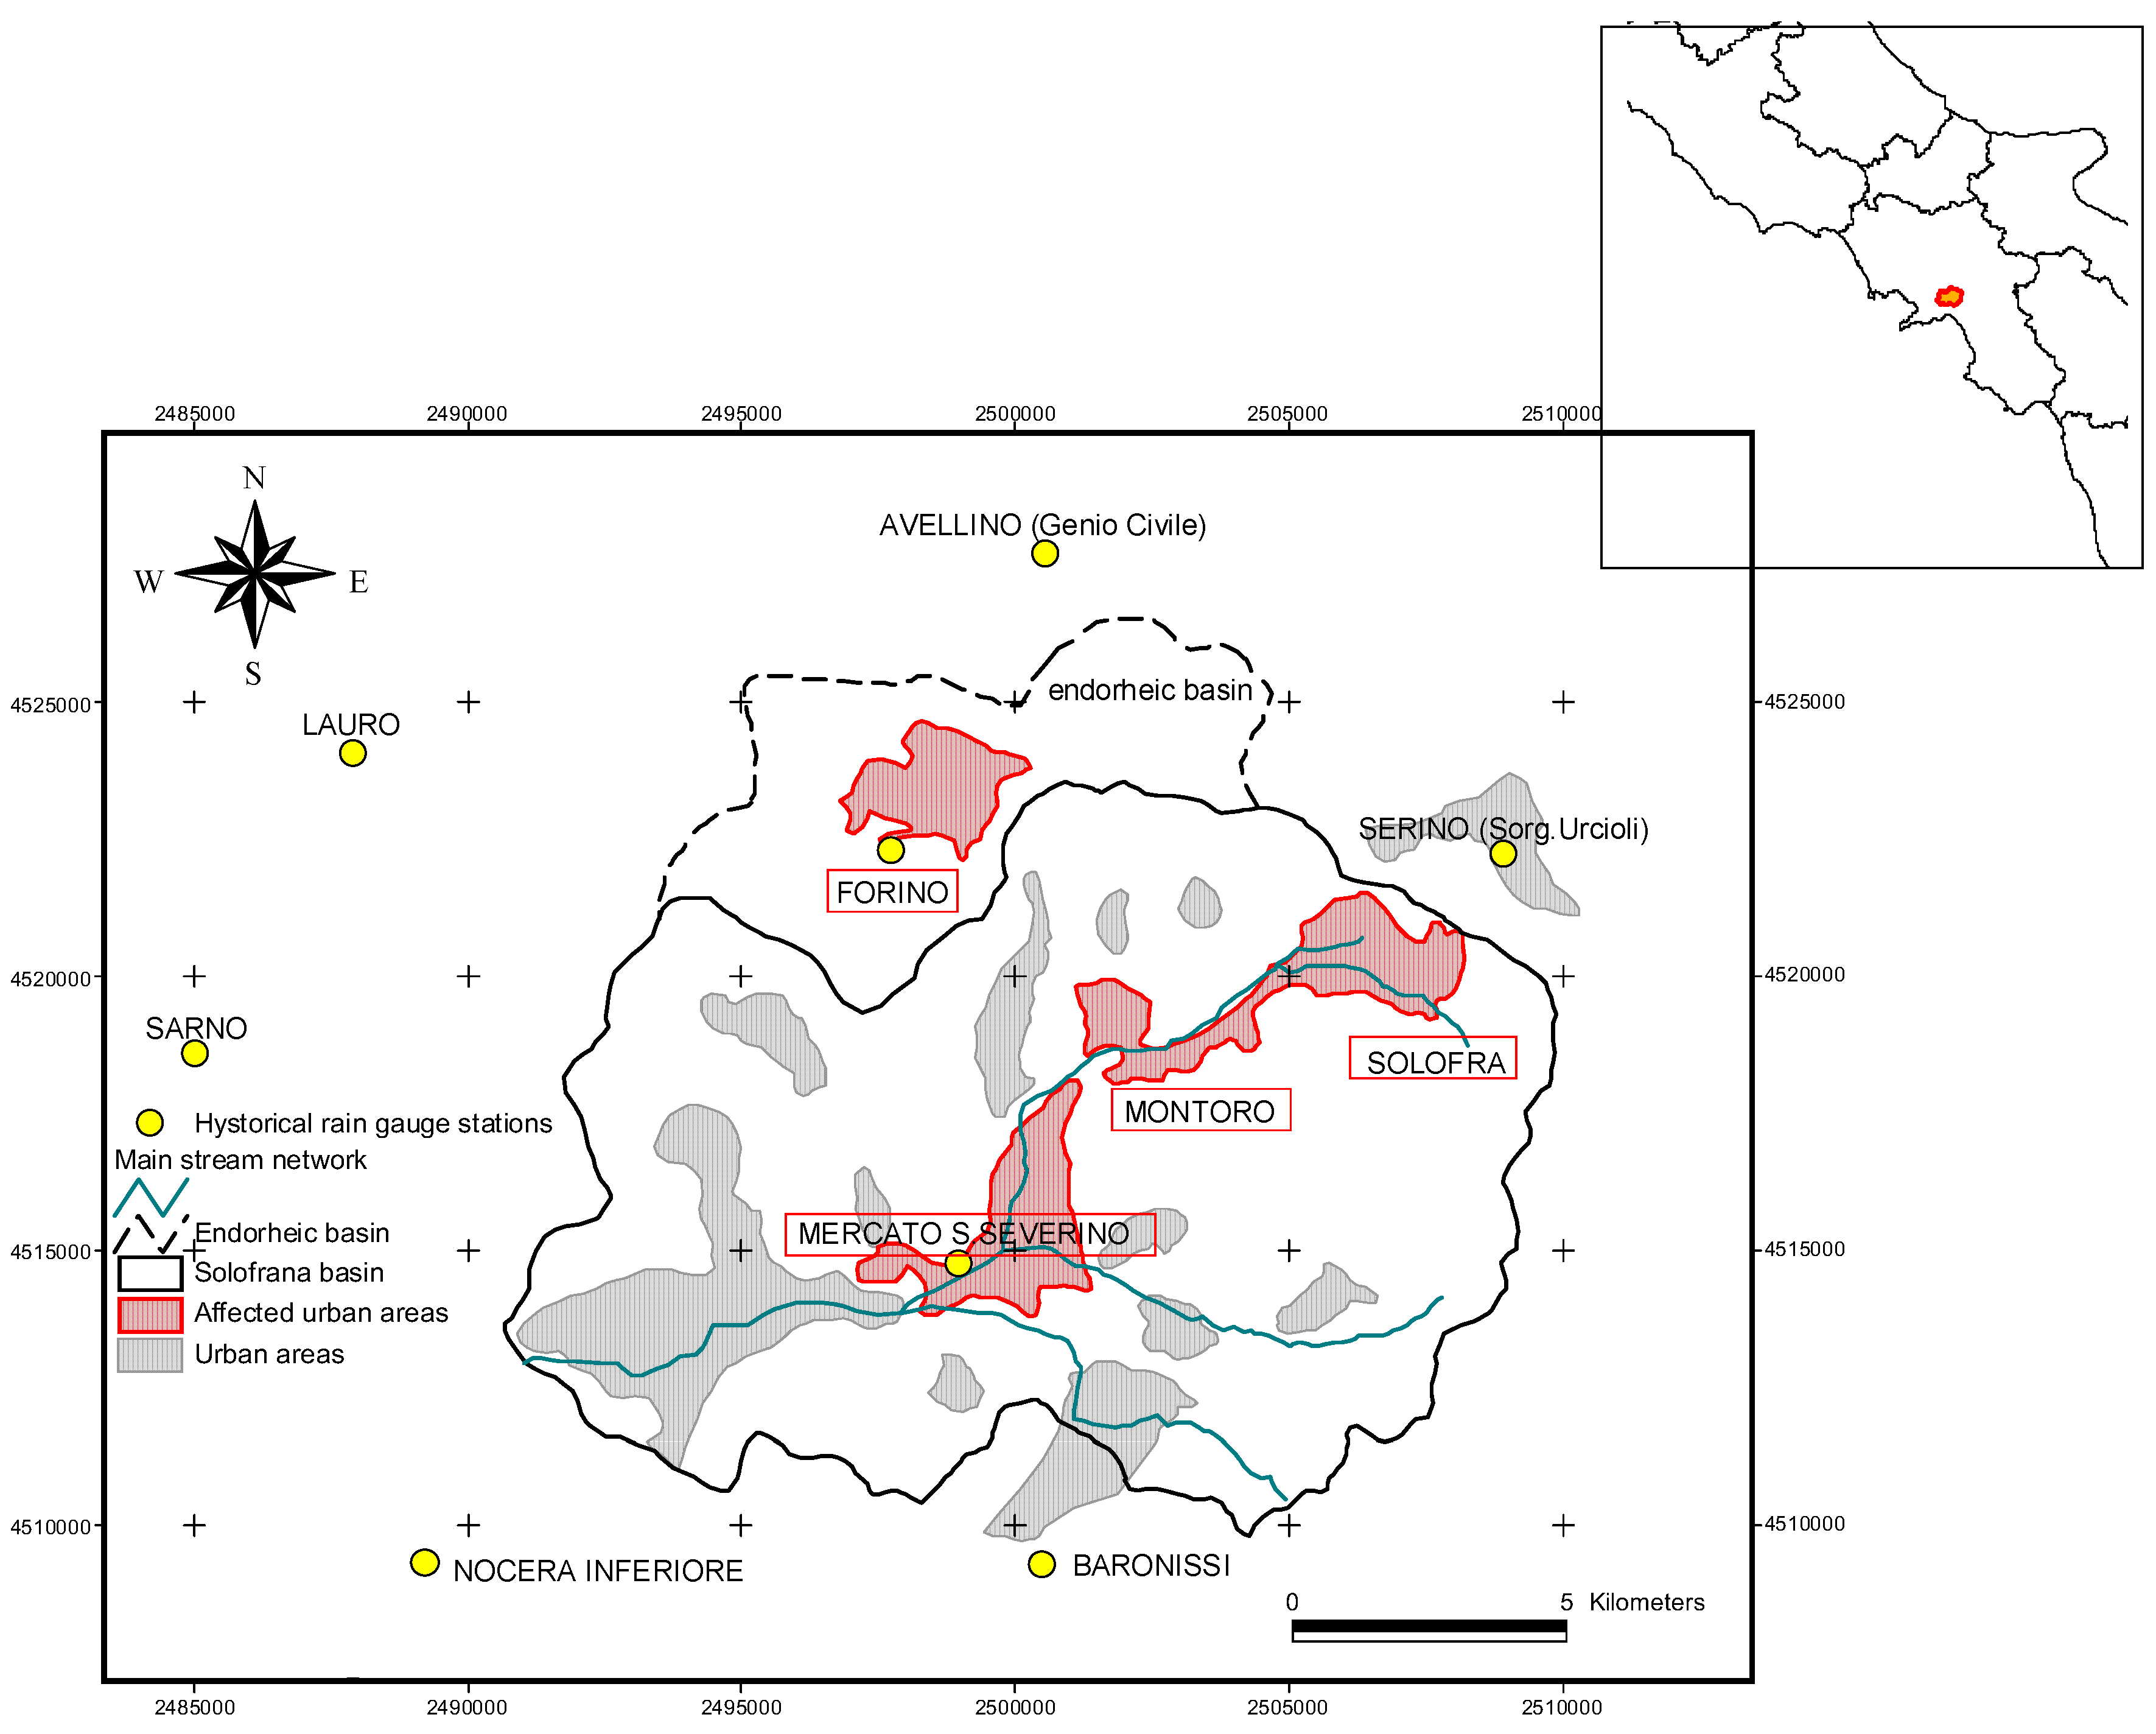
2.1. The Solofrana Peri-Urban Catchment

The case study is represented by the Solofrana peri-urban basin (about 200 km2), one of the major tributaries of the Sarno river basin. It is located in the Campania region, Southern Italy (Figure 1). The Solofrana river basin is featured by various types of limestone rocks, belonging to the Campano-Lucanian and Abruzzese-Campanian platforms. The main reliefs are represented by Triassic dolomite, by dolomitic limestone of the lower Jurassic-Cretaceous, as well as by Cretaceous fractured and karstified limestone [28]. Pyroclastic deposits generally cover the calcareous-dolomitic rocks and are particularly prone to debris flow initiations which, along with floodplain flooding, are one of the major sources of damaging natural events for the studied catchment. The Solofrana river valley is characterized by a graben structure filled by thick pyroclastic deposits, shaped by geomorphological, especially by flooding, events. The pyroclastic plains deposits occur more often consolidated and interdigitated with the presence of sandy-silty lenses, less frequently with gravel lenses. The hydrological regime is typically intermittent, with high discharges during the rainy season and long dry spells during the dry season. Urban and peri-urban areas cover a significant portion of total area, about 25%, and are principally located along the valley plains. Main land use covers are croplands (about 20%) and woodlands (about 50%).

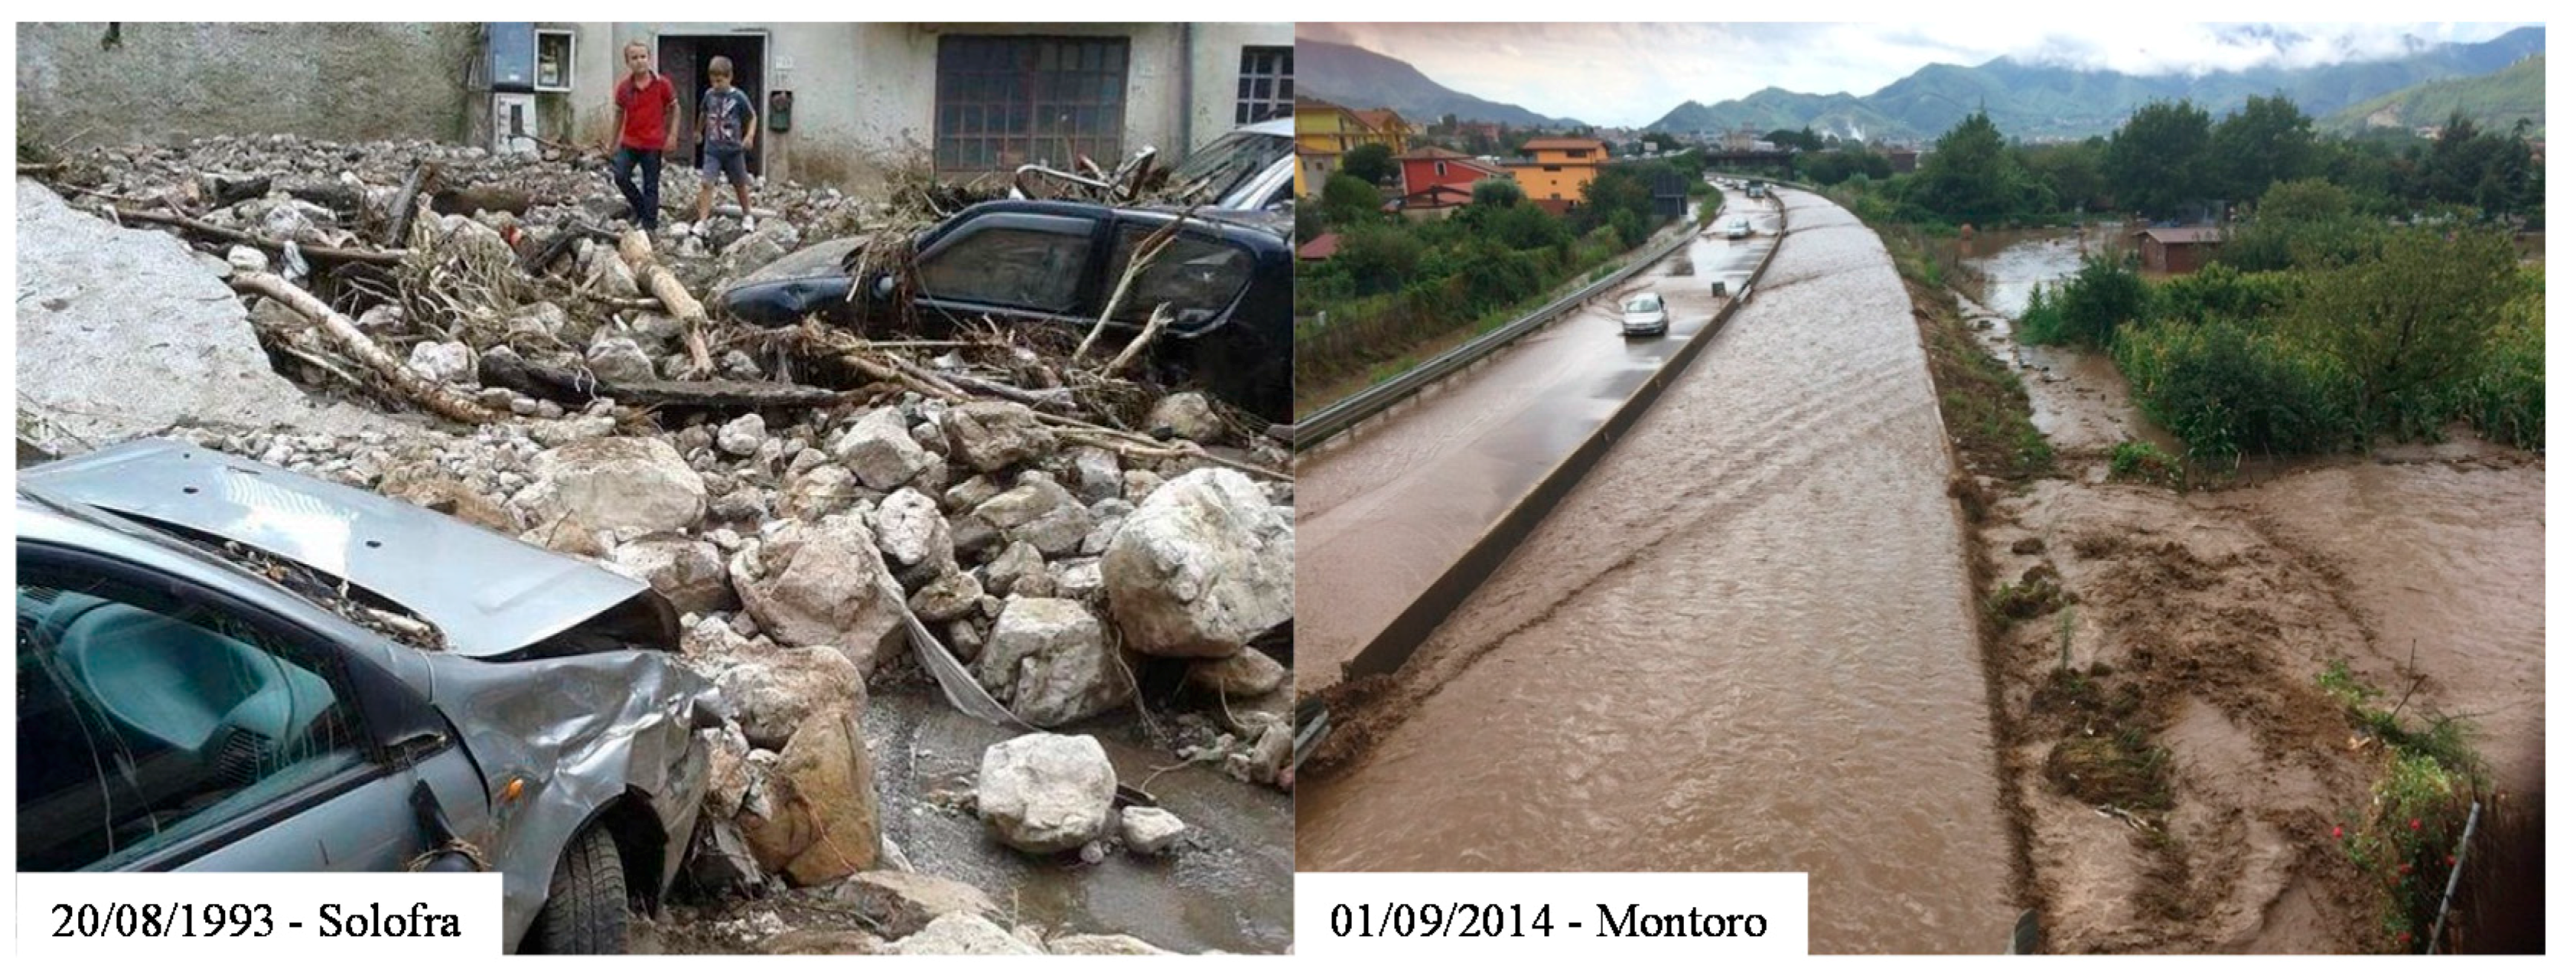
2.2. MDHE Occurrences Collection

Different sources have been consulted in order to gather information about the day of occurrence, the name of the river reach that overflowed, the location of damages, the affected municipalities, and the type of phenomena for each event. Flooding (F), landslides (L), and combined floods and landslides (F/L) have been considered. Governmental agencies’ documentary evidence, paper and book reviews, press articles, and national floods and landslides catalogues have been searched and crossed to originate the MDHEs inventory for the Solofrana basin, which are listed in Table 1. A number of about 45 MDHEs have been recorded, occurring during the period 1951–2014.
Urban areas of municipalities included within the catchment area are illustrated in Figure 1 as grey polygons. Among these, only four municipalities, Forino, Solofra, Montoro, and Mercato San Severino, highlighted as red polygons in Figure 1, have been severely affected by MDHEs during the period of observation. The remaining were not affected at all or in just one occasion, on 05/05/1998, when an extremely severe rainfall event caused floods and landslides that hit numerous locations in the studied river basin, also causing losses of lives [30]. As the frequency of occurrences is the target point of the current analysis, they were not included in the database.
With exception to the 05/05/1998 occurrence, collected events have never caused losses of lives, but severe and costly damaging to the natural environment, urban infrastructures, and interruption of local transportation infrastructures, where at least more than 50 people were reported affected (Figure 2).
As a streamflow measurement database is not available for the investigated basin, the hydro-geological hazard temporal evolution within the Solofrana catchment has been mainly investigated with reference to combined climate indices, accounting for the storm erosivity potential, as described in the following paragraph.

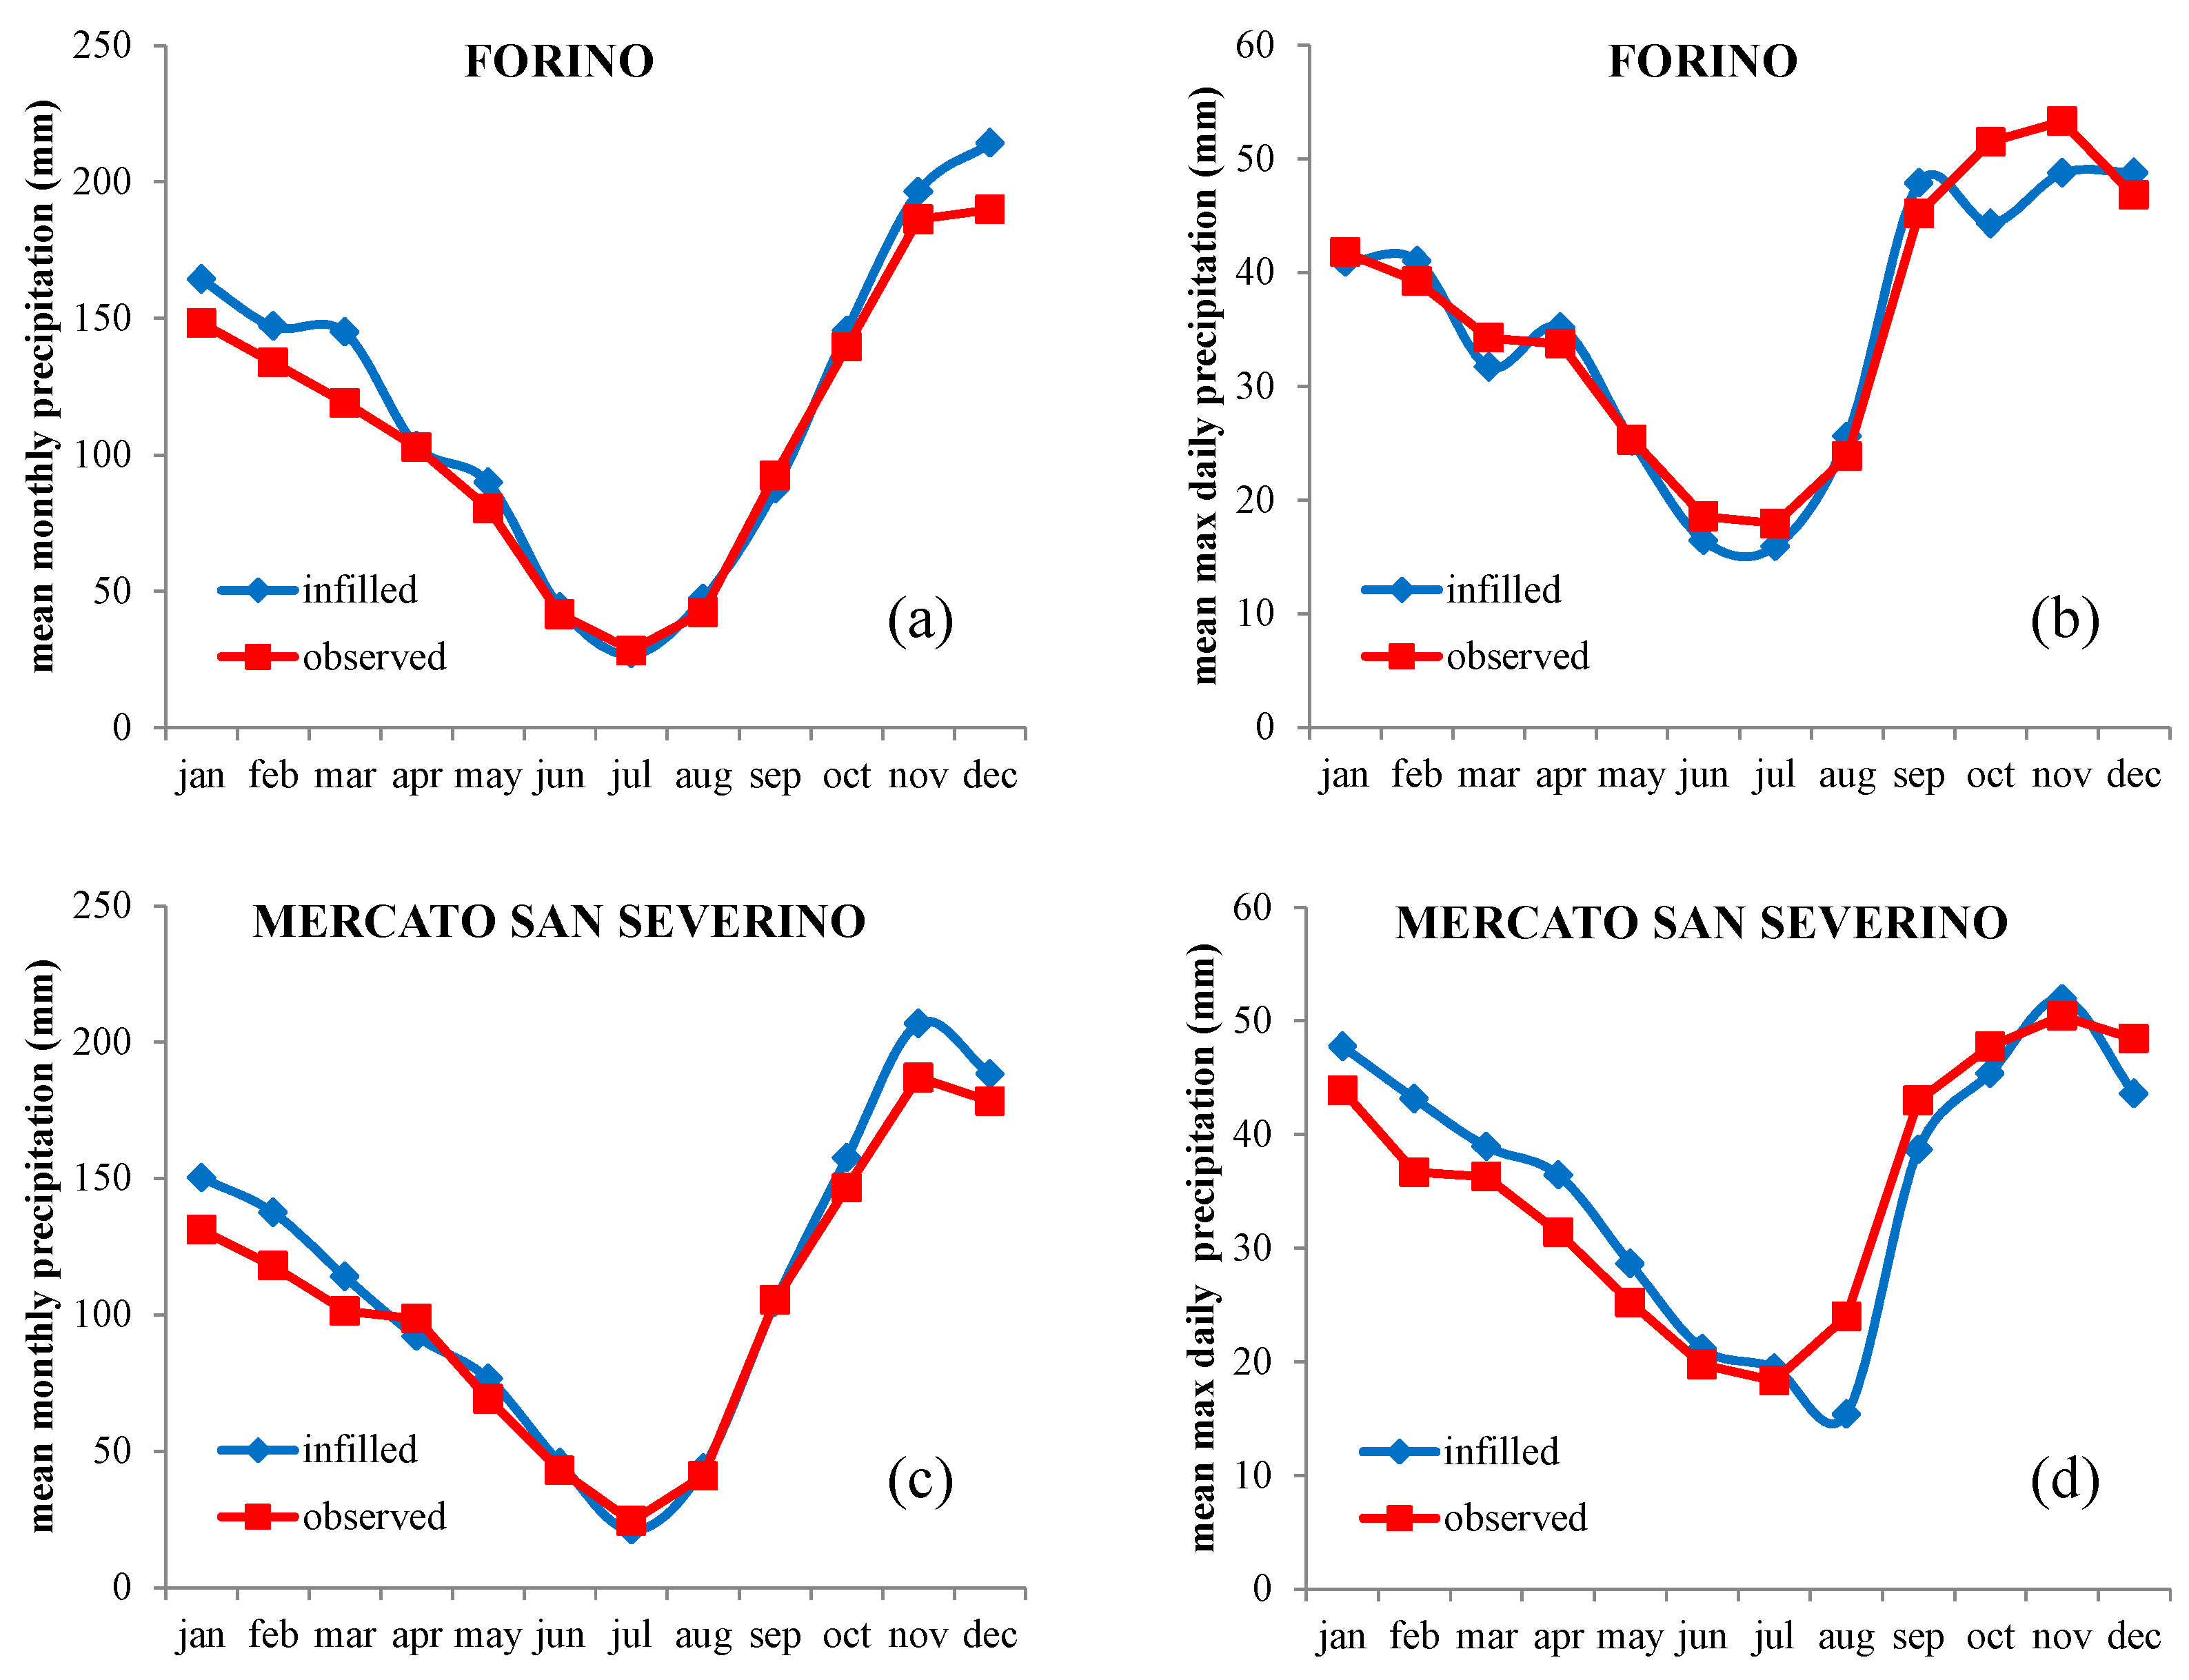
2.3. Precipitation Data

Historical annual and monthly precipitation data spatial variability in the Campania region has been reported in previous studies [31,32]. Historical rain gauge stations located in the study area are indicated in Figure 1. Data from eight stations have been considered in the current analysis. Metadata and mean annual precipitation are reported in Table 2. Despite the long time windows for available records, time series are frequently not continuous, with a minimum number of observation equal to 35 years. In particular, time series for the two stations located within the watershed, Forino and Mercato San Severino, present a long break of about 10 years starting from 1986.
The region appears rather homogeneous on the climatological point of view. Mean annual precipitation values for the considered stations are similar (Table 2), as well as the monthly patterns illustrated in Figure 3. If the average pattern, over the eight stations, is delineated, the range of monthly values fall within the 95% prediction bounds. Extreme precipitation regional patterns have also been under investigation in previous studies [33,34]. Five homogeneous areas have been identified, and within each of them, a regional relationship has been calibrated where a dependence on point station elevation has been considered to predict extreme rainfall of different durations.
Despite their spatial location, Forino and Mercato San Severino rain gauges cover an important range of variability in topographical elevation and, thus, can be considered as representative, respectively, of the mountain and valley territory. For such reasons, they have be assumed as candidate rain gauge stations to predict the temporal evolution of the rainfall-runoff erosivity, as later described. The discussed climate homogeneity and the main dependence on topographical elevation have represented an advantage in the application of an infilling algorithm, to infill missed data for the two mentioned rain gauge stations.
The simple nearest neighbor method has been used, where the donor station has been selected as the station with the highest correlation to the target rain gauge [35]. Infilled values have been obtained with a correction factor that is the ratio of the long term means of the target station and its nearest neighbor. Correlation coefficients are generally high (0.8–0.88) and, interestingly, the lower of the correlation coefficients (0.8) is computed between Forino and Mercato San Severino stations. This consideration further validates the use of the two candidate rain gauge stations, as they provide a climate signal which is less correlated than the remaining stations couples. As a summary, in Figure 4, the seasonal average patterns for observed and infilled data for both Forino (Figure 4a,b) and Mercato San Severino (Figure 4c,d) are illustrated. Goodness-of-fit for monthly data are satisfactory with maximum relative percentage errors of about 18% and 15% for Forino and Mercato San Severino, respectively. Maximum daily rainfall patterns show larger errors, of about 50% for Mercato San Severino (Figure 4d). As the maximum error is detected in only one month, August, where the percentage of occurred MDHEs is not as important as in the autumn trimester (as later shown) and as the evolution of the rainfall-runoff erosivity will be assessed at the annual scale, we assumed infilled precipitation data reliable for further applications.

2.4. Rainfal-Runoff Erosivity
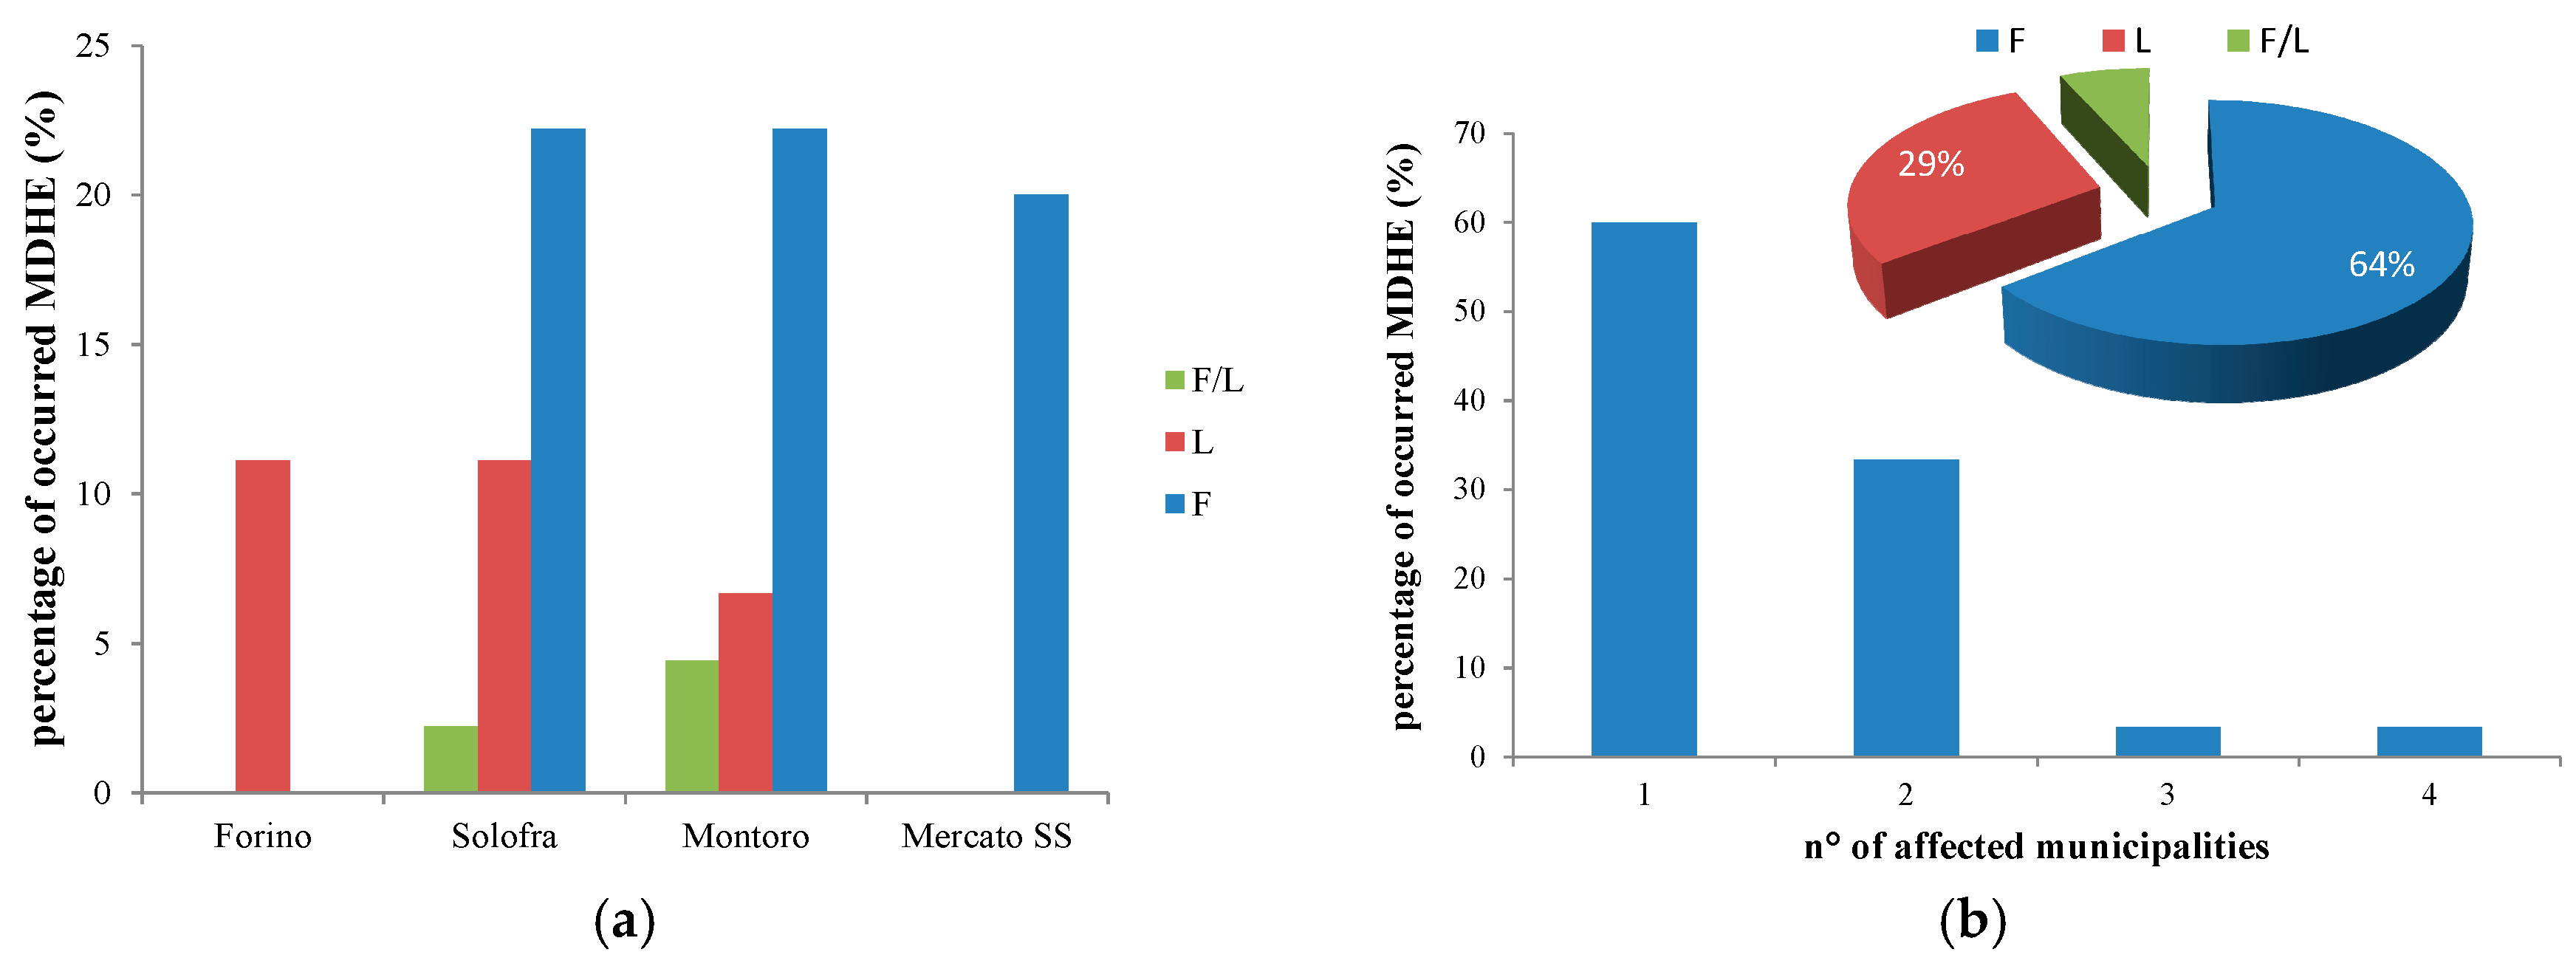
The general approach used to estimate the rainfall-runoff erosivity (RR), when detailed rainfall data are not available (e.g., sub-hourly rainfall), as for the case study, is to refer to the application in areas featured by similar climate conditions, for which detailed data are available and where relationships between RR and less-detailed climate indices can be calibrated. Following this operational scheme, an approach previously calibrated for the Alento river basin, similar by catchment area and climate properties, has been applied to predict the rainfall-runoff erosivity for the Solofrana river basin [36].
As developed by Wischmeier and Smith [14] and later modified by Foster et al. [16], the following modelling scheme is used:
R R = 0.5 R S + 0.5 R Q
where RS is the rainfall-runoff erosivity associated to the rain drop erosivity process and RQ is the component of rainfall-runoff erosivity associated to the surface runoff erosion.
Depending on the time scale of aggregation, different formulation for the computation of RS can be used. When the monthly scale is investigated, they can be summarized in the following expression [37]:
E I 30 - month = α P m β
in which Pm is the monthly scale precipitation, where α and β are the model parameters to be calibrated and α, in particular, mimics the intra-annual variability associated to RS induced by the seasonal variability of heavily-erosive storms. In particular, for the Mediterranean region, Equation (2) becomes [38]:
E I 30 - month = α P m d β h γ
where α, β, and γ are the model parameters to be calibrated, d is the monthly daily maximum precipitation, and h is the monthly maximum hourly precipitation. The terms d and h have been introduced to specifically account for the power of heavily-erosive precipitation events. Pm represents, instead, the power for weakly-erosive precipitation. Equation (3) has been modified as suggested in [36], to provide an assessment for RS in the case where hourly data are not extensively available:
R S = P m d ( d f ( m ) )
where the monthly maximum hourly precipitation is replaced with a function of monthly maximum daily precipitation modulated by a function f(m) that modulates the intra-seasonal storm-intensity proxy during rainfalls, with m as an index of the month of the year (1 for January to 12 for December):
f ( m ) = ( 1 0.65 cos ( 6.28 m 2 21 m ) )
Equation (4), as a rainfall erosivity indicator, has been calibrated versus actual erosivity data in [36], with a significant correlation coefficient (0.81). In the same study, a calibration for RQ has also been provided. RQ is defined as:
R Q = ( p m + p m 1 ) w ( m )
where, similarly to the f(m) function, w(m) is an indicator of soil humidity, modulating the relative intra-seasonal variability:
w ( m ) = ( 0.5 + 0.4 cos ( 6.28 m + 0.5 24 m ) )
Assumed to represent an indicator for runoff production, a comparison between monthly RQ and monthly scale aggregated streamflow observation has been provided in [36], with a significant correlation coefficient (0.71).

3. Results

Below, a temporal characterization of occurred events is illustrated, and summary statistics for the database in Table 1 are provided. Sixty-four percent of the events are represented by flooding events (F), whereas landslides (L) occurred only in 29% of cases. In only three cases (about 7%) flooding and landslides occurred simultaneously. Figure 5a,b illustrates how events are distributed within the studied watershed. Solofra and Montoro municipalities appear to be the most affected by MDHEs (respectively, 36% and 33% of total cases). Floods, 22% of total cases for both municipalities, dominate the occurrences of landslides, amounting, respectively, to 11% and 7% for Solofra and Montoro. Combined flood and landslide events (F/L) occur more frequently in Montoro. The spatial distribution of floods and landslides appears coherent with the physiographical environment. Due to its geographical environment, the municipality of Forino is only exposed to landslide events; 38% of total landslides occurred there. Similarly, Mercato San Severino is only exposed to flooding events; 31% of total flooding occurred there. Rather frequently (33% of total cases) events occur simultaneously at two different municipalities and only in one case, on the 4 November 2000, all of the considered municipalities were affected (Figure 5b).

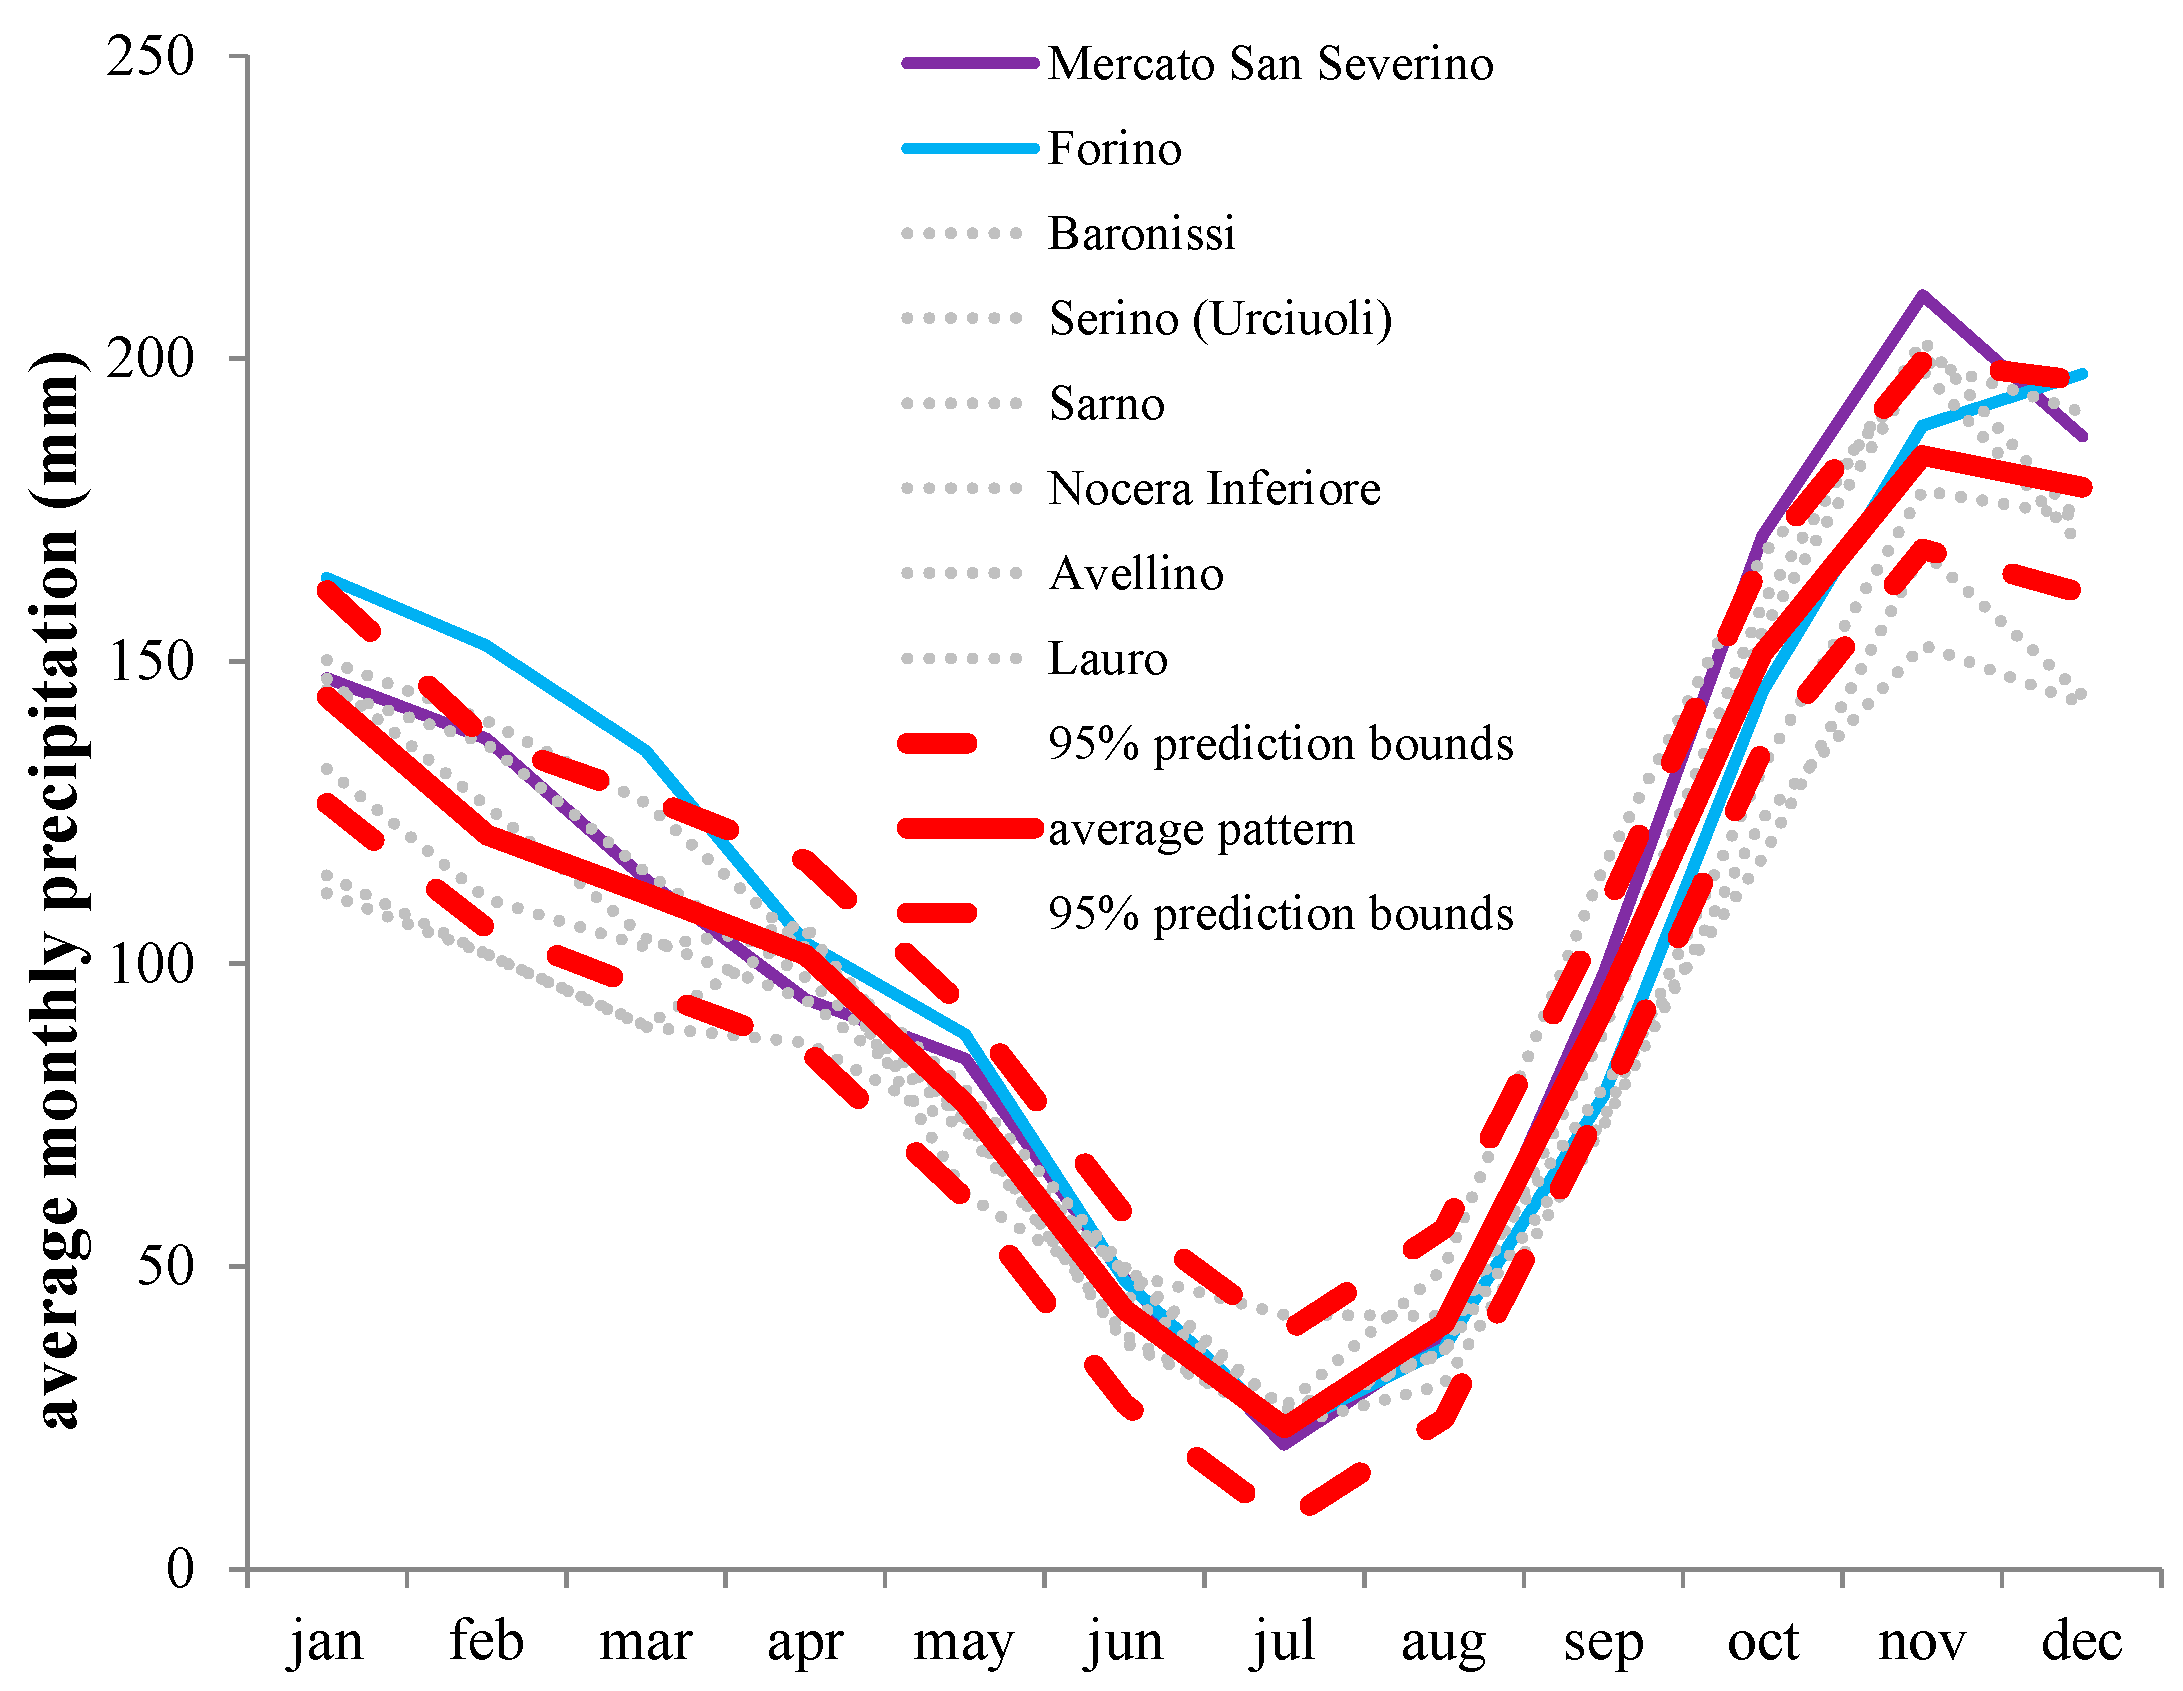
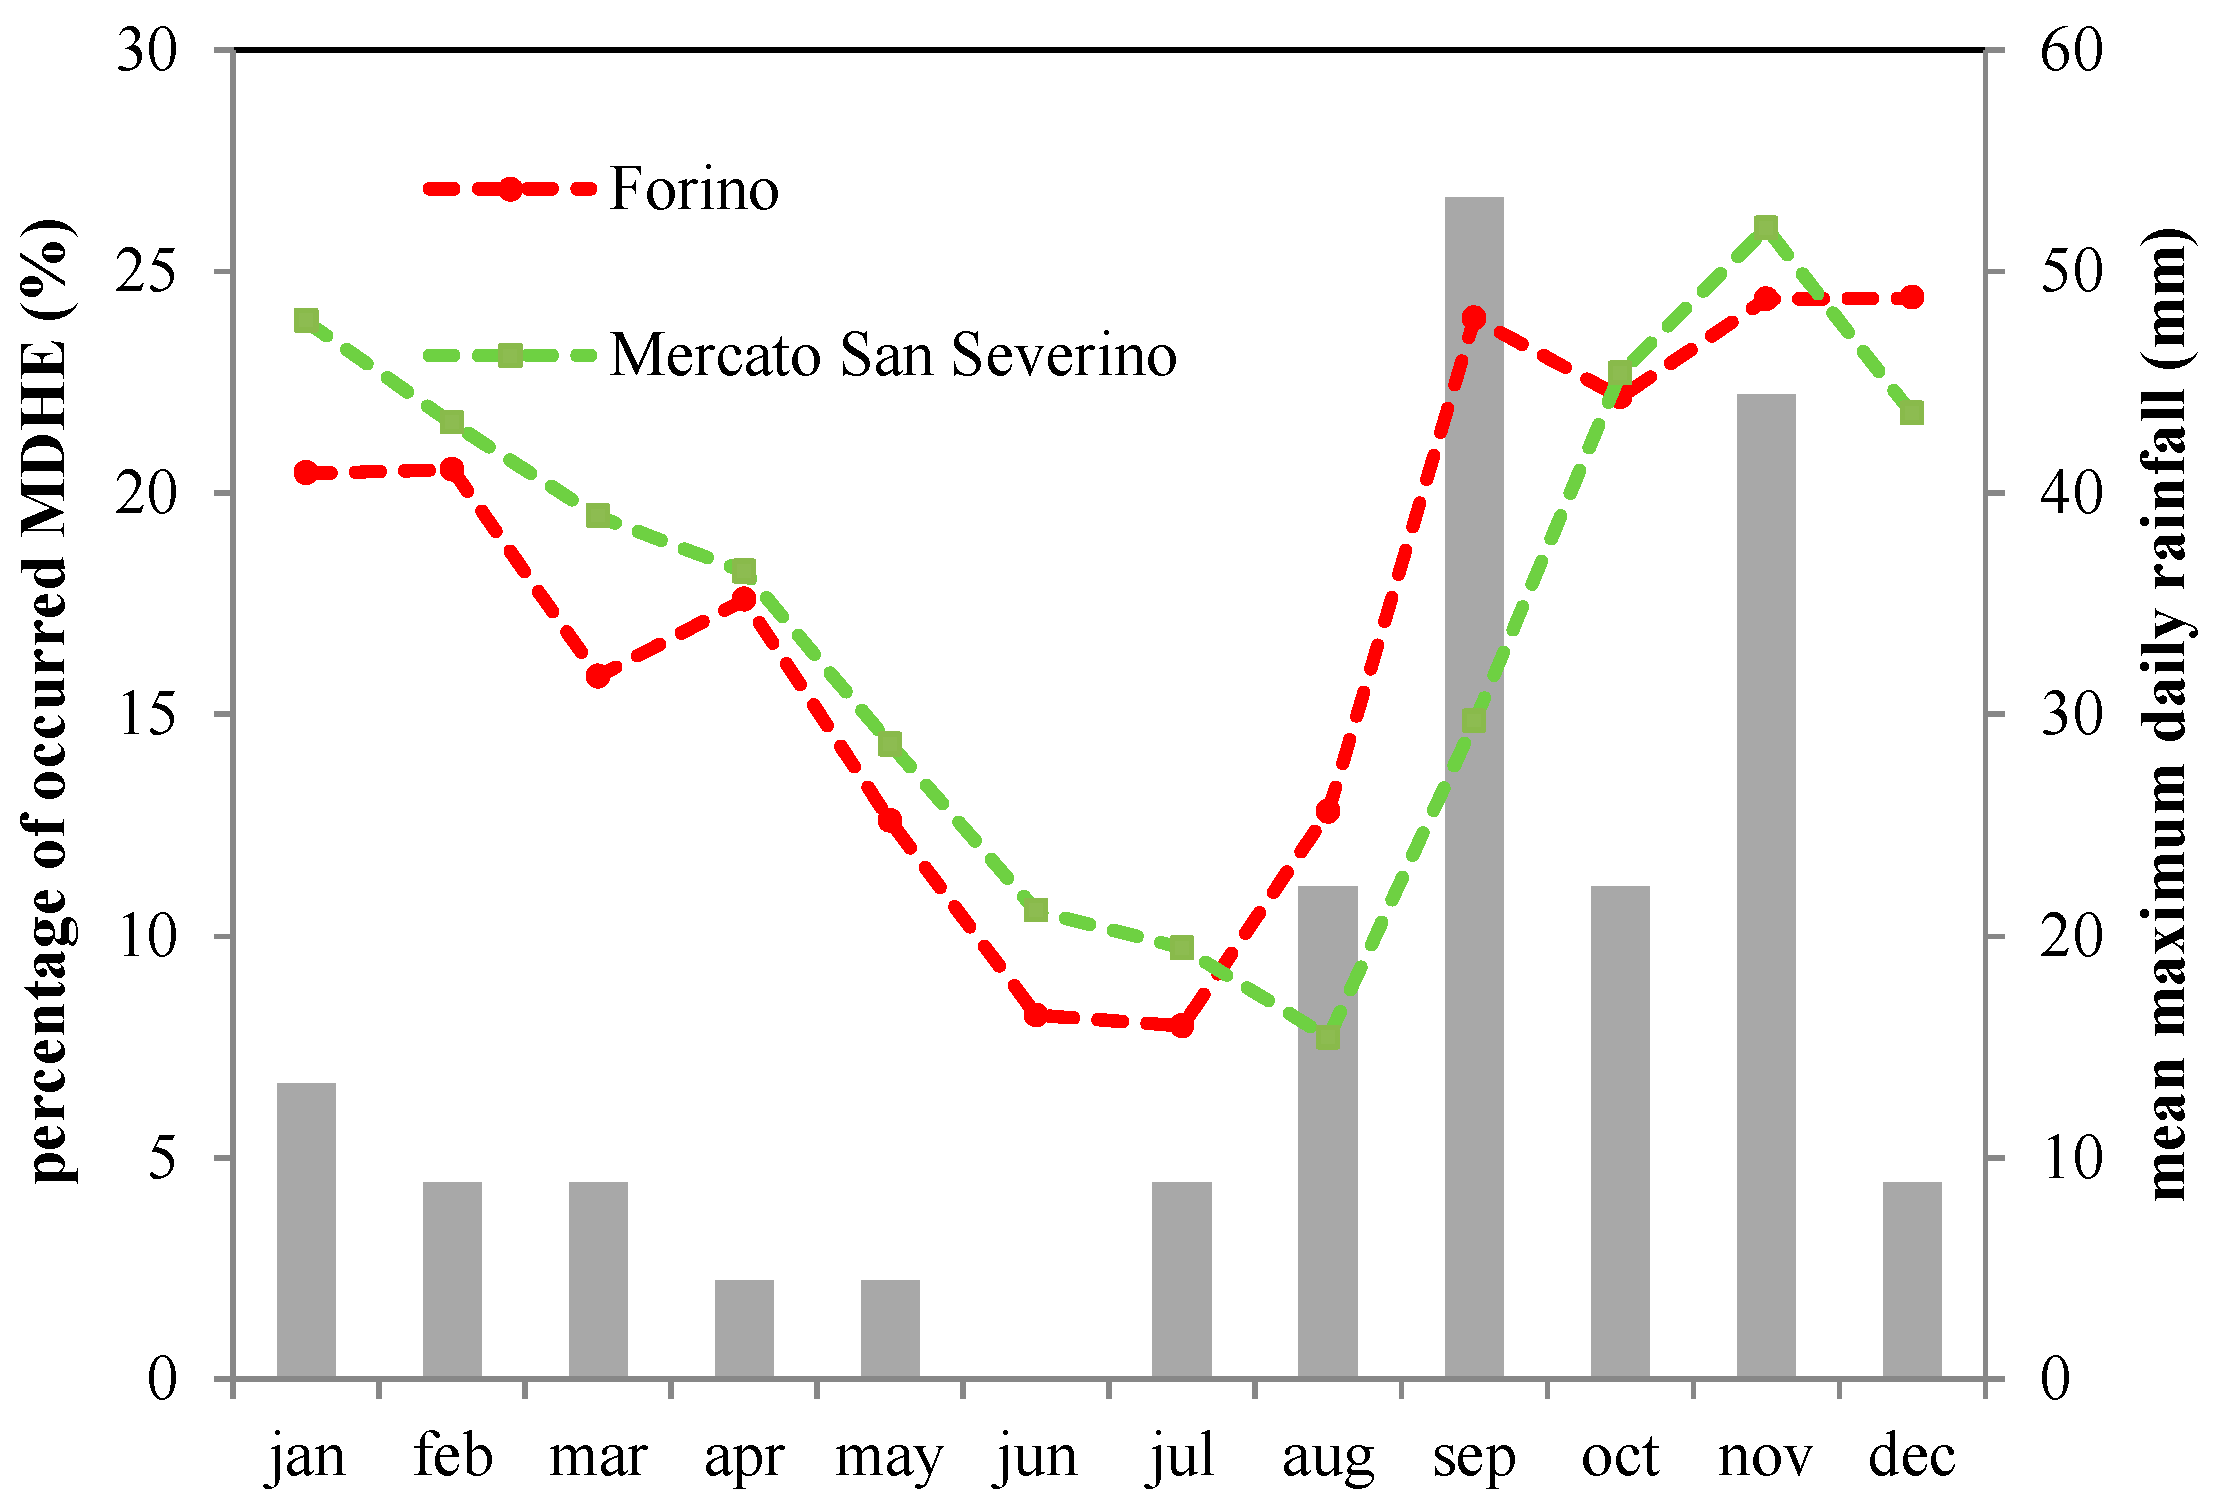
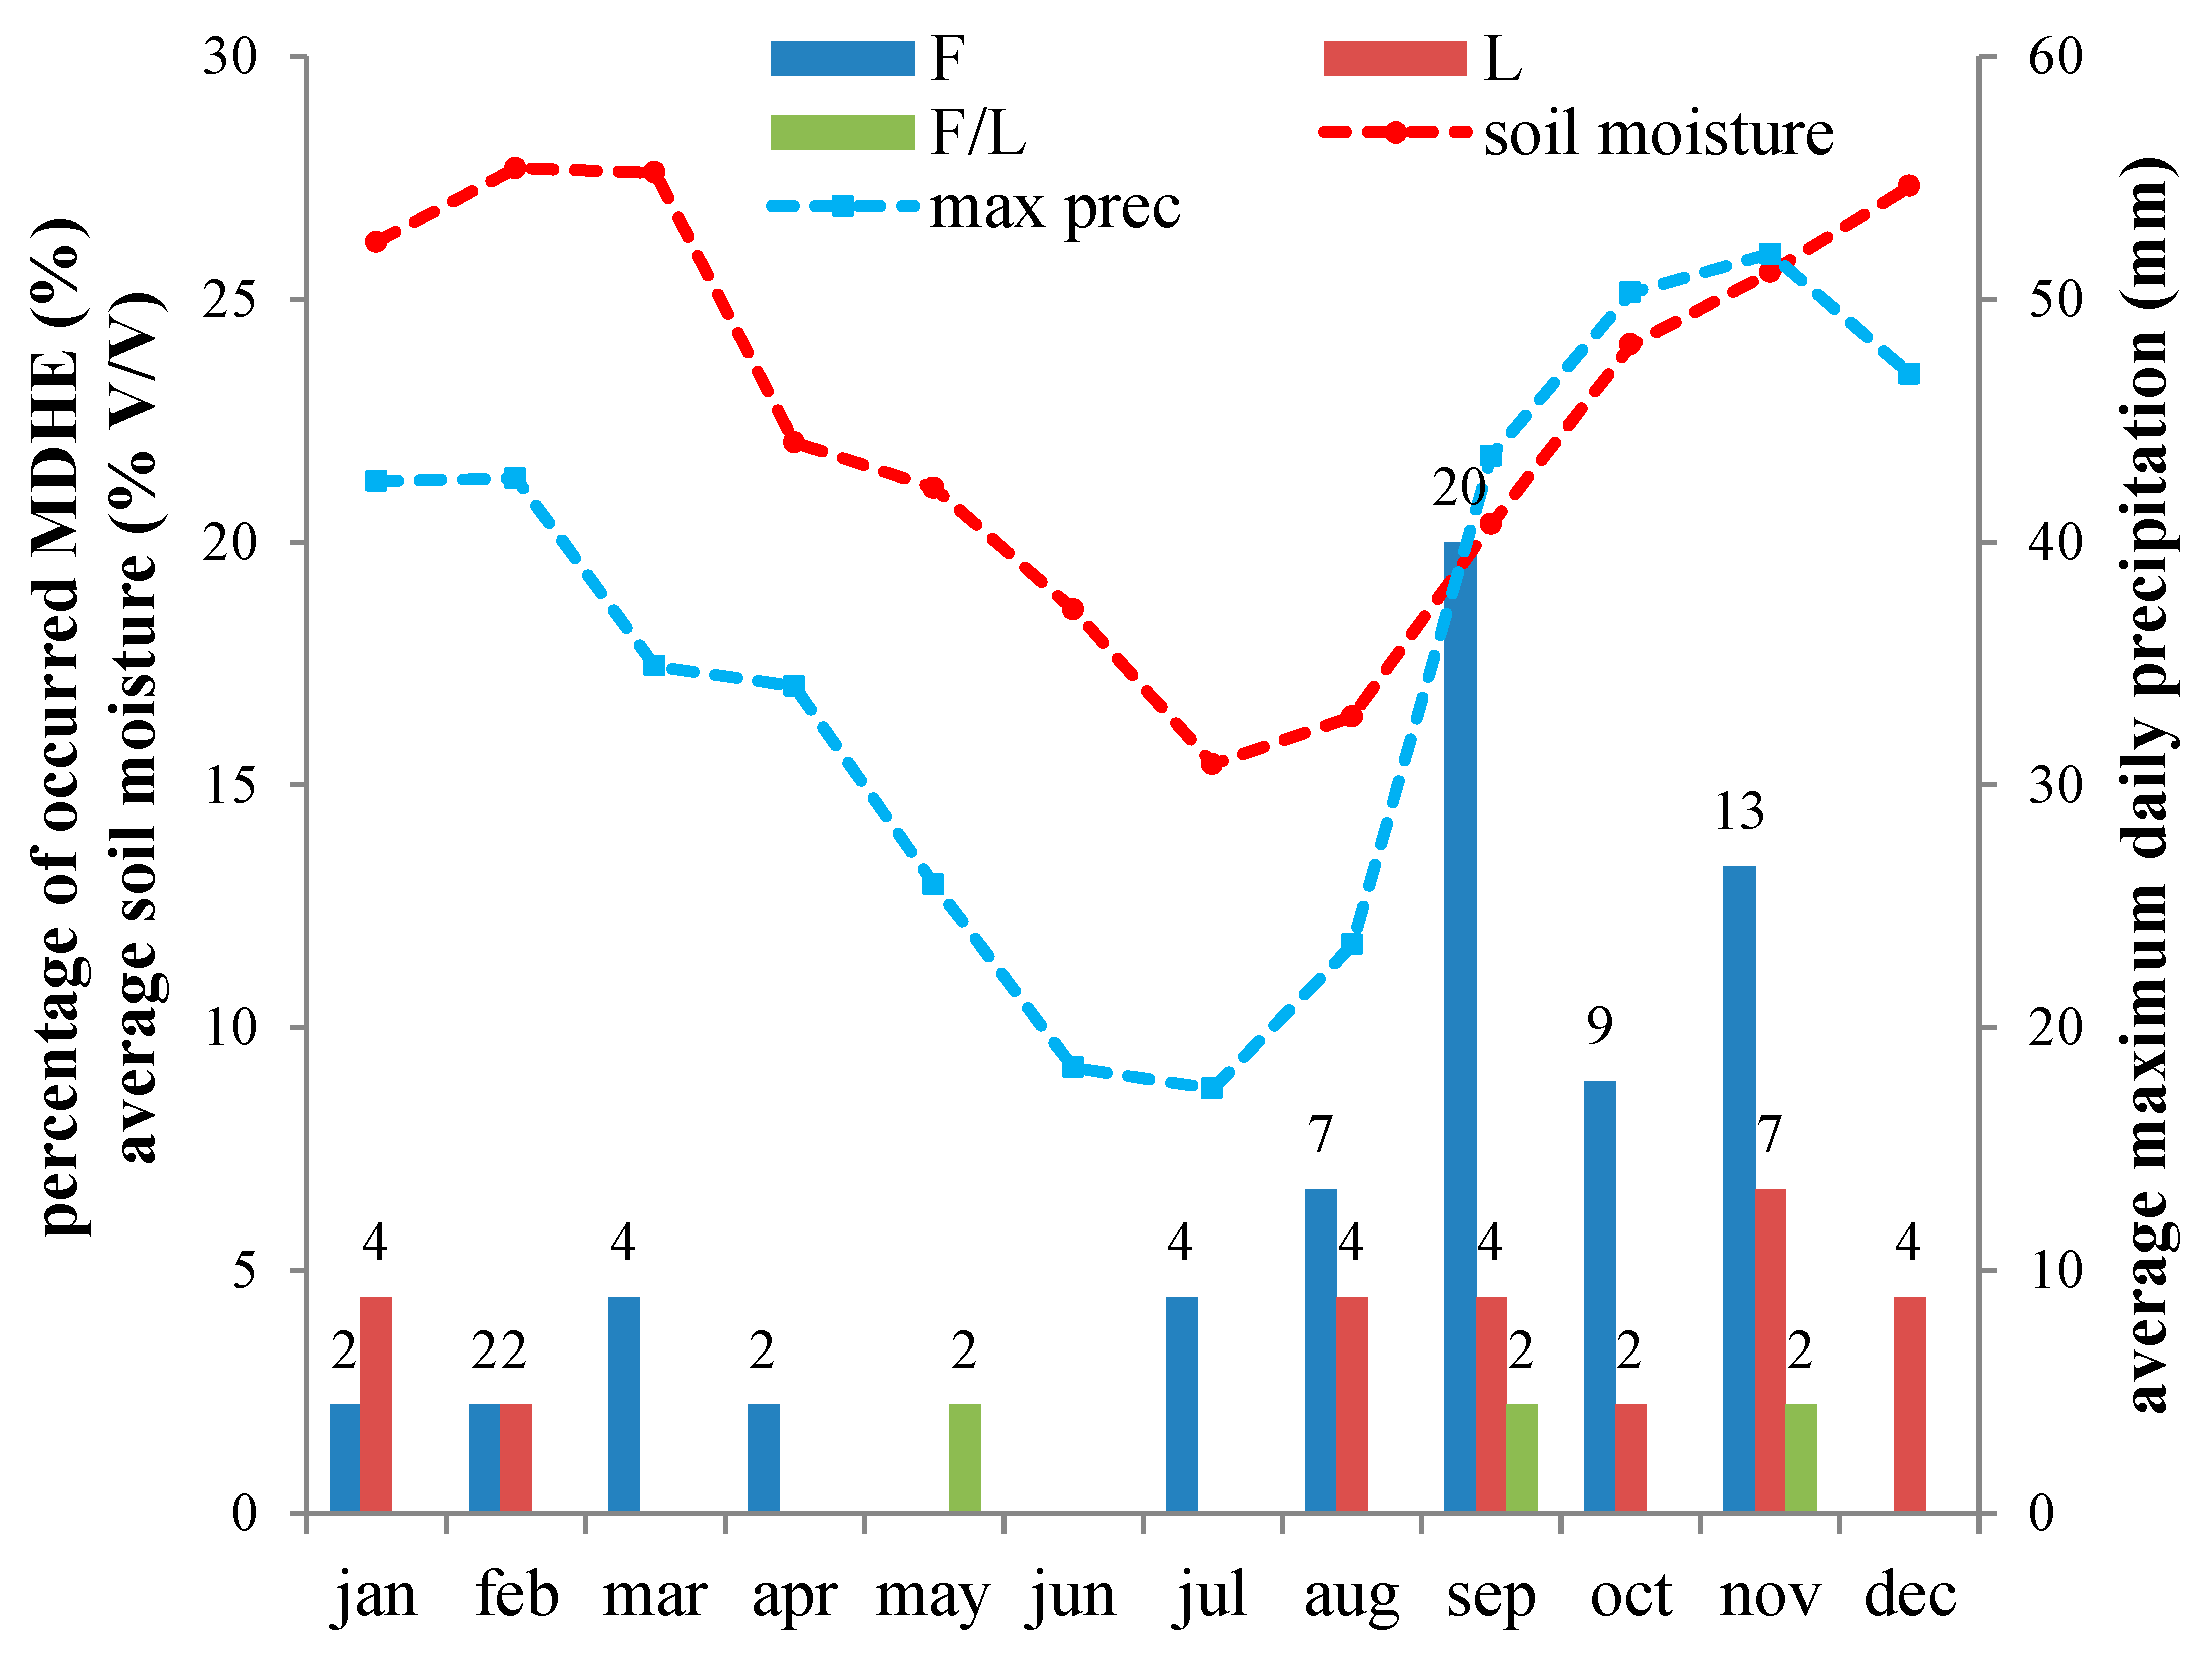
3.1. Seasonal Pattern

The seasonal pattern of occurred MDHEs is represented in Figure 6. On a seasonal basis, it is rather evident how the largest fraction of MDHEs occur within the autumn season, where, from September to November, about 60% of the total number of events have been reported. This number would further increase if a significant percentage, about 11%, of events, occurring during the third week of August, is also considered.
The monthly pattern of occurred MDHEs is compared to the monthly pattern of the average value of maximum daily rainfall, computed for both Forino and Mercato San Severino rain gauge stations (Figure 6). The large percentage of occurrences during the autumn season is likely to be related to the synoptic dynamics of hazardous autumn precipitation and cyclone events, moving and evolving along the Mediterranean basin within this particular season [24]. The largest monthly values of maximum daily rainfall for the investigated area take place exactly in the same period, from September to November, where the largest percentage of MDHEs is reported. In this period, measured soil water contents also start to quickly increase after the dry summer period, reaching a stationary condition for the largest soil moisture value through the hydrological year [39]. The latter hydrological condition, added to the climate peculiarity, is probably the cause of an amplification of geomorphological phenomena. Probably due to such reasons, landslides occur with a rather constant rate during the autumn and winter seasons, probably more frequently induced by prolonged wet periods, causing soil saturation phenomena, rather than by short and intense precipitation events (Figure 7). Floods are reported throughout the year, with a significant rate increase during the autumn season (Figure 7).

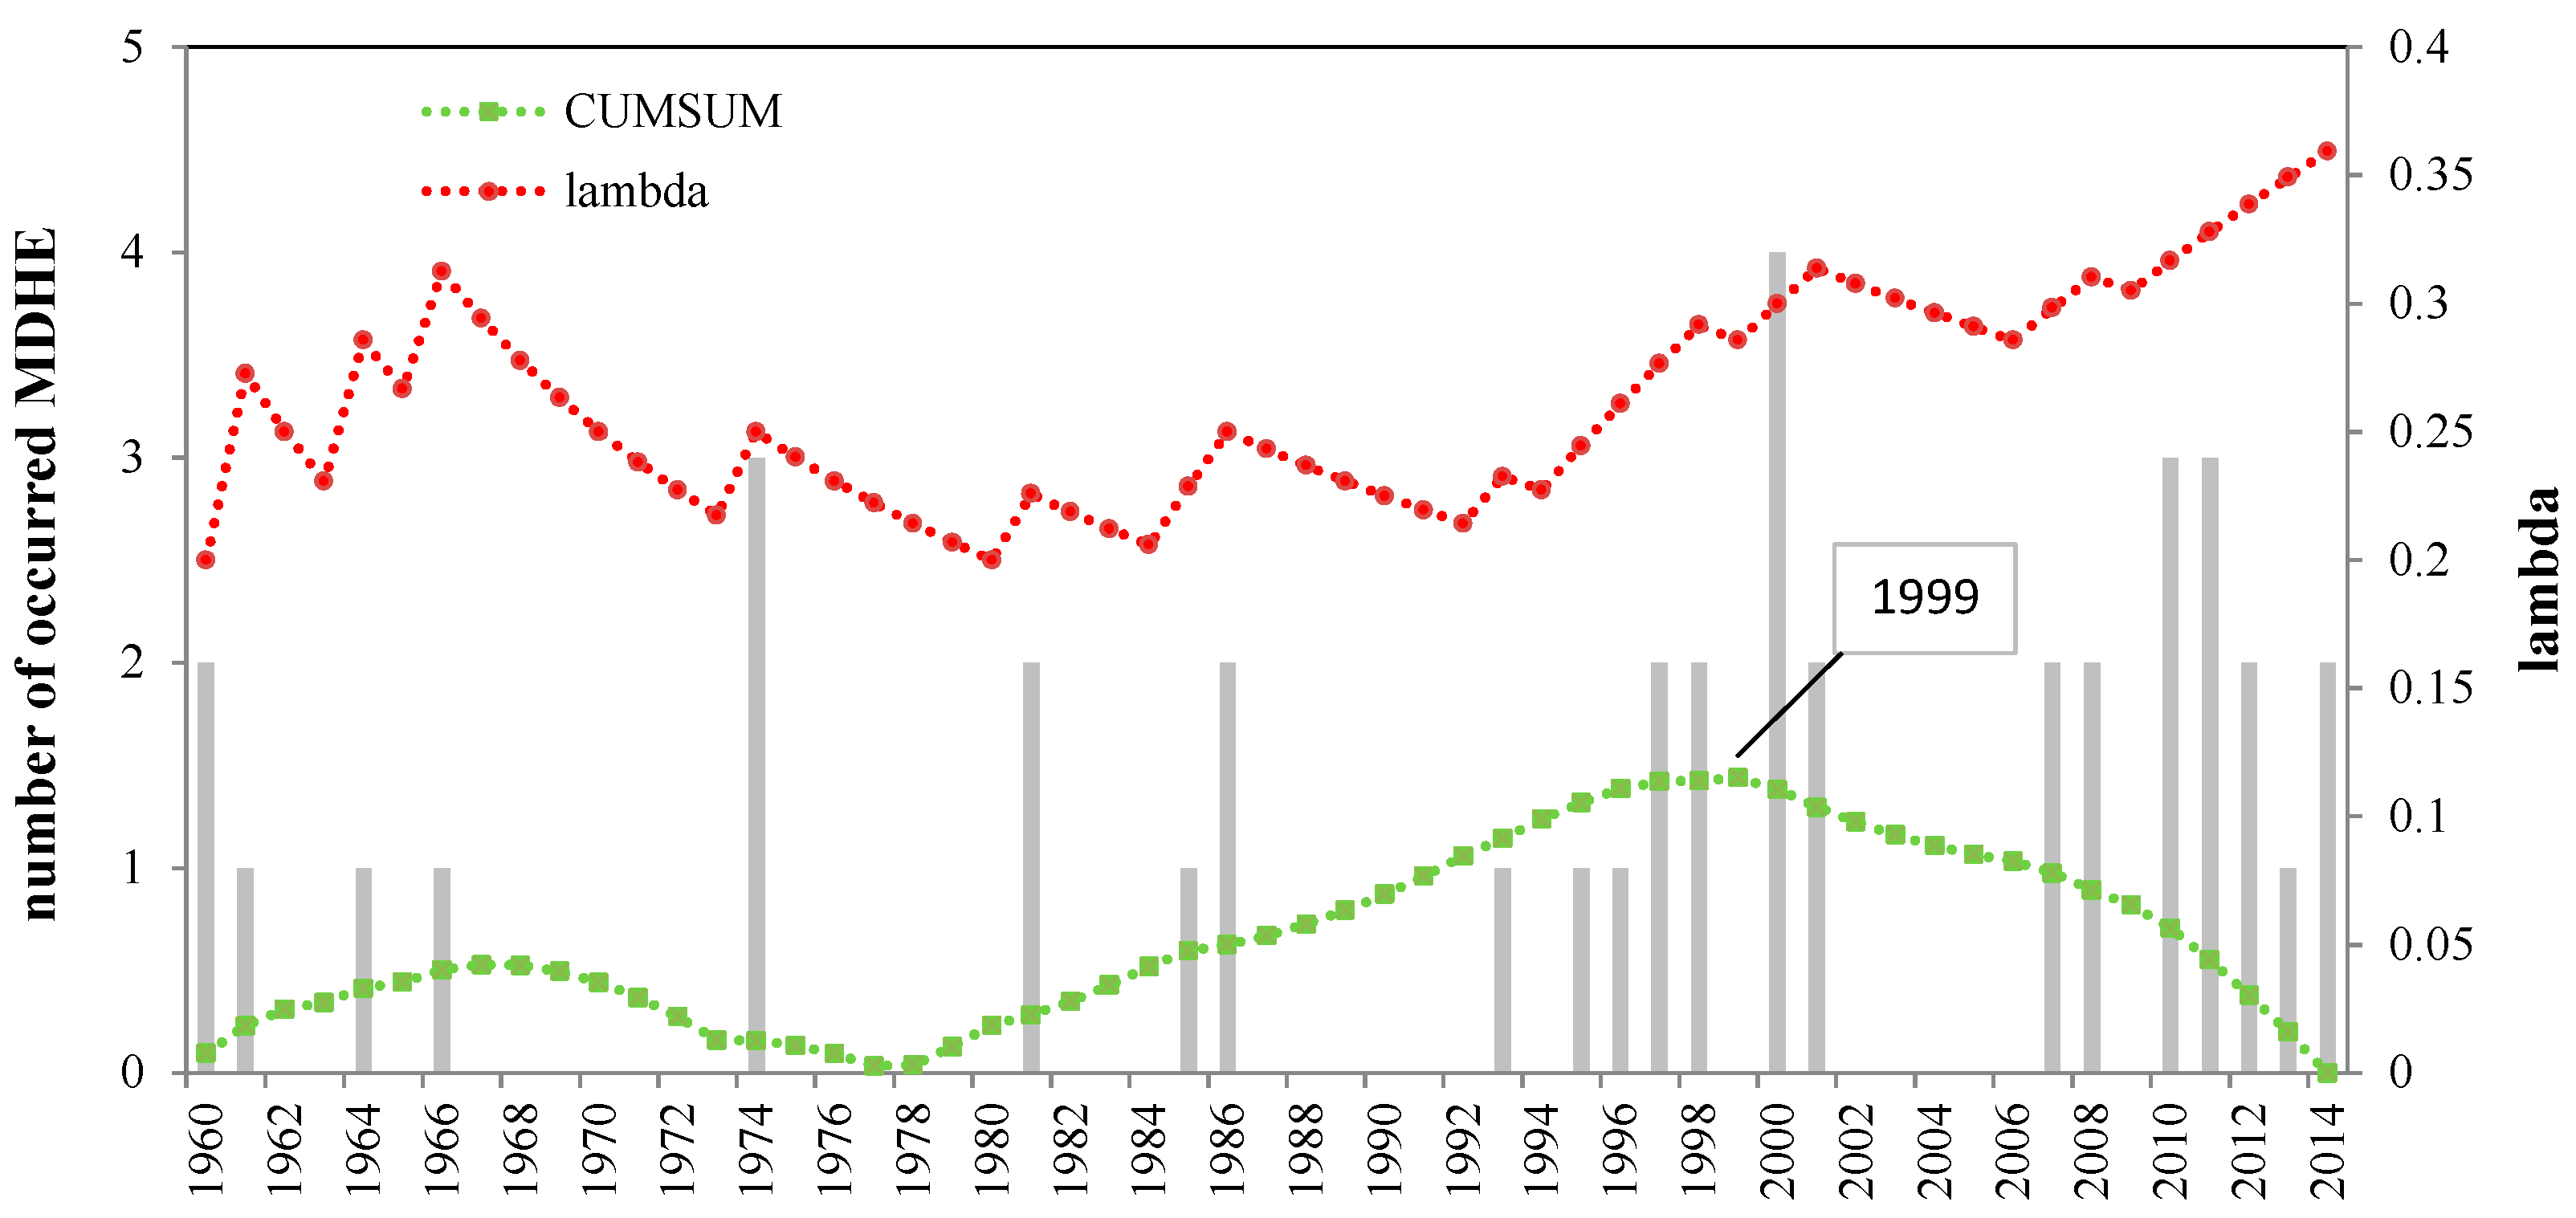
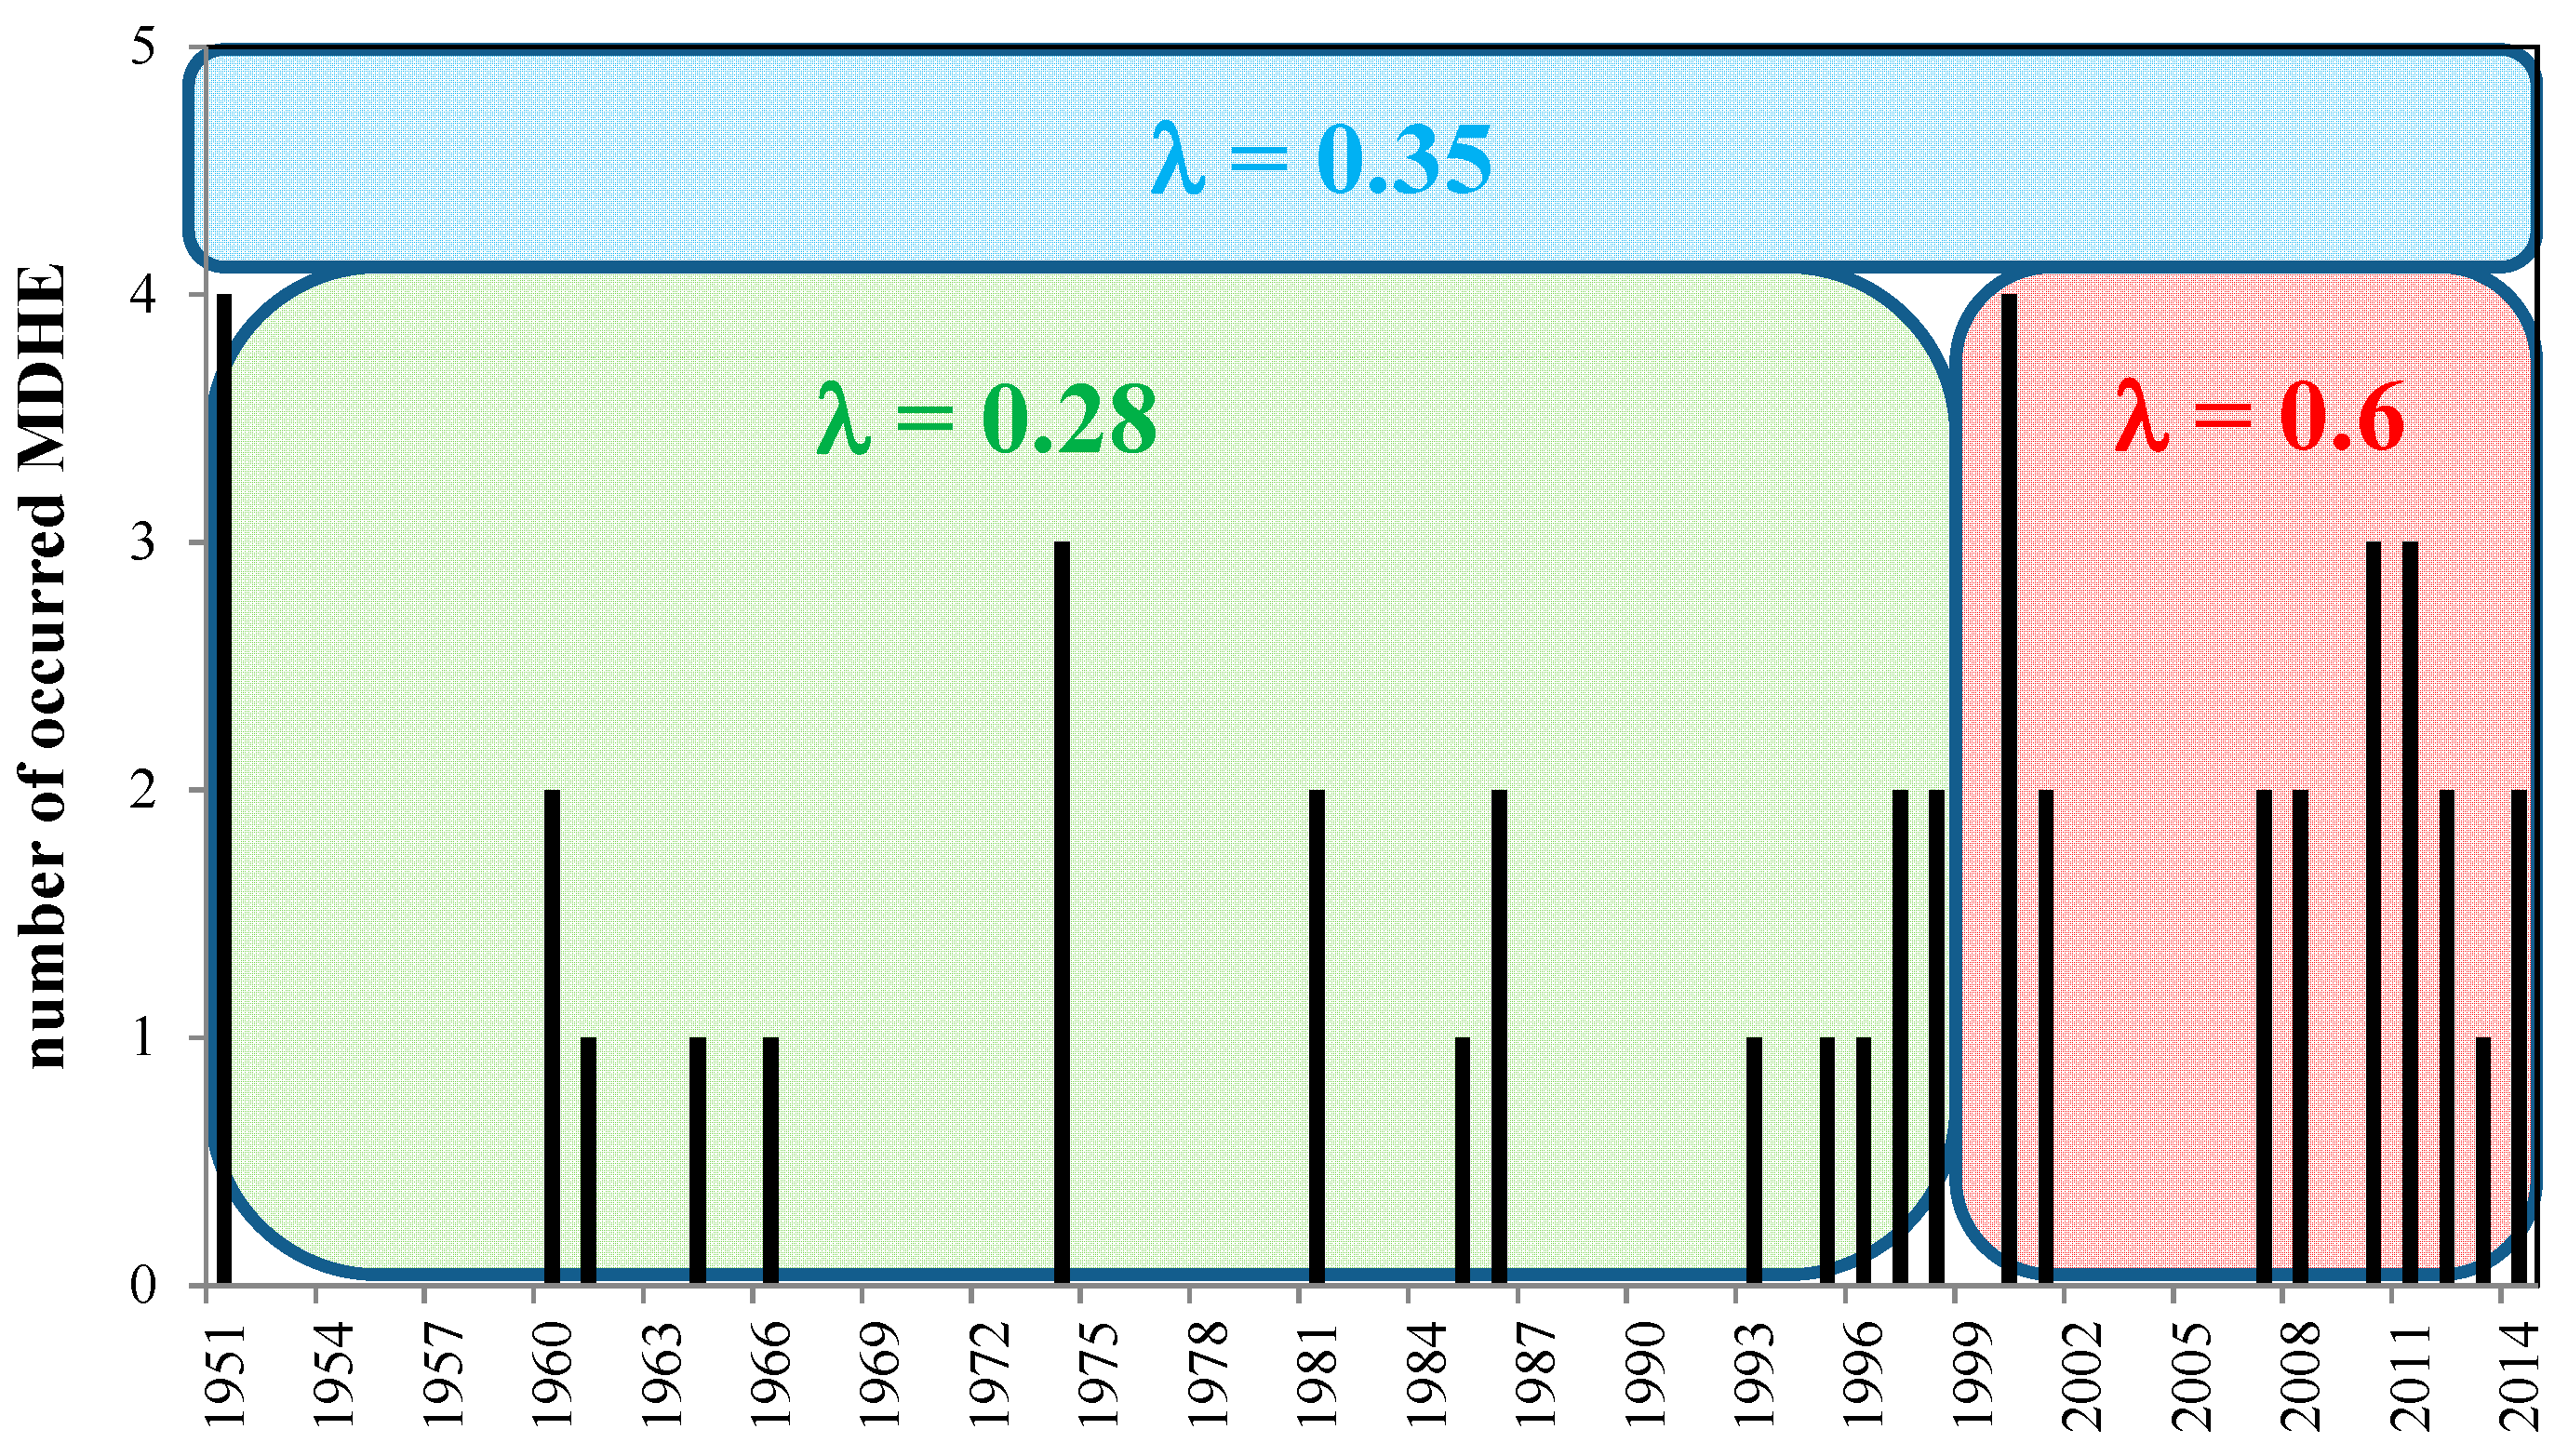
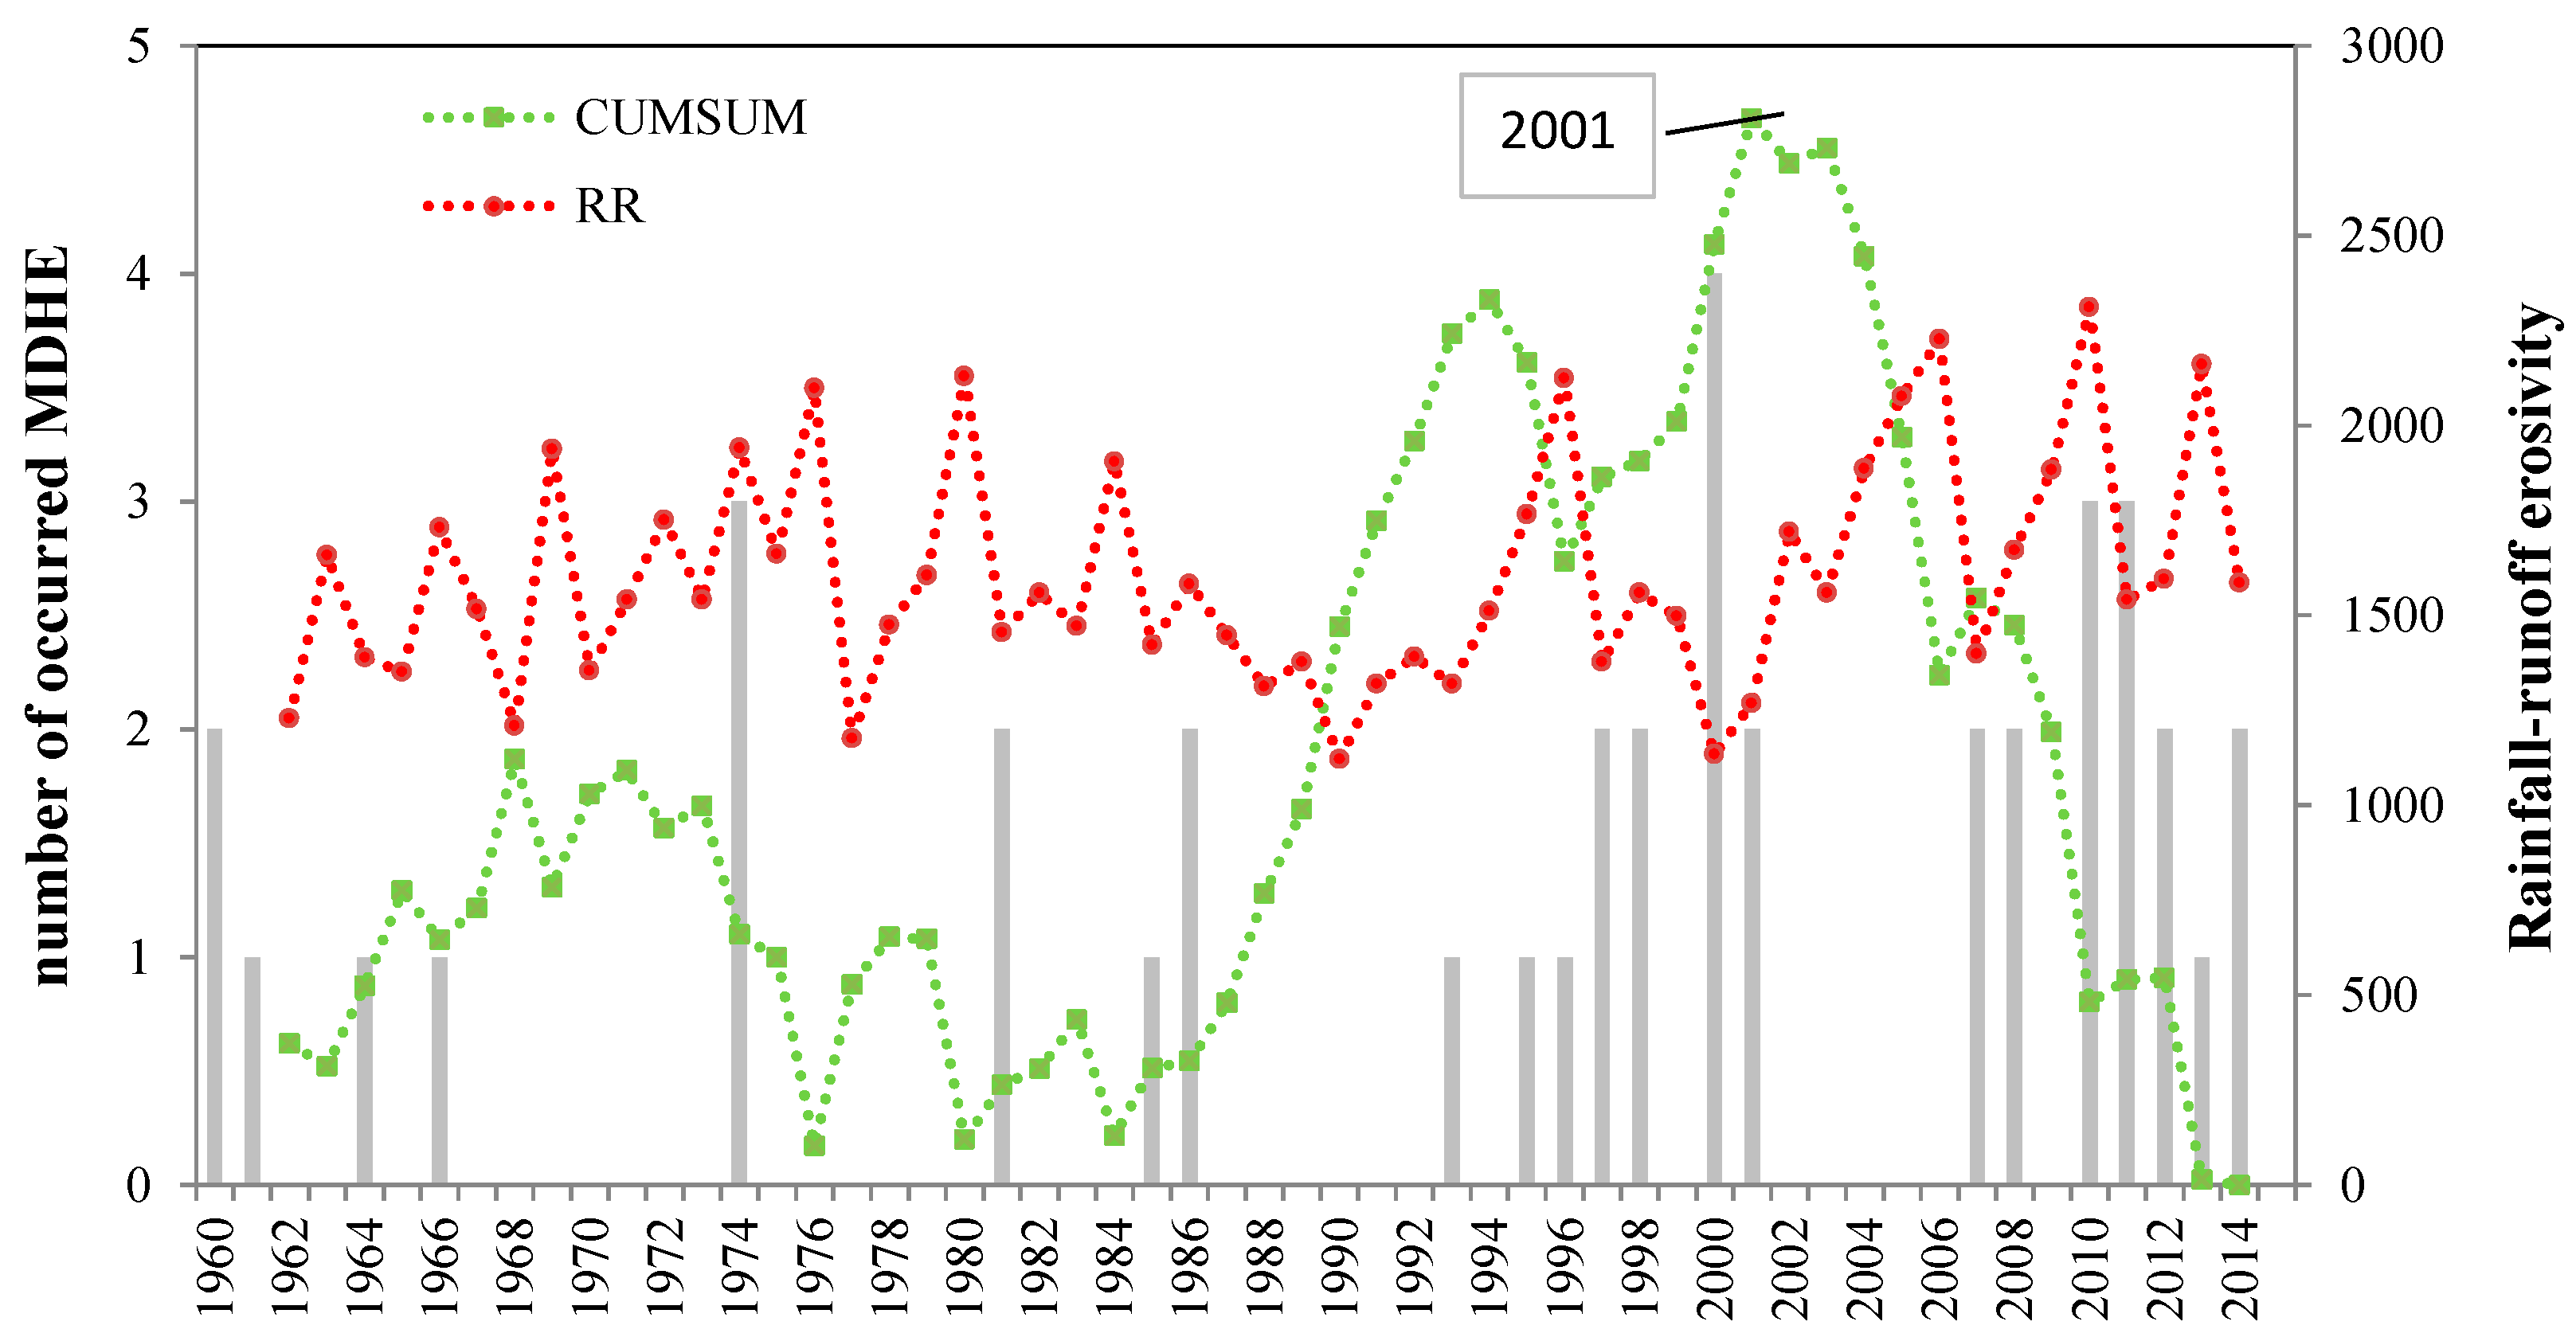
3.2. Long-Term Pattern and Tendency

The long-term pattern of occurred MDHEs is analyzed in addition to the seasonal pattern, to assess the hydro-geological hazard and its related evolution for the studied catchment. A visual inspection of MDHE occurrences reported in Figure 8 clearly indicates that the frequency of severe hydro-geological events has been changing during the last sixty years. On average, the Solofrana basin has been hit by MDHEs at least once per year (Table 1).
These considerations are indeed confirmed by statistical analysis. With the aim to investigate the temporal evolution of MDHE occurrences, in the following, the time interval between years where an unspecified number of MDHEs occur is the focus of the assessment. Regardless of the cumulative number of events within each particular year, the process of occurrences of time instants (years) where MDHEs have been recorded, X, can be modelled by a Poisson distribution:
f ( k ; λ ) = P r ( X = k   e v e n t   i n   i n t e r v a l ) = λ k e λ k !
where Pr(X = k) is the probability of observing k events in an interval and λ (lambda) is the average number of events per interval. Considering a time index t (t = 1, 2, 3, 4, …) , with 0 < t < T, T = the observed total time interval, an assessment for the average number of events λ (t) occurring for each time interval T* = [1, t] is provided and illustrated in Figure 8. The λ parameter assumes large values during the period between 1960 and 1970; after that a decrease occurs for a long time interval from 1970–1996, to further increase exceeding the estimated values during the early period of observation. Searching for a non-stationary behaviour, the probability of the occurrence of a change point has been computed by the application of the Buishand test [40], also known as the CUMSUM test. If a change, or break, point exists, on the basis of a statistical test, statistical significant differences exist in the time series characteristics before and after the break point. The CUMSUM test is a cumulative test which statistic S is defined as:
St = St−1 + Xt μ, for t = 1, ,T
where T is the sample length and μ is the sample mean. The series is considered homogeneous if S is approximately 0. If St shows a maximum (minimum) a negative (positive) shift would be detected. The significance of the shift can be evaluated calculating the ’rescaled adjusted range’ variable:
R = m a x S t m i n S t σ
where σ is the time series standard deviation. Critical values for R are given in Buishand [40]. A change point is found, with a significance level α = 5%, about at the year 1999, confirming indeed what is notable evident in Figure 8. The average lambda value for the full period of observation is about 0.35, rather similar to the one assessed for the time span 1951–1999 (λ = 0.28) (Figure 9). After the break, λ has a significant increase, doubling the average value for the full period (λ = 0.6). In other words, the time interval between years where an unspecified number of MDHEs occur is about three years, for the full period of observation, and about 1.5 years after the break point.

3.3. Rainfall-Runoff Erosivity Computation

In order to improve the hydro-geological hazard mitigation strategies in a particular area, an understanding of the nature and variability of the typical physical processes driving the MDHE occurrences, in that area, is undoubtedly essential. The climate impact, summarized by the previously-introduced rainfall-runoff erosivity (RR), is preliminarily explored, provided the tight conceptual role assigned to it in MDHE phenomena. RR computation is actually dependent on the monthly, maximum daily, and maximum hourly rainfall data, and the existence of a break point in relevant RR time series, especially if congruent in time with the break point found for the λ(t) time series, would provide an interesting indication about the connection between climate properties and MDHEs occurrences.
As for the case of lambda (Figure 8), a break point in the RR time series would actually entail an assumption about non-stationary features affecting the precipitation process. During the past century, with growing concerns about the impacts of climatic changes, precipitation trend analysis, on different spatial and temporal scales, has been one of the most extensively research and debated issues. The fifth IPCC Assessment Report (AR5) confirmed an increase in the Earth’s surface temperature in the twentieth century and forecasted a further increase for the twenty-first century [17]. With reference to the southern regions of Europe (the Mediterranean basin), the AR5 stressed how these areas appear particularly vulnerable to potential future alternations of extreme rainy periods and droughts or scarcity of water resources. Furthermore, the Mediterranean basin is characterized by a large precipitation variability at the regional scale [41,42], which is related to synoptic dynamics of hazardous events moving and evolving along the Mediterranean basin [43].
The studied catchment is located within an area for which not particularly severe climate non-stationary signals have been detected. A moderate decrease in monthly precipitation during the autumn season and a moderate increase in monthly precipitation during the summer season has indeed been observed during the past century [32]. Climate variability at shorter time scales also presents not clearly distinctive properties. A tendency in the increase in maximum daily rainfall data appear, in fact, significant only for the Forino rain gauge station [27]. In addition to the spatial connotation of climate variability, it has to be considered that rainfall fields that cause damaging events in the area are typically featured by a mesoscale dimension, which would also explain the fact that about 40% of collected events occurs simultaneously for two or more municipalities (Figure 5b and Table 1).
Provided the previous explanation, an average catchment scale index is proposed to comment on, and potentially relate, the MDHE occurrences, computing an average RR index for the rain gauge station relevant to the current analysis that is for Forino and Mercato San Severino. The average RR computation is illustrated in Figure 10, along with the histogram of MDHEs recorded within the Solofrana peri-urban basin. RR has been tested for change point detection using the CUMSUM test, similarly to what performed for the lambda parameter (average number of events). The results of the test have been illustrated in Figure 10. A break point is statistically significant (α = 5%), but also evidently visible, for the year 2001. As the average value of RR for the whole period of observation is about 1539 MJ·mm·ha/h/year, the period 1951–2001 is characterized, on average, by 1530 MJ·mm·ha/h/year, whereas the period 2001–2014 is marked by an average value of about 1740 MJ·mm·ha/h/year, about 15% larger than the long term average.

4. Discussion and Conclusions

This paper has reported the results of the investigation of temporal MDHE occurrences for the Solofrana peri-urban basin, located in Southern Italy, a geographical area characterized by a high density in landslides and flood occurrences. Based on the collection of MDHEs that affected the studied area, the frequency of occurrence of severe geomorphological events appears to have increased during the last decade. A statistical analysis actually confirms that while the average temporal distance between occurrences is about three years over the whole investigated period, 1951–2014, the average temporal distance has significantly decreased, to about 1.5 years, during the period between 2000 and 2014.
A first limitation of the study is the absence of a streamflow measurement database. Consequently, the hydro-geological hazard temporal evolution within the Solofrana catchment has been mainly investigated with reference to combined climate indices, describing the effect of rain drop and surface runoff rainfall erosivity power. The poor quality and consistency of historical data, especially for what concerns the hourly and sub-hourly observations is, furthermore, a limitation. In the context of data scarcity, the description and modelling of the physical processes related to MDHE occurrences have to be replaced, necessarily, by less sophisticated and empirical approaches, and this is reflected in the choice of the method for the rainfall-runoff erosivity assessment.
Clearly, the mentioned limitations can also be seen as a strength, as the data availability and quality is a major and common problem in many different geographical contexts and the illustrated application could help manage hydro-geological risks in poorly-gauged basins. Despite all of the mentioned critical points, the proposed methodology appears to reasonably explain the empirical evidence. The rainfall-runoff RR catchment scale index, which integrates different aggregation time scale precipitation data or proxy, such as monthly, maximum daily, and maximum hourly precipitation, has been found to also be a non-stationary process, for which the average value during the period 2001–2014 is about 15% larger than the long term average. The simultaneous significant (CUMSUM test) increase of the RR index and significant (CUMSUM test) reduction of the average temporal distance, poses a rather interesting relationship between climate evolution and hydro-geological hazard evolution, at least for the studied catchment. Applications to different case studies could further validate the potential of the proposed approach to detect the attitude of a particular territory to a temporal evolution of severe geomorphological events.
The hydro-geological hazard is a very complex problem and, besides climate conditions, depends, of course, on different dynamic processes and phenomena, such as the specific land use properties and the environmental policies adopted for the studied territory. They are all interrelated and changes in one of them propagate through the remaining, generating changes in the rainfall-runoff response at the catchment scale and, thus, changes in the hydro-geological hazards. The distinction between the effects that each of them exerts is still a challenging point for researchers and the inclusion of the broad spectrum of environmental changes in the definition of environmental policies and planning strategies is far from the current situation in the studied area, because of obvious difficulties. The results of the presented application show however that methodologies based on stationary scenarios are no longer reliable. They should be replaced by even simple methods, such as the one proposed, accounting at least for climate evolution, to focus on areas where planned hazard mitigation strategies need do adapt to changing environmental conditions, in the medium-long temporal horizon.

Acknowledgments

The authors gratefully acknowledge funding support provided through the Instruction, University and Research Italian Ministry (MIUR) under the Grants ORSA149974 and ORSA154528. Authors thank all the anonymous reviewers for their comments, which resulted in a significant improvement of the manuscript.

Author Contributions

Antonia Longobardi and Nazzareno Diodato conceived and designed the experiments; Mirka Mobilia performed the experiments; Antonia Longobardi and Mirka Mobilia analyzed the data; all the authors contributed to write the paper.

Conflicts of Interest

The authors declare no conflict of interest.

References

  1. Nicholls, N.; Alexander, L. Has the climate become more variable or extreme? Progress 1992–2006. Prog. Phys. Geog. 2007, 31, 77–87. [Google Scholar]
  2. Sugiyama, M.; Shiogama, H.; Emori, S. Precipitation extreme changes exceeding moisture content increases in MIROC and IPCC climate models. Proc. Natl. Acad. Sci. USA 2010, 107, 571–575. [Google Scholar] [CrossRef] [PubMed]
  3. Easterling, D.R.; Evans, J.L.; Groisman, P.Y.; Karl, T.R.; Kunkel, K.E.; Ambenje, P. Observed variability and trends in extreme climate events: A brief review. Bull. Am. Meteorol. Soc. 2000, 81, 417–425. [Google Scholar] [CrossRef]
  4. Nunes, J.P.; Nearing, N. Modelling impacts of climatic change: Case studies using the new generation of erosion models. In Handbook of Erosion Modelling; Morgan, R.P.C., Nearing, M.A., Eds.; John Wiley & Sons Ltd.: Chichester, UK, 2011; pp. 289–312. [Google Scholar]
  5. Diodato, N.; Bellocchi, G.; Romano, N.; Guadagno, F.M. Modelling the Rainfall Erosivity of the Rhone Region Associated with Climate Variability and Storminess. Adv. Meteorol. 2016, 2016, 1–9. [Google Scholar] [CrossRef]
  6. Aich, V.; Kone, B.; Hattermann, F.; Paton, E.N. Time Series Analysis of Floods across the Niger River Basin. Water 2016, 8, 165–183. [Google Scholar] [CrossRef]
  7. Petrucci, O.; Polemio, M. The use of historical data for the characterization of multiple damaging hydrogeological events. Nat. Hazards Earth Syst. Sci. 2003, 3, 17–30. [Google Scholar] [CrossRef]
  8. Elmer, F.; Hoymann, J.; Duthmann, D. Drivers of flood risk change in residential areas. Nat. Hazards Earth Syst. Sci. 2012, 12, 1641–1657. [Google Scholar] [CrossRef]
  9. Petrucci, O.; Pasqua, A.A.; Polemio, M. Impact of Damaging Geo-Hydrological Events and Population Development in Calabria, Southern Italy. Water 2013, 5, 1780–1796. [Google Scholar] [CrossRef]
  10. Diodato, N. Modelling net erosion responses to enviroclimatic changes recorded upon multisecular timescales. Geomorphology 2006, 80, 164–177. [Google Scholar] [CrossRef]
  11. Diodato, N.; Bellocchi, G. Storminess and environmental changes in the Mediterranean Central Area. Earth Interact. 2010, 14, 1–16. [Google Scholar] [CrossRef]
  12. Verstraeten, G.; Poesen, J.; Demarée, G.; Salles, G. Long-term (105 years) variability in rain erosivity as derived from 10-min rainfall depth data for Ukkel (Brussels, Belgium): Implications for assessing soil erosion rates. J. Geophys. Res. Atmos. 2006, 111, D22109. [Google Scholar] [CrossRef]
  13. Pradhan, B.; Chaudhari, A.; Adinarayana, J.; Buchroithner, M.F. Soil erosion assessment and its correlation with landslide events using remote sensing data and GIS: A case study at Penang Island, Malaysia. Environ. Monit. Assess. 2012, 184, 715–727. [Google Scholar] [CrossRef] [PubMed]
  14. Wischmeier, W.H.; Smith, D.D. Predicting Rainfall Erosion Losses: A Guide to Conservation Planning; Agriculture Handbook No. 537; U.S. Government Printing Office: Washington, DC, USA, 1978.
  15. Auerswald, K.; Fiener, P.; Dikau, R. Rates of sheet and rill erosion in Germany—A meta-analysis. Geomorphology 2009, 111, 182–193. [Google Scholar] [CrossRef]
  16. Foster, G.R.; Meyer, L.D.; Onstad, C.A. A runoff erosivity factor and variable slope length exponent for soil loss estimates. Trans. ASAE 1977, 20, 683–687. [Google Scholar] [CrossRef]
  17. Hrissanthou, V.; Piliotis, A. Estimation of sediment inflow into a reservoir under construction. In Proceedings of the 6th Conference of the Greek Hydrotechnical Union, Thessaloniki, Greece, 11–12 September 1995; pp. 355–362.
  18. Diodato, N.; Soriano, M. Rainfalls and Storm Erosivity. In Storminess and Environmental Change; Diodato, N., Bellocchi, G., Eds.; Springer: Dordrecht, The Netherlands, 2014; pp. 39–51. [Google Scholar]
  19. Intergovernmental Panel on Climate Change (IPCC). Climate Change 2014: Synthesis Report. Contribution of Working Groups I, II and III to the Fifth Assessment Report of the Intergovernmental Panel on Climate Change; IPCC: Geneva, Switzerland, 2014; p. 151. [Google Scholar]
  20. Rojas, R.; Feyen, L.; Watkiss, P. Climate change and river floods in the European Union: Socio-economic consequences and the costs and benefits of adaptation. Glob. Environ. Chang. 2013, 23, 1737–1751. [Google Scholar] [CrossRef]
  21. Caloiero, T.; Pasqua, A.A.; Petrucci, O. Damaging Hydrogeological Events: A Procedure for the Assessment of Severity Levels and an Application to Calabria (Southern Italy). Water 2014, 6, 3652–3670. [Google Scholar] [CrossRef]
  22. Panagos, P.; Ballabio, C.; Borrelli, P.; Meusburger, K.; Klik, A.; Rousseva, S.; Tadić, M.P.; Michaelides, S.; Hrabalíková, M.; Olsen, P.; et al. Rainfall erosivity in Europe. Sci. Total Environ. 2015, 511, 801–814. [Google Scholar] [CrossRef] [PubMed]
  23. Alpert, P.; Ben-Gai, T.; Baharad, A.; Benjamini, Y.; Yekutieli, D.; Colacino, M.; Diodato, L.; Ramis, C.; Homar, V.; Romero, R.; et al. The paradoxical increase of Mediterranean extreme daily rainfall in spite of decrease in total values. Geophys. Res. Lett. 2002, 29, 1–31. [Google Scholar] [CrossRef]
  24. Diodato, N.; Bellocchi, G.; Fiorillo, F.; Longobardi, A. Historical reconstruction of erosive storms driving damaging hydrological events in Southern Italy (Bonea basin). In Storminess and Environmental Changes; Diodato, N., Bellocchi, G., Eds.; Springer: Dordrecht, The Netherlands, 2014; pp. 179–192. [Google Scholar]
  25. Salvati, P.; Bianchi, C.; Rossi, M.; Guzzetti, F. Societal landslide and flood risk in Italy. Nat. Hazards Earth Syst. Sci. 2010, 10, 465–483. [Google Scholar] [CrossRef]
  26. Mobilia, M.; Califano, F.; Longobardi, A. Analysis of Rainfall Events driving MDHEs Occurred in the Solofrana River Basin, Southern Italy. Procedia Eng. 2015, 119, 1139–1146. [Google Scholar] [CrossRef]
  27. Califano, F.; Mobilia, M.; Longobardi, A. Heavy Rainfall Temporal Characterization in the Peri-Urban Solofrana River Basin, Southern Italy. Procedia Eng. 2015, 119, 1129–1138. [Google Scholar] [CrossRef]
  28. De Pippo, T.; Donadio, C.; Guida, M.; Petrosino, C. The case of Sarno River (Southern Italy): Effects of geomorphology on the environmental impacts. Environ. Sci. Pollut. Res. 2006, 13, 184–191. [Google Scholar] [CrossRef]
  29. Vallario, A. Il Dissesto Idrogeologico in Campania; Cooperativa Universitaria Editrice Napoletana: Napoli, Italy, 2001. (In Italian) [Google Scholar]
  30. Calvello, M.; Papa, M.N.; Pratschke, J.; Crescenzo, M.N. Landslide risk perception: A case study in Southern Italy. Landslides 2016, 13, 349–360. [Google Scholar] [CrossRef]
  31. Longobardi, A.; Villani, P. Trend analysis of annual and seasonal rainfall time series in the Mediterranean area. Int. J. Climatol. 2010, 30, 1538–1546. [Google Scholar] [CrossRef]
  32. Longobardi, A.; Buttafuoco, G.; Caloiero, T.; Coscarelli, R. Spatial and temporal distribution of precipitation in a Mediterranean area (southern Italy). Environ. Earth Sci. 2016, 75, 1–20. [Google Scholar] [CrossRef]
  33. Pelosi, A.; Furcolo, P. An Amplification Model for the Regional Estimation of Extreme Rainfall within Orographic Areas in Campania Region (Italy). Water 2015, 7, 6877–6891. [Google Scholar] [CrossRef]
  34. Furcolo, P.; Pelosi, A.; Rossi, F. Statistical identification of orographic effects in the regional analysis of extreme rainfall. Hydrol. Process. 2016, 30, 1342–1353. [Google Scholar] [CrossRef]
  35. Bardossy, A.; Pegram, G. Infilling missing precipitation records—A comparison of a new copula-based method with other techniques. J. Hydrol. 2014, 519, 1162–1170. [Google Scholar] [CrossRef]
  36. Diodato, N.; Bellocchi, G.; Romano, N. Climate Control on Net Erosion Responses in a Mediterranean Landscape: The Alento River Basin; Technical Note N.10; Met European Research Observatory: Benevento, Italy, 2016; p. 25. [Google Scholar]
  37. Diodato, N.; Aronica, G. Finding Simplicity in Storm Erosivity Modelling. In Storminess and Environmental Change; Diodato, N., Bellocchi, G., Eds.; Springer: Dordrecht, The Netherlands, 2014; pp. 53–64. [Google Scholar]
  38. Diodato, N. Estimating RUSLE’s rainfall factor in the part of Italy with a Mediterranean rainfall regime. Hydrol. Earth Syst. Sci. 2004, 8, 103–107. [Google Scholar] [CrossRef]
  39. Longobardi, A.; Khaertdinova, E. Relating soil moisture and air temperature to evapotranspiration fluxes during inter-storm periods at a Mediterranean experimental site. J. Arid Land 2015, 7, 27–36. [Google Scholar] [CrossRef]
  40. Buishand, T.A. Some methods for testing the homogeneity of rainfall records. J. Hydrol. 1982, 58, 11–27. [Google Scholar] [CrossRef]
  41. Mehta, A.V.; Yang, S. Precipitation climatology over Mediterranean Basin from ten years of TRMM measurements. Adv. Geosci. 2008, 17, 87–91. [Google Scholar] [CrossRef]
  42. Reale, M.; Lionello, P. Synoptic climatology of winter intense precipitation events along the Mediterranean coasts. Nat. Hazards Earth Syst. Sci. 2013, 13, 1707–1722. [Google Scholar] [CrossRef]
  43. Lionello, P.; Giorgi, F. Winter precipitation and cyclones in the Mediterranean region: Future climate scenarios in a regional simulation. Adv. Geosci. 2007, 12, 153–158. [Google Scholar] [CrossRef]
Figure 1. Study area and historical rain gauge network. The Solofrana river basin is represented as a black continuous line. The endorheic area is represented as a black dashed line. Municipalities urban area located within the study area are indicated by grey polygons. Among these, red polygons indicate the municipalities’ urban area affected by MDHEs reported in Table 1.
Water 08 00398 g001
Figure 2. Documentary photos. Reproduced with permission from Mobilia, M.; Califano, F.; Longobardi, A. Analysis of rainfall events driving MDHEs occurred in the Solofrana river basin, Southern Italy. Procedia Engineering. 2015 [26].
Water 08 00398 g002
Figure 3. Average monthly precipitation for the rain gauge network located in the area of the Solofrana river basin. In red, the average monthly pattern for the same area (continuous) and 95% prediction lower and upper bounds (dashed).
Water 08 00398 g003
Figure 4. (a) and (b) mean monthly and mean maximum daily precipitation for Forino rain gauge; (c) and (d) mean monthly and mean maximum daily precipitation for Mercato San Severino rain gauge. In red and blue are the average monthly pattern computed on the basis of observed and infilled data, respectively.
Water 08 00398 g004
Figure 5. (a) Percentage of occurred MDHEs distinguished by event type (F, L, F/L) for each of the affected municipality; (b) Percentage of MDHEs simultaneously affecting a variable number of municipalities.
Water 08 00398 g005
Figure 6. Monthly distribution of the percentage of occurred MDHE in the Solofrana river basin, compared to the monthly pattern of mean maximum daily rainfall.
Water 08 00398 g006
Figure 7. Monthly distribution of percentage of occurred MDHEs distinguished by event type (F, L, F/L), compared to the monthly pattern of mean maximum daily rainfall and average soil moisture content.
Water 08 00398 g007
Figure 8. Occurred MDHEs, average modelled number of occurred events λ(t), and the change point identification (CUMSUM test).
Water 08 00398 g008
Figure 9. Average value of lambda, before and after the break point in the MDHE occurrences time series, and for the full period of observation.
Water 08 00398 g009
Figure 10. Coevolution of rainfall-runoff erosivity (MJ·mm·ha/h/year) averaged upon the station of Forino and Mercato S Severino (red curve), and the number of municipalities injured (by floods and landslides) per year in the Solofrana river basin (gray histogram). Note the change point in the rainfall-runoff erosivity series occurred in 2001 after the CUMSUM test (green curve).
Water 08 00398 g010
Table 1. MDHE inventory for the Solofrana peri-urban catchment (F = flood, L = landslide, F/L combined flood and landslide).
DateMain StreamLocationsEventSource
26/09/1951SolofranaMontoroFVallario, A. (2001) [29].
22/11/1951SolofranaSolofraLSICI-CNR (GNDCI) Sistema informativo sulle catastrofi idrogeologiche. PROGETTO AVI.
02/11/1951SolofranaSolofraFVallario, A. (2001) [29].
02/11/1951CalvagnolaMercato San SeverinoFVallario, A. (2001) [29].
03/02/1960SolofranaSolofraFSICI-CNR (GNDCI) Sistema informativo sulle catastrofi idrogeologiche. PROGETTO AVI.
03/02/1960SolofranaForinoLSICI-CNR (GNDCI) Sistema informativo sulle catastrofi idrogeologiche. PROGETTO AVI.
18/10/1961SolofranaMontoroFVallario, A. (2001) [29].
07/03/1964SolofranaSolofraFSICI-CNR (GNDCI) Sistema informativo sulle catastrofi idrogeologiche. PROGETTO AVI.
25/10/1966SolofranaMercato San SeverinoFVallario, A. (2001) [29].
29/08/1974SolofranaSolofraFSICI-CNR (GNDCI) Sistema informativo sulle catastrofi idrogeologiche. PROGETTO AVI.
29/08/1974SolofranaMontoroFSICI-CNR (GNDCI) Sistema informativo sulle catastrofi idrogeologiche. PROGETTO AVI.
29/08/1974SolofranaForinoLSICI-CNR (GNDCI) Sistema informativo sulle catastrofi idrogeologiche. PROGETTO AVI.
21/10/1981SolofranaMontoro IFSICI-CNR (GNDCI) Sistema informativo sulle catastrofi idrogeologiche. PROGETTO AVI.
21/01/1981SolofranaMontoroFVallario, A. (2001) [29].
18/11/1985SolofranaForinoLSICI-CNR (GNDCI) Sistema informativo sulle catastrofi idrogeologiche. PROGETTO AVI.
14-16/07/1986SolofranaMontoroFVallario, A. (2001) [29].
23/12/1986SolofranaSolofraLVallario, A. (2001) [29].
20/08/1993SolofranaSolofraLProgetto, I. F. F. I. “Inventario dei fenomeni franosi in Italia.” ISPRA—Dipartimento Difesa del Suolo—Servizio Geologico d’Italia (in Italian).
04/03/1995SolofranaSolofraFSICI-CNR (GNDCI) Sistema informativo sulle catastrofi idrogeologiche. PROGETTO AVI.
02/04/1996SolofranaSolofraFSICI-CNR (GNDCI) Sistema informativo sulle catastrofi idrogeologiche. PROGETTO AVI.
01/09/1997SolofranaSolofraFSICI-CNR (GNDCI) Sistema informativo sulle catastrofi idrogeologiche. PROGETTO AVI.
01/12/1997SolofranaForinoLSICI-CNR (GNDCI) Sistema informativo sulle catastrofi idrogeologiche. PROGETTO AVI.
05/05/1998SolofranaMontoroF/ LProgetto, I. F. F. I. “Inventario dei fenomeni franosi in Italia.” ISPRA—Dipartimento Difesa del Suolo—Servizio Geologico d’Italia (in Italian).
21/08/1998SolofranaMontoroFSICI-CNR (GNDCI) Sistema informativo sulle catastrofi idrogeologiche. PROGETTO AVI.
04/11/2000SolofranaSolofraFSICI-CNR (GNDCI) Sistema informativo sulle catastrofi idrogeologiche. PROGETTO AVI.
04/11/2000SolofranaM. S. SeverinoFSICI-CNR (GNDCI) Sistema informativo sulle catastrofi idrogeologiche. PROGETTO AVI.
04/11/2000SolofranaMontoroFSICI-CNR (GNDCI) Sistema informativo sulle catastrofi idrogeologiche. PROGETTO AVI.
04/11/2000SolofranaForinoLSICI-CNR (GNDCI) Sistema informativo sulle catastrofi idrogeologiche. PROGETTO AVI.
09/11/2001SolofranaMontoro (Piano di Montoro, Torchiati)F /LLocal municipalities website
09/11/2001CalvagnolaMercato San SeverinoFLocal municipalities website
28/09/2007SolofranaMontoro (Aterrana)LLocal newspaper website
28/09/2007CalvagnolaMercato San SeverinoFLocal newspaper website
13/09/2008CalvagnolaMercato San SeverinoFLocal municipalities website
05/10/2008CalvagnolaMercato San SeverinoFLocal newspaper website
08/01/2010SolofranaMontoro (Aterrana)LLocal newspaper website
08/01/2010SolofranaSolofra (Turci)LProgetto, I. F. F. I. “Inventario dei fenomeni franosi in Italia.” ISPRA—Dipartimento Difesa del Suolo—Servizio Geologico d’Italia (in Italian).
30–31/07/2010CalvagnolaMercato San SeverinoFLocal newspaper website
06/09/2011SolofranaSolofra (Caposolofra)FNational newspaper website
19/09/2011SolofranaSolofra (Turci)FLocal newspaper website
19/09/2011SolofranaMontoroLPress review
13/09/2012SolofranaMontoro (Misciano, Piano di Montoro)FLocal municipalities website
13/09/2012CalvagnolaMercato San SeverinoFLocal newspaper website
08/10/2013SolofranaSolofra (Sant’ Andrea Apostolo)LLocal newspaper website
01/09/2014SolofranaMontoro (San Pietro, Misciano, Pisana)FLocal newspaper website
01/09/2014SolofranaSolofraF/LProgetto, I. F. F. I. “Inventario dei fenomeni franosi in Italia.” ISPRA—Dipartimento Difesa del Suolo—Servizio Geologico d’Italia (in Italian).
Table 2. Historical rain gauge stations metadata and main precipitation statistics.
StationElevation (m.a.s.l.)Period of Observation# of Records (Years)Mean Annual Precipitation (mm)
Avellino3701920–2014831240
Lauro1921958–1999351128
Nocera Inf.611918–1999701271
Serino (Urciuoli)3511919–2014721345
Baronissi2601964–2014481287
Forino3991920–2014721360
Mercato San Severino1411921–2014771350
Sarno241920–2014791048

