Article

Spatial–Temporal Dynamics of Wetland Vegetation Related to Water Level Fluctuations in Poyang Lake, China

1
Key Laboratory of Watershed Geographic Sciences, Nanjing Institute of Geography and Limnology, Chinese Academy of Sciences, Nanjing 210008, China
2
State Key Laboratory of Lake Science and Environment, Nanjing Institute of Geography and Limnology, Chinese Academy of Sciences, Nanjing 210008, China
*
Author to whom correspondence should be addressed.
Water 2016, 8(9), 397; https://doi.org/10.3390/w8090397
Submission received: 18 May 2016 / Revised: 5 August 2016 / Accepted: 17 August 2016 / Published: 13 September 2016

Abstract

:
Hydrological properties are driving forces of wetland systems. The influence of water level fluctuations on vegetation distribution is of growing interest as wetlands are increasingly disturbed by climate change and intensive human activity. Based on time series MODIS (Moderate Resolution Imaging Spectroradiometer) imagery from 2000 to 2012, we investigated the spatial–temporal dynamics of wetland vegetation in Poyang Lake using a combined Sen’s slope and Mann–Kendall (MK) test approach, and explored their correlations with water level fluctuations in different hydrological periods. The results showed that more than 34% of wetlands at lower elevations of Poyang Lake had experienced an increasing trend in the enhanced vegetation index (EVI), whereas EVI in about 11% of the wetlands at higher elevations decreased significantly. Responses of grassland area extracted from MODIS EVI were found to be more sensitive to water level fluctuations in the southern lakes. The change rate of grassland area decreased with the rising water level during the rising period, but increased with the rising water level during the retreating period. Correlations between grassland area and water level were much weaker in the dry period. In addition, we found fluctuations of the main water body had negligible effect on grassland area since the water level at Xingzi station was below 14 m. These results provide new insights for predicting future changes of wetland vegetation influenced by the ongoing threats from climate change and human activity, and form a foundation for ecosystem management of Poyang Lake.

1. Introduction

As the primary producer of wetlands in the coastal zone and around lakes and reservoirs, wetland vegetation is an internationally important biodiversity resource. Wetlands provide important ecosystem services, such as erosion control, water quality improvement, and fisheries and wildlife habitat protection, while supporting economic activities such as livestock grazing and medicinal plants collection [1,2,3]. Wetland plant communities vary spatially and temporally with interspecific competition [4], microtopography [5], soil [6], climate [7], management [8], and particularly, water regime [9,10,11]. In shallow lakes, water level fluctuations are a decisive element in the water regime, which is determined by water depth and the rate, duration, frequency, amplitude, and timing of flood or draw-down events [12,13]. The condition of fish and wildlife habitat, patterns of biotic succession, species richness, biodiversity, productivity and spatial distribution of wetland plant communities are dependent on water level fluctuations of varying frequency and amplitude [14,15,16]. Therefore, accurate estimation of the spatial–temporal patterns of wetland vegetation and driving forces of water level fluctuations is critical to assist flood control, land use planning, and lake ecological conservation.
As one of the most frequently flooded but also drought-stricken areas in China, the Poyang Lake wetland is famous for its high plant species richness and diversity, and was registered as an internationally important wetland by the United Nations in 1992. Poyang Lake is the largest freshwater lake in China, and the lake water levels depend on both inflow from tributaries and outflow into the Yangtze River. The water levels are significantly affected by the Yangtze River discharge or height [17,18]. Poyang Lake water levels have been declining significantly due to climate change and human activity, and the ecological and environmental conditions have been evolving rapidly over the last decade [19,20,21]. The construction of the Three Gorges Dam (TGD) upstream of the Yangtze River, which began to impound water on 1 June 2003, is likely a causal factor for the decline in Poyang Lake water level [22]. Flow reduction caused by the TGD led to a decrease of the mean water level by 0.94 m at Hukou (outlet of Poyang Lake), 0.74 m at Xingzi in the northern part of the lake, and 0.50 m at Duchang near the lake center [23].
Consequently, the altered hydrology could result in a potential change in wetland vegetation, especially for those species that are sensitive to hydrological variations [24]. If the lake level variation is larger than the ability of the species to colonize the new environments, the distribution area of many plant communities will likely diminish. For instance, hygrophytes growing at the upper edge of the wetland have been seriously degraded and some have been replaced by mesophytes [25]. Phragmites australis located at the interface between land and water has significantly expanded downward and occupied the former habitat of Carex cinerascens, while the bottomland species C. cinerascens has moved into shallow water areas [26]. Moreover, the biomass of the Phragmites community has declined by over one half, and the number of species decreased dramatically from 1994 to 2009 [27]. To stop the drying of the lake and to minimize the impacts on local socioeconomic development and lake wetland functions, there is a proposal to construct a dam (Poyang Lake Projection, PLP) at the lake’s outlet [28,29]. A better understanding of the relationship between vegetation characteristics and the hydrological conditions is urgently needed to determine water level regulation criteria and evaluate the proposed plan for regulation of the lake.
Numerous studies have attempted to relate specific environmental factors and individual plant species for the Poyang Lake wetland community in relatively narrow spatial scales: from a typical belt less than 1 km2 [30,31] to a reserve covering hundreds of km2 [32]. For example, You et al. (2013) examined the morphological response of individual species to extreme soil moisture conditions in a pot experiment [33]. Xu et al. (2013) further noted that species richness and Shannon–Weiner indices of three plant communities were significantly correlated with water table depth and the soil moisture gradient [31]. Zhang et al. (2012) linked the distribution of relative abundance of different communities with the inundation duration gradient [32]. A few scholars have carried out research on the entire Poyang Lake wetland supported by limited (and/or asynchronous) observation data. For example, Zhang et al. (2013) investigated the adaption strategies of the dominant phreatophytes of Carex spp., and Phalaris arundinacea in the Poyang Lake wetland in response to the water depth gradient [34]. Wang et al. (2012) suggested wetland vegetation plant functional types in the Poyang Lake wetland were strongly correlated with different submersion times and flood tolerances [35].
Due to a significant seasonal variation (10 m) in the Poyang Lake water level [36], the growth environment of wetland vegetation changes dramatically. Some important ecosystem functions (e.g., wildlife resources, fisheries, and livestock) of wetland vegetation are altered over a short time frame in response to submersion and re-emergence processes, regardless of whether the plant species in functional groups have completed their life cycles. In addition, the effects of individual water regimes can be difficult to isolate. For instance, the duration of flooding is often correlated with depth: longer durations are a consequence of deeper flooding [37]. Flood frequency is usually closely linked with flood depth and duration [38]. The pattern of wetland vegetation under natural, fluctuating water regimes is a consequence of water level fluctuations by desiccating aquatic plants or inundating terrestrial plants, by modifying oxygen availability in the soil, by accumulating nutrients and toxic substances, and by changing the light climate with depth changes [15,39]. To the best of our knowledge, many linkages between water level variation and vegetation pattern in the Poyang Lake wetland have not been well-documented. Therefore, a major objective of the current study was to relate hydrological processes to wetland vegetation dynamics at wide spatial and temporal scales.

2. Materials and Methods
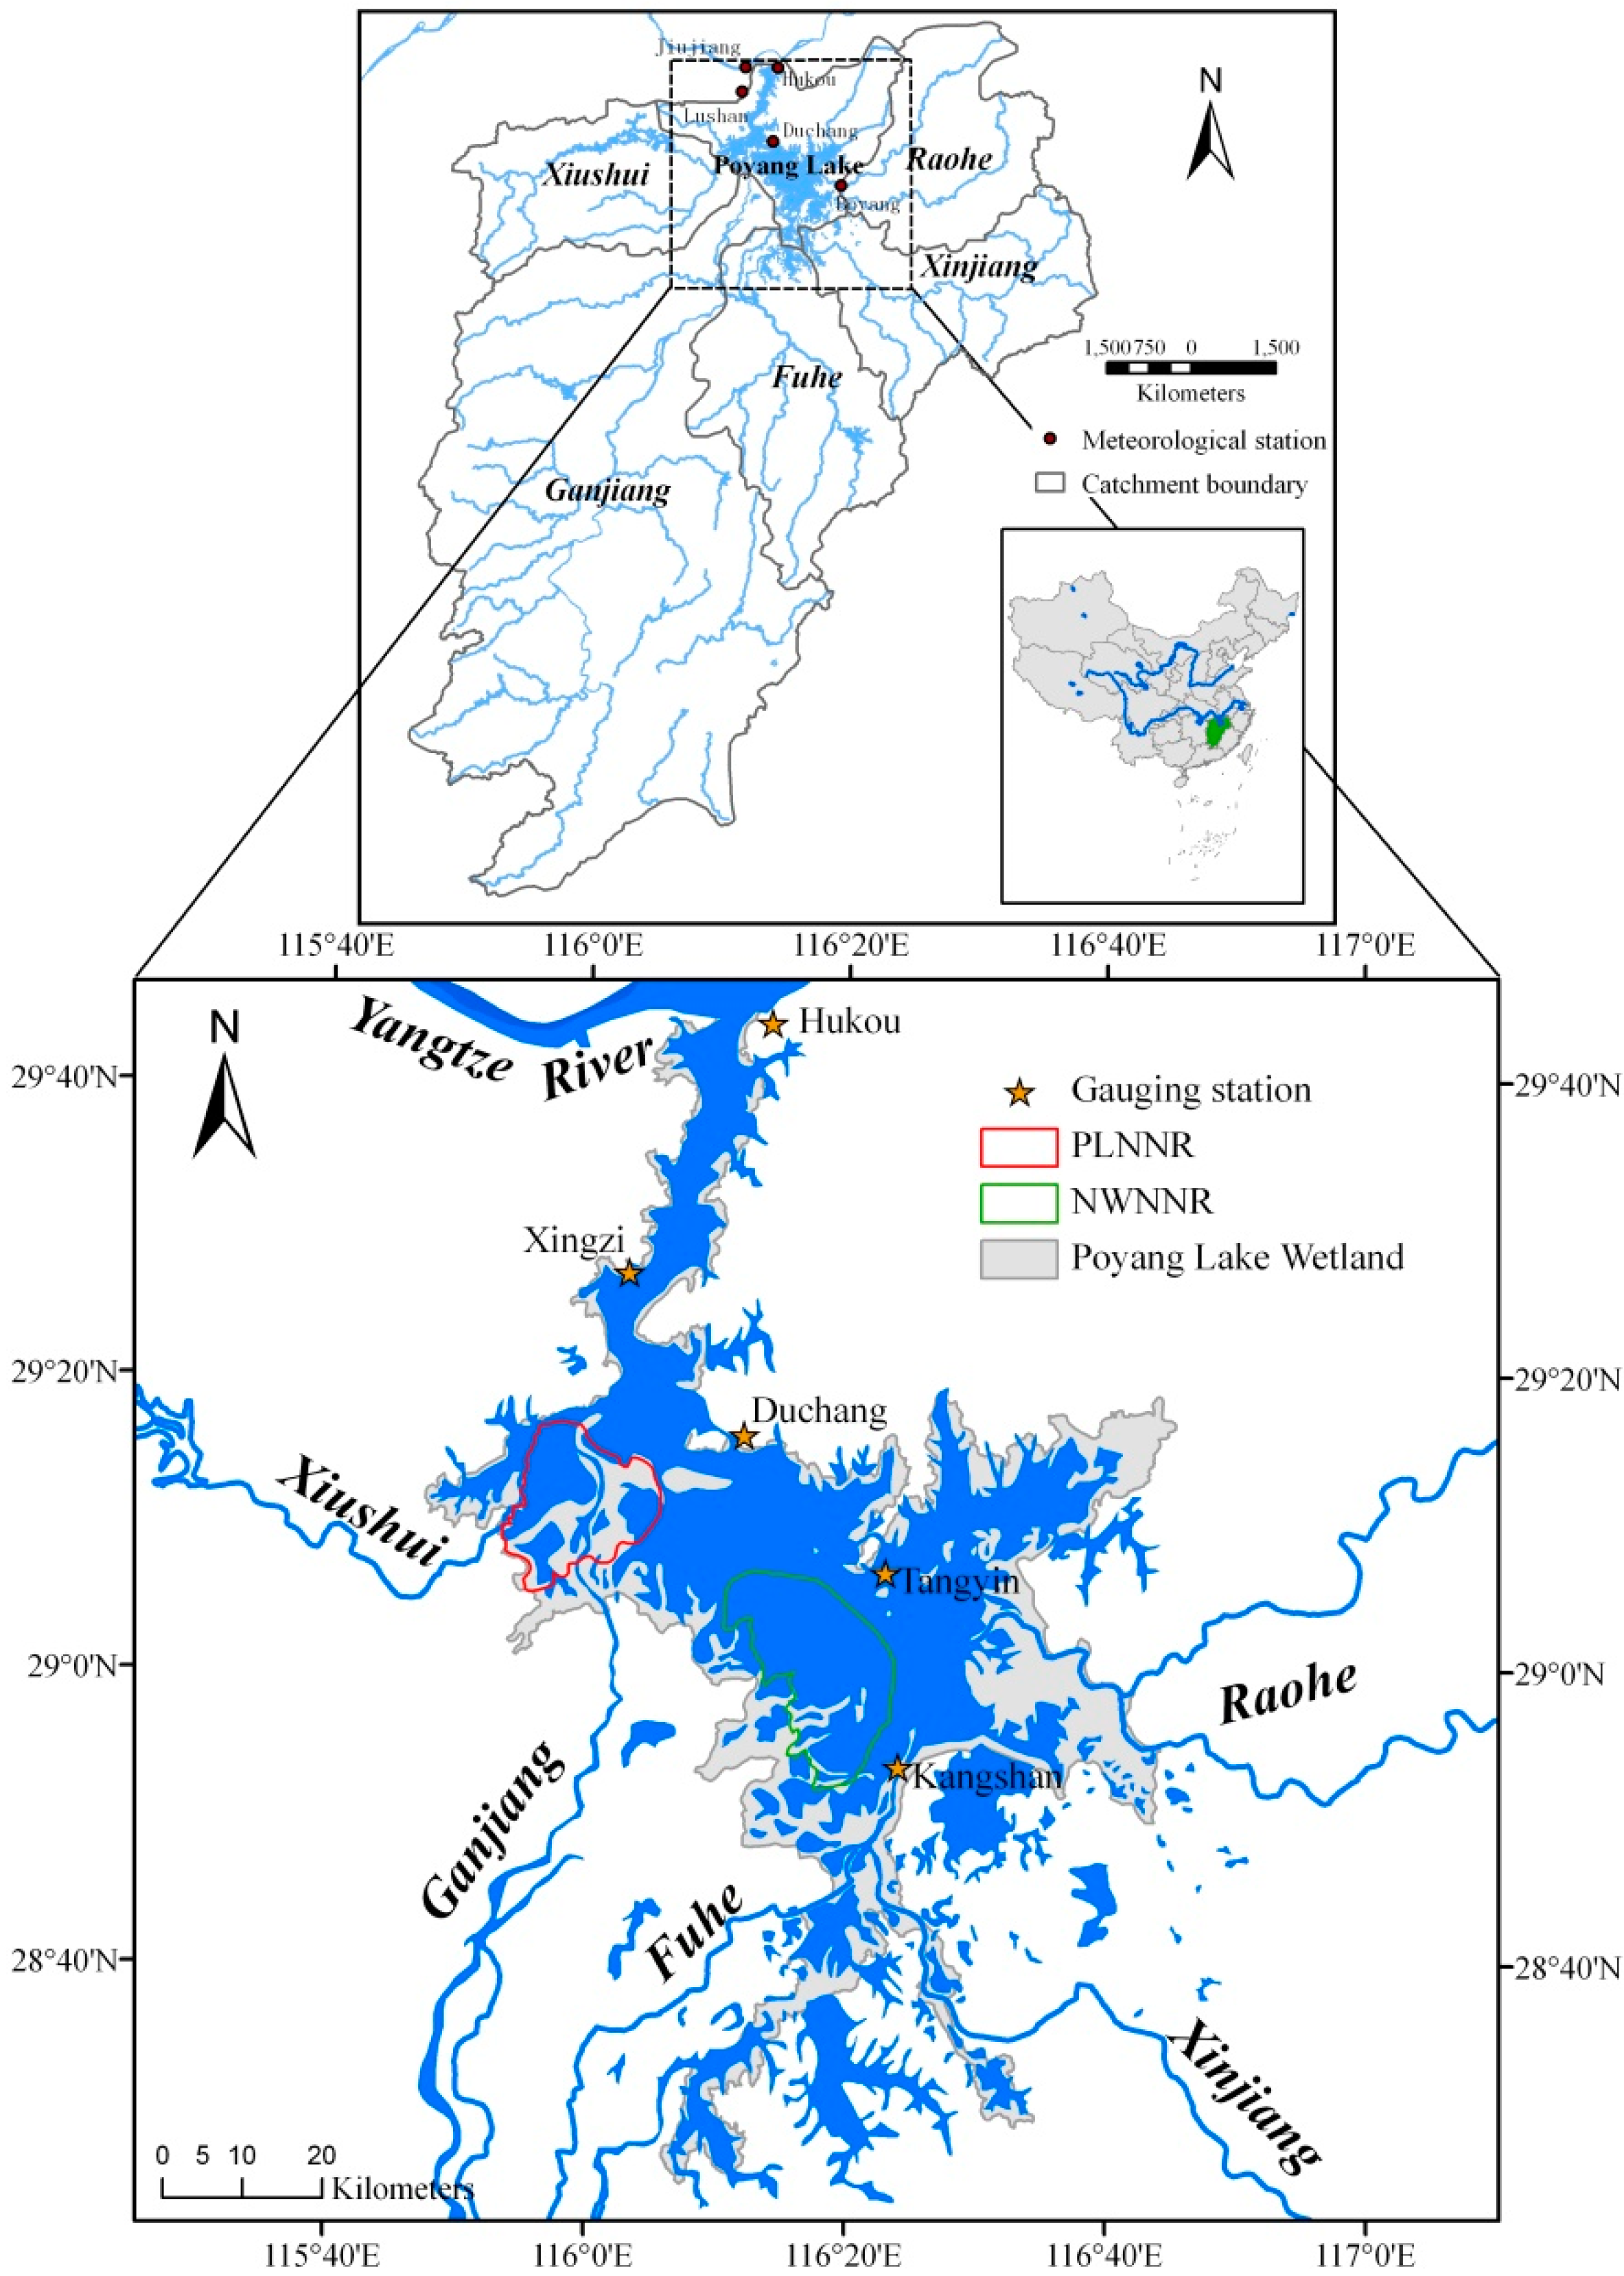
This chapter describes the materials and methods, including study area, remote sensing and hydrological data, and trend test approach.

2.1. Study Area

Located in the northern part of Jiangxi province, Poyang Lake (28°24′–29°46′ N, E 115°49′–116°46′ E) receives inflow from five major rivers (Ganjiang, Fuhe, Xinjiang, Raohe, and Xiushui) in the south and eventually discharges into the main stream of the Yangtze River in the north (Figure 1). Poyang Lake is geometrically complex with tortuous shorelines and incised bottom morphology, which has been shaped by a combination of lacustrine and riverine morphological processes [40]. Based on historical measures of the lake surface during periods with high water levels in combination with recognition of the extensive levee system (in order to separate artificial wetlands from nature wetlands), a study area covering 3124 km2 was determined using GIS (Geographic Information System) techniques.
The seasonality of precipitation (influenced by subtropical monsoons), combined with the smooth relief and other factors, results in significant variations in the Poyang Lake’s inundation area throughout a year [41]. The lake has a maximum area of more than 3000 km2 during the wet season from April to September and shrinks to 1000 km2 to form a narrow meandering channel from October to March [22].
An extensive wetland developed by the dramatic water level fluctuations maintains high plant richness and diversity, and plays an important role in maintaining ecosystem functions. For example, dominant plants, such as Carex spp. (including C. cinerascens, C. argyi, and C. unisexualis, etc.) and its companion species, P. arundinacea, provide an ideal habitat for migratory birds to spawn, rest, feed, and avoid predators. They also supply local residents with fuel, fertilizer, and grass. Phragmites spp., which are typically associated with Triarrhena lutarioriparia and Artemisia selengensis, make up another important community. Phragmites spp. and Triarrhena spp. provide food and habitat for wintering migratory birds, and their height also protects the migratory birds from human interference [42]. Artemisia spp. is the main forage grass with high food and medicinal value.

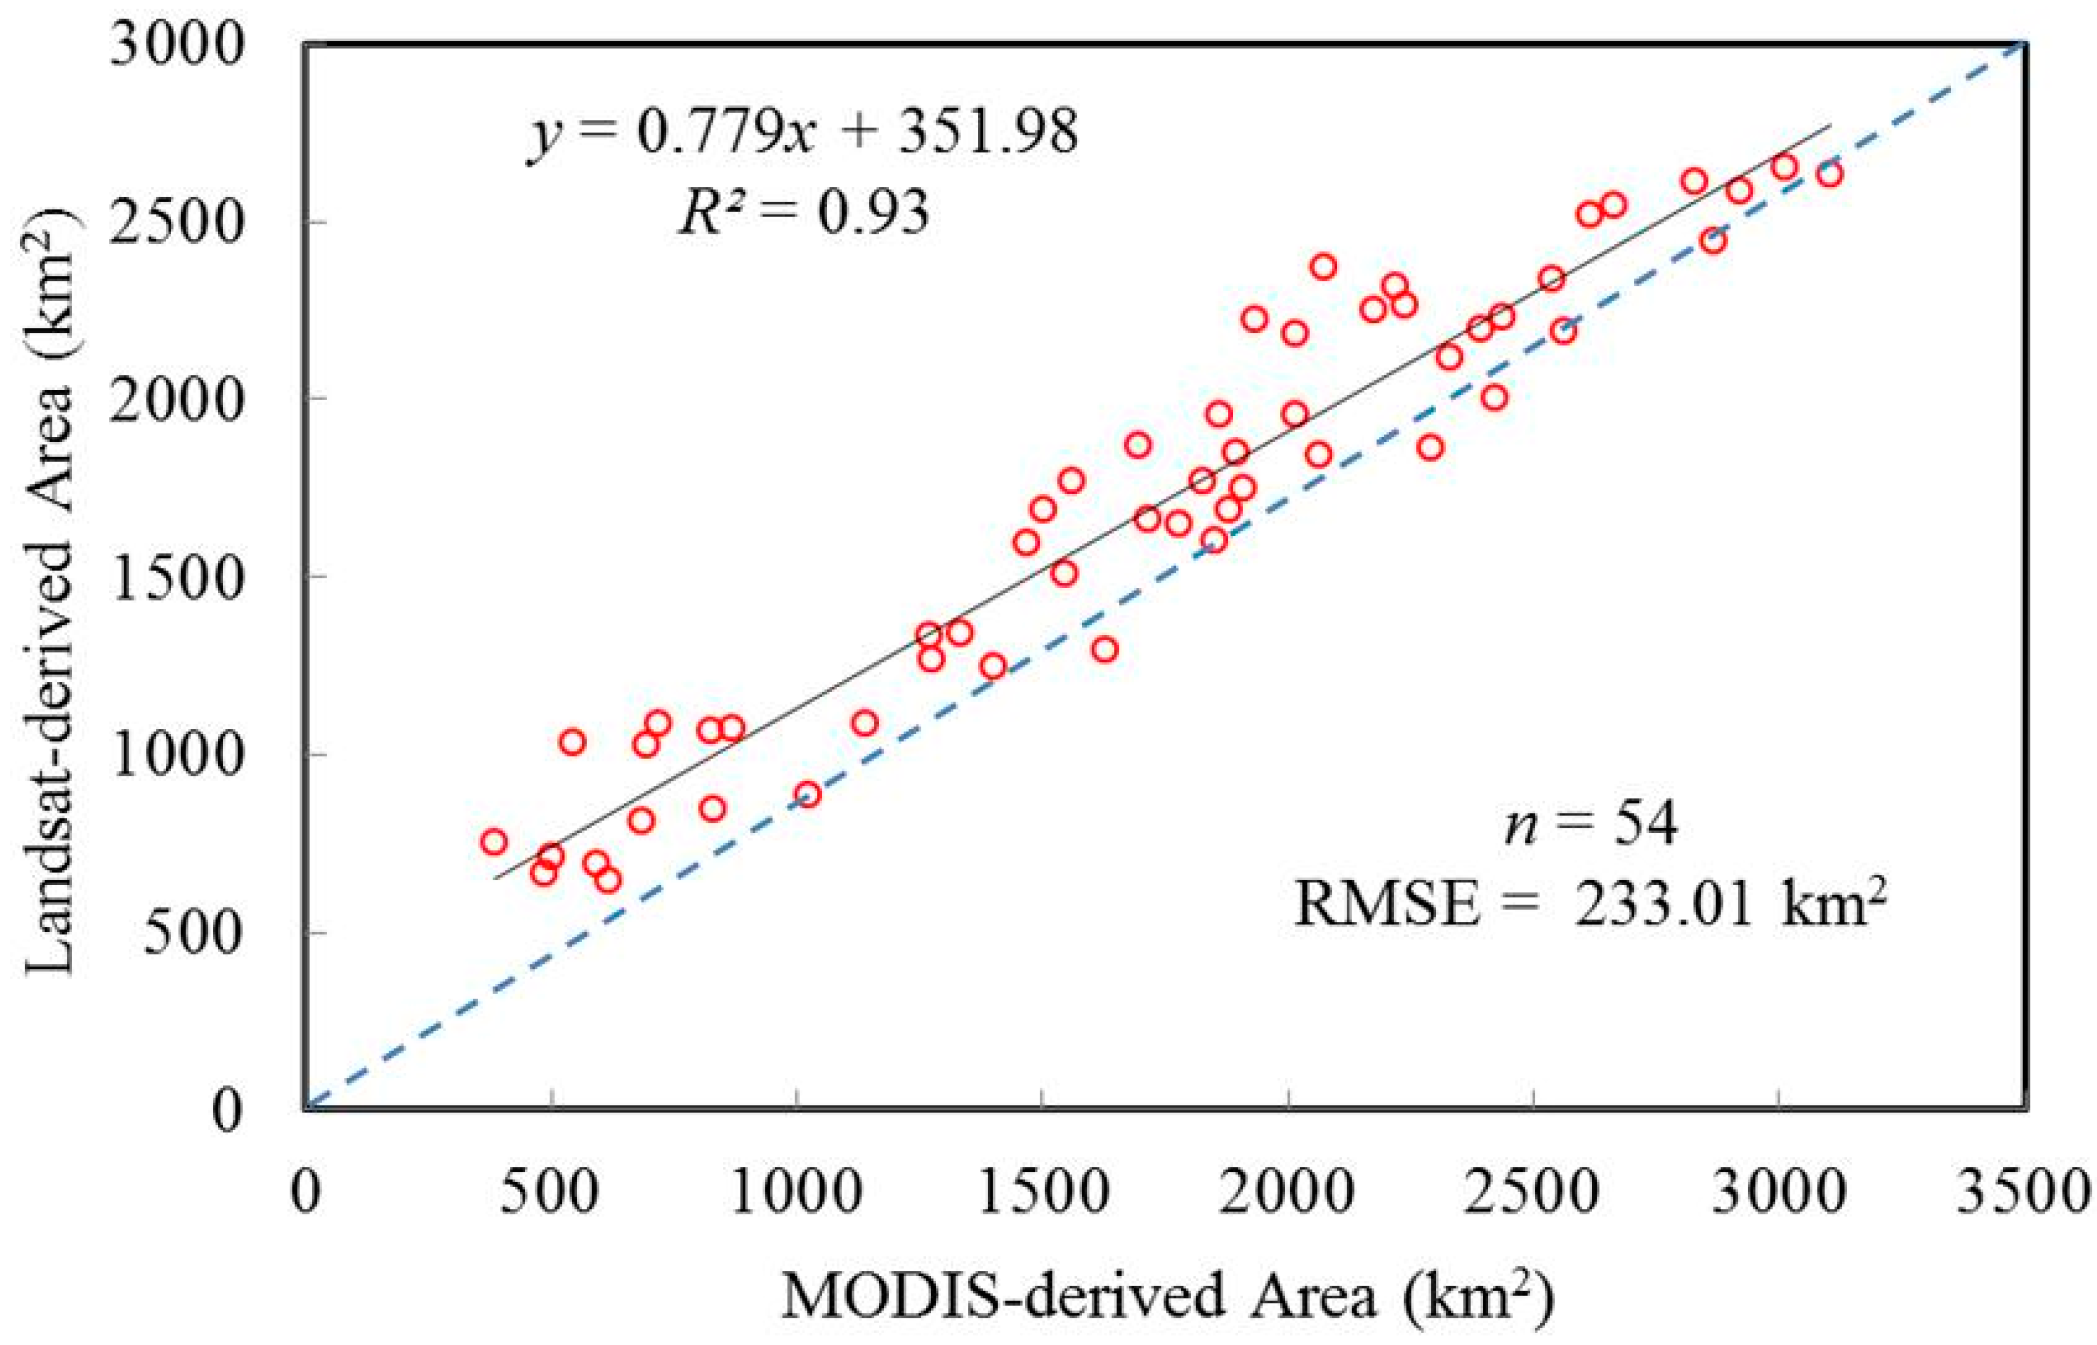
2.2. The Moderate Resolution Imaging Spectroradiometer (MODIS)

Wessels et al. (2004) suggested general land cover patterns (e.g., grassland, deciduous/evergreen forest, and agricultural) could be successfully mapped with MODIS data [43]. In this study, vegetation dynamics of the Poyang Lake wetland were detected with MODIS 250 m imagery (2000–2012). MODIS data from the Terra satellite are collected on a near daily basis and are processed and composited into 16 day values by NASA’s EROS Data Center using 3–5 cloud-free images for each collection interval. The enhanced vegetation index (EVI) data acquired from the Oak Ridge National Laboratory’s Distributed Active Archive Center (DAAC) website are available as georectified and atmospherically corrected Terra MODIS products. These products provide significant refinements in spectral, radiometric, and geometric properties compared to previously available data sets with similar spatial resolution [44]. For example, EVI is less sensitive to soil and atmospheric effects than the widely used normalized difference vegetation index (NDVI) because it incorporates blue spectral wavelengths [45]. As a result, EVI remains sensitive to increases in canopy density beyond where NDVI becomes saturated [46]. Non-rationing vegetation indices, such as the perpendicular vegetation index (PVI) and the green vegetation index (GVI) are generally more linear with less saturation problems, but require external and sensor noise removal in the derivation of surface reflectances that are input to VI computation [47,48]. Current emphasis in the observing system (EOS) era involves operational “external” noise removal through improved calibration, atmospheric correction, cloud and cloud shadow removal, and standardization of sun–surface–sensor geometries with bidirectional reflectance distribution function (BRDF) models. This allows for the introduction of EVI for operational monitoring of Earth’s vegetation. The MODIS EVI is calculated from the following equation:
EVI = 2.5 × R NIR R Red 1 + R NIR + 6 × R Red 7.5 × R Blue ,
where RNIR (near-infrared band: 841–876 nm), RRed (red band: 620–670 nm) and RBlue (blue band: 459–479 nm) are atmospherically corrected or partially atmosphere-corrected (Rayleigh and ozone absorption) surface reflectances; the coefficient “1” accounts for canopy background scattering and the blue and red coefficients, and 6 and 7.5 minimize residual aerosol variations.
In addition, 54 scenes of cloud-free Landsat MSS/TM/ETM+ images (30 m × 30 m2) with the same overpass date were selected to validate the lower-resolution MODIS observations. These data were acquired from the Global Land Cover Facility (GLCF). MSS/TM/ETM+ band 3 (red band) and band 4 (NIR band) were used to delineate the relatively accurate vegetation cover.
In this study, the grasslands were delineated using a thresholding segmentation algorithm, which assumes the EVI images are relatively homogeneous regions that can be separated by selecting the appropriate threshold. An optimal threshold between vegetation and non-vegetation features was determined using the generated EVI histogram. In the same way, grassland area was also obtained from the transformed NDVI, which was extracted from Landsat MSS/TM/ETM+ DN values.

2.3. Water Level Information

Observed daily water levels at four gauging stations (Xingzi, Duchang, Tangyin, and Kangshan) available for the period of 2000–2012 were acquired from the Hydrological Bureau of Jiangxi Province and the Hydrological Bureau of the Yangtze River Water Resources Commission. Xingzi station was selected as the most downstream and the closest to the northern part of the lake, and was considered to best reflect the water level fluctuations in the long and narrow watercourse that flows into the Yangtze River mainstream. Duchang and Tangyin stations are expected to reflect the water level fluctuations in the central part of the lake, which is characterized by a broad area with high vegetation coverage (e.g., Poyang Lake National Nature Reserve (PLNNR) and Nanji Wetland National Nature Reserve (NWNNR)). Kangshan station, located at the most upstream end of the lake, was selected because it is expected to respond primarily to catchment runoff in the southern part of Poyang Lake.

2.4. Sen’s Slope Estimator and Mann–Kendall (MK) Test

A combined Sen’s slope and MK test approach was applied to analyze trends in the EVI time series. Sen’s slope involves computing the slopes for all temporally ordered pairs of data points and then calculating the median of these slopes as an estimate of the overall slope. Since Sen’s slope is not greatly affected by outliers or single data errors, and missing values are also allowed, it is more rigorous than the commonly used regression slopes and thus provides a realistic measure of the trends in time series [49,50]. But, this approach cannot test the significance of the time series. The MK test is a non-parametric test and does not require the data to be normally distributed. Meanwhile, the MK test has low sensitivity to abrupt breaks due to non-homogeneous time series [51,52]. Therefore, the MK test was used to determine whether the trend in EVI time series was significant.
First, the slopes of all data value pairs were calculated as:
Q i = x j x k j k
in which xj and xk are pairs of the EVI series, and j and k are serial numbers, j > k. If there are N values xj in the time series we get as many as N = n (n − 1)/2 slope estimates Qi (n is the length of the series, n = 296). Sen’s slope is the median of these N values of Qi. The N values of Qi are ranked from the smallest to the largest and the Sen’s estimator is
Q = { Q ( N + 1 2 ) ,   N   is odd Q ( N 2 ) + Q ( N + 2 2 ) 2 ,   N   is even  
A positive value of Q indicates an increasing trend whereas a negative value indicates a decreasing trend.
Then the MK test statistic is calculated as
S = i = 1 n 1 j = i + 1 n sgn ( x j x i )  
where s g n   ( x j x i ) = { + 1 ,   x j > x i   0 ,   x j = x i 1 ,   x j < x i   and n is the sample size. When   n 10 , the standardized statistics Z for the one-tailed test is formulated as
Z = { S 1 Var ( S ) ,   S > 0 0 ,   S = 0 S + 1 Var ( S ) ,   S < 0  
in which   V a r ( S ) = ( n ( n 1 ) ( 2 n + 5 ) i = 1 n t i ( t i 1 ) ( 2 t i + 5 ) ) / 18 ; n is the sample size, and ti is the number of ties of extent i. In this study, trend free pre-whitening proposed by Yue and Wang (2002) was applied with significant autocorrelation to eliminate the effect of serial correlation [53].
Due to the pre-observation of MODIS between 1 January and 25 February 2000, a total of 296 EVI time-series images (i.e., 23 images/year × 13 years − 3 images = 296 images) were analyzed in this study. In case | Z | Z 1 2 = 1.96 for the trend, the null hypothesis of no trend should be accepted at the 95% significance level. When   | Z | > 1.96 , a positive value of Q connotes a significant “upward trend,” while a negative value of Q indicates a significant “downward trend”.

2.5. Gaussian Regression Model

Spatial distribution patterns of vegetation dynamics were analyzed by the Gaussian regression model. The Gaussian regression model is available for evaluating the normal distribution patterns [54]. The model can be expressed as:
y = c exp [ 1 2 ( x u ) 2 / t 2 ]
where y is the relative abundance (number of pixels) of each classification of vegetation dynamics within each elevation gradient; x is the DEM (digital elevation model) data in this paper, derived from the National Geometrics Centre of China; c is the maximum of abundance; u is the peak of elevation, which appears when y equals to c; and the full width of half maximum (FWHM) is 4t.

3. Results and Discussion

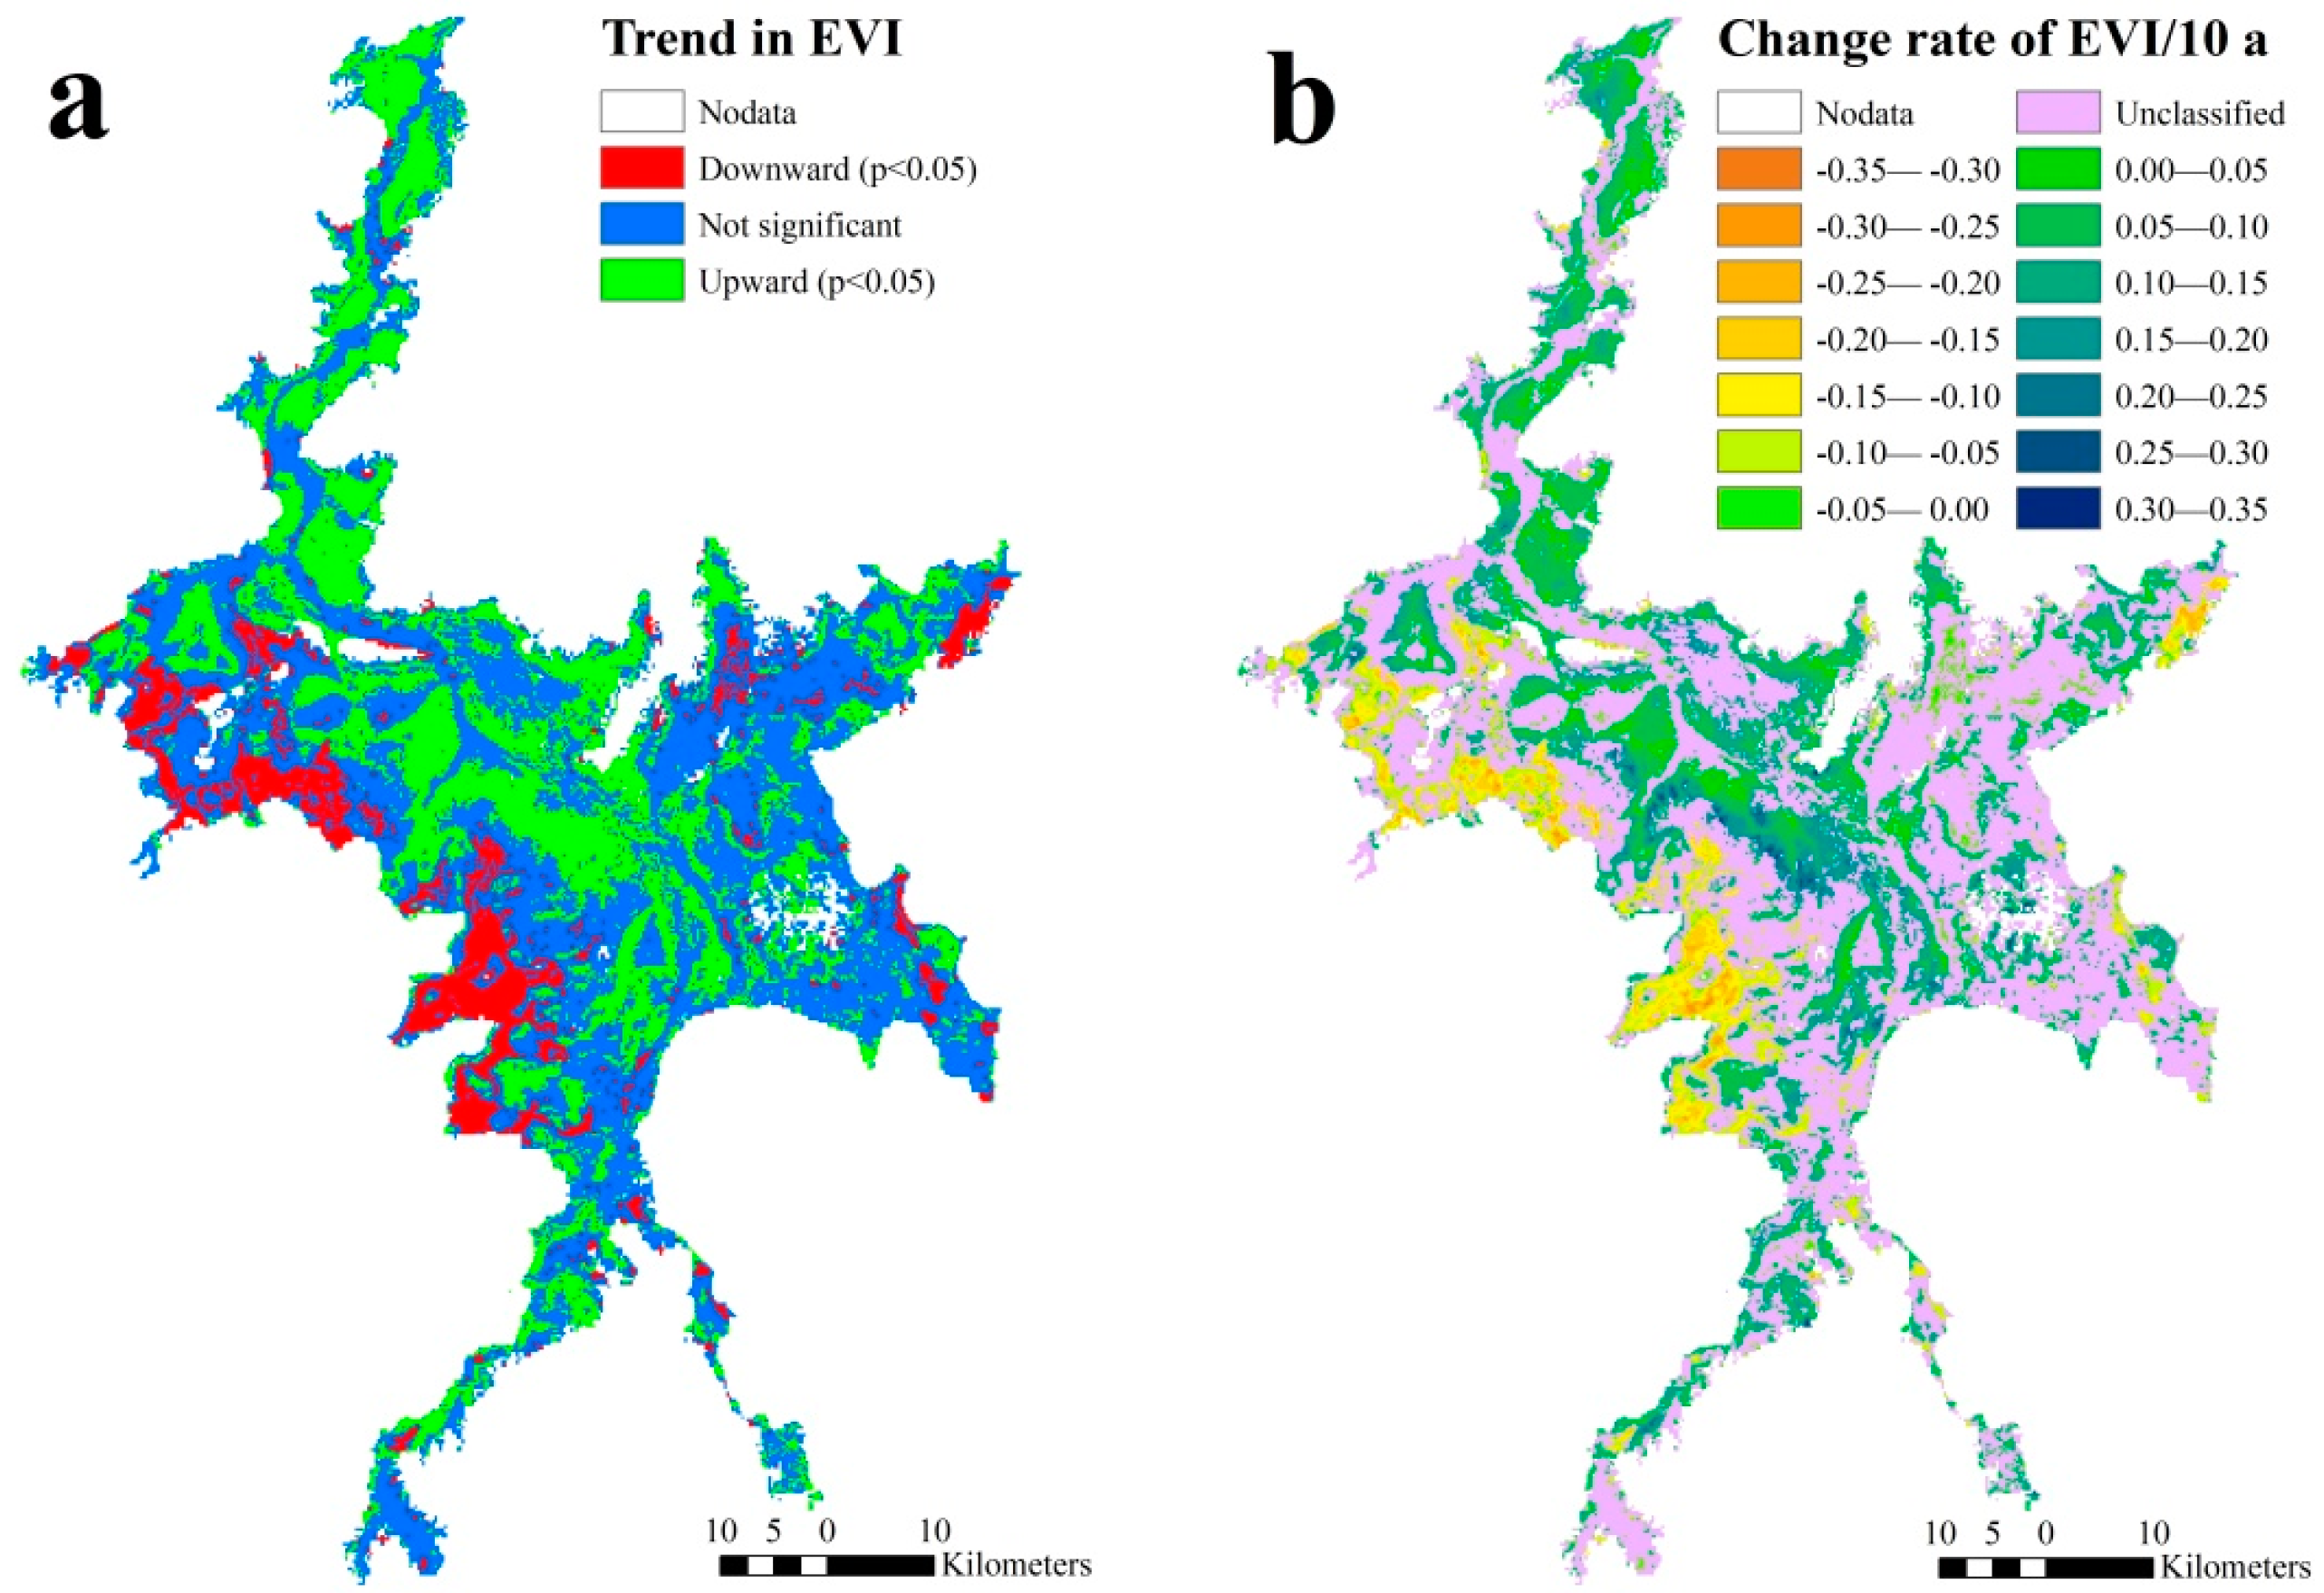
3.1. Spatial and Temporal Variability of EVI

Sen’s slope estimator and the MK test were used to investigate the spatial distribution trend of EVI for each pixel (Figure 2a). Further, the statistically significant trend of the change rate of EVI was estimated by regressing the time series for each pixel; the resulting slope estimate was used as the EVI change rate (Figure 2b). A decrease in EVI time series was observed in about 11% of the wetlands in the study area with an averaged changing rate exceeding −0.0745 every 10 years (p < 0.05). Analyzed by a Gaussian regression model, significant downward trends in EVI were mainly found at 12.5–15.3 m elevation in the upper wetlands of the PLNNR and NWNNR (Table 1). In addition, more than 34% of the wetlands in Poyang Lake showed a significant increasing trend in EVI, particularly in the bottomlands (elevation between 9.9 m to 12.9 m). Magnitudes of the upward trends ranged between −0.0248 and 0.2716 every 10 years (0.0661 ± 0.0350, p < 0.05).
It has been noted that under a persistent decline in lake water level, the area of the Phragmites community has mainly distributed along levees and on the higher plains of the dish-shaped pit groups, and has been significantly decreased compared to historical evidence. In contrast, the area of the Carex community in the bottomlands has significantly increased [37].
In this section, we first presented the spatial and temporal variability of trends in EVI and their change rates across the whole Poyang Lake wetland. These results strongly support the former studies: the biomass, density and/or greenness of upland vegetation (e.g., Phragmites spp., Triarrhena spp., and Artemisia spp.) declined under drought stress, resulting in a significant downward trend in EVI across these regions. In contrast, positive succession occurred in the bottomlands due to the invasion of hygrophilous plants (e.g., Carex spp. and Phalaris spp.) resulting in a significant upward trend in EVI.
Our assessment indicates that areas with increased EVI were larger than areas with decreased EVI in the Poyang Lake wetland during 2000–2012 (i.e., 1135.80 km2 − 361.44 km2 = 774.36 km2). Instead, the magnitude of the trend in “upward” regions was smaller than the absolute value in “downward” regions. Degradation and succession of vegetation may lead to changes of grassland area, which are significant to the evolution of wetland ecosystems. Differential responses of grassland area within Poyang Lake wetland to the water level fluctuations during typical hydrological periods still remain unclear.

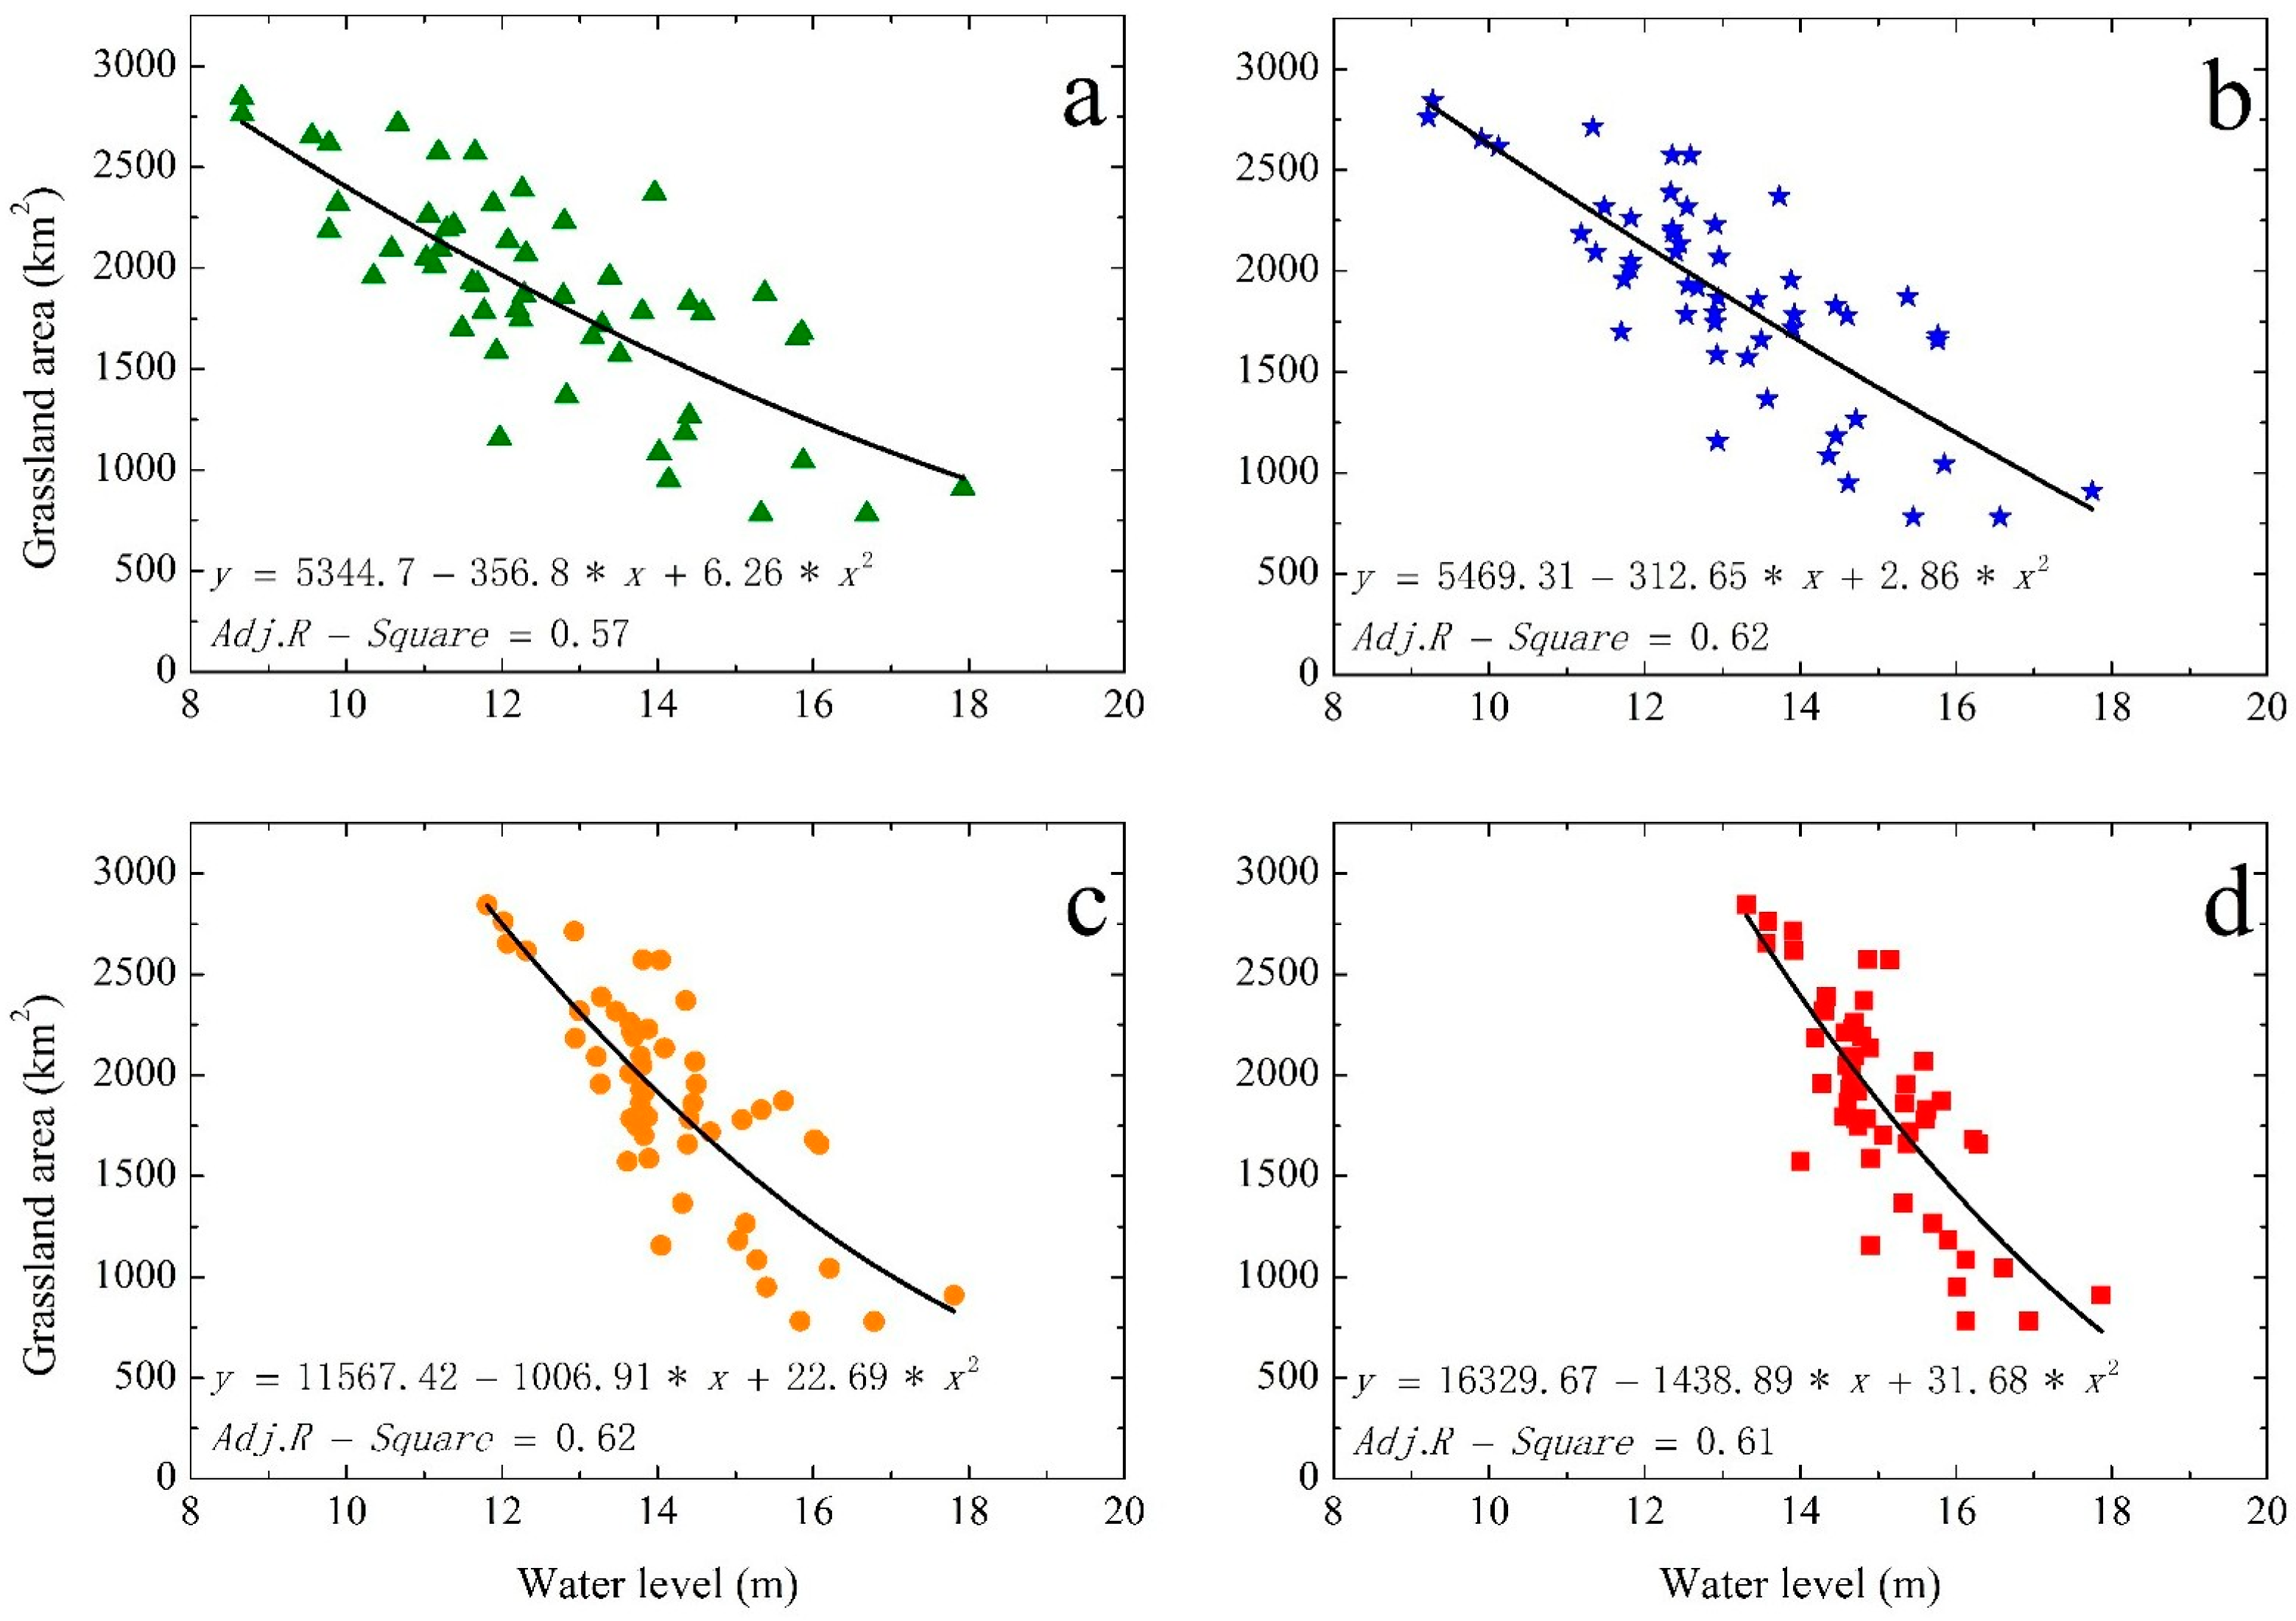
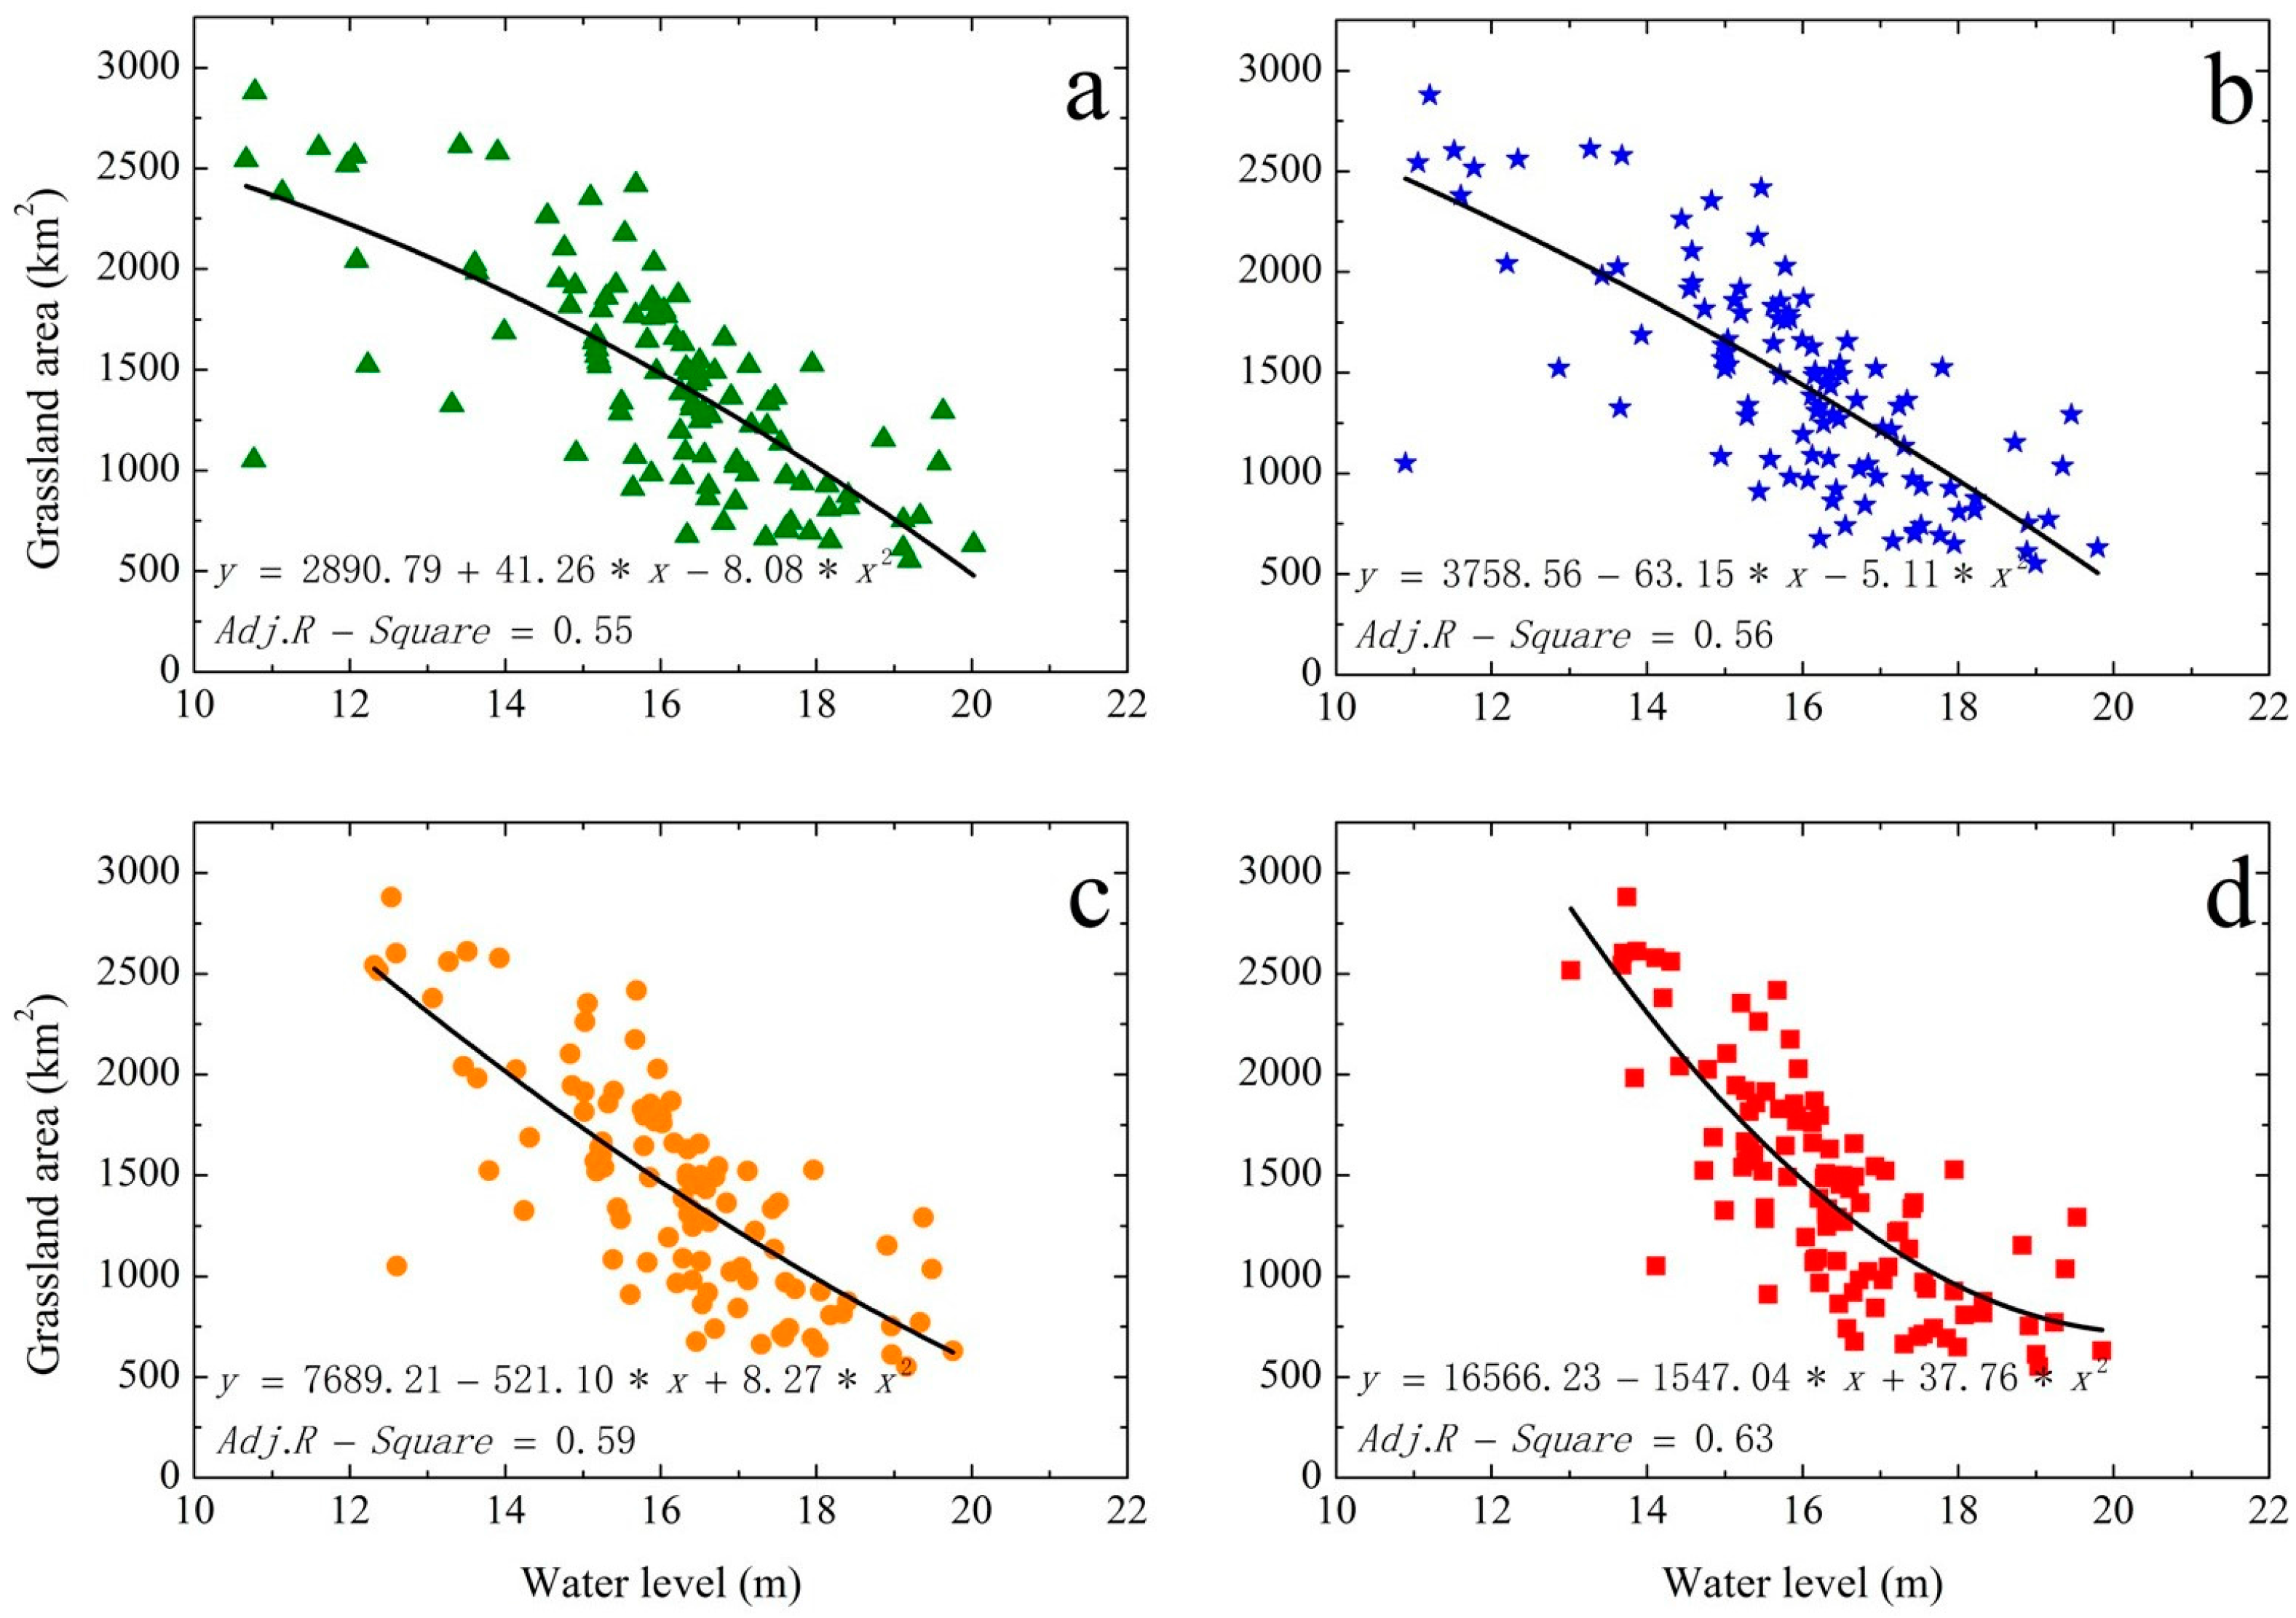
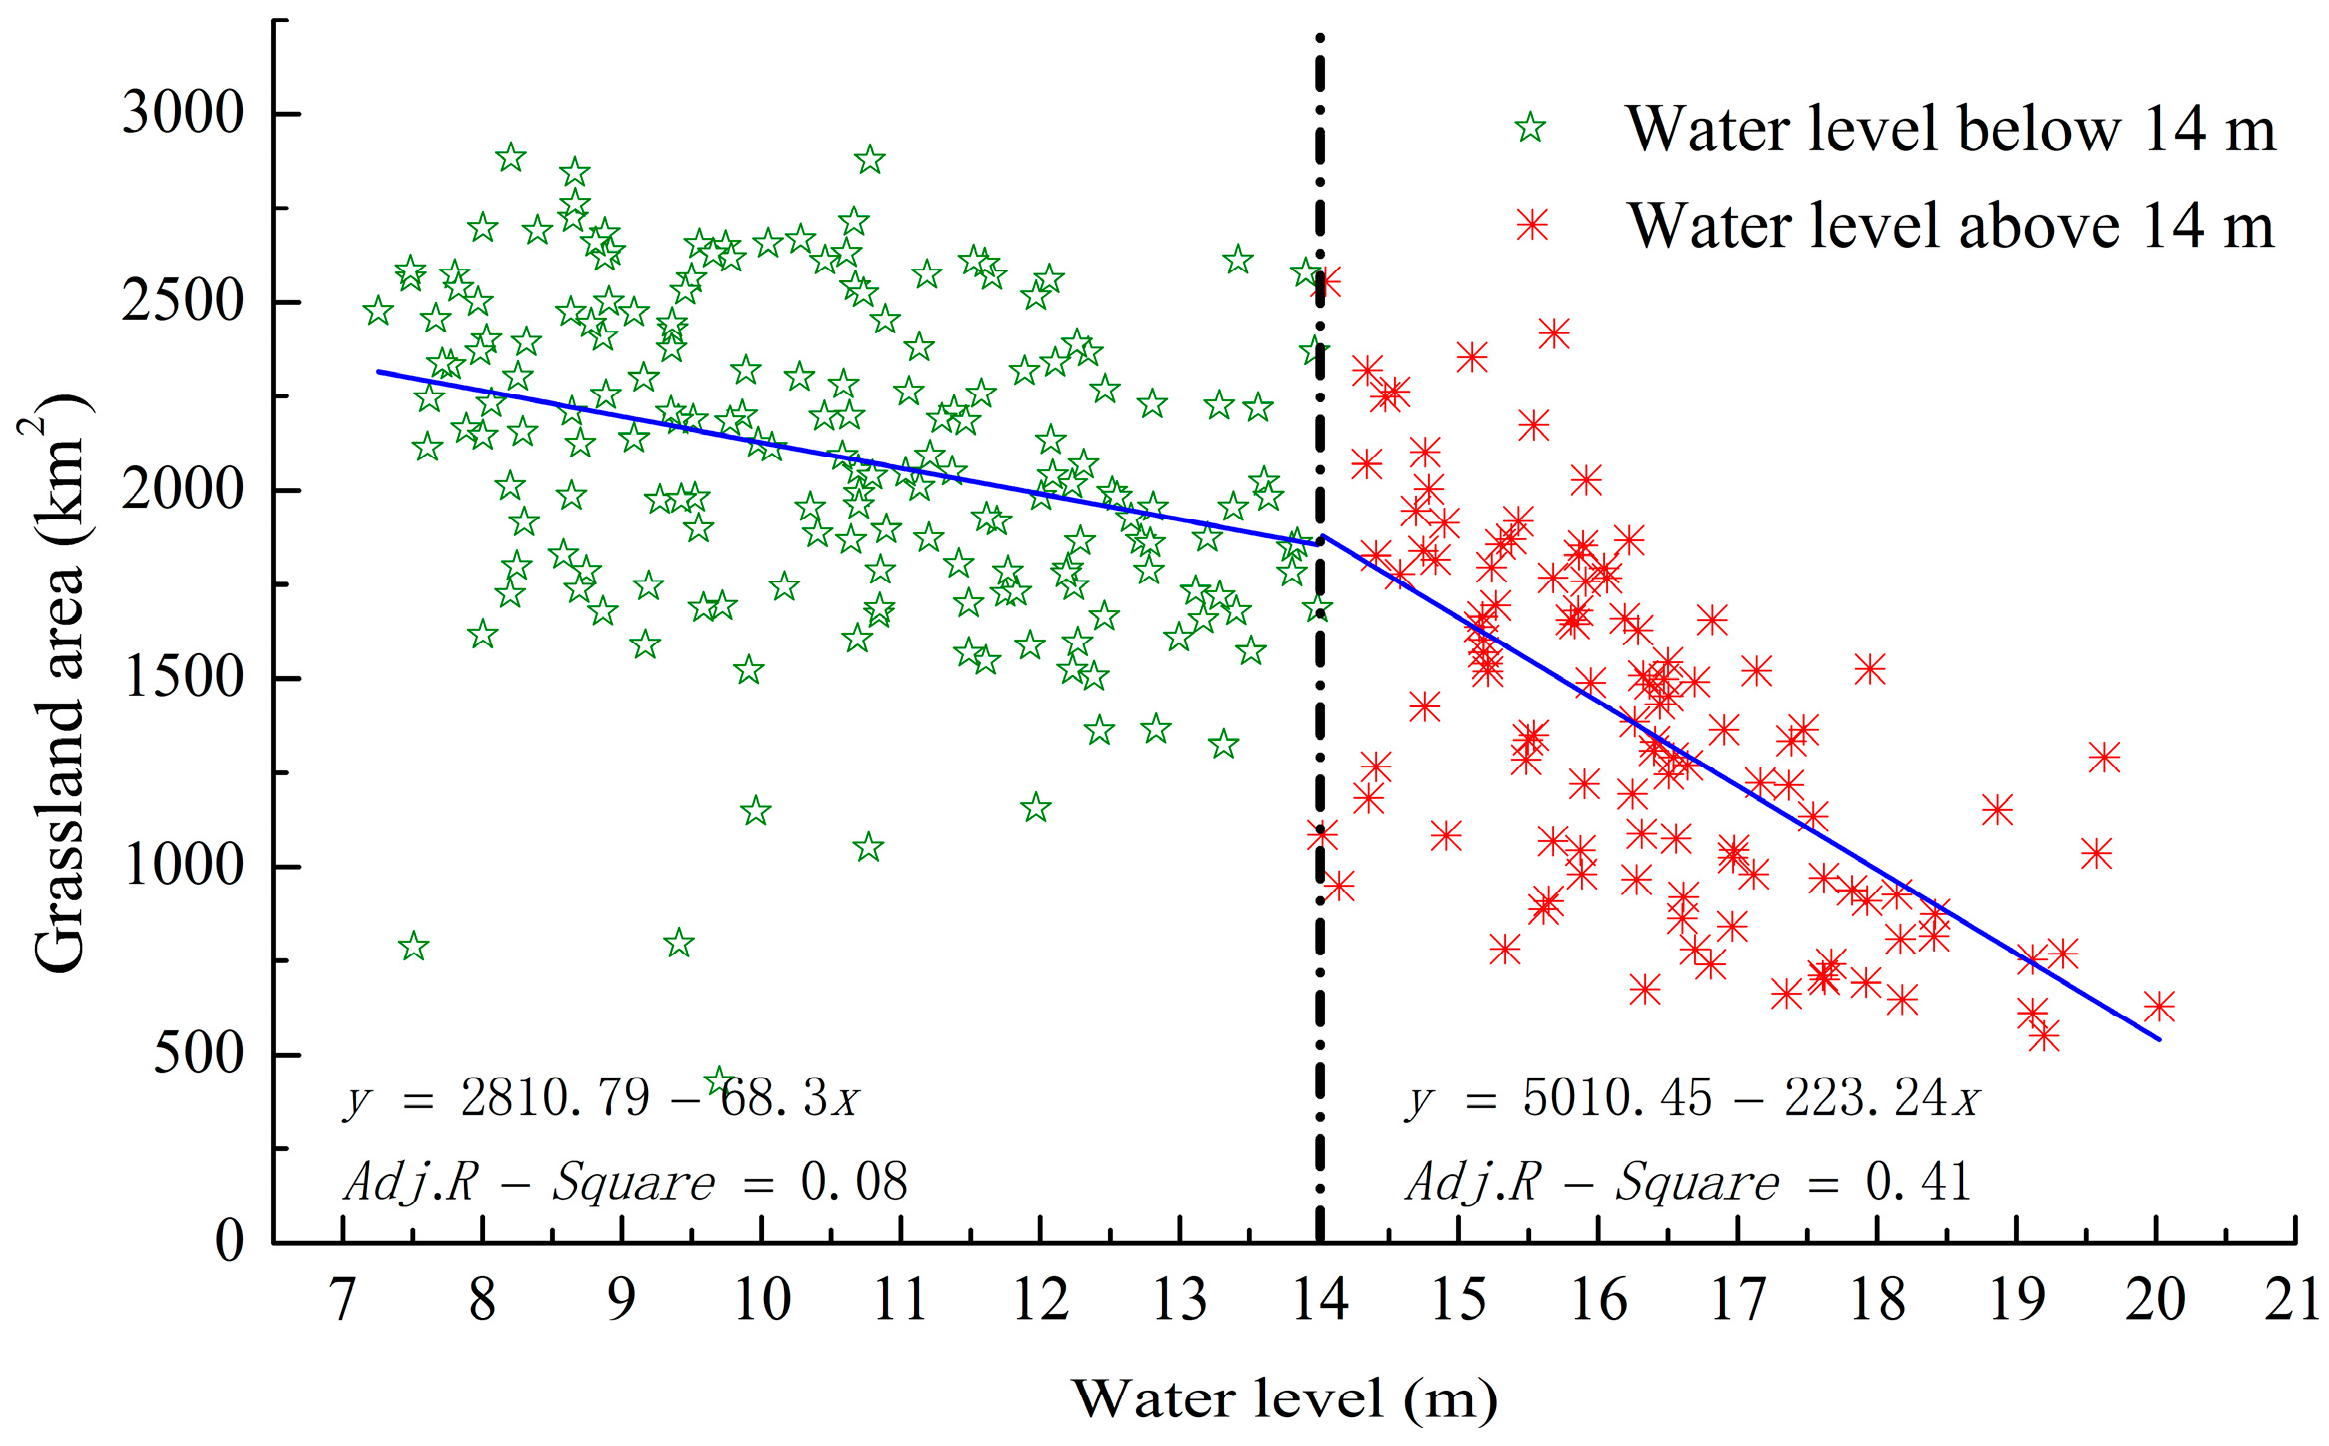
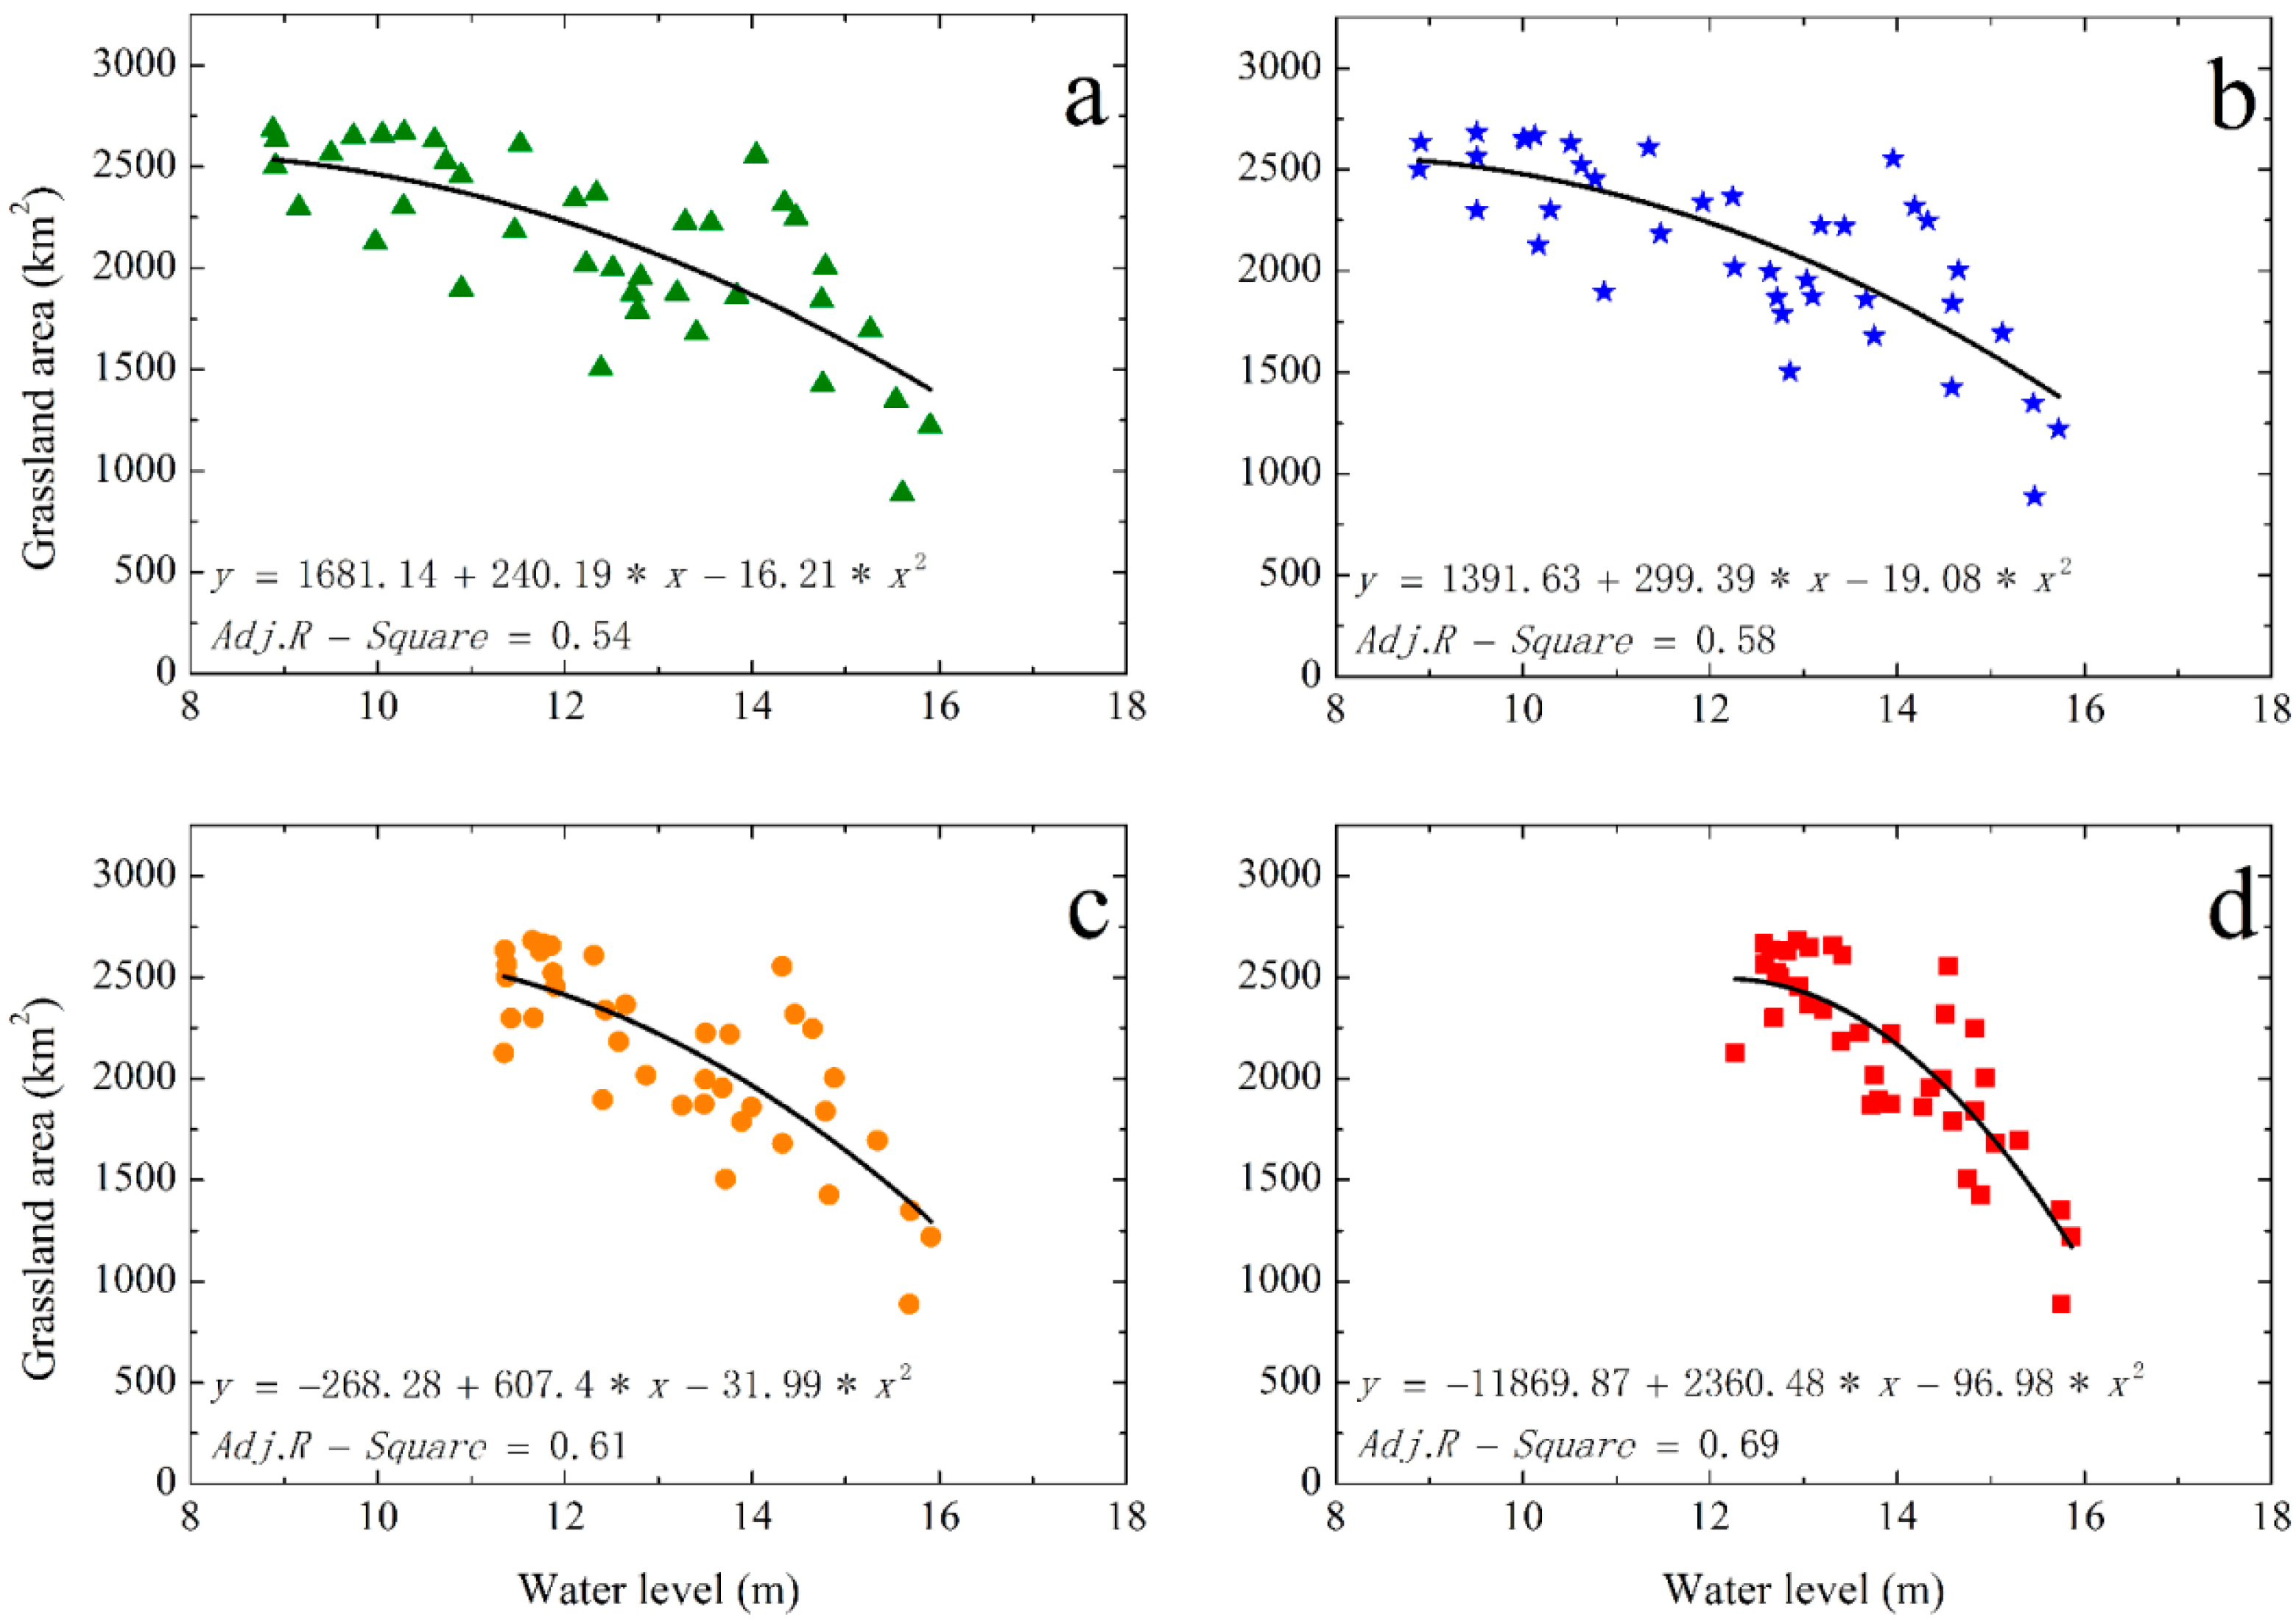
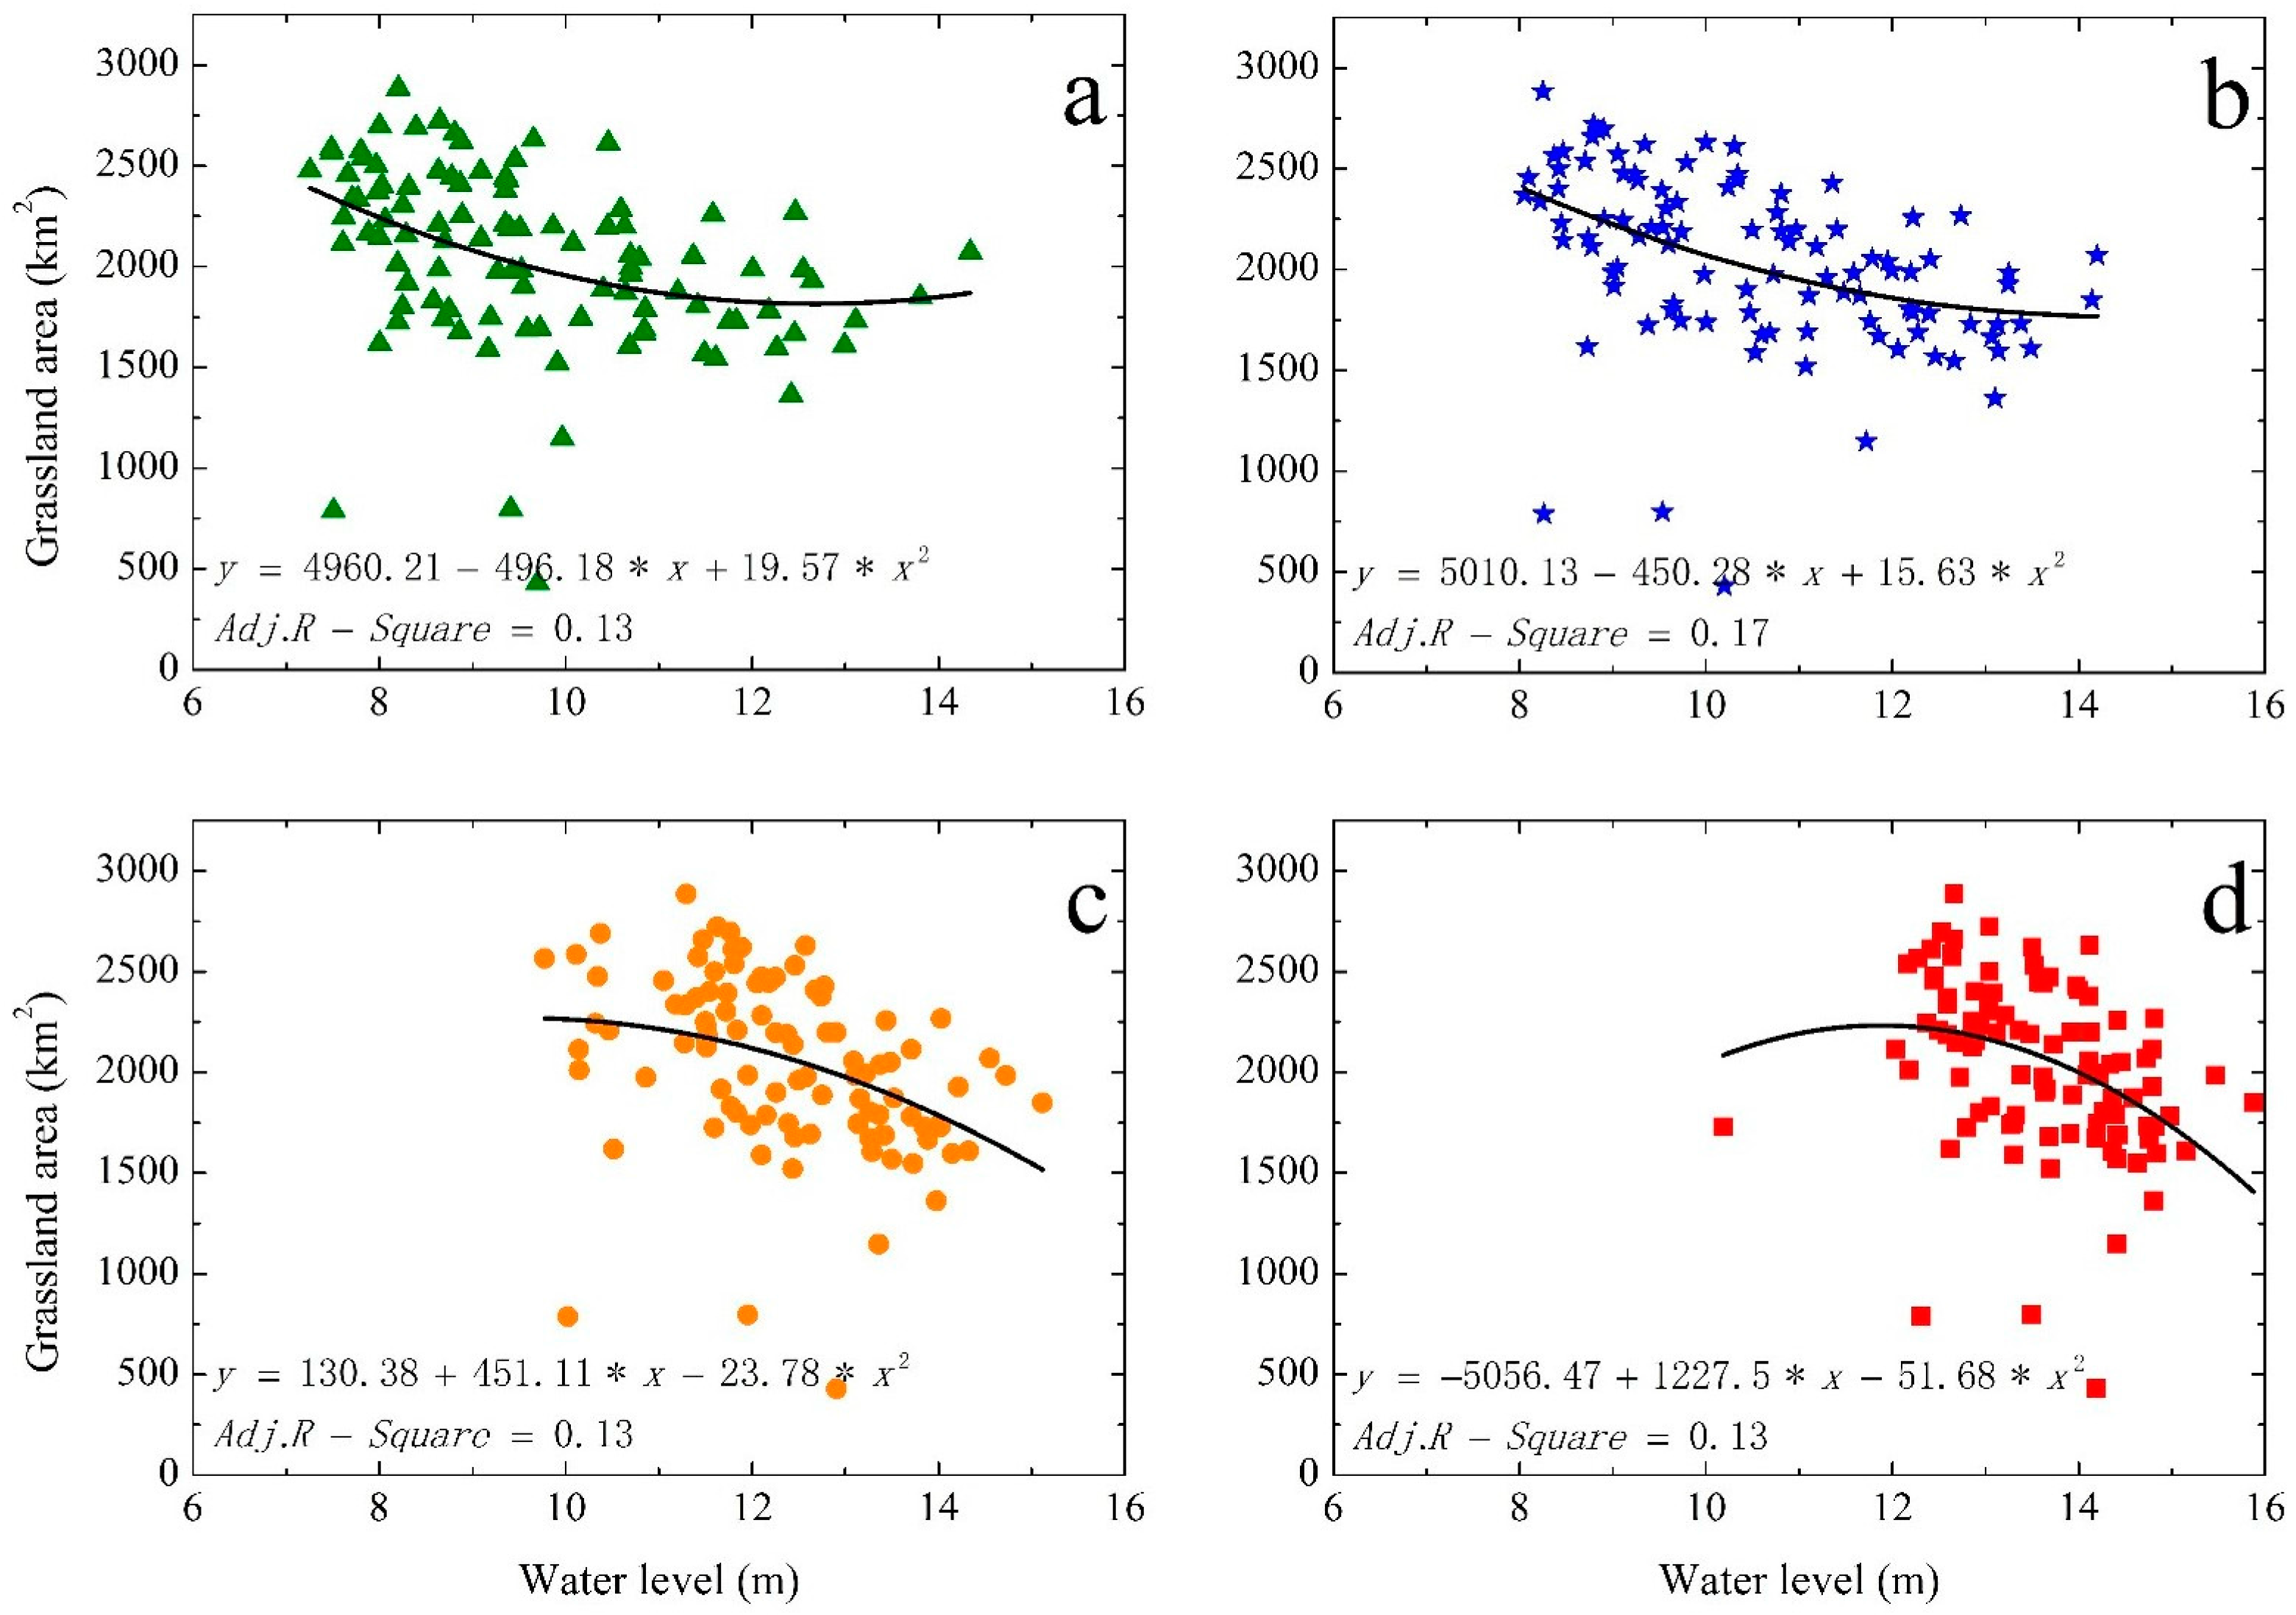
3.2. Relations between Grassland Area and Water Level

Figure 3 shows the accuracy assessment results of MODIS-derived grassland area, revealing a high correlation with the Landsat-derived results. The absolute and relative differences between the two datasets are 28.9 km2 and 1.7%, respectively. For all of the MODIS-derived grassland area, the comparison with the Landsat values resulted in an average absolute error (AAE) of 193.67 km2, a root mean square error (RMSE) of 233.01 km2, and an R2 of 0.93, indicating the relationships between fine resolution (e.g., Landsat MSS/TM/ETM+) and coarse resolution (e.g., MODIS) are linear and constant over time.
Several pioneering studies have shown that the polynomial regression is qualified to characterize the response of grassland area to water level fluctuations because the quadratic function produced the best fit with the largest correlation coefficient between them [55,56]. The coefficients of x2 in quadratic function are related to the slope of the curves: a positive value indicates a parabola going upward (meaning greater change in grassland area at relatively low water levels), and a negative value indicates a parabola going downward (meaning smaller change in grassland at relatively low water levels, but greater at higher water levels).
The submersion—emersion processes of wetlands in different zones of Poyang Lake during the rising and retreating water periods were divided according to the lake’s hydrological and topographic features. Indeed, the timing and duration of inundation directly affect the productivity, biomass, species richness and diversity of wetland plants. We infer that the variations of grassland area have differential responses to the water level fluctuations in different lake regions during typical hydrological periods (Table 2).
During the water rising period (submersion of grassland), water levels gradually increased from north to south, a pattern that was especially dominant in the lake’s main body and nearby estuary delta zones (e.g., PLNNR and NWNNR), resulting in a high correlation between grassland area and water levels at Duchang and Tangyin stations (Figure 4). Because a larger proportion of wetland vegetation is distributed in the very flat lowlands of Poyang Lake, the change slope of grassland area was great at first, and decreased with the rising water levels.
There are a lot of shallow sub-lakes in the middle and northern wetlands of Poyang Lake (relatively far away from the Kangshan gauging station), such as Dachahu (covers an area of 85 km2), Banghu (covers an area of 73 km2), and Dahuchi (covers an area of 30 km2), which account for a large portion of Poyang Lake grassland. These sub-lakes connect to Poyang Lake during periods with higher water levels, and separate from the Poyang Lake during periods with lower water levels. In Figure 5, the R2 values are relatively low for Xingzi (R2 = 0.55), Duchang (R2 = 0.56), and Tangyin (R2 = 0.55), indicating that grassland area in the sub-lakes no longer correlated to the middle and northern water level fluctuations of Poyang Lake at some water elevations. This case may also happen in severe drought years. To minimize the spatial variability of water level, the water level variations at Kangshan station were small during this period, suggesting a distinct change in grassland area during the low water period. After that, most grasslands were inundated by floods during the high water period.
Through all hydrological periods, we further found the grassland area was linearly related to water level fluctuations when the water level of Poyang Lake at Xingzi station was higher than 14 m (p < 0.01), and this relationship disappeared when the water level of Poyang Lake at Xingzi station was lower than 14 m (Figure 6). This result was consistent with former studies [31,57].
During the retreating period, the water level decreases slowly from south to north, with water levels dropping first in the southern parts of Poyang Lake and a water level gradient reappearing in the main lake body of the lake [58]. Different from the rising period, the slope of grassland area change decreased with the declining water levels due to the distribution pattern of wetland vegetation in Poyang Lake (Figure 7). The slope increased from north to south as follows: Xingzi (coefficient of x2 equals to −16.21), Duchang (coefficient of x2 equals to −19.08), Tangyin (coefficient of x2 equals to −31.99), and Kangshan (coefficient of x2 equals to −96.98).
The growing status of wetland plants is mainly controlled by ground water and weather (temperature) conditions [42]. Species with two growing cycles grow slowly and eventually stop growing in winter due to cold temperatures, and fresh biomass and canopy water content start to drop. The senescent stage of other species living at higher altitudes with one growing cycle (e.g., Artemisia spp.) starts in December due to cold weather and lack of water. In contrast, with the exception of the lake depressions and several artificial lakes, only the main channel was inundated during the dry period; the relatively stable lake water levels with low variation amplitudes did not likely explain the changes in grassland area (Figure 8). But the relatively shallow water and bare ground covered by mud and grass provide ideal habitats and food for migratory birds.
Liu et al. (2011) found that when the water level of Poyang Lake was higher than 14.18 m (Xingzi Station) in the dry season, fewer habitats for birds remained because the area with low water depth disappeared [59]. The proposed PLP would play a role from September to March in maintaining the lake water level at 15 m or higher. For species that are found only at Poyang Lake, if critical habitat was lost during infrequent hydrological events, populations would decline or be eliminated because the species lifecycle would be broken [60,61]. Moreover, sedge communities can tolerate flooding during part of the year, usually during the summer months. If these communities remained inundated permanently, it would greatly affect the fitness of adult plants, and cause failure in seed regeneration [62]. Lacking appropriate habitat, many wintering bird populations could be lost or severely reduced. Realistic projections of the impact of the project are required.

4. Conclusions

This study primarily addressed the variations in wetland vegetation across the largest freshwater lake in China using MODIS data collected from 2000 to 2012. The combined Sen’s slope and MK test approach was applied to analyze trends in EVI time series. There were statistically significant decreasing trends in the mesophytes and semi-aquatic emergent tall vegetation growing at the upper edge of the Poyang Lake wetland. In contrast, increasing trends in vegetation were found in the recently exposed bottomland. Although such dynamic changes are well known, we believe that this is the first time they have been quantified using high-frequency long-term remote sensing data and, therefore, have more statistical meaning. For example, up to 1135.80 km2 of bottomland at 9.9–12.9 m elevation has experienced an increasing trend in EVI with a rate averaged at 0.0661 every 10 years, whereas EVI in about 361.44 km2 of uplands (12.5–15.3 m) has decreased by an average rate of −0.0745 every 10 years. We believe that these “trends” are mainly driven by the 13 year water level fluctuations, and will lead to changes of grassland area in Poyang Lake wetland.
Further analysis indicated that changes of grassland area were significantly correlated with water level fluctuations. With respect to spatial variability, we demonstrated that the water level fluctuations affected the change rate of grassland area in a descending order from south to north, corresponding to the variation amplitude of water level in different parts of the lake. For the four hydrological periods, the slope of grassland area change decreased with the rising water level during the rising period due to the distribution pattern of wetland vegetation in Poyang Lake. In contrast, a relatively small change of grassland area was found at lower water levels during the retreating period, but a greater change was found at higher water levels. Correlations between them were much weaker in the dry period, which was affected by the phonological features of wetland vegetation. It is worth noting that fluctuations of the main water body have negligible effect on grassland area since the water level at Xingzi station is below 14 m on an annual basis.
In recent years, Poyang Lake no longer supports its original ecological system and is undergoing a gradual trend of shrinking. The distribution and prevalence of wetland vegetation would hence be influenced by the ongoing threats from both climate change and human activity, especially from hydro-engineering projects (e.g., the TGD and the proposed PLP). We believe the methodology applied in this study provides new insights for extracting wetland vegetation patterns and their dynamics at wide spatial and temporal scales. Linkages between vegetation distribution and hydrological processes may serve as a foundation for predicting how wet grassland changes respond to future water level fluctuations in Poyang Lake. This could help determine the optimal scheduling of hydro-engineering projects, and help formation of management policies for wetland vegetation restoration.

Acknowledgments

This work was partly supported by National Science Foundation of China (41271034 and 41371121), Science and Technology Project of JiangSu Province (BZ2014005 and BE2014739), Key Laboratory of Poyang Lake Wetland and Watershed Research, Ministry of Education (Jiangxi normal University, PK2015008) and Key Laboratory of Karst Ecosystem and Rocky Desertification Control, Ministry of Land and Resources.

Author Contributions

Zhiqiang Tan carried out data processing, data analysis and wrote the paper. Jiahu Jiang proposed the main idea, offered guidance to complete the work and made revisions to the manuscript.

Conflicts of Interest

The authors declare no conflicts of interest.

References

  1. Joyce, C.B.; Wade, P.M. European Wet Grasslands: Biodiversity, Management and Restoration; John Wiley & Sons Ltd.: Chichester, UK, 1998. [Google Scholar]
  2. Mountford, J.; Roy, D.; Cooper, J.; Manchester, S.; Swetnam, R.; Warman, E.; Treweek, J. Methods for targeting the restoration of grazing marsh and wet grassland communities at a national, regional and local scale. J. Nat. Conserv. 2006, 14, 46–66. [Google Scholar] [CrossRef]
  3. Toogood, S.E.; Joyce, C.B. Effects of raised water levels on wet grassland plant communities. Appl. Veg. Sci. 2009, 12, 283–294. [Google Scholar] [CrossRef]
  4. Connell, J.H. The influence of interspecific competition and other factors on the distribution of the barnacle Chthamalus stellatus. Ecology 1961, 42, 710–723. [Google Scholar] [CrossRef]
  5. Courtwright, J.; Findlay, S.E. Effects of microtopography on hydrology, physicochemistry, and vegetation in a tidal swamp of the Hudson River. Wetlands 2011, 31, 239–249. [Google Scholar] [CrossRef]
  6. Wang, X.L.; Han, J.Y.; Xu, L.G.; Wan, R.R.; Chen, Y.W. Soil Characteristics in Relation to Vegetation Communities in the Wetlands of Poyang Lake, China. Wetlands 2014, 34, 829–839. [Google Scholar]
  7. Piao, S.L.; Fang, J.Y.; Ji, W.; Guo, Q.H.; Ke, J.H.; Tao, S.; Woods, K. Variation in a satellite-based vegetation index in relation to climate in China. J. Veg. Sci. 2004, 15, 219–226. [Google Scholar] [CrossRef]
  8. Euliss, N.H.; Smith, L.M.; Wilcox, D.A.; Browne, B.A. Linking ecosystem processes with wetland management goals: Charting a course for a sustainable future. Wetlands 2008, 28, 553–562. [Google Scholar] [CrossRef]
  9. Chapin, D.M.; Paige, D.K. Response of Delta Vegetation to Water Level Changes in a Regulated Mountain Lake, Washington, WA, USA. Wetlands 2013, 33, 431–444. [Google Scholar] [CrossRef]
  10. Jiao, C.C.; Zhou, D.M. Modeling the spatial distribution of Carex pseudocuraica in a freshwater marsh, northeast China. Wetlands 2014, 34, 267–276. [Google Scholar] [CrossRef]
  11. Silvertown, J.; Dodd, M.E.; Gowing, D.J.; Mountford, J.O. Hydrologically defined niches reveal a basis for species richness in plant communities. Nature 1999, 400, 61–63. [Google Scholar] [CrossRef]
  12. Deegan, B.M.; White, S.D.; Ganf, G.G. The influence of water level fluctuations on the growth of four emergent macrophyte species. Aquat. Bot. 2007, 86, 309–315. [Google Scholar] [CrossRef]
  13. Yao, X.; Yang, G.S.; Wan, R.R.; Wang, X.L. Impact of water level change on wetland vegetation of rivers and lakes. J. Lake Sci. 2014, 26, 813–821. (In Chinese) [Google Scholar]
  14. Kennedy, M.P.; Milne, J.M.; Murphy, K.J. Experimental growth responses to groundwater level variation and competition in five British wetland plant species. Wetl. Ecol. Manag. 2003, 11, 383–396. [Google Scholar] [CrossRef]
  15. Keough, J.R.; Thompson, T.A.; Guntenspergen, G.R.; Wilcox, D.A. Hydrogeomorphic factors and ecosystem responses in coastal wetlands of the Great Lakes. Wetlands 1999, 19, 821–834. [Google Scholar] [CrossRef]
  16. Wilcox, D.A.; Nichols, S.J. The effects of water-level fluctuations on vegetation in a Lake Huron wetland. Wetlands 2008, 28, 487–501. [Google Scholar] [CrossRef]
  17. Shankman, D.; Liang, Q. Landscape changes and increasing flood frequency in China’s Poyang Lake region. Prof. Geogr. 2003, 55, 434–445. [Google Scholar] [CrossRef]
  18. Li, X.H.; Zhang, Q. Variation of floods characteristics and their responses to climate and human activities in Poyang Lake, China. Chin. Geogr. Sci. 2015, 25, 13–25. [Google Scholar] [CrossRef]
  19. Fang, H.W.; Han, D.; He, G.J.; Chen, M.H. Flood management selections for the Yangtze River midstream after the Three Gorges Project operation. J. Hydrol. 2012, 432–433, 1–11. [Google Scholar] [CrossRef]
  20. Guo, H.; Hu, Q.; Zhang, Q.; Feng, S. Effects of the three gorges dam on Yangtze river flow and river interaction with Poyang Lake, China: 2003–2008. J. Hydrol. 2012, 416, 19–27. [Google Scholar] [CrossRef]
  21. Zhao, P.; Tang, X.Y.; Tang, J.L.; Wang, C. Assessing water quality of three gorges reservoir, China, over a five-year period from 2006 to 2011. Water Resour. Manag. 2013, 27, 4545–4558. [Google Scholar] [CrossRef]
  22. Feng, L.; Hu, C.M.; Chen, X.L.; Zhao, X. Dramatic inundation changes of China’s two largest freshwater lakes linked to the Three Gorges Dam. Environ. Sci. Technol. 2013, 47, 9628–9634. [Google Scholar] [CrossRef] [PubMed]
  23. Lai, X.J.; Liang, Q.H.; Jiang, J.H.; Huang, Q. Impoundment Effects of the Three-Gorges-Dam on Flow Regimes in Two China’s Largest Freshwater Lakes. Water Resour. Manag. 2014, 28, 5111–5124. [Google Scholar] [CrossRef]
  24. Toogood, S.E.; Joyce, C.B.; Waite, S. Response of floodplain grassland plant communities to altered water regimes. Plant. Ecol. 2008, 197, 285–298. [Google Scholar] [CrossRef]
  25. Dronova, I.; Gong, P.; Wang, L. Object-based analysis and change detection of major wetland cover types and their classification uncertainty during the low water period at Poyang Lake, China. Remote Sens. Environ. 2011, 115, 3220–3236. [Google Scholar] [CrossRef]
  26. Yu, L.; He, L.H.; Zhang, Q.; Chen, Y.W.; Wang, X.L. Effects of the Three Gorges Project on the typical wetland vegetations of Poyang Lake. Geogr. Res. 2011, 30, 134–144. (In Chinese) [Google Scholar]
  27. Wu, J.D.; Liu, G.H.; Jin, J.F.; You, X.; Zhan, H.Y.; Jia, W.M.; Cao, R.; Gao, Y.Y.; Luo, H.; Gao, X. Structure Analysis of Beach Vegetation in Poyang Lake in Autumn. Jiangxi Sci. 2010, 28, 549–605. (In Chinese) [Google Scholar]
  28. Li, J. Scientists line up against dam that would alter protected wetlands. Science 2009, 326, 508–509. [Google Scholar]
  29. Wang, P.; Lai, G.Y.; Li, L. Predicting the Hydrological Impacts of the Poyang Lake Project Using an EFDC Model. J. Hydrol. Eng. 2015, 20, 05015009. [Google Scholar] [CrossRef]
  30. Xu, X.L.; Zhang, Q.; Tan, Z.Q.; Li, Y.L.; Wang, X.L. Effects of water-table depth and soil moisture on plant biomass, diversity, and distribution at a seasonally flooded wetland of Poyang Lake. Chin. Geogr. Sci. 2015, 25, 739–756. [Google Scholar] [CrossRef]
  31. Xu, J.X.; Xu, L.G.; Jiang, J.H.; Wang, X.L.; Chen, Y.W.; Xu, J. Change of Vegetation Community Structure and the Relationship between It and Soil Nutrients in Typical Beaches in Poyang Lake Area. Wetl. Sci. 2013, 11, 186–191. (In Chinese) [Google Scholar]
  32. Zhang, L.L.; Yin, J.X.; Jiang, Y.Z.; Wang, H. Relationship between the hydrological conditions and the distribution of vegetation communities within the Poyang Lake National Nature Reserve, China. Ecol. Inform. 2012, 11, 65–75. [Google Scholar] [CrossRef]
  33. You, H.L.; Xu, L.G.; Jiang, J.H.; Xu, J.X.; Deng, J.M.; Long, W.X. Responses of typical hygrophytes root growth characteristics to extreme water regimes in beach wetland of Poyang Lake, China. Chin. J. Ecol. 2013, 32, 3125–3130. (In Chinese) [Google Scholar]
  34. Zhang, M.; Ni, L.Y.; Jun, X.U.; Liang, H.E.; Hui, F.U.; Liu, Z.G. Annual Dynamics of the Wetland Plants Community in Poyang Lake in Response to Water-Level Variations. Res. J. Environ. Sci. 2013, 26, 1057–1063. (In Chinese) [Google Scholar]
  35. Wang, L.; Dronova, I.; Gong, P.; Yang, W.B.; Li, Y.R.; Liu, Q. A new time series vegetation–water index of phenological–hydrological trait across species and functional types for Poyang Lake wetland ecosystem. Remote Sens. Environ. 2012, 125, 49–63. [Google Scholar] [CrossRef]
  36. Zhang, Q.; Ye, X.C.; Werner, A.D.; Li, Y.L.; Yao, J.; Li, X.H.; Xu, C.Y. An investigation of enhanced recessions in Poyang Lake: Comparison of Yangtze River and local catchment impacts. J. Hydrol. 2014, 517, 425–434. [Google Scholar] [CrossRef]
  37. Tan, Z.Q.; Zhang, Q.; Li, M.F.; Li, Y.L.; Xu, X.L.; Jiang, J.H. A study of the relationship between wetland vegetation communities and water regimes using a combined remote sensing and hydraulic modeling approach. Hydrol. Res. 2016. [Google Scholar] [CrossRef]
  38. Casanova, M.T.; Brock, M.A. How do depth, duration and frequency of flooding influence the establishment of wetland plant communities? Plant Ecol. 2000, 147, 237–250. [Google Scholar] [CrossRef]
  39. Zweig, C.L.; Kitchens, W.M. Effects of landscape gradients on wetland vegetation communities: Information for large-scale restoration. Wetlands 2008, 28, 1086–1096. [Google Scholar] [CrossRef]
  40. Gao, J.H.; Jia, J.; Kettner, A.J.; Xing, F.; Wang, Y.P.; Xu, X.N.; Yang, Y.; Zou, X.Q.; Gao, S.; Qi, S.; et al. Changes in water and sediment exchange between the Changjiang River and Poyang Lake under natural and anthropogenic conditions, China. Sci. Total Environ. 2014, 481, 542–553. [Google Scholar] [CrossRef] [PubMed]
  41. Zhang, B. Research of Poyang Lake; Shanghai Scientific & Technical Publishers: Shanghai, China, 1988. (In Chinese) [Google Scholar]
  42. Sang, H.Y.; Zhang, J.X.; Lin, H.; Zhai, L. Multi-polarization ASAR backscattering from herbaceous wetlands in Poyang Lake region, China. Remote Sens. 2014, 6, 4621–4646. [Google Scholar] [CrossRef]
  43. Wessels, K.J.; De Fries, R.S.; Dempewolf, J.; Anderson, L.O.; Hansen, A.J.; Powell, S.L.; Moran, E.F. Mapping regional land cover with MODIS data for biological conservation: Examples from the Greater Yellowstone Ecosystem, USA and Para State, Brazil. Remote Sens. Environ. 2004, 92, 67–83. [Google Scholar] [CrossRef]
  44. Wardlow, B.D.; Egbert, S.L.; Kastens, J.H. Analysis of time-series MODIS 250 m vegetation index data for crop classification in the US Central Great Plains. Remote Sens. Environ. 2007, 108, 290–310. [Google Scholar] [CrossRef]
  45. Waring, R.; Coops, N.; Fan, W.; Nightingale, J. MODIS enhanced vegetation index predicts tree species richness across forested ecoregions in the contiguous USA. Remote Sens. Environ. 2006, 103, 218–226. [Google Scholar] [CrossRef]
  46. Huete, A.; Didan, K.; Miura, T.; Rodriguez, E.P.; Gao, X.; Ferreira, L.G. Overview of the radiometric and biophysical performance of the MODIS vegetation indices. Remote Sens. Environ. 2002, 83, 195–213. [Google Scholar] [CrossRef]
  47. Crist, E.P.; Cicone, R.C. A physically based transformation of Thematic Mapper data—The TM Tasseled Cap. IEEE Trans. Geosci. Remote Sens. 1984, 3, 256–263. [Google Scholar] [CrossRef]
  48. Richardson, A.J.; Wiegand, C.L. Distinguishing vegetation from soil background information. Photogramm. Eng. Remote Sens. 1977, 43, 1541–1552. [Google Scholar]
  49. Sen, P.K. Estimates of the regression coefficient based on Kendall’s tau. J. Am. Stat. Assoc. 1968, 63, 1379–1389. [Google Scholar] [CrossRef]
  50. Salmi, T.; Määttä, A.; Anttila, P.; Ruoho-Airola, T.; Amnell, T. Detecting Trends of Annual Values of Atmospheric Pollutants by the Mann-Kendall Test and Sen’s Slope Estimates—The Excel Template Application MAKESENS; Finnish Meteorological Institute: Helsinki, Finland, 2002. [Google Scholar]
  51. Tabari, H.; Marofi, S.; Aeini, A.; Talaee, P.H.; Mohammadi, K. Trend analysis of reference evapotranspiration in the western half of Iran. Agric. For. Meteorol. 2011, 151, 128–136. [Google Scholar] [CrossRef]
  52. Tao, H.; Fraedrich, K.; Menz, C.; Zhai, J.Q. Trends in extreme temperature indices in the Poyang Lake Basin, China. Stoch. Environ. Res. Risk Assess. 2014, 28, 1543–1553. [Google Scholar] [CrossRef]
  53. Yue, S.; Wang, C.Y. Applicability of prewhitening to eliminate the influence of serial correlation on the Mann-Kendall test. Water Resour. Res. 2002, 38, 1068. [Google Scholar] [CrossRef]
  54. Gause, G.F. The influence of ecological factors on the size of population. Am. Nat. 1931, 65, 70–76. [Google Scholar] [CrossRef]
  55. Zhang, F.F.; Qi, S.H.; Liao, F.Q.; Zhang, Q.M. Analysis of distribution features of the emersed grassland in Poyang Lake based on remote sensing. Resour. Environ. Yangtze Basin 2011, 20, 1361–1367. (In Chinese) [Google Scholar]
  56. Liu, Y.; Fan, N.; Yu, X.B.; Xia, S.X.; Qi, S.H. Identification of wetland boundaries of Poyang Lake and analysis of seasonal change based on remote sensing and GIS technology. Resour. Sci. 2010, 32, 2239–2245. (In Chinese) [Google Scholar]
  57. Hu, Z.P.; Ge, G.; Liu, C.L.; Chen, F.S.; Li, S. Structure of Poyang Lake wetland plants ecosystem and influence of lake water level for the structure. Resour. Environ. Yangtze Basin 2010, 19, 597–605. (In Chinese) [Google Scholar]
  58. Wu, G.P.; Liu, Y.B. Combining Multispectral Imagery with in situ Topographic Data Reveals Complex Water Level Variation in China’s Largest Freshwater Lake. Remote Sens. 2015, 7, 13466–13484. [Google Scholar] [CrossRef]
  59. Liu, C.L.; Tan, Y.J.; Lin, L.S.; Tao, H.; Tan, H. The wetland water level process and habitat of migratory birds in Lake Poyang. J. Lake Sci. 2011, 23, 129–135. (In Chinese) [Google Scholar]
  60. Barzen, J.; Engels, M.; Burnham, J.; Harris, J.; Wu, G. Potential Impacts of a Water Control Structure on the Abundance and Distribution of Wintering Waterbirds at Poyang Lake; International Crane Foundation: Baraboo, WI, USA, 2009. [Google Scholar]
  61. Qi, S.H.; Liao, F.Q. A study on the scheme of water level regulation of the Poyang Lake hydraulic project. J. Acta Geogr. Sin. 2013, 68, 118–126. (In Chinese) [Google Scholar]
  62. Liu, G.H.; Li, W.; Zhou, J.; Liu, W.Z.; Yang, D.; Davy, A.J. How does the propagule bank contribute to cyclic vegetation change in a lakeshore marsh with seasonal drawdown? Aquat. Bot. 2006, 84, 137–143. [Google Scholar] [CrossRef]
Figure 1. Locations of the Poyang Lake wetland, nature reserves, and meteorological and gauging stations. PLNNR: Poyang Lake National Nature Reserve; NWNNR: Nanji Wetland National Nature Reserve.
Water 08 00397 g001
Figure 2. Spatial distribution of variation trend (a) in EVI and the change rate; (b) of EVI with statistically significant trends during 2000–2012.
Water 08 00397 g002
Figure 3. The accuracy assessment results of Moderate Resolution Imaging Spectroradiometer (MODIS)-derived grassland area. The vertical axis shows the Landsat-derived grassland area and the horizontal axis shows the MODIS-derived grassland area. The perfect agreement line (1:1) and linear regression are also plotted.
Water 08 00397 g003
Figure 4. Relationships between grassland area and water level fluctuations ((a) Xingzi; (b) Duchang; (c) Tangyin; (d) Kangshan) during the rising period.
Water 08 00397 g004
Figure 5. Relationships between grassland area and water level fluctuations ((a) Xingzi; (b) Duchang; (c) Tangyin; (d) Kangshan) during the flood period.
Water 08 00397 g005
Figure 6. Relationships between grassland area in the Poyang Lake wetland and the fluctuations of Xingzi water level (separated at 14 m of water level).
Water 08 00397 g006
Figure 7. Relationships between grassland area and water level fluctuations ((a) Xingzi; (b) Duchang; (c) Tangyin; (d) Kangshan) during the retreating period.
Water 08 00397 g007
Figure 8. Relationships between grassland area and water level fluctuations ((a) Xingzi; (b) Duchang; (c) Tangyin; (d) Kangshan) during the dry period.
Water 08 00397 g008
Table 1. Distribution of elevation of regions that experienced significant enhanced vegetation index (EVI) changes. Var: Variance; Std: Standard deviation.
Statistical IndexElevation (m)
“Downward” Region“Upward” Region
Mean13.411.3
Median13.611.3
MIN−6.0−9.8
MAX20.220.2
Var6.26.1
Std2.52.5
Peak13.911.4
FWHM2.83.0
Range12.5–15.39.9–12.9
Table 2. Hydrological periods of Poyang Lake and the MODIS EVI time series with the same overpass time. DOY: day of year.
Hydrological PeriodCharacteristics of Water LevelMonthSynchronous Data of EVI (DOY)
DryMaintain relatively stable low water levelDec–Mar337, 353 and 1, 17, 33, 49, 65, 81 of the next year
RisingRapid rise of water levelApr–May97, 113, 129 and 145
FloodExperience sustained high water level fluctuationsJul–Sep161, 177, 193, 209, 225, 241 and 257
RetreatingSteady decline of water levelOct–Nov273, 289, 305 and 321

