Article

Application of a GIS Multi-Criteria Decision Analysis for the Identification of Intrinsic Suitable Sites in Costa Rica for the Application of Managed Aquifer Recharge (MAR) through Spreading Methods

1
Instituto Costarricense de Acueductos y Alcantarillados, San José 10109, Costa Rica
2
Junior Research Group “INOWAS”, Department of Hydrosciences, Technische Universität Dresden, Dresden 01069, Germany
3
Department of Hydrosciences, Technische Universität Dresden, Dresden 01069, Germany
*
Author to whom correspondence should be addressed.
Water 2016, 8(9), 391; https://doi.org/10.3390/w8090391
Submission received: 31 May 2016 / Revised: 21 July 2016 / Accepted: 30 August 2016 / Published: 9 September 2016

Abstract

:
Costa Rica’s annual mean precipitation is above 3300 mm, but this precipitation is not evenly distributed in time or space, producing clear differentiated wet and dry seasons in most of the country. Droughts are also common phenomena which greatly affect the availability of water resources. Managed aquifer recharge (MAR) schemes are being taken into consideration to enhance the underground water storage capacity of the country. The present study constitutes the first assessment for the identification of suitable sites for the implementation of MAR technology spreading methods (SM) in Costa Rica. The suitable sites are identified by means of a geographic information system multi-criteria decision analysis (GIS-MCDA) based on four criteria: hydrogeological aptitude, terrain slope, top soil texture and drainage network density. Four steps are performed in order to identify these sites: problem definition, screening for suitable areas, suitability mapping, and sensitivity analysis. The suitability map was divided in two zones after the screening: suitable and unsuitable, the first zone was further divided in five classes according to the weighted linear combination (WLC) ranking. The results indicate that 61% of the country is suitable for conducting SM. This map is a tool for future implementation of MAR techniques in the country.

Graphical Abstract

1. Introduction

Costa Rica is located in the Central America isthmus in the northern hemisphere tropical zone, between the Pacific Ocean and the Caribbean Sea with a total surface area of 51,100 km2 [1]. The country’s climate is tropical, dominated by trade winds and its mountain systems [2]. This leads to a mean annual rainfall of over 3300 mm—of which two-thirds become runoff [3]. This amount of water is not equally distributed, neither in time nor space. In the Pacific and Central regions there is a marked difference between the wet and dry season, the latter with almost no rain during four months of the year [2].
The country presents a complex geology [4] and topography [5]. The mountain ranges are composed mainly of volcanic formations, while the Northern and Tortuguero lowlands and the coastal areas are mostly alluvial depositions from eroded material transported from the elevated steep mountain areas [4]. The spatial distribution of these features is shown in Figure 1 while a detailed description of the country’s geological formations is given elsewhere [4,6,7].
Topographically, the country presents lowland plains, valleys, plateaus, and mountains over 3000 m in height; that favors the development of different climatic regions. Three mountain ranges (Guanacaste, Central, and Talamanca cordilleras) cross the country from northwest to southeast which is the principal orographic feature [5]. The river discharge variations are driven by the seasonal rainfall differences, especially in the Pacific watersheds, where the relatively short distances from the Guanacaste and Aguacate cordilleras to the oceans limit the length of river system and triggers the quick response to rain events [4].
The abundance of water in the wet season, the fast runoff into the oceans, and the touristic high season coinciding in time with the dry season, make managed aquifer recharge (MAR) a viable approach to overcome the drought issue, especially for the water supply systems in Costa Rica. According to Dillon [9], MAR is defined as the intentional banking and treatment of water in aquifers; moreover, it may also be applied for the recovery of falling water levels in the aquifer as well as preventing saline water intrusion or land subsidence [9]. MAR methodologies are classified in five main categories: (a) spreading methods; (b) induced bank infiltration; (c) well, shaft, and borehole recharge; (d) in-channel modifications; and (e) rainwater and run-off harvesting; these are subdivided in specific MAR types [10,11]. This study aims to identify and rank the suitable sites for applying the MAR category spreading methods (SM), which aim to recharge an unconfined aquifer at or near the ground surface by infiltration through permeable materials at the surface [10].
The main objective of this work is to identify the areas in Costa Rica that present the best intrinsic conditions (environmental and physical criteria) to conduct further research on MAR—rather than sorting out the unsuitable sites for it. Other factors (land use, existing infrastructure, water sources, and economics, among others) are not taken into account as these factors can change with time, while the intrinsic factors tend to be more or less constant. Nevertheless, for the implementation of specific MAR schemes, socioeconomic variables should be analyzed.
This study uses the methodology proposed by Rahman et al. [12]. The MAR suitability map is calculated and displayed at 1:500,000 scale for the whole country. This map is a first level screening tool that serves as a basis for decision making where detailed investigations should be carried out. The applied approach can easily be supplemented with additional data.

2. Materials and Methods

2.1. Geographic Information System Multi-Criteria Decision Analysis (GIS-MCDA)

GIS-MCDA is defined as a collection of methods and tools for transforming and combining geographical data and preferences (value judgments) to obtain information for decision making [13,14]. GIS offers the capabilities to automate, manage, and analyze a variety of spatial data—while MCDA comprises a wide range of methodologies, techniques, and procedures that guide the decision making process [13]. GIS-MCDA is used to rank the available areas based on decision rules that define how the standardized criteria are integrated. For a detailed description of GIS-MCDA and the concepts it involves see [13,14].
According to Rahman et al. [12] the ranking of potential MAR sites may be performed more comprehensively and at a lower cost using a MCDA integrated into GIS. GIS-MCDA for the identification of MAR suitable sites has been applied to entire countries such as Australia [15] and Spain [16], as well as in many regions of the world, for example in India [17,18,19,20,21,22,23], Iran [24,25,26,27], Jordan [28,29], Portugal [12,30], Tunisia [31,32], and the United States [33,34]. The general process for MAR site suitability analysis proposed in [12] is: problem definition, screening of feasible areas, suitability mapping—including the classification of thematic layers or criteria, standardization, weighting of the criteria and layers overlaying—and sensitivity analysis.

2.1.1. Problem Definition

The recognition of the decision problem is the first step in all decision processes (as GIS-MCDA for MAR) [13]. The objective of site selection is to identify the best site for a given activity which is done by the ranking the basic analysis units in which the study area is subdivided [14]. Suitable site selection for proper MAR technologies is one of the primary requirements for a successful MAR implementation [12].

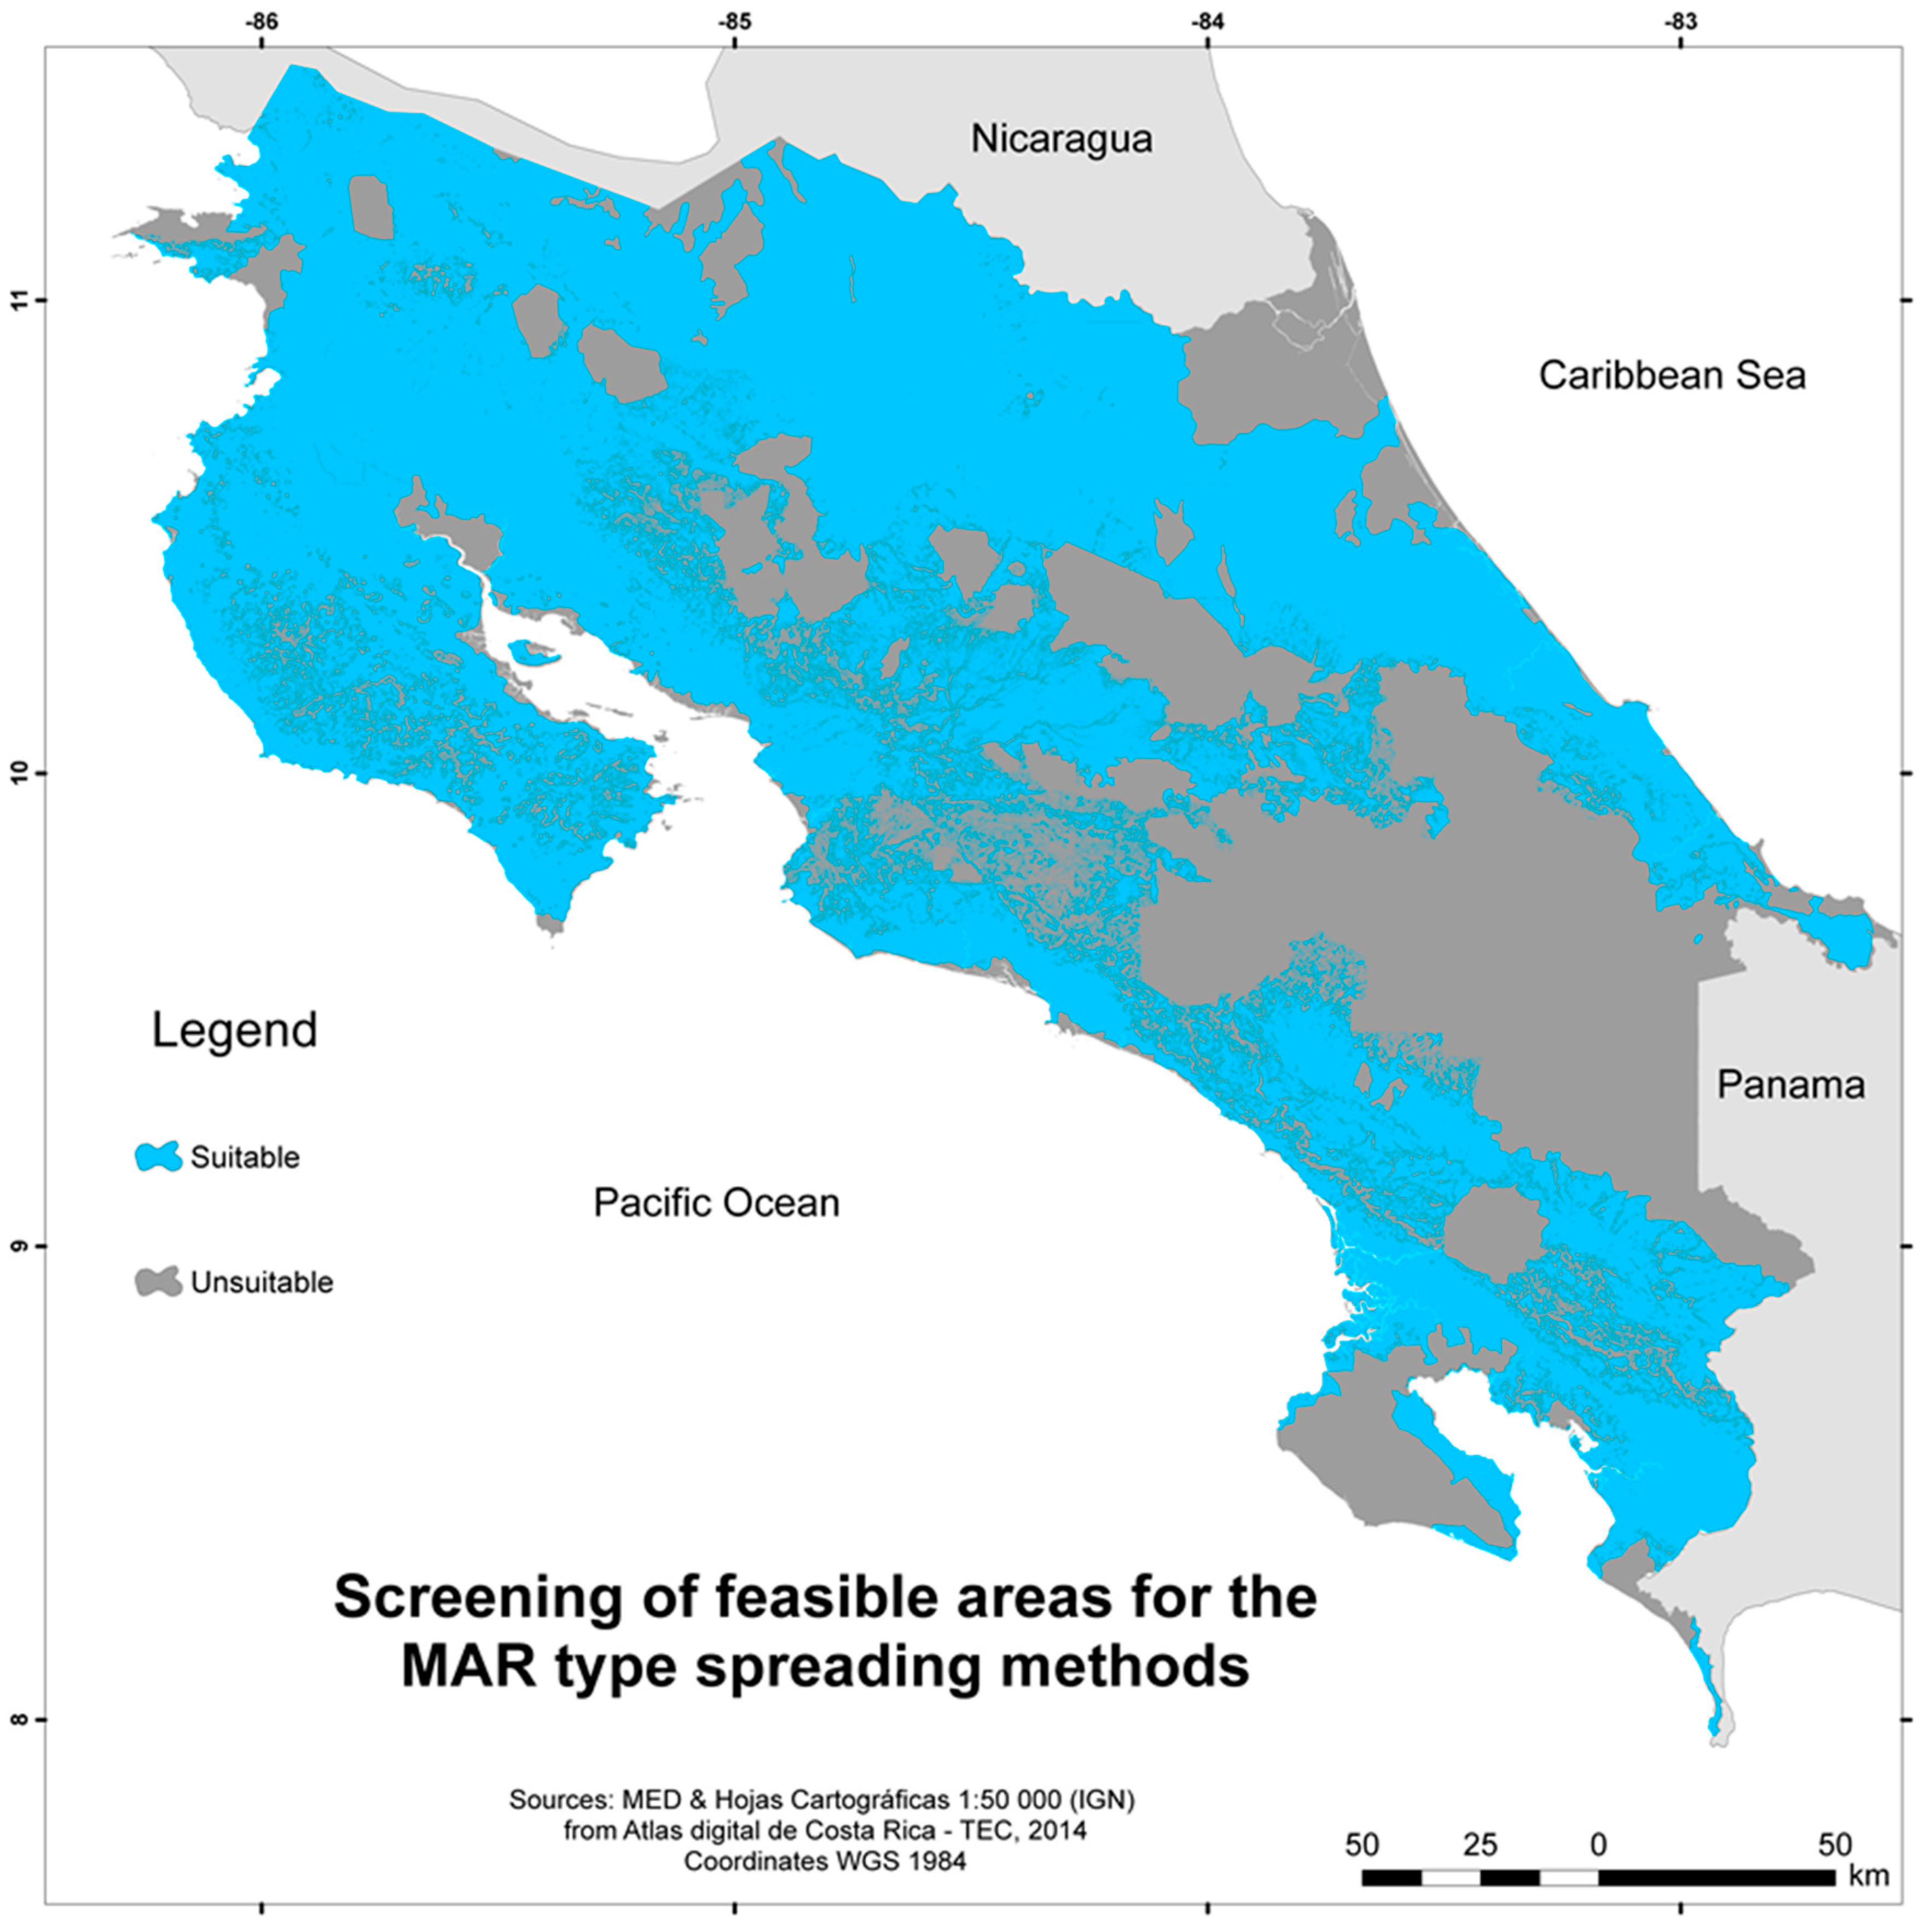
2.1.2. Screening Suitable Areas

Areas that are not feasible for MAR (or not available) are screened out by means of Boolean logic algebra [12]. Boolean logic involves the logical combination of binary maps (only zero or one values are assigned to each unit area) by “AND” and “OR” operators [25]. In Boolean logic, an area is either accepted or rejected based on a given threshold value [35]. The criterion value that satisfy the threshold are assigned with a value of 1, otherwise 0 is assigned; if all the criteria for a specific location contain a value of 1 the resulting map will contain a value of 1 for this location, if only one on the criterion contains a value of 0, the location will also be assign a 0 [12].

2.1.3. Suitability Mapping

Suitability mapping is done to estimate the ability of the study area to support a specific use [36] defined in the problem definition. The suitability map is built to identify the areas with high infiltration rates as well as the terrains where the conditions are favorable for the construction of the infrastructure necessary to enhance the recharge process. This is the most important step in GIS-MCDA [12]. The Weighted Linear Combination (WLC) method is the decision rule applied in this work to overlay the criteria to identify the suitable site. A short description of the suitability mapping components and concepts are listed below:
● Decision rule—WLC
The decision rule is the fundamental part of the suitability mapping and therefore GIS-MCDA dictates how to rank the alternatives [13]. WLC is one of the most popular decision rules [12,13,14,37]. It consists of the linear aggregation of the product of criterion weights and values [14]. A comprehensive approach to the critical elements of the WLC is presented in [37], these are weight assignment to the criteria and the procedure to commensurate them (normalizing the criteria).
● Criteria
The environmental factors that govern the groundwater recharge, occurrence, and movement in a region depend upon geology, geomorphology, land cover, and natural precipitation [38]. The term criterion involves both the concepts of objectives and attributes [13,14,37]. A criterion refers to the desire state of geographical system (objective) and any property that distinguishes it (attribute) [13]. According to Malczewski [13] every criterion has to be compressive and measurable. Furthermore, it is recommended that the criteria be complete, operational, decomposable, non-redundant, and minimal.
● Standardization
A common scale is needed to describe the relative level of the criteria. This is achieved by the transformation of the criterion to comparable units; ergo, standardization [13]. Step-wise and linear functions are the two standardization methods. In accordance with Rahman et al. [12] step-wise functions are used to standardized aggregation criterion.
● Weight assignment—multi-influencing factor
The assignment of different weight for the integration of the criteria is necessary as not all them have the same degree of influence [39]. Weight assignment is one of the critical elements in the WLC [37]. In this work, the multi-influencing factor (MIF) is used for the explanation and assignment of the weight. The MIF method is described in [39,40] where the relationships between the criteria are established in a graphical way.
The estimation of the weights between the criteria is done based on the effect that they have among each other and the objective; the weighting for each criterion depends upon the interrelations between each—it can have either a major or minor effect [39]. According to Shaban et al. [39] a major effect is given 1 point while the minor effect is given 1/2 of a point. From the cumulative score of both major and minor effects for each criterion the relative rate is calculated which is further used to compute the weight of each influencing criterion [40].

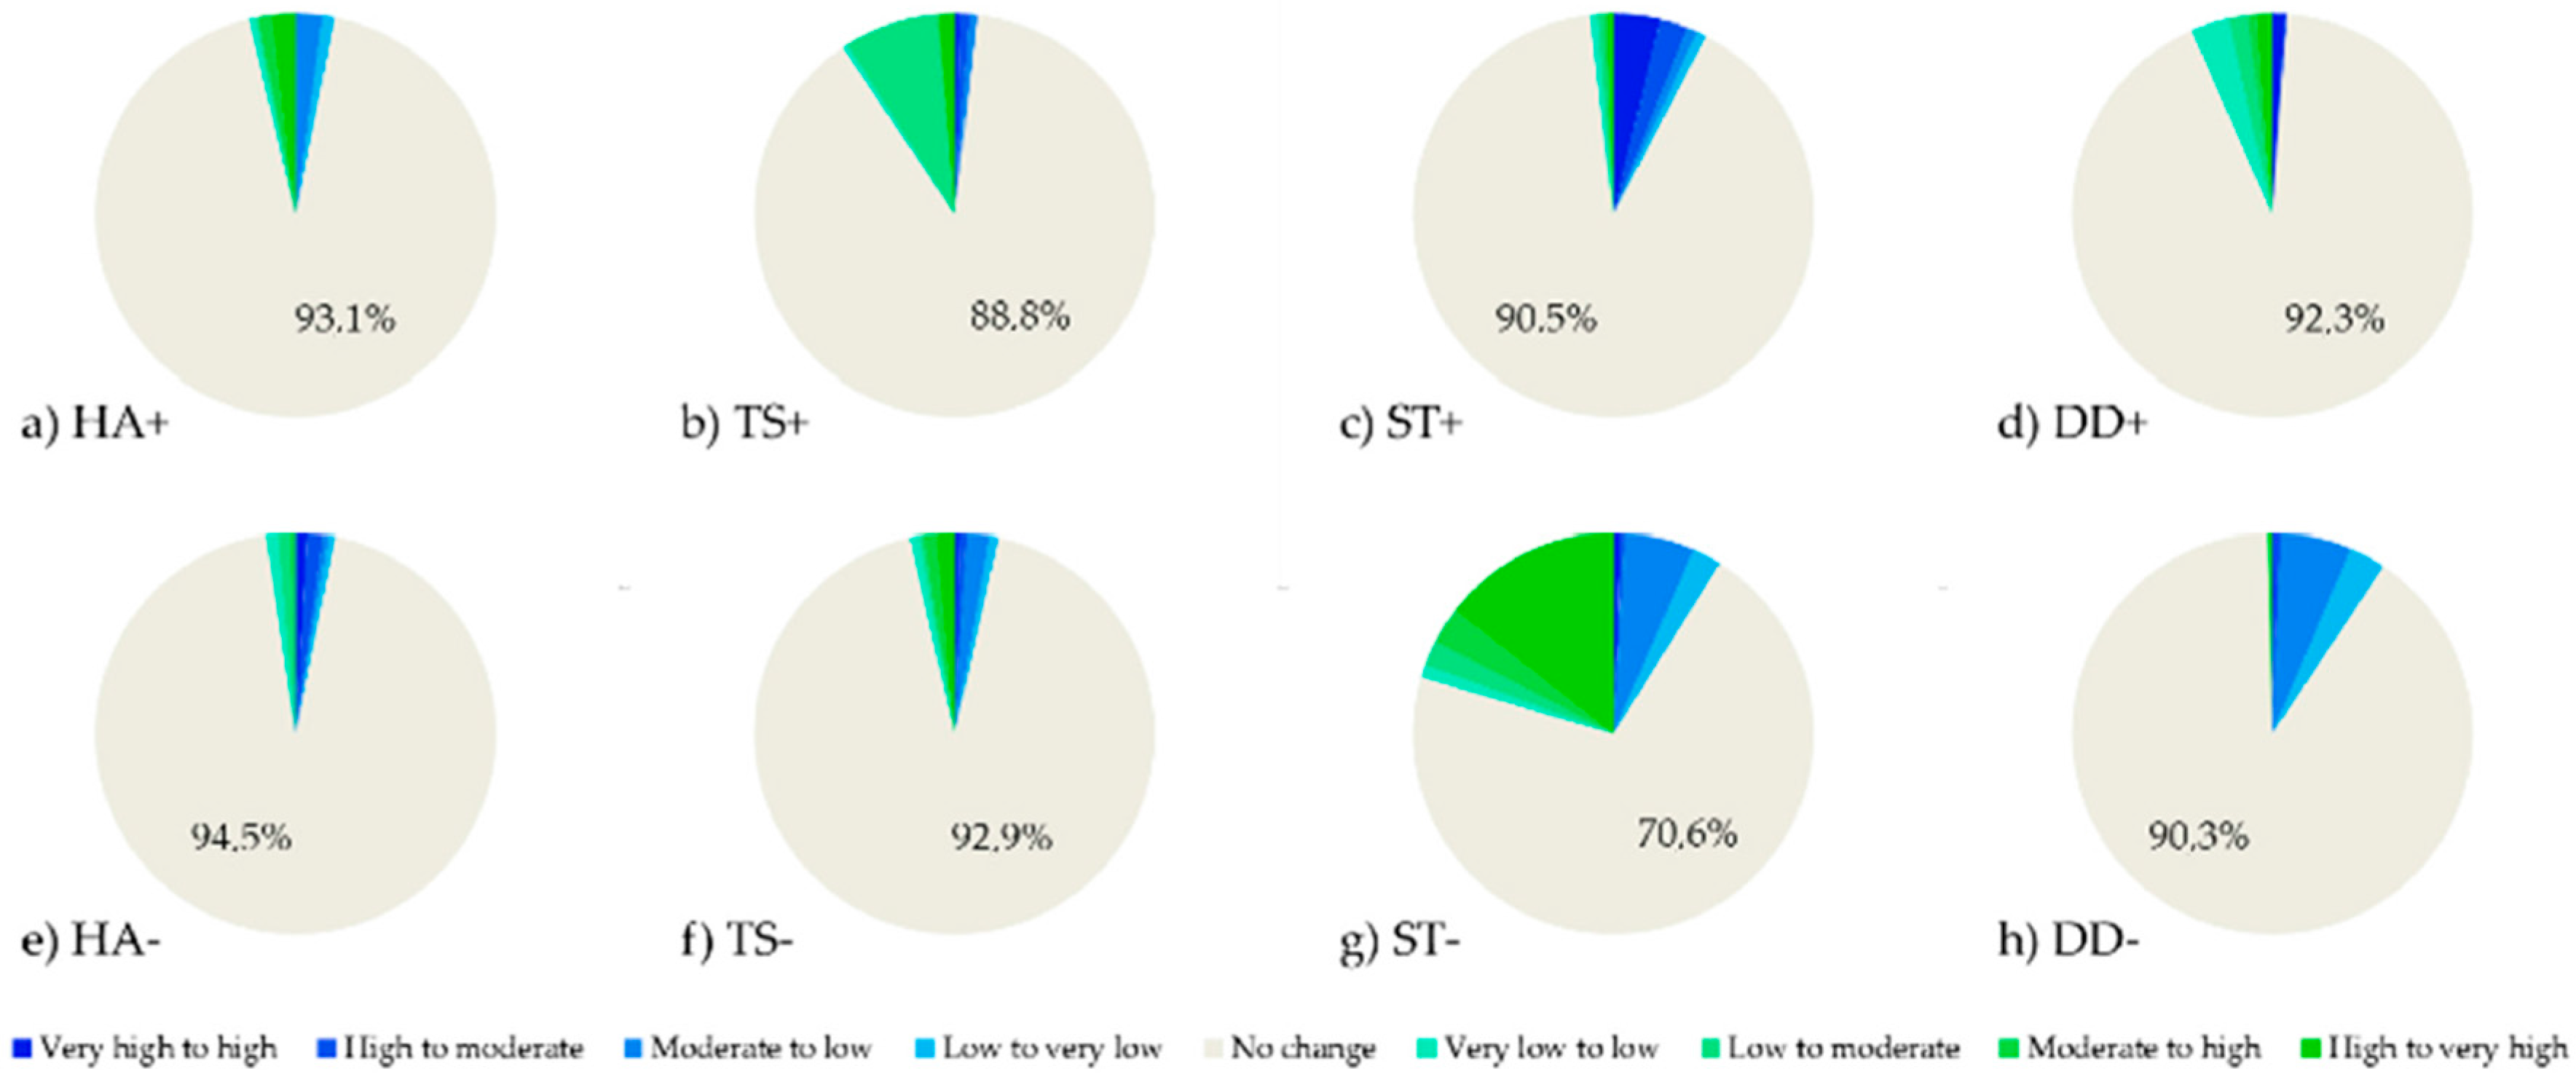
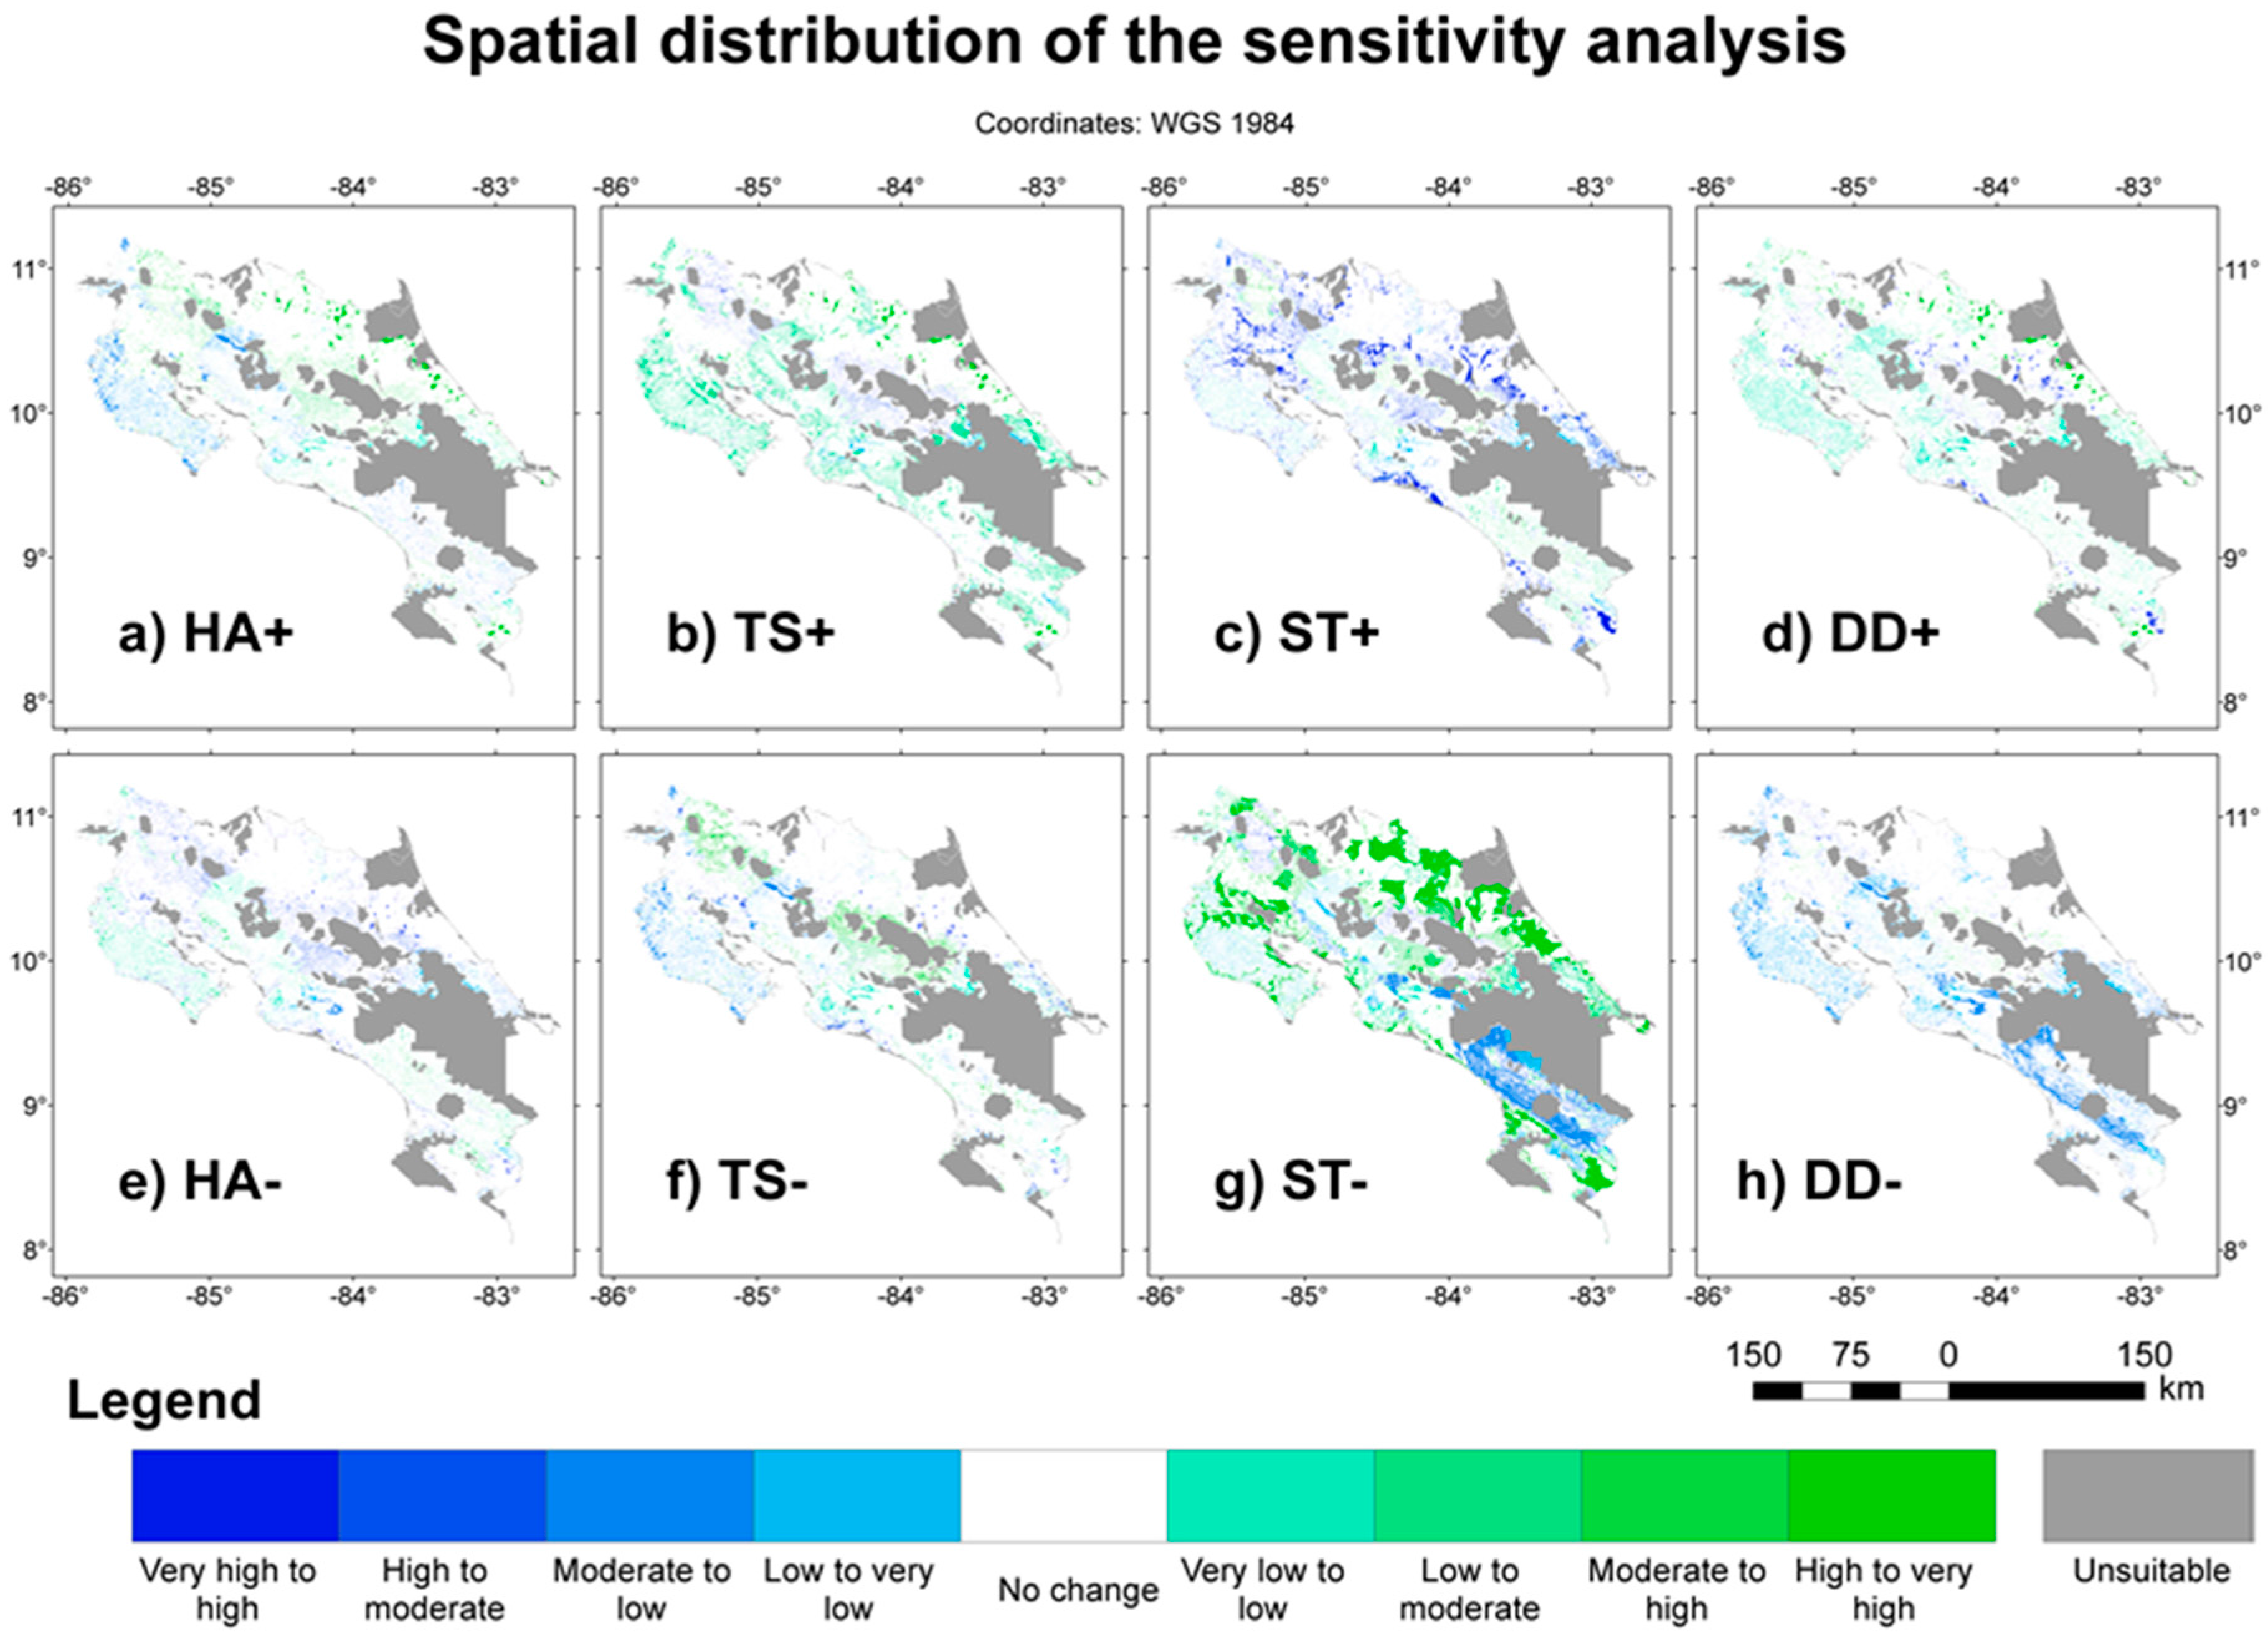
2.1.4. Sensitivity Analysis

Sensitivity analysis in MCDA is defined by Malczewski and Rinner [14] as a set of methods for assessing uncertainty in the multi-criteria model output and the importance of the model input factors as the criterion values and weights. These factors (criterion values and criterion weights) are the main sources of uncertainty in the GIS-MCDA [14]. Performing a sensitivity analysis makes a more robust decision rule for the selection of site suitability [41].
Methods and instructions for the sensitivity analysis are available in [12,13,14,19,35,41]. These include “one-at-a-time” methods and ”variance-methods” [14]. Sensitivity analysis has been carried out to demonstrate the effect of changes of the criterion weights on the spatial distribution the suitability mapping in [12,35,41]. A sensitivity analysis completed by changing the criterion values is given in [19]. As in [35], in this study the sensitivity analysis is done on the criterion weights; ergo the MIF method. The criterion weight sensitivity analysis is done by changing the weight by a small amount and evaluating its effect, in this case; the amount of the change was defined by adding or erasing relationships between the criteria; thus, altering the decision rule by small variations in the MIF method.

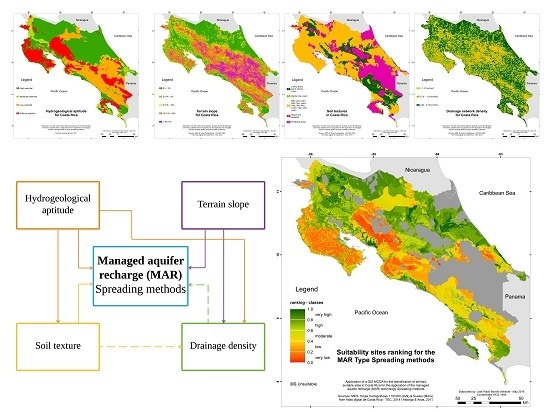
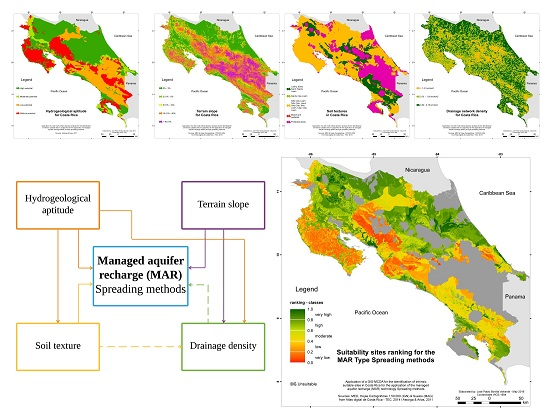
2.2. Criteria Used in the GIS-MCDA

Four spatial parameters in the form of thematic layers are chosen as criteria to identify the suitable sites for applying SM in Costa Rica. These are: hydrogeological aptitude, terrain slope, soil texture, and drainage network density. The screening of suitable areas is done by the integration of two of these thematic layers by means of a Boolean logic: terrain slope and soil texture. The hydrogeological aptitude and drainage network density are not considered restrictive criteria; hence, they are not used for the screening map but are used for the suitability analysis. Each criterion is explained in the next sections.

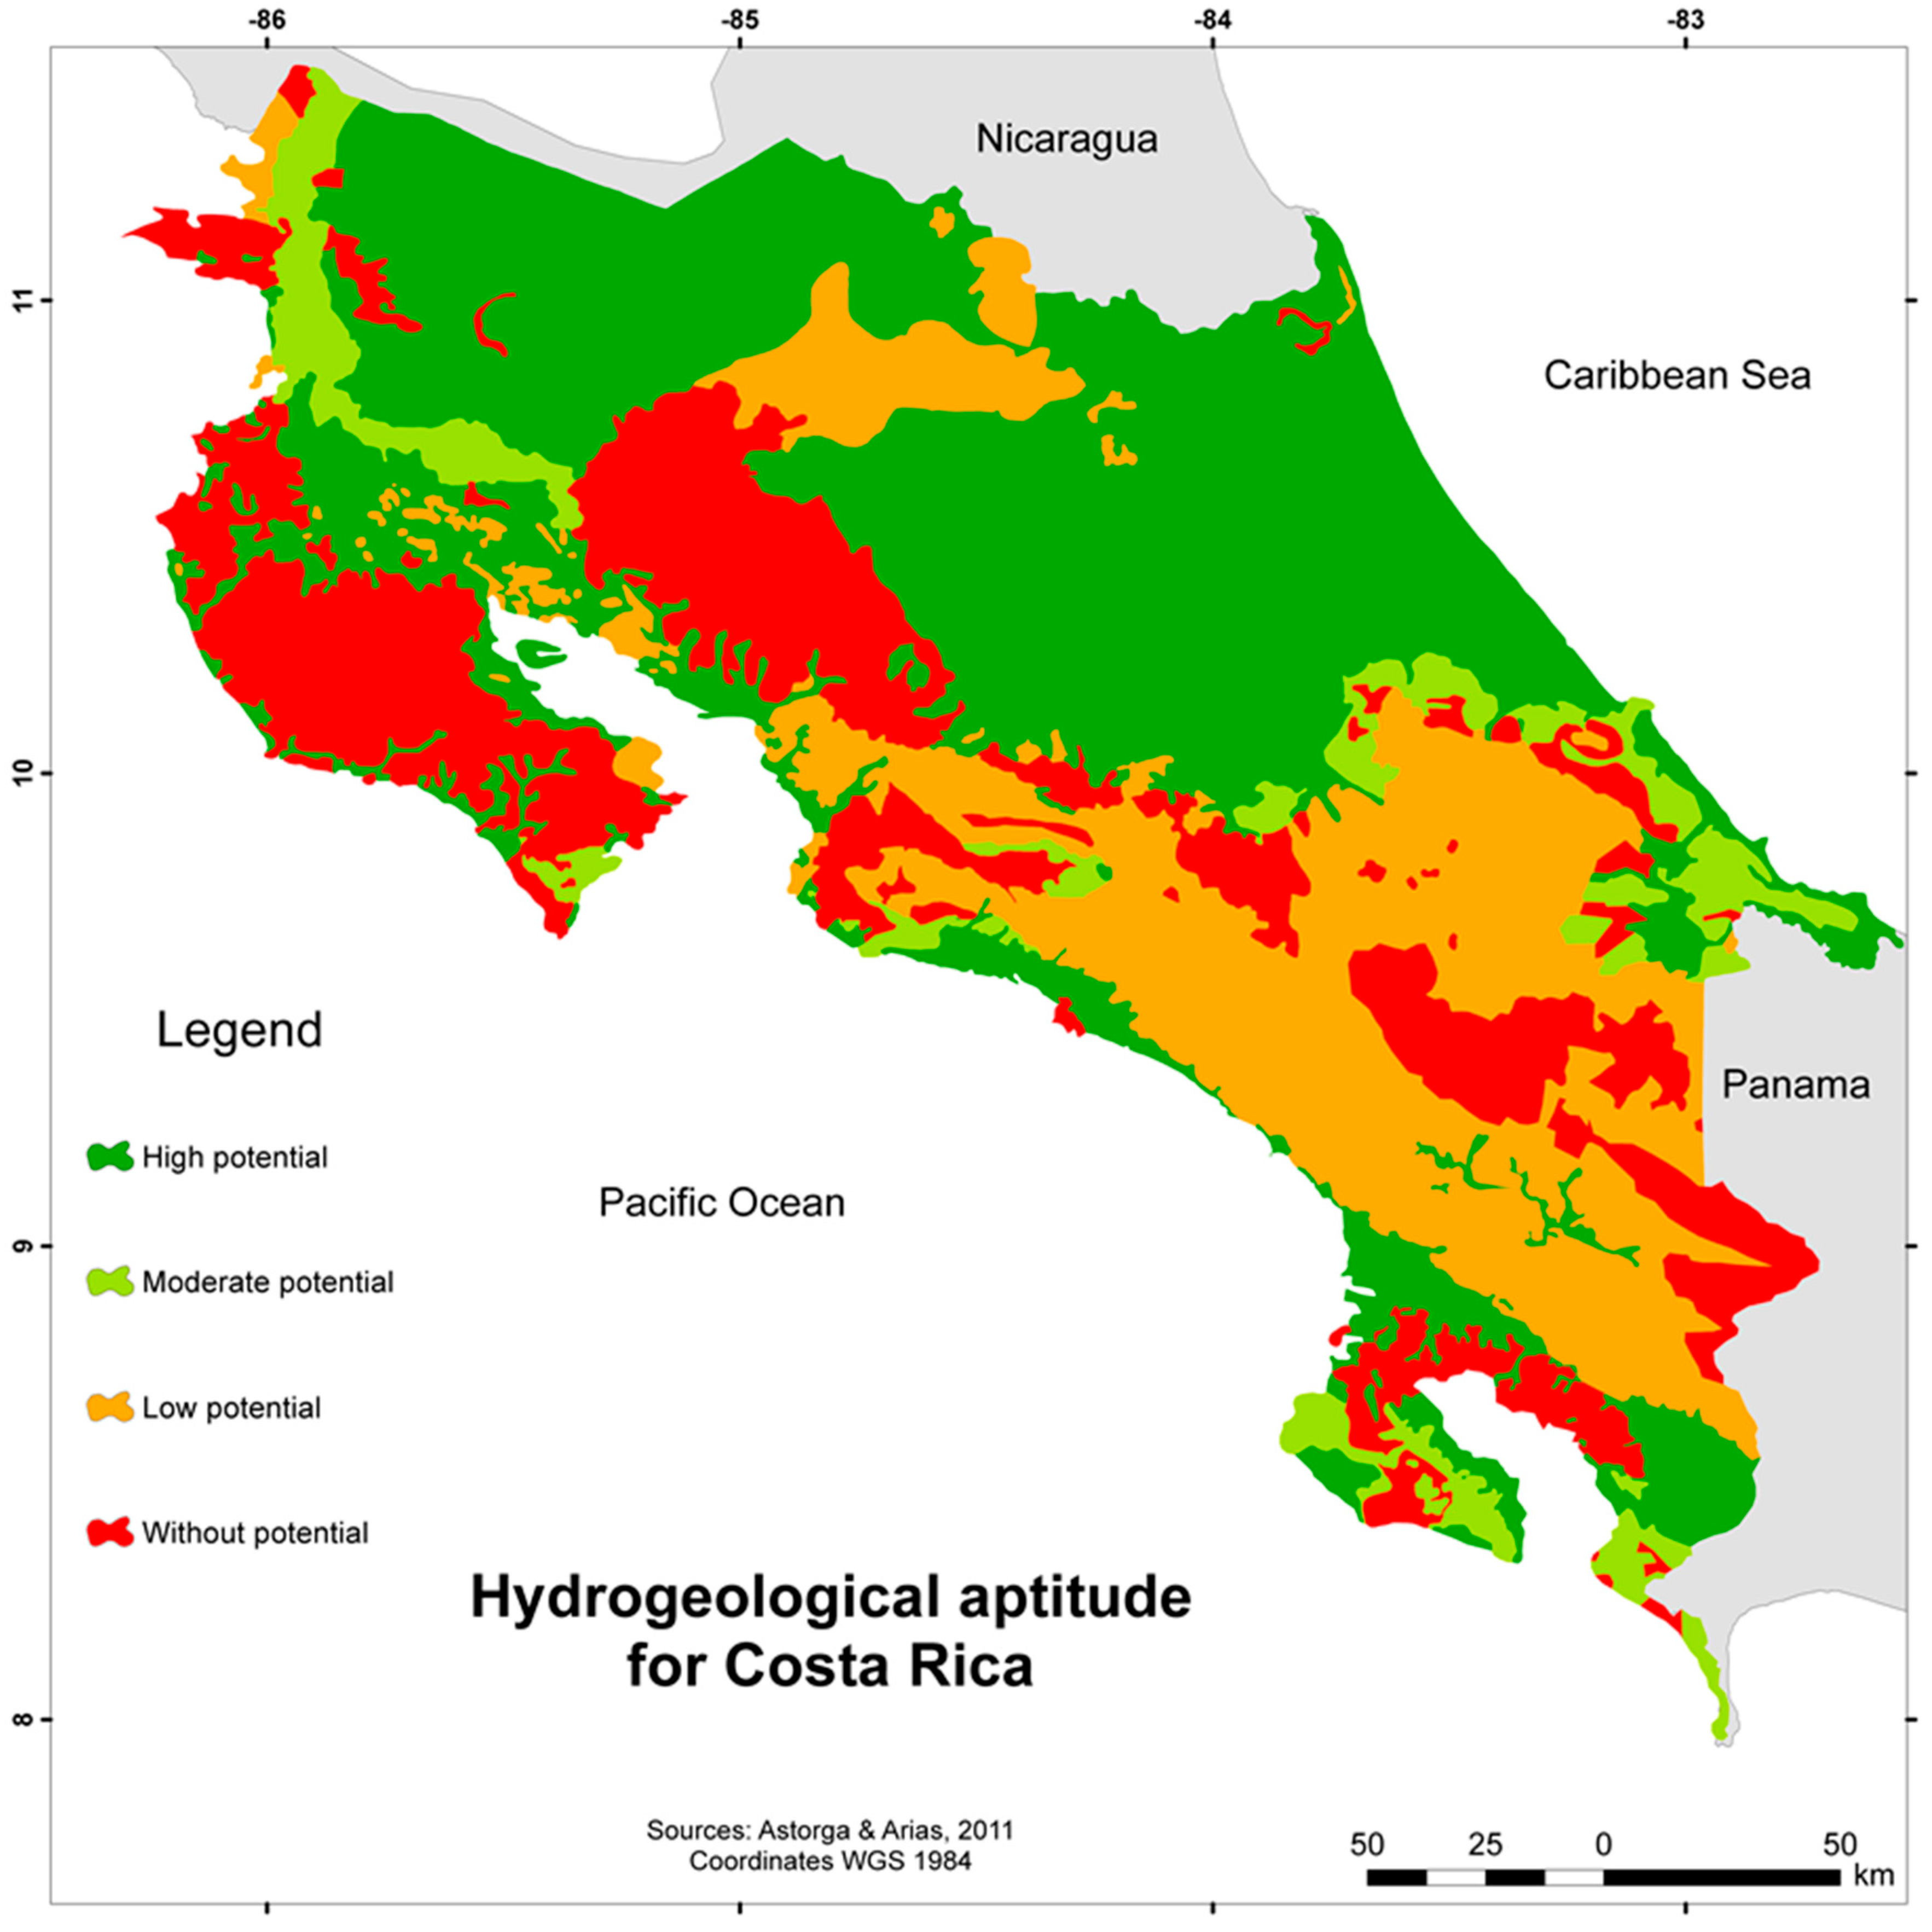
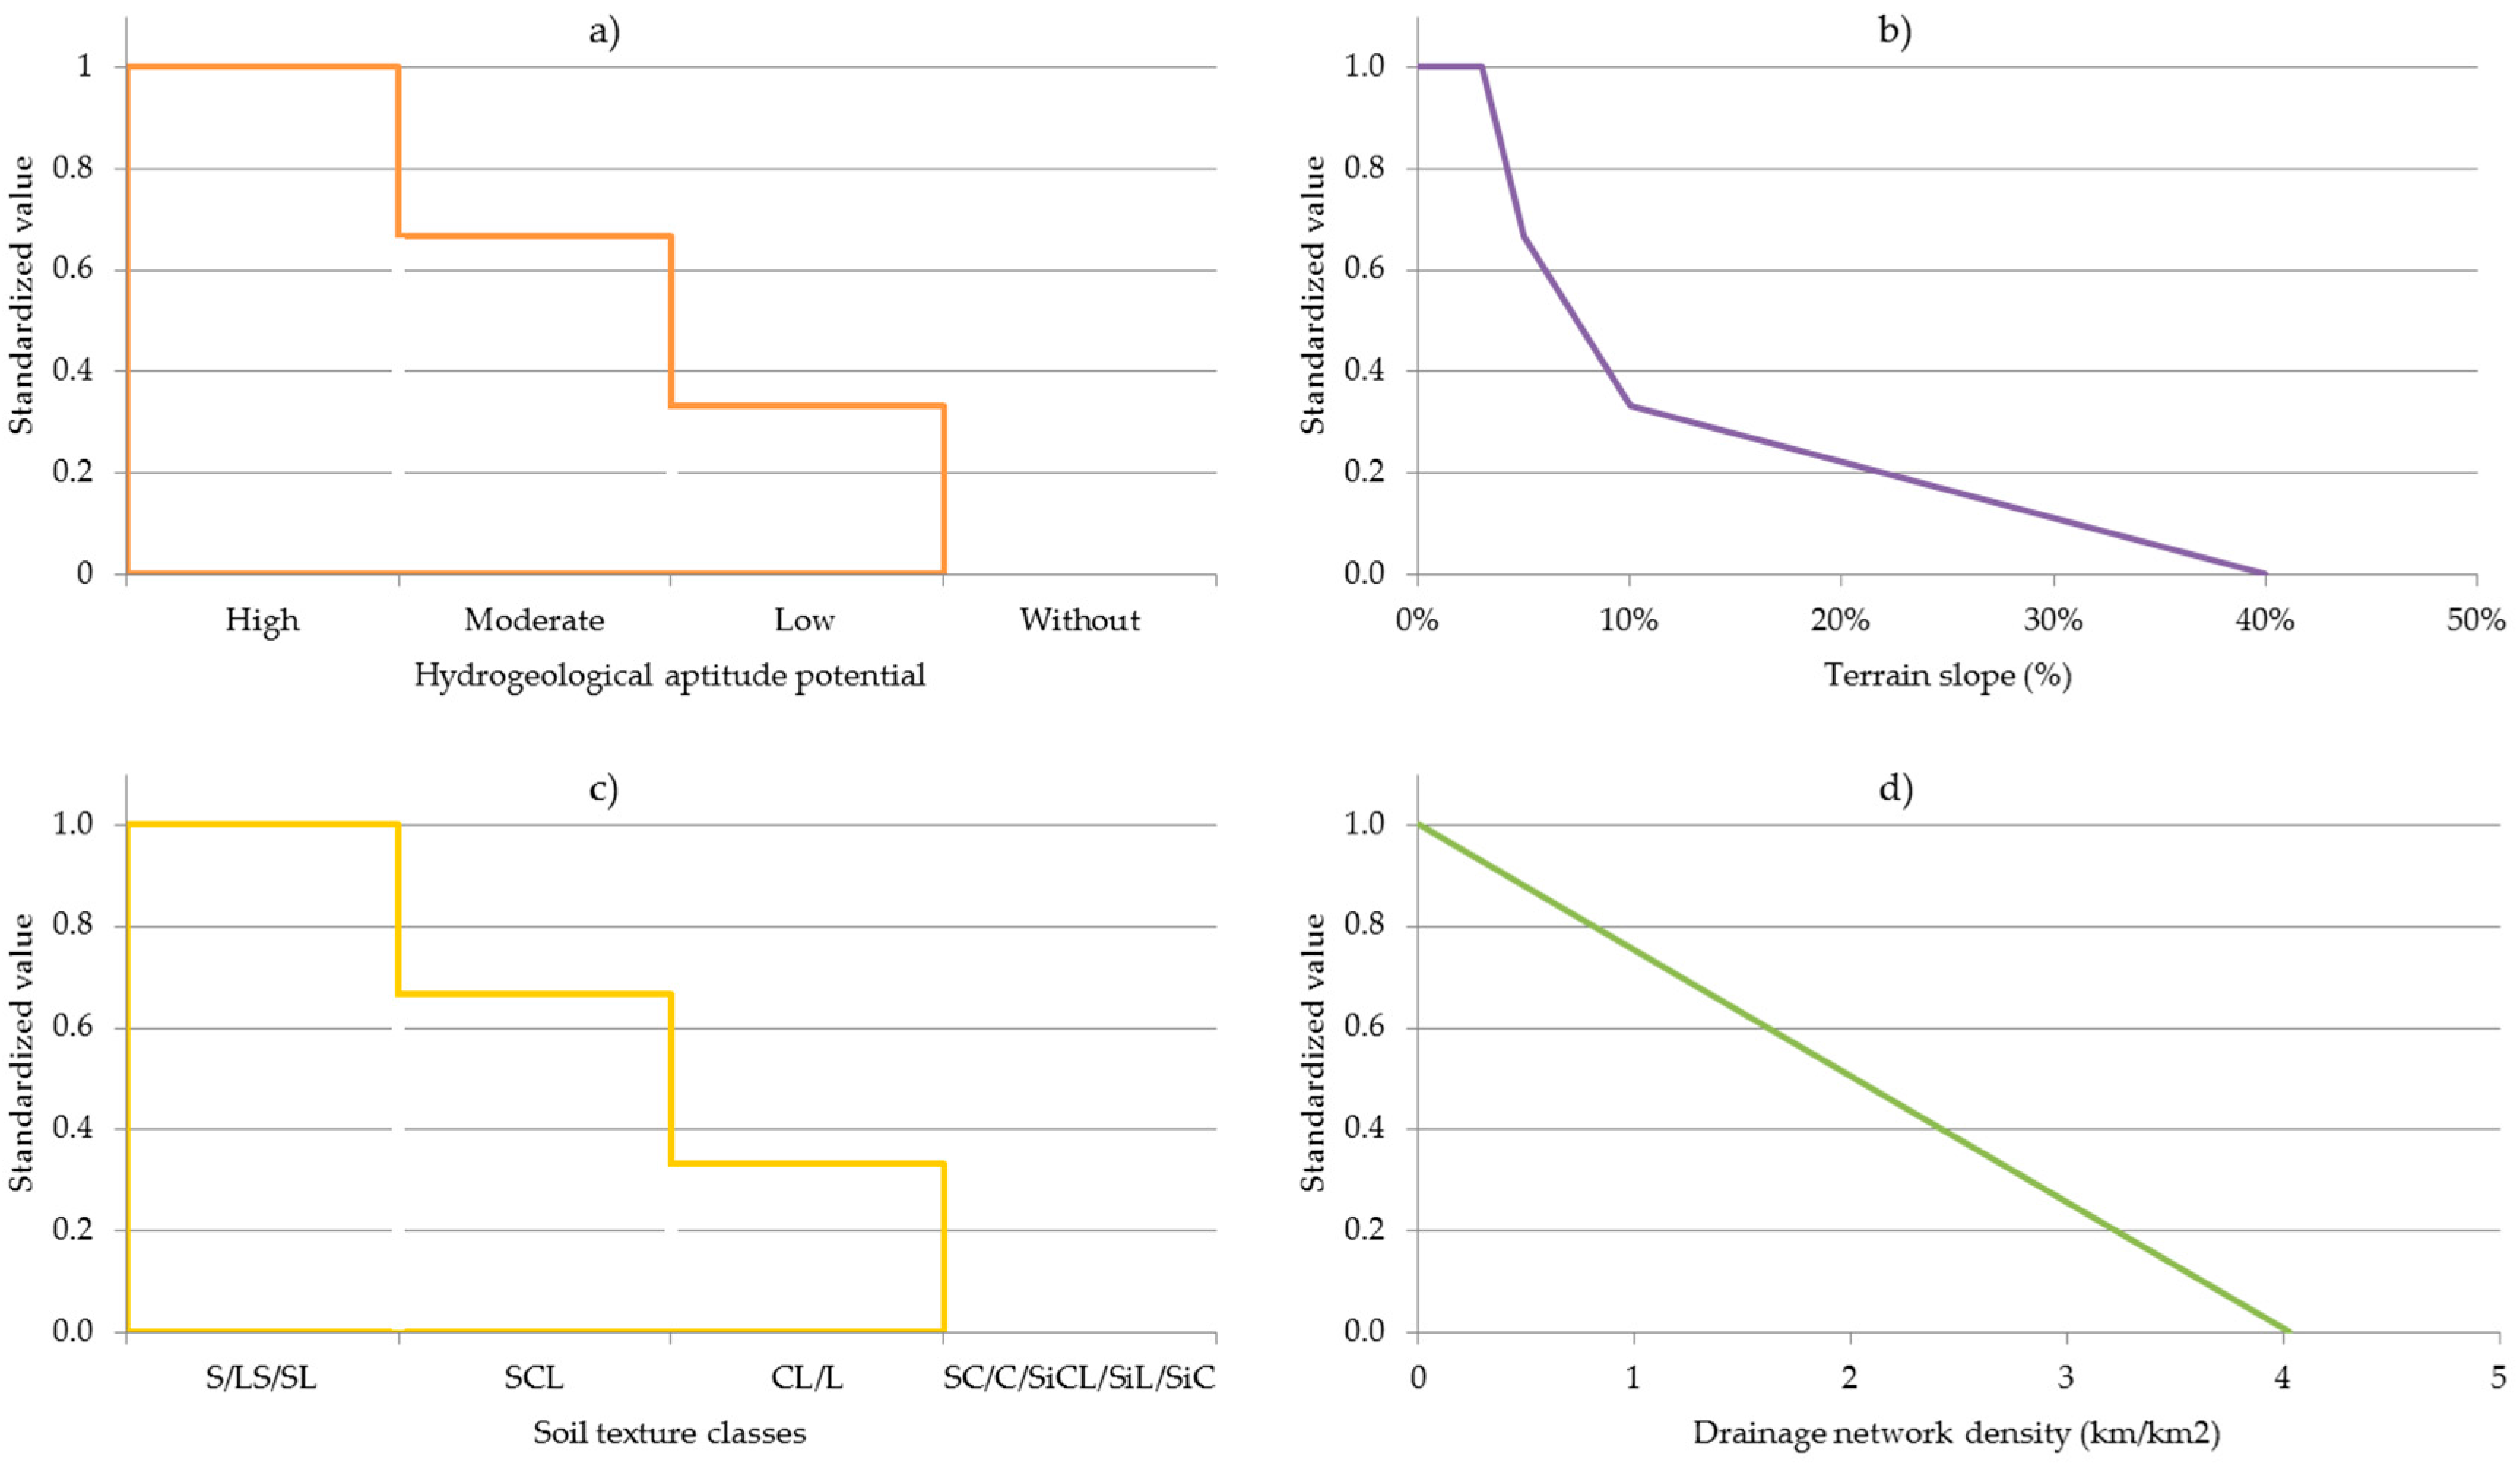
2.2.1. Hydrogeological Aptitude

The aquifer type, extent, water-holding capacity, and depth are relevant information for the site selection, as well as the distance to a water source and to the potential users [15]. Astorga and Arias [42] defined hydrogeological aptitude as the characteristic of a geological rock formation that expresses the potential to have an unconfined aquifer that may be used for various human activities. The hydrogeological aptitude for Costa Rica is based on the identified geological formations in the Costa Rica Geological Map in a 1:500,000 scale [7] and it takes into account the rock formation attributes—lithology, extension, and general physical characteristics. The geological formations are classified as: with potential or without potential [42].
The objective of the work by Astorga and Arias [42] was to identify which areas of the country have a higher vulnerability of contamination of the unconfined aquifers from anthropic activities, and not to represent the actual aquifers that exist in Costa Rica, ergo, it represents the rock formations that have the potential to hold an unconfined aquifer. A volcanic or sedimentary formation without potential does not limit the existence of aquifers by the fracture system of each formation [42]. The most important aquifers for public water supply of the Costa Rica exist in this type of formation [1].
The first category (areas with potential), is further divided in three sub-categories: areas with high potential, moderate potential and low potential. Figure 2 shows the hydrogeological aptitude defined in [42]. In Figure 2, parts of the Santa Elena, Nicoya and Osa peninsulas are classified as without potential [42] which corresponds to gabbro and ocean floor rocks mafic and ultramafic igneous complexes [4,7]. Astorga and Arias [42] also identified the mountain range between the Guanacaste and Central cordilleras (dissected remnants of stratovolcanoes—locally known as Monteverde Formation [7]) and the granite intrusive in Talamanca [7] as without potential.
Regarding the areas with hydrogeological potential, Astorga and Arias [42] assigned a low potential to the andesitic lava flows in the Northern Lowlands [7] as well as most of southern Costa Rica which correspond more significantly to the Talamanca extrusive rocks, the Caribbean interbedded limestones, and Central and Fila Costeña dendritic series among others [7]. Ignimbrites to the east of the Guanacaste cordillera and sandstone, marine sands, conglomerates, and turbidite beds in the south of the Nicoya Peninsula (Nicoya complex), the Caribbean and the Osa and Burica peninsulas identified in [4,7] are classified as with moderate potential in [42]. The stratovolcanoes of the Central cordillera and the quaternary deposits in the Northern and Tortuguero lowlands; the Tempisque and General valleys; and coastal Pacific and Caribbean shores are classified with high potential [42].

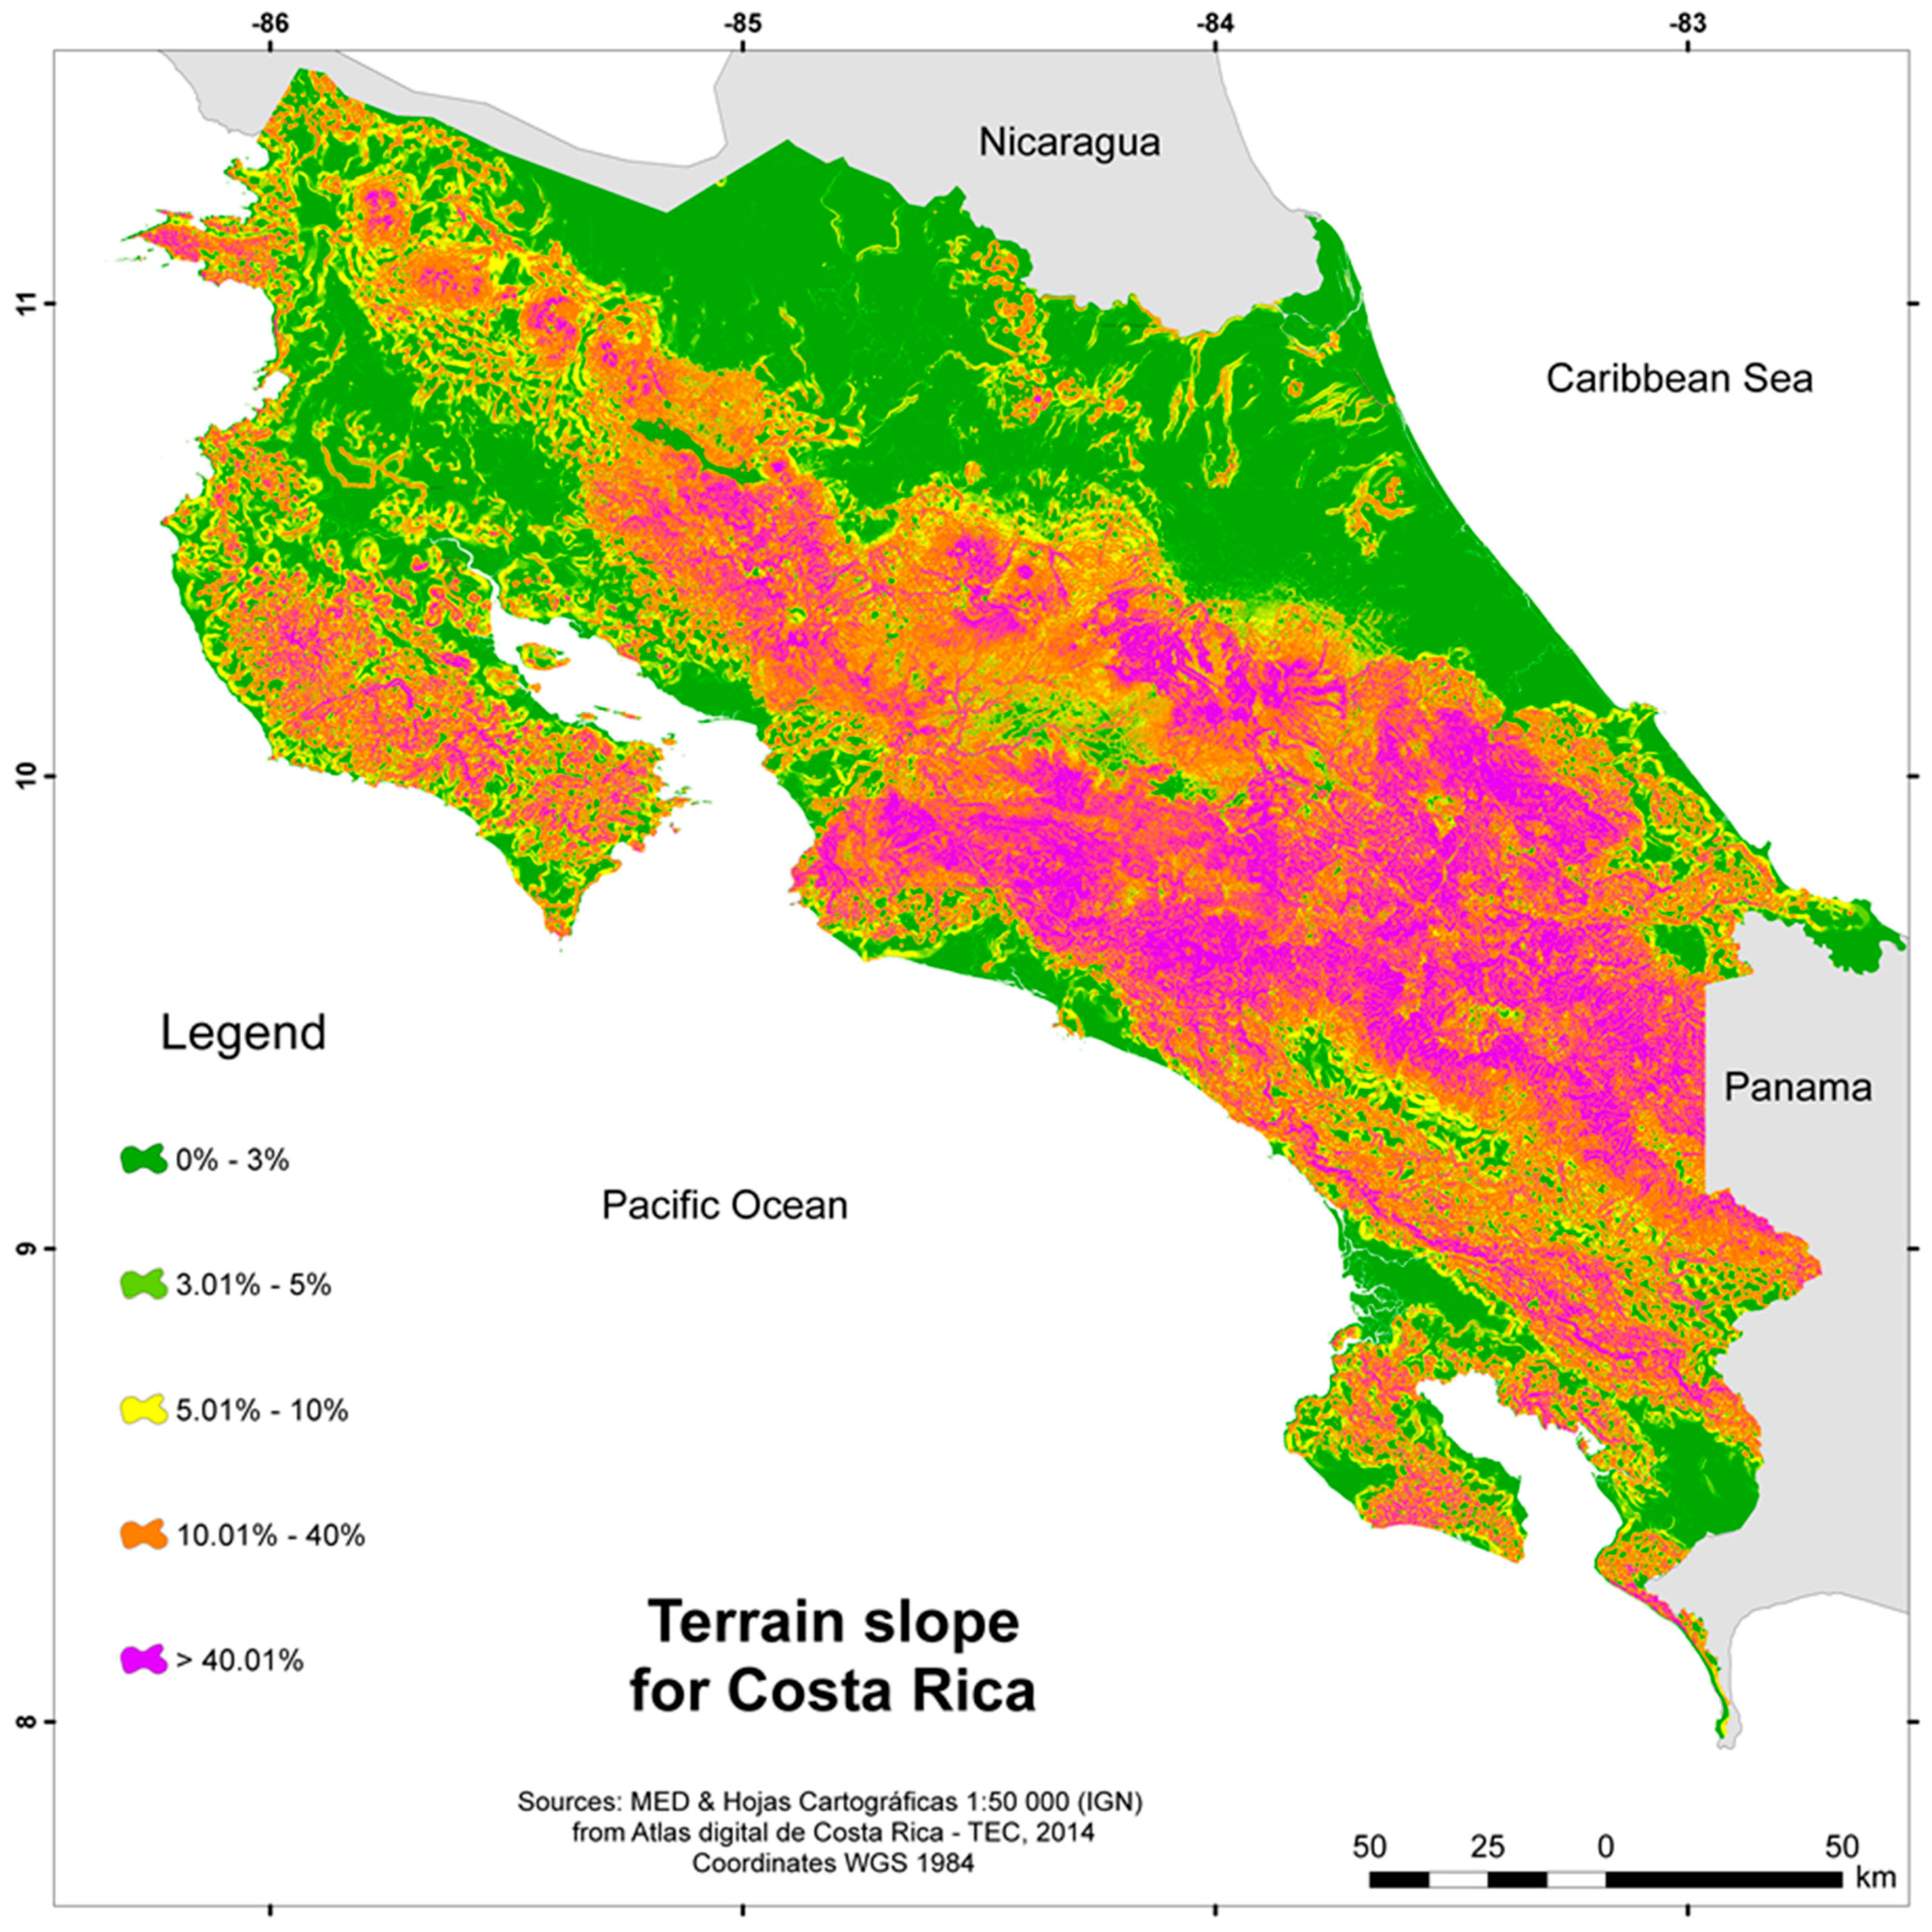
2.2.2. Terrain Slope

Mainly referred as slope in previous works, the terrain slope is one of the main criteria that control natural recharge in a basin water balance; it is considered the most important attribute of terrain topography governing groundwater infiltration [12]. The slope describes the inclination of a direct line between two landmarks and their respective heights. It is suggested [43] that under steady conditions with a rainfall rate much greater than the saturated hydraulic conductivity, the subsurface flow decreases with increasing slope angle. Thus, slope has a substantial influence on infiltration rates. Furthermore, water velocity is directly related to the terrain slope.
On steep slopes, runoff is more erosive, thus easily removing and transporting detached sediments down the slope [25]. Consequently, soil instability can occur. This could risk safety of an infiltration pond [32]. Moreover, steeper slopes do not permit the implementation of infiltration basins. Therefore, gentle slopes (<5%) increase infiltration rates and are suitable for aquifer recharge [12], while high slopes have poor groundwater infiltration conditions, thus are unsuitable for SM [19]. The slope classification for the country presented in Figure 3 is based on the Digital Elevation Model (DEM) with a 30 meter pixel size published in the Costa Rica Digital Atlas by the Tecnológico de Costa Rica (TEC) [44].

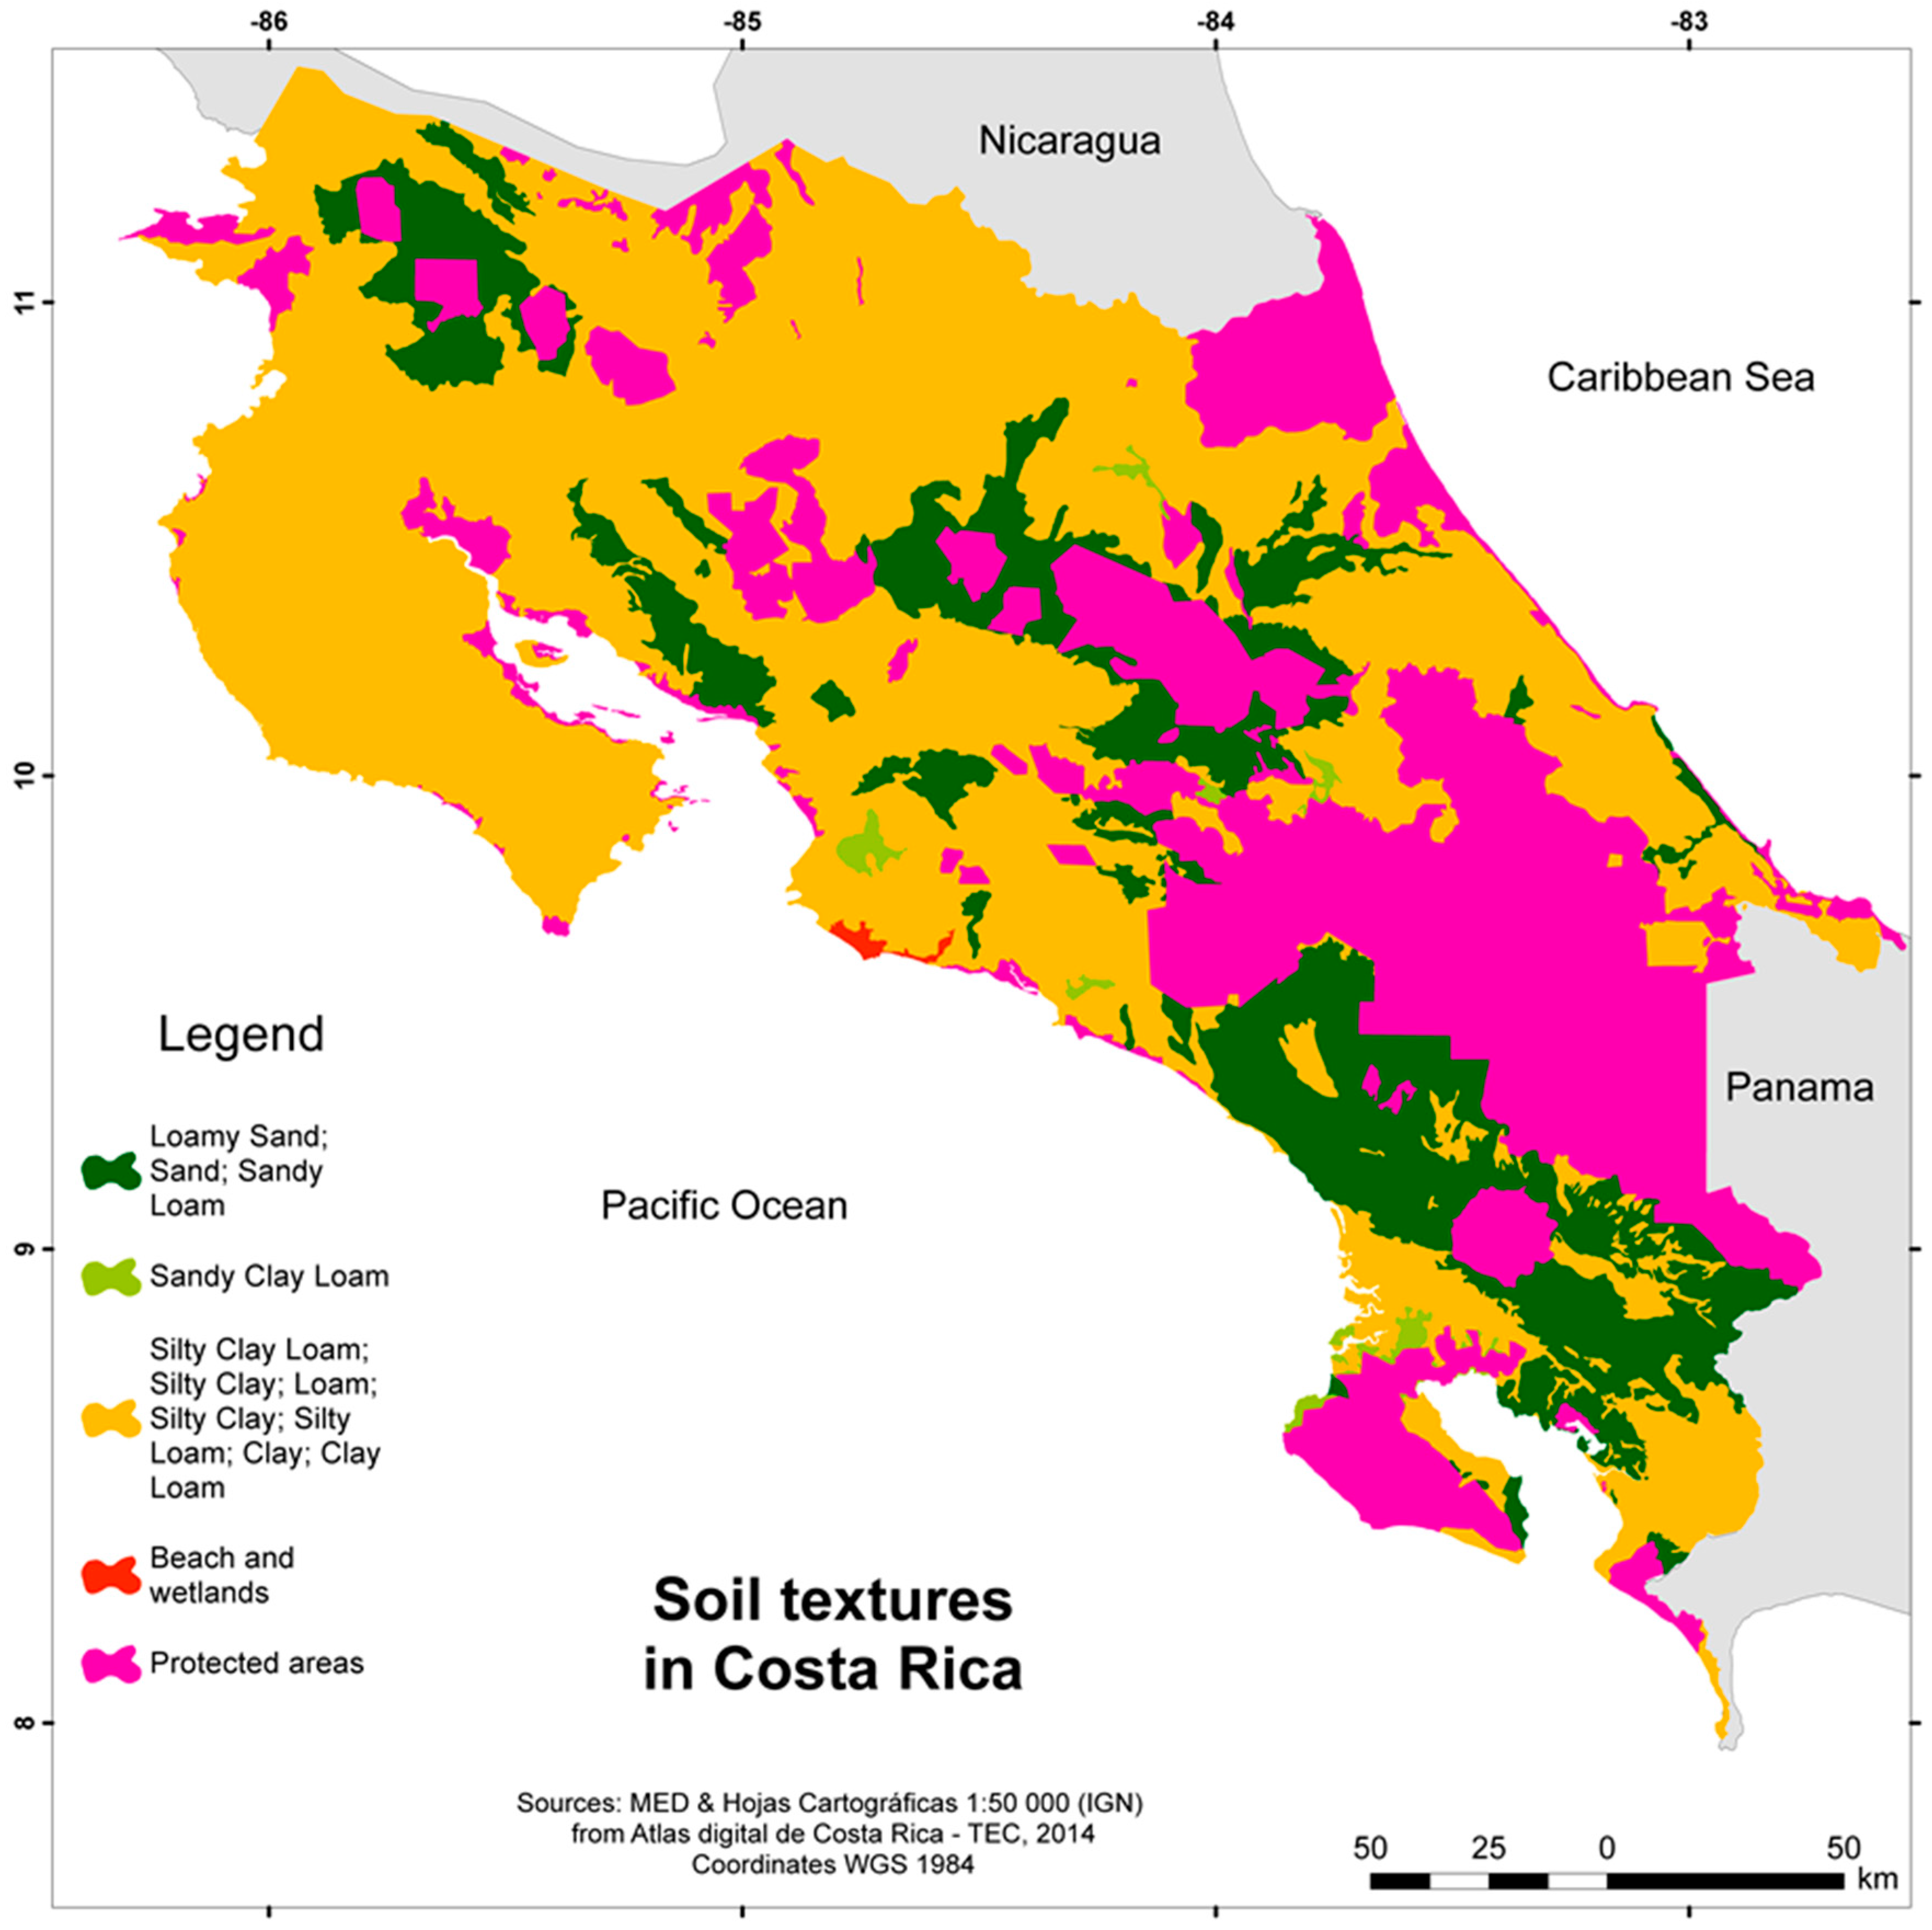
2.2.3. Top Soil Texture

Soils texture was identified as the main influence parameter of the soil capacity to support infiltration of water into the subsurface [20,22]. Coarse-texture soils (such as sands) have large pores that facilitate water drainage in contrary to the fine pores in clay that retard drainage [45]. The higher the clay content in the soil, the lower the permeability (thus inhibiting the infiltration). Therefore, a low clay fraction (<10%) is favorable for infiltration [32]. The soil data collected by the Ministerio de Agricultura y Ganaderia of Costa Rica (MAG) at 1:500,000 scale digitalized by TEC [44] is shown in Figure 4 with the respective soil texture classes.

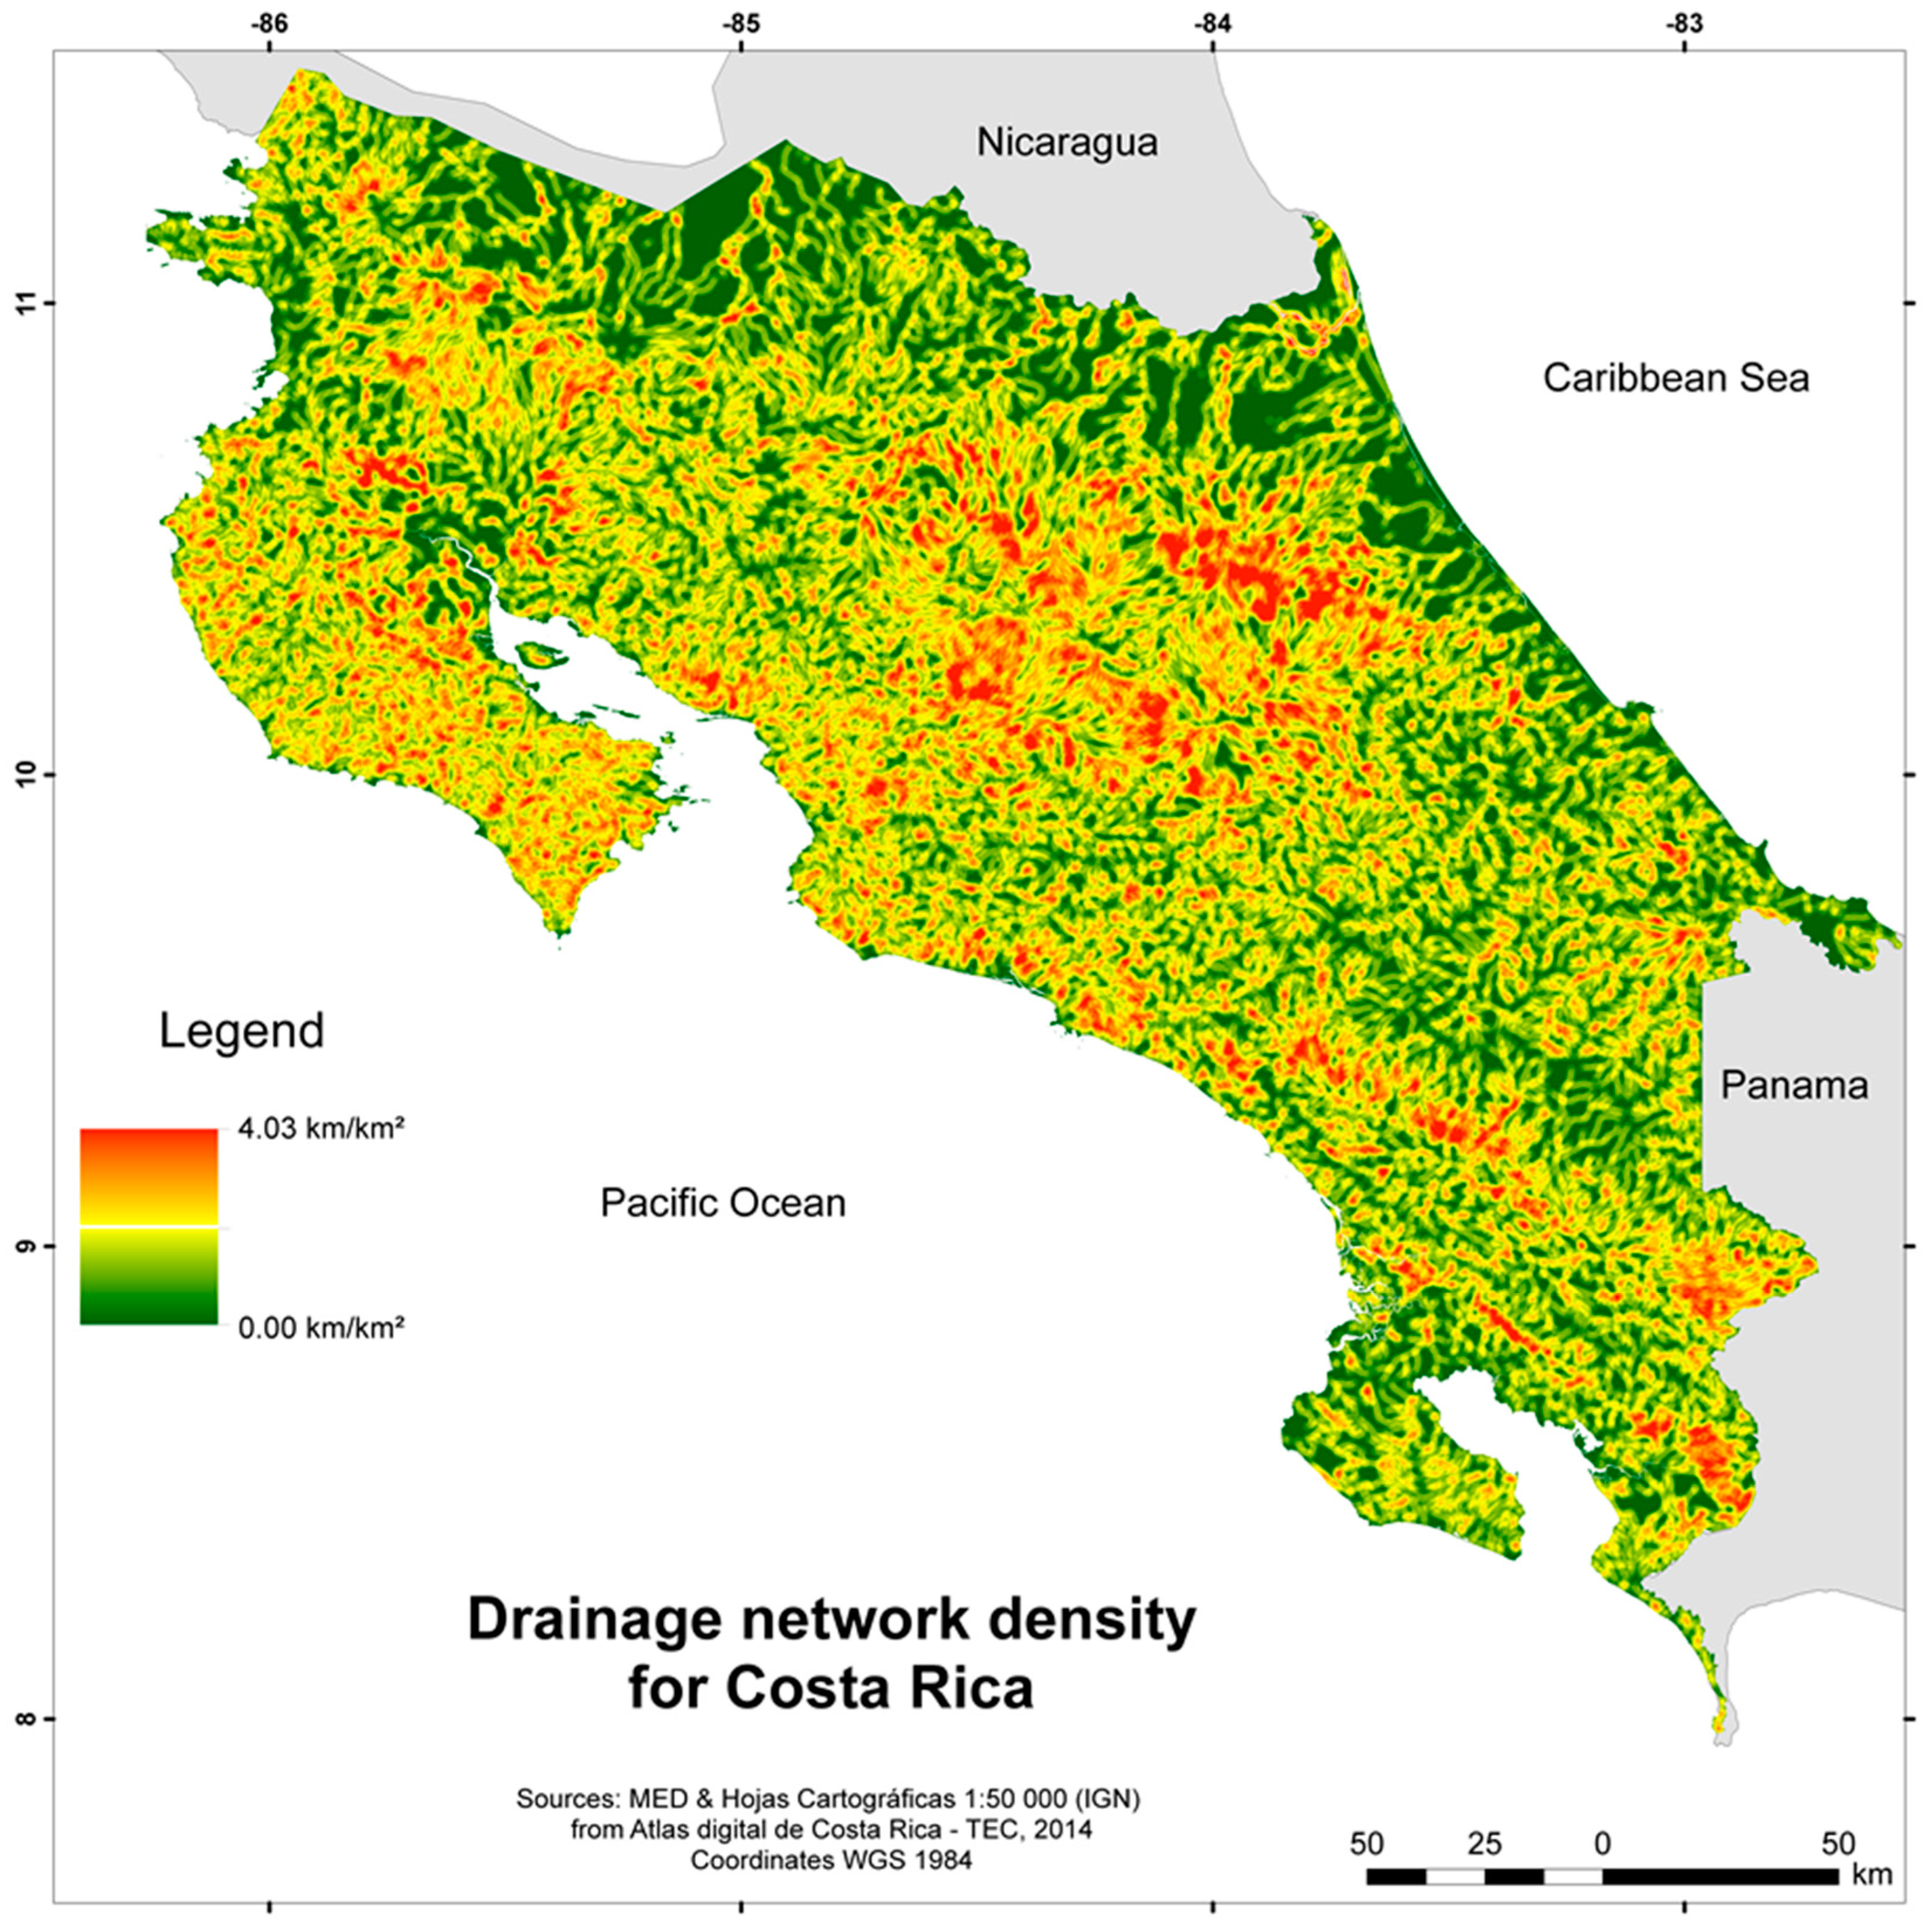
2.2.4. Drainage Network Density

According to Shaban et al. [39], one of the most important morphometric properties of a drainage system is the drainage density. Drainage network density or drainage density is an indicator for the natural infiltration of a terrain—a higher drainage network density reflects a higher runoff, hence less infiltration; or as stated in [39] the denser the drainage network, the lower the recharge rate. Infiltration depends upon surface runoff and permeability [17]; less permeable soil formation allows less infiltration whereas permeable ground leads to a low drainage density. Thus, areas with low drainage densities are considered favorable for MAR. Drainage network density is calculated from the division of the length of all the rivers in the basin divided by the area of the basin [45].
The river network was obtained from the cartography maps (1:50,000) compiled by the Costa Rica National Geographic Institute. Small inconsistencies—such as hydraulic structures, channels, aqueducts, and river banks in the original maps were removed before further processing the river networks, in order to obtain rivers consisting of only one line per river. The drainage network thematic layer is presented in Figure 5.

3. Results

In this GIS-MCDA analysis, the problem is defined as the identification of sites with the best intrinsic conditions for SM in Costa Rica based on four criteria. The main result of this work is the suitability map presented in Section 3.4 (3.4. Suitable Areas).

3.1. Screening of Suitable Areas

Two criteria were considered for the screening of suitable areas: terrain slope and soil texture. According to the Costa Rican Forest Law 7575 [46], terrains with a slope higher than 40% are considered steep terrains. Also soils in a protected area are not available to any other activity other than conservation purposes (Organic Environmental Law 7554 [47]) and have no soil texture information as well. Soils falling into wetlands and beach classes are also excluded from further analysis in the screening process.
Suitable areas are considered regions where the terrains have a slope lower than 40% and with any soil type other than protected areas, wetlands and beaches. These areas were assigned the value of 1 while all other areas were assigned a value of 0. Both thematic layers are joined by an “OR” connector. This means that only when both values are 1, the screening map will obtain a value of 1. In any other combination, the assigned value is 0, thus, rendering the area not suitable for SM. The final screening map is shown in Figure 6, where suitable areas are shown in blue and unsuitable areas in grey.
The results indicate that more than half (61.0%) of the country’s surface is suitable for direct surface recharge techniques. It can be appreciated in Figure 6 that the Northern and Tortuguero lowlands, as well as the Tempisque River Valley and the Nicoya Peninsula present the majority of available areas. Also along the Caribbean and Pacific coast and the Central and General valleys some large areas are identified as suitable. It is important to point out that more than a quarter of the country is under some kind on protection, thus, only conservation and investigation activities are allowed. The main mountain ranges systems (Guanacaste, Central, and Talamanca cordilleras) are excluded both due to their steep terrain and protection category.

3.2. Standardization

The four thematic layers were standardized in order to be implemented in the WLC. Step-wise functions are used for the hydrogeological aptitude and soil texture; for the terrain slope, a series of linear functions between the threshold values was used, and for the drainage network density a linear function throughout the range of the criterion values was used. Figure 7 shows the graphics for the standardization of each criterion. A short description of each criterion and their threshold values are given.
The step-wise function is used for the hydrogeological aptitude maintaining the original classification (see Figure 7). Areas classified in [42] as without potential are assigned a value of 0; while areas with high, moderate, and low potential are equally distributed between 0.0 and 1.0. High potential areas are assigned a value of 1.0, moderate potential areas are assigned a value of 0.67, and low potential a value of 0.33. It is important to keep in mind that areas classified as “without potential” can still hold aquifers (e.g., fractured aquifers) [42].
Several different approaches to classify the suitability of the slope are available in the literature [12,16,17,18,19,21,22,23,25,26,27,28,29,30,31,32,33,34,41]. The linear function for the standardization of the slope is used in [12,41], all the others use the step-wise function (slope classes). A slope from 0 to 3% is considered optimum for infiltration schemes followed by three more classes (3% to 5%, 5% to 10%, and above 10%) [17,21,22]. Based on these classes, three breaking points are chosen for the terrain slope: from 0 to 3% a value of 1.0 is assigned, the next breaking point is at a slope 5% with a value of 0.67 and 10% with a value of 0.33, finally, values above 30% are assigned a value of 0.0. The standardization is given in Figure 7b.
The soil texture classification used is based on [20,22,30]. As it is shown in Figure 7c, the first class consists of sandy soils as sand (S), loamy sand (LS), and sandy loam (SL) which represent “High” infiltration capacity, thus a value of 1.0 is assigned. Sandy clay loam (SCL) is assigned a value of 0.67; clay loam (CL) and loam (L) a value of 0.33; and “Unsuitable” soils, which consist of sandy clay (SC), clay (C), silty clay loam (SiCL), silty loam (SiL), and silty clay (SiC) are assigned a value of 0.0.
The drainage density indicator is standardized using a step-wise function in [17,19,21,22,29]. The classification system used in [17,21] ranges from “good” or “excellent” (0–0.75 km/km2) to “poor” (>2.5 km/km2), with class limit increments of 0.75. Slightly lower limit values between the classes are given in [22], ranging from 0 to 0.5 km/km2 as “good” to above 1 km/km2 as “poor” and class limit increments of 0.5. In [19] a drainage density under 2 km/km2 is considered favorable for MAR. A lower drainage network density category is used in [29] where values higher than 1 km/km2 are unsuitable for MAR. All the classification systems discussed show linear increments in the class limits. Based on the linear distribution of the limits and the fact that the drainage network density is an indicator of terrains with good infiltration rate, but not of unsuitable infiltration sites, a linearization was done (see Figure 7d): a value of 1.0 was assigned to a 0 km/km2 drainage network density and 0.0 to the maximum drainage network density (4.03 km/km2).

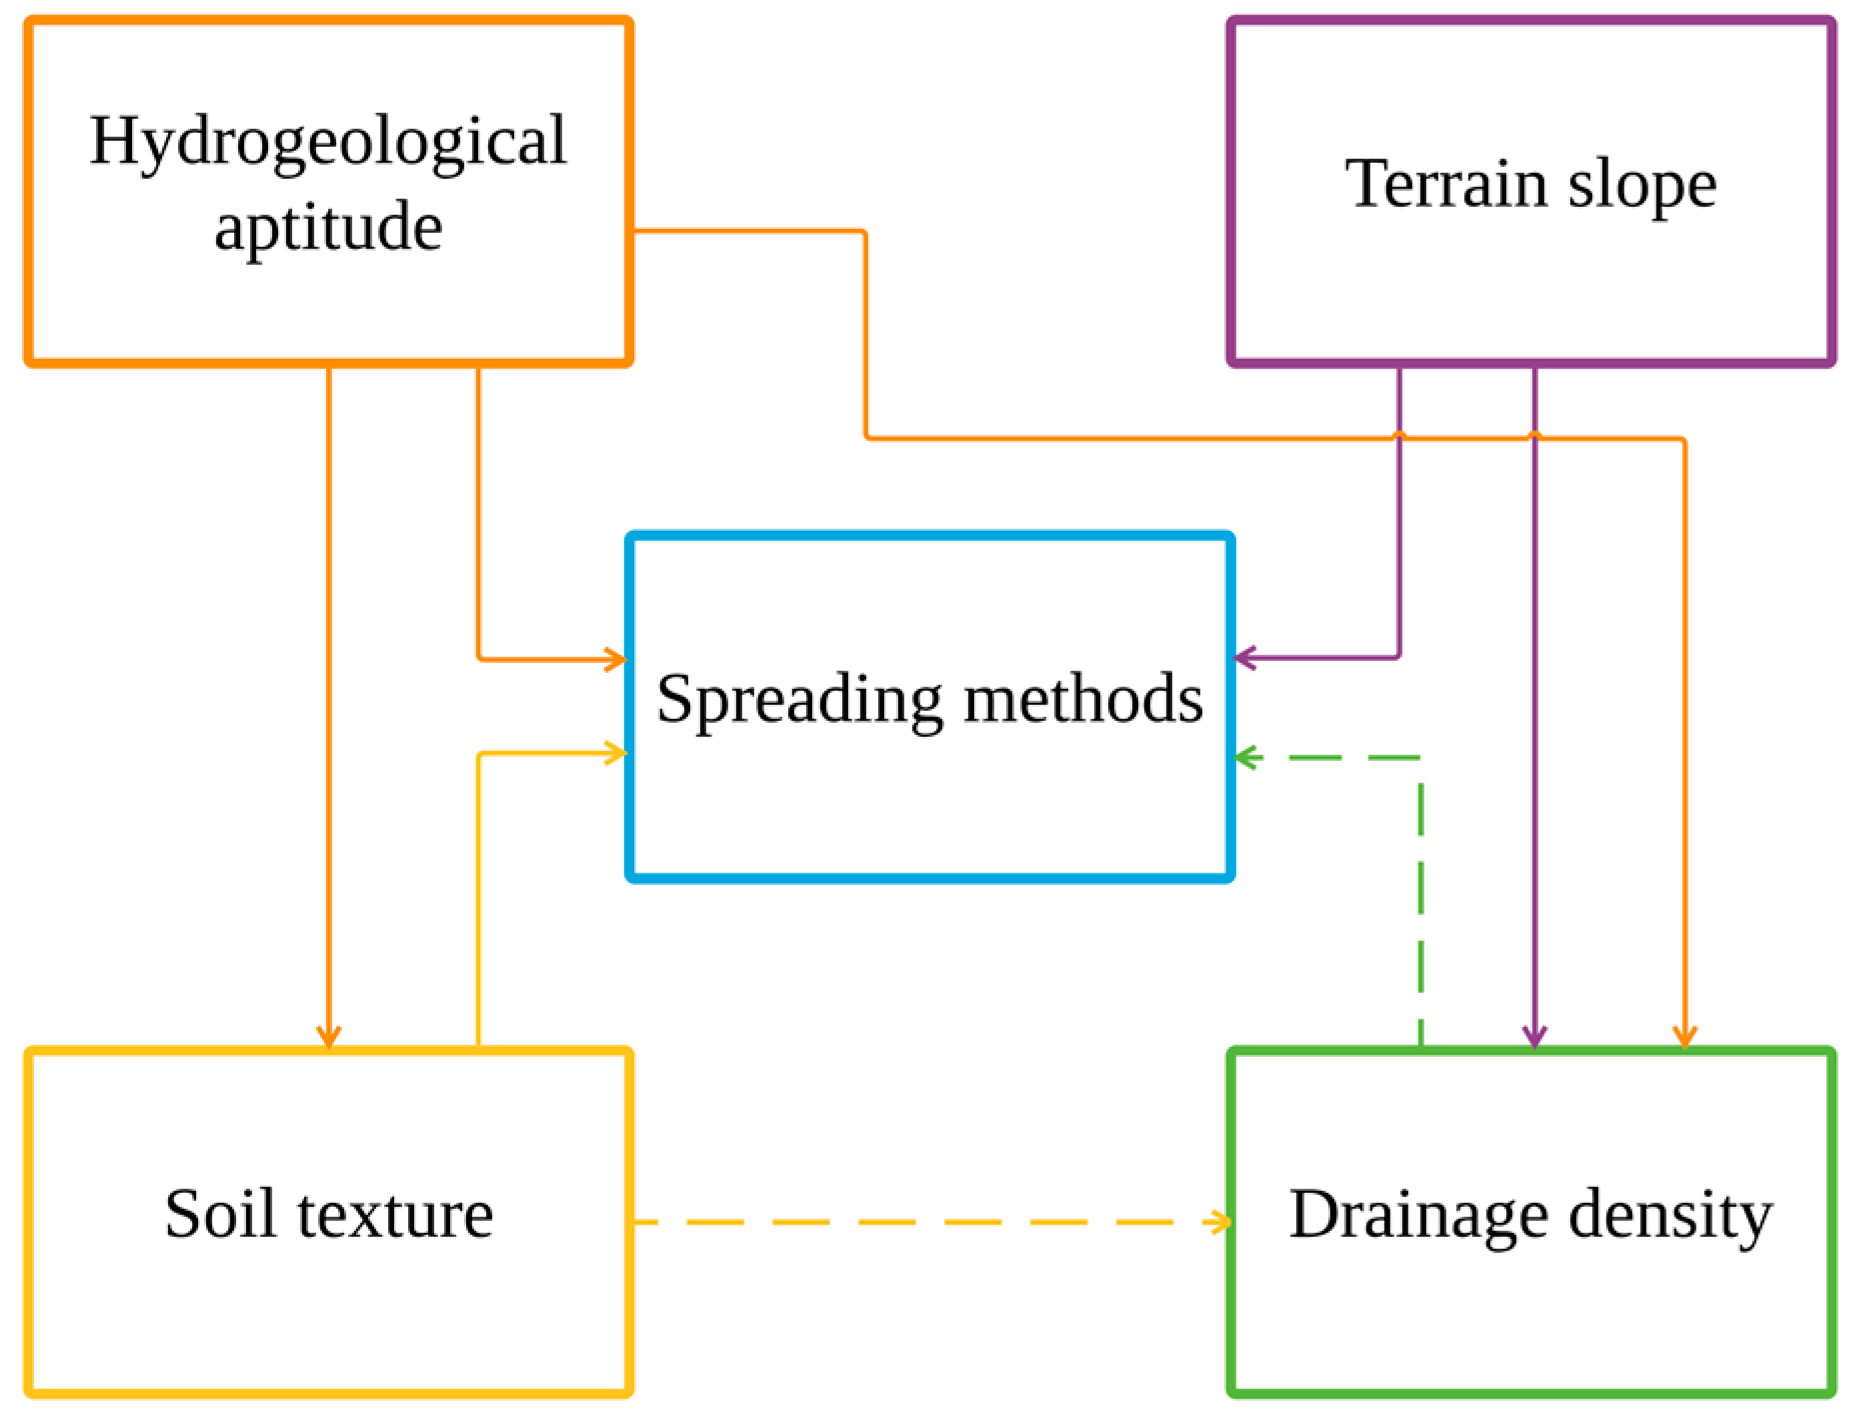
3.3. Multi-Influencing Factor (MIF)
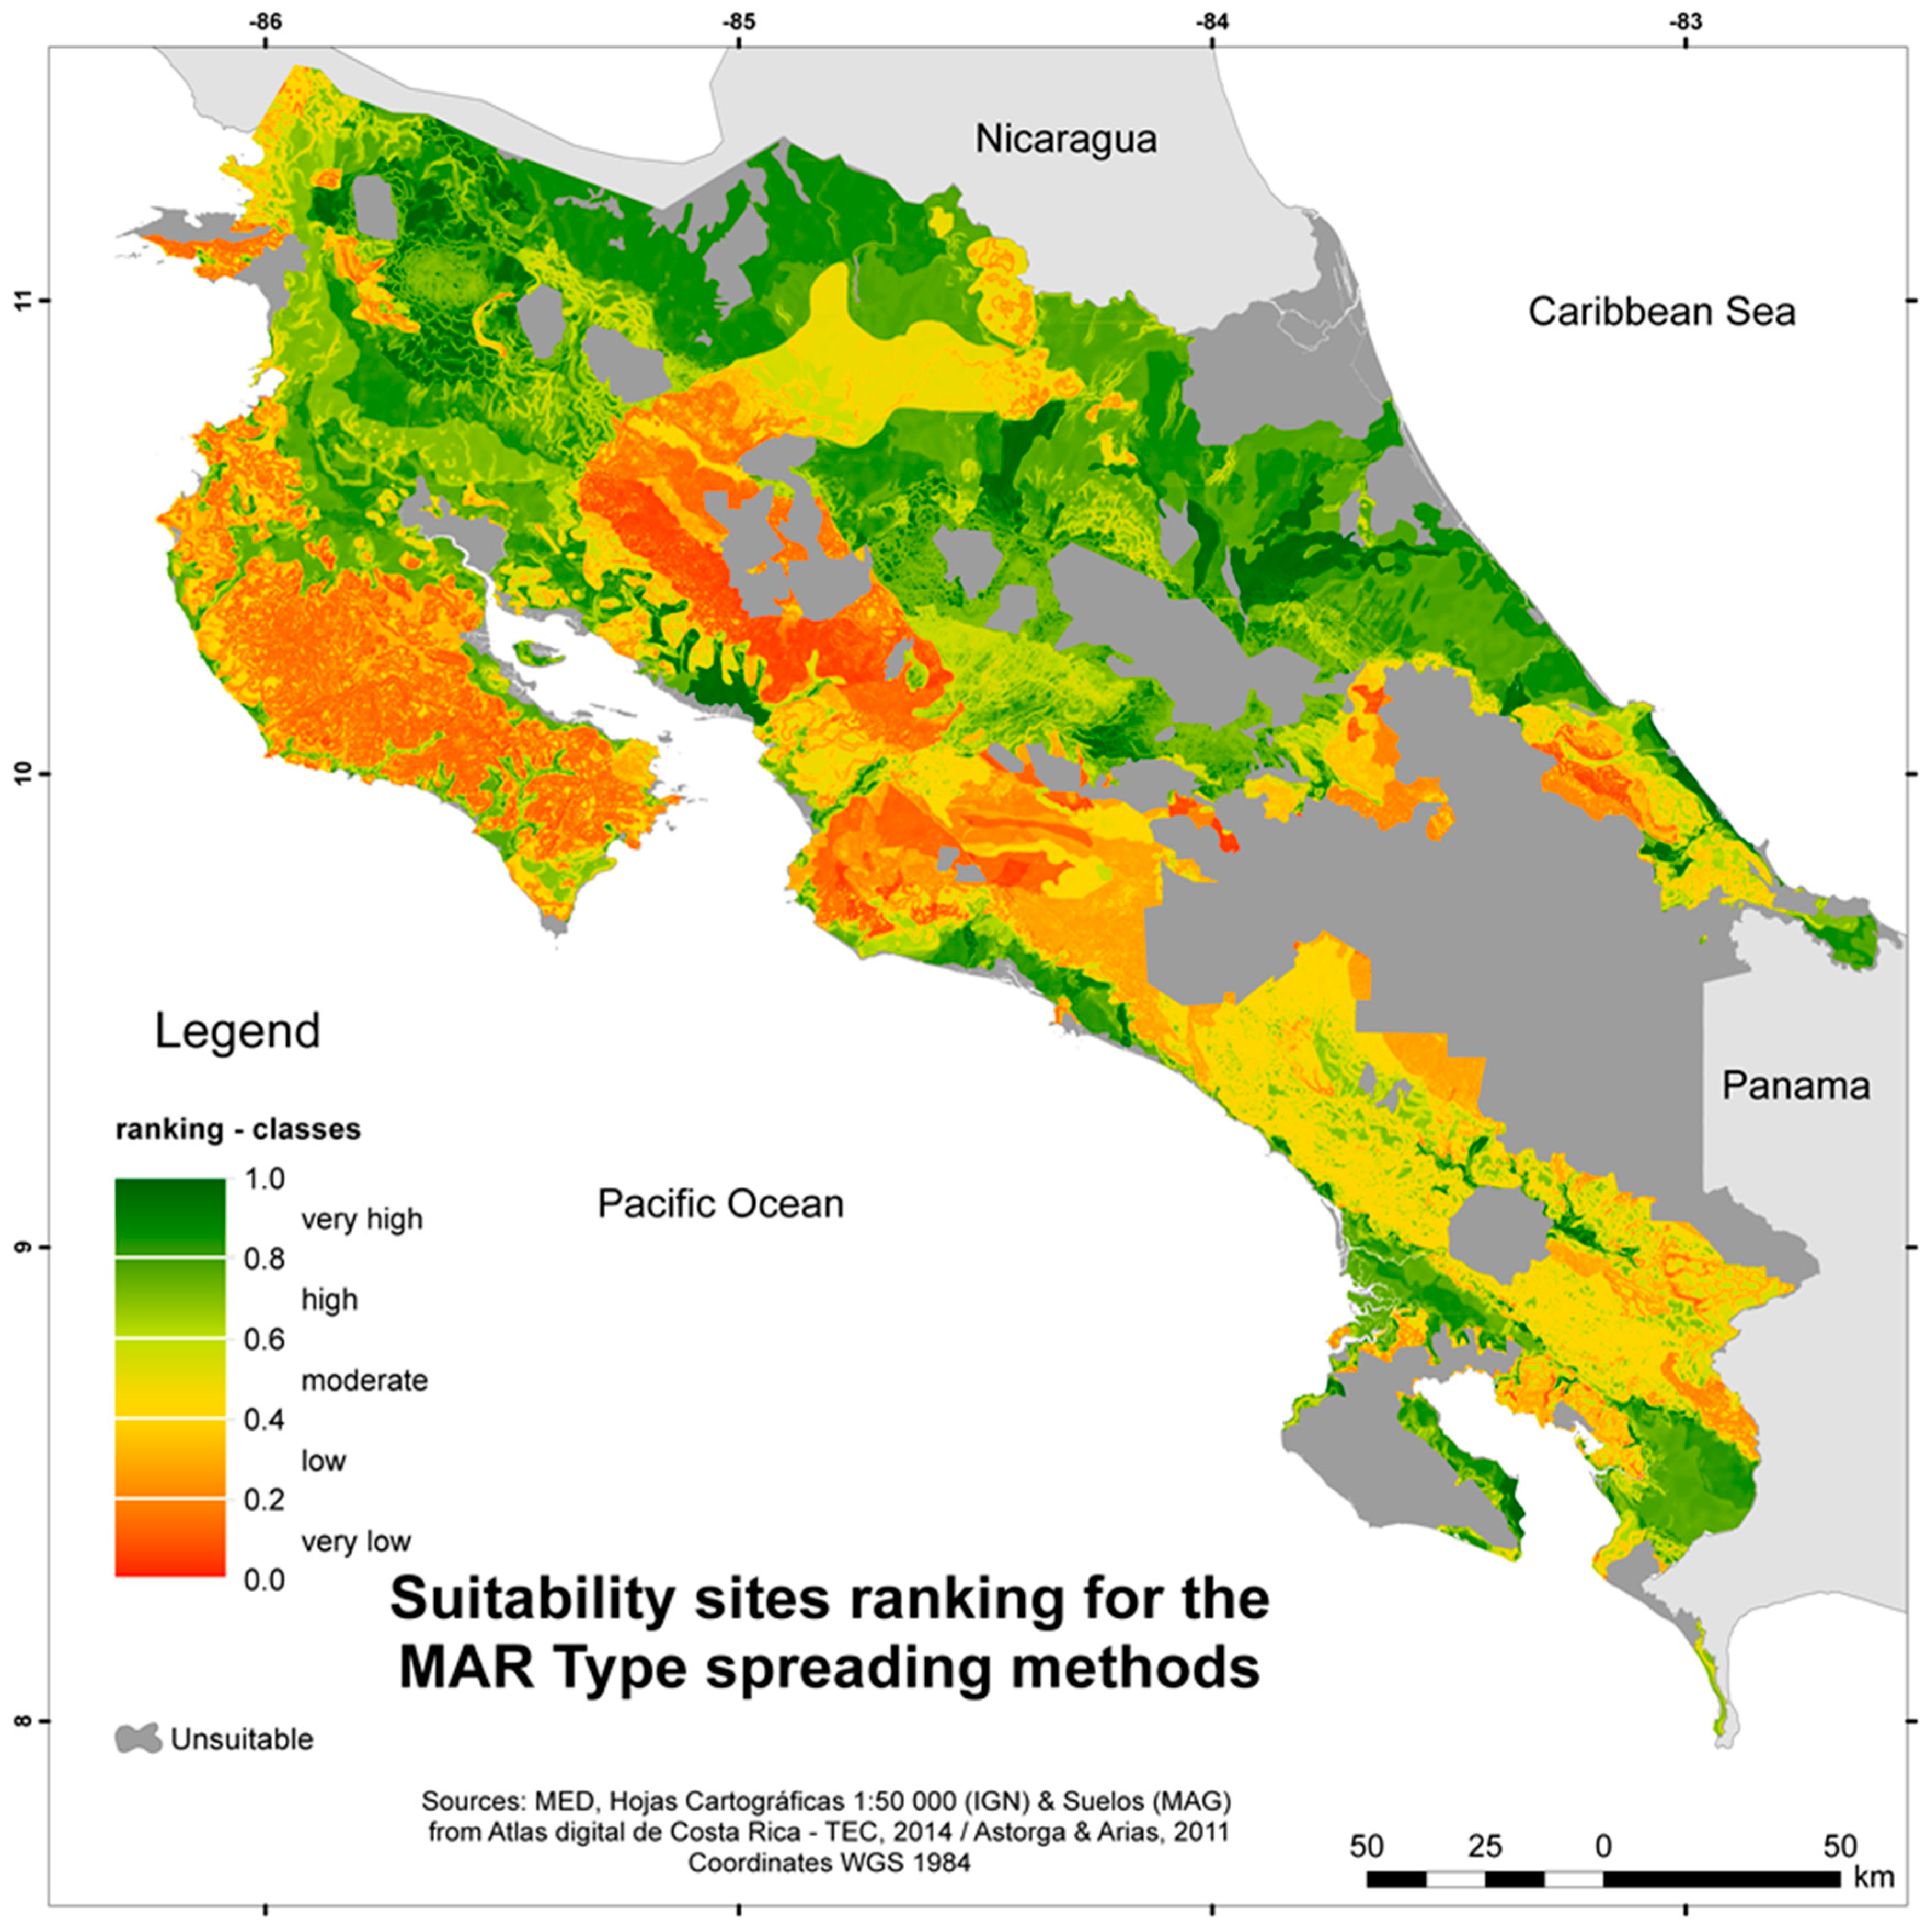
According to the MIF methodology, the more influence a criterion has on the other criteria and the objective, the higher is its score and higher the weight obtained. A total of six major effects and two minor effects where identified between the criteria (as well as between the criteria and the objective) and visualized in the diagram in Figure 8. The total cumulative score of 7 points is presented in Table 1 as well as the computation of the weights by the MIF method.
The hydrogeological aptitude criterion has three major effects: on the soil texture, on the drainage network density, and on the recharge process; the major effect on the soil texture is explained as the soil type is decisively influenced by the geologic parent material [42] while the major effect on the drainage density is due to the fact that the geology influences the development of river networks [21,22,39]. The terrain slope has two major effects: on the drainage network density and on the recharge itself; the steeper the slope, the higher is the drainage density in an area [22]. Soil texture has a major effect on the recharge process as well as minor effects on the drainage network density through erosion and deposition processes [21,22]. Drainage network density is considered as an indicator of the infiltration capacity of a specific area, thus, it only has a minor effect on the recharge process.

3.4. Suitable Areas

WLC is used in this work to overlay the criteria in order to identify and rank suitable sites for SM. The direct result of the WLC is shown in Figure 9, where the previously screened suitable areas (see Figure 6) are assigned values from 0 to 1 according to the WLC (color range from orange to green). The screened out or unsuitable areas in Figure 6 are also presented in grey in Figure 9.
For a better interpretation of the identification of suitable areas for conducting the SM, the WLC map was categorized into five suitability classes according to the ranking value—the range is inside the parenthesis: “very high” (1.0–0.8), “high” (0.8–0.6), “moderate” (0.6–0.4), “low” (0.4–0.2), and “very low” (0.2–0.0). The percentage of both the suitable and total country area by class is shown in Table 2.
Areas classified as “very high” and “high” suitable for SM in Costa Rica represent almost half of the suitable area previously screened in Section 3.1. This constitutes more than 30% of the total country area. “Moderate” suitable areas constitute more than one-fifth of the suitable area (13.5% of the total country) and areas classified with “low” and “very low” suitability constitute 28% of the suitable areas, which represents 17% of the total country area.
The Northern and Tortuguero lowlands still present most of the “very high”, “high”, and “moderate” areas in the country, while the Nicoya Peninsula is considered as having “low” and “very low” suitability as it is covered mainly by the Nicoya complex formation. Still, both banks of the Tempisque River are considered in the Northern Pacific with “very high” and “high” suitability. In the Caribbean coast, some areas are classified under the “very high”, “high”, and “moderate” suitability classes near the coast, but they change into “low” and “very low” when moving from the inland to the south. This behaviour is observed also in the Pacific coast where the lowlands fall into the “moderate” suitability category. The General valley mostly presents areas of “low” suitability for SM.

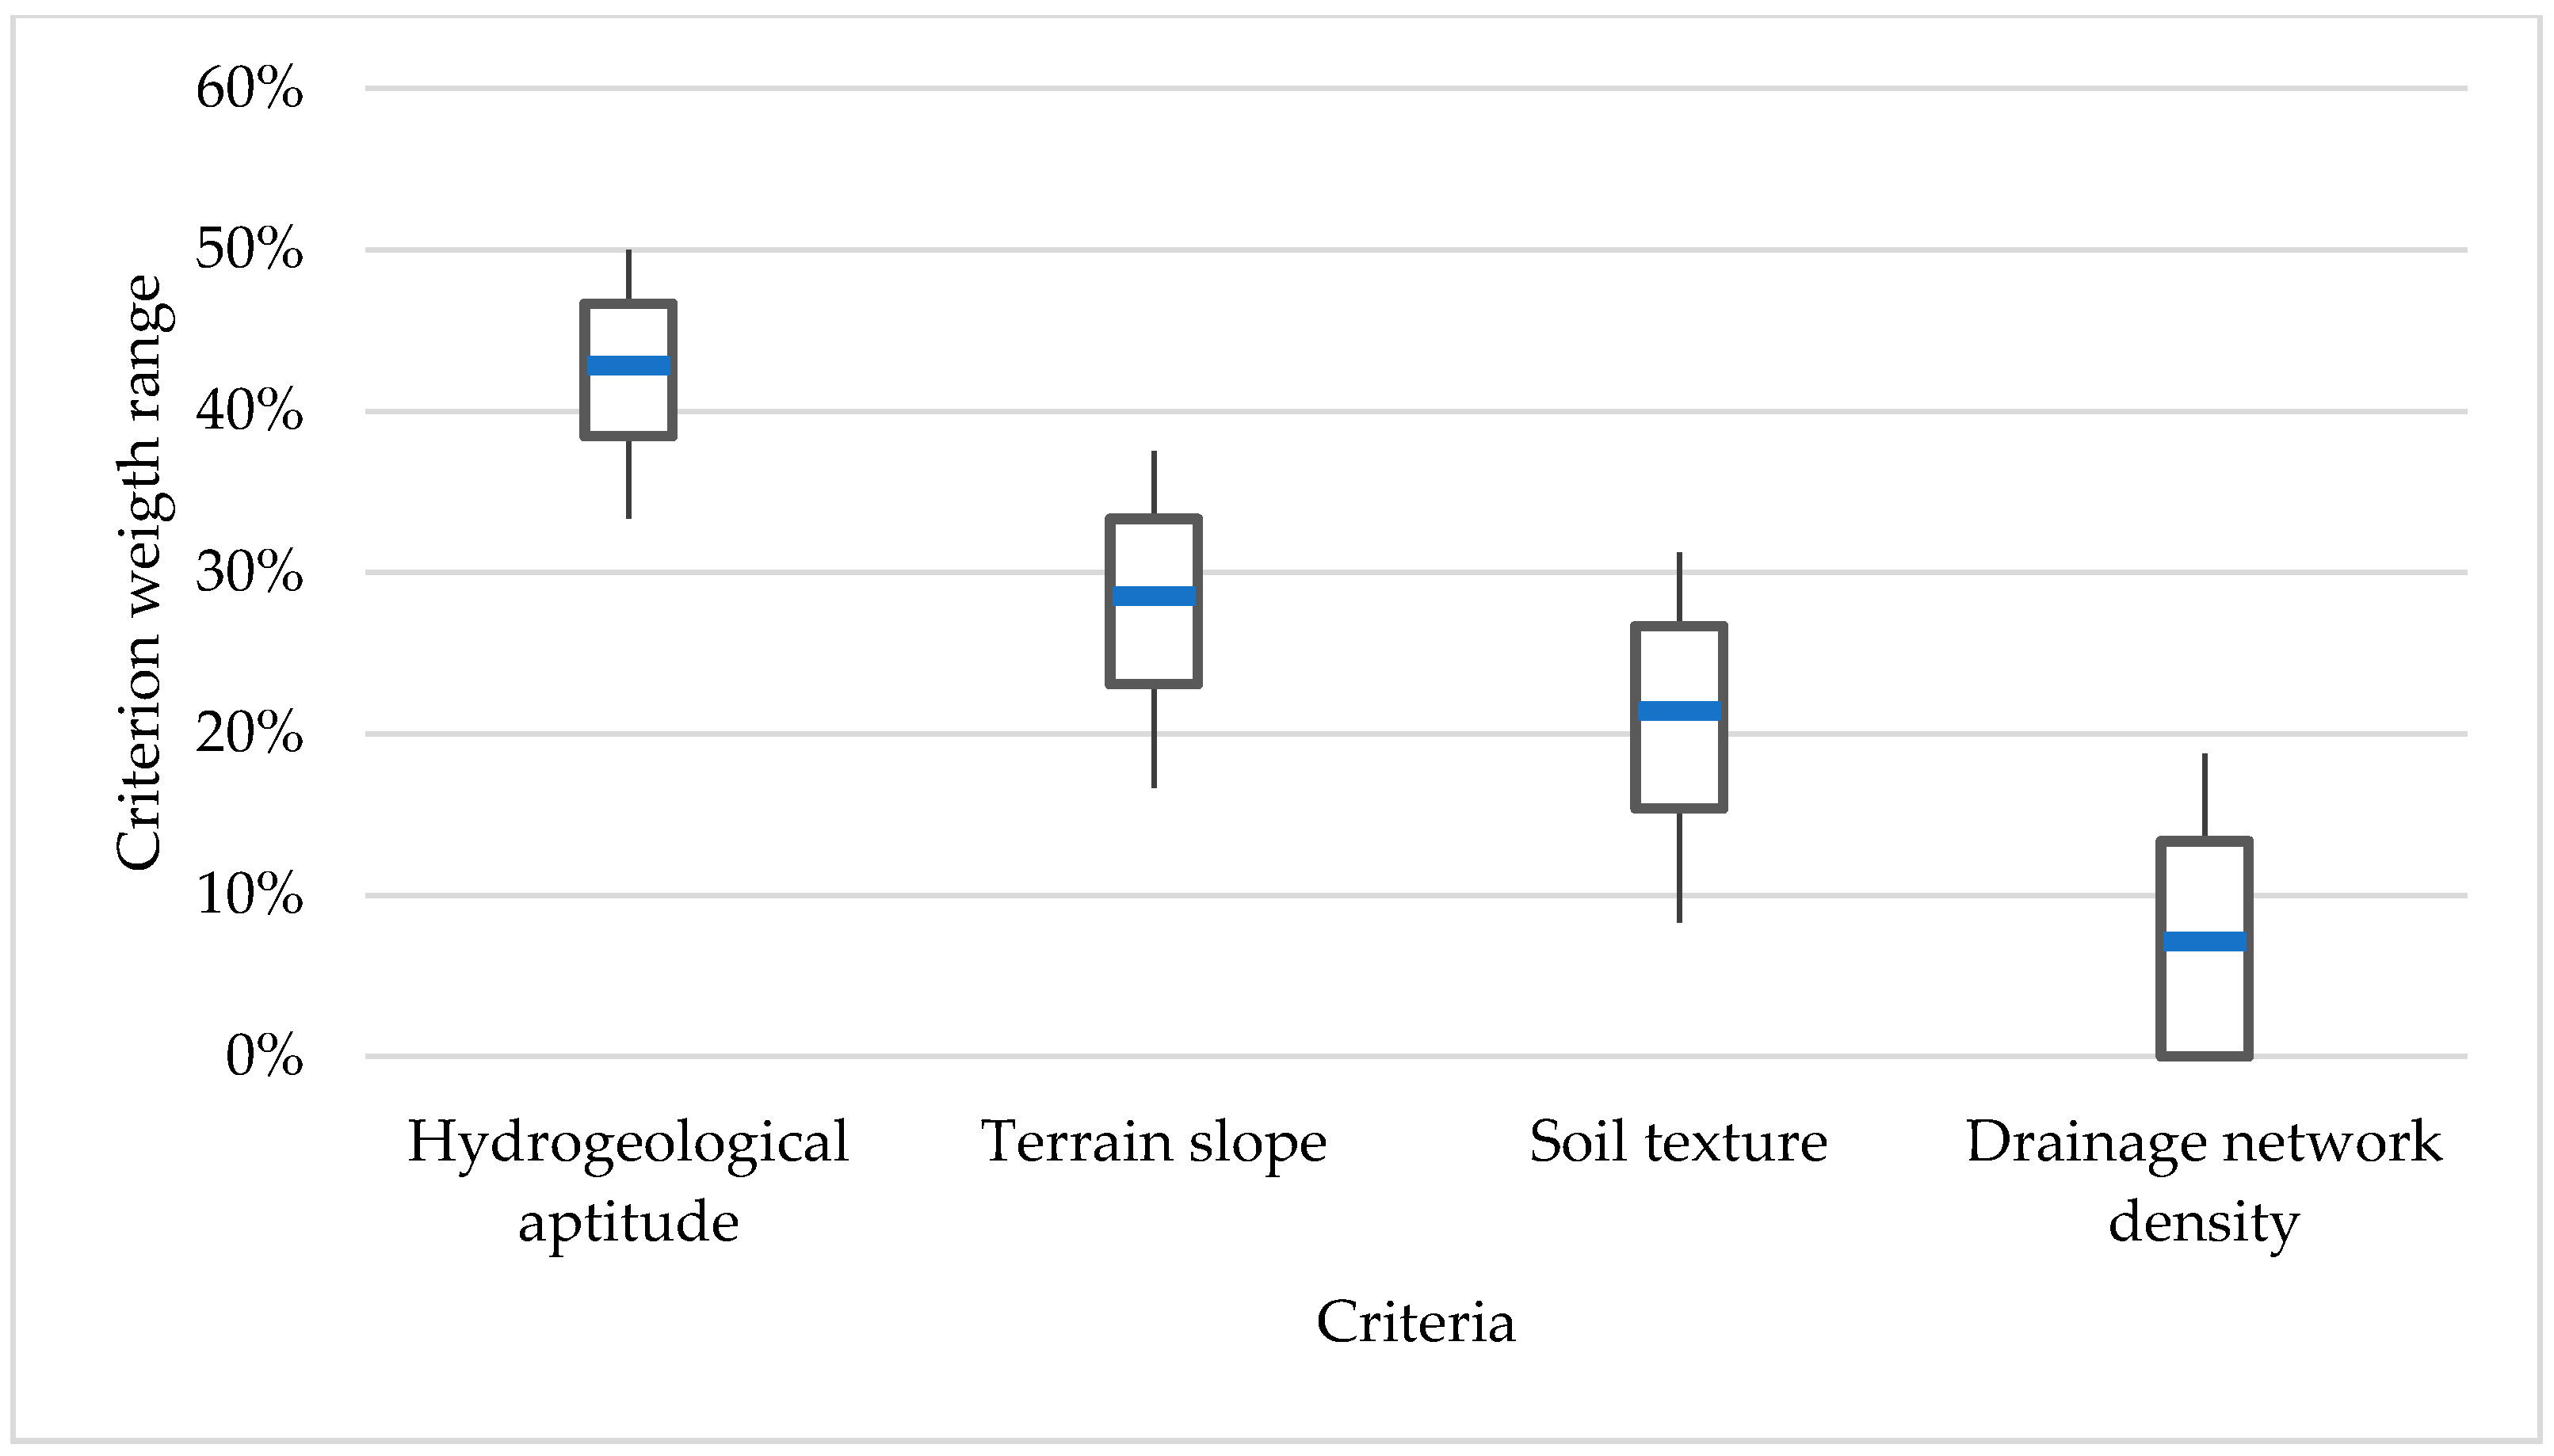
3.5. Sensitivity Analysis

The value range of the criterion weight by adding or erasing relationships in the MIF method is shown in a boxplot diagram in Figure 10. The original criterion weight obtained by the MIF method in Section 3.3 is presented as a blue line inside the boxplot, the new value for each criterion obtained by adding or erasing a minor effect are represented through the box and the major effects via the whiskers (extending vertical lines from the boxes) in Figure 10.
By adding or erasing one minor or one major relation between the criteria in the MIF method, a total of eight scenarios with different decision rules are obtained. The changes in the weight of one criterion affect all the other criteria, thus, adding a relation to a criterion increases its weight and decreases all the other criteria weights, and the opposite occurs when one relation is erased. The eight scenarios are compared with the original reclassified WLC and the analysis is done by the areas that shift between classes.
The switch of classes or the percentage of the areas that change from one class to another is given in Figure 11 for each scenario, by adding and erasing one minor relationship. This change can be in any direction or not at all (e.g., no change)—the last being the ideal situation. Figure 12 shows the spatial distribution of the classes switch. A switch from a class with lower suitability to a higher suitability class is called a positive switch and from a higher suitability class to a lower is called a negative switch. Positive and negative switches are used in a directional context and not in a qualitative context: a suitability change from very high to high is a negative switch, but is not necessarily considered as a completely negative impact in the decision making.
In Figure 11 and Figure 12 the “+” sign (a–d) stands for adding a minor effect and the “−” for erasing a minor effect (e–h), whereby HA represents the change in hydrogeological aptitude (a,e), TS in terrain slope (b,f), ST in soil texture (c,g) and DD changes in drainage density (d,h). The sensitivity analysis shows the hydrogeological aptitude as the criterion with less classes switch either by adding or erasing a minor relationship in the MIF, with the “no change” scenario representing 93.1% (a) and 94.5% (e) of the analyzed area, respectively. Hydrogeological aptitude is the criterion with the highest weight (see Table 1 and Figure 10).
There are six scenarios where there is no change in the classes in more than 90% of the analyzed area (Figure 11a,c–f,h). The two scenarios where the switch between classes is higher than 10% (ergo no change under 90%) are when a minor effect is added to the terrain slope criterion (11.2% in Figure 11b) and when a minor effect is erased from the soil texture criterion (29.4% in Figure 11g). In the last scenario (ST−), erasing one minor effect from the soil texture criterion, almost half of the switch is from high to very high suitability (14.4%) which is a positive switch. This is not considered as critical as the objective of the study is to point out the areas that offer the best conductions for conducting SM. In other words, this work is inclusive, it is done to further research the areas classified as with very high, high, and moderate suitability, instead of being exclusive, were the objective will be to exclude study areas.
The second highest switch is achieved when adding a minor relation to the terrain slope criterion (11.2% in Figure 11b) which is also an increase in the classes, with 7.5% of the area changing from low to moderate suitability. This positive switch is also not considered critical as this work is inclusive. Two other switches present values above 5% (Figure 11g,h); both represent a negative switch from moderate to low suitability and both occur in 5.7% of the analyzed area. They are achieved when erasing a minor effect of the soil texture criterion and the drainage density criterion. All other switches represent less than 4% of the analyzed area. Based on this analysis, the uncertainty of the assign weights by the MIF method is considered acceptable.
In all the scenarios, the switch between classes is distributed all over the country (see Figure 12). The distribution of the switch classes is reciprocal within the criterion; they tend to be opposite for each pair scenarios per criterion, e.g., positive switch (blue regions) in Figure 12a turn to negative switch (green) in Figure 12e and vice versa. The reciprocal effect is a correspondence on a regional scale and not a “one to one” relationship per pixel.
The geographical distribution of the class title “without potential” for the hydrogeological aptitude criterion (see Santa Elena and Nicoya peninsulas in Figure 2) can be identified in Figure 12a,e. When a minor effect is added to the hydrogeological aptitude (HA+), the weight of the criterion increases, causing a negative switch in the mentioned region in Figure 12a. This is because this region has a value of zero in the criterion due to the standardization process (Figure 7a). The same outcome can be seen in the mountain ranges of the Guanacaste and Central cordilleras with the terrain slope in Figure 12b,f where slopes in the range of 10% to 40% have the lowest values (see Figure 3 and Figure 7b).
The opposite occurs with a criterion characteristic with a high standardization value. The soil texture classes loamy sand, sand, and sandy loam concentrate in the General valley in the south of the country (see Figure 4). These classes are standardized with the higher value (1.0) within the criterion in Figure 7c. With the addition of a minor effect to the soil texture (ST+) the weight of the criterion increases, thus, areas with a higher value will show a positive switch as the General valley in Figure 12c. In Figure 12g, a predominance of negative switches in the same region can be noticed when a minor effect is erased (ST−).
The drainage density values are distributed all over the country (Figure 5) and no clear distribution can be observed in Figure 12d,h.

4. Discussion

The identification of the sites that present the best physical conditions in Costa Rica for the application of SM schemes is based on four criteria: hydrogeological aptitude, terrain slope, soil texture, and drainage network density. The results obtained in this study are an indicator of the suitability of an area in comparison to other areas in the country, but it does not mean that it is not possible to conduct infiltration schemes to increase the recharge in an area with a low ranking, e.g., “very low” or “low” suitability. It only means that it is plausible to have a better infiltration process in an area with a higher ranking.
Based on two criteria (terrain slope and soil texture), the suitable areas in Costa Rica for SM were screened. The suitable areas constitute almost two-thirds of the country’s area (61%). The suitable areas were grouped in five classes for a better interpretation. Most of the country is classified as “highly” suitable for SM (18% of the country, 29% of the suitable areas).
The areas with higher suitability for SM implementation are located in the Northern and Caribbean lowlands, as well as in the Tempisque River Valley in Guanacaste, the former being also the region with most water scarcity problems reported in the last decade in the country [2]. Other areas with high suitability to hold recharge structures are in the Central and South Pacific coastal areas.
The suitability map is a tool for the decision maker, it should be used as a base map where other variables—such as water demand, availability of water resources, waste water facilities, etc. can be integrated to prioritized the sites for MAR implementation in Costa Rica. For example, this map can be used to identify the suitable areas for SM in a radius around the production wells of systems that need to increase their production in order to set the priorities for applying this method.
The scale and information used to assemble the suitability map is large and general, as it is the first attempt to classify and prioritize areas for further studies. Soil texture and hydrogeological aptitude maps limited in the working scale of the final map (both thematic layers were only available on a 1:500,000 scale); hence, this is the prevailing scale of the suitability map.
This map should only be used to emphasize the areas that possess the best physical characteristics for SM. Before any full-scale application is implemented, more precise and detailed information is needed, as well as working on a more appropriate scale, which will depend on the scope of the subsequent studies.

Acknowledgments

This work was partly funded by the Programa de Innovación y Capital Humano para la Competitividad (PINN) of Costa Rica through a fellowship grant provided to José Pablo Bonilla Valverde and by the German Federal Ministry of Education and Research through a research grant provided to the Junior Research Group INOWAS, project No. 01LN1311A. We acknowledge support by the German Research Foundation and the Open Access Publication Funds of the TU Dresden. The authors would also like to acknowledge the contribution of M.Sc. Mario Arias who facilitated the hydrogeological aptitude map, as well as the Ministerio de Agricultura y Ganaderia de Costa Rica (MAG) for the soil texture map.

Author Contributions

José Pablo Bonilla Valverde conceived and designed the general paper concept, analyzed the results, and wrote the first draft of the paper. Clemens Blank, Mario Roidt and Lisa Schneider processed the thematic layers and contributed to writing the Introduction and Materials and Methods. Mario Roidt provided additional revisions on manuscript. Catalin Stefan contributed to the conceptualization of the study and revised and provided feedback on the manuscript.

Conflicts of Interest

The authors declare no conflict of interest. The founding sponsors had no role in the design of the study; in the collection, analyses, or interpretation of data; in the writing of the manuscript, and in the decision to publish the results.

References

  1. Salguero, M.E.A.; Penón, M.L.; Li, S.A. Estado del conocimiento del agua subterránea en Costa Rica. Bol. Geol. Min. 2006, 117, 63–73. [Google Scholar]
  2. Quintero, J.S.; Flores, R.V. Aspectos Fisiográficos aplicados a un Bosquejo de Regionalización Geográfico Climático de Costa Rica. Rev. Tóp. Meteorol. Ocean. 2001, 8, 26–32. [Google Scholar]
  3. UNESCO. Balance Hídrico Superficial de Costa Rica. Período 1970–2002; Documento Técnico del PHI-LAC; UNESCO Office Montevideo: Montevideo, Uruguay, 2007; p. 55, illus, maps. [Google Scholar]
  4. Bundschuh, J.; Alvarado, G.E. Central America, Two Volume Set: Geology, Resources and Hazards; CRC Press: Boca Raton, FL, USA, 2007. [Google Scholar]
  5. Muñoz, A.C. Variación estacional del viento en Costa Rica y su relación con los regímenes de lluvia. Rev. Tóp. Meteorol. Ocean. 2002, 9, 1–13. [Google Scholar]
  6. Weyl, R. Geology of Central America, 2nd ed.; Gebrüder Borntraeger: Stuttgart, Germany, 1980. [Google Scholar]
  7. Tournon, J.; Guillermo, E.; Alvarado, I. Mapa Geologico de Costa Rica: Folleto Explicativo; Editorial Tecnologica de Costa Rica: Cartago, Costa Rica, 1997. [Google Scholar]
  8. U.S. Geological Survey (USGS). GTOPO30: GT30W100N40 2012; USGS: Sioux Falls, SD, USA, 2012.
  9. Dillon, P. Future management of aquifer recharge. Hydrogeol. J. 2005, 13, 313–316. [Google Scholar] [CrossRef]
  10. Gale, I. (Ed.) Strategies for Managed Aquifer Recharge (MAR) in Semi-Arid Areas; UNESCO IHP: Paris, France, 2005.
  11. Huber, A.; Scheibler, F. Development of a Catalogue on European MAR Sites—Documentation. Report DEMEAU Project. 2013, p. 60. Available online: http://demeau-fp7.eu/D11 (accessed on 30 April 2014).
  12. Rahman, M.A.; Rusteberg, B.; Gogu, R.C.; Lobo Ferreira, J.P.; Sauter, M. A new spatial multi-criteria decision support tool for site selection for implementation of managed aquifer recharge. J. Environ. Manag. 2012, 99, 61–75. [Google Scholar] [CrossRef] [PubMed]
  13. Malczewski, J. GIS and Multicriteria Decision Analysis; John Wiley & Sons: New York, NY, USA, 1999. [Google Scholar]
  14. Malczewski, J.; Rinner, C. Multicriteria Decision Analysis in Geographic Information Science; Springer: New York, NY, USA, 2015. [Google Scholar]
  15. Hostetler, S. Water Banking; Science for Decision Makers; Australian Government, Bureau of Rural Sciences: Canberra, Australia, 2007.
  16. Escalante, E.F.; Gil, R.C.; San Miguel Fraile, M.Á.; Serrano, F.S. Economic Assessment of Opportunities for Managed Aquifer Recharge Techniques in Spain Using an Advanced Geographic Information System (GIS). Water 2014, 6, 2021–2040. [Google Scholar] [CrossRef]
  17. Krishnamurthy, J.; Kumar, N.V.; Jayaraman, V.; Manivel, M. An approach to demarcate ground water potential zones through remote sensing and a geographical information system. Int. J. Remote Sens. 1996, 17, 1867–1884. [Google Scholar] [CrossRef]
  18. Saraf, A.K.; Choudhury, P.R. Integrated remote sensing and GIS for groundwater exploration and identification of artificial recharge sites. Int. J. Remote Sens. 1998, 19, 1825–1841. [Google Scholar] [CrossRef]
  19. Shankar, M.N.R.; Mohan, G. A GIS based hydrogeomorphic approach for identification of site-specific artificial-recharge techniques in the Deccan Volcanic Province. J. Earth Syst. Sci. 2005, 114, 505–514. [Google Scholar] [CrossRef]
  20. Sukumar, S.; Sankar, K. Delineation of potential zones for artificial recharge using GIS in Theni district, Tamilnadu, India. Int. J. Geomat. Geosci. 2010, 1, 639. [Google Scholar]
  21. Chowdhury, A.; Jha, M.K.; Chowdary, V.M. Delineation of groundwater recharge zones and identification of artificial recharge sites in West Medinipur district, West Bengal, using RS, GIS and MCDM techniques. Environ. Earth Sci. 2010, 59, 1209–1222. [Google Scholar] [CrossRef]
  22. Singh, A.; Panda, S.N.; Kumar, K.S.; Sharma, C.S. Artificial groundwater recharge zones mapping using remote sensing and GIS: A case study in Indian Punjab. Environ. Manag. 2013, 52, 61–71. [Google Scholar] [CrossRef] [PubMed]
  23. Patil, S.G.; Mohite, N.M. Identification of groundwater recharge potential zones for a watershed using remote sensing and GIS. Int. J. Geomat. Geosci. 2014, 4, 485–498. [Google Scholar]
  24. Saravi, M.; Malekian, A.; Nouri, B. Identification of suitable sites for groundwater recharge. In Proceedings of the 2nd International Conference on Water Resources and Arid Environment, Riyadh, Saudi Arabia, 26–29 November 2006; pp. 1–5.
  25. Ghayoumian, J.; Mohseni Saravi, M.; Feiznia, S.; Nouri, B.; Malekian, A. Application of GIS techniques to determine areas most suitable for artificial groundwater recharge in a coastal aquifer in southern Iran. J. Asian Earth Sci. 2007, 30, 364–374. [Google Scholar] [CrossRef]
  26. Mehrabi, H.; Zeinivand, H.; Hadidi, M. Site Selection for Groundwater Artificial Recharge in Silakhor Rangelands Using GIS Technique. J. Rangel. Sci. 2012, 2, 687–695. [Google Scholar]
  27. Malekmohammadi, B.; Ramezani Mehrian, M.; Jafari, H.R. Site selection for managed aquifer recharge using fuzzy rules: Integrating geographical information system (GIS) tools and multi-criteria decision making. Hydrogeol. J. 2012, 20, 1393–1405. [Google Scholar] [CrossRef]
  28. Alraggad, M.; Jasem, H. Managed Aquifer Recharge (MAR) through Surface Infiltration in the Azraq Basin/Jordan. J. Water Resour. Prot. 2010, 2, 1057–1070. [Google Scholar] [CrossRef]
  29. Al-Adamat, R. The Use of GIS and Google Earth for Preliminary Site Selection of Groundwater Recharge in the Azraq Oasis Area—Jordan. J. Water Resour. Prot. 2012, 4, 395–399. [Google Scholar] [CrossRef]
  30. Pedrero, F.; Albuquerque, A.; Marecos do Monte, H.; Cavaleiro, V.; Alarcón, J.J. Application of GIS-based multi-criteria analysis for site selection of aquifer recharge with reclaimed water. Resour. Conserv. Recycl. 2011, 56, 105–116. [Google Scholar] [CrossRef]
  31. Chenini, I.; Ben Mammou, A. Groundwater recharge study in arid region: An approach using GIS techniques and numerical modeling. Comput. Geosci. 2010, 36, 801–817. [Google Scholar] [CrossRef]
  32. Kallali, H.; Anane, M.; Jellali, S.; Tarhouni, J. GIS-based multi-criteria analysis for potential wastewater aquifer recharge sites. Desalination 2007, 215, 111–119. [Google Scholar] [CrossRef]
  33. Russo, T.A.; Fisher, A.T.; Lockwood, B.S. Assessment of Managed Aquifer Recharge Site Suitability Using a GIS and Modeling. Groundwater 2015, 53, 389–400. [Google Scholar] [CrossRef] [PubMed]
  34. O’Geen, A.; Saal, M.; Dahlke, H.; Doll, D.; Elkins, R.; Fulton, A.; Fogg, G.; Harter, T.; Hopmans, J.; Ingels, C.; et al. Soil suitability index identifies potential areas for groundwater banking on agricultural lands. Calif. Agric. 2015, 69, 75–84. [Google Scholar] [CrossRef]
  35. Store, R.; Kangas, J. Integrating spatial multi-criteria evaluation and expert knowledge for GIS-based habitat suitability modelling. Landsc. Urban Plan. 2001, 55, 79–93. [Google Scholar] [CrossRef]
  36. Sugumaran, R.; Degroote, J. Spatial Decision Support Systems: Principles and Practices; CRC Press: Boca Raton, FL, USA, 2010. [Google Scholar]
  37. Malczewski, J. On the Use of Weighted Linear Combination Method in GIS: Common and Best Practice Approaches. Trans. GIS 2000, 4, 5–22. [Google Scholar] [CrossRef]
  38. Das, D. Geomorphological techniques in locating sites for artificial recharge: A Case Study from a drought-prone hard-rock terraine in eastern India. In Management of Aquifer Recharge for Sustainability, Proceedings of the 4th International Symposium on Artificial Recharge of Groundwater, ISAR-4, Adelaide, Australia, 22–26 September 2002; pp. 543–546.
  39. Shaban, A.; Khawlie, M.; Abdallah, C. Use of remote sensing and GIS to determine recharge potential zones: The case of Occidental Lebanon. Hydrogeol. J. 2006, 14, 433–443. [Google Scholar] [CrossRef]
  40. Magesh, N.S.; Chandrasekar, N.; Soundranayagam, J.P. Delineation of groundwater potential zones in Theni district, Tamil Nadu, using remote sensing, GIS and MIF techniques. Geosci. Front. 2012, 3, 189–196. [Google Scholar] [CrossRef]
  41. Rahman, M.A.; Rusteberg, B.; Uddin, M.S.; Lutz, A.; Saada, M.A.; Sauter, M. An integrated study of spatial multicriteria analysis and mathematical modelling for managed aquifer recharge site suitability mapping and site ranking at Northern Gaza coastal aquifer. J. Environ. Manag. 2013, 124, 25–39. [Google Scholar] [CrossRef] [PubMed]
  42. Astorga, A.; Arias, M. Mapa de geoaptitud hidrogeológica de Costa Rica: Implicaciones respecto a la gestión ambiental del desarrollo. Rev. Geol. Am. Cent. 2003, 29, 95–101. [Google Scholar] [CrossRef]
  43. Essig, E.T.; Corradini, C.; Morbidelli, R.; Govindaraju, R.S. Infiltration and deep flow over sloping surfaces: Comparison of numerical and experimental results. J. Hydrol. 2009, 374, 30–42. [Google Scholar] [CrossRef]
  44. Instituto Tecnológico de Costa Rica. Atlas Digital de Costa Rica; [CD-ROM]; Instituto Tecnológico de Costa Rica: Cartago, Costa Rica, 2014. [Google Scholar]
  45. Dunne, T.; Leopold, L.B. Water in Environmental Planning; Macmillan: San Francisco, CA, USA, 1978. [Google Scholar]
  46. Ley Forestal. Law N°7575; Gaceta N°72, Alcance 21; Republic of Costa Rica: San José, Costa Rica, 1996.
  47. Ley Orgánica del Ambiente. Law N°7554; Gaceta N°215; Republic of Costa Rica: San José, Costa Rica, 1995.
Figure 1. Main geomorphic features of Costa Rica based on Bundschuh and Alvarado [4] with base digital elevation model by the USGS [8].
Water 08 00391 g001
Figure 2. Hydrogeological aptitude for Costa Rica based on Astorga and Arias [42].
Water 08 00391 g002
Figure 3. Terrain slope for Costa Rica based on the DEM by the TEC [44].
Water 08 00391 g003
Figure 4. Soil texture based on the soil data collected by the Ministry of Agriculture of Costa Rica (MAG, in Spanish) digitalized by TEC [44].
Water 08 00391 g004
Figure 5. Drainage network density for Costa Rica based on the cartography maps (IGN) on a 1:50,000 scale digitalized by TEC [44].
Water 08 00391 g005
Figure 6. Screening suitable sites for SM in Costa Rica based on the terrain slope lower than 40% and protected areas, beaches, and wetlands.
Water 08 00391 g006
Figure 7. Standardization of the four criteria used in the WLC. (a) hydrogeological aptitude; (b) terrain slope; (c) soil texture; and (d) drainage network density.
Water 08 00391 g007
Figure 8. Interaction between the criteria for the MIF method (solid arrows represent major effects and dash arrows minor effects).
Water 08 00391 g008
Figure 9. Costa Rica’s areas ranking of site suitability for SM calculated by the WLC based on hydrogeological aptitude, terrain slope, soil texture, and drainage network density.
Water 08 00391 g009
Figure 10. Range of weights used for the sensitivity analysis by adding or erasing one minor or one major effect between the criteria for the MIF methods.
Water 08 00391 g010
Figure 11. Classes switch for the sensitivity analysis on the criteria weight by the MIF method.
Water 08 00391 g011
Figure 12. Spatial distribution of the sensitivity analysis scenarios.
Water 08 00391 g012
Table 1. Computation of the criterion weight using the MIF method.
CriterionScoreWeight
Hydrogeological aptitude1 + 1 + 1 = 343%
Terrain slope1 + 1 = 229%
Soil texture1 + 0.5 = 1.521%
Drainage density0.57%
Total7100%
Table 2. Percentage area by category for the suitable areas and total country area.
Class (GIS-MCDA Range)Percentage from the Total Suitable AreaPercentage from the Total Country Area
Very high (1.0–0.8)20.4%12.4%
High (0.8–0.6)29.4%18.0%
Moderate (0.6–0.4)22.2%13.5%
Low (0.4–0.2)16.2%9.9%
Very low (0.2–0.0)11.8%7.2%

