Article

Impact of Fertilizer N Application on the Grey Water Footprint of Winter Wheat in a NW-European Temperate Climate

Yara International ASA, Institute of Crop Nutrition and Environmental Research, Hanninghof 35, 48249 Dülmen, Germany
*
Author to whom correspondence should be addressed.
Water 2016, 8(8), 356; https://doi.org/10.3390/w8080356
Submission received: 13 May 2016 / Revised: 3 August 2016 / Accepted: 9 August 2016 / Published: 19 August 2016
(This article belongs to the Special Issue Water Footprint Assessment)

Abstract

:
Nutrient management is central in water footprint analyses as it exerts strong control over crop yield and potentially contributes to pollution of freshwater, the so-called grey water footprint. In the frame of grey water footprint accounting, two methods are suggested, the constant leaching fraction approach (10% of applied fertilizer N) and the N surplus approach. We compared both approaches and expected that the N surplus approach gives lower estimates of N leaching (and fertilizer-induced freshwater pollution) when the N surplus is small and higher N leaching estimates when the N surplus is high. We compared N fertilizer application at which the N balance = 0 with the N application at which profit is highest. We further expect pronounced differences in N surplus between farm sites and years, due to yield and soil fertility differences. N response trials were conducted at several locations over three years in Germany. Fertilizer-induced N surplus was calculated from the difference between applied N fertilizer and grain N removal. N fertilizer application at which N balance = 0 (NBal = 0) was lower than economic optimum N application rates (NEcon). N surplus at NEcon was linearly correlated with the additional N applied. Pooled over years and sites the median N surplus was 39 kg N ha−1. Differences between sites rather than between years dominated variation in fertilizer-induced N surplus. Estimated N leaching at NEcon was on average 9% of applied fertilizer N. The product water footprint was on average 180 m3 per ton of grain, but differences between sites were substantial with values varying between 0 and >400 m3 per ton. Yield and protein contents were lower at NBal = 0 compared to NEcon indicating a trade-off between freshwater protection, yield, wheat grain quality and economic optimum N application. Site-specific fertilizer strategies which consider soil type, crop development, annual field water balance, in-season nutrient dynamics and crop rotational effects are key to minimize fertilizer‑induced leaching of N into groundwater.

1. Introduction

The projected population growth will substantially increase food demand by 2050 and puts additional pressure on land and water resources [1,2]. Intensification of agricultural systems can avoid massive expansion of agriculture into natural ecosystems. However, if resource management of water and fertilizers is inefficient, it presents a burden on the environment by regional exhaustion of freshwater reserves or non-point pollution of ground- and surface waters by nutrients [3]. Over-exploitation and pollution of freshwater presents a massive threat to sustain future water demand. Presently 2.8 billion people live in water-scarce areas [4] and for another 1.8 billion people the water requirements are rising too quickly to avoid future water scarcity [5].
Projections of future food and water demand increase public concern about the ‘water costs’ of agricultural commodities and, consequently, policy makers, industry, and consumers increasingly demand for transparency of the ‘water consumption’ behind food products. The water footprint is a quantitative indicator of water appropriation in the food sector and allows comparisons between food production systems in terms of efficiency of water use and their impact on regional freshwater resources within a watershed [6,7]. A crop water footprint quantifies evapotranspiration (green water), irrigation (blue water), and pollution of freshwater (grey water). Freshwater pollution is quantified by the amount of water needed to re-dilute polluted freshwater back to an accepted threshold value, the so-called grey water footprint, on which we focus in this case study. Nutrient management is central in water footprint analyses as nutrient supply potentially contributes to pollution of freshwater.
Nitrogen (N) transport into freshwater occurs via surface run-off and vertical transport below the rooting zone (leaching). Focusing on leaching, dissolved N-containing compounds (predominantly nitrate and some organic N) are transported in percolation water and, consequently, the extent of leaching is a function of percolation water volume and concentration of dissolved N compounds. Percolation water volume is controlled by the field water balance (input of water via rainfall and irrigation and output via evapotranspiration), which is highly location- and year-specific due to variability in both rainfall and crop water consumption. Furthermore, percolation water volume depends on the water storage capacity of soils with fine-textured soils being able to store more water in the rooting zone than light-textured soils. This complexity in factors contributing to N leaching illustrates that N leaching is highly site-specific.
Fertilizer-induced leaching of N has been evaluated manifold with different methodological approaches and in many different cropping systems and climates. Necessarily, the outcome is highly variable with estimates ranging from hardly any to high N leaching. For wheat, several studies consistently showed that fertilizer-induced leaching (the additional amount of leached N compared to unfertilized controls) increases linearly or exponentially at N rates exceeding a certain threshold value [8,9,10,11,12]. In only a few studies N response trials were used to quantify this threshold value in relation to the economic optimum N fertilizer application rate (NEcon). NEcon is the crop, year and site-specific N fertilizer application at which the profit is maximized. Farm managers are not able to predict NEcon during the cropping season as final grain yield and grain prices are not precisely known. However, long-term fertilizer application at NEcon is considered as a benchmark of economic viability. Some studies [8,9,12] indicated that, compared to N rates at which N input equaled N removal, N leaching increased only slightly at NEcon.
In the frame of global water footprint approaches, the quantification of fertilizer application impact on freshwater pollution necessarily relies on simplified assumptions. In a tier 1 approach focusing on a global survey of nutrient leaching and run-off, it was assumed that, irrespective of climate and soil type, a constant fraction of 10% of the N application rate was subject to leaching and run-off [13]. That approach, however, inherently implies that reduction of fertilizer input is the only management option to minimize pollution. Furthermore, heavy overdosing of fertilizer has a severe impact on freshwater quality which possibly is not sufficiently reflected in this simplified approach.
Another method to estimate N leaching, such as ref [14], applies a more explicit approach in the frame of water footprint accounting. Nutrient load into freshwater (L; mass/time) is estimated by a leaching-runoff fraction (β) multiplied by nutrient surplus (NSurp; mass/time).
L = β·NSurp
NSurp is the difference between N input (organic and/or inorganic N fertilizer application) and N removal (N removed via the harvested crop). The leaching-runoff fraction β accounts for site-specific factors such as terrain slope, rainfall amount, soil texture and fertilizer application strategy.
We expect that the N surplus approach (Equation (1)) as compared with the constant leaching fraction approach (10% of applied fertilizer N) gives lower estimates of N leaching (and fertilizer‑induced freshwater pollution) when NSurp is small and higher N leaching estimates when NSurp substantially increases. Fertilizer application of farms considers both nutrient balances and profit. For that reason, we compared N fertilizer application at which the N balance = 0 with the N application at which profit is highest. We expect pronounced differences in N surplus between farm sites and years, due to yield and soil fertility differences.
We used N response trial data of winter wheat and analyzed the relationship between mineral N fertilizer application, grain yield, and the related grey water footprint. Results are discussed in the context of putative trade-offs between economic and environmental goals and finally with regard to regional variability in soil types, rainfall amount, and distribution.

2. Materials and Methods

2.1. Experimental Sites and Data Collection

Winter wheat yield response to CAN (calcium-ammonium nitrate, 27%N) fertilizer application rates was investigated in field trials conducted at several locations in Germany (Table 1).
Sites were predominantly located in West, North and East Germany, site ‘Biberach’ was located in South Germany. Experiments were established on farm fields which, prior to set-up of the experiment, were managed according to local farm practices and, thus, differed with regard to preceding crops, crop protection measures, soil tillage and inherent soil fertility. Depending on farmers’ preferences different wheat varieties were cultivated.
Experiments comprised of 5 N application rates (in 3 split applications) which established N availabilities of 0, 120, 160, 220, and 280 kg N ha−1. Soil mineral N availability (NO3-N plus NH4-N; Nmin, kg N ha−1) at post-winter vegetation start was measured at soil depths 0–30, 30–60, and 60–90 cm (with six bulked soil samples per plot). According to best-management practice recommended by official advisory boards in Germany, topsoil Nmin was considered at the 1st application date and subsoil Nmin (30–90 cm) at the 2nd application date (Table 2).
The experimental layout was a completely randomized block design with four replicates and a plot size of 30 m2 of which 15 m2 were harvested with a plot combine harvester at maturity. Residual water content of grains was measured and grain yield reported on a 86% dry matter content (DW) basis for all sites and years. Grain N concentration (Kjeldahl-N) was measured and grain protein content of all samples was calculated by multiplying grain N concentration with 5.7 [15].

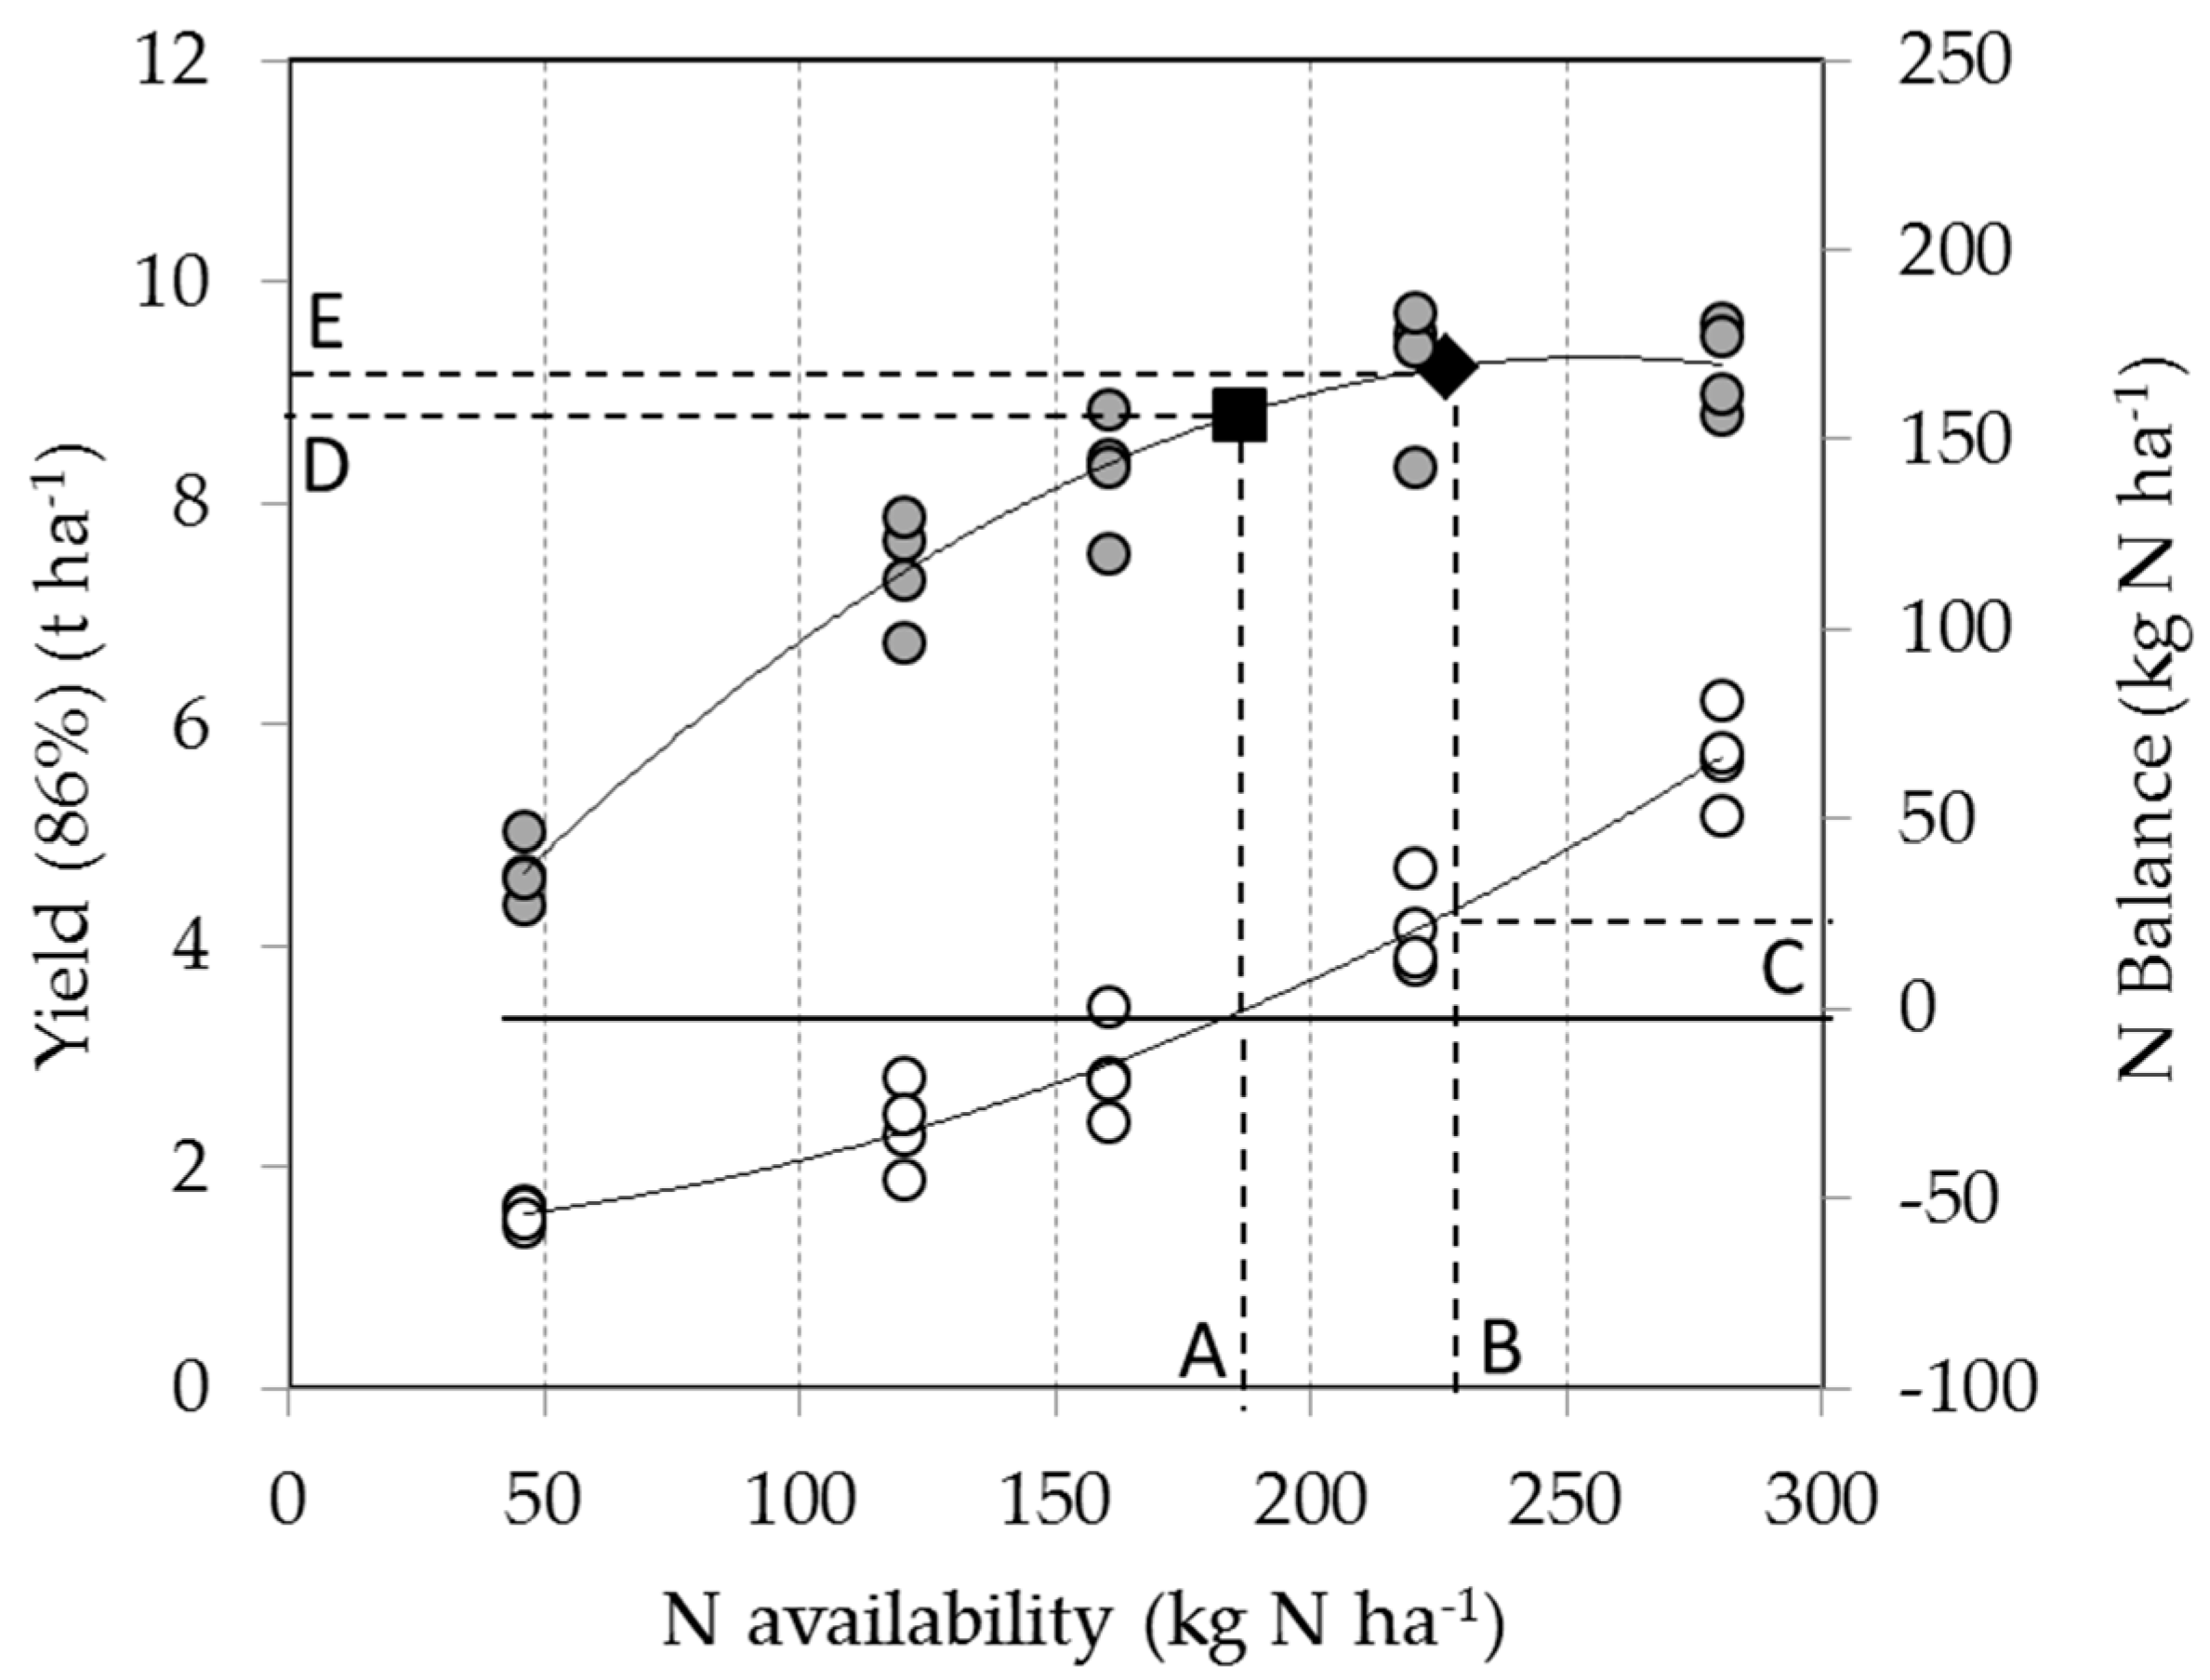
2.2. Calculation of Economic Optimum N Application Rates

Grain yield (YGrain) response to fertilizer N supply (NFert) was curve-fitted with a quadratic function:
YGrain = a·NFert2 + b·NFert + c
Coefficients a and b of Equation (2a) were used for calculating NEcon [16]. K in Equation (2b) is the cost/price ratio using an average of the 2006–2011 seasons German grain farm purchase price of 185 € per ton of wheat grain [17], a fertilizer price of 0.90 €/kg N, and fixed costs of fertilizer application of 45 € per ha:
NEcon = (K − b)/(2·a)

2.3. N Balance

The mass N balance (Equation (3)) considered the N fertilizer (NFert) applied and N removal by the harvest product (NRem). A positive N balance was considered as fertilizer-induced N surplus (NSurp) under the presupposition that the soil organic matter pool remains stable. This approach is a simplification as N input by deposition and N emissions to air are not considered.
NSurp = NFert − NRem
N deposition, however, has substantially increased as compared to the pre-industrial era and can be considerably higher near point-emitters such as livestock holdings and N-to-air emissions can as well be a relevant component of the N balance [18,19,20].
The N balance of all five treatment levels was calculated from the difference between crop N removal and N fertilizer input. A quadratic function was used to predict the N balance as a function of plant available N (Figure 1).
Figure 1 displays a typical example of a yield response and N balance curve and derived parameters. At all sites the coefficient of determination (R2) was larger than 0.95. NRem was calculated by multiplying grain yields (absolute dry mass basis) with grain N concentrations. N fertilizer application rate at NBal = 0 was derived by solving the quadratic function, which fitted the N balance as a function of N availability. N surplus at NEcon was calculated by solving the quadratic N balance equation for N availability at NEcon. Yields at NBal = 0 and NEcon were derived from the quadratic yield response function. NBal = 0 (point A in Figure 1) is, in the following, considered as the minimum required N fertilizer input causing no fertilizer-induced freshwater pollution. NEcon (point B in Figure 1) is considered as the strategy which maximises profit but potentially induces fertilizer-induced N surplus (point C in Figure 1). The difference E-D quantifies the yield difference between NBal = 0 and NEcon. Regression functions were written in the statistical software package R [21].

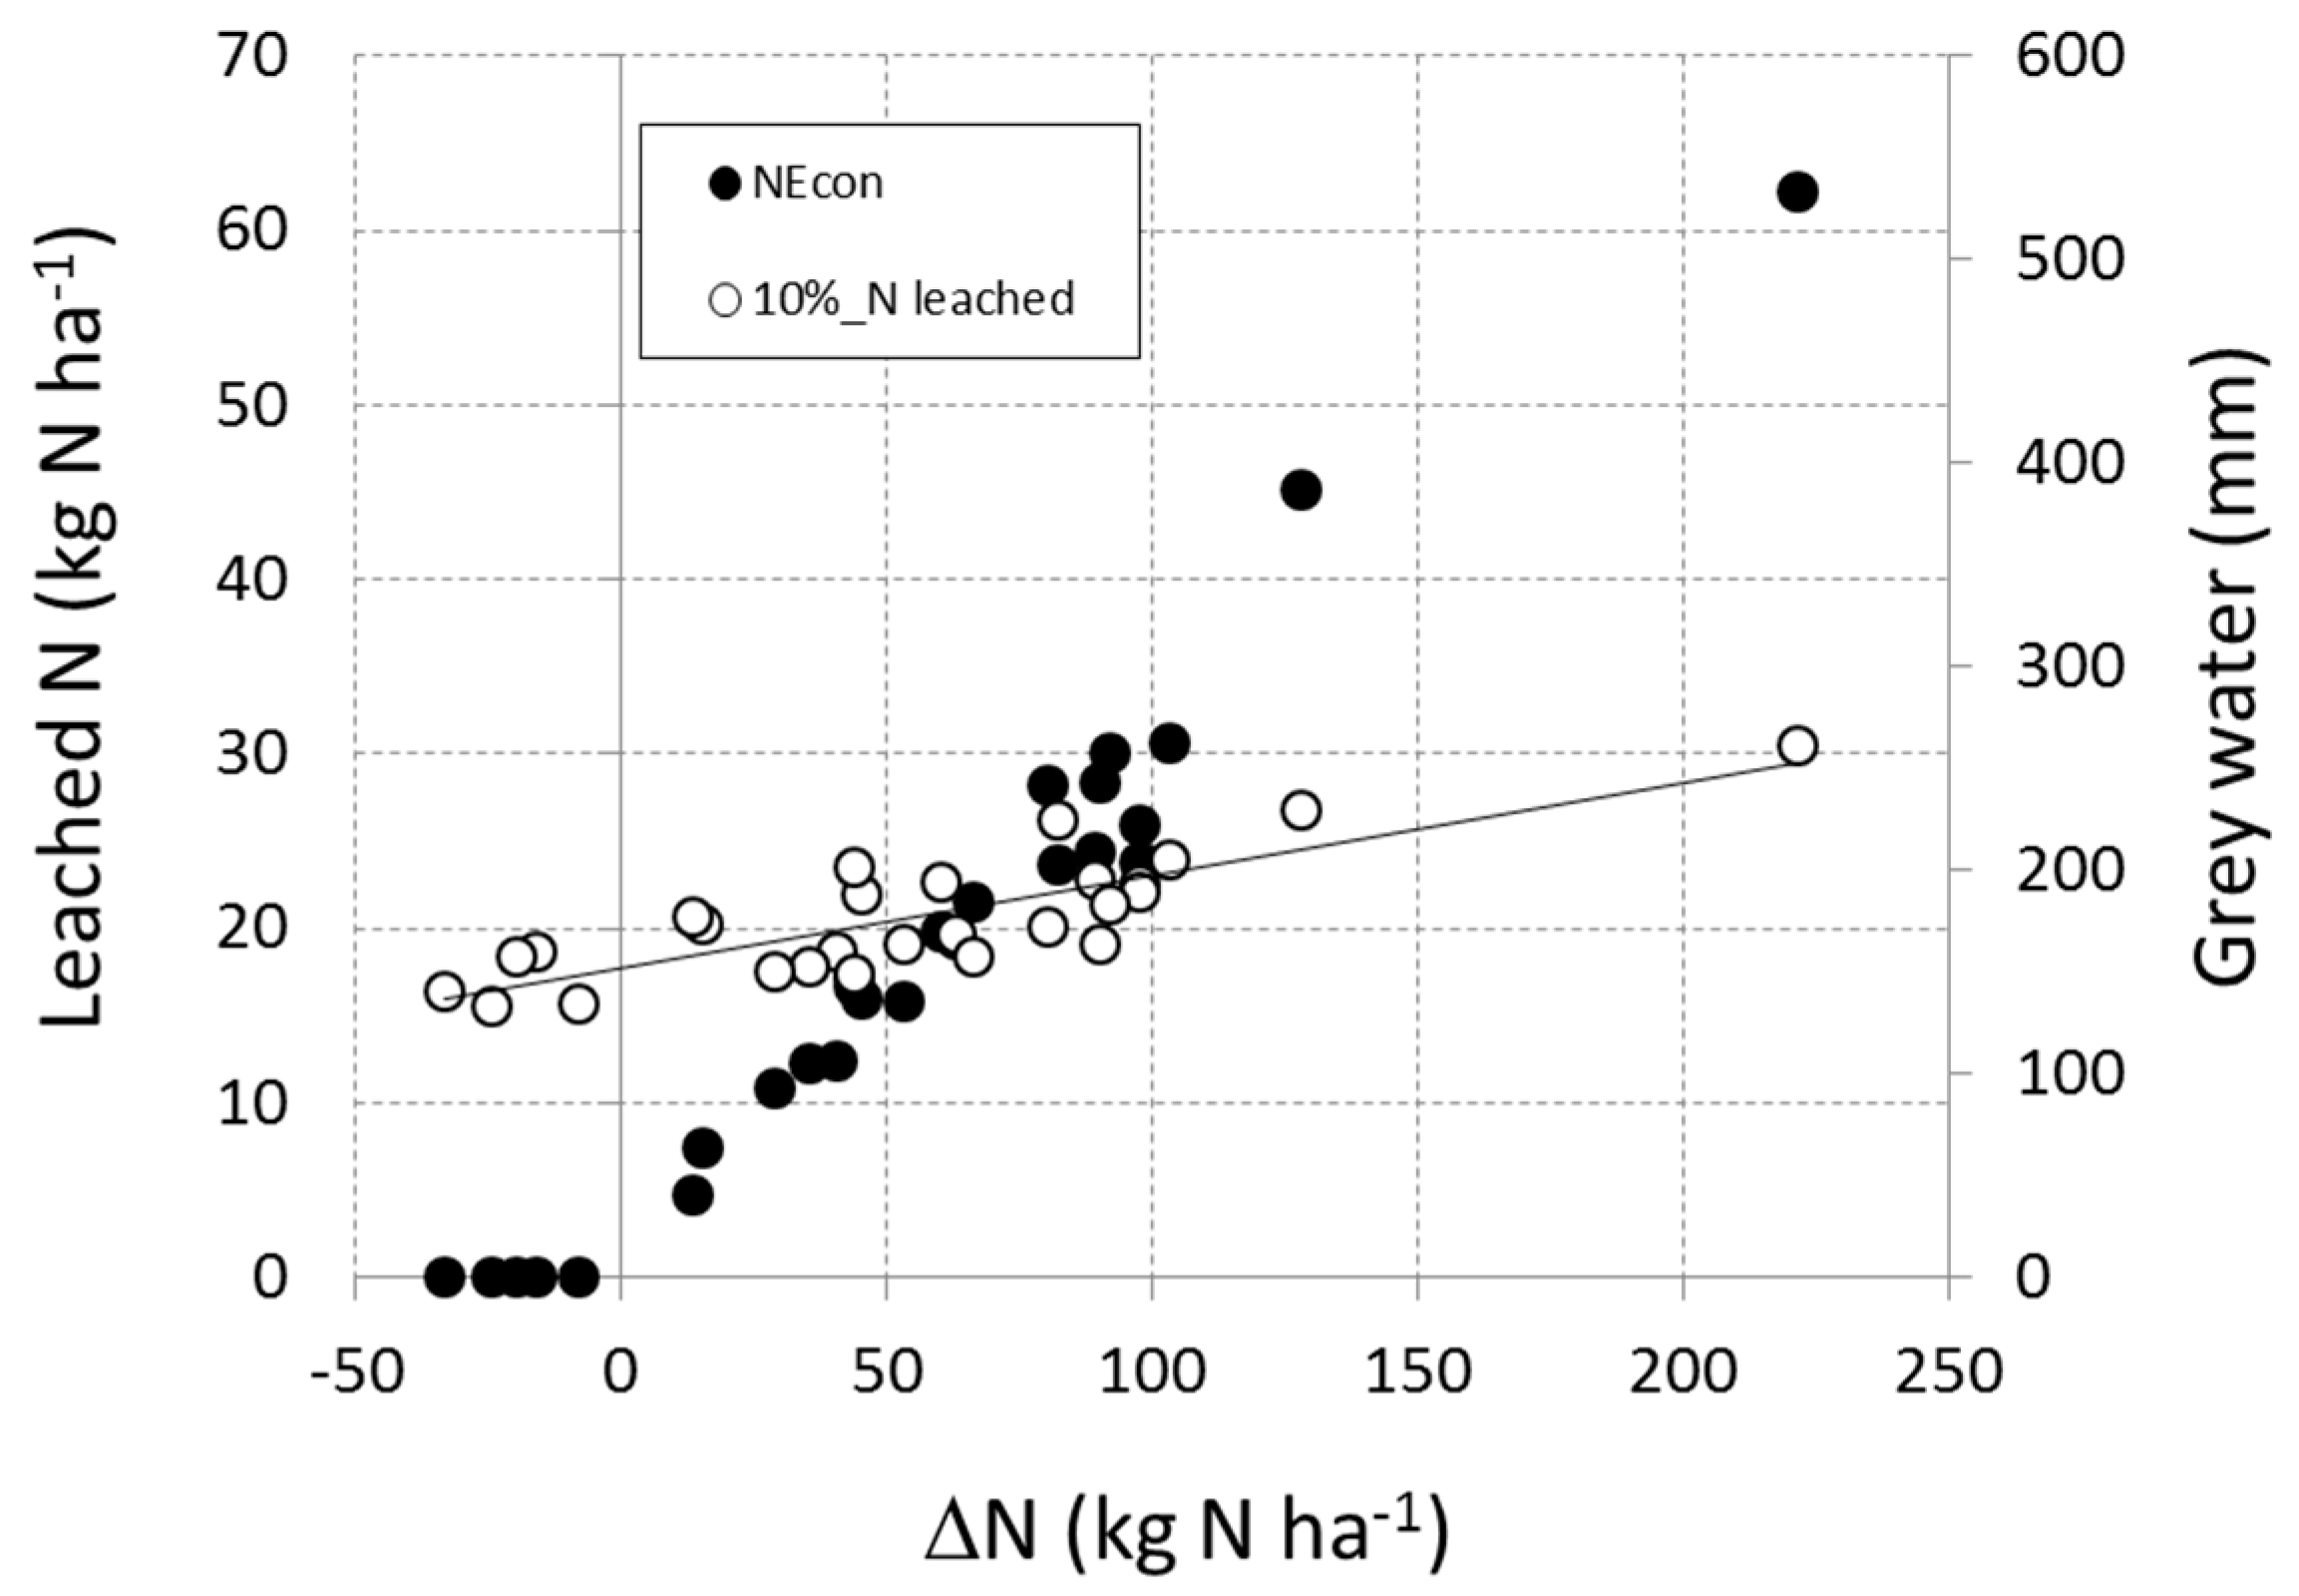
2.4. Leaching Estimates

The approach of leaching estimates is based on a leaching run-off fraction β; (see Equation (1)) [14]. Site-specific information of environmental factors and agricultural practice is considered by weighting factors (wi) and a 4-class score (si) with values of 0, 0.33, 0.67 and 1 (see Table S1) and β calculated as:
β = βmin + [Σ(si·wi)/Σwi] · (βmax − βmin)
The nitrogen leaching run-off fraction has a minimum (βmin) and maximum (βmax) value of 0.08 and 0.8 [14]. According to the classification scheme of Franke et al. [14], all sites of our study were well drained (score: 0.67), located in areas of very high N deposition (score 1) and subject to good management practice (score: 0.33). Except for one site, N2-fixation by legumes was absent in the crop rotations (Score 0). Notably, annual precipitation of 600–1200 mm ranked all sites into the group ‘low’ (score: 0.33). Franke et al. [14] differentiated between texture relevant for leaching and texture relevant for run-off with weighting factors of 0.15 and 0.10, respectively. This approach (in combination with terrain slope information) is relevant at the regional scale and particularly for surface transport of fine-particles. Scores for leaching and run-off are inversely related, such that e.g., sand has a high score for leaching (1) and a low score (0) for run-off. By this, soil type differences are, to a certain extent, evened out. In this study, we focused on leaching and not on run-off and therefore took a weighting factor of 0.25 for both texture and natural drainage. Across all sites, β was, on average, 0.471, a value close to the average factor of 0.44 reported in [14]. The minimum and maximum values were 0.344 and 0.524 indicating that between 34% and 52% of N surpluses are estimated as leached into groundwater.
The grey water footprint was calculated from estimated nitrogen load into freshwater (see Equation (1)) divided by the maximum acceptable concentration of 50 mg NO3 (11.3 mg N) per litre of freshwater.

3. Results

3.1. Fertilizer Induced N Surplus

Average N fertilizer applications at NBal = 0 were 149, 155 and 124 kg N ha−1 in 2013, 2102 and 2011, respectively (Figure 2a). As indicated by the interquartile range, site differences rather than differences between years (as indicated by the median) dominated variation in NBal = 0. Across sites and years, NBal = 0 varied between 73 and 198 kg N ha−1 and was linearly correlated with grain yields (Figure 2b). Grain protein contents were only weakly correlated with NBal = 0 (data not shown) and were 10.8%, 10.9% and 10.4% in 2013, 2012 and 2011, respectively (Table 3).
N fertilizer application at NEcon was in five (of 29) cases lower than NBal = 0, but in 83% higher (Figure 3a). N surplus and the difference of N fertilizer supply between NEcon and NBal = 0 (ΔN) were linearly correlated and N surplus was, as indicated by the slope of the linear regression function, 61.6% of ΔN. Higher N application rates at NEcon compared to NBal = 0 resulted in exponentially increasing grain yields (Figure 3b). Grain yields at NEcon, as compared to NBal = 0, increased on average by 0.8, 0.6 and 1.0 tons·ha−1 and protein contents to 11.6%, 11.2% and 11.4% (Table 3). The median of fertilizer-induced N surplus at NEcon was lower in 2012 than in 2013 and 2011 but, as indicated by the standard deviation, differences between sites dominated variation in fertilizer-induced N surplus. Pooled over years N surplus was 39 kg N ha−1 (interquartile range: 34 kg N ha−1).

3.2. N Leaching and Related Grey Water Footprint

According to Equations (1) and (4), only a fraction (β) of the N surplus is subject to leaching and β varied between sites due to differences in soil texture (Table S1). Across all sites estimated leached N was linearly correlated with the amount of fertilizer N applied above NBal = 0 (Figure 4). Compared to the approach in which a constant fraction of 10% of the applied fertilizer N is assumed to pollute freshwater (see Figure 4, 10%_NLeach), the N surplus approach with leaching fraction β gave lower estimates of leached N towards NBal = 0 and substantially higher leaching loss estimates if N application rates exceeded NEcon.
The average amount of estimated leached N at NEcon was on average 18.4 kg N ha−1 with 50% of the data between 7 and 28 kg N ha−1 (Figure 4). Estimated N leaching at NEcon was on average 9% of the amount of applied fertilizer N. The quantity of water for diluting this N surplus to the EU threshold of 50 mg nitrate per litre of water, the grey water component of the volume water footprint, was on average 163 mm (Table 3). The grey water footprint per unit harvested product, the product water footprint, was, on average, 180 m3 per ton but differences between sites were substantial with values varying between 0 and >400 m3 per ton of grain.

4. Discussion

4.1. Fertilizer-Induced N Surplus

Quantification of water use in agriculture is central for future projections of agricultural crop product demand (food, feed, fibres and bioenergy), as population growth during the next decades and increasing water demand of the industrial and domestic sector will increase competition for water resources. Water scarcity, in this context, is a regional issue due to spatially segregated water catchments. Within such catchments, farms are the logical unit of consideration and farmers the addressees for measures aiming for efficient and sustainable water use. Water footprints have become a widely used indicator of water appropriation and global maps with high spatial resolution of evapotranspiration (green water), irrigation water use (blue water) and freshwater pollution (grey water) are available for all relevant crops [7]. Fertilizer-related freshwater pollution is particularly important in the frame of surface and groundwater protection measures and the grey water footprint is a suitable impact quantifier in this regard [22,23].
Fertilizer-related pollution of freshwater is predominantly driven by drainage and surface run-off of phosphorus and nitrogen. The extent of pollution depends on many factors such as climatic conditions, soil texture, topography and, ultimately, crop and farm management. Nitrogen balances are considered as a suitable indicator of efficient N management and environmental risks and must be annually reported and a statutory indicator of pollution potential in several EU countries. In this study, N surplus of winter wheat at NEcon was quantified by considering nutrient import and export at typical farm sites and compared with a fertilizer strategy which aims at a neutral N balance (NBal = 0). N application at NEcon was on average (pooled over years) 37 kg N ha−1 higher than at NBal = 0. Considering the typical shape of a yield-response curve (see Figure 1), yield increases become smaller with increasing N application rates and increases of N application from NBal = 0 to NEcon induced a strictly linear increase in N surplus (Figure 3a), irrespective of the contrasting wheat varieties used in these experiments, previous crops, climate and soil type (Table 1 and Table S1). The slope of the linear regression (Figure 3a) indicates that irrespective of the amount of additionally supplied fertilizer N at NEcon, roughly 40% of the N was efficiently used via yield increases (Figure 3b) and increased protein content (Table 3).
In Germany, the tolerated 3-year farm’s average N surplus is presently 60 kg N ha−1 [24]. At the majority of sites N surplus at NEcon was below that limit, indicating that a fertilizer strategy aiming at NEcon was in line with legal obligations. Eleven sites exceeded or approached (>50 kg N ha−1) the N surplus threshold of 60 kg N ha−1 (Figure 3a). Eight of these 11 sites had below average grain yields, indicating that yield formation during growth stages after the third fertilizer application date was impaired by factors such as pests, water or heat stress, or lodging. Such yield reductions below the often well-justified earlier yield expectation (and nitrogen supply strategy), necessarily induce unintended N surplus. Particularly low water availability, as well as lodging induced by heavy rainfall events during later growth stages, cannot be considered in fertilizer application strategies and represent a substantial threat of increased N surplus and risks of N leaching. In this context, increased climate variability in Europe will further increase the risk of high farm-gate N surplus due to increasing risks of yield declines and will compromise the probability of farmers to comply with regulations.

4.2. N Leaching and Related Grey Water Footprint

N surplus is calculated from N input and N removal and reflects the fertilizer-induced N leaching potential at harvest. However, not all of this N surplus is effectively entering groundwater. Post-harvest dynamics of soil nitrogen are complex and highly site-specific and render quantification of N leaching during the autumn and winter period difficult. The main processes which need to be considered during that period are net N mineralization, N demand of the subsequent crop (if sown in autumn) and percolation water (rainfall amount and distribution), which ultimately defines time and extent of N transport into groundwater. The approach of [14] gives, across all sites, an average leaching factor β of 0.47 (Table S1) suggesting that 53% of post-harvest N surplus is not prone to leaching but either immobilized in the (labile) soil organic matter pool, taken up by the subsequent crop or emitted to air (as N2O or N2). The concept of [14] is similar to approaches aiming at regional estimates of N budgets in Europe [25]. In contrast to the use of a static leaching factor per unit fertilizer application in the frame of water footprint accounting [13], the approach which was used in this study considers that leaching of N is a function of regional/local N surplus and considers site‑specific factors, such as soil texture and slope, carbon content, rooting depth, temperature and precipitation regime. We tested the N response of winter wheat in a range of N availability between 0 and 280 kg N ha−1 and monitored grain yield response, grain protein and N removal. Across all sites and years, the amount of fertilizer-induced estimated leached N was linearly related to N supply above NBal = 0 (Figure 4) and N application at NEcon, on average, induced N leaching of 18.4 kg N ha−1 and a leaching fraction of 9% of the fertilizer N applied. This N leaching estimate is similar to the estimate of 10% leached N used in the static approach of grey water accounting [14]. However, N application beyond NEcon sharply increased estimated N leaching (Figure 4) with N leaching relative to fertilizer application rising up to 20%. We consider this approach as a refinement which yields more realistic estimates of N leaching than the static 10% approach. Experimental data from field and lysimeter studies indicated that N leaching can increase linearly or exponentially [26]. The N balance approach of [14], therefore, can be considered as a suitable impact assessment method which, however, is not able to fully reflect the complexity of water and N transport in heterogeneous soil.
In almost all cases, N fertilizer application at NEcon induced N leaching. However, yield and protein contents tended to be lower at NBal = 0 as compared to NEcon (Table 3). Differences in yield and protein content between N fertilizer strategies aiming at NBal = 0 or NEcon would likely increase over time. This indicates a trade-off between economically optimal N input and freshwater protection goals on the one hand and freshwater protection and related yield losses and reduced wheat grain quality on the other hand. Additionally, application rates at NBal = 0 should be considered in relation to the fact that fields in humid climates are subject to unavoidable, basal N leaching which often occurs during autumn, when mineralization rates of soil organic matter are high and N uptake by crops is low, or on bare soil, absent. Basal leaching rates vary greatly between sites and particularly in response to organic or mineral fertilizer application history but values between 10 to 50 kg N ha−1 were frequently observed [26]. Particularly helpful are long-term fertilizer trials where control plots without organic or mineral N application over extended time periods (more than 100 years) were investigated. Such control plots had basal leaching rates between 3 and 24 kg N ha−1 [11]. We speculate that an N fertilizer strategy aiming at NBal = 0 would, in the long-run, cause as well a negative N balance as unavoidable, basal leaching of N occurs. From the perspective of sustaining soil fertility, therefore, N fertilizer application should be higher than the N fertilizer amount at NBal = 0.
The ‘tolerable’ N surplus and N leaching, further, needs to consider regional rainfall amount and distribution and site-specific soil types. In the water footprint concept, N surplus is translated in grey water, the dilution water demand, which on average was 163 mm (with the highest value of 345 mm at one site) at NEcon. Expressed per unit grain yield the product water footprint was on average 180 m3 per ton. This estimate is very similar to the 185 m3 per ton reported by [13] in their global survey of wheat water footprints. Considering the West-East rainfall gradient across Northern Germany as an example, long-term (1990–2012) average rainfall from 1 October to 31 March is highest in Münster (West Germany; 361 mm), lower in Hannover (308 mm) and lowest in Leipzig (East Germany, 208 mm) [27]. From a simple accounting perspective, this rainfall amount along the North German West-East transect is sufficient to dilute the average amount of fertilizer-induced leached N of 18.4 kg N ha−1 below the accepted EU threshold of 50 mg nitrate per litre. N surplus at NEcon would, consequently, be tolerable in terms of freshwater protection goals. However, differences between sites dominated N surplus and related N leaching and fertilizer application rates at NEcon induced substantial N leaching at some sites, underlining the relevance of further improvements in site‑specific N fertilizer application strategies for minimizing freshwater pollution. In this regard inventory approaches of grey water accounting, such as that suggested by [14], predominantly serve to indicate potential risks of freshwater pollution at the regional scale. Successful abatement strategies, however, will require comprehensive approaches which consider soil type, field water balance, crop rotation management and farm-specific technical, and financial options/constraints at the local scale. Ultimately, integrated analyses of trade-offs and synergies between several ecological indicators (carbon footprint, soil fertility, landscape biodiversity, land sparing) are required [28].

5. Conclusions

Within water catchments, farms are the logical unit of consideration and farmers the addressees for measures aiming for efficient and sustainable water use. The grey water footprint is a suitable indicator of nutrient management. Benchmarks for fertilizer application strategies are NBal = 0 and NEcon. In the majority of cases analysed in this study, N fertilizer application aiming at NEcon did not comprome freshwater protection targets while that strategy increased yield and protein content compared to NBal = 0. However, the variability of N surplus between farm sites was large, indicating that site-specific N management is key to minimize freshwater pollution. From the perspective of sustaining soil fertility, N fertilizer application should be higher than the N fertilizer amount at NBal = 0, but not higher than NEcon.

Supplementary Materials

The Supplementary materials are available online at www.mdpi.com/2073-4441/8/8/356/s1.

Author Contributions

Holger Brueck analyzed the data of N response trials. Joachim Lammel supervised N response trial activities.

Conflicts of Interest

The authors declare no conflict of interest.

References and Notes

  1. Fischer, G.; Heilig, G.K. Population momentum and the demand on land and water resources. Philos. Trans. R. Soc. Lond. B Biol. Sci. 1997, 352, 869–889. [Google Scholar] [CrossRef]
  2. Tilman, D.; Balzer, C.; Hill, J.; Befort, N.L. Global food demand and the sustainable intensification of agriculture. Proc. Natl. Acad. Sci. USA 2011, 108, 20260–20264. [Google Scholar] [CrossRef] [PubMed]
  3. Vörösmarty, C.J.; McIntyre, P.B.; Gessner, M.O.; Dudgeon, D.; Prusevich, A.; Green, P.; Glidden, S.; Bunn, S.E.; Sullivan, C.A.; Reidy Liermann, C.; et al. Global threats to human water security and river biodiversity. Nature 2010, 467, 555–561. [Google Scholar] [CrossRef] [PubMed]
  4. Molden, D.; Frenken, K.; Barker, R.; Fraiture, C.D.; Mati, B.; Svendsen, M.; Sadoff, C.; Finlayson, C.M.; Attapatu, S.; Giordano, M.; et al. Trends in water and agricultural development. In Water for Food, Water for Life: A Comprehensive Assessment of Water Management in Agriculture; Molden, D., Ed.; Earthscan: London, UK; International Water Management Institute: Colombo, Sri Lanka, 2007; pp. 57–89. [Google Scholar]
  5. Falkenmark, M. Meeting water requirements of an expanding world population. Philos. Trans. R. Soc. Lond. B Biol. Sci. 1997, 352, 929–936. [Google Scholar] [CrossRef]
  6. Siebert, S.; Döll, P. Quantifying blue and green virtual water contents in global crop production as well as potential production losses without irrigation. J. Hydrol. 2010, 384, 198–217. [Google Scholar] [CrossRef]
  7. Hoekstra, A.Y.; Mekonnen, M.M. The water footprint of humanity. Proc. Natl. Acad. Sci. USA 2012, 109, 3232–3237. [Google Scholar] [CrossRef] [PubMed]
  8. Delin, S.; Stenberg, M. Effect of nitrogen fertilization on nitrate leaching in relation to grain yield response on loamy sand in Sweden. Eur. J. Agron. 2014, 52, 291–296. [Google Scholar] [CrossRef]
  9. Kitchen, N.R.; Goulding, K.W.T.; Shanahan, J.F. Proven Practices and Innovative Technologies for On-Farm Crop Nutrition Management. In Nitrogen in the Environment: Sources, Problems and Management, 2nd ed.; Hatfield, J.L., Follett, R.F., Eds.; Academic Press: London, UK, 2008; pp. 483–517. [Google Scholar]
  10. Sieling, K.; Kage, H. N balance as an indicator of N leaching in an oilseed rape–winter wheat–winter barley rotation. Agric. Ecosyst. Environ. 2006, 115, 261–269. [Google Scholar] [CrossRef]
  11. Goulding, K.W.T.; Poulton, P.R.; Webster, C.P.; Howe, M.T. Nitrate leaching from the Broadbalk Wheat Experiment, Rothamsted, UK, as influenced by fertilizer and manure inputs and the weather. Soil Use Manag. 2000, 16, 244–250. [Google Scholar] [CrossRef]
  12. Lord, E.I.; Mitchell, R.D.I. Effect of nitrogen inputs to cereals on nitrate leaching from sandy soils. Soil Use Manag. 1998, 14, 78–83. [Google Scholar] [CrossRef]
  13. Mekonnen, M.M.; Hoekstra, A.Y. A global and high-resolution assessment of the green, blue and grey water footprint of wheat. Hydrol. Earth Syst. Sci. 2010, 14, 1259–1276. [Google Scholar] [CrossRef] [Green Version]
  14. Franke, N.A.; Boyacioglu, H.; Hoekstra, A.Y. Grey Water Footprint Accounting: Tier 1 Supporting Guidelines; Value of Water Research Report Series, No. 65; UNESCO-IHE: Delft, The Netherlands, 2013. [Google Scholar]
  15. Mariotti, F.; Tomé, D.; Patureau Mirand, P. Converting Nitrogen into Protein—Beyond 6.25 and Jones’ Factors. Crit. Rev. Food Sci. Nutr. 2009, 48, 177–184. [Google Scholar] [CrossRef] [PubMed]
  16. Neeteson, J.J.; Wadman, W.P. Assessment of economically optimum application rates of fertilizer N on the basis of response curves. Fertil. Res. 1987, 12, 37–25. [Google Scholar] [CrossRef]
  17. BMELV. Bundesministerium für Ernährung, Landwirtschaft und Verbraucherschutz. Available online: http://www.bmelv-statistik.de/ (accessed on 3 January 2014).
  18. Galloway, J.; Dentener, F.; Capone, D.; Bower, E.W.; Howarth, R.W.; Seitzinger, S.P.; Asner, G.P.; Cleveland, A.F.; Green, P.A.; Holland, E.A.; et al. Nitrogen cycles: past, present, and future. Biogeochemistry 2004, 70, 153–226. [Google Scholar] [CrossRef]
  19. Van Pul, A.; Jaarsveld, H.V.; Meulen, T.V.D.; Velders, G. Ammonia concentrations in the Netherlands: Spatially detailed measurements and model calculations. Atmos. Environ. 2004, 38, 4045–4055. [Google Scholar]
  20. EMEP. European Monitoring and Evaluation Programme. Available online: http://emep.int/mscw/index_mscw.html/ (accessed on 3 January 2014).
  21. RCDT 2008 R Development Core Team. R: A Language and Environment for Statistical Computing. R Foundation for Statistical Computing, Vienna, Austria. Available online: http://www.R-project.org (accessed on 12 February 2016).
  22. Van Grinsven, H.J.M.; Ten Berge, H.F.M.; Dalgaard, T.; Fraters, B.; Durand, P.; Hart, A.; Hofman, G.; Jacobsen, B.H.; Lalor, S.T.J.; Lesschen, J.P.; et al. Management, regulation and environmental impacts of nitrogen fertilization in northwestern Europe under the Nitrates Directive; a benchmark study. Biogeosciences 2012, 9, 5143–5160. [Google Scholar] [CrossRef] [Green Version]
  23. Vanham, D.; Bidoglio, G. A review on the indicator water footprint for the EU28. Ecol. Ind. 2013, 26, 61–75. [Google Scholar] [CrossRef]
  24. Düngeverordnung in der Fassung der Bekanntmachung vom 27. Februar 2007 (BGBl. I S. 221), die zuletzt durch Artikel 5 Absatz 36 des Gesetzes vom 24. Februar 2012 (BGBl. I S. 212) geändert worden ist.
  25. Velthof, G.L.; Oudendag, D.; Witzke, H.P.; Asman, W.A.H.; Klimont, Z.; Oenema, O. Integrated assessment of nitrogen losses from agriculture in EU-27 using MITERRA. J. Environ. Qual. 2009, 38, 402–417. [Google Scholar] [CrossRef] [PubMed]
  26. Deutscher Verband für Wasserwirtschaft und Kulturbau e.V. (DVWK). Bodennutzung und Nitrataustrag; Verlag Paul Parey: Hamburg, Berlin, 1985; p. 241. [Google Scholar]
  27. DWD. Deutscher Wetterdienst. Available online: http://www.dwd.de.html (accessed on 13 October 2014).
  28. Hoekstra, A.Y. Sustainable, efficient and equitable water use: the three pillars under wise freshwater allocation. Wires Water 2013. [Google Scholar] [CrossRef]
Figure 1. Yield (grey filled circles) and N balance (open circles) response to increasing N availability exemplified by data from site 16 (see Table 1). The filled square and diamond indicate points on the yield response curve where the N balance is zero and the yield is at economic optimum, respectively. Points A and B indicate N availability at these two points, point C the surplus at economic optimum and points D and E yields.
Water 08 00356 g001
Figure 2. (a) Fertilizer application rates required to achieve N input = N output (NBal = 0). Each dot represents one experimental site (2013: n = 11, 2012: n = 9, 2011: n = 7); (b) Relationship between grain yield (86% dry mass) and N fertilizer application rates at NBal = 0. Linear regression: y = 18.46 − 16.8, R2 = 0.78, n = 27.
Water 08 00356 g002
Figure 3. (a) Relationship between ΔN (difference of N fertilizer supply between NEcon and NBal = 0) and N surplus; (b) relationship between ΔN and Δgrain yield (yield difference between NEcon and NBal = 0). Different symbols in Figure 3a indicate experimental years (diamonds: 2011, circles: 2012, triangles: 2013).
Water 08 00356 g003
Figure 4. Relationship between ΔN and estimated leached nitrogen (kg N ha−1). ΔN is the difference of N fertilizer supply between NEcon and NBal = 0. Leached N was estimated from N surplus and the leaching fraction β according to [14]. The linear regression function (10%_N leached) is the simplified approach according to [14]. Grey water footprint (mm) is expressed as dilution water demand with a threshold of 50 mg nitrate per liter.
Water 08 00356 g004
Table 1. Region, soil type, preceding crop, soil mineral nitrogen content (NMin; kg N ha−1) at vegetation start, variety name and wheat type. Wheat type classes A, B, and C refer to variety-specific bread-processing features. Class A types have regularly higher grain N concentration than class C types. Preceding crops (Pre-crop) were maize as silage (SM) or corn cob mix (CCM), potato (POT), winter barley (WB), winter wheat (WW), oilseed rape (OSR), sugar beet (SB) or pea (P). In the same region, different sites were used.
YearSiteRegionCoordinatesSoil TypePre-CropNMinVariety; Type
20111Ahaus52.5/7.0loamCCM44Hermann CK
2Münster51.9/7.7loamy clayOSR52Manager; B
3Itzehoe53.9/9.5sandy loamWW30Ritmo; B
4Uelzen53.1/10.5loamy sandWW21Meister; A
5Anklam53.9/13.3sandy loamOSR87Akteur; E
6Hildesheim52.1/10.2Clayey loamWW52Julius; A
7Dülmen51.8/7.3sandCCM13Hermann; CK
2012 §8Dülmen51.8/7.3loamy sandCCM20Inspiration; B
9Dülmen51.8/7.3sandy loamCCM20Smaragd; B
10Dülmen51.8/7.3sandy loamPOT44Tabasco; C
11Ahaus52.5/7.0sandy loamSM36Skalmeje; C
12Osnabrück52.3/8.0loamy sandWB19JB Asano; A
13Röbel53.4/12.5sandy loamOSR21Potenzial; A
14Hildesheim52.1/10.2clayey loamWW57Julius; A
15Biberach48.1/9.8silty loamP25Dekan; B
16Riesa51.6/11.6loamOSR46JB Asano; A
2013 §17Dülmen51.8/7.3sandy loamCCM22Bombus; C
18Dülmen51.8/7.3loamy sandCCM21Inspiration; B
19Uelzen52.4/10.7loamy sandSB36Inspiration; B
20Anklam53.9/13.3silty clayOSR44Tuareg; A
21Röbel53.4/12.5sandy loamOSR20Linus; A
22Lüneburg53.3/10.2sandPOT17Potenzial; A
23Osnabrück52.3/8.0sandy loamOSR45JB Asano; A
24Biberach48.1/9.8sandy loamSM39Meister; A
25Oldesloe53.8/10.5sandy loamWW23Buteo; B
26Riesa51.6/11.6sandy loamSB30Kerubino (E)
27Riesa$51.8/7.3sandy loamSB26Chevalier (A)
Note: §: harvest year.
Table 2. Target values of N availability (kg N ha−1) of the N response trials. N fertilizer was applied at post-winter vegetation start (1st appl.), begin of booting (2nd appl.) and at flag leaf emergence (3rd appl.). N fertilizer application at the 1st and 2nd application date considered site-specific availability of inorganic N (NO3-N plus NH4-N; Nmin, kg N ha−1) sampled at post-winter vegetation start.
Treatment1st Appl.2nd Appl.3rd Appl.
N 0000
N 12040 – Nmin 0–30 cm50 – Nmin 30–90 cm30
N 16050 – Nmin 0–30 cm70 – Nmin 30–90 cm40
N 22080 – Nmin 0–30 cm80 – Nmin 30–90 cm60
N 28090 – Nmin 0–30 cm110 – Nmin 30–90 cm80
Table 3. Grain yield (t·ha−1 at 86% dry mass) and grain protein content (%) of winter wheat at NBal = 0 and NEcon and N surplus (kg N ha−1), grey water footprint (Grey WF; mm) and grey product water footprint (Grey PWF; m3·t−1) at NEcon. Mean ± s.e.; n = 11 (2013); 9 (2012), 7 (2011).
NBal = 0NEcon
YearYieldProteinYieldProteinN SurplusGrey WFGrey PWF
20139.1 ± 1.410.8 ± 0.89.8 ± 1.311.6 ± 0.539 ± 18168 ± 71180 ± 8
20129.2 ± 1.410.9 ± 1.19.8 ± 1.211.3 ± 1.025 ± 38124 ± 143130 ± 15
20117.6 ± 1.710.4 ± 1.58.6 ± 1.011.4 ± 1.345 ± 41206 ± 176240 ± 20

