Article

Spatiotemporal Variability in the Water Quality of Poyang Lake and Its Associated Responses to Hydrological Conditions

1
Key Laboratory of Watershed Geography Sciences, Nanjing Institute of Geography and Limnology, Chinese Academy of Sciences, Nanjing 210008, China
2
University of Chinese Academy of Sciences, Beijing 100049, China
*
Author to whom correspondence should be addressed.
Water 2016, 8(7), 296; https://doi.org/10.3390/w8070296
Submission received: 26 May 2016 / Revised: 5 July 2016 / Accepted: 11 July 2016 / Published: 18 July 2016

Abstract

:
Determining the spatiotemporal water quality patterns and their corresponding driving factors is crucial for lake water quality managements. This study analyzed hydrological data and concentrations of 11 water quality parameters, including total nitrogen, total phosphorus, ammonia nitrogen and chlorophyll–a (Chl–a), for water samples collected from 15 sampling sites between 2009 and 2014. The water quality of sites in the northern Poyang Lake–Yangtze River waterway was influenced by different environmental parameters compared to sites in central lake, especially for Chl–a concentration. All pollutant parameters were significantly higher in the river phase (water level <14 m) than in the lake phase (water level >14 m) (p < 0.05). These results were confirmed via principal component analysis, which identified three principal components that explained over 79% of the dataset variance. Among all the parameters related to climatic factors, eutrophication and organic pollution were the most important contributors in water quality. Dilution was the controlling factor that drove the seasonal variability in the water quality of the Poyang Lake, China. This work further indicated that regulating pollutant effluents in tributaries and water level within the lake could improve the water quality in Poyang Lake, which may give some impetus for water quality management.

1. Introduction

Natural lakes serve the ecosystem by providing drinking water, food and means of transportation and recreation [1,2]. Achieving and maintaining the purity of lake water has long been an urgent objective of water resources management and government decision makers [3]. However, the ongoing urbanization and population expansion substantially increase the loading of nutrients (including nitrogen and phosphorus) into lakes, thereby deteriorating water quality [4]. Therefore, a better understanding of water quality variations and their driving factors is a critical objective for lake water quality management.
Intra- and Inter- annual water level fluctuations (WLFs) play important roles in structuring aquatic communities and influencing water quality [5,6,7]. White et al. [5] found that inter-annual WLFs resulted in notable variability in the water quality parameters in the Laurentian Great Lakes region. While Kurata [8] argued that a low water level slightly affects the water quality of Lake Biwa. The water quality parameters in flood-plain lakes with great WLFs, such as Poyang Lake and Dongting Lake in China, may be greatly influenced by intra- and inter-annual WLFs, which reflect the uneven temporal-spatial distributions of hydrodynamic conditions and play important roles in pollutants transport and degradation [9]. Flow rate and residence time were also agreed to be important factors for pollutants mobility and degradation. However, the specific relationship between water quality parameters and WLFs in flood-plain lakes with seasonal variable velocities remains unexplored.
Poyang Lake, ranking the largest freshwater lake in China, is located in the middle and lower reaches of the Yangtze River. This lake serves as a habitat for rare migratory birds in winter and it has been listed as a globally important eco-region by the World Wide Fund for Nature. The water quantity and quality of Poyang Lake not only affect the economic development of humans and societies in the basin, but also partially determine the status of the water environment in the lower reaches of the Yangtze River. However, under the dual pressure of global climate change and the impoundment of the Three Gorges Reservoir, the water mass exchange between Poyang Lake and the Yangtze River has been altered, thereby affecting the WLFs of the lake [10,11]. The more frequent occurrence of low water levels and the earlier decline in winter water level and the longer river-phase period of Poyang Lake have greatly affected its ecological functions [12,13]. Previous studies have shown that the water quality of Poyang Lake is steadily deteriorating [14]. Algal bloom events were even recorded occasionally in local studies [15]. Besides, Poyang Lake receives a substantial input of nutrients from its tributaries, which may already be pushing the lake toward a near- irreversible change in its ecological characteristics [16]. Previous studies also showed that low flow velocities and higher water residence times in rivers and lakes will hinder the mobility of pollutants and reduce oxygen levels, resulting in relative bad water quality [17]. However, the highest water level and lowest velocities of Poyang Lake both occurred in summer, and vice versa in winter, which is different from other rivers or lakes [18]. Furthermore, the inverse relationship between pollutants levels and flow was often found for polluted rivers or lakes. Thus, it is necessary to examine the corresponding relationship in Poyang Lake. Therefore, the spatiotemporal variability in the water quality parameters of Poyang Lake must be investigated, and the relationship of such variability with the hydrological conditions in this large flood-plain lake must be examined further.
The objective of this study was therefore to investigate the variability in the water quality of Poyang Lake and its corresponding driving factors. By investigating the seasonal variability of the water level and the 11 water quality parameters for the water samples that were collected from 15 sites in Poyang Lake between 2009 and 2014, we sought to elucidate how the water quality of the lake is influenced by water regime.

2. Materials and Methods
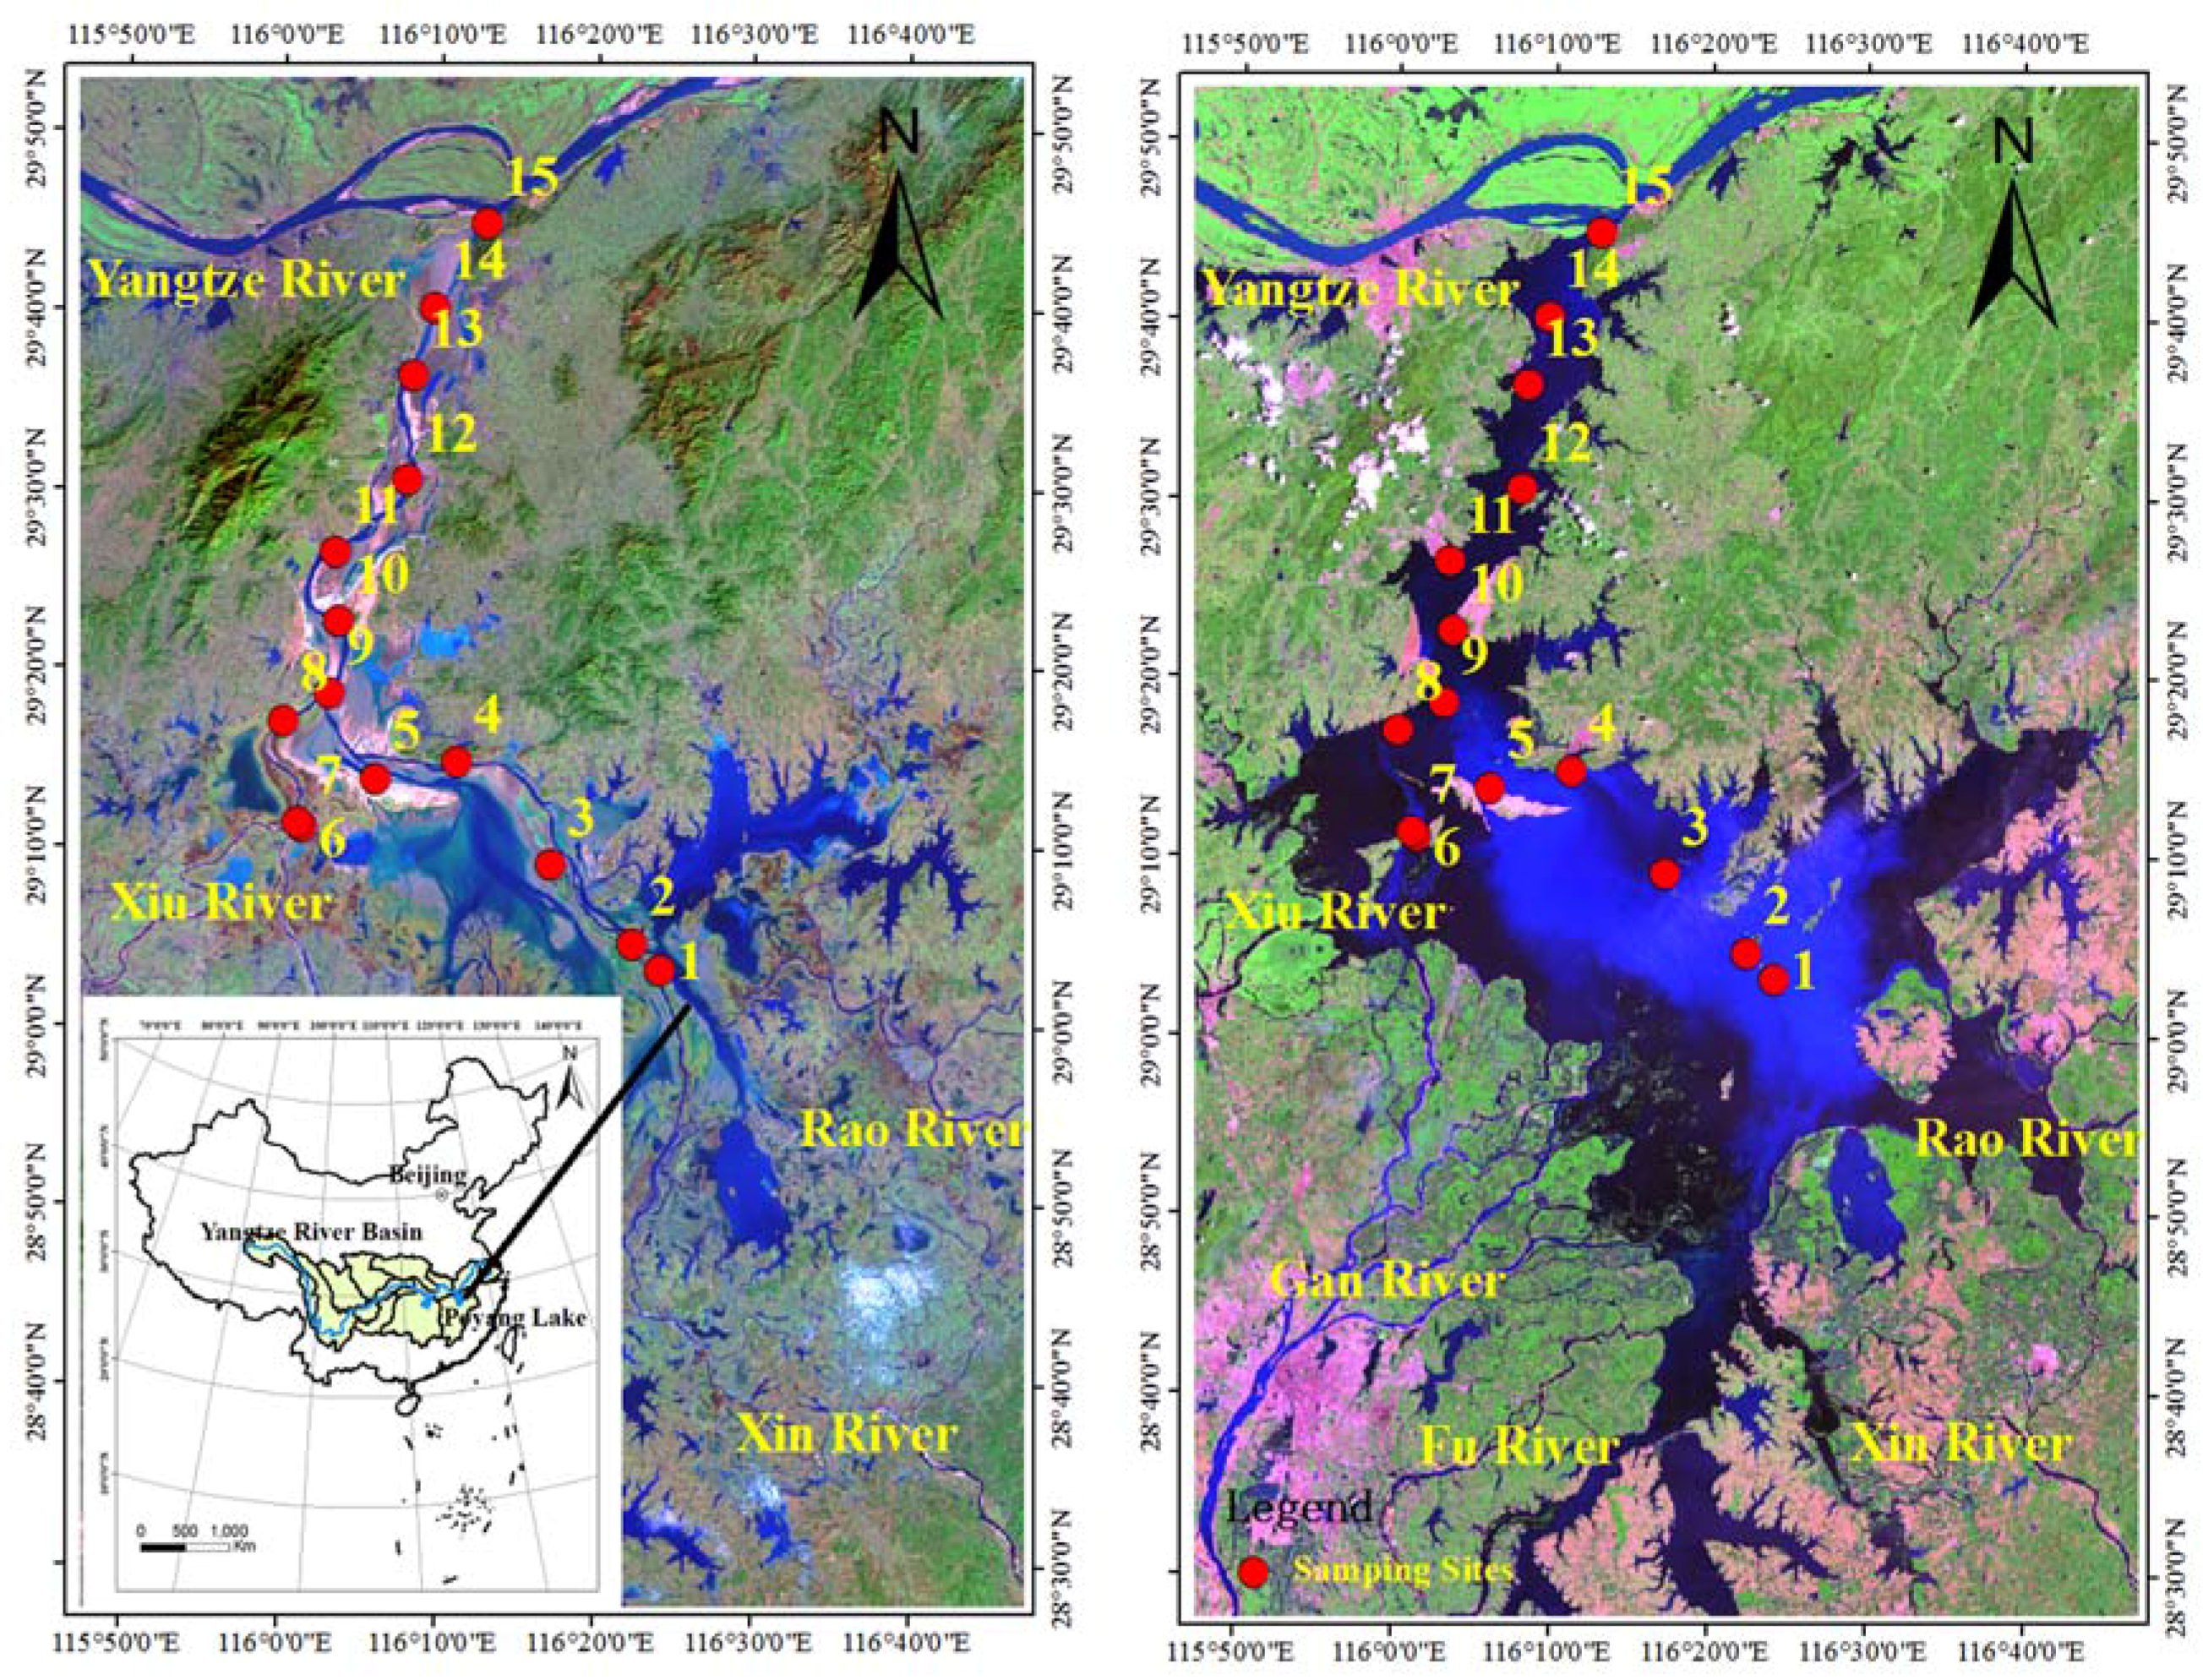
2.1. Study Area

Poyang Lake is located at the southern bank of the Yangtze River in Jiangxi Province, China (Figure 1). Jiangxi Province accounts for 97% of the total catchment of the Poyang Lake basin, which has a typical subtropical monsoon climate with an average annual temperature of 17.6 °C and a mean annual precipitation of 1450 mm to 1550 mm that is mostly concentrated in the summer (July). Poyang Lake nourishes a drainage area of 16.22 × 10⁴ km2, and plays a significant role in supplying freshwater and fish, restricting flooding, regulating the climate, and degrading pollutants in the area. It is primarily fed by the Gan, Fu, Xin, Rao and Xiu Rivers, and it is freely connected to the Yangtze River at Hukou. The discharge from the tributaries greatly increases from April to June, with the water level rising. Then the discharge from the tributaries decreases gradually in July–August while the high water level in the Yangtze River impedes the drawdown of the lake, resulting in the highest water level during this period. The water level of the lake gradually decreases from September and the lowest water level in Poyang Lake usually occurs in January (dry season) (Figure 1 and Figure 2). Consistently with water level fluctuations, the lake area changes seasonally and reaches its peaks in summer (about 4000 km2) [19]. However, the velocities of flow within the lake were opposite to the water level variations, for example, in the dry season, the lake takes on riverine features with the highest velocity, and lowest velocity in the wet season.

2.2. Sampling Sites and Sample Collection

Figure 1 shows the distribution of the sampling sites throughout Poyang Lake and its tributaries. These 15 sampling sites were selected on the basis of the size of the lake and its proximity to rivers and human activities. Site 1 was adjacent to the outlet of Rao River, which is the most polluted among the Poyang Lake tributaries, while site 7 was located in the outlet of Xiu River, of which the upper stream is the Zhelin Reservoir. Site 4 was set at the Duchang gauge station within the lake. Site 8 was located at the outlet of a subsidiary lake (Bang Lake). Sites 10 to 15 were located in the northern Poyang Lake–Yangtze River waterway, and site 15 is situated at the junction of Poyang Lake and the Yangtze River. In addition, all sampling sites were covered with water throughout the entire year despite the seasonal variation in the water levels of Poyang Lake (Figure 1). Data on monthly water level of site 4 (Duchang) were obtained from the Hydrological Bureau of Jiangxi Province. Since estimates of sewage from tributaries into the lake for different years are difficult to acquire, and given the fact that the Jiangxi Province accounts for about 97% of the Poyang Lake basin, outlet of which is the Poyang Lake. Data on inter-annual sewage discharge into the rivers in Jiangxi Province obtained from the Jiangxi Water Resources Bulletin, was used as a proxy for sewage flow into the lake. In addition, monthly discharge and pollutant concentrations (TP and NH4–N) from five main tributaries from 2009 to 2011 were gathered to analyze the pollutant variation within the year.
Seasonal sampling campaigns were implemented at these sites (n = 15) from 2009 to 2014. A total of 360 (15 sites × 4 seasons × 6 years) surface water samples (0 m to 0.5 m) were collected. Since the water level has typical variations from winter (January) to spring (April), summer (July) and fall (October), water quality samples were collected accordingly (every three months) to analyze relationships between water quality and water level fluctuations (Figure 2). Water temperature (T), pH, dissolved oxygen (DO), and electrical conductivity (EC) were measured using a Hydrolab DataSonde5 sensor in situ. The Secchi depth (SD) was determined using a Secchi disk in situ. Vertically integrated water samples were collected with acid-clean 10 L plastic buckets and kept at 3 °C in a portable refrigerator before they were transported to the laboratory. The standard methods of the American Public Health Association [20] were followed in estimating of suspended solids (SS), chemical oxygen demand (CODMn), total nitrogen (TN), total phosphorus (TP) and ammonia nitrogen (NH4–N). To estimate the chlorophyll–a concentration (Chl–a), the water samples were first filtered through pre-combusted (450 °C for 4 h) Whatman GF/F filters (47 mm) and then measured with a spectrophotometer after extraction in hot 90% ethanol [21]. The temporal and spatial variations of the nutrient indicators including TN, TP, NH4–N and Chl–a were examined and 11 parameters were used for the principal component analysis (PCA). NH4–N concentration was found the most important nutrient factor controlling the presence frequency of aquatic vegetation, which is crucial for degradation of pollutants [22].

2.3. Statistical Analysis and Visualization

In reference to the study of Akyuz et al. [23], we examined the seasonal variations at each sampling site using a relative seasonal average (RMse,s,p):
R M se , s , p = X ¯ s e , s , p X ¯ s , p
where X ¯ s e , s , p is the average parameter (p) value for each season (se) of the study period at each site (s) and X ¯ s , p is the average parameter at each site over the entire study period (2009–2014). The se = 1, 4, 7, 10 denotes winter, spring, summer and fall respectively. X ¯ s , p was then divided by the average over all sites ( X ¯ p ) as follows:
R S s , p = X ¯ s , p X ¯ p 1
where RSs,p represents the variations between different sampling sites (s) for each parameter (p). The mean concentration of this site is higher than the mean over all stations if RSs,p > 0, and vice-versa if RSs,p < 0.
The nutrient indicators including TN, TP, NH4–N and Chl–a were visualized using three-dimensional plots with time as the x-axis and the sampling sites as the y-axis. The skewness and kurtosis values of all the variables except for TN were far from the normal distribution. Therefore, a non-parametric Kolmogorov–Smirnov test (K–S test) was performed to examine the difference between groups. The statistical analyses, including the calculation, Pearson correlation analysis, K–S test, visualization, and probability density analyses were implemented in R 3.1.3 software [24]. The spatial distribution of sampling sites and indices was mapped using the ArcGIS 10.2 software.

2.4. PCA

PCA was conducted to identify important water quality parameters and to investigate the possible sources of pollutants under different water regimes. PCA was performed for the same sites in different water level phases, which were examined using two typical water regimes in Poyang Lake, namely, river phase (low water level phase) and lake phase (high water level phase). Eleven variables were included in the PCA on the basis of the correlation matrix and the corresponding significance level. PCA was performed using the CANOCO software (Version 4.5) (Microcomputer Power, New York, NY, USA) to ascertain the importance of environmental parameters. Kaisere-Meyere-Olkin (KMO) and Bartlett’s tests were applied to examine the compatibility of the data with the PCA. The significance of the variables (loadings) in the PCA was determined with the vertical distance of each arrow from the x or y axis, and the scatter point showed the PCA scores of the different sampling sites.

3. Results

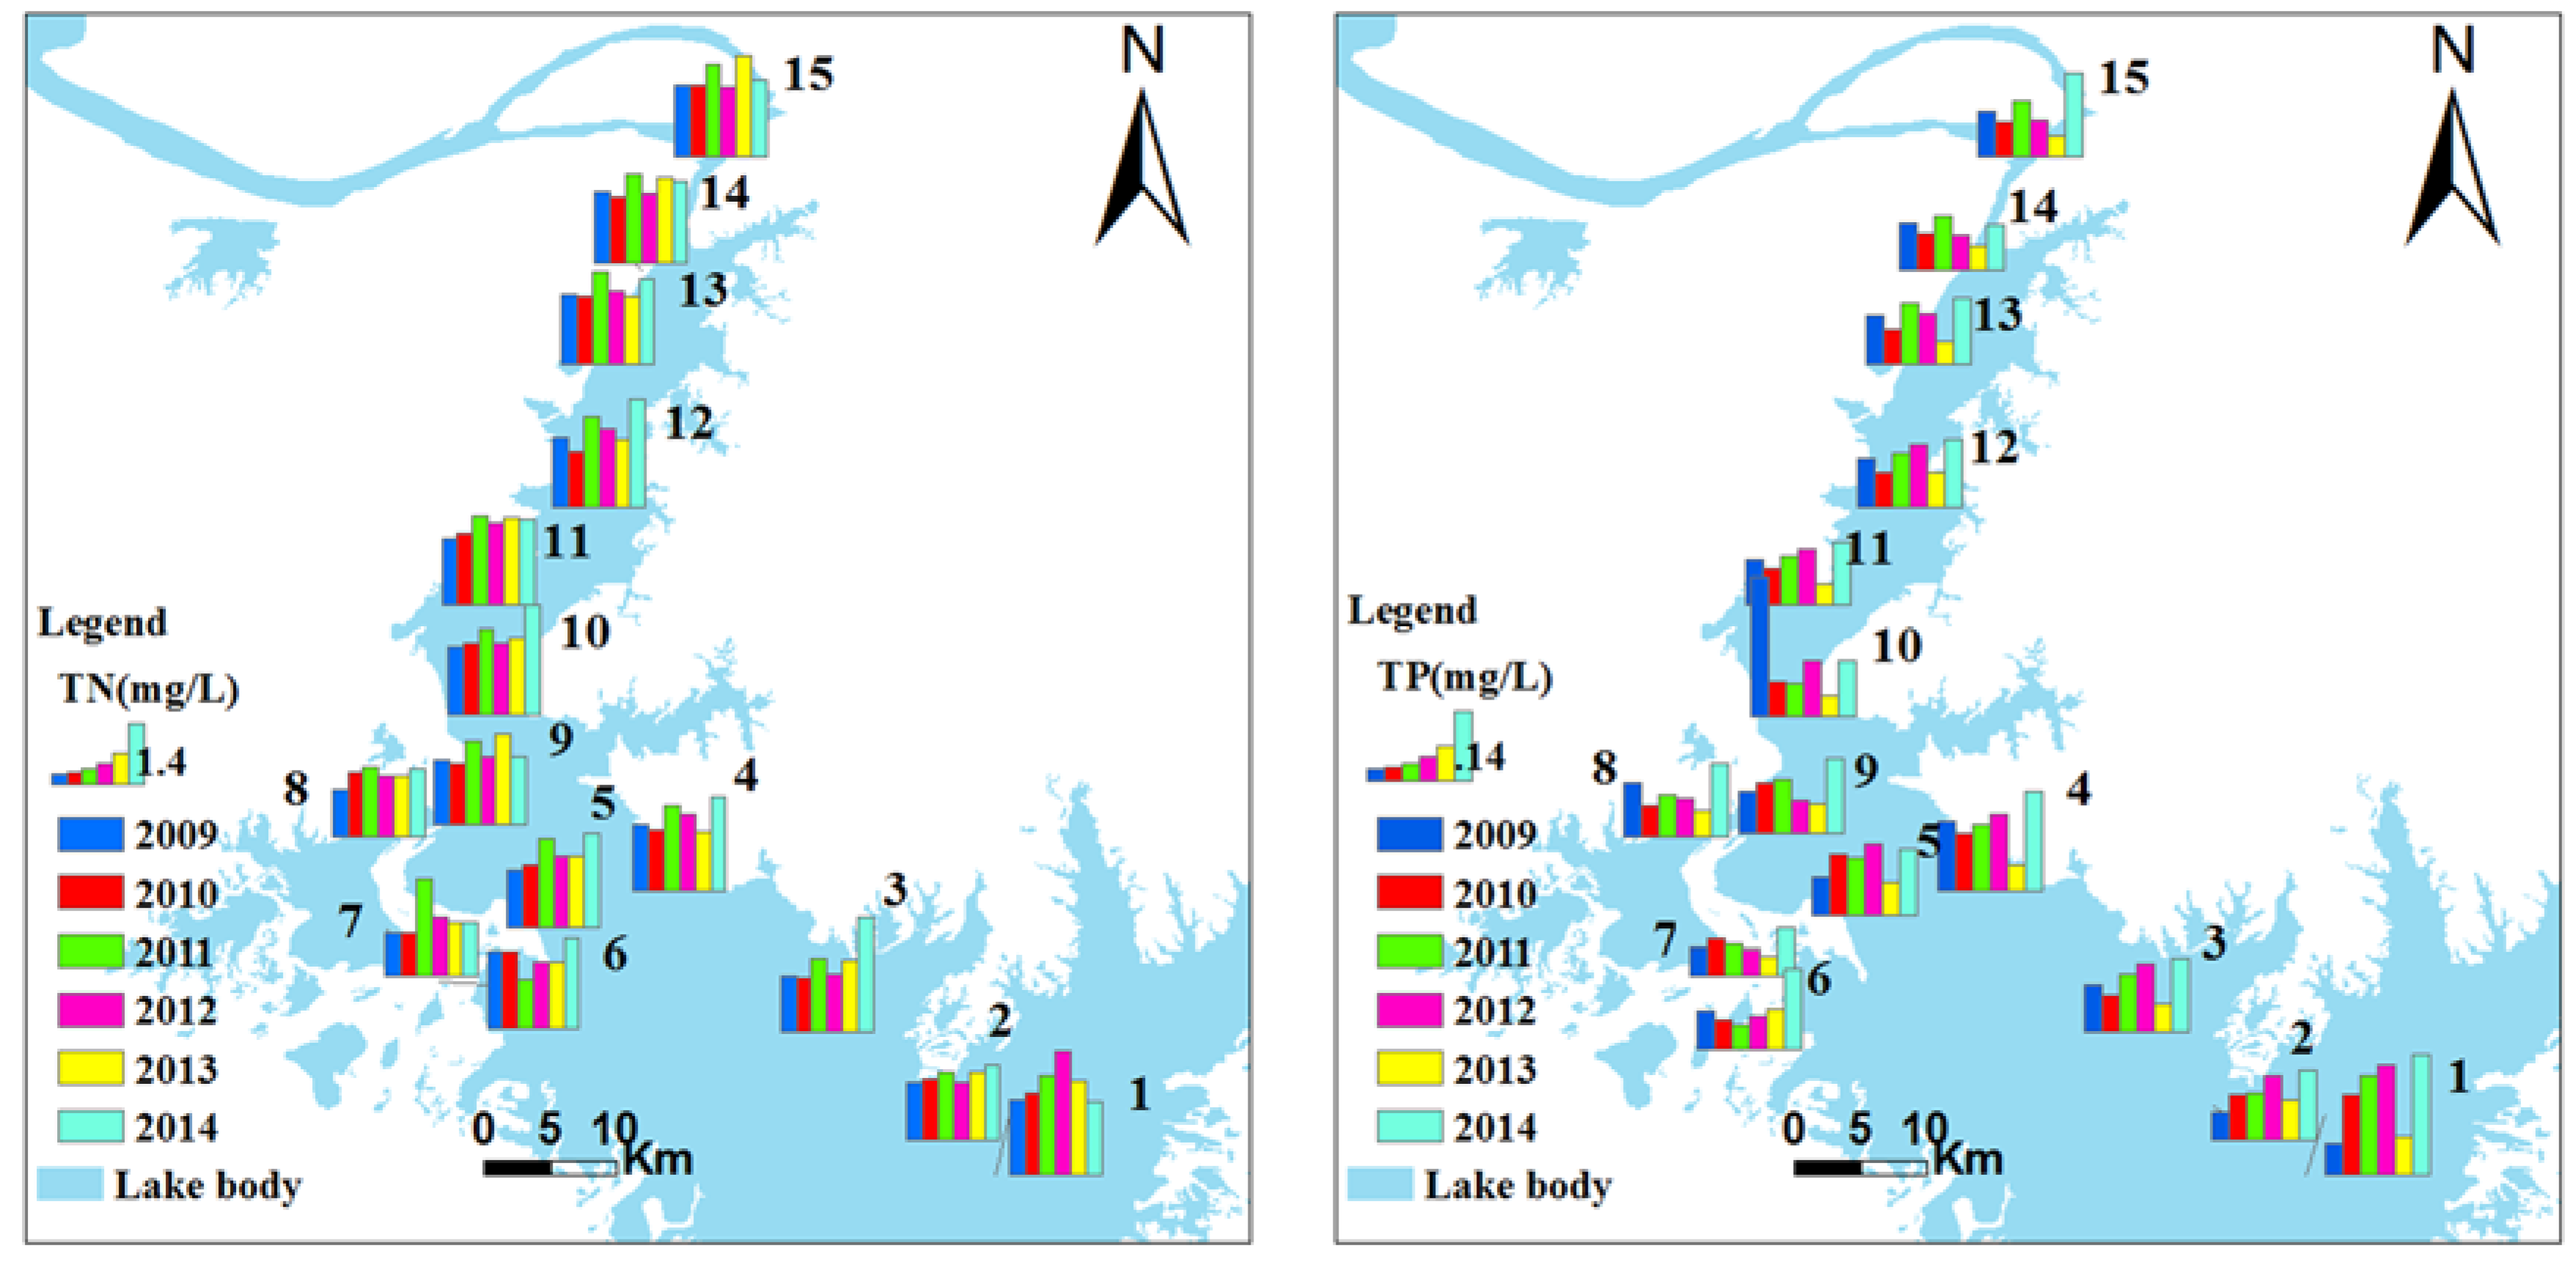
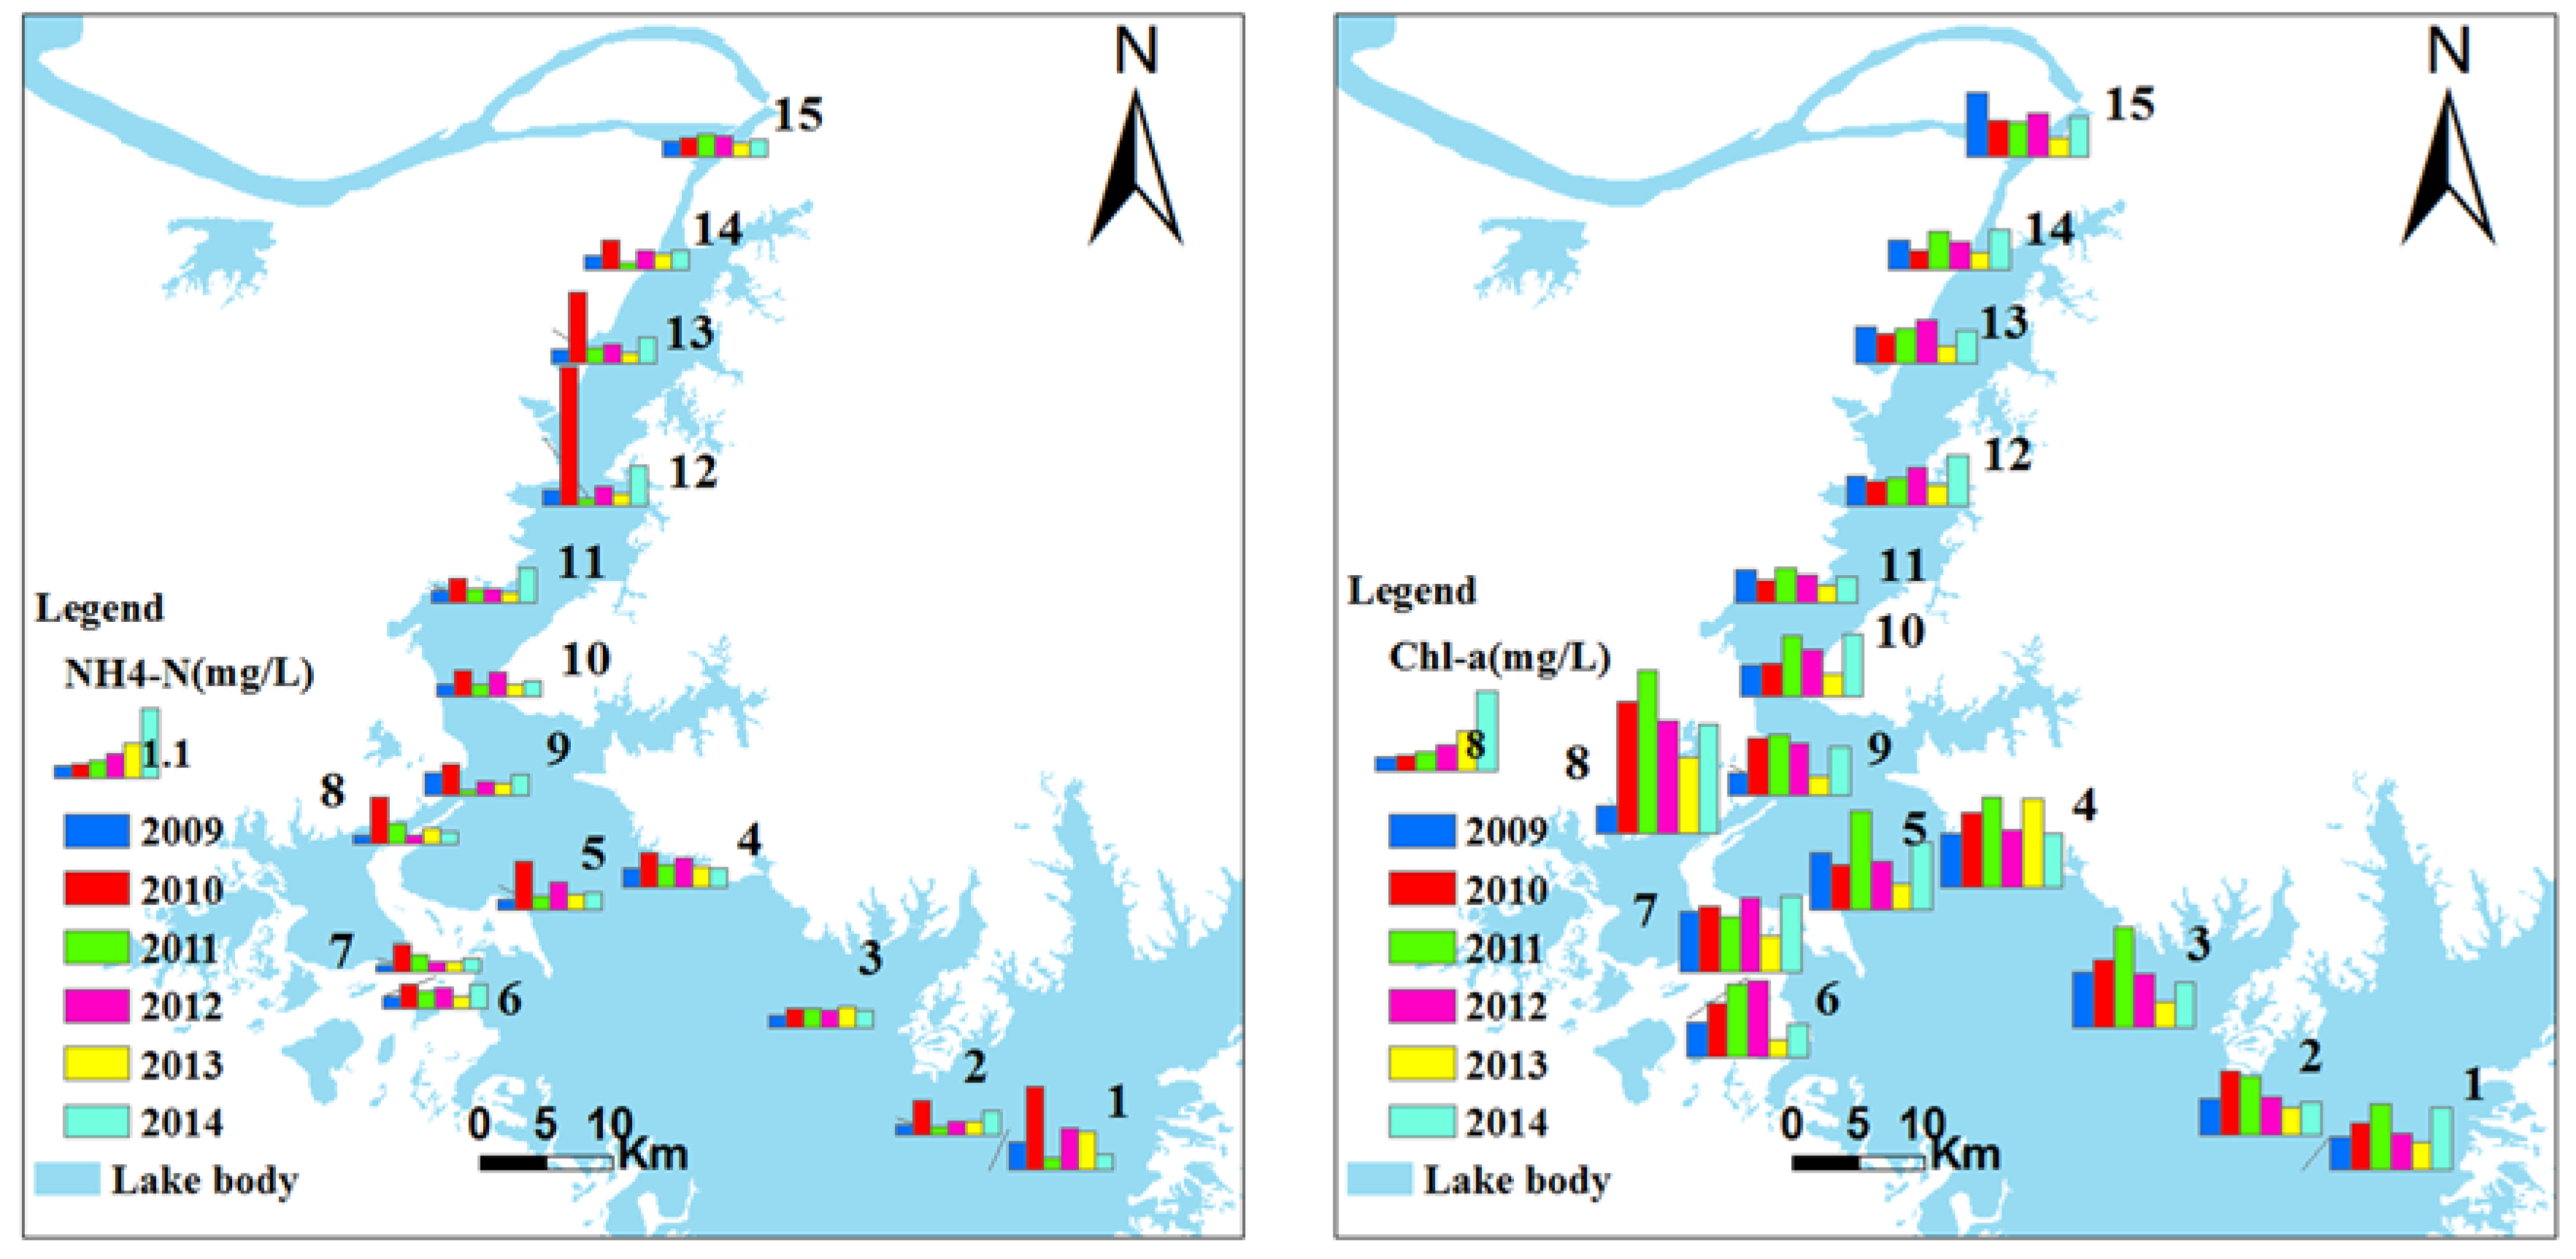
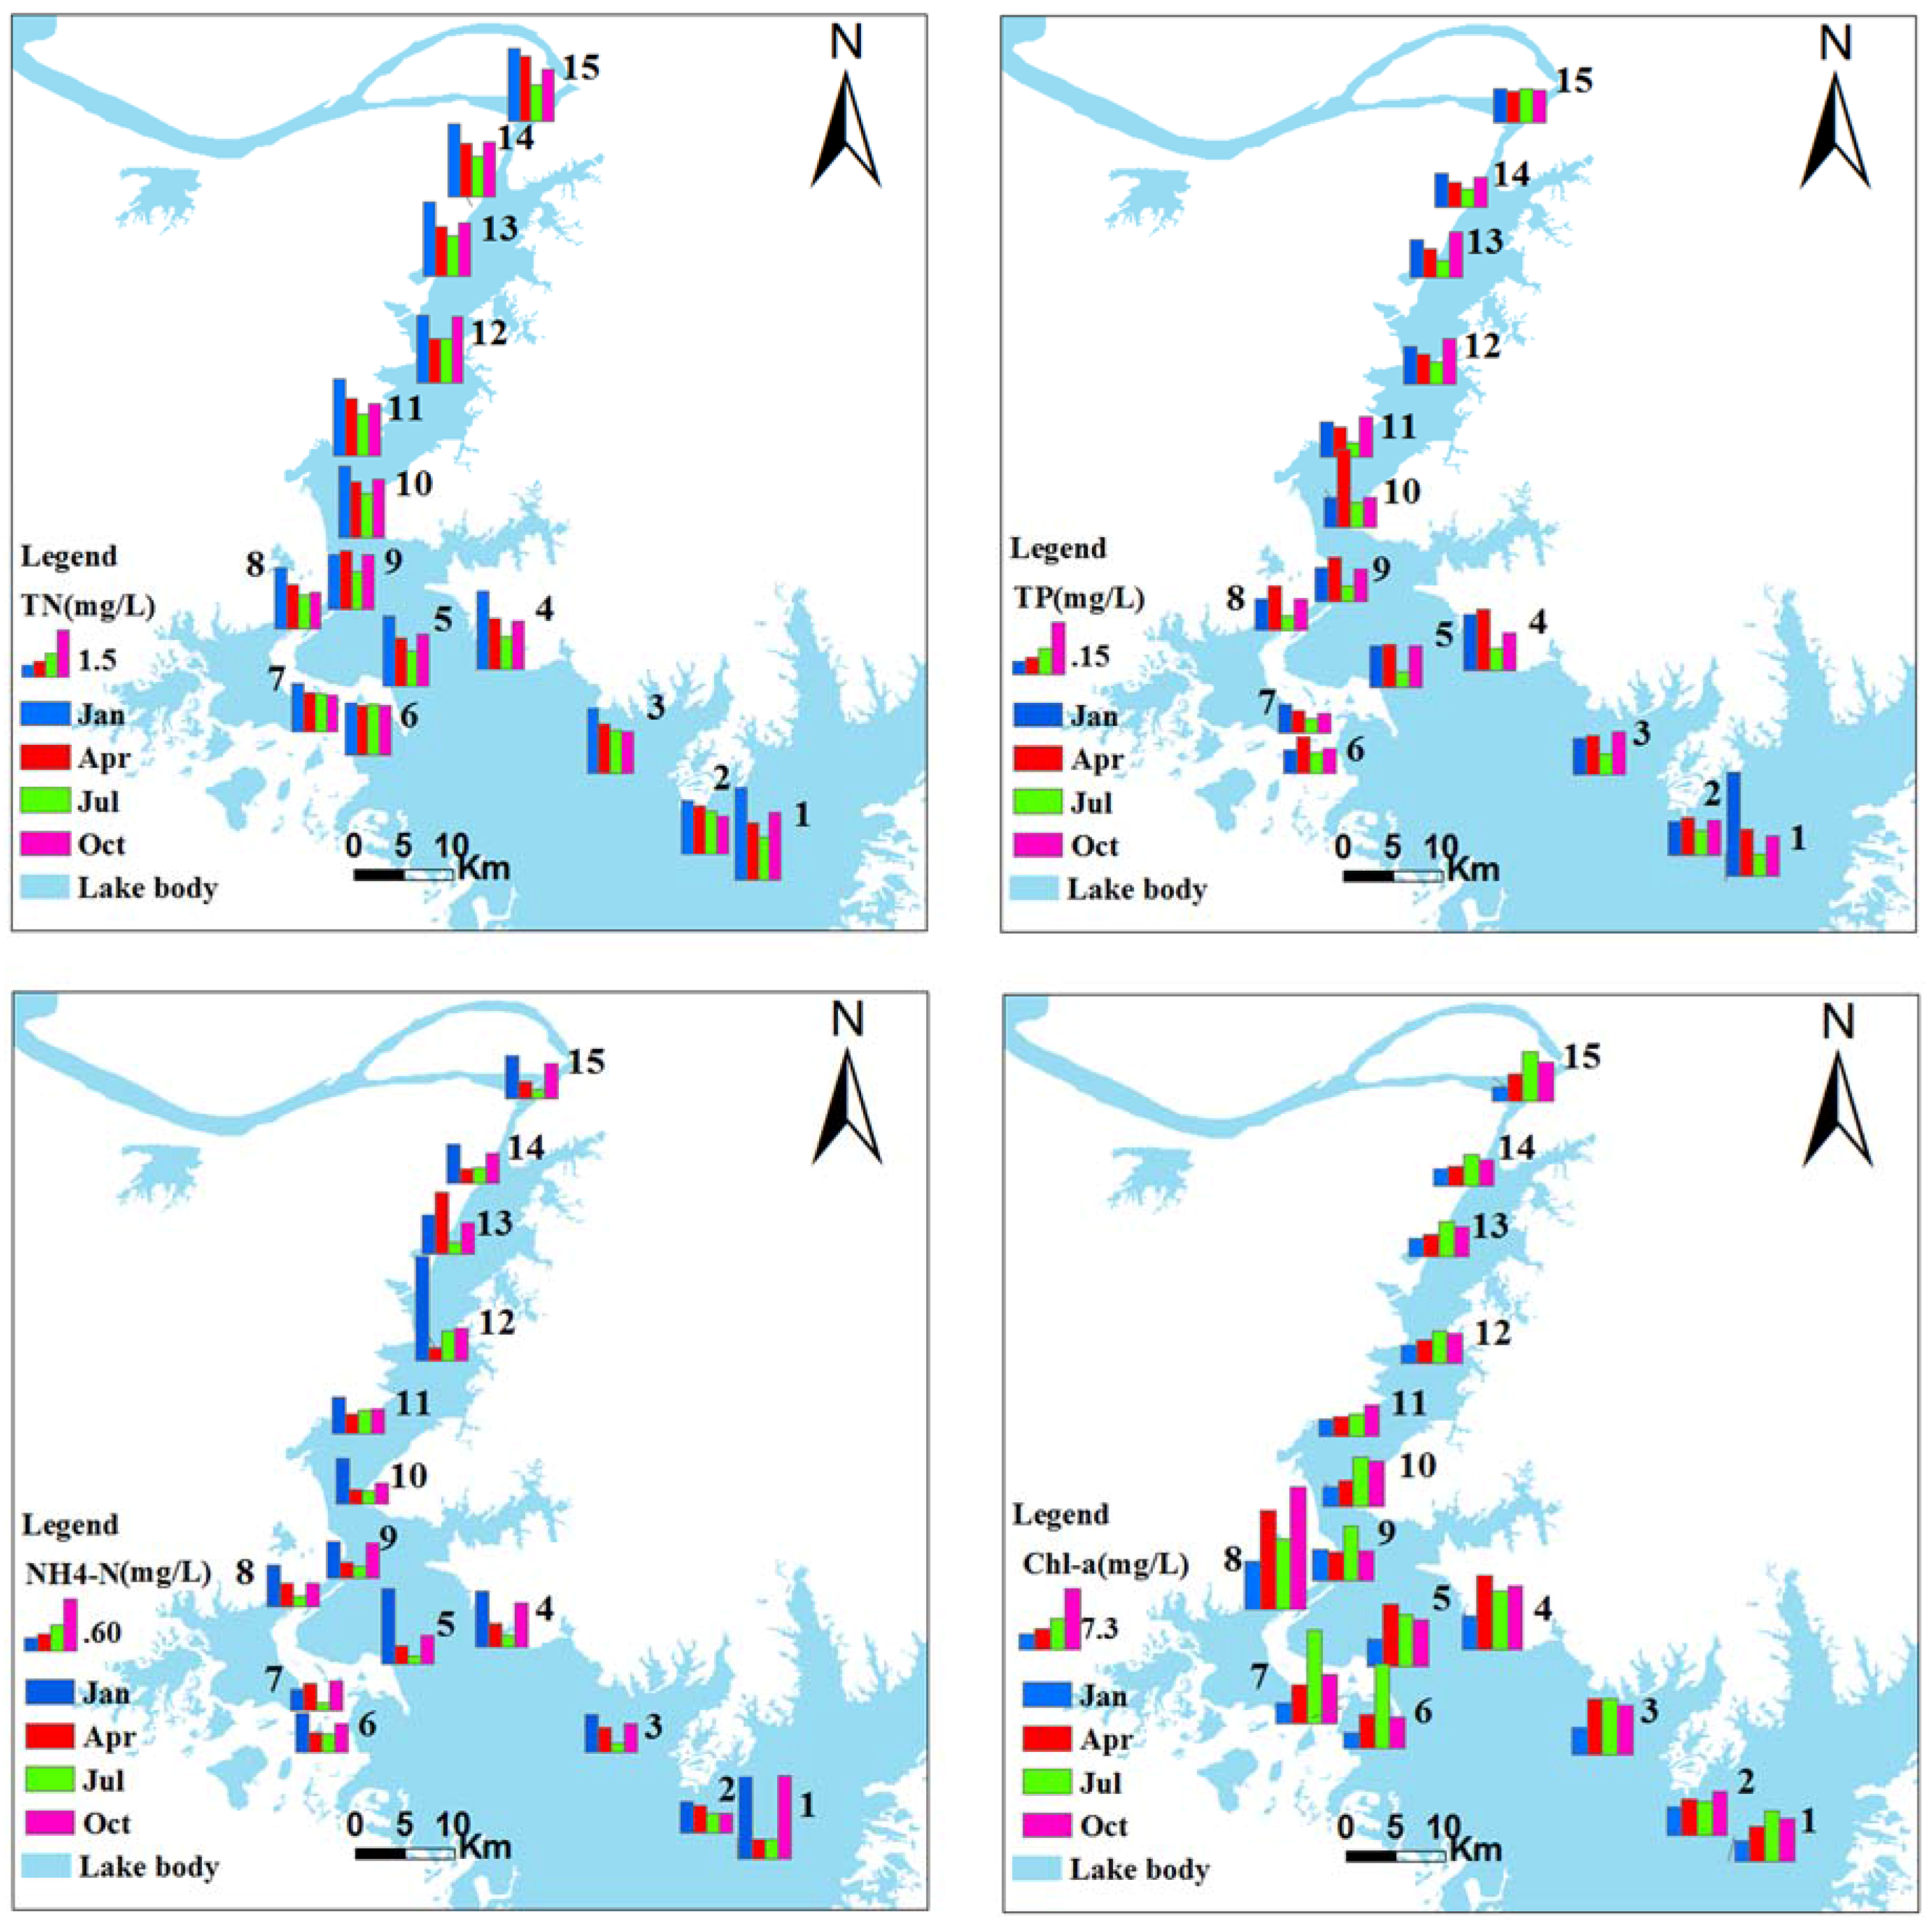
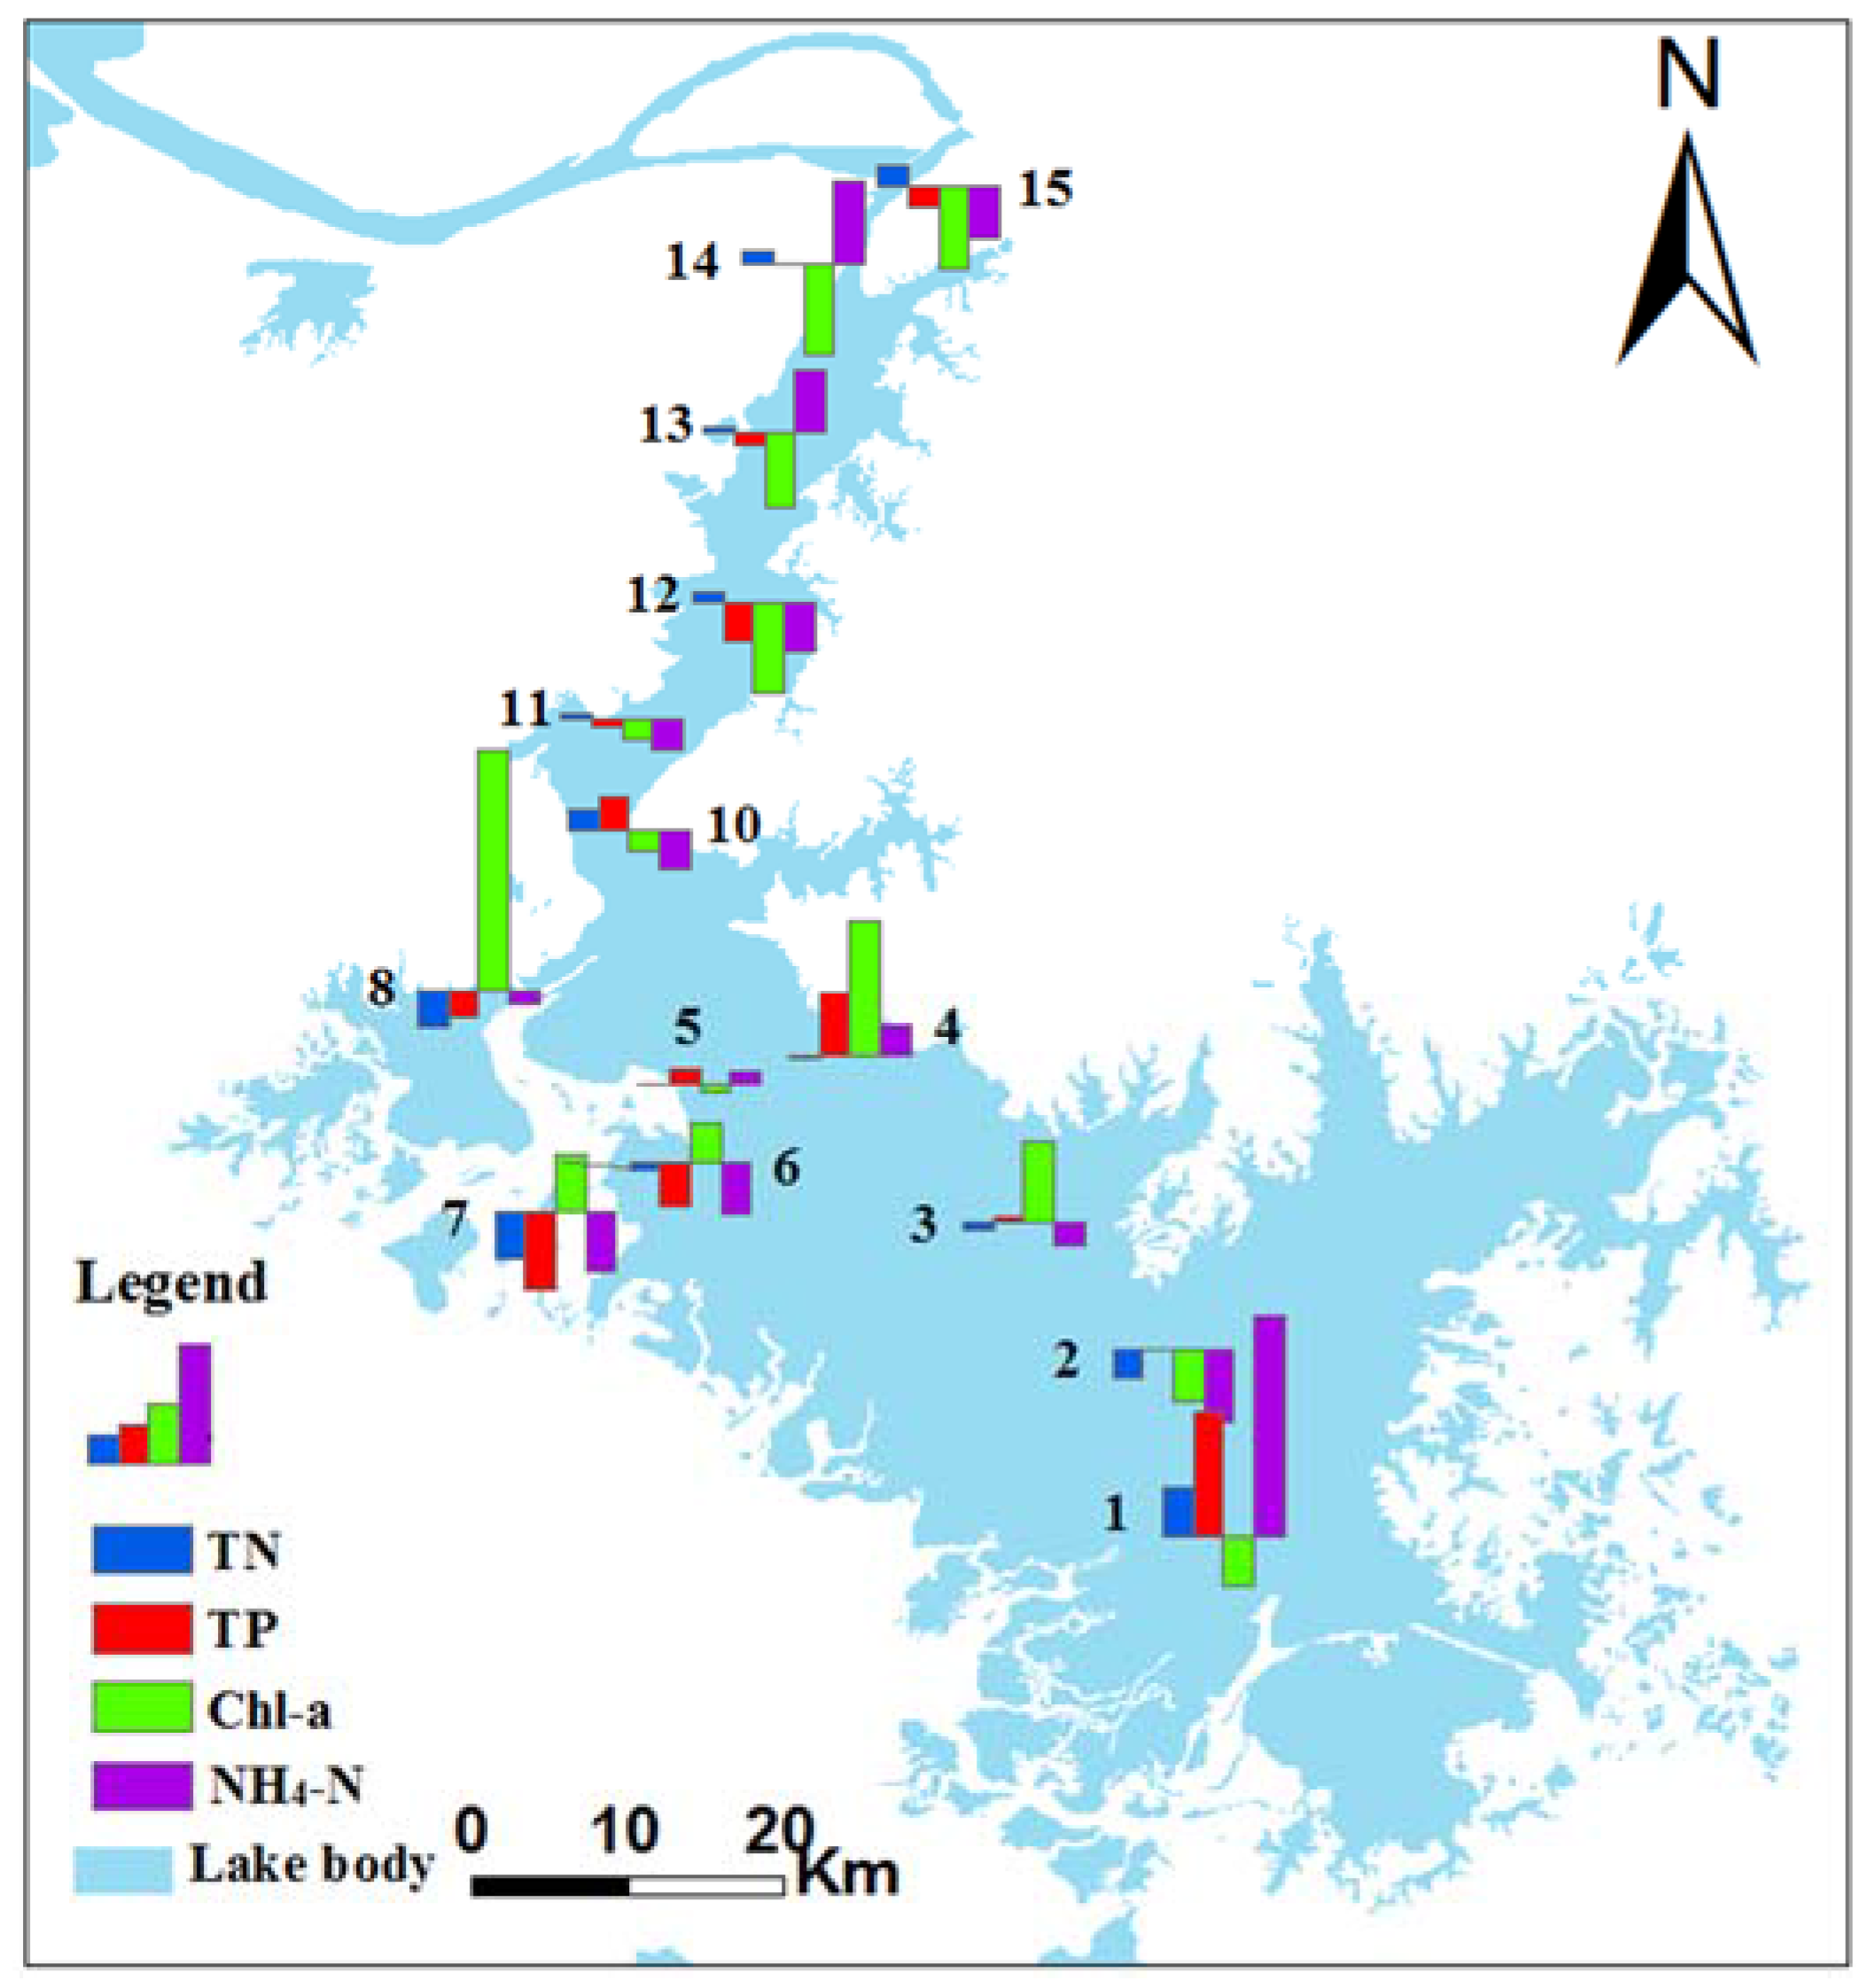
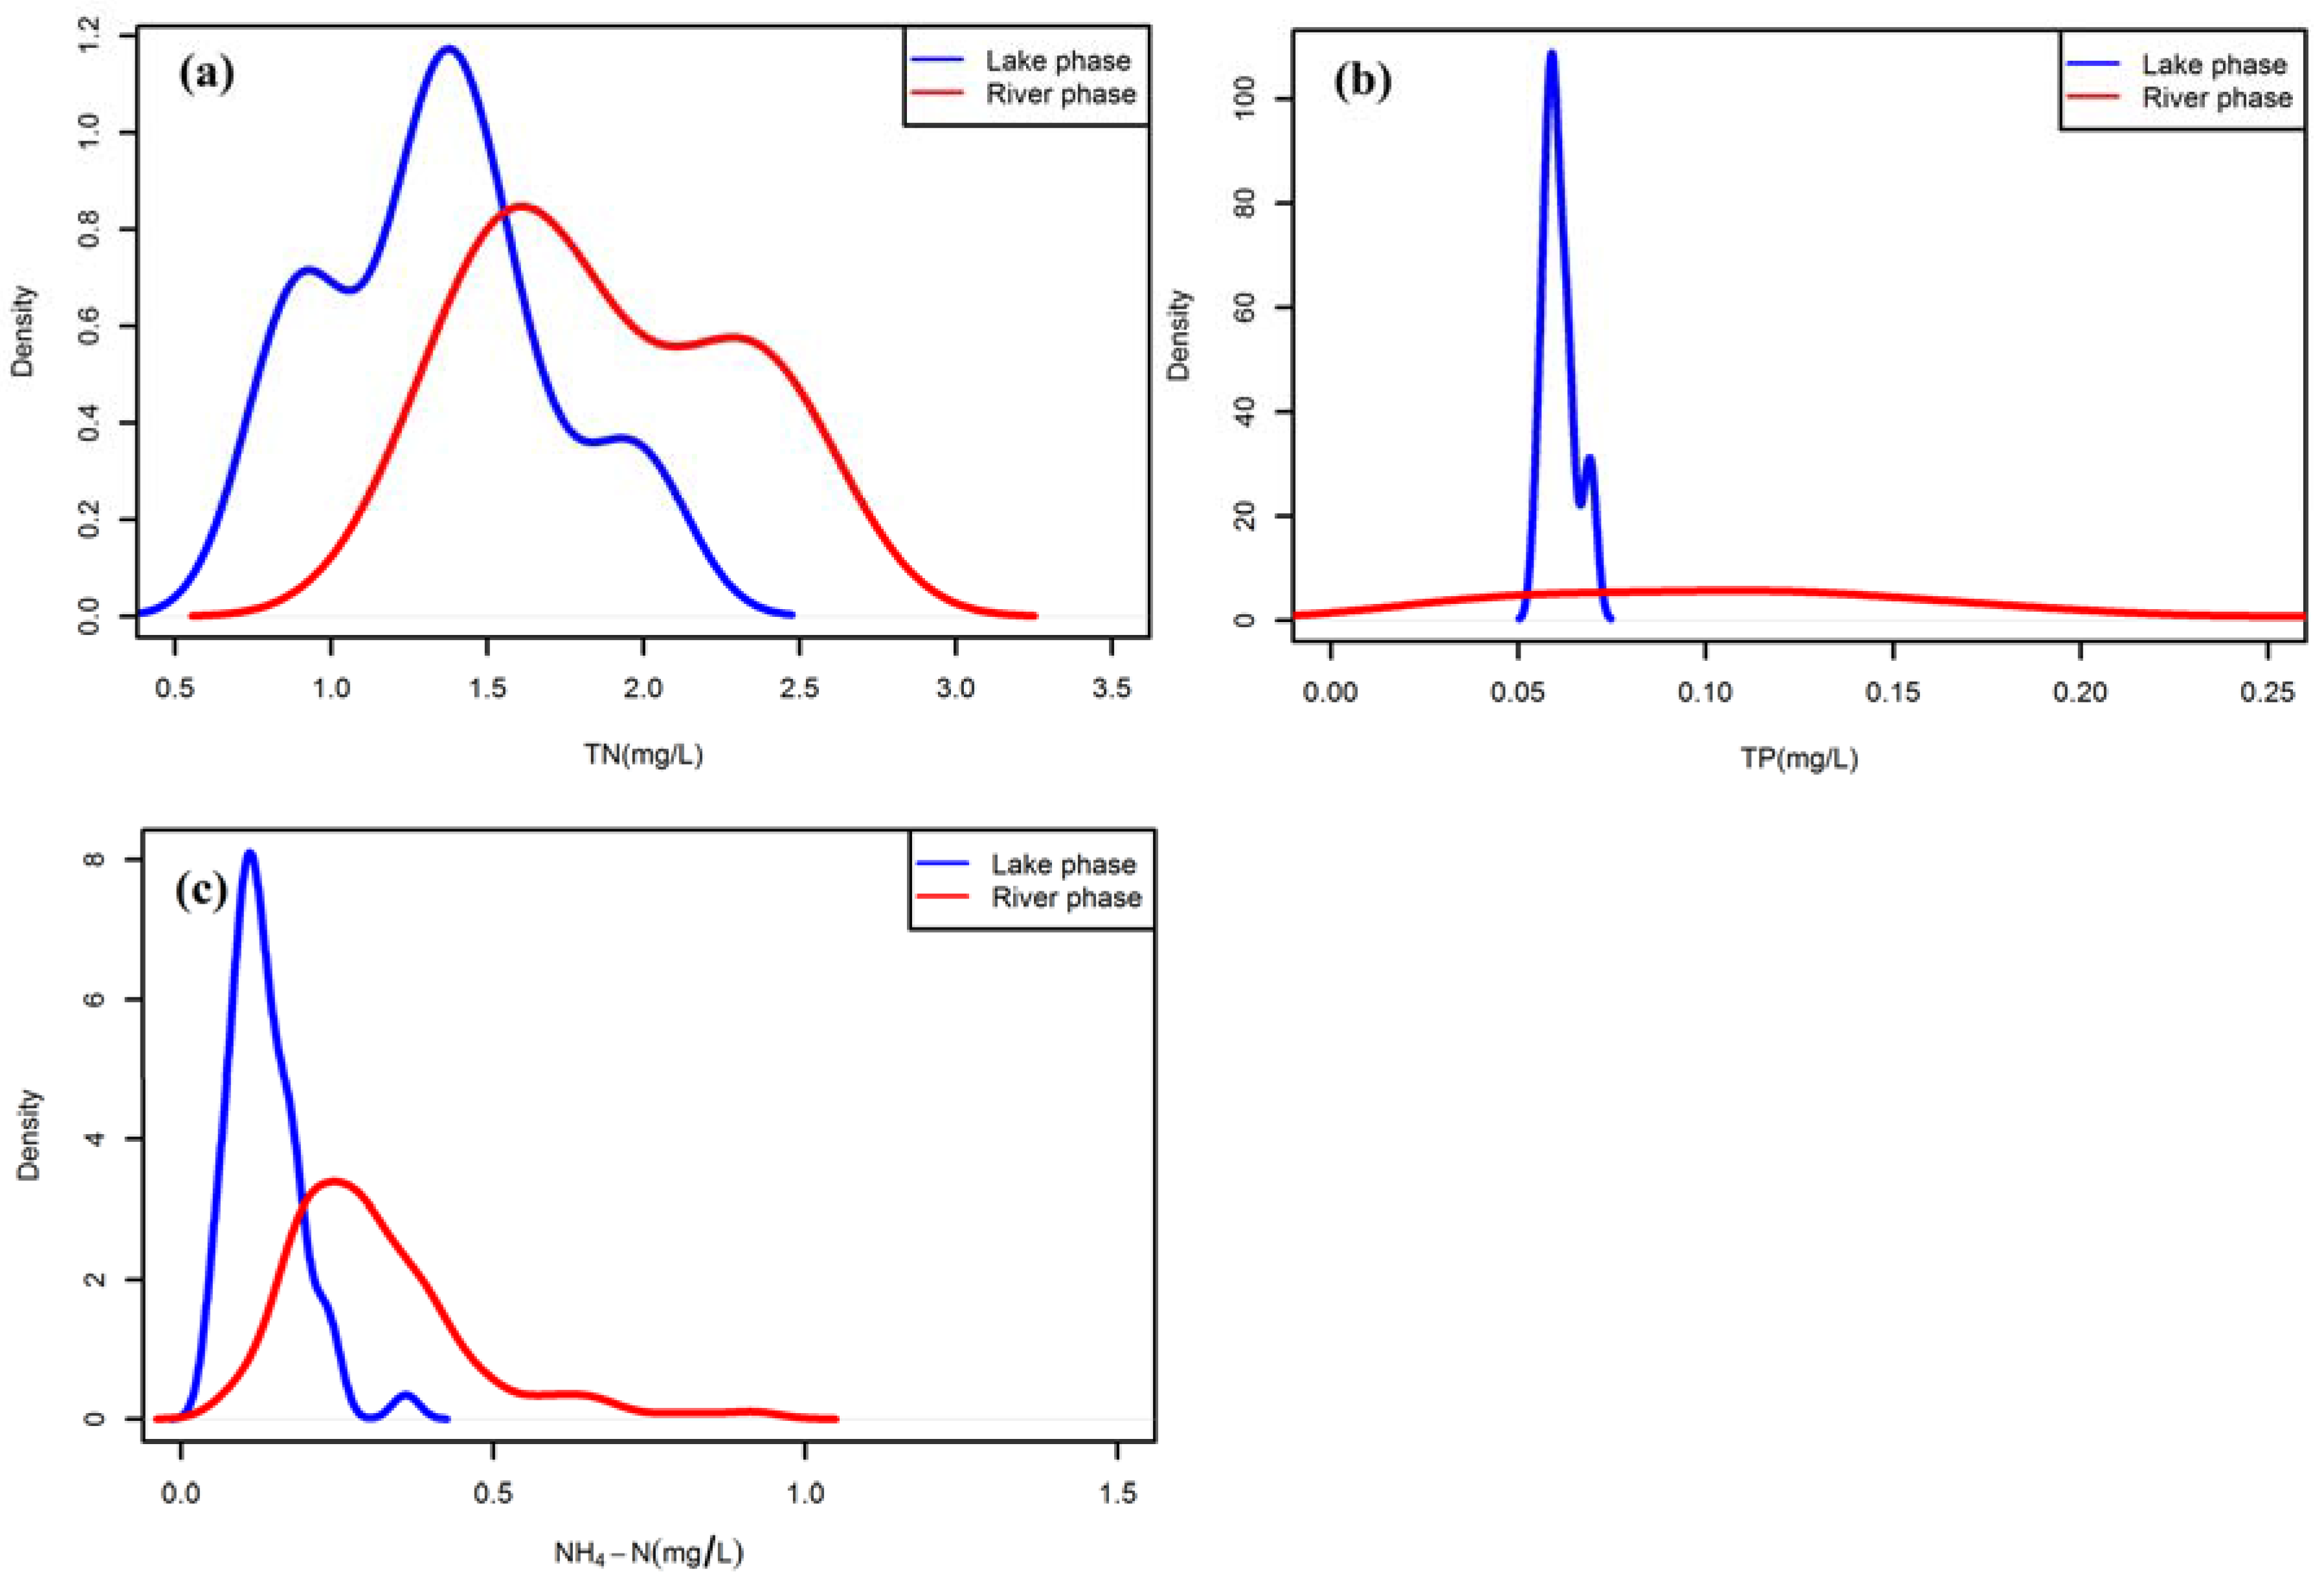
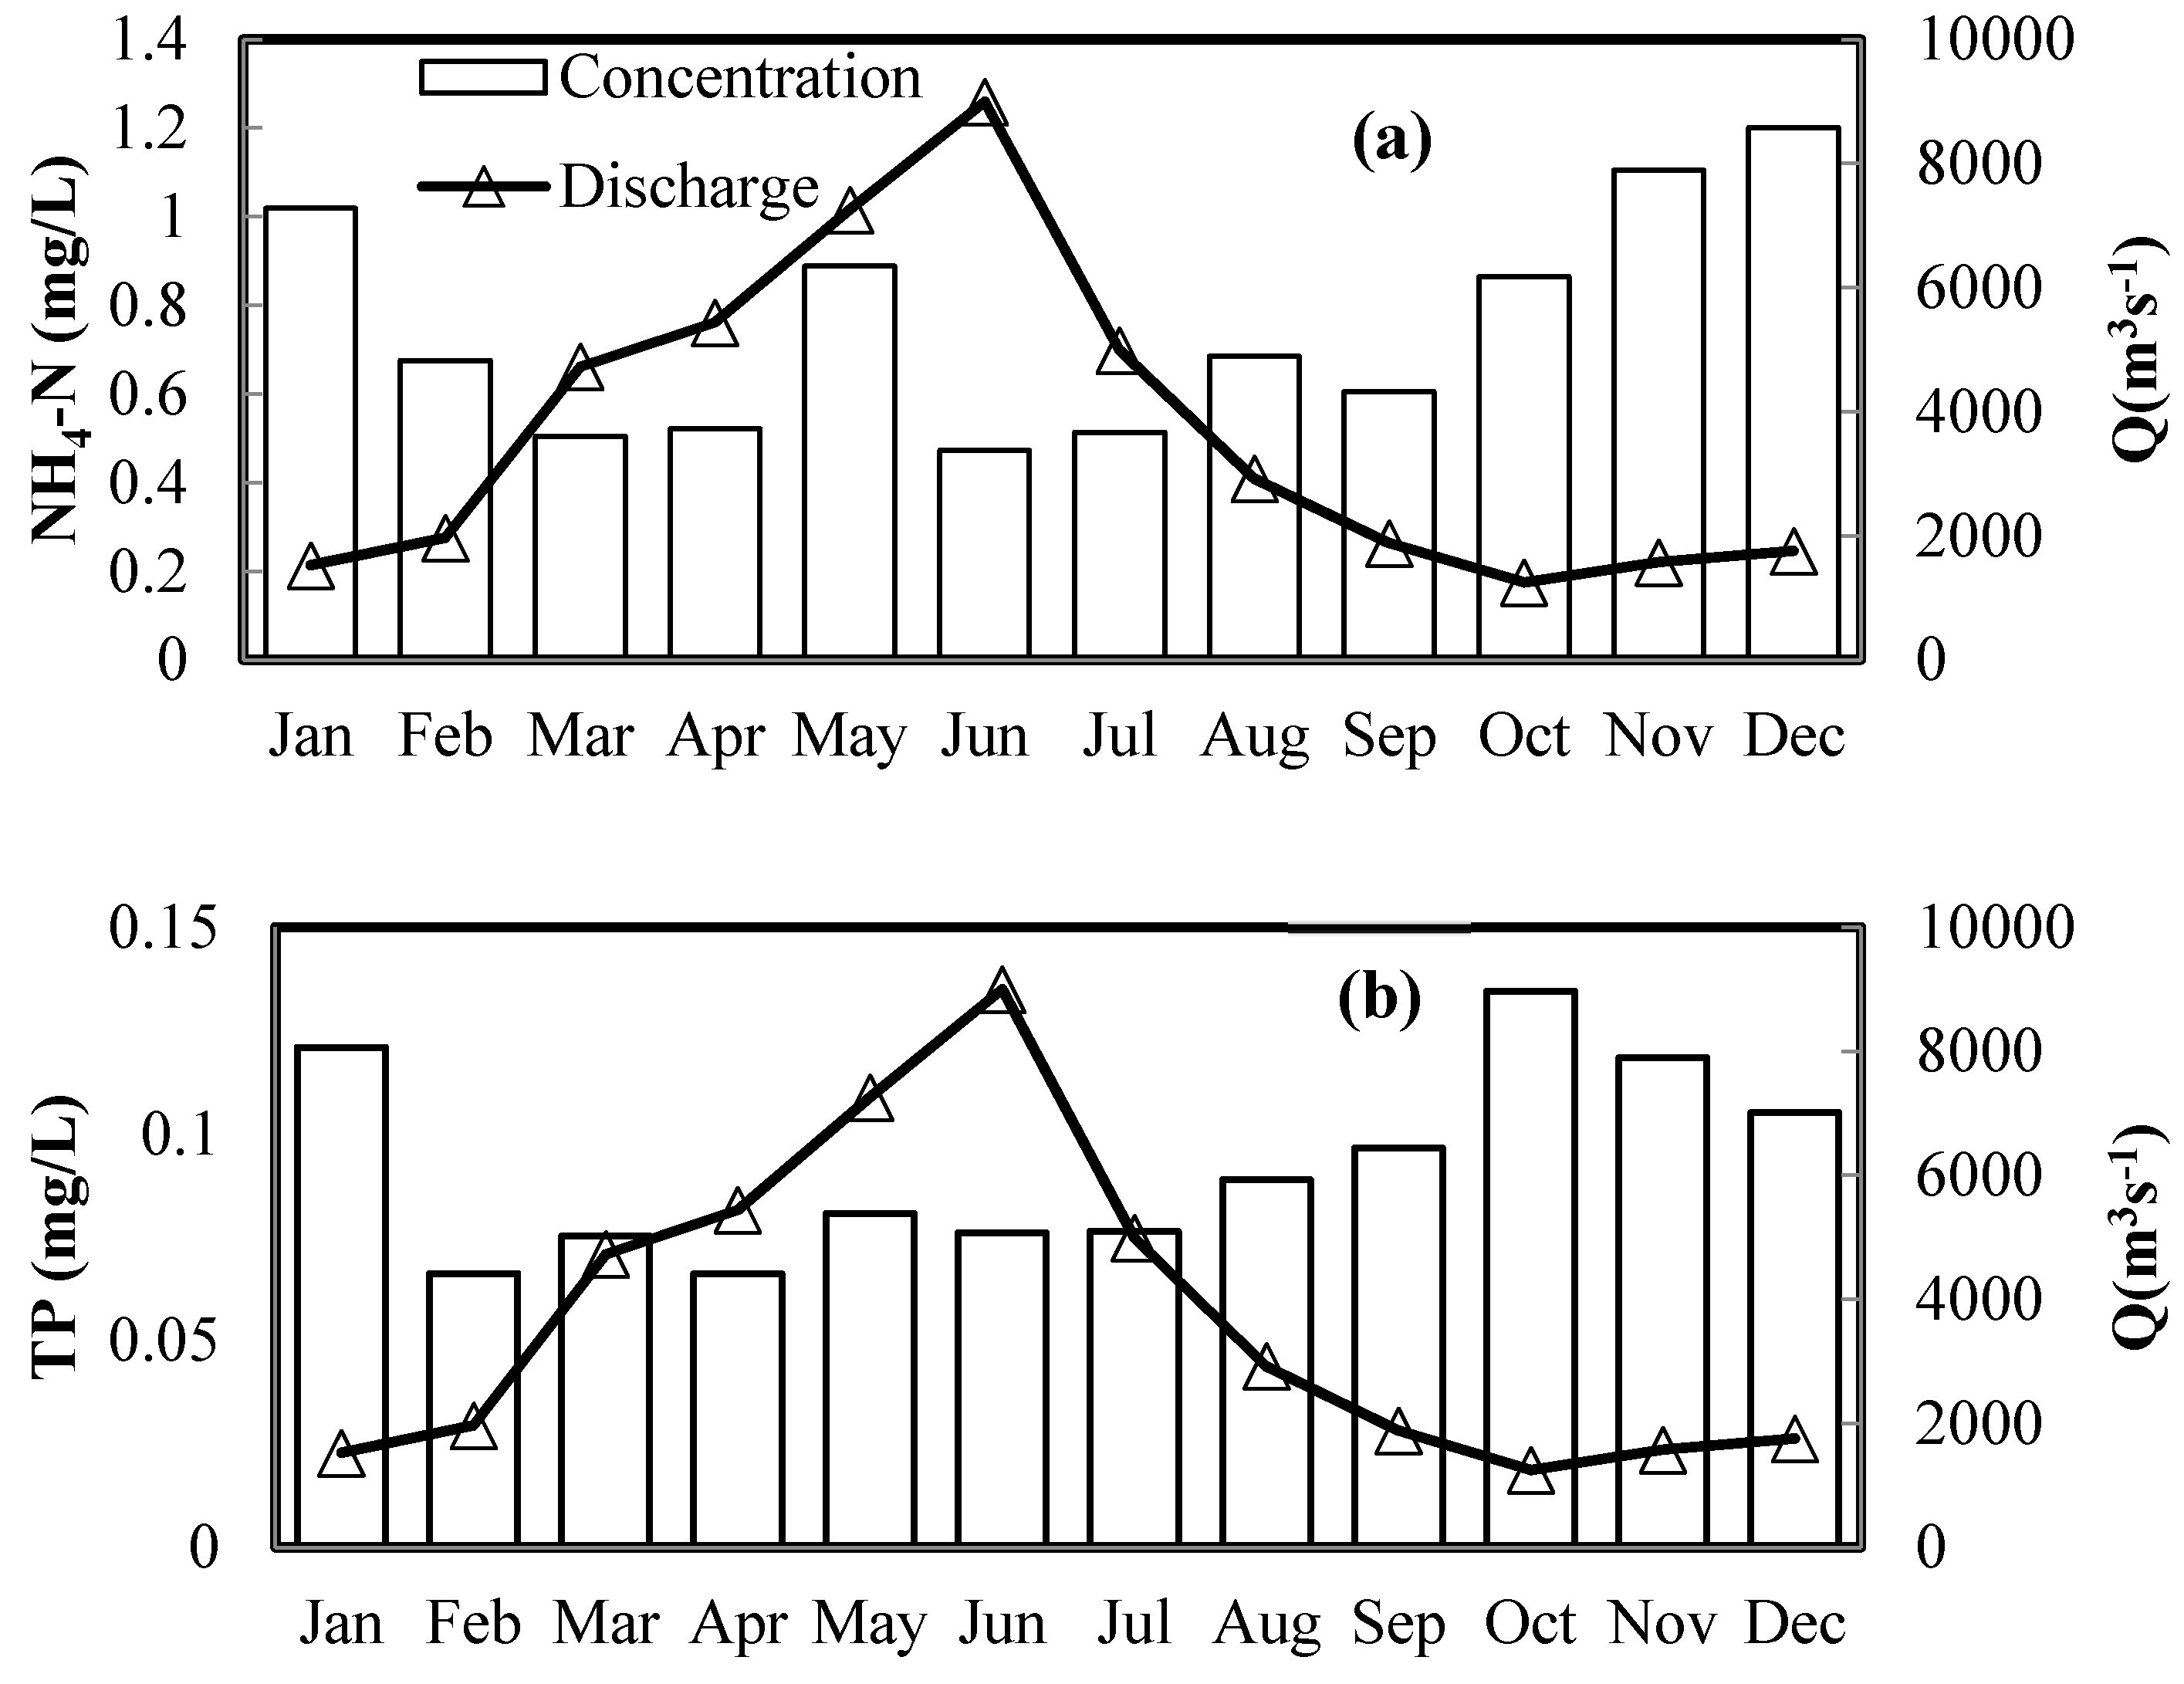
3.1. Spatial-Temporal Variations

According to K–S test, the water quality variables, except for T, EC, and SS, showed significant inter-annual variations (p < 0.05). The highest EC (164.6 μs/cm), SS (73.98 mg/L), and CODMn (3.5 mg/L), and the lowest DO level of (7.55 mg/L) were recorded in 2011. For the nutrient indicators only, the highest Chl–a concentration was observed in the same year, while TN concentration was significantly higher in 2011 and 2014 (Figure 3). The TP concentration was significantly lower in 2013 (p < 0.05). Thus, the water quality in 2011 may be the worst among six years under investigation concerning TN, SS, CODMn, TP and Chl–a. 2011 was a typically dry year with an average water level of 10.96 m, with much less freshwater flow into the lake (Figure 2).
The values of all the nutrient indicators largely varied across the seasons. In all 15 sampling sites, the seasonal average TN concentration relative to the annual change (2009–2014) peaked in winter. For example, RM1,s1,TN = 1.42, RM1,s2,TN = 1.18, RM1,s4,TN = 1.49, RM1,s8,TN = 1.4, RM1,s11,TN = 1.35, and RM1,s15,TN = 1.4, which indicated a remarkably high TN concentration in the dry season. While the minimums of RMse,s,TN were mostly confined to summer (July) (sites 1, 4, 5, 8 to 15) (Figure 4). Notably, the RMse,s,TN values of the sampling sites in the Poyang Lake- Yangtze River waterway were kept minimal in July. The seasonal variations in NH4–N were similar to TN. The maximum and minimum RMse,s,NH4–N values across all stations were 2.88 (winter) and 0.12 (summer), respectively.
At individual stations, the maximum seasonal average values of TP relative to the annual average (2009–2014) from the southern to northern lake were confined in January, April and October (see Table S1). These values reflected the relatively high TP level in sites 1, 10, and 8. Furthermore, an obvious shift in maxima was observed from spring in the central lake stations to winter and autumn in the Yangtze-connected northern lake. Such observation indicated that the water quality of the stations in the central and northern lake was controlled by different environmental parameters. However, the corresponding minima of TP all occurred in summer, during which RMse,s,TP ranged from 0.43 to 0.78 (Figure 4).
The seasonal patterns of variations in Chl–a (RMse,s,Chl–a) were more complex. The maximum values of seasonal average relative to the annual average (RMse,s,Chl–a) occurred in both April, July and October, and more prone to be July (Figure 4). Besides, Figure 4 shows that the highest RMse,s,Chl–a values were recorded in sites 6, 7, 8 (1.93, 1.77, and 1.55, respectively). However, the minimum of RMse,s,Chl–a values all occurred in winter (January), during which the lowest and highest RMse,s,Chl–a values were observed in site 1 (0.31) and site 11 (0.78), respectively. Chl–a concentration showed an opposite seasonal pattern compared to other nutrient parameters, that is, the minimum RMse,s,Chl–a value was confined to winter, which could be attributed to the relatively low water temperature and underwater light conditions of Poyang lake in January [25].
The variations between stations were compared using RSs,p, which was normalized to zero to illustrate the proximity between the average parameter value for a specific station and the average parameter value for all stations from 2009 to 2014. For TN, TP, and NH4–N, the highest and lowest RSs,p values all occurred in sites 1 and 7, respectively (Figure 5). Besides, Sites 6 to 9 in the central lake tended to have a lower concentration of nutrients. For Chl–a, the highest RSs,p value (1.15) was recorded in site 8 in the Bang Lake outlet. A higher Chl–a concentration was observed in the central part of the lake. Figure 5 also notably shows that stations in Yangtze-connected northern lake had a relatively low RSs,Chl–a. Furthermore, the RSs,Chl–a, RSs,NH4–N, and RSs,TP values tended to have higher magnitudes than the RSs,TN value, which indicated relatively small spatial variations in TN.

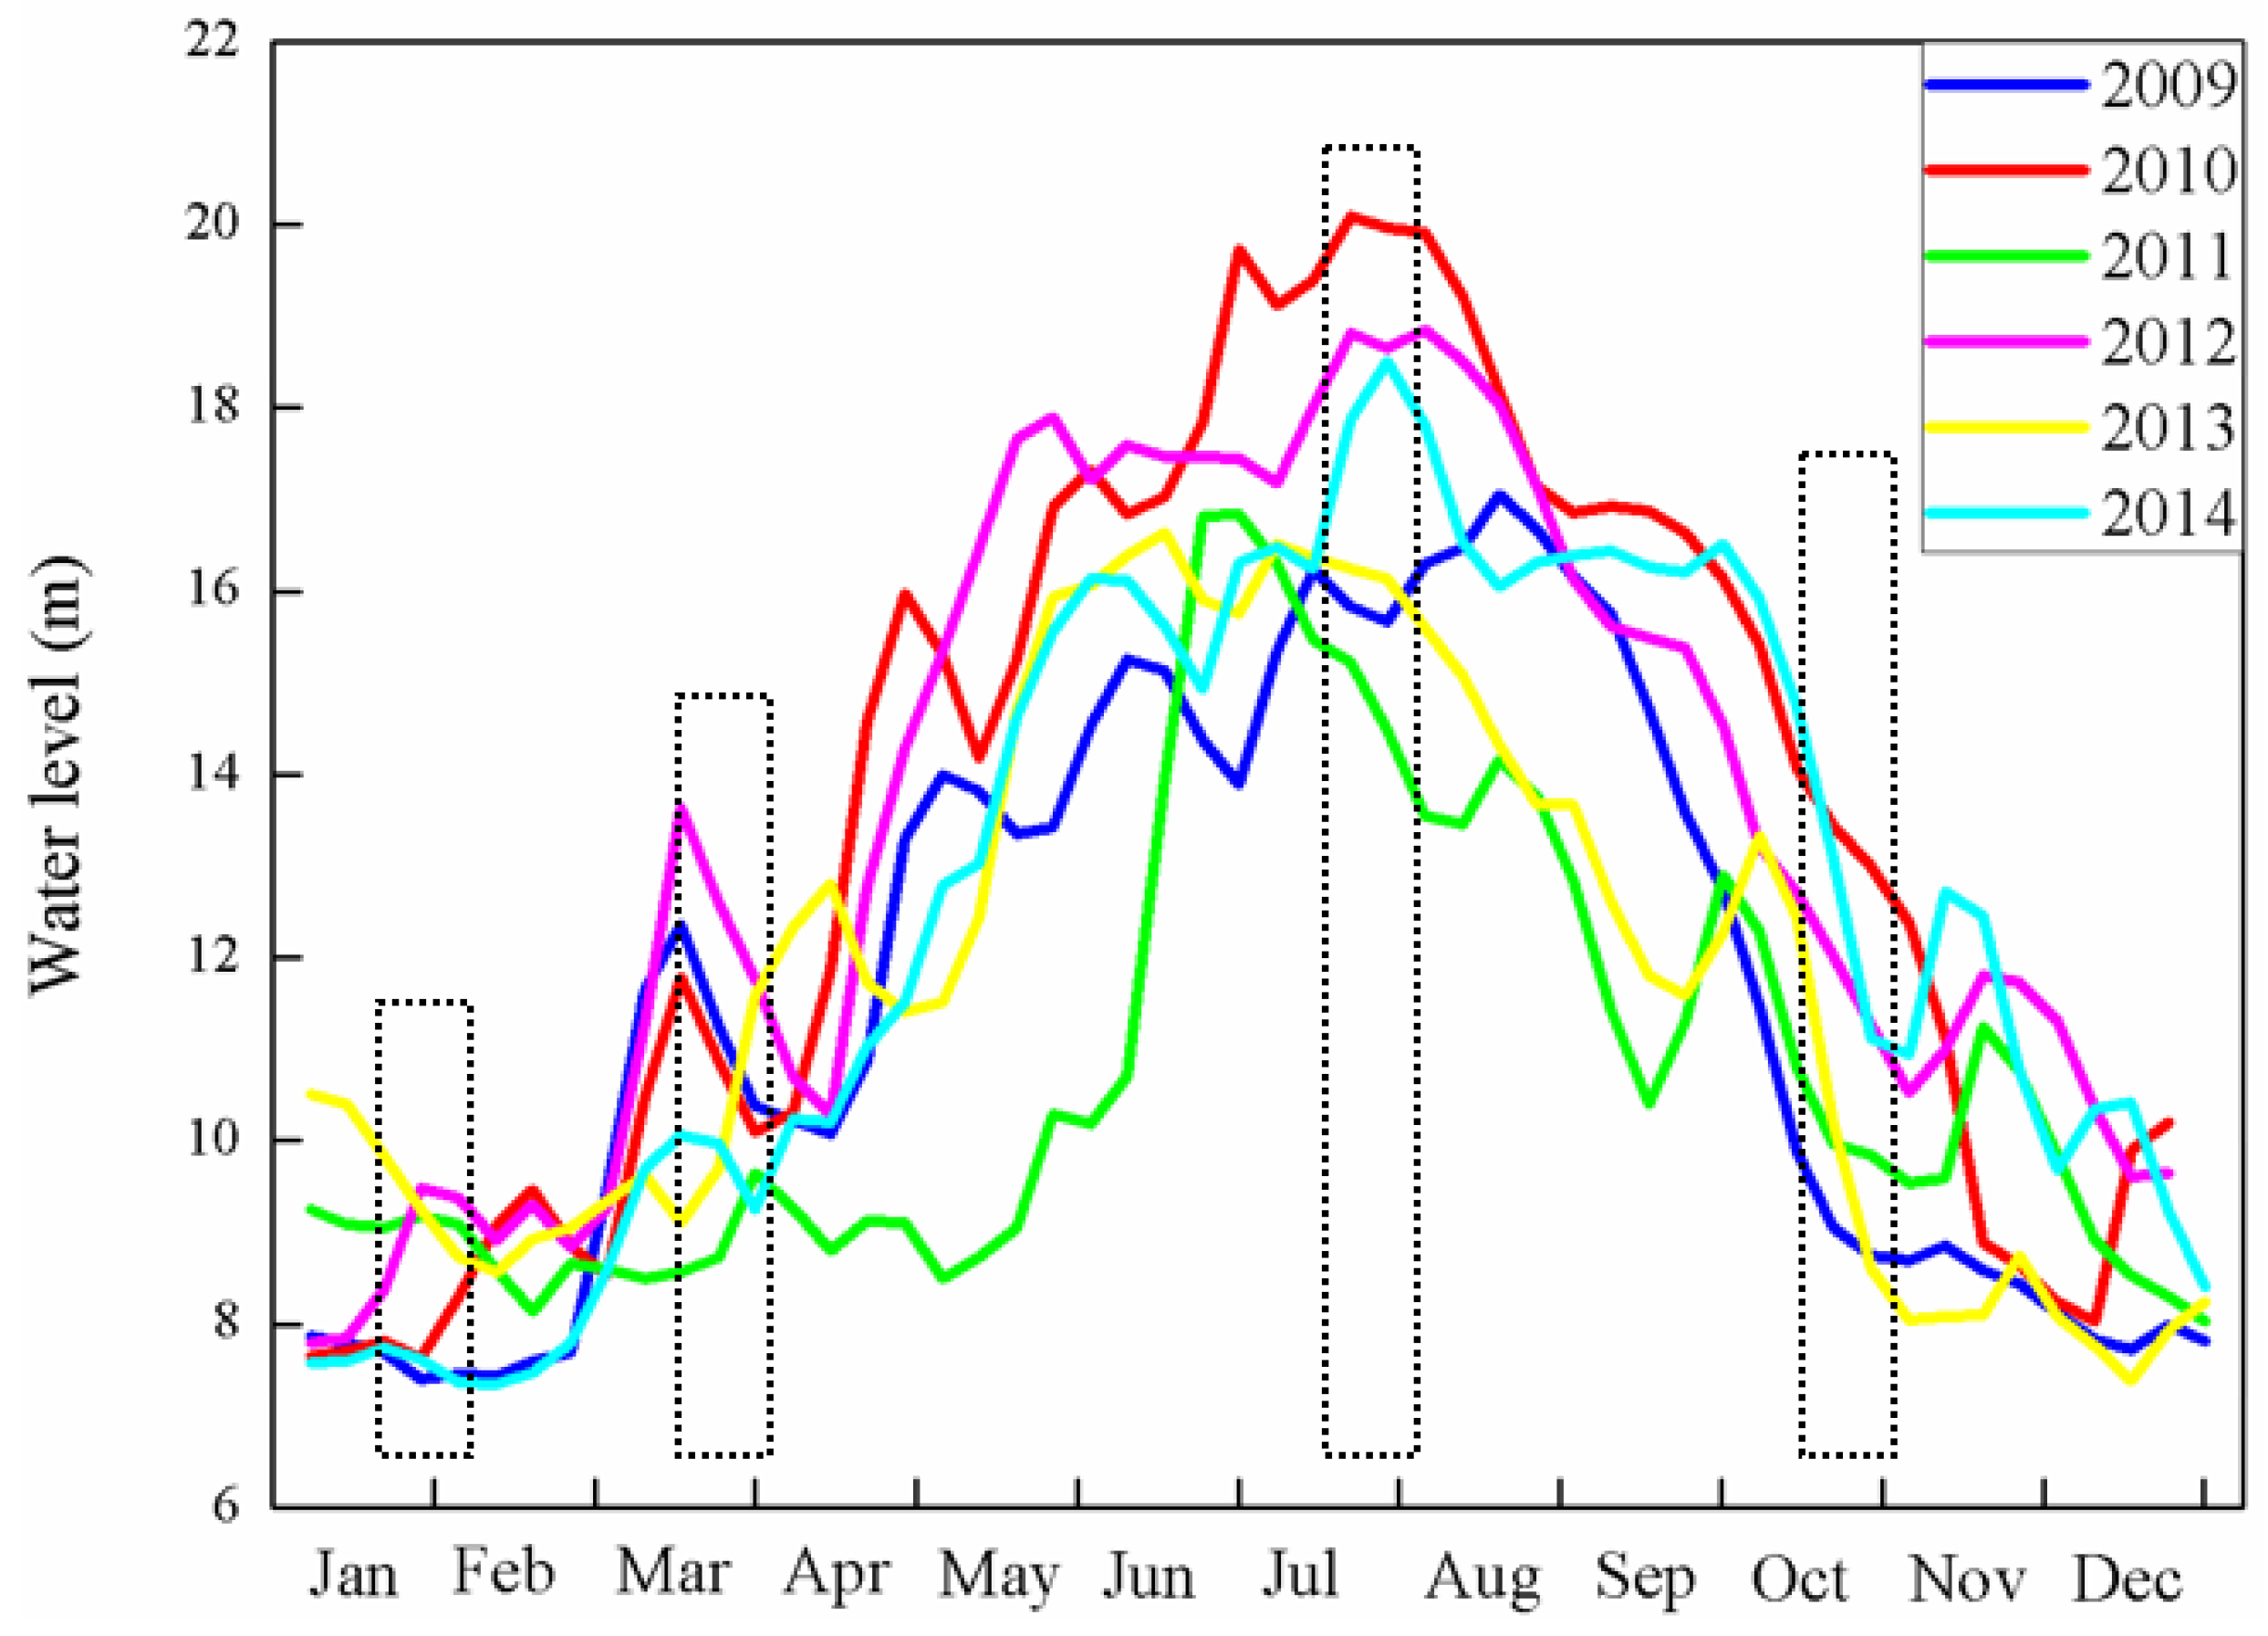
3.2. WLFs and Physical—Chemical Parameters
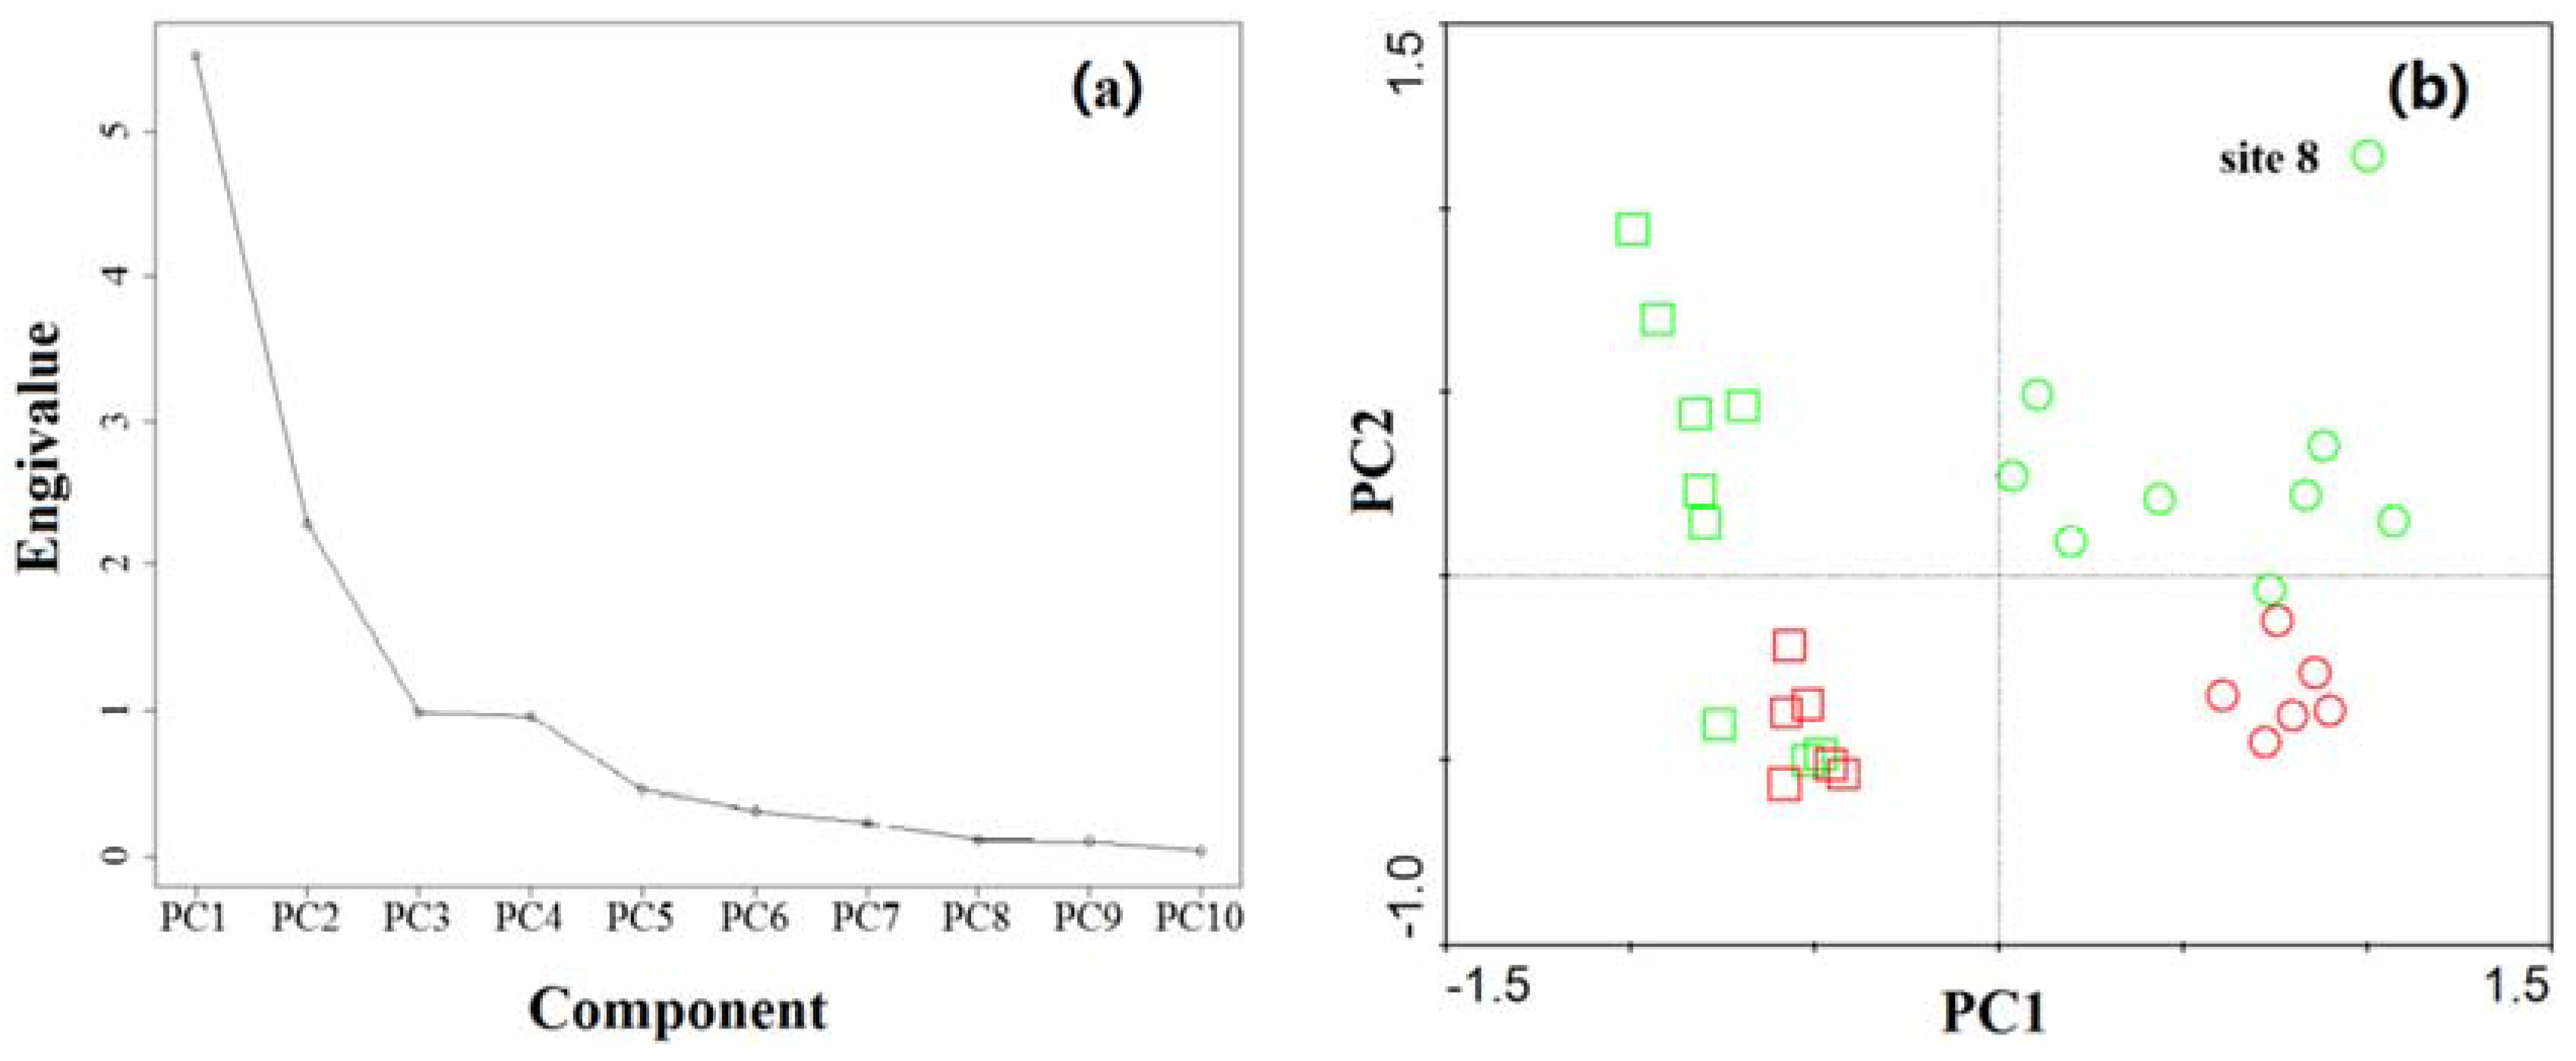
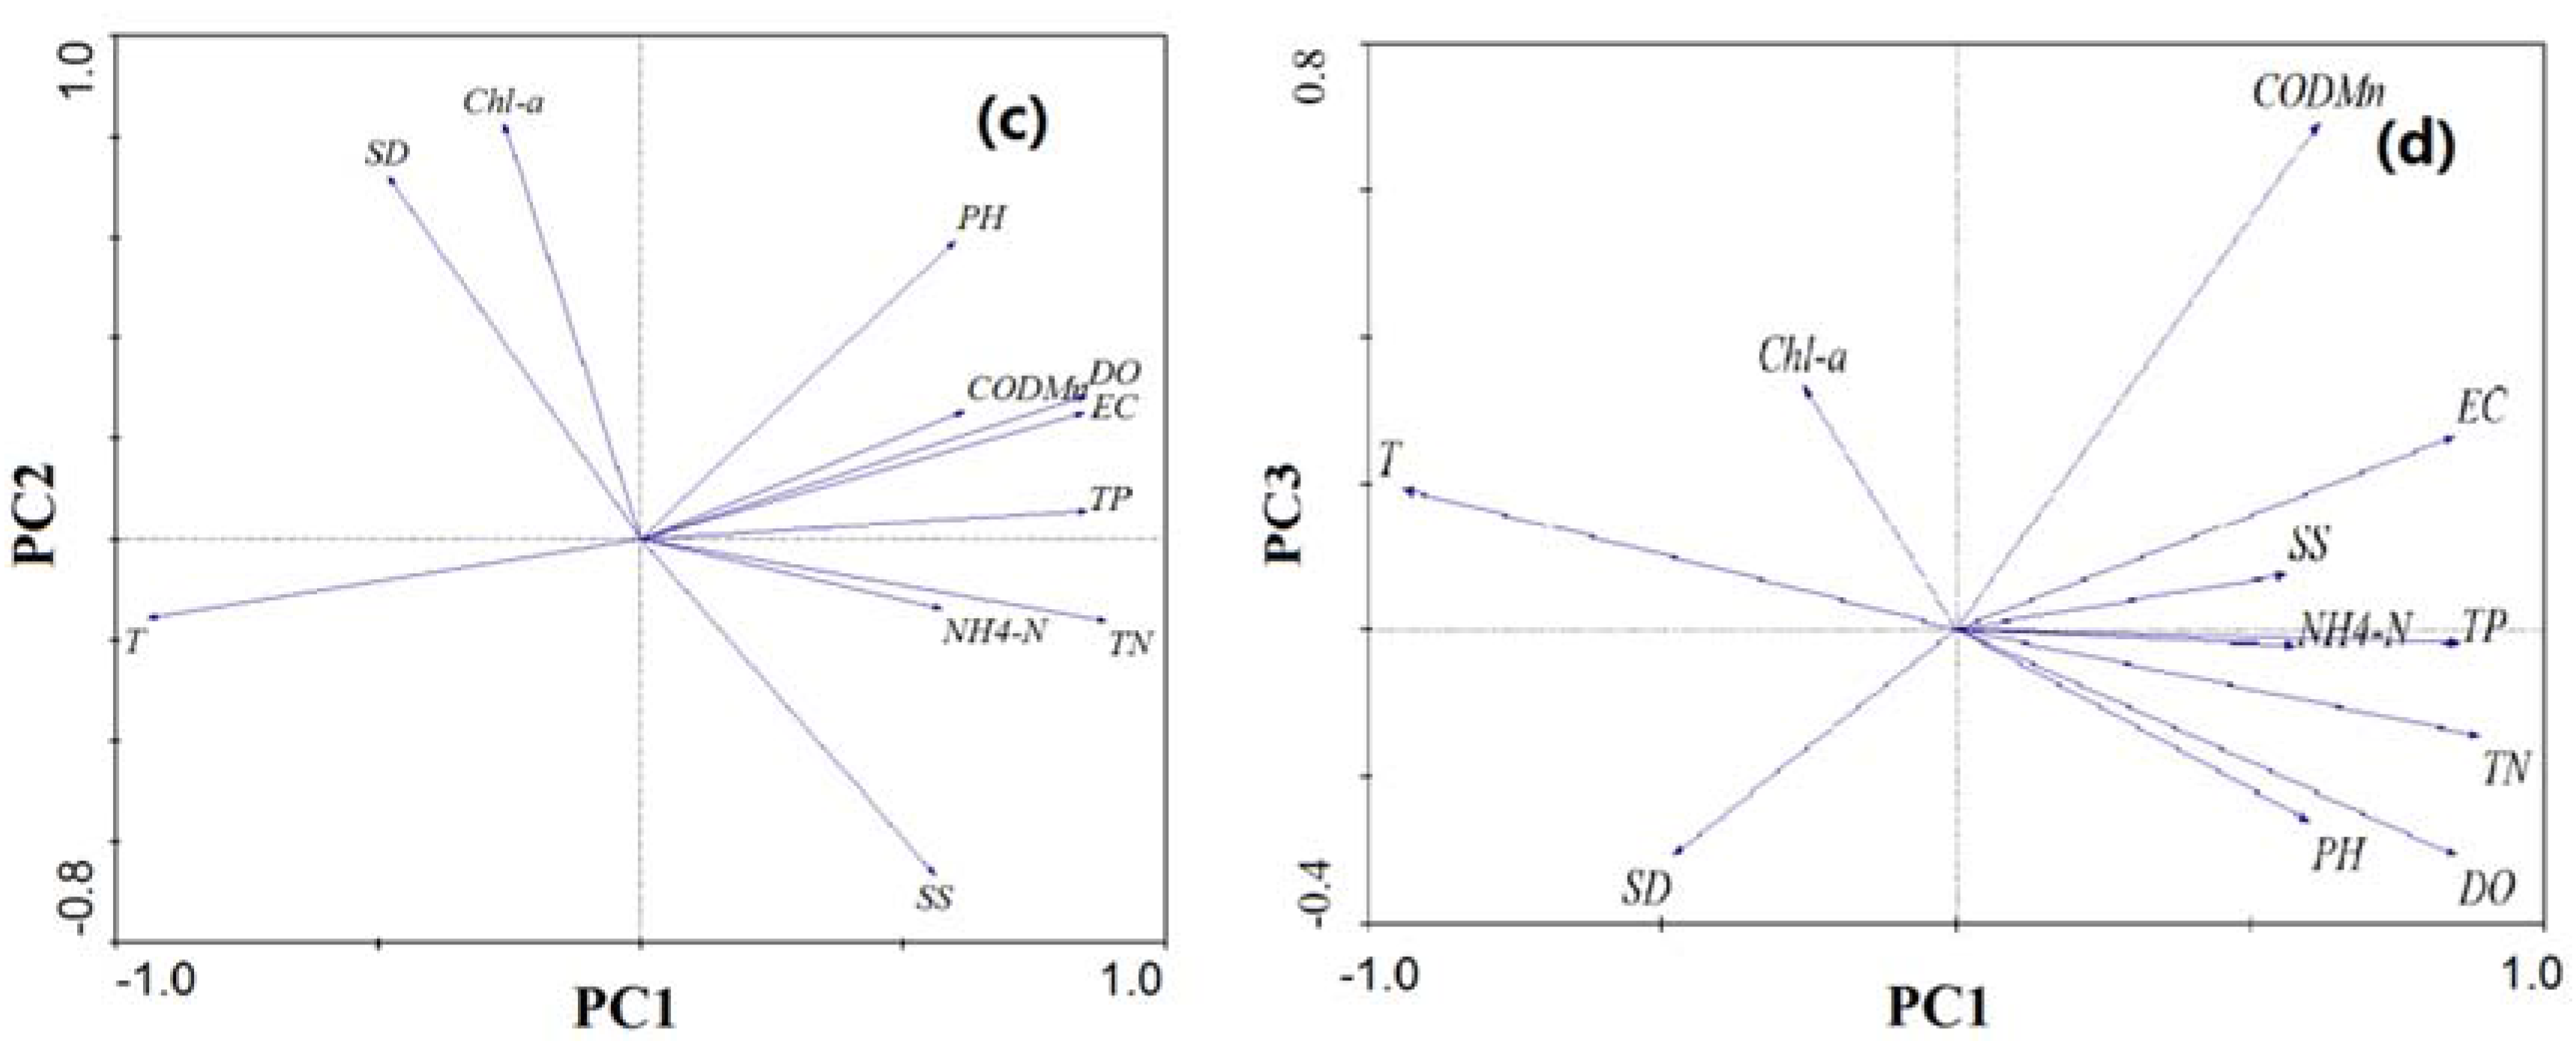
Table 1 presents the Pearson’s correlation coefficients of water level and the 11 water parameters. These coefficients must be interpreted with caution because the water quality parameters reflect both spatial and temporal variations (Figure 3). For the physical parameters, water level was significantly correlated with T, SD, and EC (p < 0.05). The pollutant indices were negatively related to water level (TN at a significant level of 0.01, CODMn and SS at a significant level of 0.05, and TP and NH4–N at an insignificant level). Water level was also remarkably negative relative to DO concentration. It has been proved that DO concentrations are negatively related to temperature [26]. Moreover, a low water level phase is characterized with higher velocities, which further increase the DO concentration in water. Owing to the special climate and hydrological process of Poyang Lake, the high water level was confined to the warm wet season, during which substantial freshwater discharge flows from the tributaries into the lake. However, the lake displays river-like characteristics as the water level gradually goes down in the cool dry season.
The nutrient indicators, except for TN, did not show any notable correlation with water level. However, Figure 4 reveals that these indicators showed remarkable seasonal variations. Fang [27] considered 14 m as the characteristic water level that divides the lake and river phases of Poyang Lake. Therefore, this level was further used to examine the different responses of all the water quality parameters to WLFs in Poyang Lake. The whole dataset was divided into lake and river phases on the basis of the water level in Duchang station. Table 2 compares the water quality parameters between these phases. The K–S test revealed that these parameters exhibited significant differences between these phases (p < 0.05). Specifically, the TN concentration in the river phase (1.87 mg/L) was much higher than that in the lake phase (1.34 mg/L). Despite being insignificantly correlated with water level, TP also showed a notable variation, which indicated that a threshold might exist for TP and that TP concentration would substantially decrease when the water level exceeded the threshold. A similar trend was also observed in NH4–N and Chl–a with a significance of p < 0.05.

3.3. PCA Results

Before conducting the PCA, the data were normalized to have zero means and unit variances to account for the different measurement units and to equalize the effects of all the parameters on the total variance in the dataset. Scree plot was used to identify the number of principal components (PCs) to be retained, and a pronounced change was observed after the third eigenvalue (KMO test = 0.71; Bartlett’s test of sphericity = 0.00) (Figure 6a). Therefore, three PCs explained over 79% of the total variance (with each component explaining 50.2%, 20.7%, and 8.9% of the variance). Figure 6c,d present the loadings of these components, with the arrows representing the loading of parameters. The first component (PC1) has strong negative loadings for water temperature and positive loadings for TN, TP, EC, and DO, thereby suggesting nutrient and natural input pollution. This finding can be explained by the fact that an increase in water temperature leads to a decrease in DO and reinforces the dilution effect in the high water level regime. Moreover, most of the variability in the data is related to temperature change, which is strongly correlated with water level. PC2 is positively correlated with Chl–a and negatively correlated with SS. This component represents the influence of phytoplankton growth (eutrophication), which is hindered by a high SS concentration. PC3 is largely contributed by CODMn and represents the influence of organic pollutants that are mostly related to human activities, such as domestic and industrial discharges, and to decaying plant and animal matter. Figure 6b presents the PCA scores, with the symbols representing the scores of the sampling sites. The PCA ordination results show a clear separation between the river and lake phases. Those sampling sites with a high water level (lake phase) have higher T, Chl–a, and SD and lower TN and TP, whereas those with a low water level have higher TN, TP, NH4–N, EC, DO, and SS (Figure 6b). Those samples that were collected from the lake phase have a significantly lower mean PC1 score than those that were collected from the river phase (p < 0.05). However, no significant difference was observed between the mean PC2 scores of these groups. Sites 10 to 15, which are located in the river channel to the Yangtze River, have high SS and low Chl–a, which is consistent with the spatial analyses results presented in Section 3.1. Figure 6b shows the low mean PC2 scores of sites 10 to 15 (shown in red color), thereby indicating a relatively low risk of algal bloom in the northern Poyang Lake–Yangtze River waterway. Interestingly, site 8 has a high Chl–a and low SS, which indicates that this site is mainly influenced by phytoplankton growth (PC2).

4. Discussion

The water quality of Poyang Lake shows insignificant spatial variations, except in those sites near the outlet of heavily polluted tributaries. As a typical flushing lake, Poyang Lake has a relatively shorter water retention time (7 days to 30 days) during different water regimes [28], in comparison with Tai Lake (270 days) and Chao Lake (136 days) [29,30]. Spatially, site 1 has the highest RSs,p for TN, TP, and NH4–N, which may be attributed that the Rao River was characterized with highest pollutants concentration [31] (Figure S1), with average fluxes of 0.54 kg/s and 0.05 kg/s for NH4–N and TP in 2009–2011, which were approximately 7 and 2 times higher than the Xiu River. The field survey also reveals that the year-round dredging activities near site 1 may remarkably change the topography of the lakebed and dredge up substantial sediment. Consistent with previous studies, site 7 has the best water quality with relatively high SD and DO, as revealed in the PCA. Given that site 8 was located at the outlet of Bang Lake with a developed aquaculture, this site shows high CODMn and Chl–a, as revealed in the PCA. Furthermore, the water quality in the northern part of Poyang Lake is different from that in the other sites, especially in terms of Chl–a concentration. Such difference may be attributed to the river-like characteristics of the lake with relatively high velocity and amounts of suspended solid, which have substantially decreased the underwater light conditions [24]. Similar results were reported in the floodplain area of the Danube, which experiences flooding and a short water residence time [32].
Poyang Lake also shows inter-annual variations in its water quality. As mentioned above, the lake had high TN and Chl–a concentrations in 2011 and 2014. Hydrological forces, such as wind and river flow, may constrain the dynamics of pollutants in lake systems [33]. WLFs can reflect the hydrodynamic conditions in a large floodplain lake to some extent. Besides, the pollutants that are discharged into the lake also exert a great effect on lake water quality. The sewage effluent was relatively low in 2009 and 2010, while it increased by 13.4% in 2011 compared to 2010. But it did not show great changes since 2011 (Figure 7). Meanwhile, 2011 was a typical dry year with average water level of 10.96 m, the amount of rainfall in 2011 decreased by 49% from the previous year, and the sharp turn from drought to flood resulted in an instantaneous surface runoff, in which substantial nutrients flowed into the lake [34]. Therefore, the inter-annual variations of water quality were under the dual influence of hydrological conditions (e.g., water level, discharge) and sewage flowed into the lake.
Eutrophication remains one of the most pervasive environmental problems in lakes [23]. The nutrient indicators considered in the present study all showed significant seasonal variations. Overall, an excellent water quality was observed in July, but a poor water quality was observed in January because of hydrodynamic conditions. The K–S test revealed the differences in the characteristics between the river and lake phases of Poyang Lake (Table 2). Figure 8 showed that the concentrations of TN, TP, and NH4–N significantly differed between these phases. For TN, the probability density analysis revealed 66.5% and 19.1% likelihoods of obtaining a TN concentration lower than 1.5 mg/L in the lake and river phases, respectively. The mean TP concentration in the lake phase (0.06 mg/L) was remarkably lower than that in the river phase (0.11 mg/L). Moreover, the TP concentration in the lake phase showed a great tendency to range between 0.05 mg/L and 0.075 mg/L. Similar results can also be obtained for NH4–N. These founding are in accordance with the study of Yao et al. [16] obtained by using dissolve organic matter (DOM) fluorescence. This can be explained by the fact that although the velocities were lower in lake phase, the five tributaries produce more freshwater discharge in the lake phase than in the river phase (Figure 9), thereby effectively diluting the contaminants in each site. In addition, there are more aquatic organisms in lake phase than in the river phase, which consuming more nutrients [31]. The impoundment of the Three Gorges Reservoir also causes a large flow gradient from Hukou to the Yangtze River in the river phase, thereby weakening the self-purification capability of Poyang Lake [35]. On the other hand, during winter, the water levels of Poyang Lake are relatively low, and the bottom sediments are dredged up by higher velocities to release substantial nutrients into the water [36]. Similar studies showed that a lower water level may decrease lake water quality [5,37]. For example, Hakanson et al. [38] concluded from their numerical models that the successive and gradual lowering of water levels might significantly deteriorate the water quality of Lake Kinneret. However, in a relatively short time scale or in the non-point pollution-dominated study area, an increased water level resulting from heavy rainfall and river discharge may increase the level of pollutants [33,39]. The relationship among the hydrological, climatic, and water quality parameters has also been studied by other authors [40,41]. The present work found a strong correlation between water temperature and water level, as well as a negative correlation between water level and CODMn, DO, EC, SS and TN. This finding contrasts with that of Prathumratana [40], who studied the lower Mekong River and found that the water level was positively correlated with TSS, TP, and CODMn. Therefore, the water quality of Poyang Lake remains relatively favorable and mainly controlled by point pollution. However, TP, NH4–N, and Chl–a are not significantly correlated with water level fluctuation, which indicates that these concentrations may be affected by certain thresholds of water level. TP was significantly positively correlated with SS in Poyang Lake, which was agreed with other studies [41,42,43]. For example, Kronvang et al. [41] found a good correlation between phosphorus and SS in an agricultural catchment (R2 = 0.87). SS was an important indicator for transportation of phosphorus and was often used as to predict total phosphorus. Dilution was identified as the controlling factor that drives the seasonal variability in the water quality of Poyang Lake.
The PCA results also indicate that most of the variability in the data can be attributed to seasonal variations in temperature and eutrophication (PC1 and PC2), which are consistent with the variations in water level. Similar results have been reported in other studies that also used PCA to investigate water quality. Andrea et al. [44] selected 18 correlated parameters for PCA and identified seven factors with eigenvalues larger than 1 to explain 75% of the total variance in their dataset. The parameters were found to be related to temperature (PC1), organic pollution (PC2), natural inputs (PC3), inorganic pollution (PC4), and so on. The lake phase has a higher phytoplankton biomass, which is mainly attributed to the significantly higher temperature, elevated underwater light conditions, and extended water residence time [45]. An increase in phytoplankton biomass during flooding was also reported in other floodplains and shallow lakes [32,46]. However, the Chl–a concentration does not show the trend of the other nutrient indices, which further indicates that the Chl–a variations cannot be explained by the nutrients in Poyang Lake [38].

5. Conclusions

The spatiotemporal analyses of water quality variables, especially nutrient indicators, and their relation to hydrological conditions (i.e., water level and discharge) are essential in evaluating lake eutrophication and providing an impetus for lake management. This paper offers a unique contribution through a case study in a large flood-plain lake. In this work, the water quality variables did not demonstrate significant spatial variations, except for those of the water samples that were collected from stations near the outlets of tributaries. However, significant temporal variations, especially seasonal ones, were observed among these variables. All water quality parameters significantly changed between the river and lake phases, with the latter showing a great possibility of resulting in relatively excellent water quality. The inter-annual water quality variation was mainly controlled by both pollutants effluent and hydrological conditions. While dilution was identified as the controlling factors that drive the variability in water quality of Poyang Lake within the year. Our research may have some impetus on water quality improvement and management, e.g., through setting total maximum daily loads (TMDL) and regulating water level within lake. Future research must ascertain the quantitative effect of the discharge from tributaries to provide reliable recommendations for the improvement and maintenance of Poyang Lake.

Supplementary Materials

The following are available online at www.mdpi.com/2073-4441/8/7/296/s1, Figure S1: Variations of TP and NH4-N concentrations from five main tributaries in Poyang Lake within the year (2009–2011), Table S1: Seasonal average values of TP relative to the annual average (2009–2014) for 15 sampling sites (maximum Rmse,s,TP were displayed in boldface).

Acknowledgments

This study was financially supported by the National Basic Research Program of China (Grant 2012CB417006), the National Scientific Foundation of China (Grant 41271500), and the National Scientific Foundation of China (Grant 41571107). We also thank the Lake Poyang Laboratory for Wetland Ecosystem Research (PLWER) for their assistance in the water quality parameter analyses.

Author Contributions

All authors contributed extensively to the work presented in this paper. Bing Li contributed to the subject of the research, literature review, manuscript preparation and statistical analysis, and finalized the manuscripts. Guishan Yang, Rongrong Wan, Yanhui Zhang, and Xue Dai contributed the conceptualization, manuscripts revision and review. Yuwei Chen contributed the water quality data analyses.

Conflicts of Interest

The authors declare no conflict of interest.

References

  1. Williamson, C.E.; Saros, J.E.; Vincent, W.F.; Smold, J.P. Lakes and reservoirs as sentinels, integrators, and regulators of climate change. Limnol. Oceanogr. 2009, 54, 2273–2282. [Google Scholar] [CrossRef]
  2. Qin, B.; Zhu, G.; Gao, G.; Zhang, Y.; Li, W.; Paerl, H.W.; Carmichael, W.W. A drinking water crisis in Lake Taihu, China: Linkage to climatic variability and lake management. Environ. Manag. 2010, 45, 105–112. [Google Scholar] [CrossRef] [PubMed]
  3. Norman, E.S.; Dunn, G.; Bakker, K.; Allen, D.M.; de Albuquerque, R.C. Water security assessment: Integrating governance and freshwater indicators. Water Resour. Manag. 2013, 27, 535–551. [Google Scholar] [CrossRef]
  4. Qin, B.; Gao, G.; Zhu, G.; Zhang, Y.; Song, Y.; Tang, X.; Xu, H.; Deng, J. Lake eutrophication and its ecosystem response. Chin. Sci. Bull. 2013, 58, 961–970. [Google Scholar] [CrossRef]
  5. White, M.; Xenopoulos, M.; Hogsden, K.; Metcalfe, R.; Dillon, P. Natural lake level fluctuation and associated concordance with water quality and aquatic communities within small lakes of the Laurentian Great Lakes region. Hydrobiologia 2008, 613, 21–31. [Google Scholar] [CrossRef]
  6. Wantzen, K.M.; Rothhaupt, K.-O.; Mörtl, M.; Cantonati, M.; László, G.; Fischer, P. Ecological Effects of Water-Level Fluctuations in Lakes: An Urgent Issue; Springer: Berlin, Germany, 2008; pp. 1–4. [Google Scholar]
  7. Coops, H.; Beklioglu, M.; Crisman, T.L. The role of water-level fluctuations in shallow lake ecosystems-workshop conclusions. Hydrobiologia 2003, 506, 23–27. [Google Scholar] [CrossRef]
  8. Kurata, A. The effect of low water levels on the water quality of Lake Biwa. Hydrobiologia 1989, 176/177, 29–38. [Google Scholar] [CrossRef]
  9. Wang, H.; Zhou, Y.; Tang, Y.; Wu, M.; Deng, Y. Fluctuation of the water environmental carrying capacity in a huge river-connected lake. Int. J. Environ. Res. Public Health 2015, 12, 3564–3578. [Google Scholar] [CrossRef] [PubMed]
  10. Guo, H.; Hu, Q.; Zhang, Q.; Feng, S. Effects of the Three Gorges Dam on Yangtze River flow and river interaction with Poyang Lake, China: 2003–2008. J. Hydrol. 2012, 416, 19–27. [Google Scholar] [CrossRef]
  11. Sun, S.; Chen, H.; Ju, W.; Song, J.; Zhang, H.; Sun, J.; Fang, Y. Effects of climate change on annual streamflow using climate elasticity in Poyang Lake Basin, China. Theor. Appl. Climatol. 2013, 112, 169–183. [Google Scholar] [CrossRef]
  12. Zhang, Q.; Sun, P.; Chen, X.H.; Jiang, T. Hydrological extremes in the Poyang Lake basin, China: Changing properties, causes and impacts. Hydrol. Process. 2011, 25, 3121–3130. [Google Scholar] [CrossRef]
  13. Zhang, Z.; Chen, X.; Xu, C.-Y.; Hong, Y.; Hardy, J.; Sun, Z. Examining the influence of river-lake interaction on the drought and water resources in the Poyang Lake basin. J. Hydrol. 2015, 522, 510–521. [Google Scholar] [CrossRef]
  14. Wang, M.; Zhou, W.; Hu, C. Status of nitrogen and phosphorus in waters of Lake Poyang Basin. J. Lake Sci. 2008, 20, 334–338. (In Chinese) [Google Scholar]
  15. Xu, C.; Li, S.; Chai, W.; Chen, Y. A newly recorded cyanobacterial species in water blooms occurred in Lake Poyang—Merismopedia convolute Breb. Kuetzing. J. Lake Sci. 2012, 24, 643–646. (In Chinese) [Google Scholar]
  16. Yao, X.; Wang, S.; Ni, Z.; Jiao, L. The response of water quality variation in Poyang Lake (Jiangxi, People’s Republic of China) to hydrological changes using historical data and DOM fluorescence. Environ. Sci. Pollut. Res. 2015, 22, 3032–3042. [Google Scholar] [CrossRef] [PubMed]
  17. Whitehead, P.; Wilby, R.; Battarbee, R.; Kernan, M.; Wade, A.J. A review of the potential impacts of climate change on surface water quality. Hydrolog. Sci. J. 2009, 54, 101–123. [Google Scholar] [CrossRef]
  18. Whitehead, P.; Wilby, R.; Butterfield, D.; Wade, A. Impacts of climate change on in-stream nitrogen in a lowland chalk stream: An appraisal of adaptation strategies. Sci. Total Environ. 2006, 365, 260–273. [Google Scholar] [CrossRef] [PubMed]
  19. Shankman, D.; Keim, B.D.; Song, J. Flood frequency in China’s Poyang Lake region: Trends and teleconnections. Int. J. Climatol. 2006, 26, 1255–1266. [Google Scholar] [CrossRef]
  20. Association, A.P.H.; Association, A.W.W.; Federation, W.P.C.; Federation, W.E. Standard Methods for the Examination of Water and Wastewater; American Public Health Association: Washington, DC, USA, 1915. [Google Scholar]
  21. Lorenzen, C.J. Determination of chlorophyll and pheo-pigments: Spectrophotometric equations. Limnol. Oceanogr. 1967, 12, 343–346. [Google Scholar] [CrossRef]
  22. Zhang, Y.; Liu, X.; Qin, B.; Shi, K.; Deng, J.; Zhou, Y. Aquatic vegetation in response to increased eutrophication and degraded light climate in Eastern Lake Taihu: Implications for lake ecological restoration. Sci. Rep. 2016, 6, 23867. [Google Scholar] [CrossRef] [PubMed]
  23. Akyuz, D.E.; Luo, L.; Hamilton, D.P. Temporal and spatial trends in water quality of Lake Taihu, China: Analysis from a north to mid-lake transect, 1991–2011. Environ. Monit. Assess. 2014, 186, 3891–3904. [Google Scholar] [CrossRef] [PubMed]
  24. Team, R.C. R: A Language and Environment for Statistical Computing; R Foundation for Statistical Computing: Vienna, Austria, 2012. [Google Scholar]
  25. Wu, Z.; Lai, X.; Zhang, L.; Cai, Y.; Chen, Y. Phytoplankton chlorophyll a in Lake Poyang and its tributaries during dry, mid-dry and wet seasons: A 4-year study. Knowl. Manag. Aquat. Ecosyst. 2014, 6. [Google Scholar] [CrossRef]
  26. Vega, M.; Pardo, R.; Barrado, E.; Debán, L. Assessment of seasonal and polluting effects on the quality of river water by exploratory data analysis. Water Res. 1998, 32, 3581–3592. [Google Scholar] [CrossRef]
  27. Fang, C.-M.; Cao, W.-H.; Mao, J.-X.; Li, H.-J. Relationship between Poyang Lake and Yangtze River and influence of three Georges Reservoir. J. Hydraul. Eng. 2012, 43, 175–181. (In Chinese) [Google Scholar]
  28. Li, Y.; Zhang, Q.; Yao, J. Investigation of residence and travel times in a large floodplain lake with complex lake-river interactions: Poyang Lake (China). Water 2015, 7, 1991–2012. [Google Scholar] [CrossRef]
  29. Qin, B.; Xu, P.; Wu, Q.; Luo, L.; Zhang, Y. Environmental issues of lake Taihu, China. Hydrobiologia 2007, 581, 3–14. [Google Scholar] [CrossRef]
  30. Xu, F.-L.; Jørgensen, S.E.; Tao, S.; Li, B.-G. Modeling the effects of ecological engineering on ecosystem health of a shallow eutrophic Chinese lake (Lake Chao). Ecol. Model. 1999, 117, 239–260. [Google Scholar] [CrossRef]
  31. Duan, W.; He, B.; Nover, D.; Yang, G.; Chen, W.; Meng, H.; Zou, S.; Liu, C. Water quality assessment and pollution source identification of the Eastern Poyang Lake basin using multivariate statistical methods. Sustainability 2016, 8, 133. [Google Scholar] [CrossRef]
  32. Peršić, V.; Horvatić, J.; Has-Schön, E.; Bogut, I. Changes in N and P limitation induced by water level fluctuations in Nature Park Kopački Rit (Croatia): Nutrient enrichment bioassay. Aquat. Ecol. 2009, 43, 27–36. [Google Scholar] [CrossRef]
  33. Seiler, L.M.; Fernandes, E.H.L.; Martins, F.; Abreu, P.C. Evaluation of hydrologic influence on water quality variation in a coastal lagoon through numerical modeling. Ecol. Model. 2015, 314, 44–61. [Google Scholar] [CrossRef]
  34. Xia, Y.; Yan, B.-Y.; Fang, Y. Nutrient loading and its controlling factors in Le’an River watershed, Lake Poyang basin. J. Lake Sci. 2015, 27, 282–288. (In Chinese) [Google Scholar]
  35. Wu, L.-H.; Li, M.; Guo, Y.-Y.; Yang, X.-L. Influence of Three Gorges Project on water quality of Poyang Lake. Procedia Environ. Sci. 2011, 10, 1496–1501. [Google Scholar] [CrossRef]
  36. Sondergaard, M.; Jensen, P.J.; Jeppesen, E. Retention and internal loading of phosphorus in shallow, eutrophic lakes. Sci. World J. 2001, 1, 427–442. [Google Scholar] [CrossRef] [PubMed]
  37. Stefanidis, K.; Papastergiadou, E. Effects of a long term water level reduction on the ecology and water quality in an eastern Mediterranean lake. Knowl. Manag. Aquat. Ecosyst. 2013, 5. [Google Scholar] [CrossRef]
  38. Håkanson, L.; Parparov, A.; Hambright, K. Modelling the impact of water level fluctuations on water quality (suspended particulate matter) in Lake Kinneret, Israel. Ecol. Model. 2000, 128, 101–125. [Google Scholar] [CrossRef]
  39. Zhou, W.; Yin, K.; Harrison, P.J.; Lee, J.H. The influence of late summer typhoons and high river discharge on water quality in Hong Kong waters. Estuar. Coast. Shelf Sci. 2012, 111, 35–47. [Google Scholar] [CrossRef]
  40. Prathumratana, L.; Sthiannopkao, S.; Kim, K.W. The relationship of climatic and hydrological parameters to surface water quality in the lower Mekong River. Environ. Int. 2008, 34, 860–866. [Google Scholar] [CrossRef] [PubMed]
  41. Kronvang, B.; Laubel, A.; Grant, R. Suspended sediment and particulate phosphorus transport and delivery pathways in an arable catchment, Gelbaek stream, Denmark. Hydrol. Process. 1997, 11, 627–642. [Google Scholar] [CrossRef]
  42. Stubblefield, A.P.; Reuter, J.E.; Dahlgren, R.A.; Goldman, C.R. Use of turbidometry to characterize suspended sediment and phosphorus fluxes in the Lake Tahoe basin, California, USA. Hydrol. Process. 2007, 21, 281–291. [Google Scholar] [CrossRef]
  43. Jones, A.S.; Stevens, D.K.; Horsburgh, J.S.; Mesner, N.O. Surrogate measures for providing high frequency estimates of total suspended solids and total phosphorus concentrations. J. Am. Water Resour. Assoc. 2011, 47, 239–253. [Google Scholar] [CrossRef]
  44. Ruždjak, A.M.; Ruždjak, D. Evaluation of river water quality variations using multivariate statistical techniques. Environ. Monit. Assess. 2015, 187, 1–14. [Google Scholar]
  45. Wu, Z.; He, H.; Cai, Y.; Zhang, L.; Chen, Y. Spatial distribution of chlorophyll a and its relationship with the environment during summer in Lake Poyang: A Yangtze-connected lake. Hydrobiologia 2014, 732, 61–70. [Google Scholar] [CrossRef]
  46. Rennella, A.; Quirós, R. The effects of hydrology on plankton biomass in shallow lakes of the Pampa Plain. Hydrobiologia 2006, 556, 181–191. [Google Scholar] [CrossRef]
Figure 1. Seasonal variations of Poyang Lake, China (winter (January) on the left, summer (July) on the right) and location of the sampling sites.
Water 08 00296 g001
Figure 2. Water level variations of Poyang Lake from 2009 to 2014 (the dashed squares represent the sampling duration).
Water 08 00296 g002
Figure 3. Spatial and annual variations in the total nitrogen (TN), total phosphorus (TP), ammonia nitrogen (NH4–N) and chlorophyll–a concentration (Chl–a) of Poyang Lake.
Water 08 00296 g003aWater 08 00296 g003b
Figure 4. Spatial and seasonal variations of TN, TP, NH4–N and Chl–a in Poyang Lake.
Water 08 00296 g004
Figure 5. Ratios of the average TN, TP, Chl–a, and NH4–N values for each site relative to the all-site average between 2009 and 2014.
Water 08 00296 g005
Figure 6. Principal component analysis (PCA) results of different water regimes. (a) scree plot of PCA; (b) PCA scores, where the squares represent the lake phase, the circles represent the river phase, and the red color represents the sampling sites in the northern Poyang Lake–Yangtze River waterway; (c) loadings of PC1 and PC2; and (d) loadings of PC1 and PC3.
Water 08 00296 g006aWater 08 00296 g006b
Figure 7. Annual variations in the discharge of sewage into the rivers of Jiangxi Province.
Water 08 00296 g007
Figure 8. Probability density lines of nutrient indicators for lake phase (water level >14 m) and river phase (water level <14 m). (a) TN; (b) TP; (c) NH4–N.
Water 08 00296 g008
Figure 9. Monthly (a) TP and (b) NH4–N concentrations and discharge from the tributaries of Poyang Lake (2009–2011).
Water 08 00296 g009
Table 1. Pearson’s correlation matrix for water-level and selected water quality parameters.
ParametersWater-LevelPHTSDECDOCODMnSSTNTPNH4–NChl–a
Water-level1
PH−0.221
T0.75 **−0.21
SD0.42 *−0.260.64 **1
EC−0.76 **0.330.7 **−0.48 *1
DO−0.57 **0.380.76 **−0.57 **0.58 **1
CODMn−0.43 *0.33−0.36−0.180.45 *0.121
SS−0.5 *−0.16−0.34−0.40.250.320.071
TN−0.74 **0.23−0.64 **−0.41 *0.78 **0.53 **0.45 *0.54 *1
TP−0.31−0.08−0.25−0.140.340.41 *−0.110.45 *0.351
NH4–N−0.260.36−0.270.110.180.210.12−0.120.04−0.271
Chl–a0.29−0.010.07−0.06−0.07−0.180.06−0.060.02−0.08−0.41 *1
Notes: * The correlation is significant at the 0.05 level (two-tailed); ** The correlation is significant at the 0.01 level (two-tailed).
Table 2. Comparison of water quality parameters between the river and lake phase of Poyang Lake from 2009 to 2014.
ParametersRiver PhaseLake Phase
MeanSDMeanSD
PH8.200.797.890.74
T (°C)16.698.4026.556.27
SD (m)0.360.190.450.26
EC (μs/cm)161.2277.98105.7536.73
SS (mg/L)58.7656.3541.8946.55
DO (mg/L)9.312.727.081.20
CODMn (mg/L)2.951.342.640.75
TN (mg/L)1.870.711.340.49
TP (mg/L)0.110.100.060.03
NH4–N (mg/L)0.370.420.260.41
Chl–a (μg/L)4.534.275.574.25

