Article

Water Use Patterns in Vietnamese Hotels: Modeling Toilet and Shower Usage

1
Department of Environmental Science, International College of Arts and Science, Fukuoka Women’s University, 1-1-1, Kasumigaoka, Higashi-ku, Fukuoka City 813-8529, Japan
2
ESG Promotion Department, TOTO Ltd., 2-1-1, Nakashima, Kokurakita-ku, Kitakyushu City 802-8601, Japan
3
Water and Lifestyle Research Laboratory, 31-3, Munakata, Fukuoka 811-4141, Japan
*
Author to whom correspondence should be addressed.
Water 2016, 8(3), 85; https://doi.org/10.3390/w8030085
Submission received: 24 July 2015 / Revised: 2 February 2016 / Accepted: 14 February 2016 / Published: 4 March 2016

Abstract

:
Water saving is a key issue in rapidly developing countries, such as Vietnam, that face various water resource management challenges. This study investigated water-use patterns in a hotel in Ho Chi Minh City in Vietnam. It aimed to quantify the efficiency of water-saving devices through modeling toilet and shower usage patterns, including water consumption. The shift in hourly consumption of cold and hot water was also identified. Analysis revealed that, on average, a full toilet flush occurs 3.3 times/day, a half flush 3.0 times/day, water consumption due to shower usage is 48.1 L/day, showering time is 7.3 min/day and the shower water temperature is 37.7 °C. Shifting levels of hot and cold water use revealed high activity in the morning time and that there are two peaks, occurring in the morning and at night.

1. Introduction

A great deal of attention has been paid to the co-benefits of saving water. An important effect is that it directly reduces CO2 emissions by lowering the energy needs for operating and maintaining water and wastewater management facilities. The Japanese government has proposed the “Joint Crediting Mechanism” (JCM) for international use, and this scheme requires the modeling of equipment use in order to quantify the effects of cold and hot water saving devices on CO2 emission reduction.
Regarding investigations related to the water consumption and usage of toilets and showers, there are numerous studies of households in Spain [1,2], the United Kingdom [3], Australia [4], Kenya [5] and Portugal [6], in addition to the work done by the authors in Japan. However, there are fewer studies that examine usage in hotels, although hot and cold water usage in a Japanese city center hotel [7] and in a business hotel [8] have been analyzed. Past studies conducted by the authors have produced models of toilet and shower usage in Vietnamese households [9]. Still, it is crucial to construct a model of toilet and shower usage in a Vietnamese hotel based on real measurements and on-the-ground investigation, because many Vietnamese hotels are considering the introduction of hot and cold water-saving equipment.
Therefore, this report investigates the pattern of water use in guest rooms in a Vietnamese hotel and suggests a model of toilet and shower usage by quantifying and assessing the efficiency of water-saving devices.

2. Investigation Overview

2.1. Overview of Building and Facilities

The hotel is outlined in Table 1, and the facilities for supplying hot and cold water are outlined in Figure 1.
The site of the study was the Renaissance Riverside Hotel Saigon, which is an affiliate of the Marriott Group. It is located in the center of Ho Chi Minh City, near the business and the entertainment areas, so the guests’ reasons for staying include both business and sightseeing. Three heat pumps are used for supplying the hot water system, and the water supply system is a general elevated tank system. In addition a pressure pump is used for the floors above the 15th floor, in order to ensure a stable water supply pressure.

2.2. Bathroom Overview

The bathrooms in the hotel study were typical hotel bathrooms, including a shower, hot water tap for the bathtub, a tap for the sink and a toilet. It was not possible for both the shower and the tap of the bathtub to emit water at the same time as they were part of a switching system controlled by pop-up metal fittings. Water temperature was controlled by combining hot and cold water with a single lever. Additionally, the shower was a water-saving model, which included a 9.5 L/min flow valve, so the flow-rate could not exceed this limit. The toilet was also a water-saving type that used 4.8 L per full flush and 3.0 L per half-flush.

2.3. Measurement Overview

This investigation selected six guest rooms, and measured the water use for six months from 1 October 2013 until 31 March 2014. To measure the water use of a bathroom, a measurement system was utilized with a flow-rate sensor, a temperature sensor and a programmable logic controller (PLC). The bathroom plan, the hot and cold water supply pipe layout and the measuring points are shown in Figure 2.
Usually flow-rate sensors are set separately on the shower, the tap of the sink and the toilet and then the flowrates of each equipment are analyzed. However, the hotel did not allow the researchers to cut pipes close to the equipment in order to install sensors, so the data was recorded to the PLC from the flow-rate sensor and the pipe surface temperature sensor. These were set on the bifurcation of the hot and cold water supply main pipes. This recording was done every 2 s and the flow data (0.0124 L/Pulse) as well as both the hot and cold water pipe’s surface temperature were stored.

2.4. Activity Separation Algorithm

As shown in Figure 2, the flow-rate sensors were set at each bifurcation of the hot and cold water supply main pipes. The flow data, which was recorded when the toilet, sink or bath was used, identified specific activities based on a gap of more than 30 s between individual pulse signals. A database containing data separated according to activity type was then constructed. The database stored information on each action such as the date, the time, the amount of hot water and cold water, the temperature and the flow rate. For the convenience of measuring points, it was necessary to separate the activities stored in the database into the following actions: face washing, toilet, showering and filling the bath. The flowchart used for separating the types of activities is shown in Figure 3.
First, in order to identify water-use patterns associated with face washing, recorded activities were separated by hot and cold-water use. This separation threshold was set based on the statistical data acquired from a preliminary monitoring assessment of the face washing occurring in each room. In the next step the remaining activities were separated by the amount of hot and cold water used, defining them as a toilet action in the case that only cold water was used and as a bath activity in the case that both hot and cold water were used. In the case of a “toilet” action, the full flush and the half flush were separated by discriminant analysis through binary function which used the amount of water and time as variables. This drew on prior data collected on the water-usage characteristics of a full flush and half flush of the toilet type under investigation. Likewise, for the bathing action, the showering and filling the bath activities were separated by discriminant analysis through the linear discriminant unary function using the flowrate as the variable. Each linear discriminant function was determined by assuming the actual measurement value, which was estimated by carrying out the particular action in advance, in function of the population. Moreover, the linear discriminant function was determined per room, due to the different dispersion of plumbing equipment in each room.
It is unlikely that simultaneous use of the toilet, bath and sink occurred because all three installations are set in the same space, as shown in Figure 2, and they are considered to be used by one person in a normal room usage situation. However, it is likely that the toilet use action will lead to a hand washing action at the sink, so separation of toilet use and hand washing actions is considered in Section 3.2 below.

3. Result and Discussion

3.1. Operation Rate and the Number of Occupants Per Room

The aggregated operation rate derived from the hotel’s management data and the statistical amount of occupants per room is shown in Table 2 and the monthly transition is shown in Figure 4.
One reason for the tendency of decreasing operation rates in the period from May to October is because Vietnam has a monsoon season in that period, so fewer guests stay for sightseeing during that time.

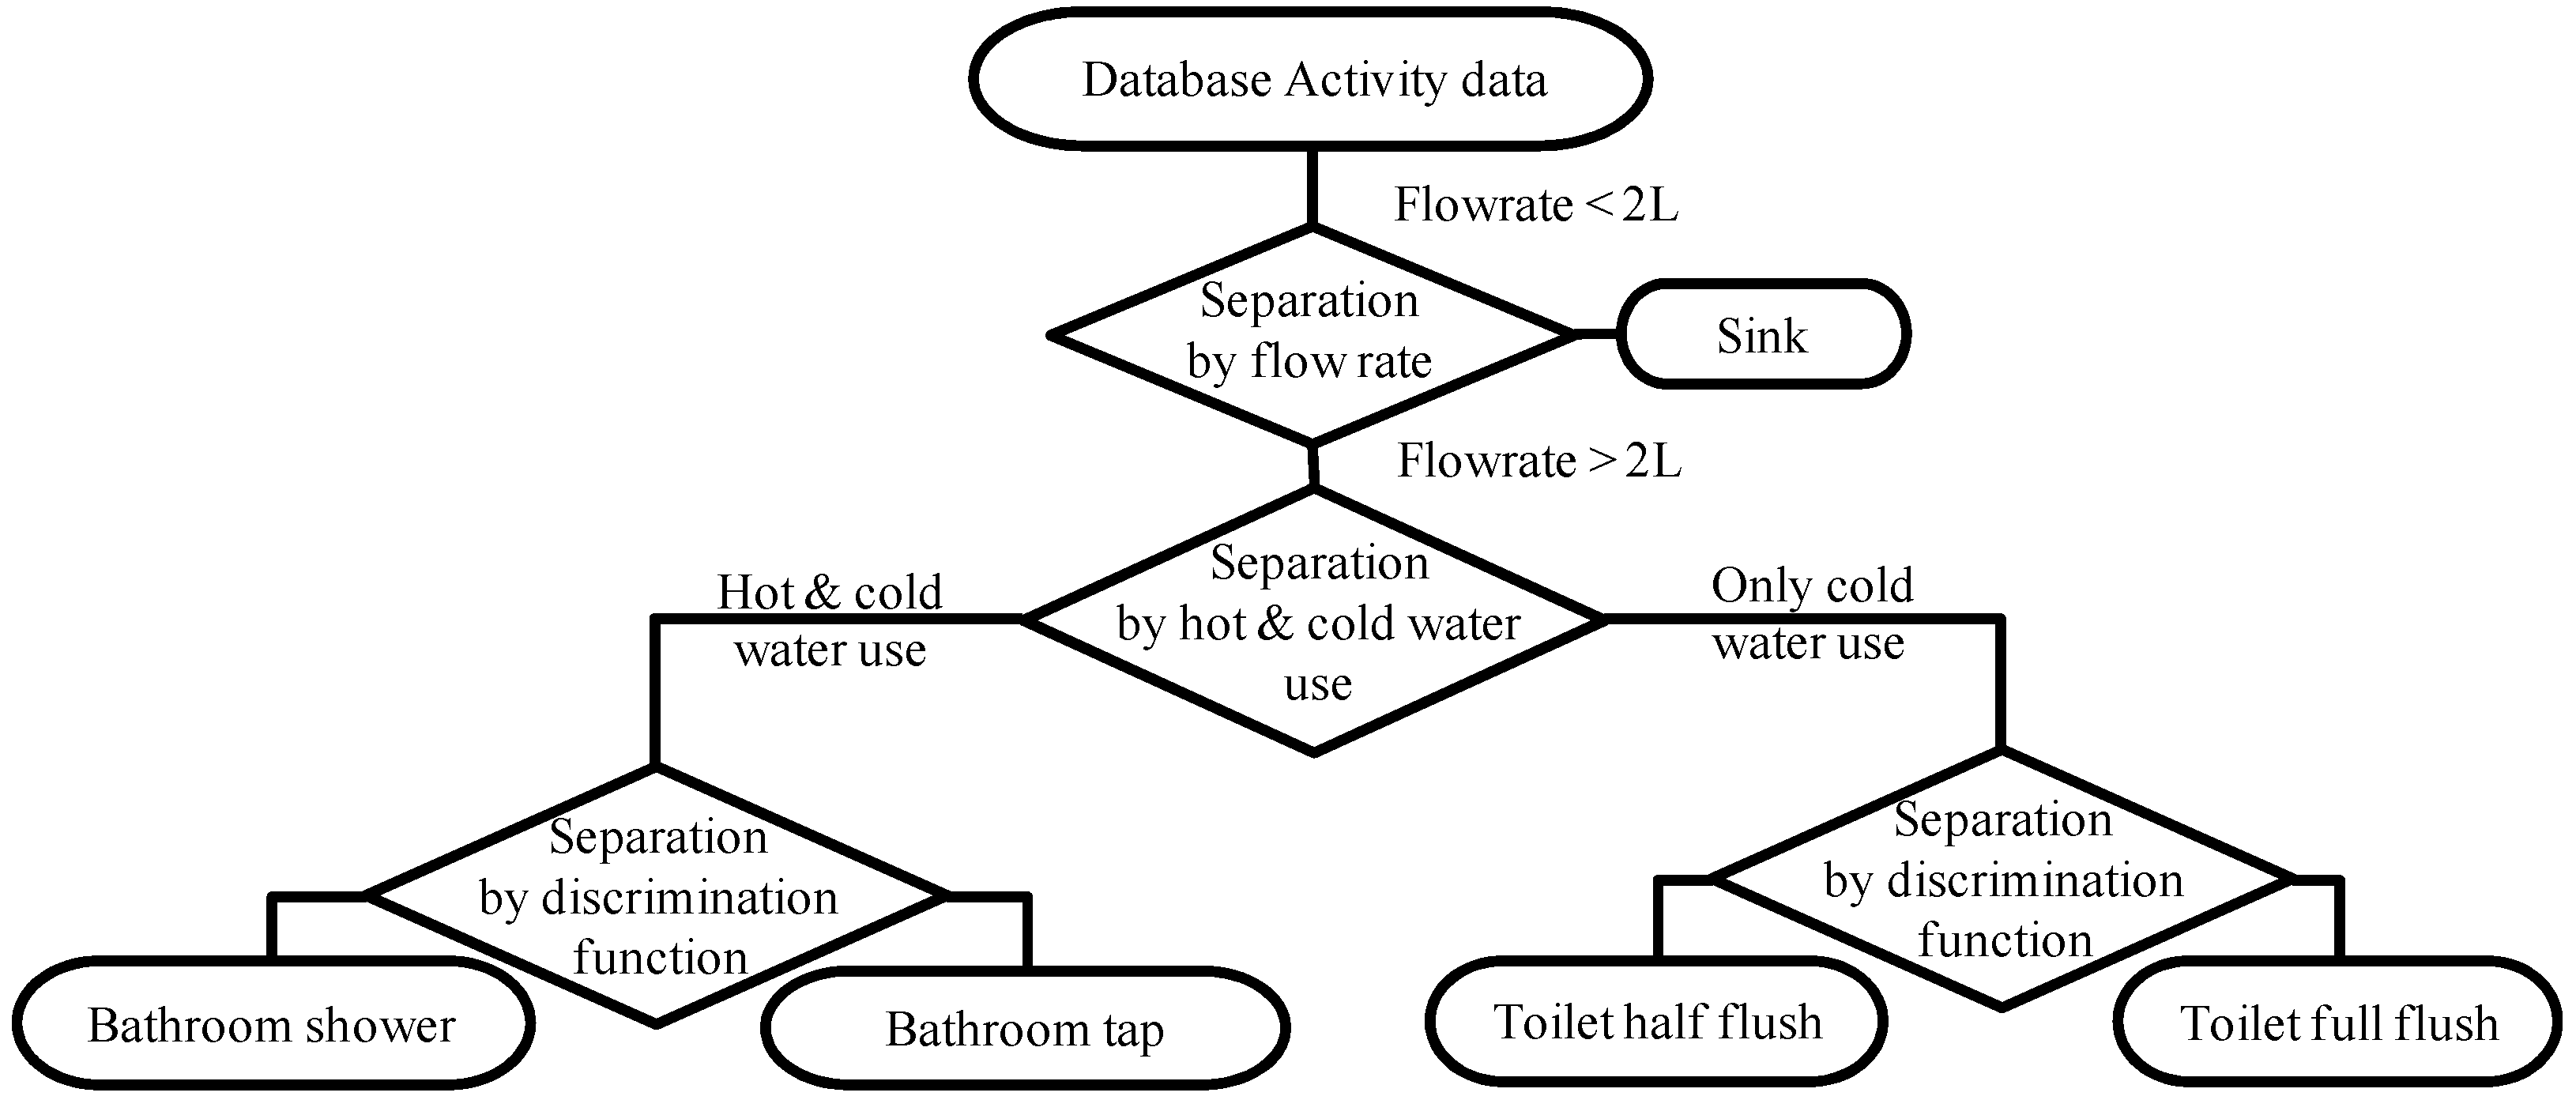
3.2. Outcome of the Hand Wash Action Separation Analysis

The threshold flow rate values were set so that a 99.5% confidence interval could be obtained from the toilet usage data in all of the measured rooms. The aforementioned statistical values for full and half toilet flushes are shown in Table 3 (The upper limit is the average value minus the value of 3σ, the lower limit is the average value minus the value of σ. The toilets used in this investigation were tank-type toilets, so the tank filling time per flush statistic in Table 3 shows the amount of time it takes for new water to be supplied to the tank reservoir after each type of flush.).
However, in most cases the toilet use action is expected to also include a hand washing action. Although the values in Table 3 only reflect the flow volume and time of toilet flushes in particular, in practice the flow volume and time of hand washes also count towards the actual water usage.
Therefore an attempt was made to obtain measurements of both flow and time values in regards to the washing of hands after a toilet usage action. In regards to hand washes (n = 60), 15.03 +/− 7.99 s was determined to be the average necessary time for the completion of the action. Moreover, the time required to start the hand wash after finishing the actual toilet usage action is 3.5 +/− 0.99 s. It is important to consider both this time gap as well as the duration of the actual action for determining the upper value of the toilet water supply if the values for hand washes are to be added to the total. Hence, the upper value is set at 46 s, as calculated by taking the sum of the 3σ values for both full and half flushes in order to reach a 95% confidence interval (15.03 + 7.99 × 3 + 3.50 + 3 × 0.99 = 45.47). This value is bigger than the water flow time threshold value as seen in Table 3, thus if hand washing is taken into consideration the upper limit of water flow time can be set at 46 s regardless of the type of flush. As for the lower flow time limit, this was set as the average of each measured room’s −3σ, assuming no hand washing action takes place.
Furthermore, the average cold water amount consumed for the washing of hands was determined to be 0.8 +/− 0.62 (L), whereas the average hot water consumption was 0.8 +/− 0.61 (L) according to the results of the investigation. Thus, the model of water flow volume and flow time as measured for a toilet use action is presented in Table 4.

3.3. An Example of Setting Linear Discriminant Function

As mentioned in Section 2.4, a linear discriminant function was used for each of the six investigated guest rooms in order to separate full and half flushes during the toilet activities and the showering and filling of the bathtub during the bathing activities. An example of the linear discriminant function as used for the toilet activities is shown below.
For the toilet usage total water volume and total time, both of which have very similar values during both full and half flushes (as can be seen in Table 4), are taken into account. The discriminant analysis is conducted in order to properly identify each type of flush, thus in other words to avoid erroneously determining what kind of flush was used.
In case the variable for the water volume is set as “x1” and the one for time as “x2”, and given the probability distribution of x = [x1, x2]′ in the population [1], then the following Equation (1) can be assumed to represent the normal distribution N (μ[1], Σ):
μ [ 1 ] = [ μ 1 [ 1 ] μ 2 [ 1 ] ] ,   = [ σ 11 σ 12 σ 12 σ 22 ]
On the other hand, the following Equation (2) is assumed to represent the normal distribution N (μ[2], Σ) given probability distribution of x = [x1, x2]′ in the population [2] and whereby Σ is considered to be the same as above:
μ [ 2 ] = [ μ 1 [ 2 ] μ 2 [ 2 ] ] ,   = [ σ 11 σ 12 σ 12 σ 22 ]
If there would be a sample that belongs to either population [1] or [2], but for which it the designation is not known, then the correct population can be determined if the values of x1 and x2 are given. For this purpose the squared Mahalanobis distance is defined as follows:
D [ k ] 2   =   ( x μ [ k ] )   1   ( x μ [ k ] ) =    [ x 1 μ 1 [ k ] ,   x 2 μ 2 [ k ] ]   [ σ 11 σ 12 σ 12 σ 22 ] [ x 1 μ 1 [ k ] x 2 μ 2 [ k ] ] =  ( x 1 μ i [ k ] ) 2 σ 11 +  ( x 2 μ 2 [ k ] ) 2 σ 22 + 2( x 1 μ 1 [ k ] )( x 2 μ 2 [ k ] ) σ 12 =  i = 1 2 j=1 2 ( x i μ i [ k ] )( x j μ j [ k ] ) σ ij     ( k=1,2 )
whereby the Σ−1 (with the superscript indicating the inverse matrix) is defined as:
1 =   [ σ 11 σ 12 σ 12 σ 22 ] 1 =   [ σ 11 σ 12 σ 12 σ 22 ]
Equation (3) represents the extension of the one dimensional Mahalanobis *1 equation to two dimensions.
Note *1 The square of the Mahalanobis distance is the distance from the sample’s x1 to each population, and can be defined as follows: D [ 1 ] 2 = ( x 1 μ 1 1 ) 2 σ 2 , D [ 2 ] 2 = ( x 1 μ 1 2 ) 2 σ 2 .
D[k]2 is a quantitative measure of the statistical distance from x to the population mean vector μ[k] of the population [k]. If Σ = I 2 , representing a unit matrix, then D[k] would be an Euclidean distance. However generally Σ I 2 , so in that case D[k] represents a value obtained by the adjustment of the Euclidean distance by variance and covariance. In case the two-dimensional normal distribution N (μ, Σ) is given by the probability density function *2, which when transformed becomes like Equation (5), then the corresponding relationship between the probability density function and the squared Mahalanobis distance is D2 = (x − μ)’Σ−1 (x − μ).
Note *2 The joint-probability density function of the two-dimensional normal distribution is generally given as: f ( x , y ) = 1 2 π 1 ρ x y 2 σ x σ y exp ( 1 2 D 2 )
f ( x ) = 1 2 π | Σ | ( D 2 2 )
The discriminant is set using the Mahalanobis distance as follows:
D [ 1 ] 2 D [ 2 ] 2 in the population [ 1 ] D [ 1 ] 2 > D [ 2 ] 2 in the population [ 2 ]
Here, we can use Equation (7), which is based on Equation (3).
D [ 2 ] 2 D [ 1 ] 2 = 2 [ μ 1 [ 1 ] μ 1 [ 2 ] , μ 2 [ 1 ] μ 2 [ 2 ] ] [ σ 11 σ 12 σ 12 σ 22 ] [ x 1 μ ¯ 1 x 2 μ ¯ 2 ]
However, one should consider that μ ¯ 1 = ( μ 1 [ 1 ] + μ 1 [ 2 ] ) 2 , μ ¯ 2 = ( μ 2 [ 1 ] + μ 2 [ 2 ] ) 2 . Equation (8) divided by 2 is called linear discriminant function, whose discriminant is determined as in Equation (9).
z = [ μ 1 [ 1 ] μ 1 [ 2 ] , μ 2 [ 1 ] μ 2 [ 2 ] ] [ σ 11 σ 12 σ 12 σ 22 ] [ x 1 μ ¯ 1 x 2 μ ¯ 2 ]
z 0     D [ 1 ] 2 D [ 2 ] 2     in the population [ 1 ] z 0     D [ 1 ] 2 > D [ 2 ] 2     in the population [ 2 ]
With full and half flushes designated as populations [1] and [2] respectively, the discriminants for each measured target room were calculated. Table 5 provides an example of results obtained in the examination of toilet activities in room A.
Given the full toilet flush data (based on the population [1], as defined in Equation (9)) we can calculate the following:
n[1] = 20
μ ^ 1 [ 1 ] = x ¯ 1 [ 1 ] = Σ i 1 [ 1 ] n [ 1 ] = 90.94 20 = 4.547
μ ^ 2 [ 1 ] = x ¯ 2 [ 1 ] = Σ i 2 [ 1 ] n [ 1 ] = 614 20 = 30.7
S 11 [ 1 ] =   ( x i 1 [ 1 ] x ¯ 1 [ 1 ] ) 2 =   x i 1 [ 1 ] 2 ( Σ x i 1 [ 1 ] ) 2 n [ 1 ] = 413.55 90.94 2 20 = 0.0574
S 22 [ 1 ] =   ( x i 2 [ 1 ] x ¯ 2 [ 1 ] ) 2 =   x i 2 [ 1 ] 2 ( Σ x i 2 [ 1 ] ) 2 n [ 1 ] = 18876 614 2 20 = 26.2
S 12 [ 1 ] =   ( x i 1 [ 1 ] x ¯ 1 [ 1 ] ) ( x i 2 [ 1 ] x ¯ 2 [ 1 ] ) =   x i 1 [ 1 ] x i 2 [ 1 ] ( Σ x i 2 [ 1 ] ) ( Σ x i 2 [ 1 ] ) n [ 1 ] = 2791 90.94 × 614 20 = 0.454
On the other hand, from the half toilet flush data (based on population [2], as defined in Equation (9)) we get the following:
n[2] = 15
μ ^ 1 [ 2 ] = x ¯ 1 [ 12 ] = Σ i 1 [ 2 ] n [ 2 ] = 44.17 15 = 2.945
μ ^ 2 [ 2 ] = x ¯ 2 [ 2 ] = Σ i 2 [ 2 ] n [ 2 ] = 308 15 = 20.53
S 11 [ 2 ] =   ( x i 1 [ 2 ] x ¯ 1 [ 2 ] ) 2 =   x i 1 [ 2 ] 2 ( Σ x i 1 [ 2 ] ) 2 n [ 2 ] = 131.9 44.17 2 15 = 1.803
S 22 [ 2 ] =   ( x i 2 [ 2 ] x ¯ 2 [ 2 ] ) 2 =   x i 2 [ 2 ] 2 ( Σ x i 2 [ 1 ] ) 2 n [ 2 ] = 6336 308 2 15 = 11.733
S 12 [ 2 ] =   ( x i 1 [ 2 ] x ¯ 1 [ 2 ] ) ( x i 2 [ 2 ] x ¯ 2 [ 2 ] ) =   x i 1 [ 1 ] x i 2 [ 1 ] ( Σ x i 2 [ 2 ] ) ( Σ x i 2 [ 2 ] ) n [ 2 ] = 906.8 44.17 × 308 15 = 0.2871
As a result we get the following equation:
μ ¯ ^ 1 = μ ^ 1 [ 1 ] + μ ^ 1 [ 2 ] 2 = 4.547 + 2.945 2 = 3.746
μ ¯ ^ 2 = μ ^ 2 [ 1 ] + μ ^ 1 [ 2 ] 2 = 30.7 + 20.53 2 = 25.62
σ ^ 11 = S 11 [ 1 ] + S 11 [ 2 ] ( n [ 1 ] 1 ) + ( n [ 2 ] 1 ) = 0.0574 + 1.803 ( 20 1 ) + ( 15 1 ) = 0.0564
σ ^ 22 = S 22 [ 1 ] + S 22 [ 2 ] ( n [ 1 ] 1 ) + ( n [ 2 ] 1 ) = 26.2 + 11.733 ( 20 1 ) + ( 15 1 ) = 1.149
σ ^ 12 = S 12 [ 1 ] + S 12 [ 2 ] ( n [ 1 ] 1 ) + ( n [ 2 ] 1 ) = 0.454 + 0.2871 ( 20 1 ) + ( 15 1 ) = 0.0225
Σ ^ = [ σ ^ 11 σ ^ 12 σ ^ 12 σ ^ 22 ] = [ 0.0564 1.149 1.149 0.0225 ]
Σ ^ 1 = [ σ ^ 11 σ ^ 12 σ ^ 12 σ ^ 22 ] = [ 0.02 0.87 0.87 0.04 ]
Thus, as explained earlier, the equation for the estimation of the linear discriminant function according to Equation (8) is the following:
z = [ μ ^ 1 [ 1 ] μ ^ 1 [ 2 ] , μ ^ 2 [ 1 ] μ ^ 2 [ 2 ] ] [ σ 11 σ 12 σ 12 σ 22 ] [ x 1 μ ¯ 1 x 2 μ ¯ 2 ] = [ 4.547 3.746 , 30.7 20.53 ] [ 0.02 0.87 0.87 0.04 ] [ x 1 3.746 x 2 25.62 ] = 32.184   x 1 818,467   x 2 363.23
The following is the discriminant equation for the values of the water flow (x1) and the time (x2) as shown in Table 5:
z ^ 0     D ^ [ 1 ] 2 D ^ [ 2 ] 2     in population [ 1 ] ( toilet full flush )
z ^ < 0     D ^ [ 1 ] 2 > D ^ [ 2 ] 2    in population [ 2 ] ( toilet half flush )
Note that with the same calculation the coefficients for each of the investigated guest rooms can be set as shown in Table 6.
If the above equation are used in order to calculate the discriminant values of the different toilet activities, then the identification rate is 100%.

3.4. Model of Toilet and Shower Actions

The toilet usage frequency (both full and half flushes), as well as the consumption, time and hot water temperature data, as measured in the six guest rooms, are shown per person and per room in Table 7.
The output values gained from the activity separation algorithm show the toilet and shower uses per room. The toilet use and shower use per person were then calculated by dividing the output value by the average number of occupants.
Data from toilet use revealed that full flushes occur more than half flushes in the hotel environment compared to the mean Vietnamese household, although the total flush time is similar when compared to the results from the earlier study (Table 8)
This may be due to the difference in users’ economic rationality. The toilet usage model in the previous study was targeted towards general households, so the burden of expenses was lowered by saving water. However, at places such as hotels, users have to pay a fixed amount of money, irrespective of the actual amount of water used. Therefore, their water-saving awareness level is considered low in the context of this study.
The showering data was compared with the results of an earlier study, in which the showering habits in Japan were measured and explored by means of a questionnaire. The previous study’s results [10] are shown in Table 9.
The research data from the Vietnamese hotel indicated a decrease in water usage, showering time and temperature of hot water when compared to the average Japanese household. Comparison of the instantaneous flow, the flow amount divided by the flow time, shows 6.6 L/min in the Vietnamese hotel to 10 L/min in the Japanese model. The variation in values between Vietnamese and Japanese data is caused by the different characteristics of the shower models used, not because of differences between the countries themselves. The average shower time in Vietnam is 7.3 min/use, which is close to the values seen in the Japanese summer data. This study shows that results obtained in Ho Chi Minh City, which has a consistent climate all year round, strongly resemble the data obtained in Japan during the summer. Moreover, it is believed that the difference seen in hot water temperatures is caused by the difference in climate zones of the investigative sites; namely the Torrid Zone in Ho Chi Minh and the Temperate Zone in Japan.

3.5. The Breakdown of Hourly Water Use in the Hotel in Vietnam

The breakdown of hourly hot and cold water use in a full and half toilet flush, in the shower and in the bath-tap at the hotel room is shown in Figure 5.
The average amount of hot and cold water use is 144.6 L/(room per day), of which the full toilet flush accounts for 27.3 L, the half toilet flush for 17.3 L, the shower for 69.6 L, and the tap of the bath for 30.3 L. Although the tap for the sink is not included in the hot and cold water usage amount, its share in the room’s total hot and cold water usage is seemingly very low. Previous studies in Japan show that the use of the sink accounts for just 5% of the total water usage. The data also reveals that each action has a high usage rate in the morning time and a low rate in the daytime. A peak in showering activity was seen twice; both in the morning and at night, because there was a second high usage rate between 21:00 and 23:00. The time of shower usage is more concentrated than the toilet usage, suggesting that the peak of hot and cold water use at the hotel is mainly caused by shower usage.

4. Conclusions

In conclusion, this study measured and assessed toilet and shower usage in the context of a Vietnamese hotel. By modeling the frequency of toilet usage and water consumption, as well as usage time and shower temperature, this study provides valuable data relevant to improving water-saving strategies and comprehending the impact of water-saving devices. The modeled mean values can be summarized as such: a full toilet flush occurs 3.3 times/day, a half flush 3.0 times/day, the water consumption from shower usage is 48.1 L/day, showering time is 7.3 min/day and the shower water temperature is 37.7 °C. This data can be utilized for the management of hotels, as it foregrounds the estimation of water consumption and the associated running costs. Future research should attempt to quantify the CO2 emission reduction effect achieved by the introduction of water saving toilets and showers in Vietnamese hotels by using the modeled values from this report.

Acknowledgments

This study was conducted as a part of the “JCM Large Scale Feasibility Project to Promote Water Saving and Energy Saving Products in Vietnam” project, which is part of the “Project to Support the Large-Scale Formation of Joint Crediting Mechanism Programs to Realize Low Carbon Societies in Asia (FY2013)” of the Ministry of Environment of Japan. This paper is written under the “Program to support research activities of female researchers” of the Japanese Ministry of Education, Culture, Sports, Science and Technology. All the people related to these projects are hereby gratefully acknowledged for their help and support.

Author Contributions

Yasutoshi Shimizu designed the experiments; Kanako Toyosada performed the experiments; Kanako Toyosada and Takayuki Otani analyzed the data; Kanako Toyosada wrote the paper.

Conflicts of Interest

The authors declare no conflict of interest.

References

  1. Gutierrez-Escolar, A.; Castillo-Martinez, A.; Gomez-Pulido, J.; Gutierrez-Martinez, J.; Garcia-Lopez, E. A New System for Households in Spain to Evaluate and Reduce Their Water Consumption. Water 2014, 6, 181–195. [Google Scholar] [CrossRef]
  2. Castillo-Martinez, A.; Gutierrez-Escolar, A.; Gutierrez-Martinez, J.; Gomez-Pulido, J.; Garcia-Lopez, E. Water Label to Improve Water Billing in Spanish Households. Water 2014, 6, 1467–1481. [Google Scholar] [CrossRef]
  3. Zadeh, S.; Hunt, D.V.L.; Rogers, C.D.F. Socio-Technological Influences on Future Water Demands. Water 2014, 6, 1961–1984. [Google Scholar] [CrossRef]
  4. Cherunya, P.C.; Janezic, C.; Leuchner, M. Sustainable Supply of Safe Drinking Water for Underserved Households in Kenya: Investigating the Viability of Decentralized Solutions. Water 2015, 7, 5437–5457. [Google Scholar] [CrossRef]
  5. Rathnayaka, K.; Malano, H.; Maheepala, S.; George, B.; Nawarathna, B.; Arora, M.; Roberts, P. Seasonal Dynamics of Residential Water Demand End-Uses. Water 2015, 7, 202–216. [Google Scholar] [CrossRef]
  6. Matos, C.; Briga-Sa, A.; Pereira, S.; Silva-Afonso, A. Water and energy consumption in urban and rural Households. In Proceedings of the 38th International CIB W062 Symposium on Water Supply and Drainage for Buildings, Nagano, Japan, 17–19 September 2013; pp. 209–221.
  7. Tanaka, A.; Murakawa, S.; Takata, H. Analyzing of hot and cold water usage action for the guest room in a city hotel. J. Environ. Eng. AIJ Jpn. 2007, 611, 53–58. (In Japanese) [Google Scholar]
  8. Takata, H.; Murakawa, S.; Saito, C.; Abe, M.; Toyosada, K. Development of the Calculating Method for the Loads of Cold and Hot Water Consumption in a Business Hotel. In Proceedings of the CIBW062 International Symposium on Water Supply and Drain for Buildings, Beijing, China, 17–20 August 2015.
  9. Otani, T.; Toyosada, K.; Shimizu, Y. CO2 Reduction Potential of Water Saving in Vietnam. Water 2015, 7, 2517–2526. [Google Scholar] [CrossRef]
  10. Negishi, S.; Iio, A.; Iwasaki, A.; Shimizu, Y.; Toyosada, K.; Sakaue, K. Research on the Actual Condition of the Shower Use Act—Part 1 Survey of the Volume Flow Rate and the Temperature. In Proceedings of the Annual Meeting of the Society of Heating, Air-Conditioning and Sanitary Akita, Akita, Japan, 3–5 September 2014; A-4. pp. 37–40. (In Japanese)
Figure 1. The facilities for supplying hot and cold water.
Water 08 00085 g001
Figure 2. The bathroom plan and the measurement points.
Water 08 00085 g002
Figure 3. The flowchart used to separate activities.
Water 08 00085 g003
Figure 4. The operation rate and the transition of occupant number per room.
Water 08 00085 g004
Figure 5. The breakdown of the hourly hot and cold water use.
Water 08 00085 g005
Table 1. Description of the hotel.
Hotel NameRenaissance Riverside Hotel Saigon
LocationHo Chi Minh City
Hotel class5 star
Total guest rooms336 rooms
Building structure21 floor 2 underground floor
Established1998
FacilitiesGuest rooms restaurants coffee lounge bar lounge fitness center business center spa
Table 2. The operation rate and occupants per room.
TotalOperation Rate (%)Number of Occupants (Person/Room)
Average68.71.43
Standard deviation9.10.08
Maximum85.21.59
Minimum58.61.31
Table 3. The statistical values for full and half toilet flushes.
ItemRoomABCDEFTotal Average
The flow volume of a full toilet flush (L/flush)Average4.515.224.704.754.745.614.92
Standard deviation0.040.030.060.050.080.06-
4.625.334.884.914.975.79
−3σ4.405.124.524.594.515.43
The tank filling time of a full toilet flush (ss/flush)Average31322627263229
Standard deviation112112-
343532302938
−3σ282920242326
The flow volume of a half toilet flush (L/flush)Average2.773.223.443.323.063.273.18
Standard deviation0.110.120.290.240.080.11-
3.093.574.304.043.303.62
−3σ2.452.872.582.602.832.93
The tank filling time of a half toilet flush (ss/flush)Average20202322171920
Standard deviation111311-
232326312022
−3σ171720131416
Table 4. The model of water flow volume and flow time.
ItemRoomABCDEF
Flow volume threshold for a full flush (L/flush)Upper limit7.328.037.587.627.678.49
Lower limit4.405.124.524.594.515.43
Flow time threshold for a full flush (s/flush)Upper limit464646464646
Lower limit282920242326
Flow volume threshold for a half flush (L/flush)Upper limit5.806.287.006.746.006.32
Lower limit2.452.872.582.602.832.93
Flow time threshold for a half flush (s/flush)Upper limit464646464646
Lower limit171720131416
Table 5. Actual measured data (room A).
No.Active PatternTotal Flow Volume (L/min)Time (s)No.Active PatternTotal Flow Volume (L/min)Time (s)No.Active PatternTotal Flow Volume (L/min)Time (s)
1Full flush4.533213Full flush4.66305Half flush2.8020
2Full flush4.563214Full flush4.53306Half flush2.7820
3Full flush4.513015Full flush4.54307Half flush2.8020
4Full flush4.463016Full flush4.59308Half flush2.7722
5Full flush4.543217Full flush4.56309Half flush2.7820
6Full flush4.453018Full flush4.553210Half flush3.0122
7Full flush4.533219Full flush4.633011Half flush3.0320
8Full flush4.493220Full flush4.553012Half flush4.1320
9Full flush4.50321Half flush2.492013Half flush3.0122
10Full flush4.55322Half flush2.842214Half flush3.0120
11Full flush4.65283Half flush2.832015Half flush3.0520
12Full flush4.56304Half flush2.8420
Table 6. List of the coefficients.
RoomCoefficient of X1Coefficient of X2Complement
A32.184818,467−363.23
B−7.393561,514−139.844
C3.0345,600−125
D2.54349,248−25.92
E1.00172,800−50.0
F1.00172,800−45.0
Table 7. The statistical values of toilet and shower use.
Characteristic ValueToilet Use Action per PersonShower Use Action Per Person
Full Flush (Time/Day)Half Flush (Time/Day)Water Volume (L/Time)Time (Min/Use)Temperature of Hot Water (°C)
Average3.33.048.17.337.7
Standard deviation2.32.234.75.22.9
Table 8. Toilet usage in Vietnamese households [9].
ItemToilet Use per Person
Full Flush (Time/Day)Half Flush (Time/Day)
Vietnam household model2.14.8
Table 9. Showering habits in Japan.
The Investigation ObjectShower Use Action per Person
Water Volume (L/Time)Instantaneous Flow (L/Min)Time (Min/Use)Temperature of Hot Water (°C)
A model of a Japanese household [10]84.610Summer: 7.6Summer: 39
Winter: 9.4Winter: 40

