Article

Impact of Demographic Growth on Seawater Intrusion: Case of the Tripoli Aquifer, Lebanon

by
Omar Kalaoun
1,2,*,
Ahmad Al Bitar
1,
Jean-Philippe Gastellu-Etchegorry
1 and
Mustapha Jazar
2
1
CESBIO (Centre d’Etudes Spatiales de la Biosphère), UMR (CNRS, CNES, IRD, UPS), Toulouse 31401, France
2
LaMA (laboratoire de mathématique et Application), Université Libanaise, Tripoli 1300, Lebanon
*
Author to whom correspondence should be addressed.
Water 2016, 8(3), 104; https://doi.org/10.3390/w8030104
Submission received: 24 July 2015 / Revised: 29 January 2016 / Accepted: 9 March 2016 / Published: 16 March 2016

Abstract

:
Water resources in Mediterranean coastal aquifers are subject to overexploitation leading to an increase in seawater intrusion. Based on the United Nations Environment Program, “UNEP” 75% of people in the world will live in coastal cities by 2020. This is having a major impact on the salinization process. This paper deals with the impact of demographic evolution on seawater intrusion and considers the case of the lower Tripoli aquifer in Lebanon. A numerical model based on the sharp interface approach is implemented using “Freefem++” to access the seawater intrusion. The model is verified against an analytic and a numerical solution. It is calibrated and validated against hydraulic head observations (RMSD = 0.819 m). Then several scenarios of pumping are applied based on available demographic growth rates to quantify the impact on seawater intrusion. The projection scenarios show that if the current pumping rates are maintained while maintaining the demographic evolution, the pumping wells will be salinized within 2 decades in the highly populated areas.

1. Introduction

Groundwater resources in coastal aquifers around the Mediterranean sea are over-exploited. Irrigation, domestic and economic activities are leading to groundwater degradation [1]. One of the most important impacts of over-pumping in a coastal aquifer is the intensification of seawater intrusion. Several studies have already shown the intensification of seawater intrusion across the world, in North America [2], Mexico [3], Australia [4], and Oman [5]. The intensification of seawater intrusion can be attributed to changes in supply and demand. The decrease in supply of freshwater into the aquifer can be due to reduction in rainfall or variability in the snow fall. The increased demand on groundwater resources is mainly due to increase in economic activities and demographic evolution. This paper deals with the impact of demography on the seawater intrusion. We consider the case of the aquifer of Tripoli-Lebanon. Since the 1990s, the uncontrolled urbanization and intensification of internal migration to the coast increased the pressure on freshwater use in this aquifer. The water quality in terms of mineral concentration in the aquifer has been greatly degraded. This decrease has been measured in 2008 and 2009 [6]. With the predicted impact of climate change on the south-Mediterranean region [7] and the aggravation of conflicts in the region, the situation is expected to worsen. Future evolution of seawater intrusion based on scenarios is needed to elaborate mitigation strategies. We choose numerical modeling to achieve this objective.
The physical approach to model seawater intrusion is to use variable density flow in porous media [8,9]. The approach relies on the fully coupled implicit equations of variable density flow in porous media (generalized Darcy 3D flow in saturated media [10]) and the solute transport in porous media (advection-dispersion in porous media). Even though this approach is well established [9] and used in several modeling tools ([11] (FEFLOW), [12] (SUTRA), [13] (OpenGeoSys)), it presents some drawbacks. The main drawback is that it is more requiring in terms of computational needs and numerical convergence [14]. This approach is inherently 3D (or 2D vertical profile). Finally it requires several parameters for the solute transport equation that are difficult to acquire like the transverse and longitudinal dispersion. A second approach to modeling saltwater intrusion is the sharp interface approach. In this case the saltwater and freshwater are considered as two immiscible fluids separated by an interface. The main approximation is provided from the Ghyben-Herzberg [15,16] works that were latter generalized in several models [17]. This approximation need to be carefully verified before application. Its validity has been discussed in [18,19]. This approach has been used by [20] in Batinah aquifer of Oman, where explicit expressions for the water table, sharp interface location and stored volume of fresh water are obtained. In this study, the needed conditions for the use of the sharp interface approach are verified over the lower Tripoli aquifer prior to running the model.
In the following sections, the finite element model is presented for the Tripoli aquifer based on previous hydro-geological studies. The model is verified against analytical and numerical solutions in basic configurations. Then it is applied to the Tripoli aquifer. The last part of the paper shows results for several scenarios of pumping and their impact on the freshwater/saltwater interface. Finally, a summary and conclusions are given.
The following Table 1 shows the list of parameters used in this paper.

2. Materials and Methods

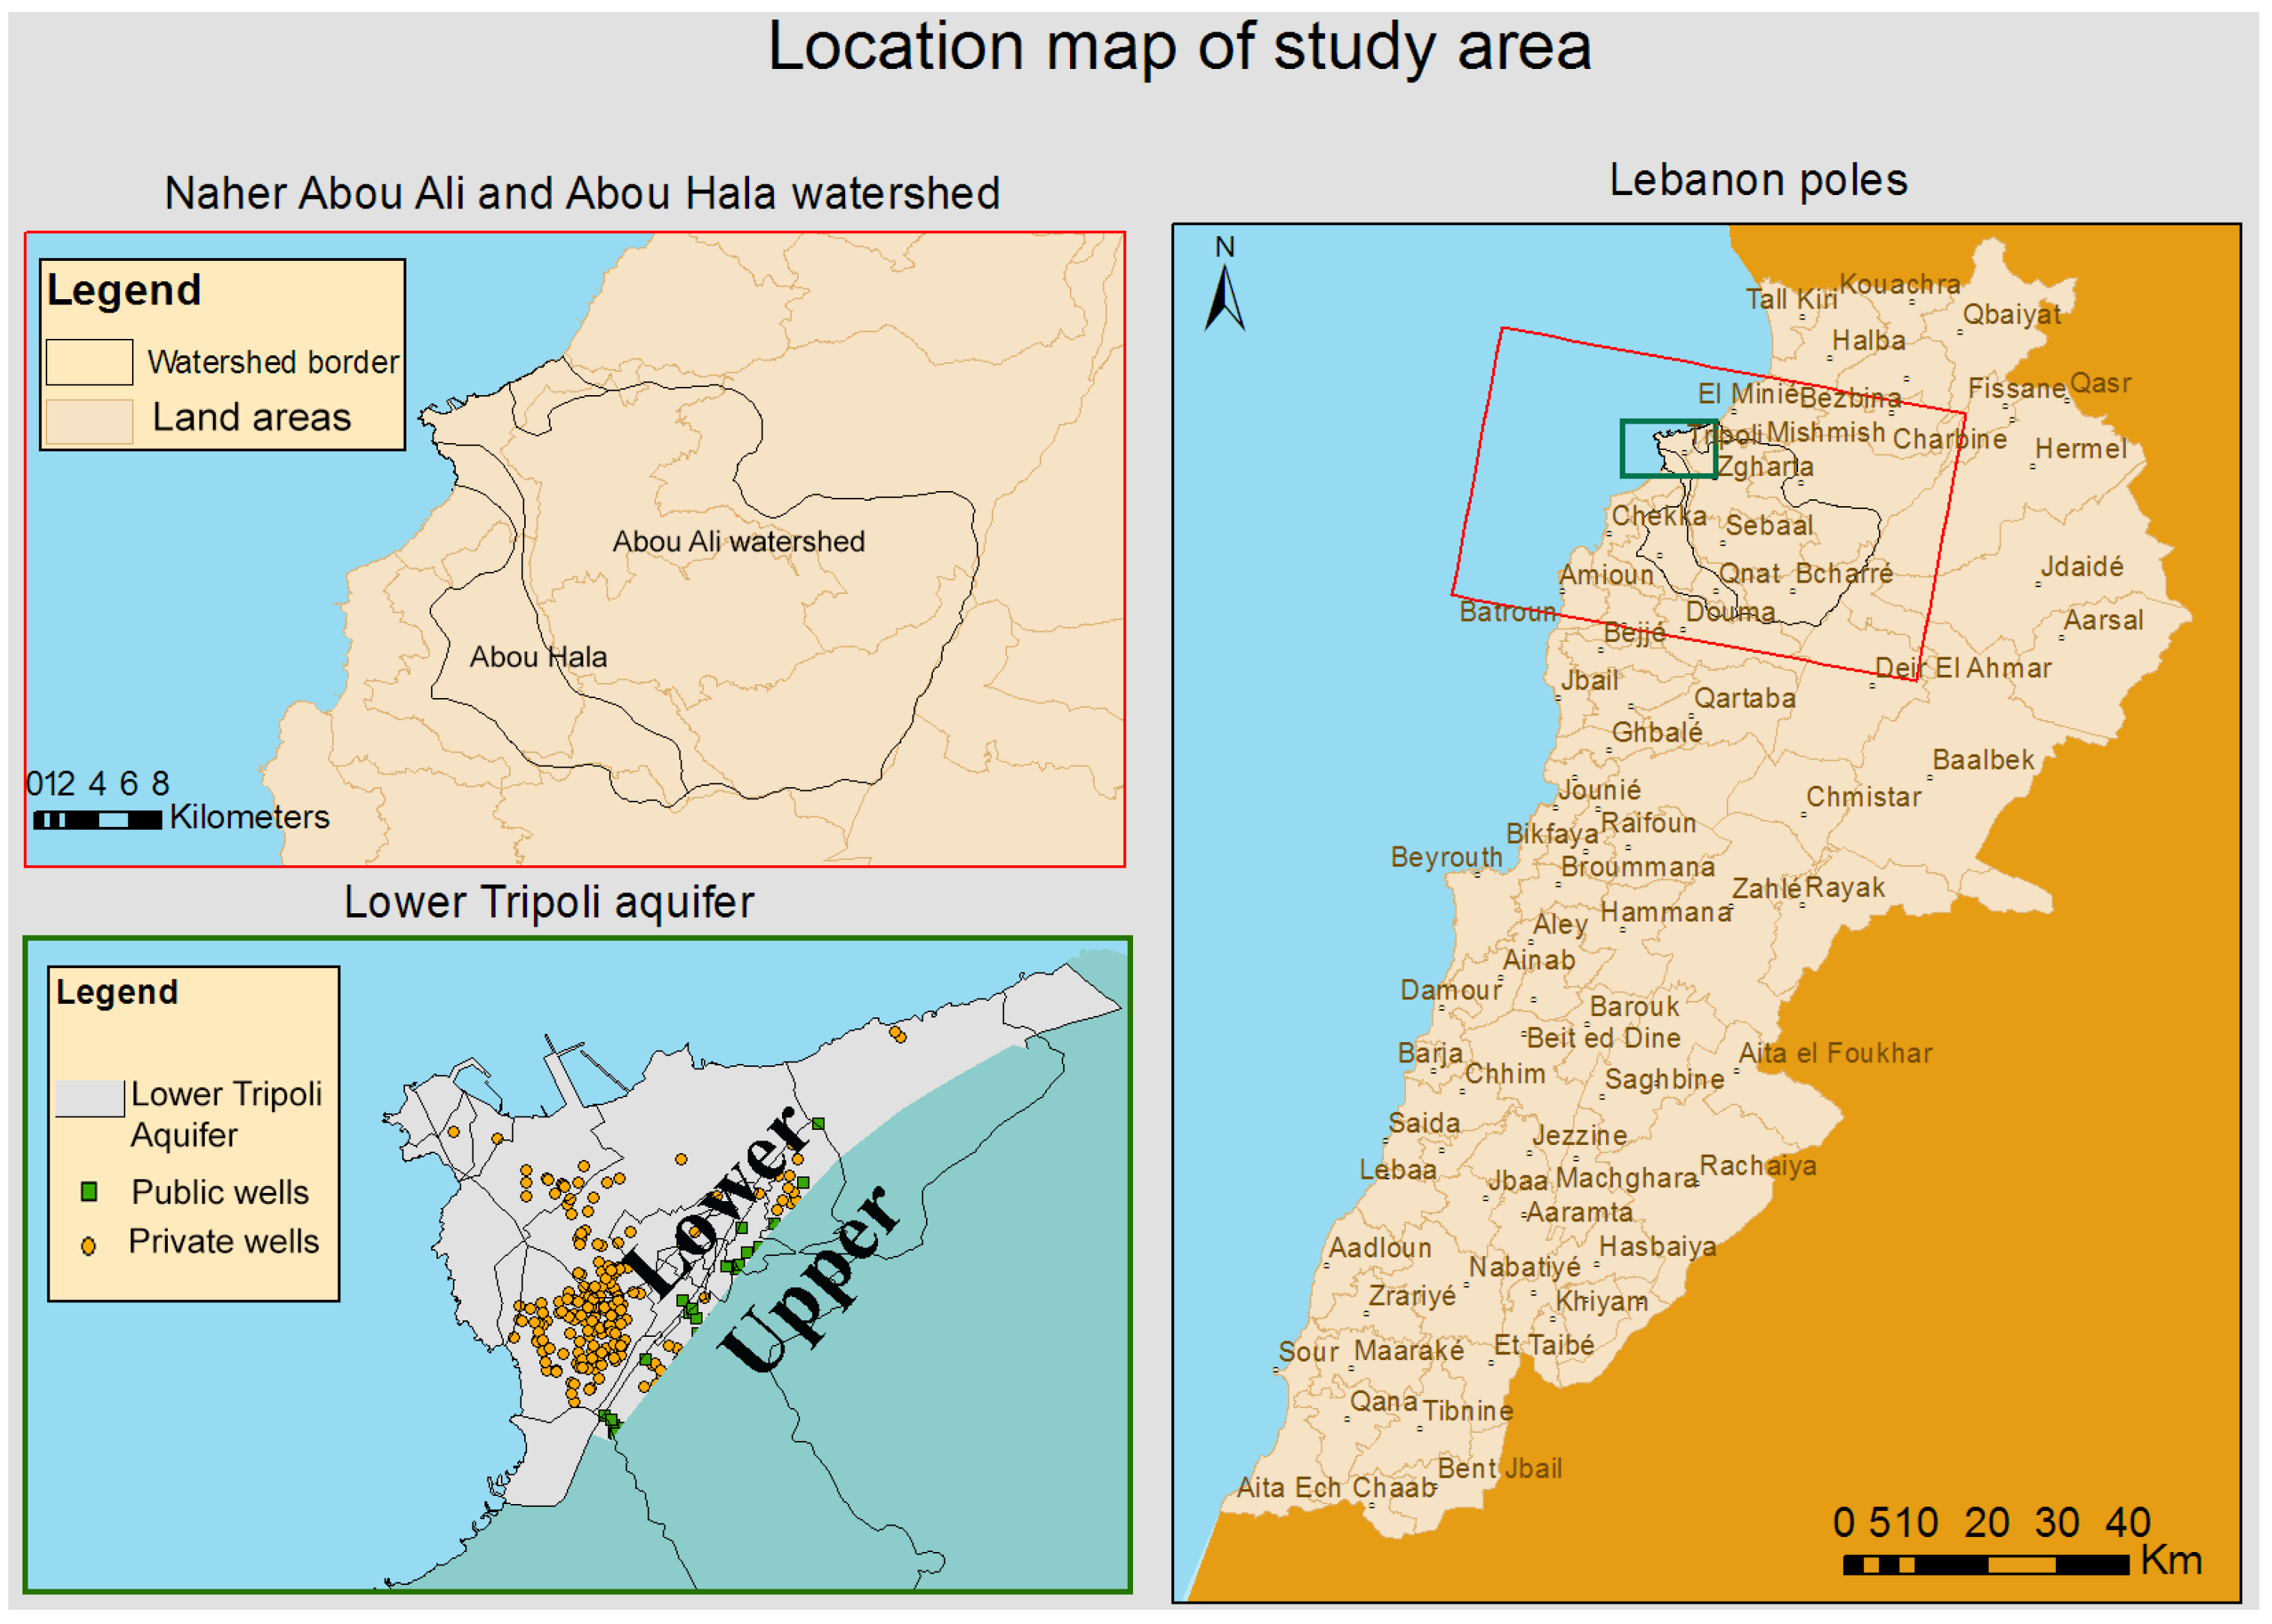
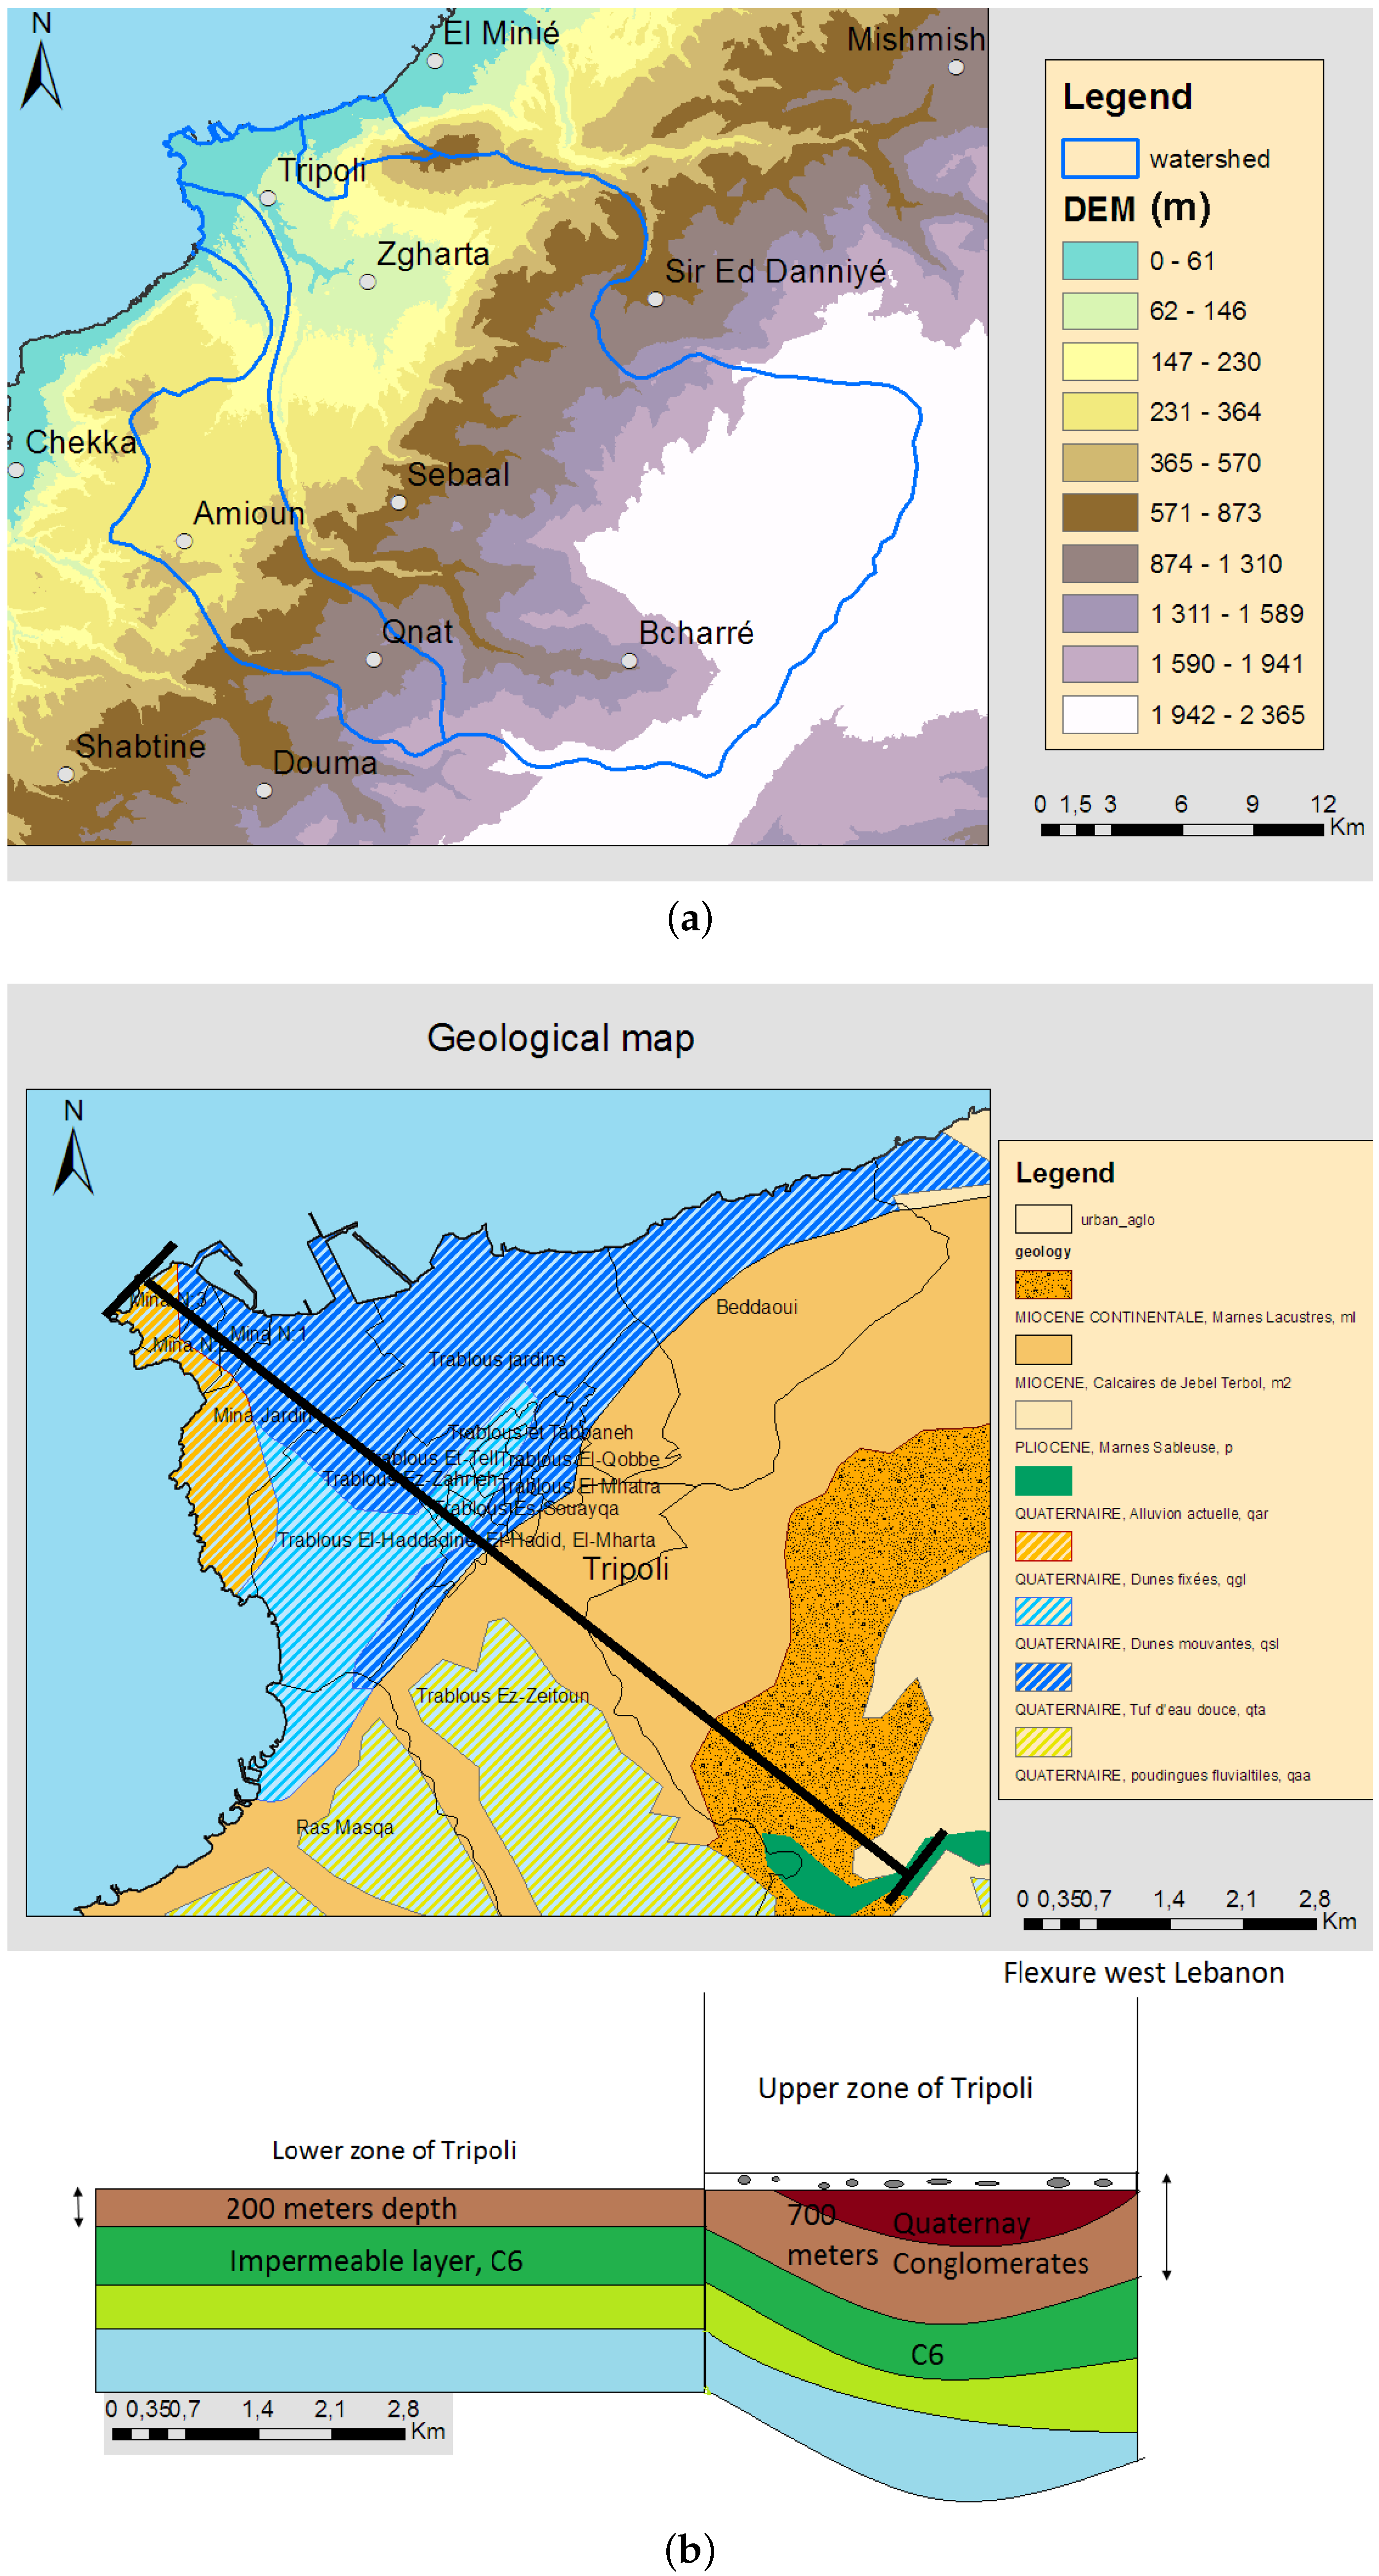
2.1. The Tripoli Aquifer

Tripoli is the second largest city in Lebanon and the regional center of North-Lebanon. It has an area of about 45 km 2 , and it is divided into lower (18 km 2 ) and upper zone (27 km 2 ) (Figure 1). The aquifer limits are inside the “Abou Ali” and “Abou Hala" watershed limits. In this study, only the lower Tripoli aquifer is considered. Its climate is hot and dry in summer, cool and wet in winter with annual rainfall of 700 mm. The median high and low temperatures vary between 1 C and 35 C. The groundwater is mainly recharged from rainfall and snow melt from “Bcharré ” region situated to the east of Tripoli aquifer (See Figure 2a). The rainfall season is short and dry season is long with little or no rainfall. Thus, during a large period of the year, the city relies on water coming from highly inconsistent snow melt [21]. The inhabitants rely highly on pumping the freshwater aquifer all year long due to the inefficient freshwater distribution network and the water shortages during the summer. In the current situation the water use is mainly domestic and industrial, a small amount is used for agricultural activities inside the lower aquifer.
Based on [22,23] the substratum of the aquifer in the study zone is the impermeable layer “C6” formed by marl and marl limestone. This layer is at a constant level of about 200 m below the sea level, see Figure 2b. At the Neogene and Quaternary period, many permeable layers were formed above to the “C6” layer. These layers are mainly formed by marly sand and have a thickness of about 200 m [24].

2.2. Observation Data Set

In the last few decades, Tripoli city has faced a large demographic change, which increased the freshwater demand. The official population growth rate given by Lebanese Ministry of Social Affairs, is 1 . 6 % per year [25]. There are about 82,000 inhabitants in the private wells region. Most of the areas originally covered by Lemon trees plantation were transformed into urban residential areas. These new buildings form a new neighborhood in Tripoli called “Dam and Farz”. Figure 1 shows part of the private wells that are operated in this region. In addition, there are six active public wells managed by Tripoli Water Authority in the study area. Four of them are in Bhsas neighborhood and the two other are in “El-Jisr” and “Malouleh”. Figure 3a shows the private wells region as a rectangle with 3,000,000 m 2 area. Yellow marks represent the public wells. Table 2 indicates the pumping rate of these wells [6]. The site is also characterized by the lack of complete observation data set due to unstable political situation. In the study all available data sources are considered the setup and validation of the model.
In 2008, water meters installed in 38 buildings showed that water consumption through well extraction is 250 L per capita per day [6]. This value exceeds the recommendation of the Lebanese Ministry of Energy and Water, which is 120 L per capita per day. In addition, when a private well starts salinizing, it remains operational for a certain amount of time for domestic uses (cleaning, toilets, etc.). A large amount of the drinkable water is acquired from external sources (bottled water, Tankers).
The total private wells pumping rate is about 20,828 m 3 per day. This excessive well pumping has caused an increase in the seawater intrusion [6]. The electric conductivity has been measured in nine wells in “Dam and Farz” neighborhood in 2008 [6]. These measurements show that this region can be divided into four zones based on water ionic content, see Figure 3b. The electrical conductivity was also measured in the same wells in 2009 and showed a notable increase, from 800 μS/cm to 1000 μS/cm [6]. These limits exceed the limits for drinkable water which are below electrical conductivity of 1000 μS/cm [26].

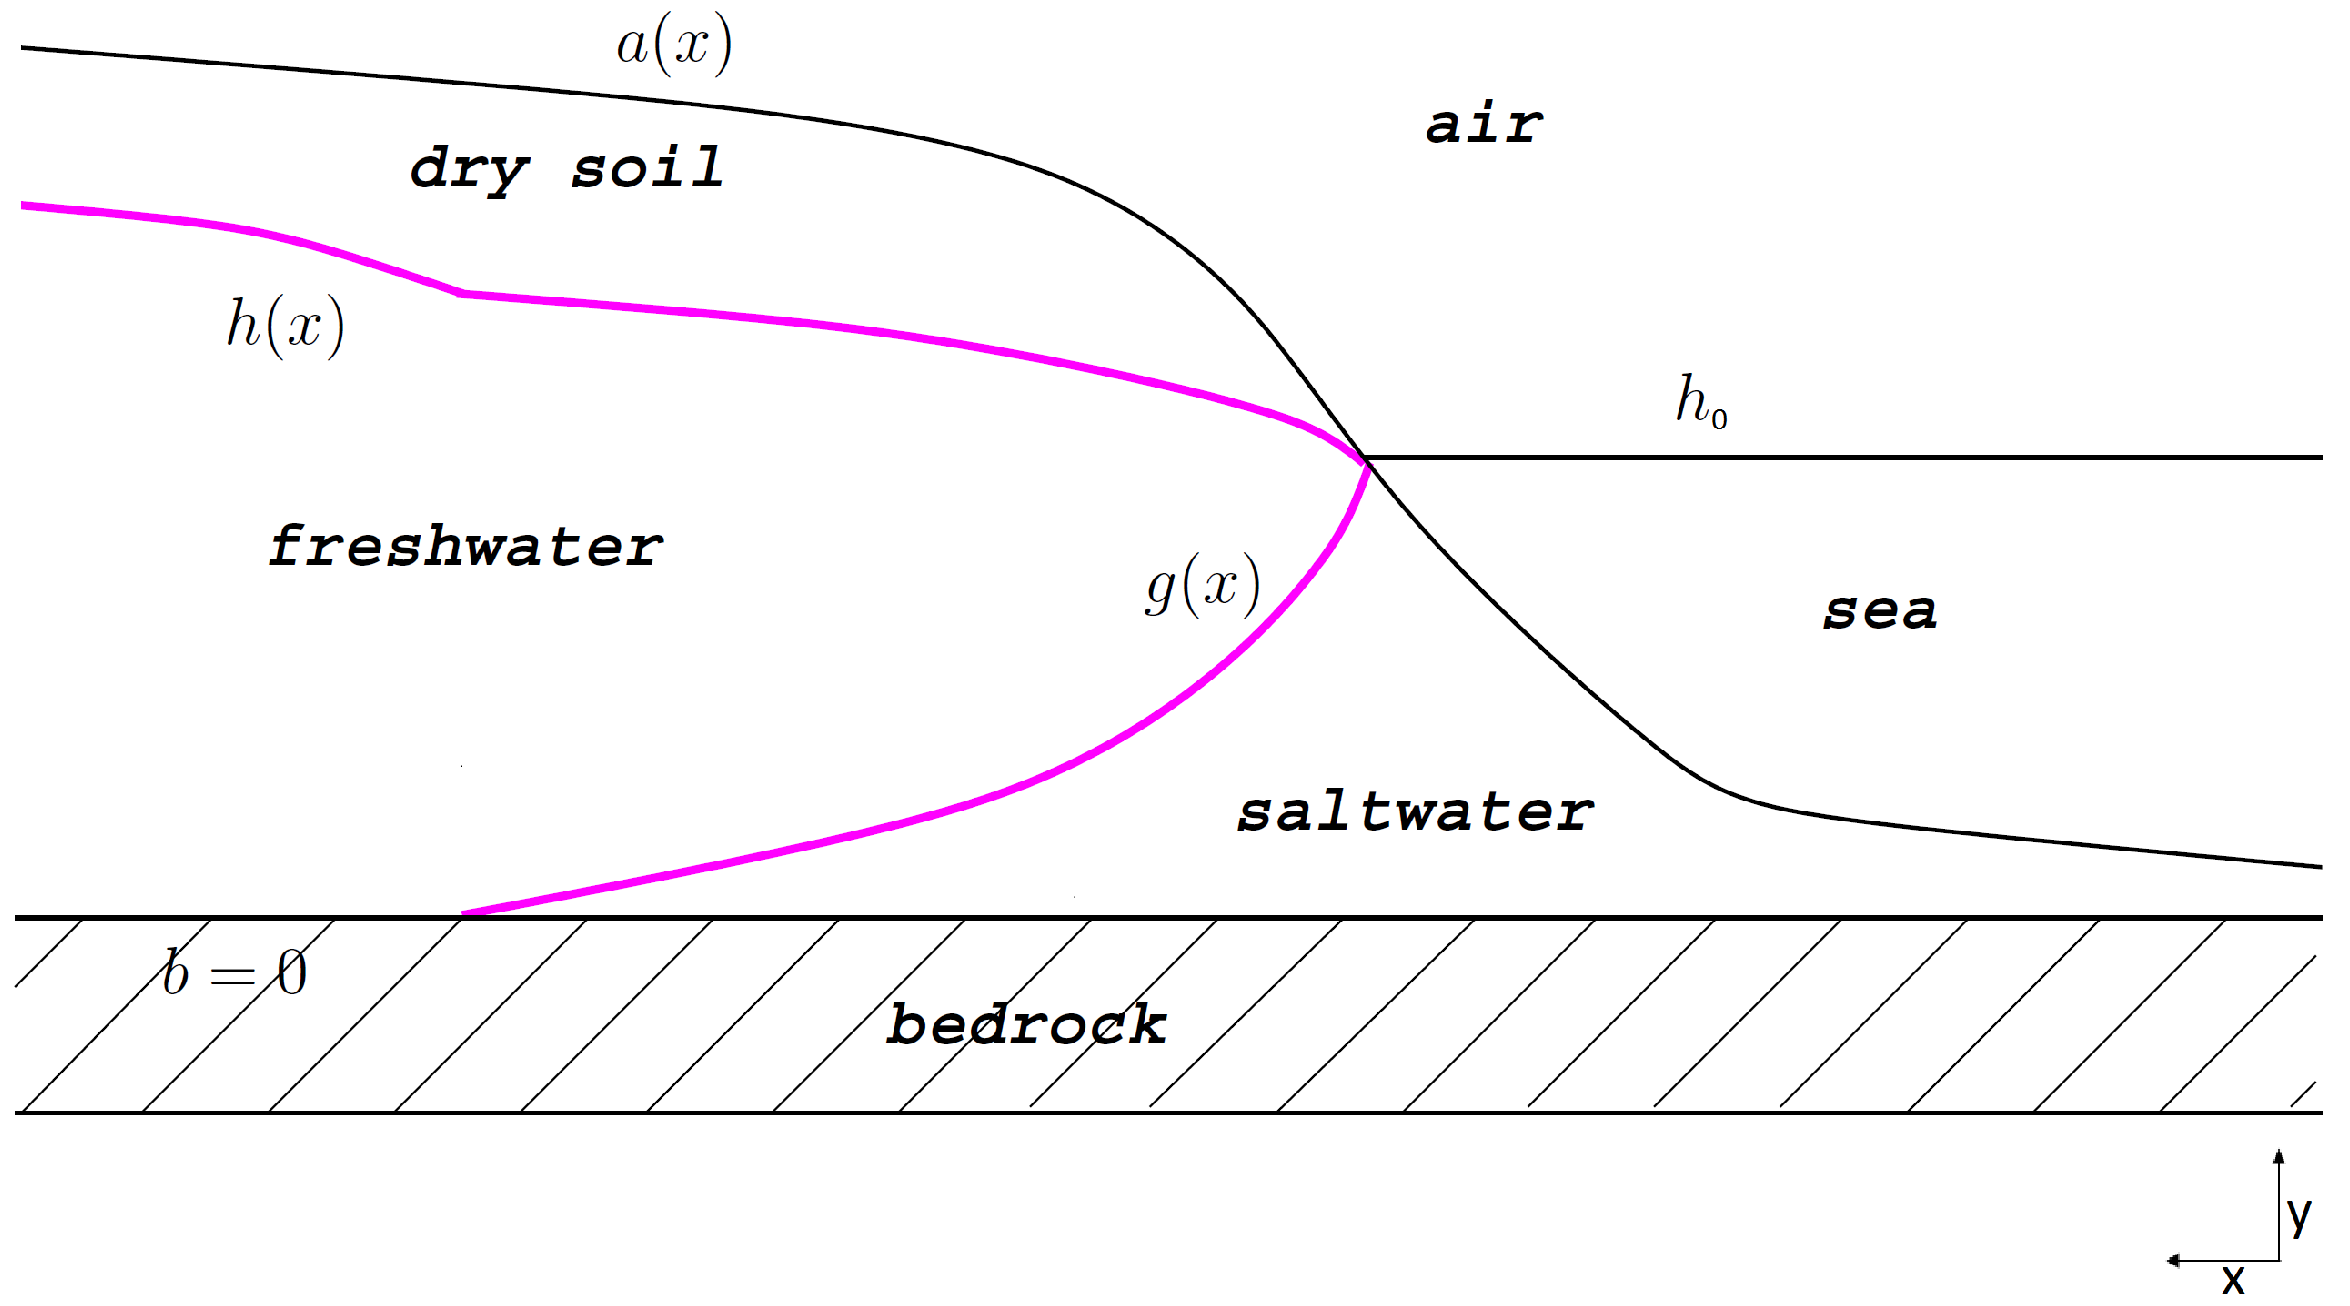
2.3. Mathematical Formulation

In order to model the seawater intrusion in Tripoli aquifer, we consider the following general configuration:
  • The Tripoli aquifer is an unconfined aquifer.
  • The flow direction is mainly horizontal.
  • The flow in the aquifer must be less than 100 m/day, enabling to consider the Darcy flow equation in porous media without the Ward-Forcheihmer quadratic terms ([27,28]).
Based on the four assumptions above, the 3D Darcy velocity equation can be integrated vertically resulting in the Dupuit-Boussinesq approximation [29]. In addition, we base our model on the Ghyben-Herzberg assumptions which means that :
  • The interface between freshwater and saltwater is assumed to be a sharp interface (the two fluids are considered as immiscible). This is applicable when the thickness of the transition zone is small. The interface is considered as representative of the lower percentile (50%) of the advection-dispersion approach.
  • The sharp interface approach is applicable considering the pumping rate. Based on [19] the sharp interface is more compatible to the realistic case when the pumping rate is higher than 0.07 m 3 per day and up to 0.15 m 3 per day also when the wells are relatively deep. This is the case in the lower Tripoli aquifer where the wells are deep (about 100 m) and the pumping rate is about 33,600 m 3 per day justifying the application of the sharp interface approximation.
  • The fluxes in the saltwater zone are considered as negligible and the saltwater is considered in hydro-static conditions.
  • An average sea water level is considered. Thus tides effects are not considered.
  • The pumping occurs in the freshwater zone. Saltwater adapts to the pressure in the freshwater, and pumping is stopped when the saltwater wedge is reached.
Figure 4 shows a schematic representation of an unconfined aquifer, in which a ( x ) denotes the ground level, b ( x ) the impermeable bedrock supposed constant in Tripoli case (see Figure 2b, h ( x , t ) the hydraulic head, g ( x , t ) the freshwater/saltwater interface, and the seawater height h 0 . Hence we have the following inequalities:
[ b ( x ) g ( x , t ) h 0 h ( x , t ) a ( x ) for   all ( x , t ) Ω × [ 0 , + ) ]
The aquifer Ω is divided into two parts, Ω = Ω s ( t ) Ω f ( t ) , where Ω s ( t ) is the part of the aquifer which contains saltwater and Ω f ( t ) that contains freshwater.
The general form of equations describing the flux of freshwater and saltwater in coastal aquifers under sharp interface approximation derive from combining the Darcy’s law with the mass conservation law for each fluid [17].
ϕ f ( h - g ) t + S = div - ( h - g ) K h ϕ s ( g - b ) t + S s = div - ( g - b ) K ( 1 - ϵ 0 ) h + ϵ 0 g
where ϕ f , ϕ s are the specific yield for the freshwater and saltwater regions respectively, ϵ 0 = ρ s - ρ f ρ s is the ratio of mass densities, ρ f is the density of freshwater, ρ s that of saltwater, S is the freshwater source term, S s is the seawater source term and K is the hydraulic conductivity of porous media.
We assume a steady state due to long-term constant boundary conditions and no source terms in the saltwater. Then the Equation (2) can be written as follows:
S = div - ( h - g ) K h 0 = - div ( g - b ) K ( 1 - ϵ 0 ) h + ϵ 0 g
The model incorporates the pumping zones that are 500 m far from the coast. Since the saltwater is considered to be hydro-static, then the “Ghyben-Herzberg” relationship ([15,16]) can then be introduced:
( 1 - ϵ 0 ) h + ϵ 0 g = h 0
Therefore, the second equation of Equation (3) becomes trivial. The System (3) becomes:
S = div - ( h - g ) K h
Based on “Ghyben-Herzberg” relationship, g is given by
g = m a x b , h 0 - ( 1 - ϵ 0 ) h ϵ 0 .
Accordingly, the Equation (5) can be written as follows:
S = div - K m i n ( h - b ) , ( h - h 0 ϵ 0 ) h in { h < a }
Assuming that the substratum b is a horizontal layer, then the only variable in the Equation (7) is h. By changing the variable h to u, the Equation (7) can be written in the following form:
S = div - K u u in { h < a }
with
u = min ( h - b ) , ( h - h 0 ϵ 0 )
Equation (8) is completed by boundary conditions in order to have a unique solution. In order to solve numerically Equation (8), we linearize it by the forward schema as follows:
S = div - K u n u n + 1
where n is an iteration index.
S = S i , for each pumping zone, S i , we consider λ i , the extraction coefficient and A i its area. These two are related by the Equation (11)
S i = λ i × A i
Equation (10) is solved numerically using finite element method in “Freefem++” software [31]. “Freefem++” is a free software to solve 2D and 3D non linear equations based on finite element method using C++ as programming language [32]. Computing u numerically is straightforward, using the “Freefem++” software. Then, by using Equation (9) and Equation (4), we can detect the freshwater/saltwater interface g. We call this implementation in “Freefem++”: “FreeSWIM”.

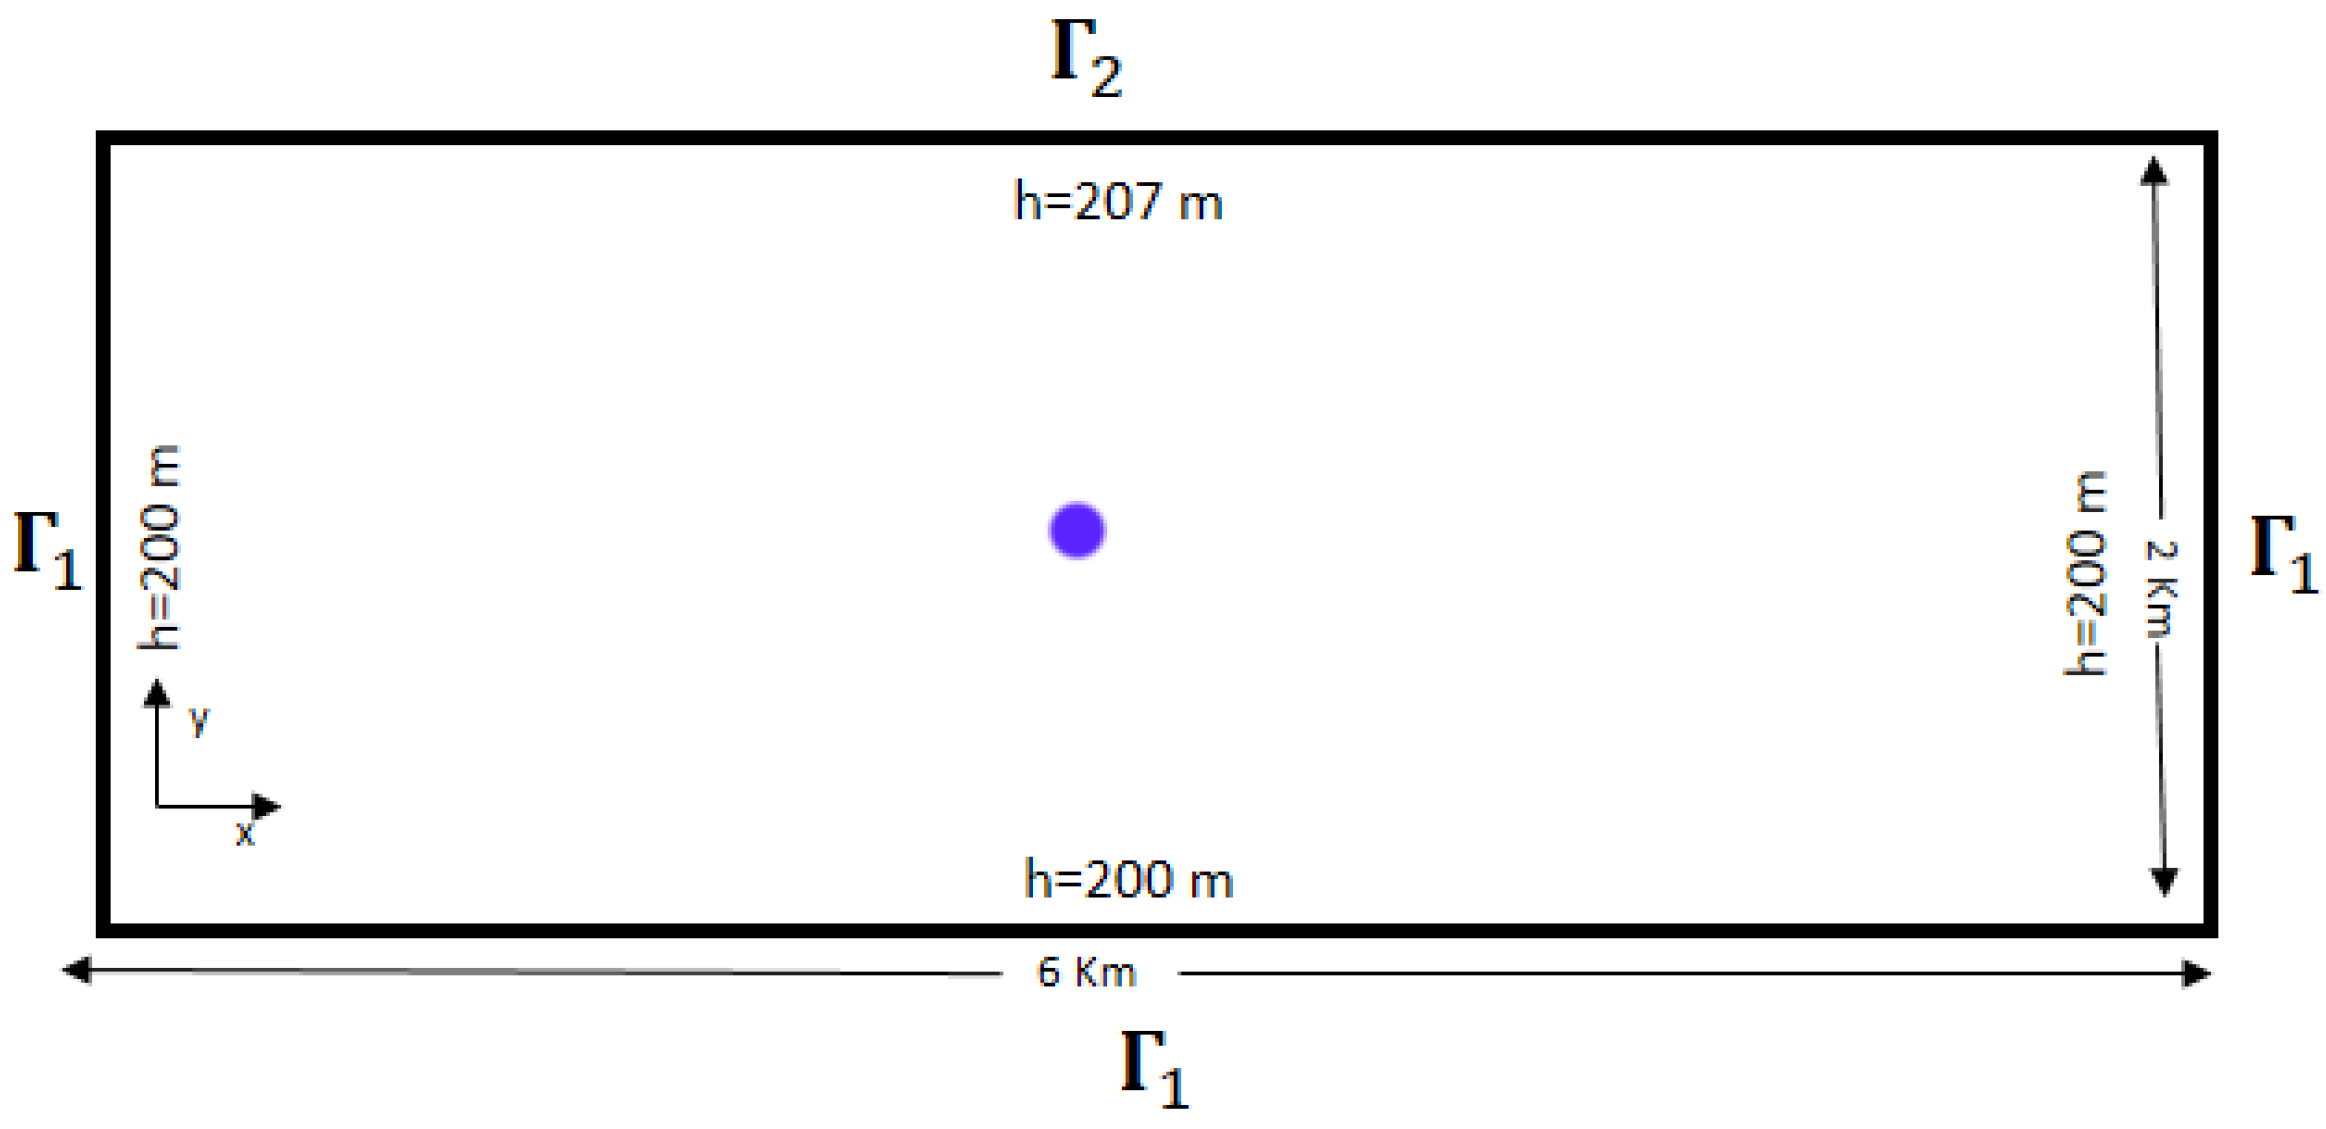
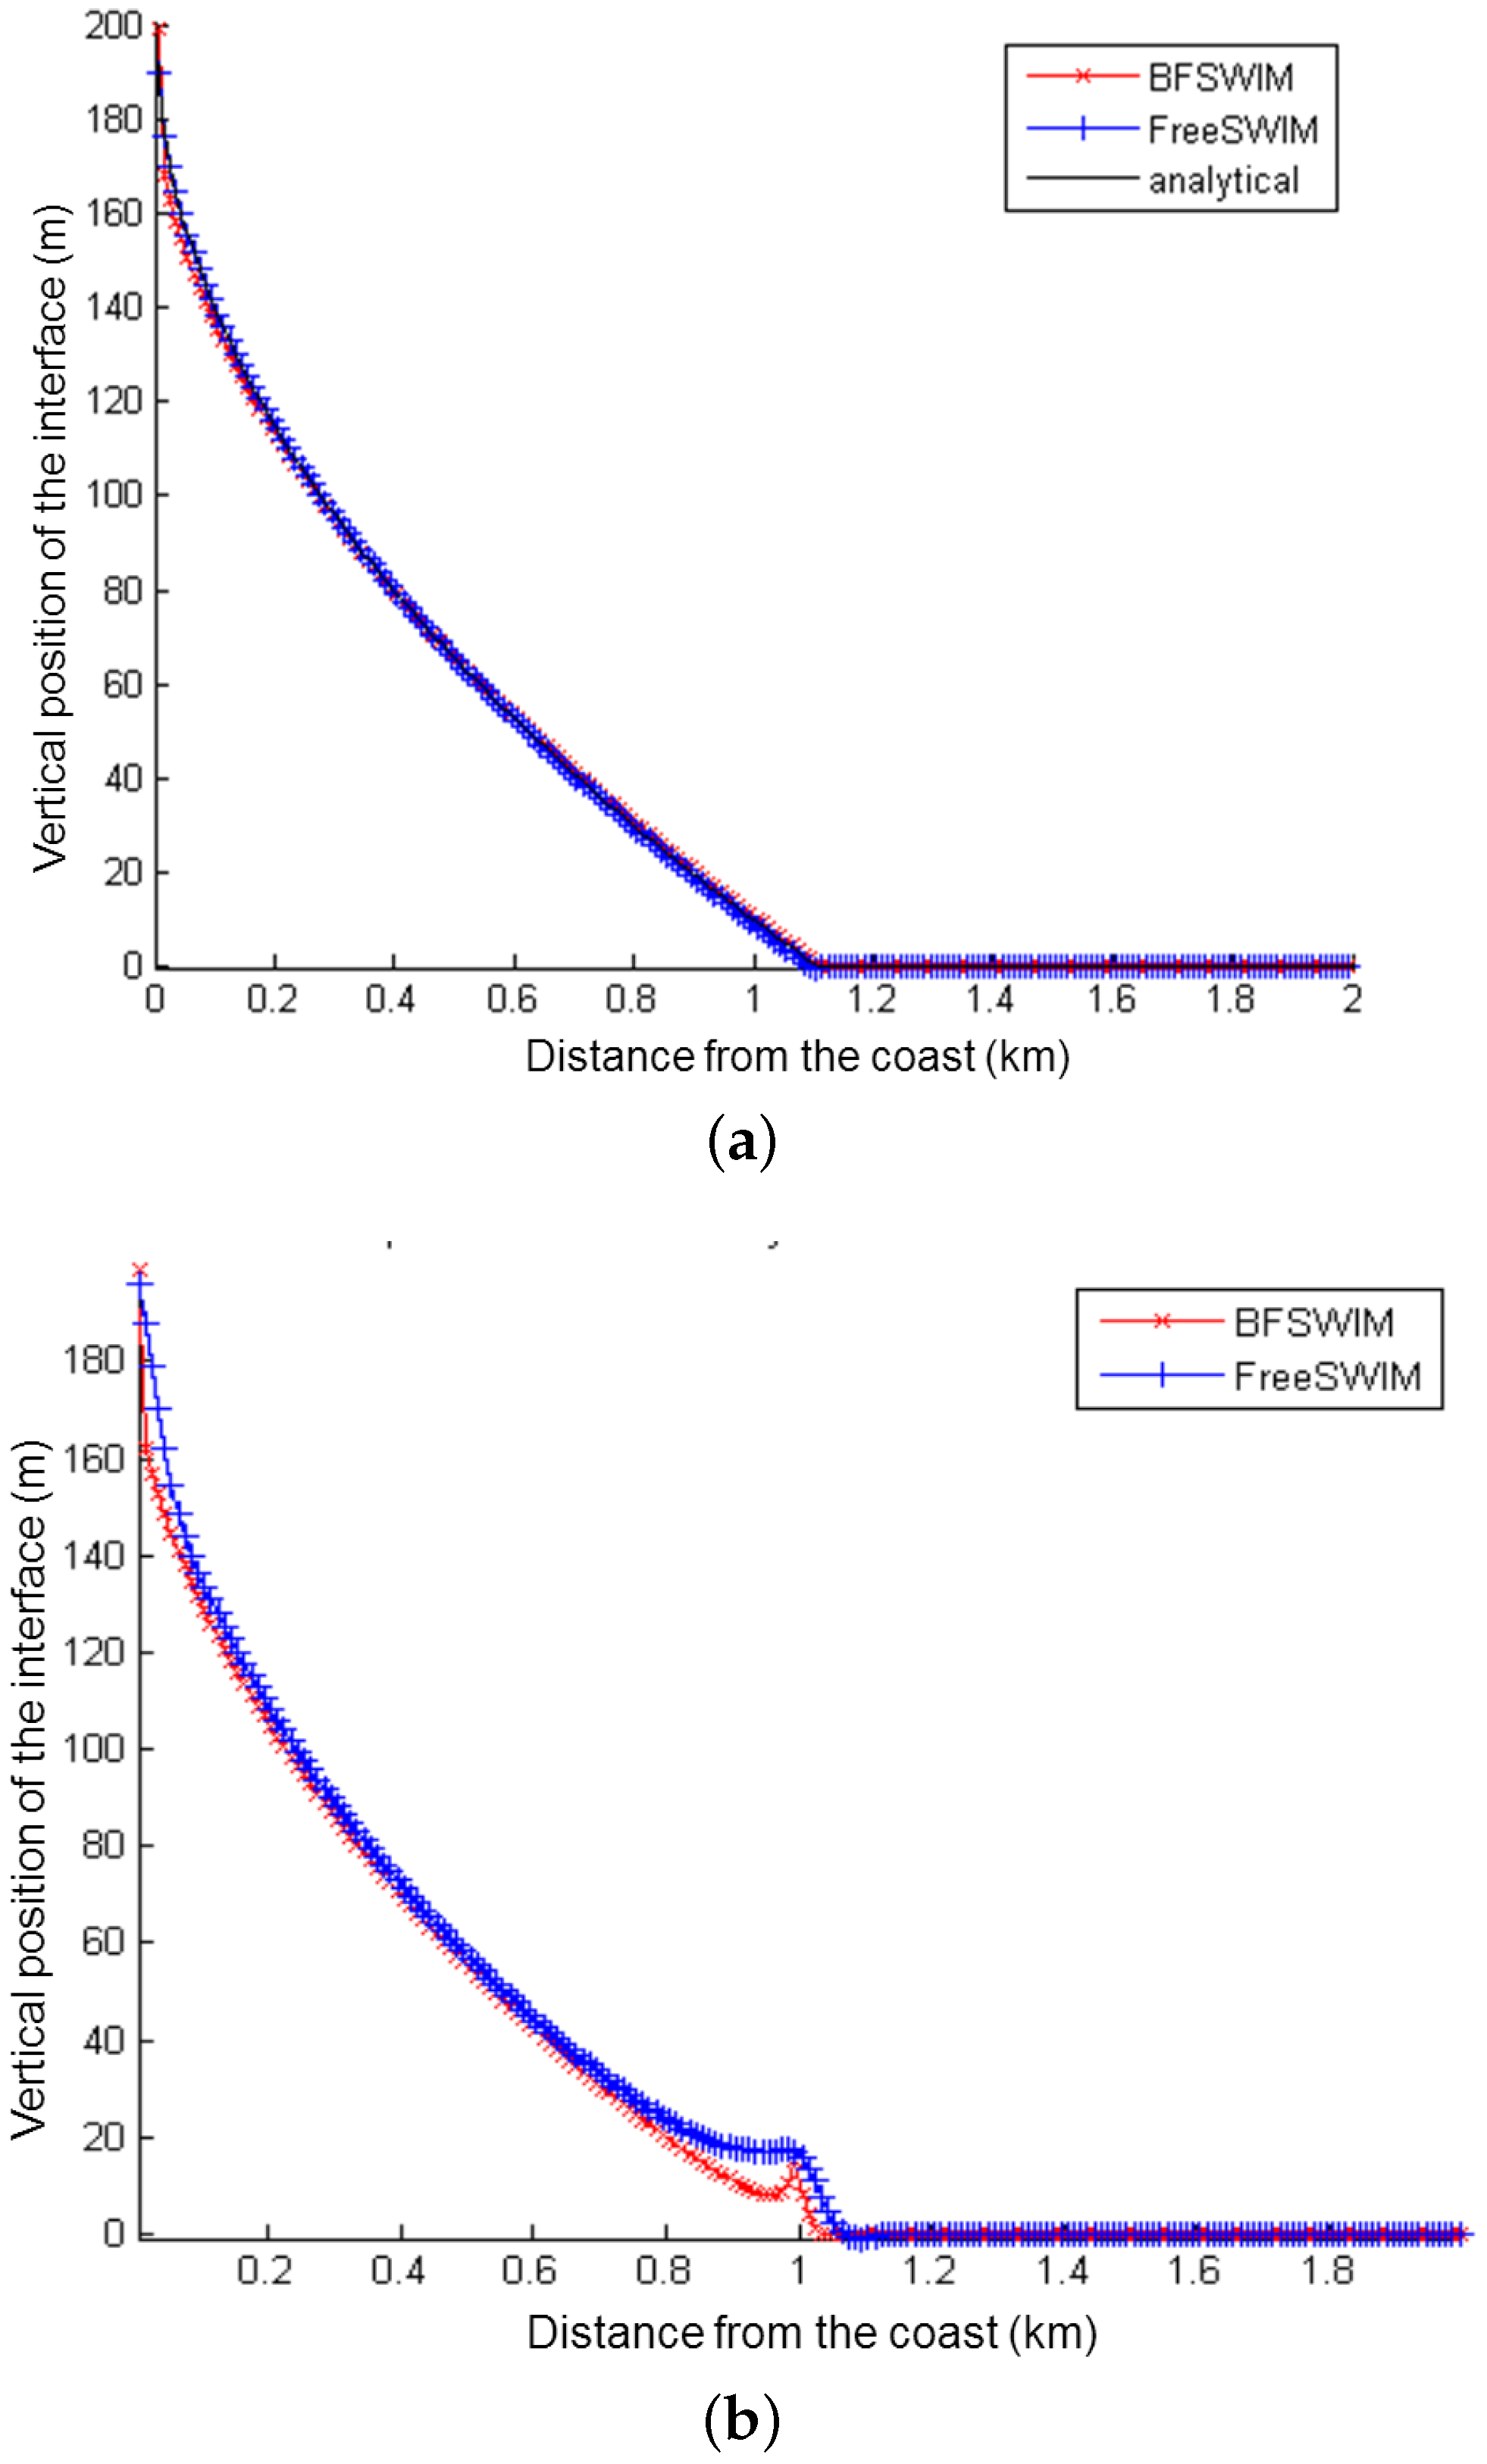
2.4. Model Verification in Schematic Domain

Prior to applying the model to the Tripoli aquifer, we conducted a validation exercise using a schematic rectangular domain. This exercise was performed for two configurations: with and without pumping wells. The model is verified against an analytical solution (only when no pumping is used) [17] and a numerical model : “BFSWIM” [33]. “BFSWIM” approach is a specific implementation of the “BIGFLOW” model [34] and was validated to the “Feflow” model using the Henry problem setup [35,36]. The domain geometry using “BFSWIM” is bound to be rectangular, so it is not adapted to model the lower Tripoli aquifer. Benchmarks experiment like the Elder problem [37] and the Goswami-Clement problem [38], were not used as their setup and configuration requires a variable density flow approach. The Elder problem may need a thermo-hydro variable density flow in porous media. The Goswami-Clement is a rectangular experimental setup of (53 cm × 26 cm × 27 cm) dimension thus the depth to thickness ratio is not commonly observed for coastal aquifers.
We launch the simulations in an homogeneous rectangle of 6 km × 2 km, and a pumping well in the middle of the domain (Figure 5). The substratum is considered as the reference level b = 0 m, h 0 = 200 m. The porous media has a hydraulic conductivity of K = 1.388 × 10 - 5 m·s - 1 . Concerning the boundary conditions, we consider Dirichlet condition, we have h = h 0 on Γ 1 (the shore), on Γ 2 we consider that the hydraulic head is 7 m above sea level.
Using Equation (9) and Equation (10) we have the following system:
div - K u n u n + 1 = λ 1 B ( S , r ) in Ω u = 0 on Γ 1 u = 207 on Γ 2 .
where λ represents the extraction coefficient of the well placed at the position S, and B ( S , r ) is a disk, used to model the pumping well, centered at S and of radius r. 1 B ( S , r ) is the characteristic function, the pumping rate is equal to the extraction coefficient multiplied by the disk area. The validation has been done for a pump rate S = 2.5 m 3 ·s - 1 , λ = 8 × 10 - 4 m·s - 1 and r = 10 m.
In case of no pumping, λ = 0 , the freshwater/saltwater interface is also calculated and we considered the analytic solution of the sharp interface freshwater saltwater, which in this case is given by [17].
g = h 0 - - 2 × Q × x / ϵ 0 / K / ( ϵ 0 + 1 ) if x L 0 b if x L 0 .
where Q = - 2 × K ( h 1 2 - ( ϵ 0 + 1 ) × h 0 2 ) / L x , L 0 = - 2 × K × Q × ϵ 0 × ( ϵ 0 + 1 ) × h 0 2 , L x is the aquifer width, and L 0 is the point where the interface g reaches the substratum b. We detect also the interface g.
The interface g, calculated by the three methods has been compared by using the cross section in the mid of the domain. The “FreeSWIM” interface g, is very close to the analytic and “BFSWIM” interface as shown in Figure 6 which represents the freshwater/saltwater depth to the width of the schematic domain. The root mean square error for the exact analytic solution and for the numerical solution using “BFSWIM” code was calculated and shown in Table 3).
The difference between errors in pumping case is higher than the case of no pumping case, this is because of the assumptions inherent to the model. Indeed, in the model we assume that the flow is quasi-horizontal, but near the active wells, there is an impact of up-coning, then the flow is not horizontal.

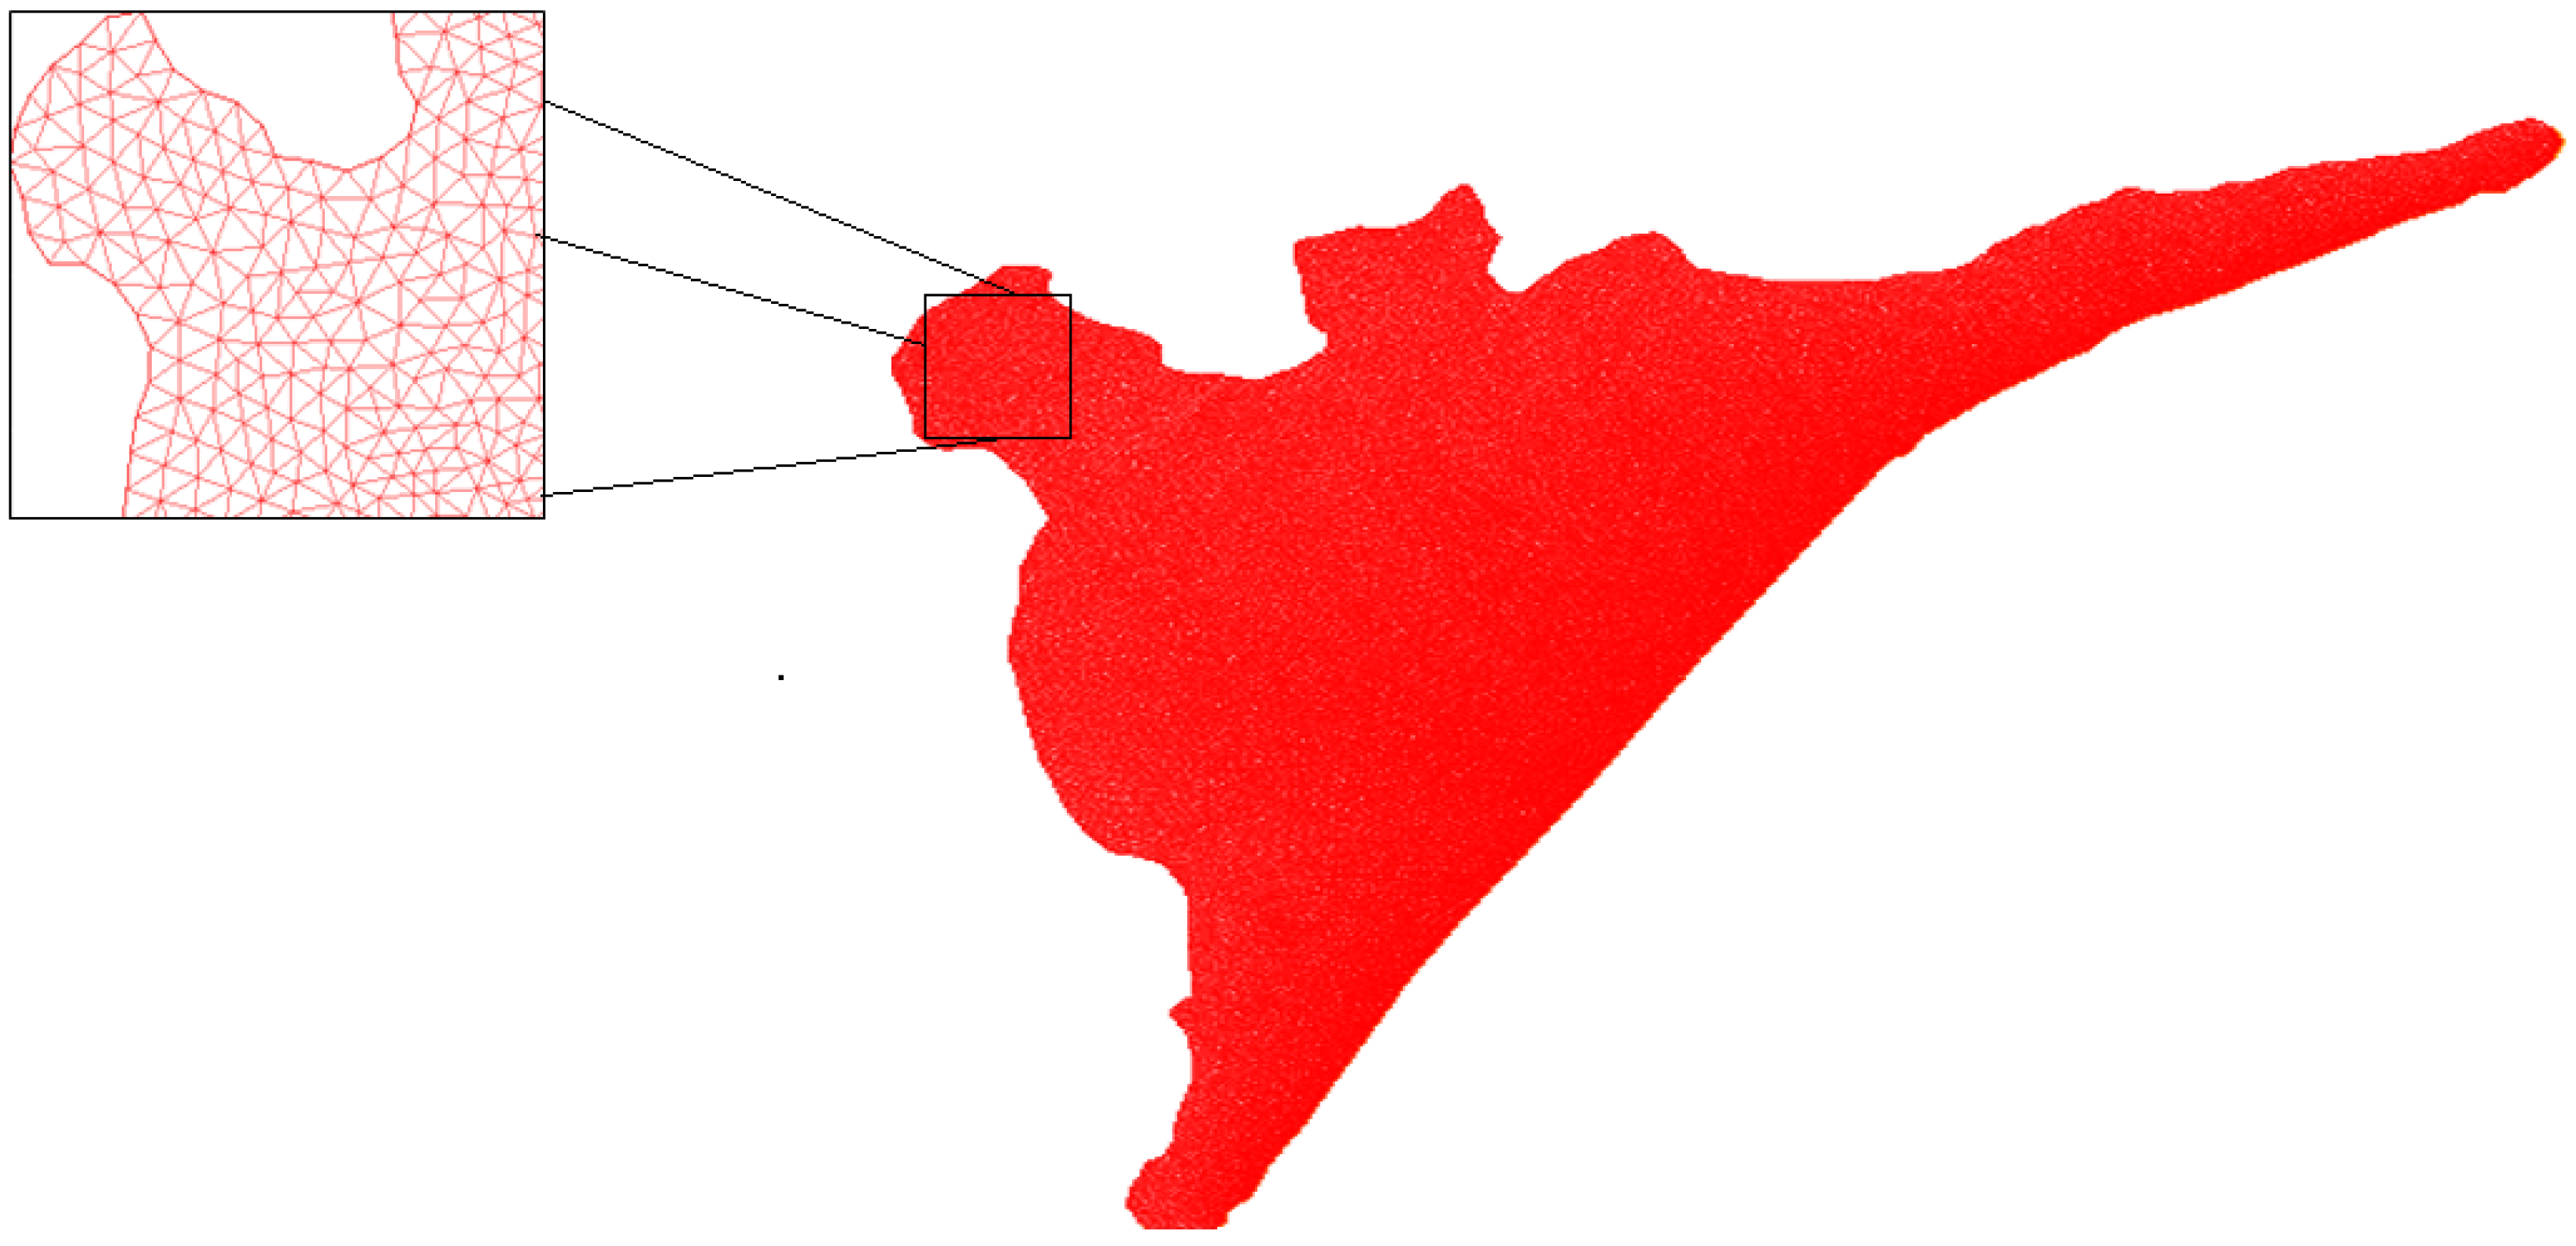
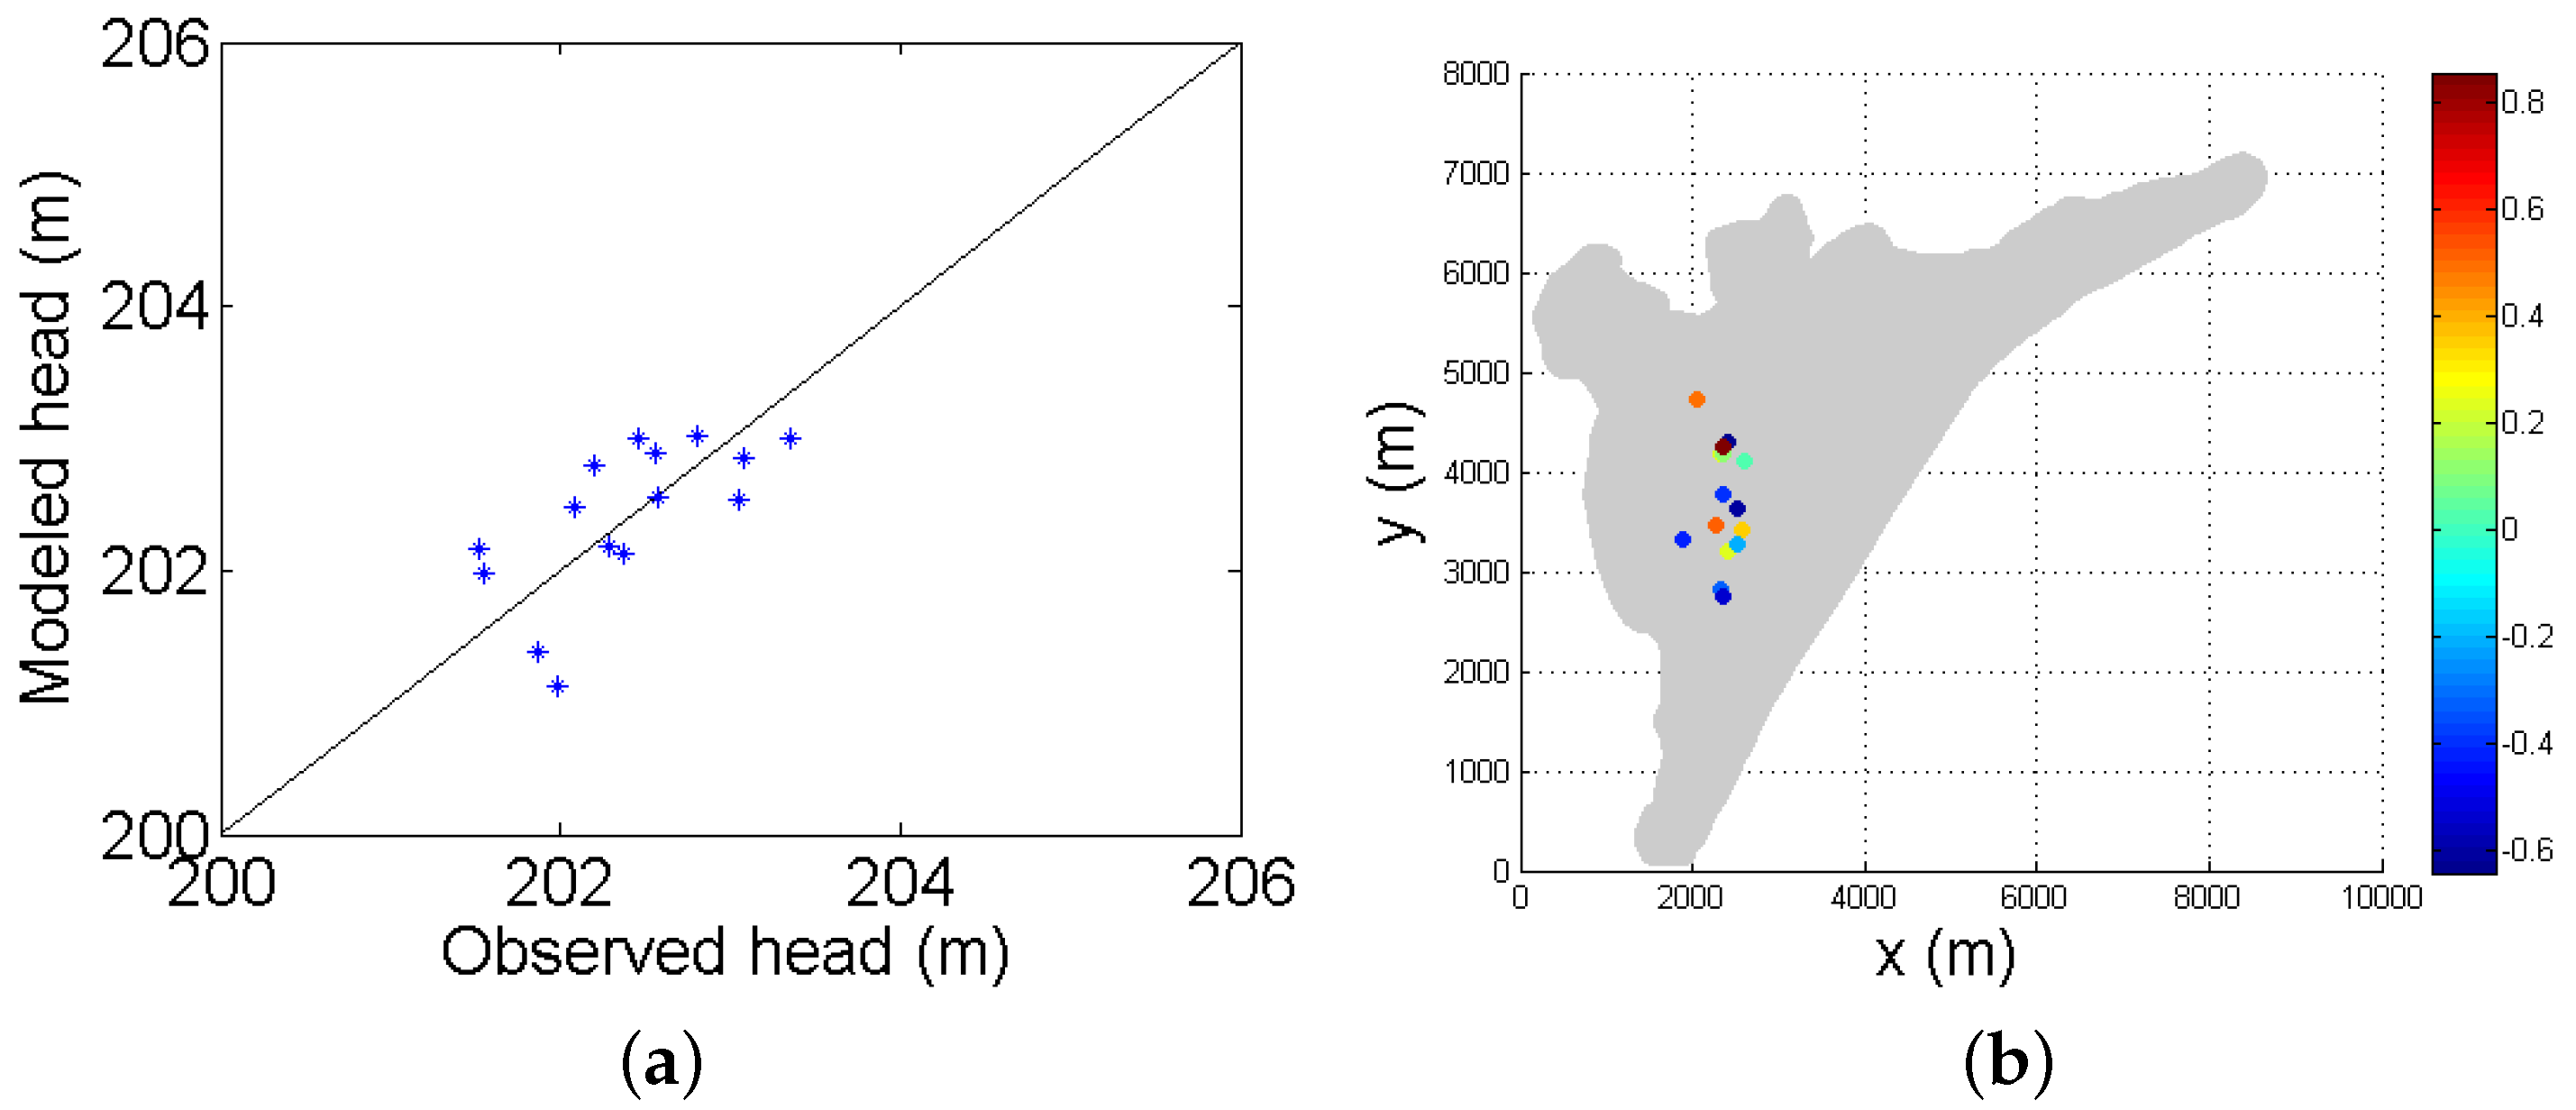
2.5. Model Setup and Calibration

In order to build a model describing the current situation of seawater intrusion in Tripoli aquifer we should solve Equation (8) over a fixed finite element mesh with the suitable boundary conditions and with the actual pumping rate.
By crossing geological information indicated in Section 2.1 and Section 2.2, the numerical terrain model, and the remote sensing optical image of the Tripoli city (See Figure 3a), the boundary of the aquifer has been identified and digitized. The domain starts from the sea side on the shore and includes newly gained surfaces from the sea. The observed outcrops in the optical image and during field visits indicate the fracture between the lower and the upper zone of Tripoli city, see Figure 2. This fracture defines the hydro-geological limits. The border is digitized using Geographic Information Systems tools that combines all the available sources (topography, geology, remote sensing images). From the existing boundary, a triangular finite element mesh is generated. The mesh grid density is increased at the location of pumping wells and at the borders of the domain. This results in a well-defined mesh of 99,412 nodes and 196,822 elements, see Figure 7.
Recharge over the urban area is considered as negligible in the majority of the aquifer as a sewage network exists and the bare soil and vegetated areas are minimal. Also the rainfall during the dry season is very low. Boundary conditions in the study zone are divided into two parts: Γ 1 which represents the shore, and Γ 2 , which represents the eastern inflow/recharge condition. On Γ 1 , we have a Dirichlet boundary condition, h = h 0 representing the height of the sea. By using Equation (9) we get u = 0 . Γ 2 is the flux of freshwater entering the domain from the eastern border. It is a Neumann boundary condition. We have then K u n = ψ on Γ 2 , where ψ is the specific freshwater entering into domain from Γ 2 side and n is normal vector on Γ 2 border.
Consequently, Equation (8) can be written as follows:
div - K u n u n + 1 = i = 1 n λ i 1 A i in Ω u = 0 on Γ 1 K u n = ψ on Γ 2 .
Table 4 gives the λ i , A i and S i values for the private wells, Bhsas, Malouleh and El-Jisr.
Each public well was modeled as a disk with a radius of r = 40 m for Bhsas wells and r = 10 m for the two other wells. For the region where private wells are densely distributed, we consider a mean pumping rate in the whole region for several reasons. First, the well positions and rates are not well identified, as they are not official. Second, the population and the density is well known from official sources. Thus, it is easier to infer the pumping rate for the whole area.
Based on [22,23], the hydraulic conductivity K has been estimated by a constant value of 1.388 × 10 - 5 m·s - 1 . The impermeable layer is at b = 0 m and the sea level is at h 0 = 200 m.
At the border Γ 2 , there is a flux of freshwater entering into the aquifer. The calibration of this flux, ψ, is based on a subset of hydraulic head measurements in several wells performed in 2008. At first, we used the measured hydraulic head in the wells near the Γ 2 boundary [39] to launch the model with conditions of Dirichlet on Γ 2 , then the associated flux, ψ, is computed and forced into the model. The flux ψ is then optimized based on the minimization of the quadratic difference between the measured and modeled hydraulic head inside the domain using the “SIMPLEX” algorithm. K is not modified in the calibration. After calibration we obtain an RMSD of 0.891 m.

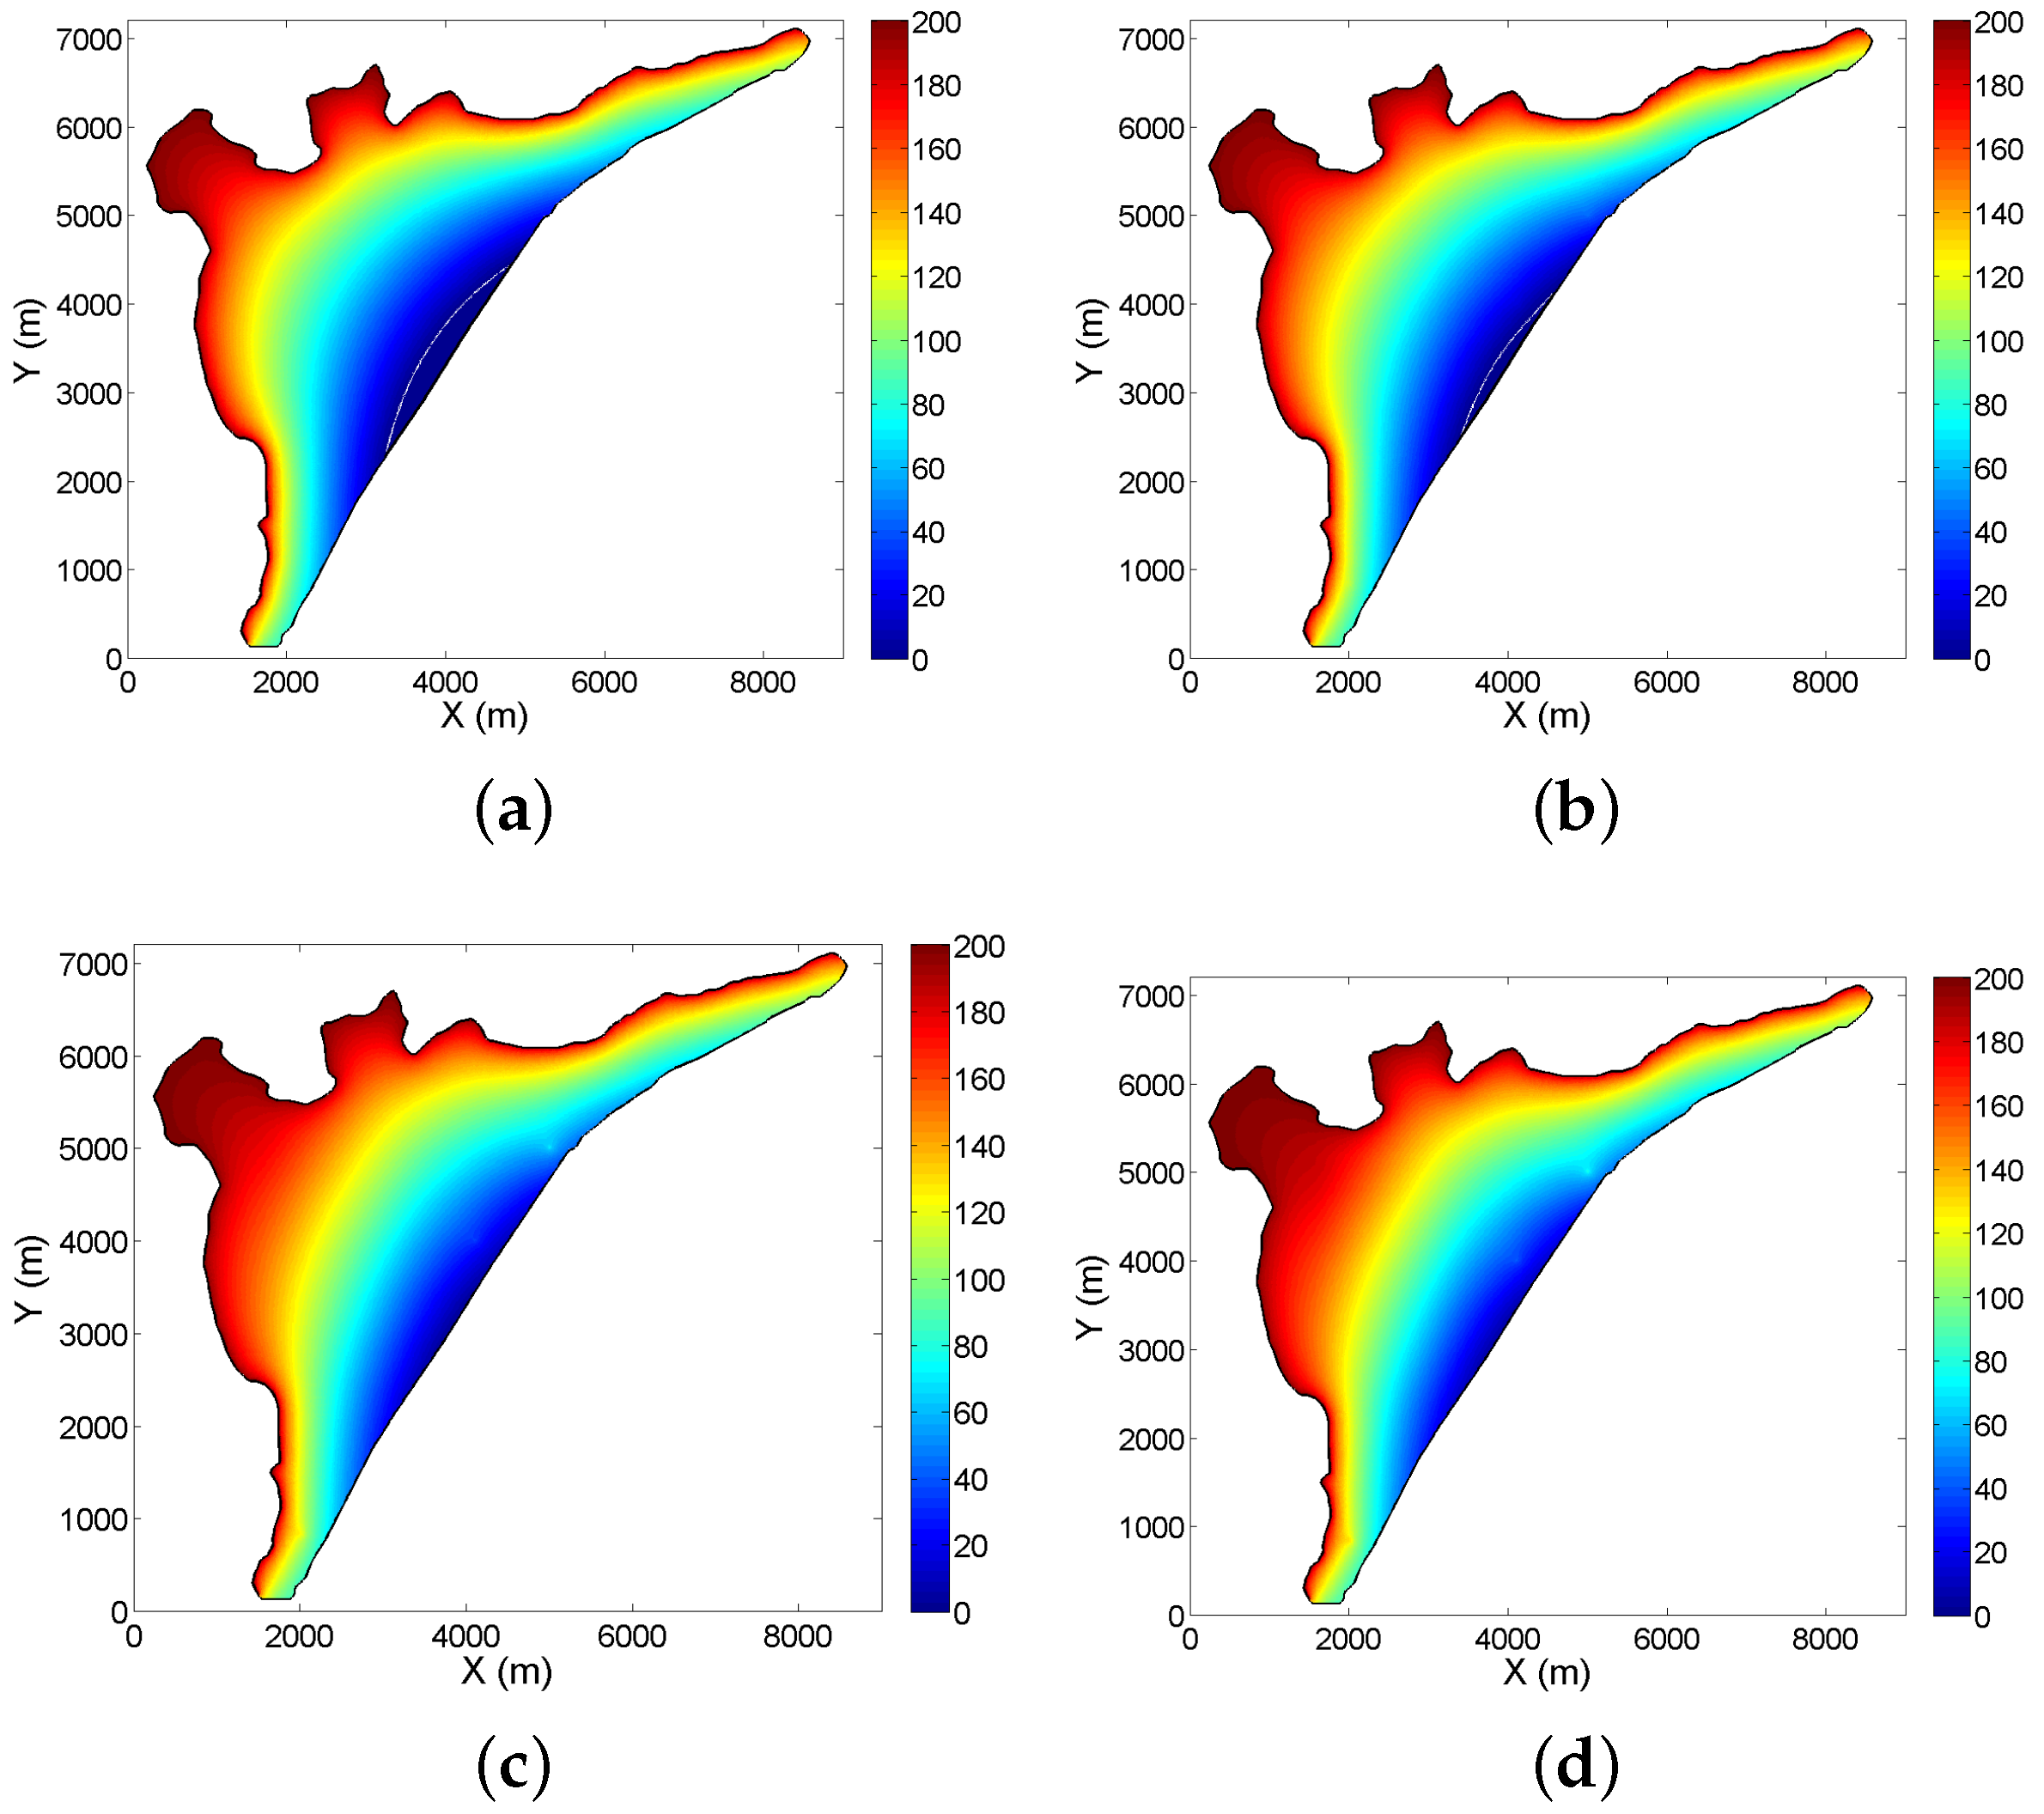
2.6. Scenario Build-up

The demographic evolution is projected up to 2028 based on a 1.6% per year increment rate as shown in Table 5. This evolution does not take into consideration the extreme events like conflicts in neighboring countries which increased the number of inhabitants in recent years. We have used the projections in Table 5 and modified the pumping rate in the unauthorized and official wells. The nominal rate of 250 L and the recommended rate of 120 L per capita were considered.
Four scenarios are considered :
  • ”NOP”: refers to the no-pumping scenario.
  • ”REC”: refers to scenario with a 120 L per capita as recommended by the water authorities.
  • ”10 Y”: refers to a 10 years projection with the current pumping rate of 250 L per capita.
  • ”20 Y”: refers to a 20 years projection with the current pumping rate of 250 L per capita.
The ”NOP” no-pumping simulation is the natural equilibrium conditions for seawater intrusion in the aquifer. None of the scenarios include special mitigation strategies like extraction of water further into the aquifer, injection of treated water into the aquifer, crystallization of the soil, or expansion of the land to the sea. The yearly projection is based on the number of inhabitants and doesn’t take into consideration the change in climate conditions and the change in strategies in water supply. The scenario results are compared to the results of the conditions for year 2008, for which the model was calibrated based on observations. This condition is labeled “CUR” meaning current condition.

3. Results and Discussion

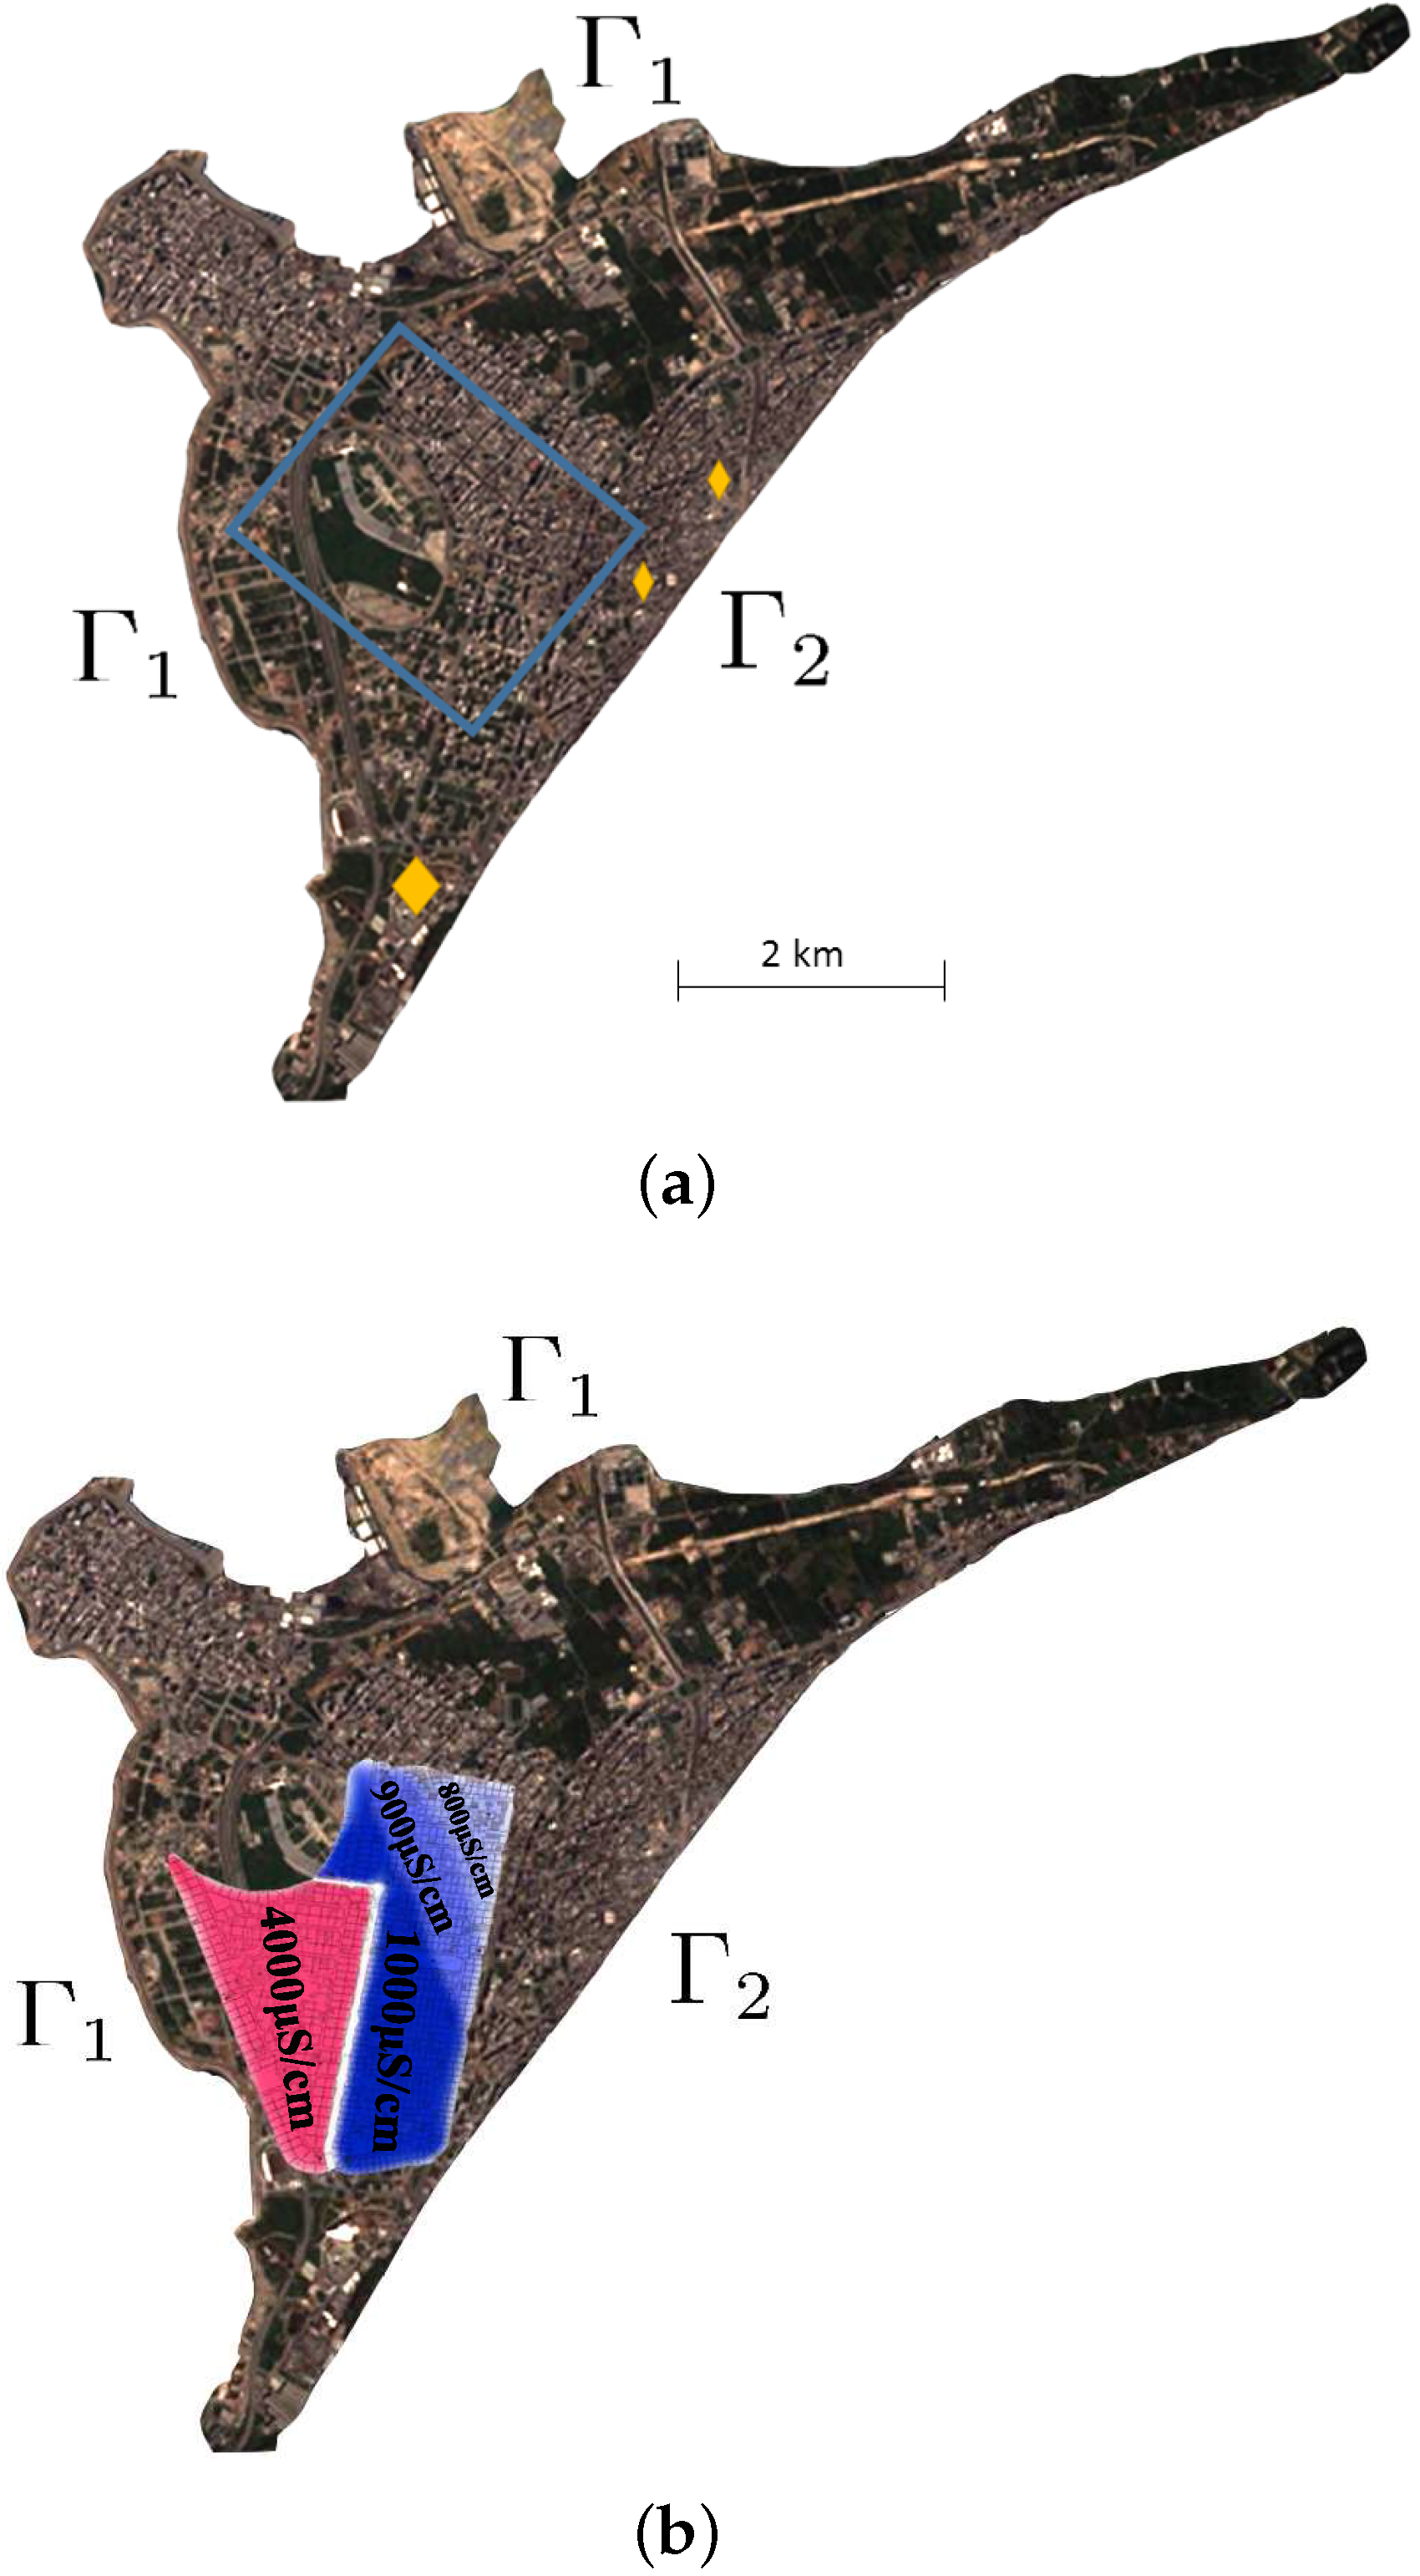
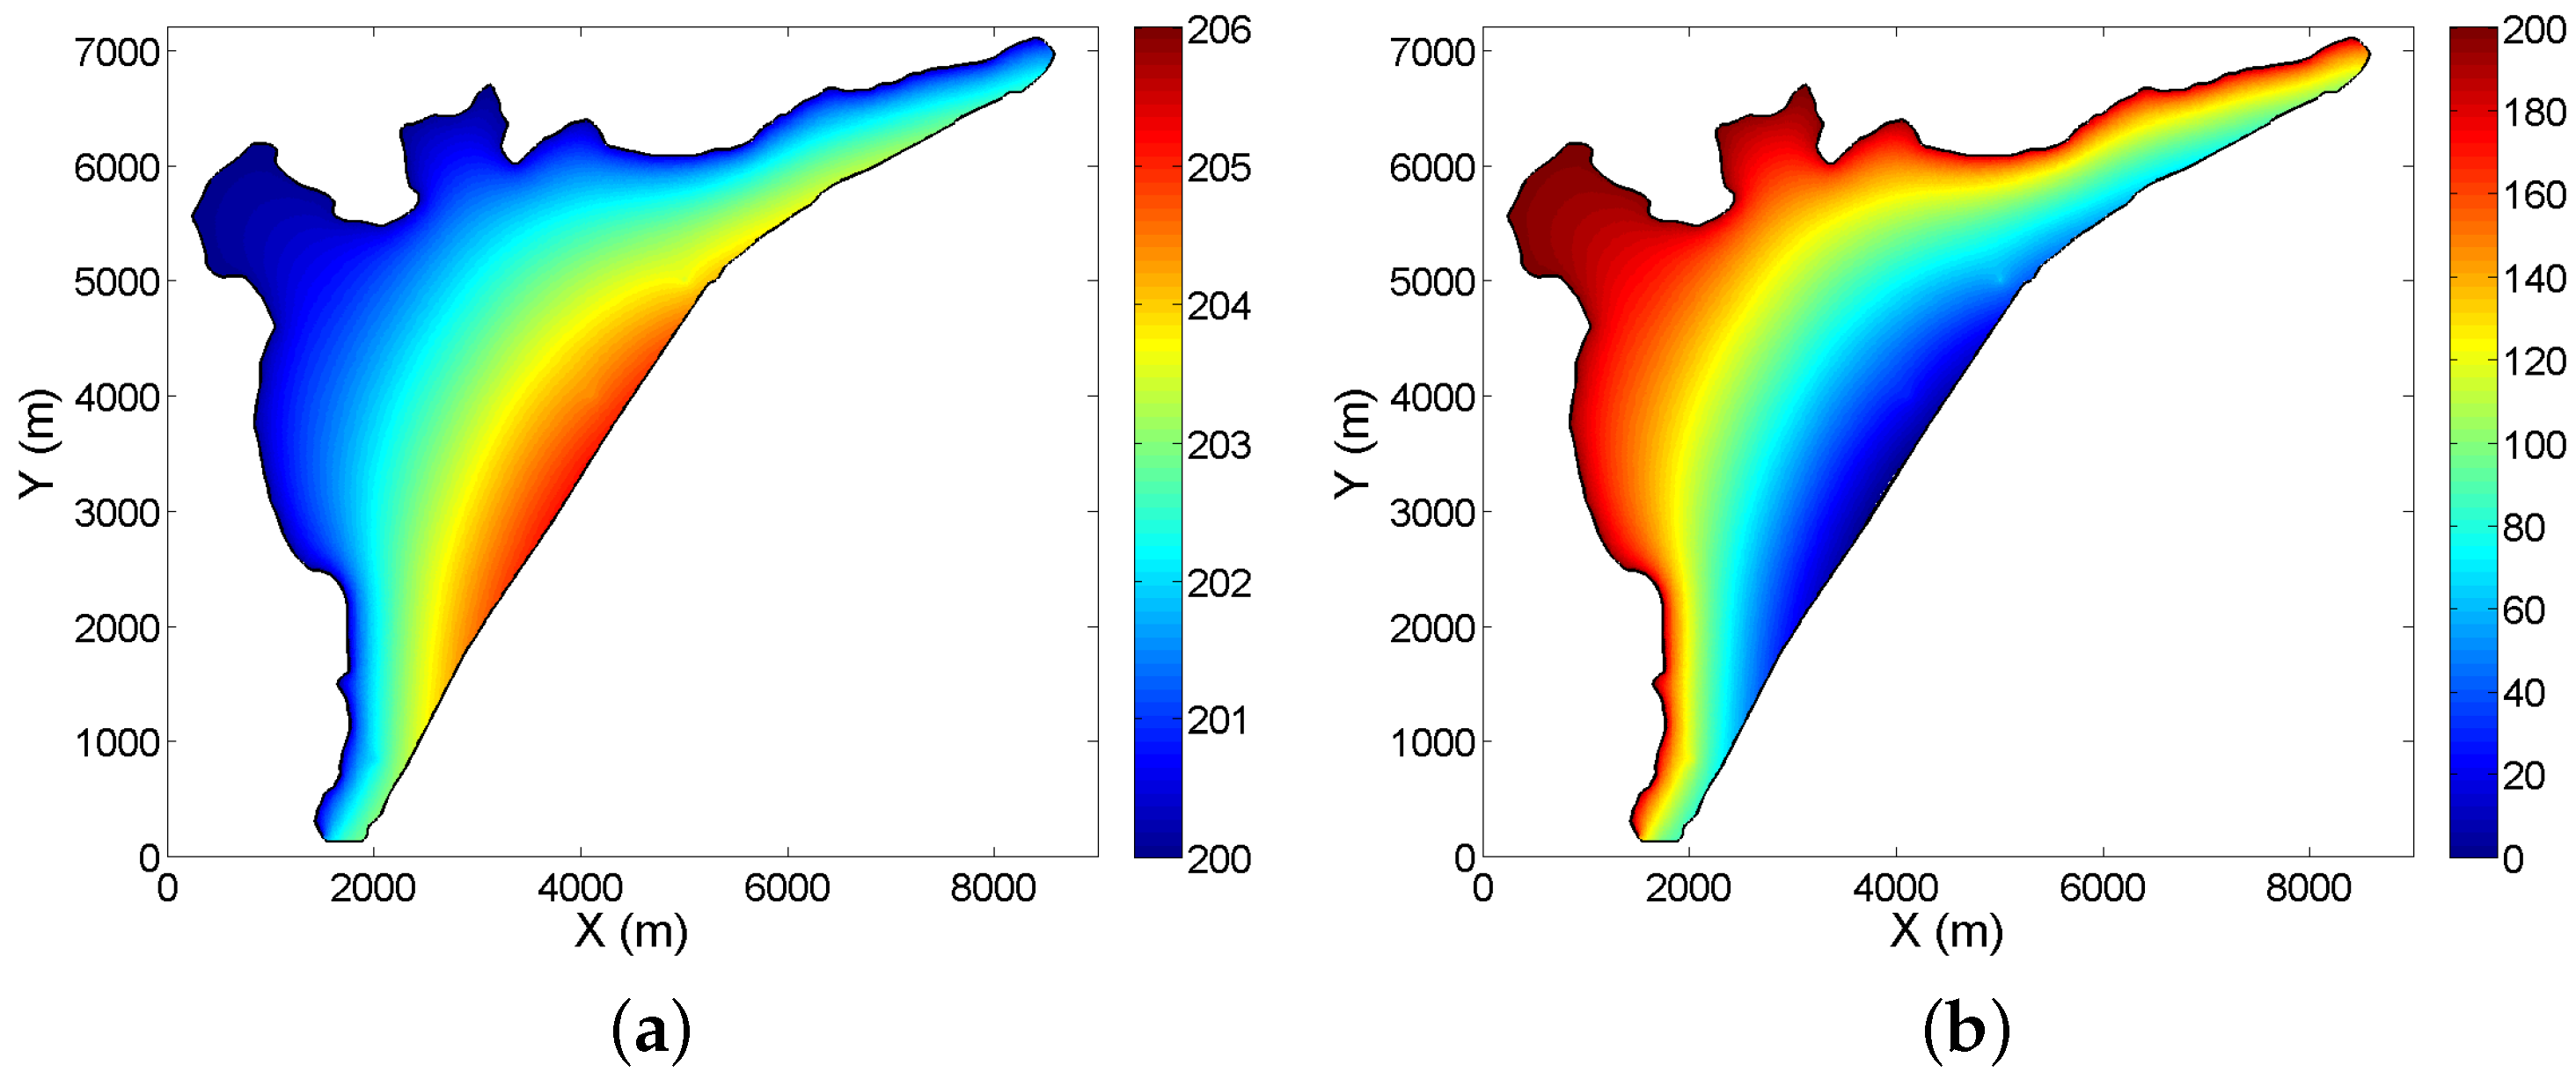
3.1. Status of Saltwater Intrusion in Tripoli

The “FreeSWIM” model is run based on the calibration of the boundary conditions, hydraulic conductivity and wells position for year 2008. The flux on the land boundary conditions is calibrated using the hydraulic head at border Γ 2 of the domain measured in year 2008. The mean hydraulic head is about 5.77 m meters above the sea level. After calibration, using a root mean square minimization in combination to a simplex algorithm the obtained flux ψ is estimated at 26.0235 m 3 ·m - 2 ·s - 1 . “FreeSWIM” model computes u numerically. Then, by using Equation (9) and Equation (4), we calculate the hydraulic head h and the interface g in Tripoli aquifer, as shown in Figure 8. These results are labeled as current saltwater intrusion conditions “CUR”.
The “CUR” simulation results are compared to the measured hydraulic head in observation wells in the aquifer. The comparison is done using the wells inside the domain and don’t include the wells used for calibration that are at the outskirts of the domain. The validation data set is constituted of 15 wells localized in the main area of interest of “Dam and Farz”. Figure 9a shows the scatter plot of the observed head vs. the modeled head. We notice that there is little variability in the head values. This can be explained by the high depth of the aquifer. The hydraulic head gradient is consistent with the expected value for a coastal aquifer with sandy marl soil [8]. The figures also show that the modeled head fits well with the measured one with a root mean square deviation of R M S D = 0.819 m. Figure 9b shows the localization of the observation wells. The color represents the difference between mean observed head and modeled head. The position of the observation wells in the area of interest are well shown. Figure 9 shows that the model gives satisfactory results in terms of hydraulic head and that little place for improvement can be achieved through a calibration using existing hydraulic heads. The difference map does not show a high spatial correlation between bias values. No specific pattern can be depicted.

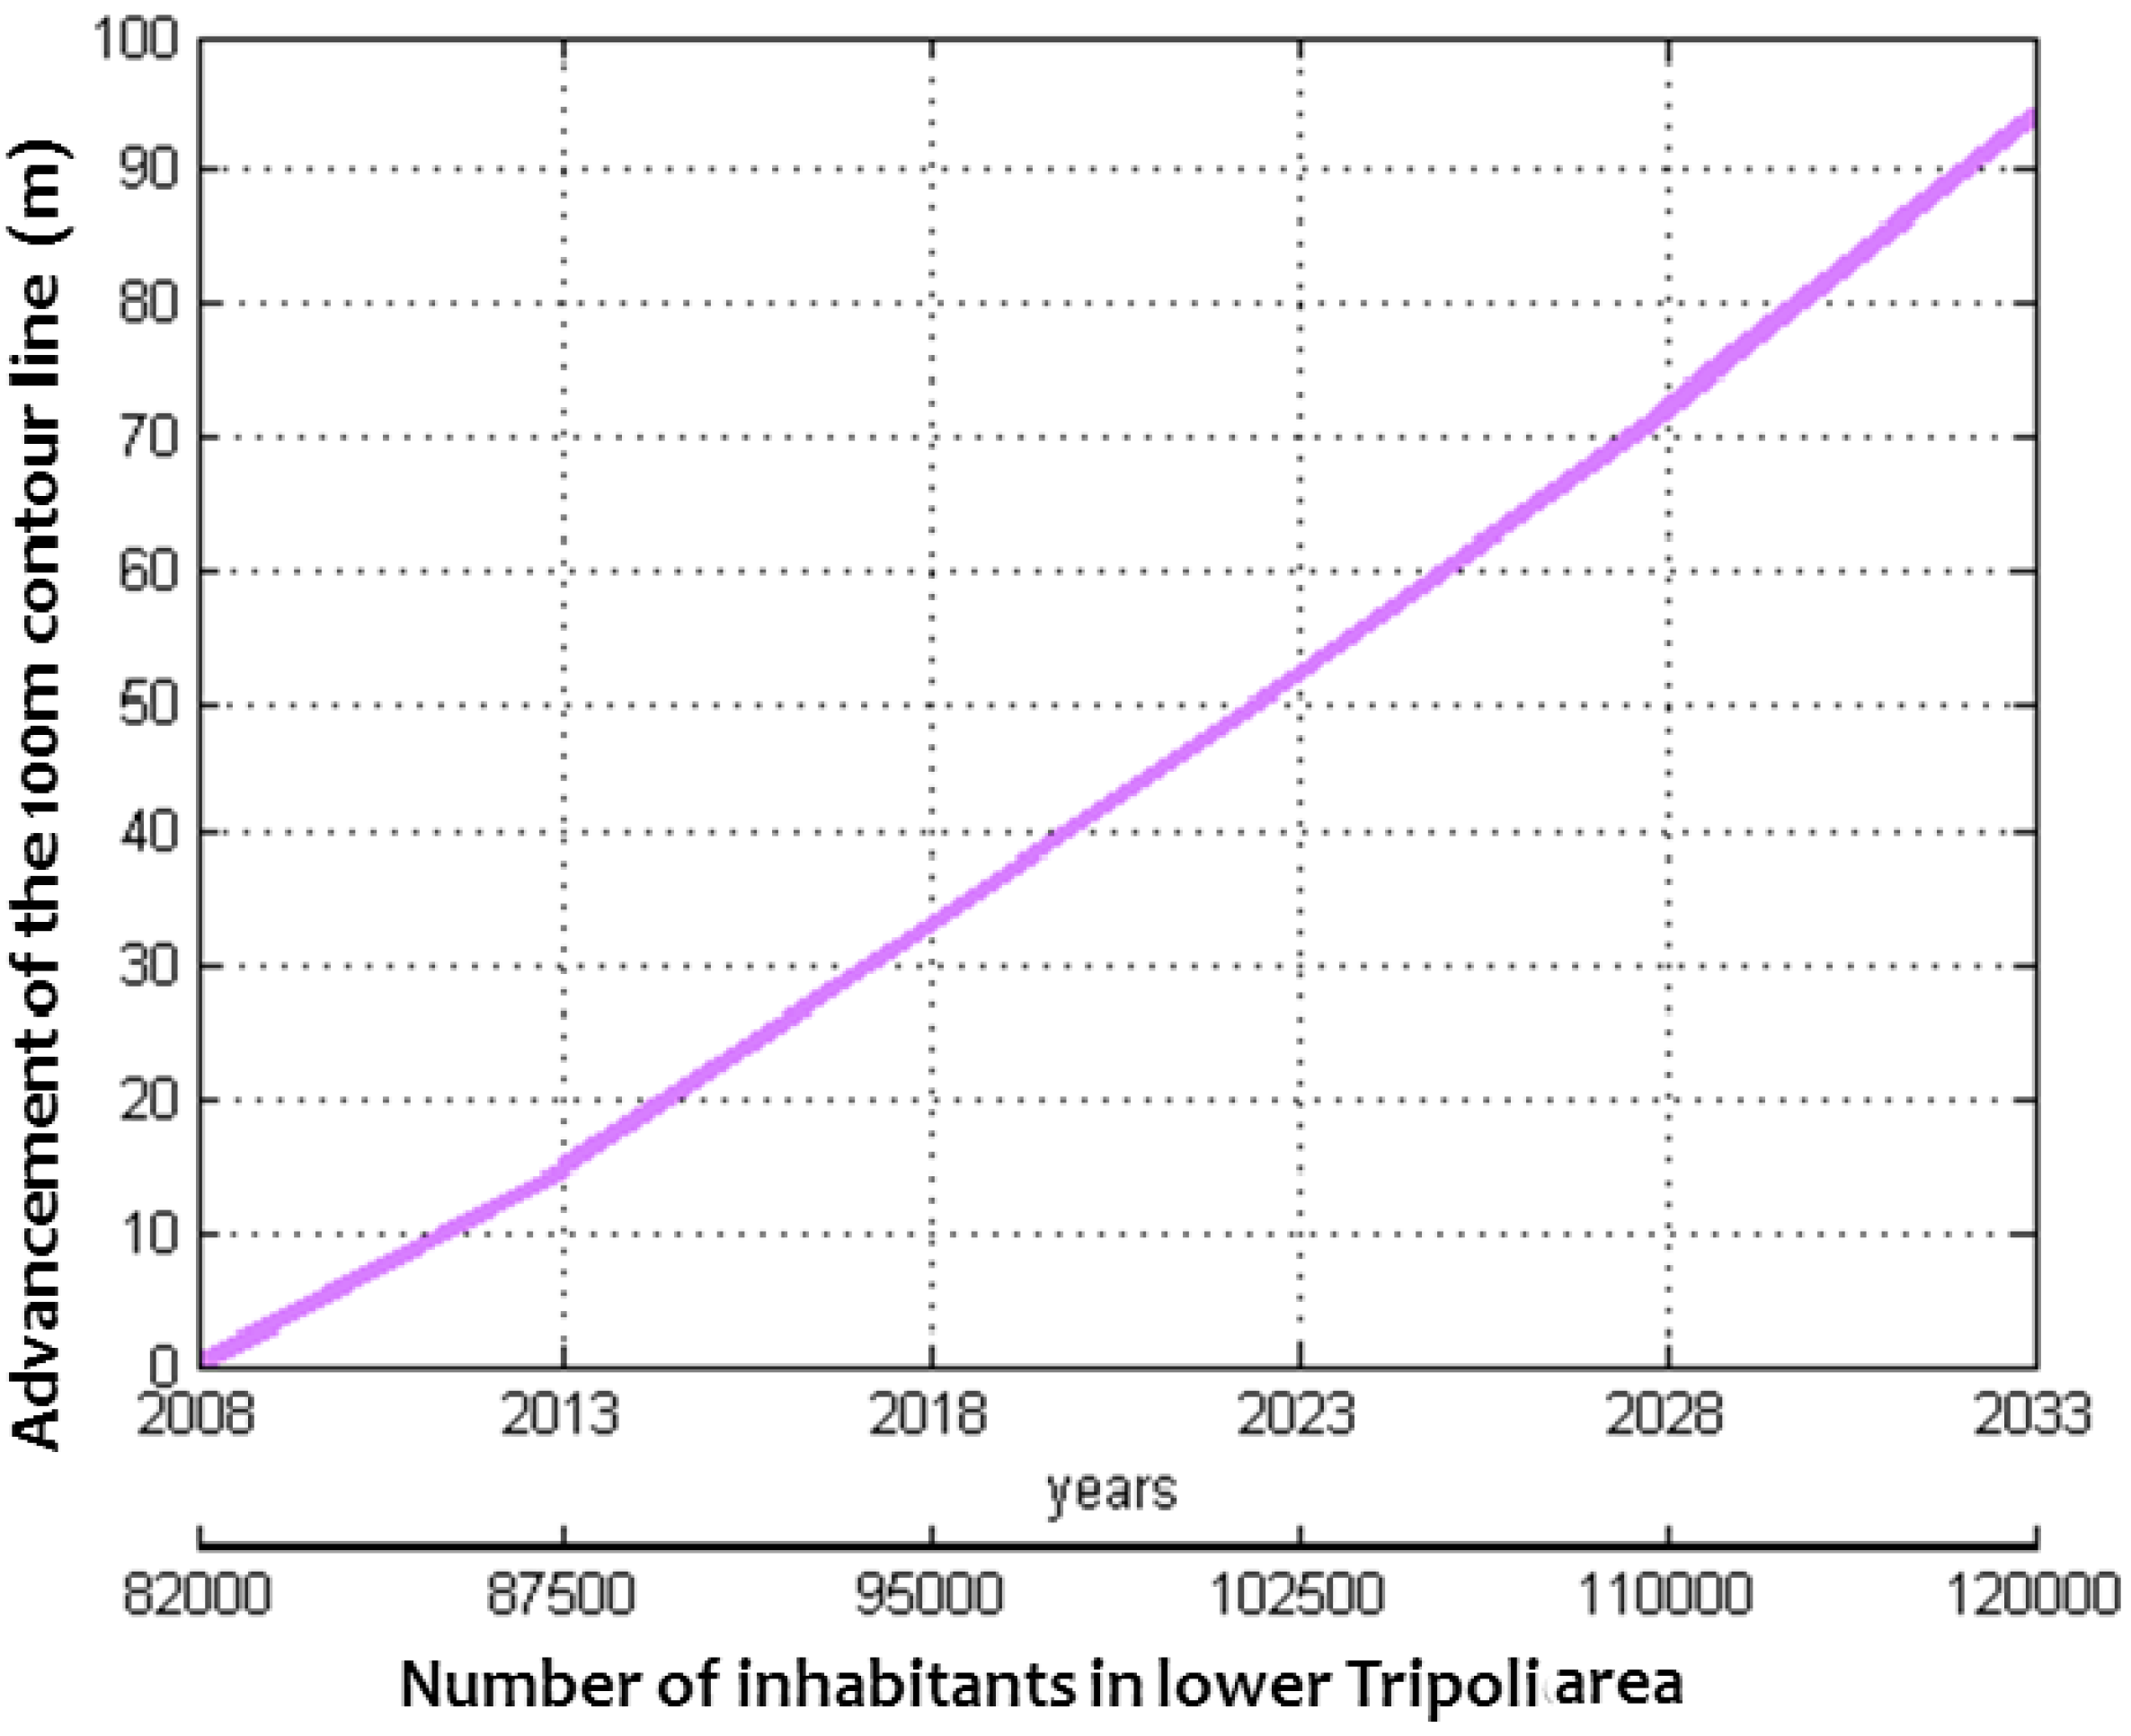
3.2. Impact of Demographic Growth on Saltwater Intrusion

The suggested scenarios in Section 2.6 are run using the same boundary conditions of “CUR” simulation. Figure 10 shows the position of the saltwater/freshwater interface for the different scenarios. The difference in terms of interface position between the current condition “CUR” and the other scenarios is shown in Figure 11.
The “NOP” scenario Figure 11a which considers no-pumping shows a significant reduction of the saltwater advancement into the interior of the aquifer. As expected the enhancement concerns primary the pumping zones. A reduction of 30 m of the position of the interface can be expected. We notice that the recommendation of 120 L per capita if respected gives half the improvement than the natural state “NOP”. On the other hand, the projections for 10 years and 20 years show that the level of the interface will raise to 14 m in the areas of the pumping. Figure 12 shows the inland advancement of the 100 m contour level of the interface g based on the “10 Y” and “20 Y” pumping rates (250 L/capita/day) with respect to the number of inhabitants and the years. The 100 m contour was selected here because the majority of the private wells are installed at this depth. It shows an advancement of 100 m within the next 2 decades.
The modeling results show if the current pumping rates are maintained that the saltwater intrusion in Tripoli aquifer will be aggravated, extending from the coast to the entire basin in 2 decades. Given that the level of freshwater will decrease by 14 m a large part of the private pumping wells will become unusable. One mitigation to this would be to enhance the water distribution system and to pump in the upper part of the aquifer or the “Naher Abou Ali” watershed sources. Part of the supply pumping wells are close to the upper zone of Tripoli, so increasing their pumping rate is recommended as they are far from the sea. Note that other elements need to be investigated before applying this recommendation like pumping yield, impact of karstic system and local pollution in the upper zone. Also it seems to be a reasonable solution to reduce the impact of saltwater intrusion in short term as the 120 L per capita per day seems to be an achievable objective using public awareness programs, educational programs and restriction policies accompanied by monitoring. This result is consistent with previous studies that showed the impact of pumping rates on saltwater intrusion in Tunisia [40]. The results of the scenarios need to be considered with care for several reasons. The local impact of pumping is not well modeled here and may be important. Also, a major contributor to the scenarios is the climate variability which is expected to play an increasing role in future decades [7]. The climate change has a well known impact on seawater levels confirmed since several decades at a mean rate of 4 to 6 mm/year [7]. Precipitation rates (rainfall and snow) are also expected to decrease . This should be the subject for future studies where the impact of each effect is modeled separately or jointly to determine the most probable scenarios. In this study we focused on demographic evolution as it is the most noticeable and directly implementable impact.

4. Summary and Conclusions

In this paper we present a study on the impact of demographic evolution on saltwater intrusion in the lower Tripoli aquifer in Lebanon. We present results based on numerical modeling using the sharp interface approach. We create a numerical implementation called “FreeSWIM” using the “Freefem++” tool to compute the interface position in steady state. “FreeSWIM” is verified against analytic solution and the “BFSWIM” software. We apply the model to the Tripoli aquifer. The model is calibrated and validated using piezometric measurements in the aquifer. Different pumping scenarios were presented in order to make projections of the seawater intrusion. The results show that the excessive pumping will cause the salinization of the aquifer’s freshwater in the region of private pumping. The results show clearly the expected aggravation of seawater intrusion in the next two decades if pumping rates are maintained. The Freshwater/Saltwater interface will raise to about 14 m in the region of pumping. The current paper thus provides a methodology for the assessment of saltwater intrusion evolution in the context of demographic change in weakly instrumented sites. The current study examines only the impact of demographic change on saltwater intrusion in the lower zone of Tripoli aquifer. Future works should simulate the impact of pump in the upper zone of the aquifer and the different hydroclimatic parameters (snow, rainfall, seawater level) and their variability in combination with demographic evolution. The salinization is expected to increase even more considering the fact that this area is considered as a hot-spot of climate change.

Acknowledgments

The authors gratefully acknowledge the Lebanese Association for Scientific Research (LASeR) for financing this research project. The authors acknowledge the contribution of IRD (Institut de Recherche pour le Développement) for providing support for the project. The authors would like to acknowledge the Earth Link & Advanced Resources Development (ELARD) for providing piezometric levels data for Tripoli. We thank Ali Mahmoodi for his corrections to improve the paper. The authors also thank the reviewers for their valuable comments and suggestions.

Author Contributions

Omar Kalaoun and Ahmad Al Bitar wrote the first draft of the paper. Omar Kalaoun and Ahmad Al Bitar elaborated the methodology for model calibration and scenarios runs. Omar Kalaoun, Ahmad Al Bitar and Mustapha Jazar made data analysis. Jean-Philippe Gastellu-Etchegorry provided feedback on the written manuscript.

Conflicts of Interest

The authors declare no conflict of interest.

References

  1. Ergil, M.E. The salination problem of the Guzelyurt aquifer, Cyprus. Water Res. 2000, 34, 1201–1214. [Google Scholar] [CrossRef]
  2. Barlow, P.M.; Reichard, E.G. Saltwater intrusion in coastal regions of North America. Hydrogeol. J. 2010, 18, 247–260. [Google Scholar] [CrossRef]
  3. Cardona, A.; Carrillo-Rivera, J.J.; Huizar-Alvarez, R.; Graniel-Castro, E. Salinization in coastal aquifers of arid zones: An example from Santo Domingo, Baja California Sur, Mexico. Environ. Geol. 2004, 45, 350–366. [Google Scholar] [CrossRef]
  4. Narayan, K.A.; Schleeberger, C.; Bristow, K.L. Modelling seawater intrusion in the Burdekin Delta irrigation area, North Queensland, Australia. Agric. Water Manag. 2007, 89, 217–228. [Google Scholar] [CrossRef]
  5. Walther, M.; Delfs, J.O.; Grundmann, J.; Kolditz, O.; Liedl, R. Saltwater intrusion modeling: Verification and application to an agricultural coastal arid region in Oman. J. Comput. Appl. Math. 2012, 236, 4798–4809. [Google Scholar] [CrossRef]
  6. Halwani, J.; Omar, W.; Alkadi, F. Intrusion Saline à Tripoli, Internal Report; Lebanese University: Tripoli, Lebanon, 2010. [Google Scholar]
  7. Pachauri, R.K.; Reisinger, A. IPCC Fourth Assessment Report; IPCC: Geneva, Switzerland, 2007. [Google Scholar]
  8. Bear, J. Dynamics of Fluids in Porous Media; American Elsevier: New York, NY, USA; London, UK; Amsterdam, The Netherlands, 1972. [Google Scholar]
  9. Diersch, H.J.; Kolditz, O. Variable-density flow and transport in porous media: Approaches and challenges. Adv. Water Resour. 2002, 25, 899–944. [Google Scholar] [CrossRef]
  10. Tek, M.R. Development of a generalized Darcy equation. J. Pet. Technol. 1957, 9, 45–47. [Google Scholar] [CrossRef]
  11. Diersch, H.J. FEFLOW Reference Manual; Institute for Water Resources Planning and Systems Research Ltd.: Berlin, Germany, 2002; p. 278. [Google Scholar]
  12. Voss, C.I. USGS SUTRA code History, practical use, and application in Hawaii. In Seawater Intrusion in Coastal Aquifers-Concepts, Methods and Practices; Springer: Dordrecht, The Netherlands, 1999; pp. 249–313. [Google Scholar]
  13. Kolditz, O.; Bauer, S.; Bilke, L.; Böttcher, N.; Delfs, J.O.; Fischer, T.; Zehner, B. OpenGeoSys: An open-source initiative for numerical simulation of thermo-hydro-mechanical/chemical (THM/C) processes in porous media. Environ.Earth Sci. 2012, 67, 589–599. [Google Scholar] [CrossRef]
  14. Ackerer, P.; Younes, A.; Mose, R. Modeling variable density flow and solute transport in porous medium: 1. Numerical model and verification. Transp. Porous Media 1999, 35, 345–373. [Google Scholar] [CrossRef]
  15. Badon-Ghyben, W. Nota in verband met de voorgenomen putboring nabij Amsterdam (Notes on the probable results of well drilling near Amsterdam). In Tijdschrift van het Kononklijk Instituut van Ingenieurs; The Hague: Amsterdam, Netherlands, 1888; Volume 9, pp. 8–22. [Google Scholar]
  16. Herzberg, A. Die Wasserversorgung einiger Nordseebader (the water supply of parts of the North Sea coast in Germany). J. Gasbeleucht. Wasserversorg 1901, 44, 815–819. [Google Scholar]
  17. Bear, J. Hydraulics of Groundwater; Mc Grraw-Hill: New York, NY, USA, 1979. [Google Scholar]
  18. Llopis-Albert, C.; Pulido-Velazquez, D. Discussion about the validity of sharp-interface models to deal with seawater intrusion in coastal aquifers. Hydrol. Process. 2014, 28, 3642–3654. [Google Scholar] [CrossRef]
  19. Mehdizadeh, S.S.; Vafaie, F.; Abolghasemi, H. Assessment of sharp-interface approach for saltwater intrusion prediction in an unconfined coastal aquifer exposed to pumping. Environ. Earth Sci. 2015, 73, 8345–8355. [Google Scholar] [CrossRef]
  20. Kacimov, A.R.; Sherif, M.M.; Perret, J.S.; Al-Mushikhi, A. Control of sea-water intrusion by salt-water pumping: Coast of Oman. Hydrogeol. J. 2009, 17, 541–558. [Google Scholar] [CrossRef]
  21. Telesca, L.; Shaban, A.; Gascoin, S.; Darwich, T.; Drapeau, L.; El Hage, M.; Faour, G. Characterization of the time dynamics of monthly satellite snow cover data on Mountain Chains in Lebanon. J. Hydrol. 2014, 519, 3214–3222. [Google Scholar] [CrossRef]
  22. Wetzel, R. Délégation Générale de France au Levant, Section Géologique. Carte Géologique au 1:50,000 Feuille de Tripoli (Liban), Tracés Géoloqique. Ing Géologique Univ de Strasbourg; Dessiné et Publié par l’Armée Libanaise en Colaboration avec l’Université de Strasbourg: Beirut, Lebanon, 1963. [Google Scholar]
  23. Amin, I.E. Groundwater mining in the Tripoli area, Lebanon. In Proceedings of the Denver Annual Meeting, Denver, CO, USA, 27–30 October 2002.
  24. Khair, K.; Khawlie, M.; Haddad, F.; Barazangi, M.; Chaimov, T.; Seber, D. Gravity modeling and geologic setting and tectonics of the central segment of the Dead Sea fault zone. Geology 1993, 21, 739–742. [Google Scholar]
  25. Haramadiyan, D. Report to the Municipality of Tripoli; Tripoli municipality: Tripoli, Lebanon, 2004. [Google Scholar]
  26. Likens, G.E. Biogeochemistry of a Forested Ecosystem; Springer Science & Business Media: New York, NY, USA, 2013. [Google Scholar]
  27. Ward, J.C. Turbulent Flow in Porous Media. J. Hydraul. Div. Proc. ASCE 1964, 5, 1–12. [Google Scholar]
  28. Irmay, S. On the theoretical derivation of Darcy and Forchheimer formulas. Eos Trans. Am. Geophys. Union 1958, 39, 702–707. [Google Scholar] [CrossRef]
  29. Brutsaert, W.; Nieber, J.L. Regionalized drought flow hydrographs from a mature glaciated plateau. Water Resour. Res. 1977, 13, 637–643. [Google Scholar] [CrossRef]
  30. Jazar, M.; Monneau, M. Derivation of seawater intrusion models by formal asymptotic. SIAM J. Appl. Math. 2014, 74, 1152–1173. [Google Scholar]
  31. Hecht, F.; Pironneau, O.; Ohtsuka, K. FreeFem++, version 3.9-2; Laboratoire JL Lions, Université Pierre et Marie Curie: Paris, France, 2010. [Google Scholar]
  32. Hecht, F.; Pironneau, O.; Le Hyaric, A.; Ohtsuka, K. FreeFem++ Manual; Laboratoire JL Lions, Université Pierre et Marie Curie: Paris, France, 2005. [Google Scholar]
  33. Al Bitar, A.; Ababou, R. Random field approach to seawater intrusion in heterogeneous coastal aquifers: Unconditional simulations and statistical analysis. In Geostatistics for Environmental Applications; Springer: Berlin, Germany; Heidelberg, Germany, 2005; pp. 233–248. [Google Scholar]
  34. Ababou, R.; Bagtzoglou, A. BIGFLOW: A Numerical Code for Simulating Flow in Variably Saturated Heterogeneous Geologic Media (Theory and User’s Manual); Report NUREG/CR-6028; US Nuclear Regulatory Commission: Washington, DC, USA, 1993. [Google Scholar]
  35. Henry, H.R. Salt Intrusion into Coastal Aquifers. Ph.D. Dissertation, Columbia University, New York, NY, USA, 1960. [Google Scholar]
  36. Al Bitar, A. Modélisation des Écoulements en Milieu Poreux Hétérogenes 2D/3D, avec Couplages Surface/Souterrain et Densitaires; Institut National Polytechnique de Toulouse: Toulouse, France, 2007. [Google Scholar]
  37. Elder, J.W. Steady free convection in a porous medium heated from below. J. Fluid Mech. 1967, 27, 29–48. [Google Scholar] [CrossRef]
  38. Goswami, R.R.; Clement, T.P. Laboratory-scale investigation of saltwater intrusion dynamics. Water Resour. Res. 2007, 43. [Google Scholar] [CrossRef]
  39. Khayat, Z. Assessment of the National Groundwater Resources of Lebanon Implemented by Joint-Venture ELARD BURGEAP-IGIP and Ribeka on Behalf of the UNDP; Ministry of Energy and Water: Beirut, Lebanon, 2014.
  40. Kerrou, J.; Renard, P.; Cornaton, F.; Perrochet, P. Stochastic forecasts of seawater intrusion towards sustainable groundwater management: Application to the Korba aquifer (Tunisia). Hydrogeol. J. 2013, 21, 425–440. [Google Scholar] [CrossRef]
Figure 1. Location map of principal rivers watersheds in the city, study zone and wells positions, Lebanon map.
Water 08 00104 g001
Figure 2. Elevation and geological maps of area of interest; (a) Elevation Map of Tripoli watershed; (b) Geological map and stratigraphy of Tripoli [23].
Water 08 00104 g002
Figure 3. The study area, lower zone of Tripoli city; (a) Location of pumping zone: Square in blue represents the area where private wells spread strongly, yellow marks are the public wells, the biggest one represents the four wells located in Bhsas in the south of the aquifer the two other represent respectively El-jisr and Malouleh wells; (b) Electrical conductivity in Dam and Farz in 2008 [6].
Water 08 00104 g003
Figure 4. Schematic representation of the computational domain adapted from [30].
Water 08 00104 g004
Figure 5. Schematic domain with boundary conditions.
Water 08 00104 g005
Figure 6. Comparison of solutions (a) without pumping and (b) with pumping. FreeSWIM vs. BFSWIM and analytic solution in (a) and FreeSWIM vs. BFSWIM solution in (b).
Water 08 00104 g006
Figure 7. Mesh discretization of the domain.
Water 08 00104 g007
Figure 8. Interfaces in current situation; (a) Piezometric head h; (b) Interface g.
Water 08 00104 g008
Figure 9. Model validation against hydraulic observation wells; (a) scatter plot between measured and modeled head (m); (b) localization of validation wells, color represents the bias for each well in meters.
Water 08 00104 g009
Figure 10. Position of the saltwater/freshwater interface g in different scenarios; (a) No-pumping “NOP”; (b) Recommendation of 120 L/capita/day “REC”; (c) After 10 years with 250 L/capita/day “10 Y”; (d) After 20 years with 250 L/capita/day “20 Y”.
Water 08 00104 g010
Figure 11. Difference between the position of freshwater/saltwater interface in four situations and the current condition “CUR”: (a) No-pumping “NOP”; (b) Recommendation of 120 L/capita/day “REC”; (c) After 10 years with 250 L/capita/day “10 Y”; (d) After 20 years with 250 L/capita/day “20 Y”.
Water 08 00104 g011
Figure 12. Advancement in-land of the 100 m contour line of the seawater freshwater interface with respect to demographic evolution.
Water 08 00104 g012
Table 1. List of used parameters.
ParameterSymbolUnitDimension
Ground levelam-
Hydraulic headhm-
Freshwater/saltwater interface positiongm-
Substratum levelbm0
Specific yield of the freshwater zone ϕ f m 3 m 3 0 . 15
Specific yield of the saltwater zone ϕ s m 3 m 3 0 . 15
Freshwater source termS m 3 d a y 33,600
Seawater source term S s m 3 d a y 0
Sea level h 0 m200
Hydraulic permeability K m·s - 1 1 . 388 × 10 - 5
Well radiusrm 10 ; 40
Specific fluxψm 3 ·m· - 2 ·s - 1 -
Area of pump zoneAm 2 -
Coefficient for pumping rateλm 3 ·m - 2 ·day - 1 -
Root mean square deviationRMSDm-
Aquifer length L x km2
Saltwater wedge penetration length L 0 km 1 . 1
Density of freshwater ρ f kg·m - 3 1000
Density of seawater ρ s kg·m - 3 1025
Table 2. Pumping rate of public wells.
WellPumping Rate (m 3 /h)
Bhsas195
Malouleh136
El-Jisr204
Table 3. The root mean square error of “FreeSWIM” model in each case in meters.
InterfaceWithout PumpingWith Pumpinp
RMSE (Analytic)RMSE (BFSWIM)RMSE (BFSWIM)
h 0 . 028 0 . 015 0 . 055
g 1 . 13 0 . 601 2 . 19
Table 4. Configuration parameters and pumping rate for the operated wells.
Pump Zone λ i (m·Day - 1 ) A i   (m 2 ) S i (m 3 ·Day - 1 )
Private wells 7 × 10 - 3 3,000,00021,000
Bhsas 0 . 9315 50244680
Malouleh 10 . 394 3143264
El-Jisr 15 . 592 3144896
Table 5. Projected number of inhabitants in Tripoli aquifer area.
YearNumber of Inhabitants
200882,000
201895,000
2028110,000

