
Evapotranspiration in the Nile Basin: Identifying Dynamics and Drivers, 2002–2011

 and
and 
Abstract
:1. Introduction
2. Materials and Methods
2.1. Static Data
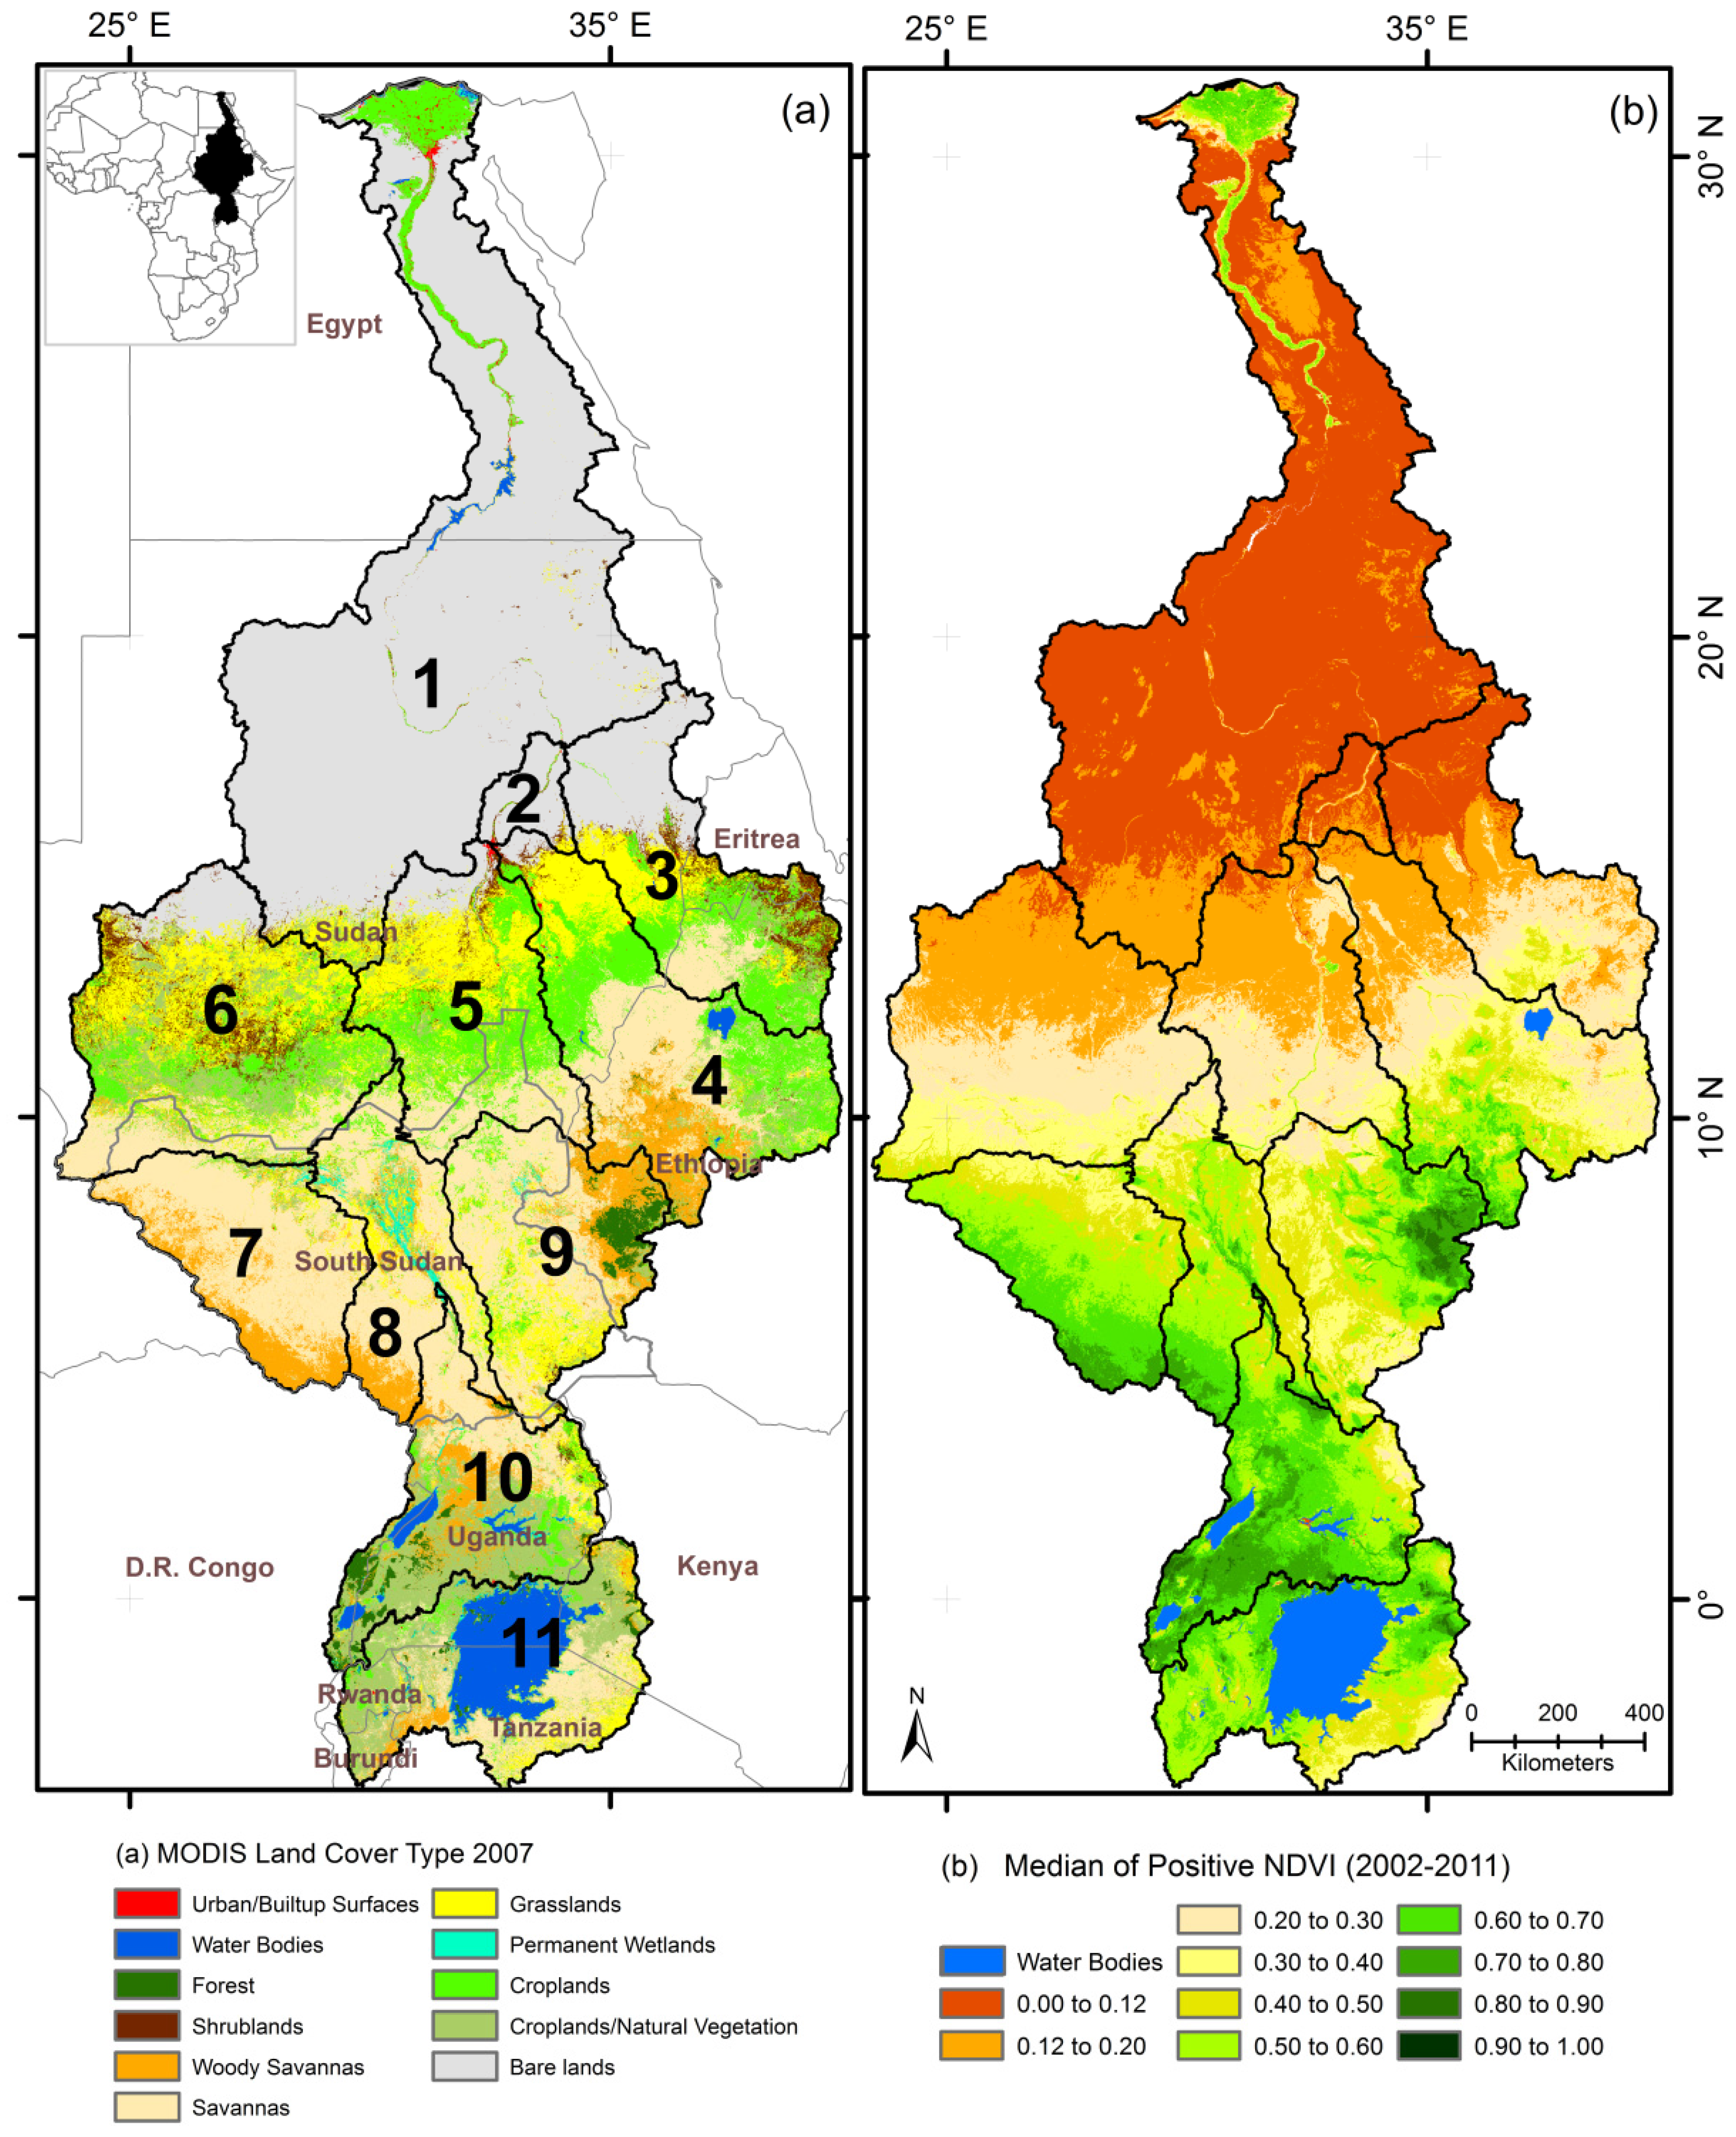
2.1.1. Study Area

2.1.2. Land Cover
2.1.3. Basin Delineation Data
2.2. Time Series Data
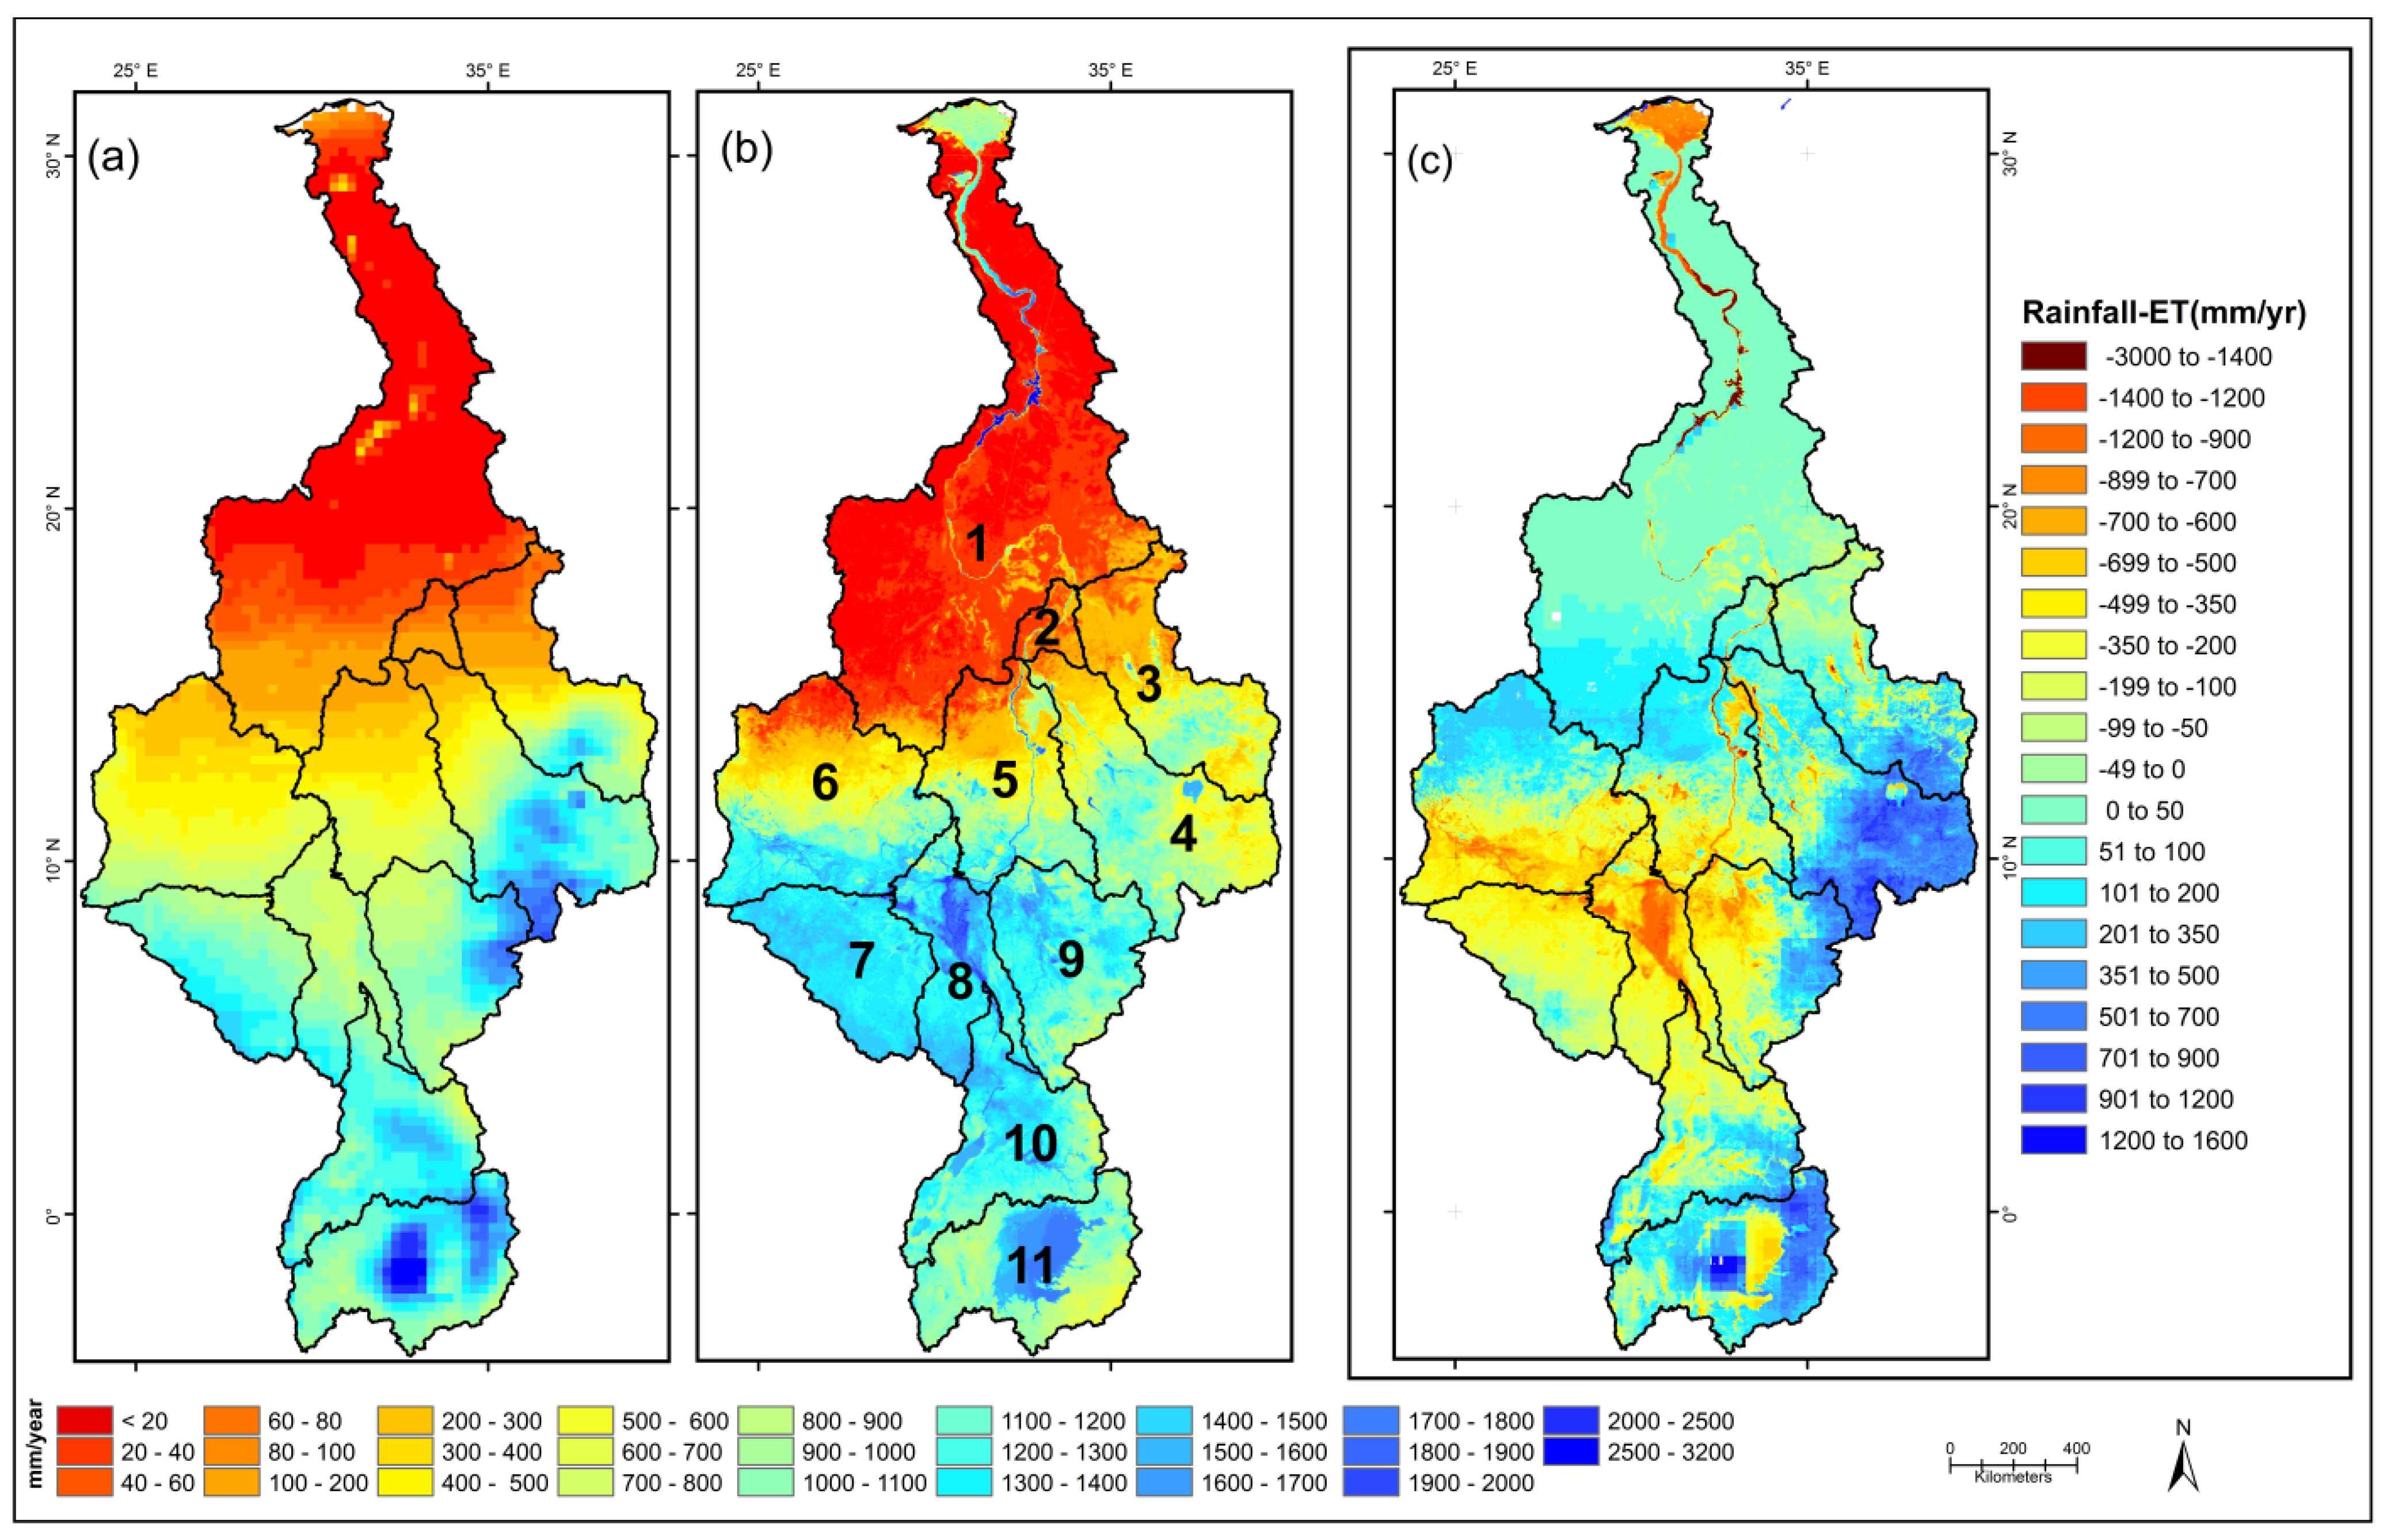
2.2.1. Evapotranspiration Data
2.2.2. Precipitation Data

2.2.3. Vegetation Data
2.3. Statistical Analysis
2.3.1. Correlation Analysis
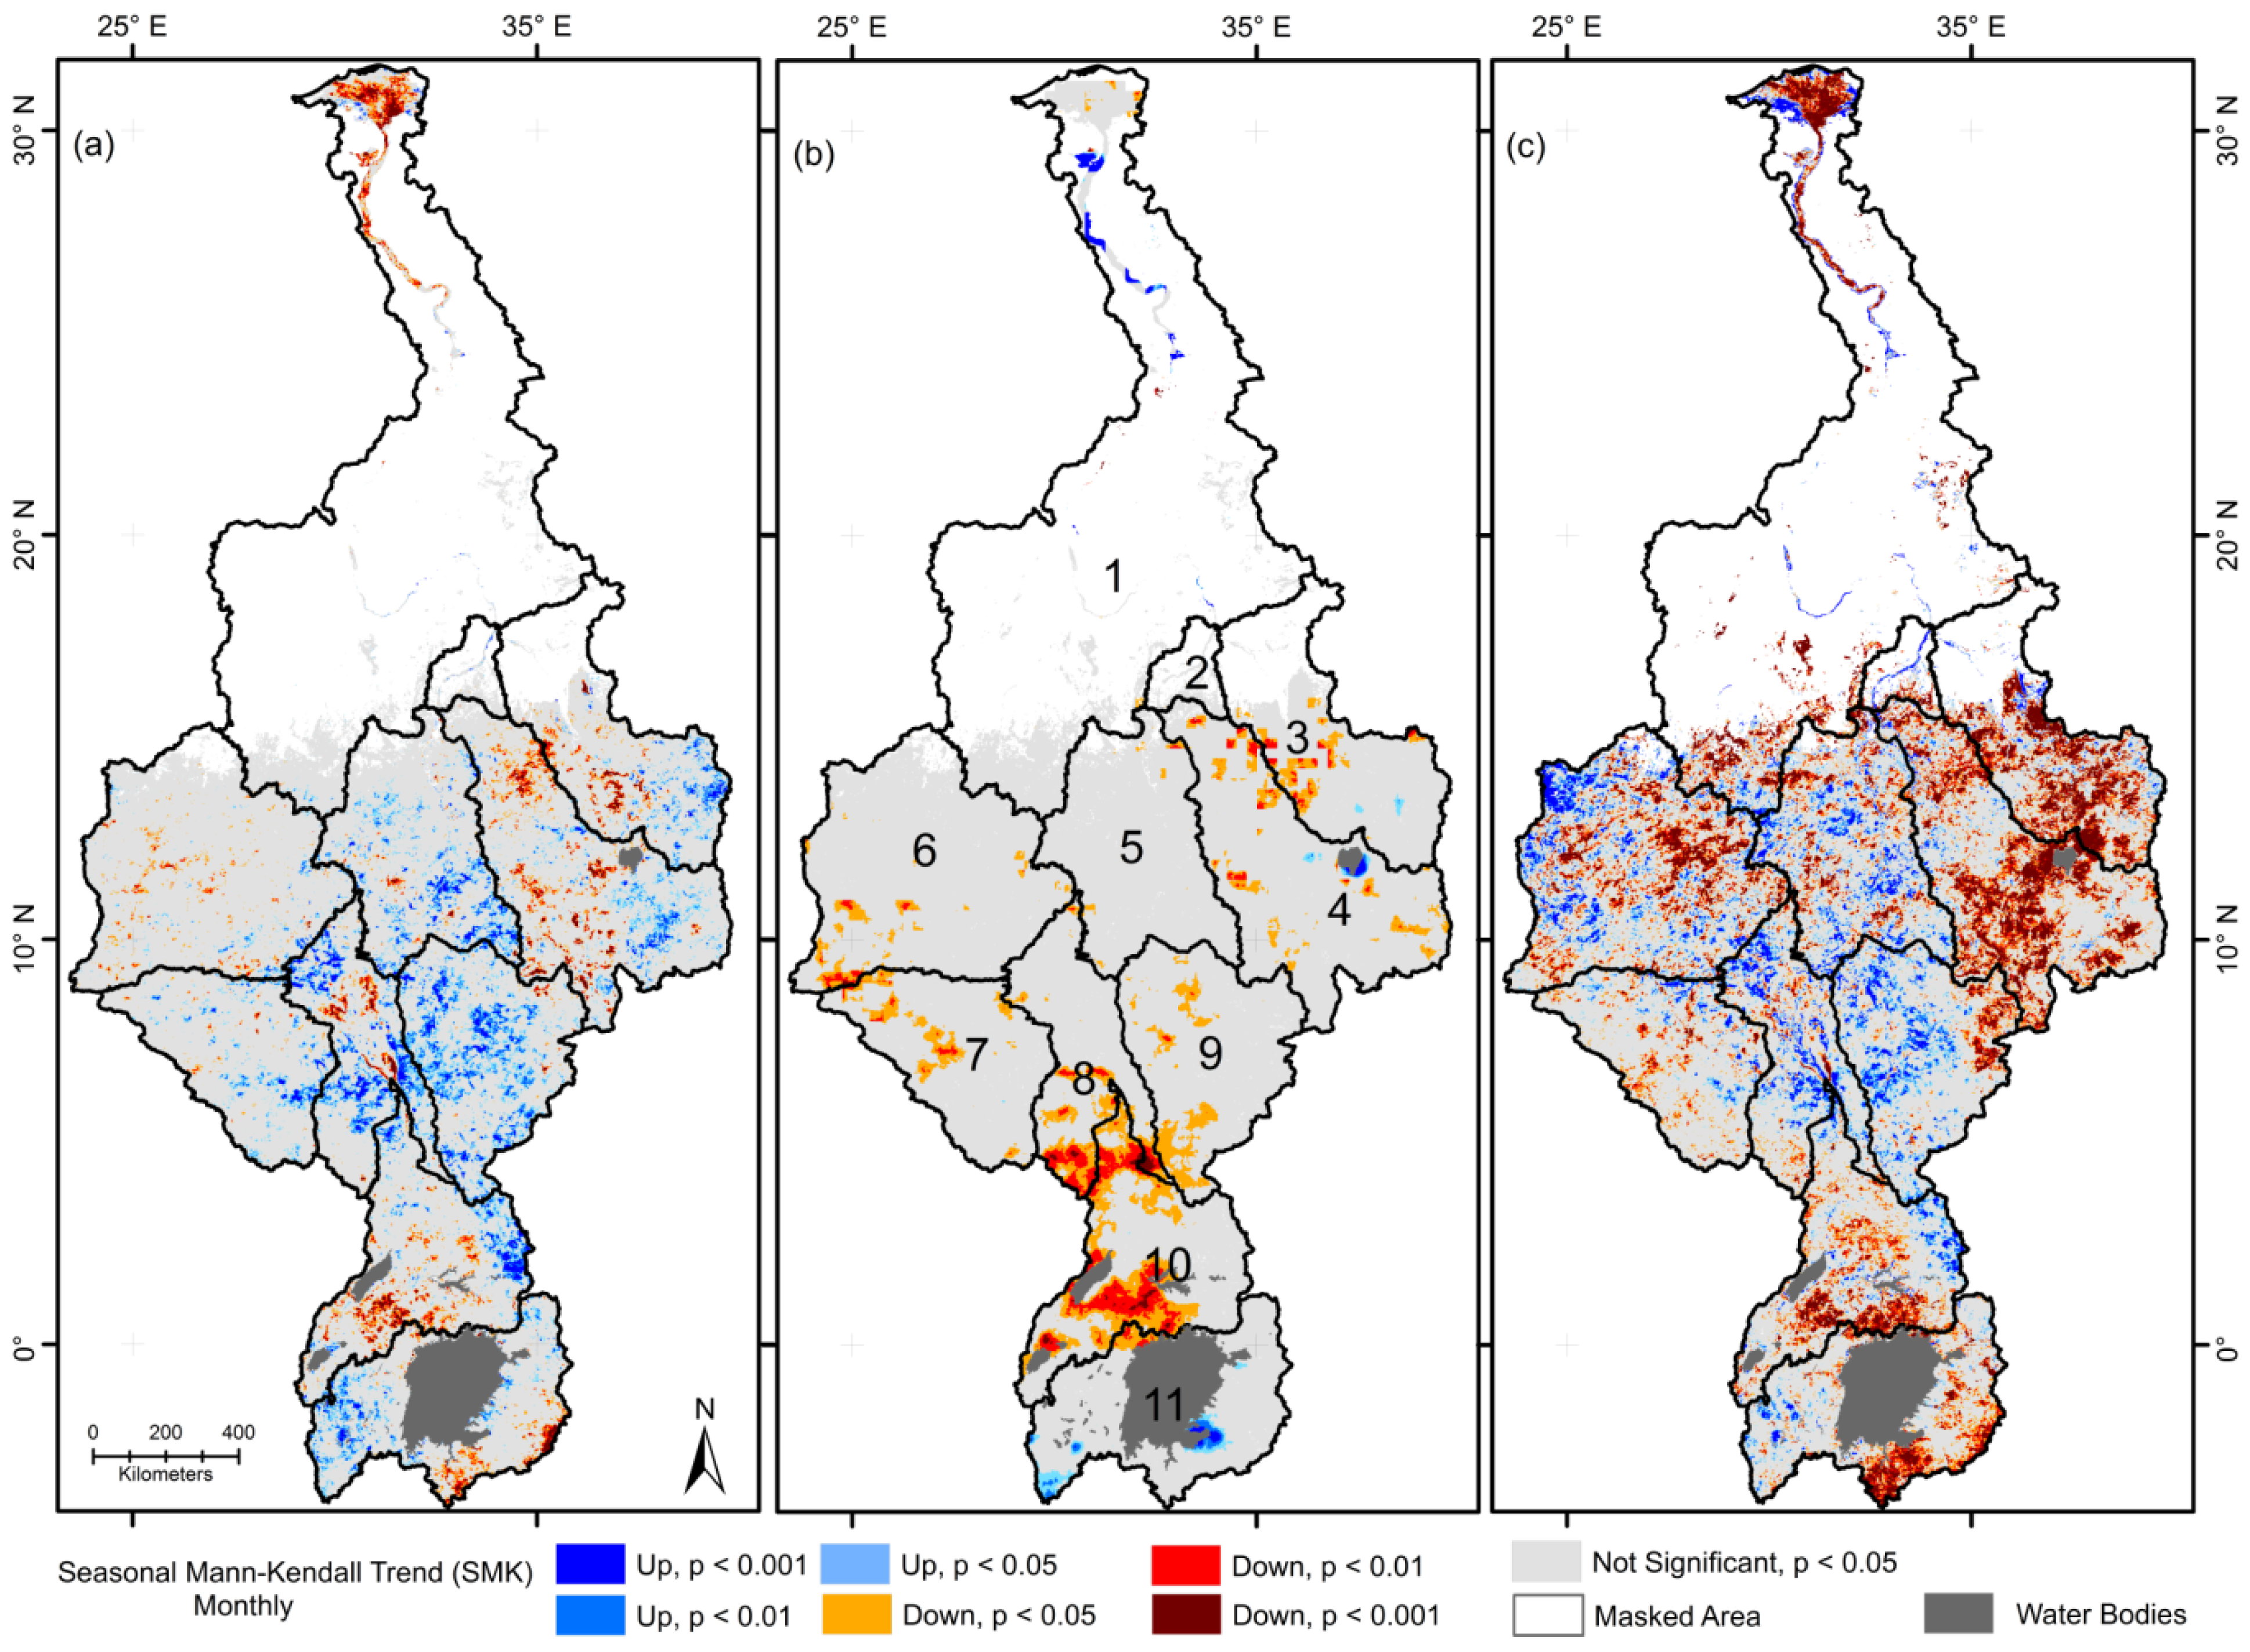
2.3.2. Trend Analysis

2.3.3. Synthesis of Trends

| ET-Rainfall-NDVI Trend Synthesis (1st–2nd–3rd) | |||
|---|---|---|---|
| Rainfall (2nd order) | NDVI (3rd order) | ET (1st order) | |
| p | n | ||
| p | p | ppp | npp |
| o | ppo | npo | |
| n | ppn | npn | |
| o | p | pop | nop |
| o | poo | noo | |
| n | pon | non | |
| n | p | pnp | nnp |
| o | pno | nno | |
| n | pnn | nnn | |
3. Results and Discussion
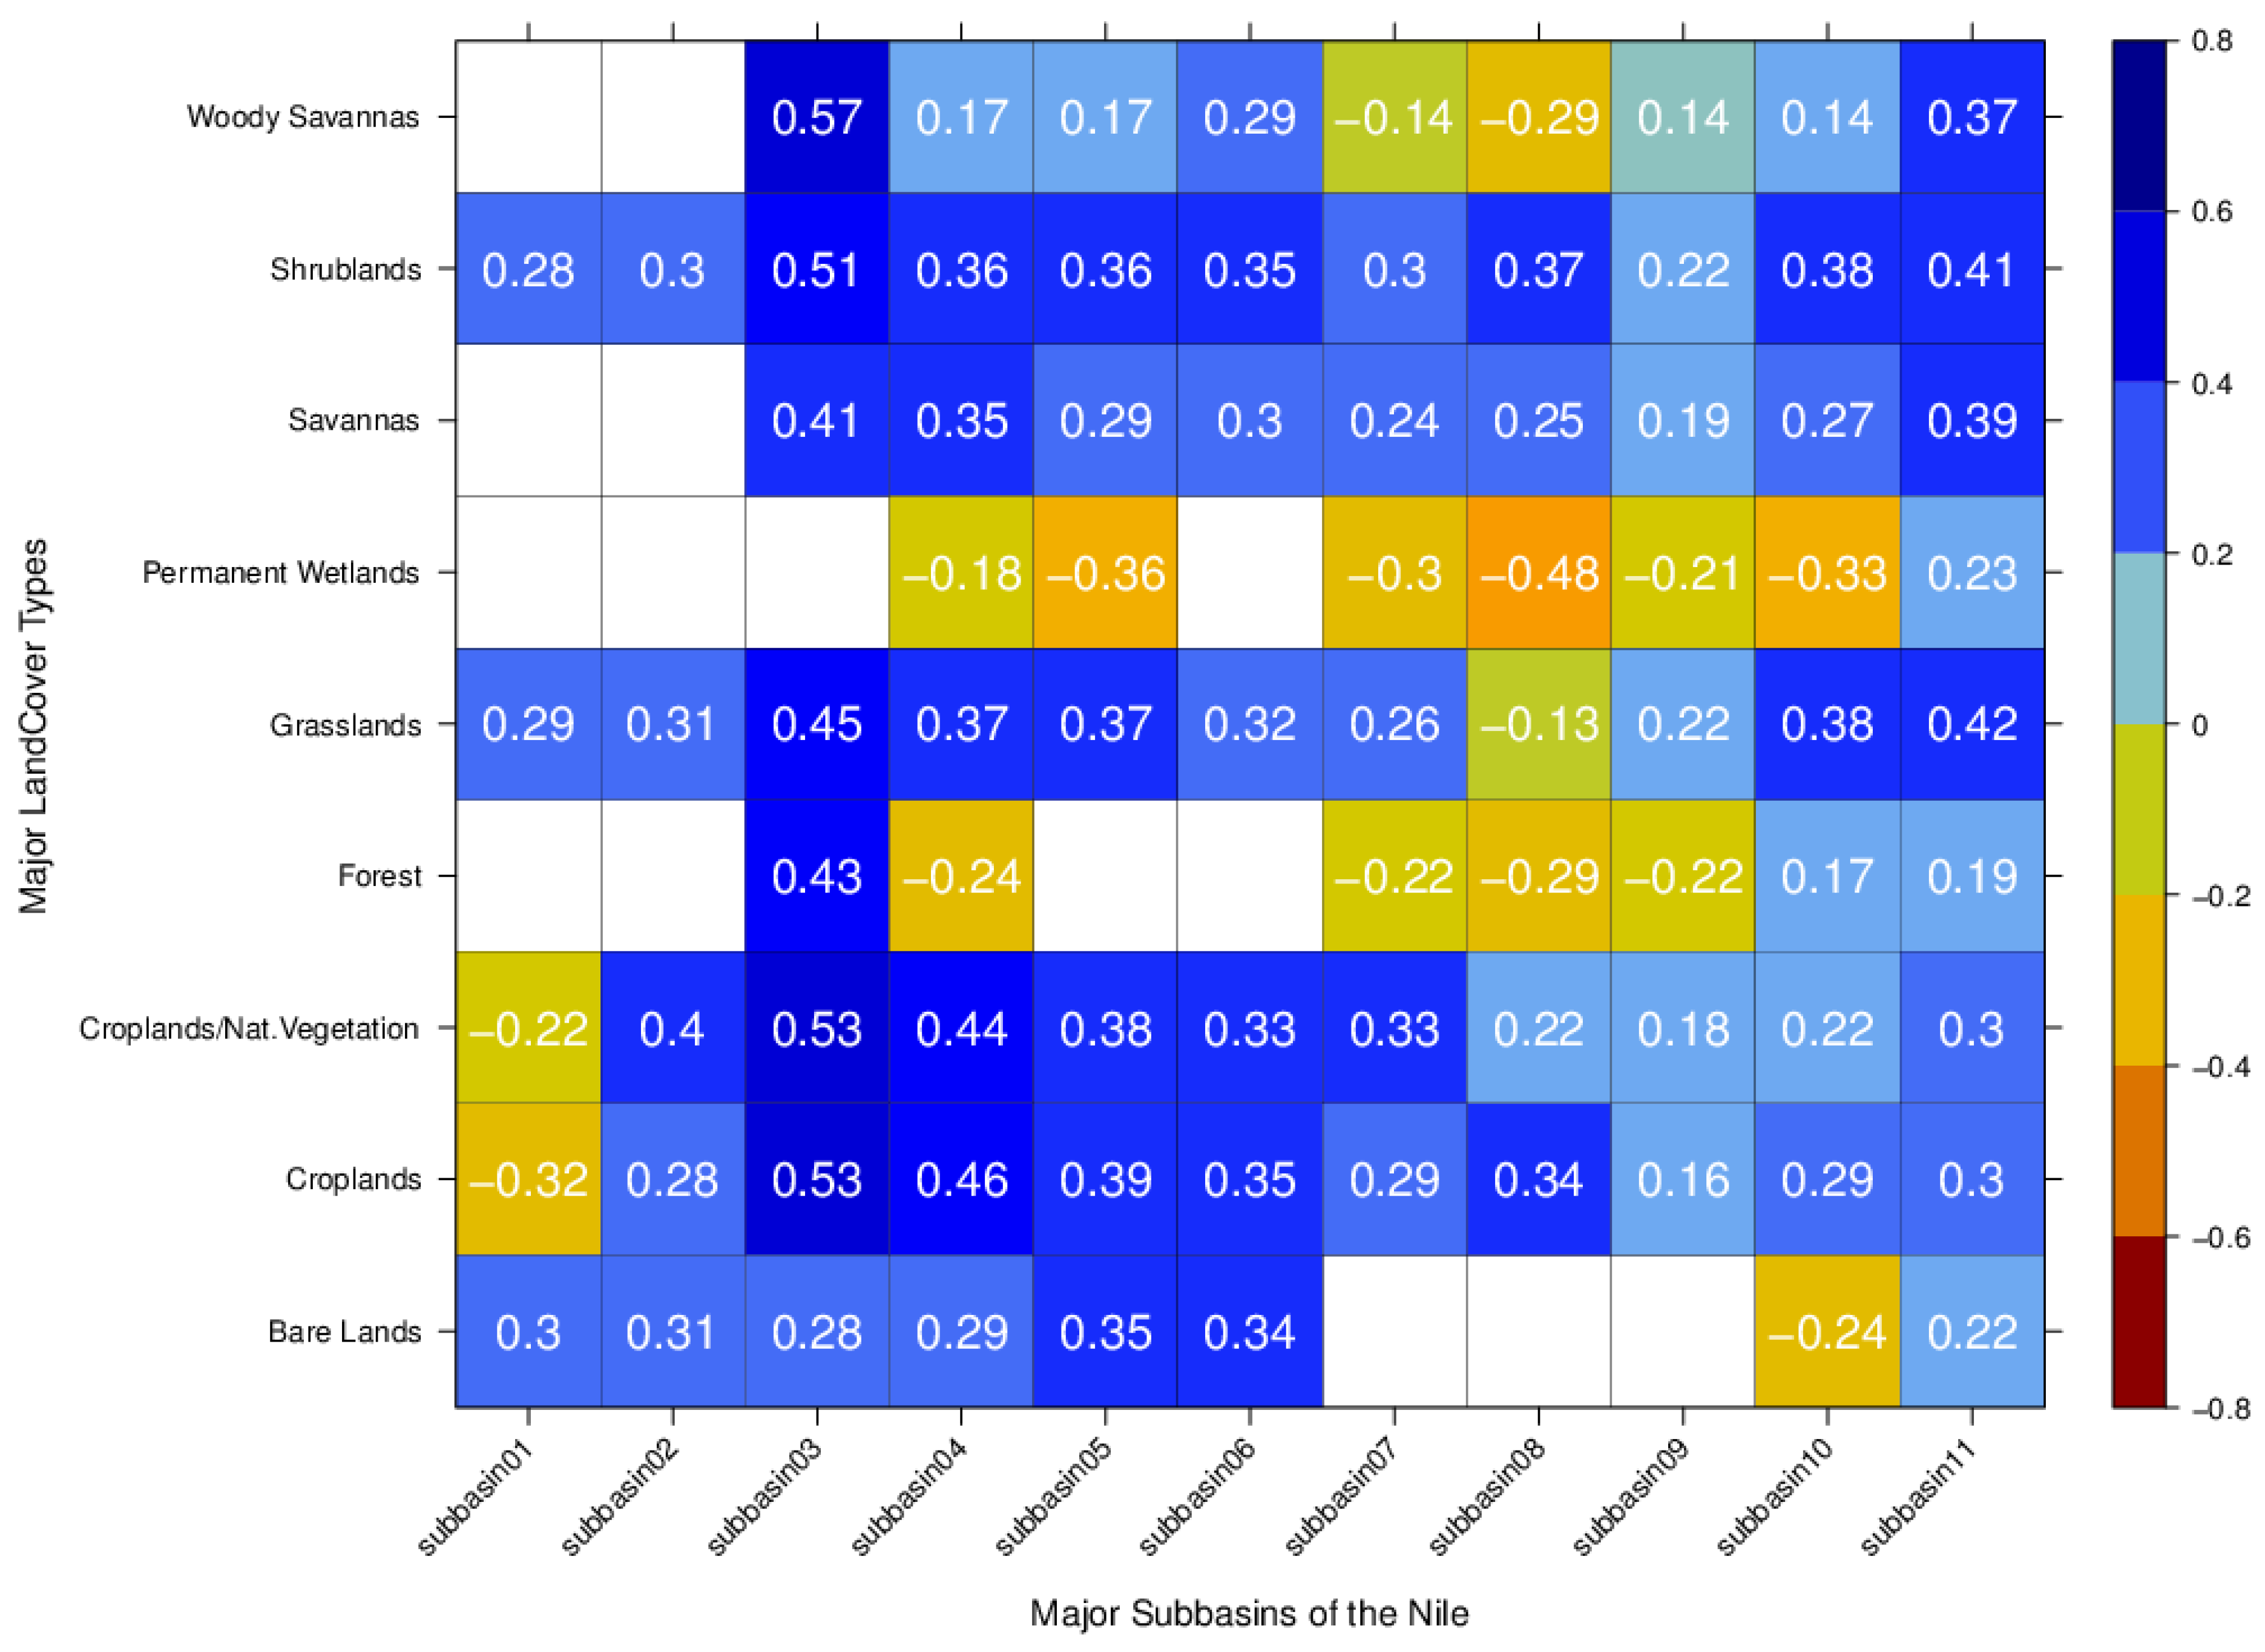
3.1. Temporal Correlations across Space
3.2. Land Cover-ET-Rainfall Relationships

3.3. Temporal Dynamics

3.3.1. ET Patterns
3.3.2. Rainfall Patterns
3.3.3. Vegetation Patterns
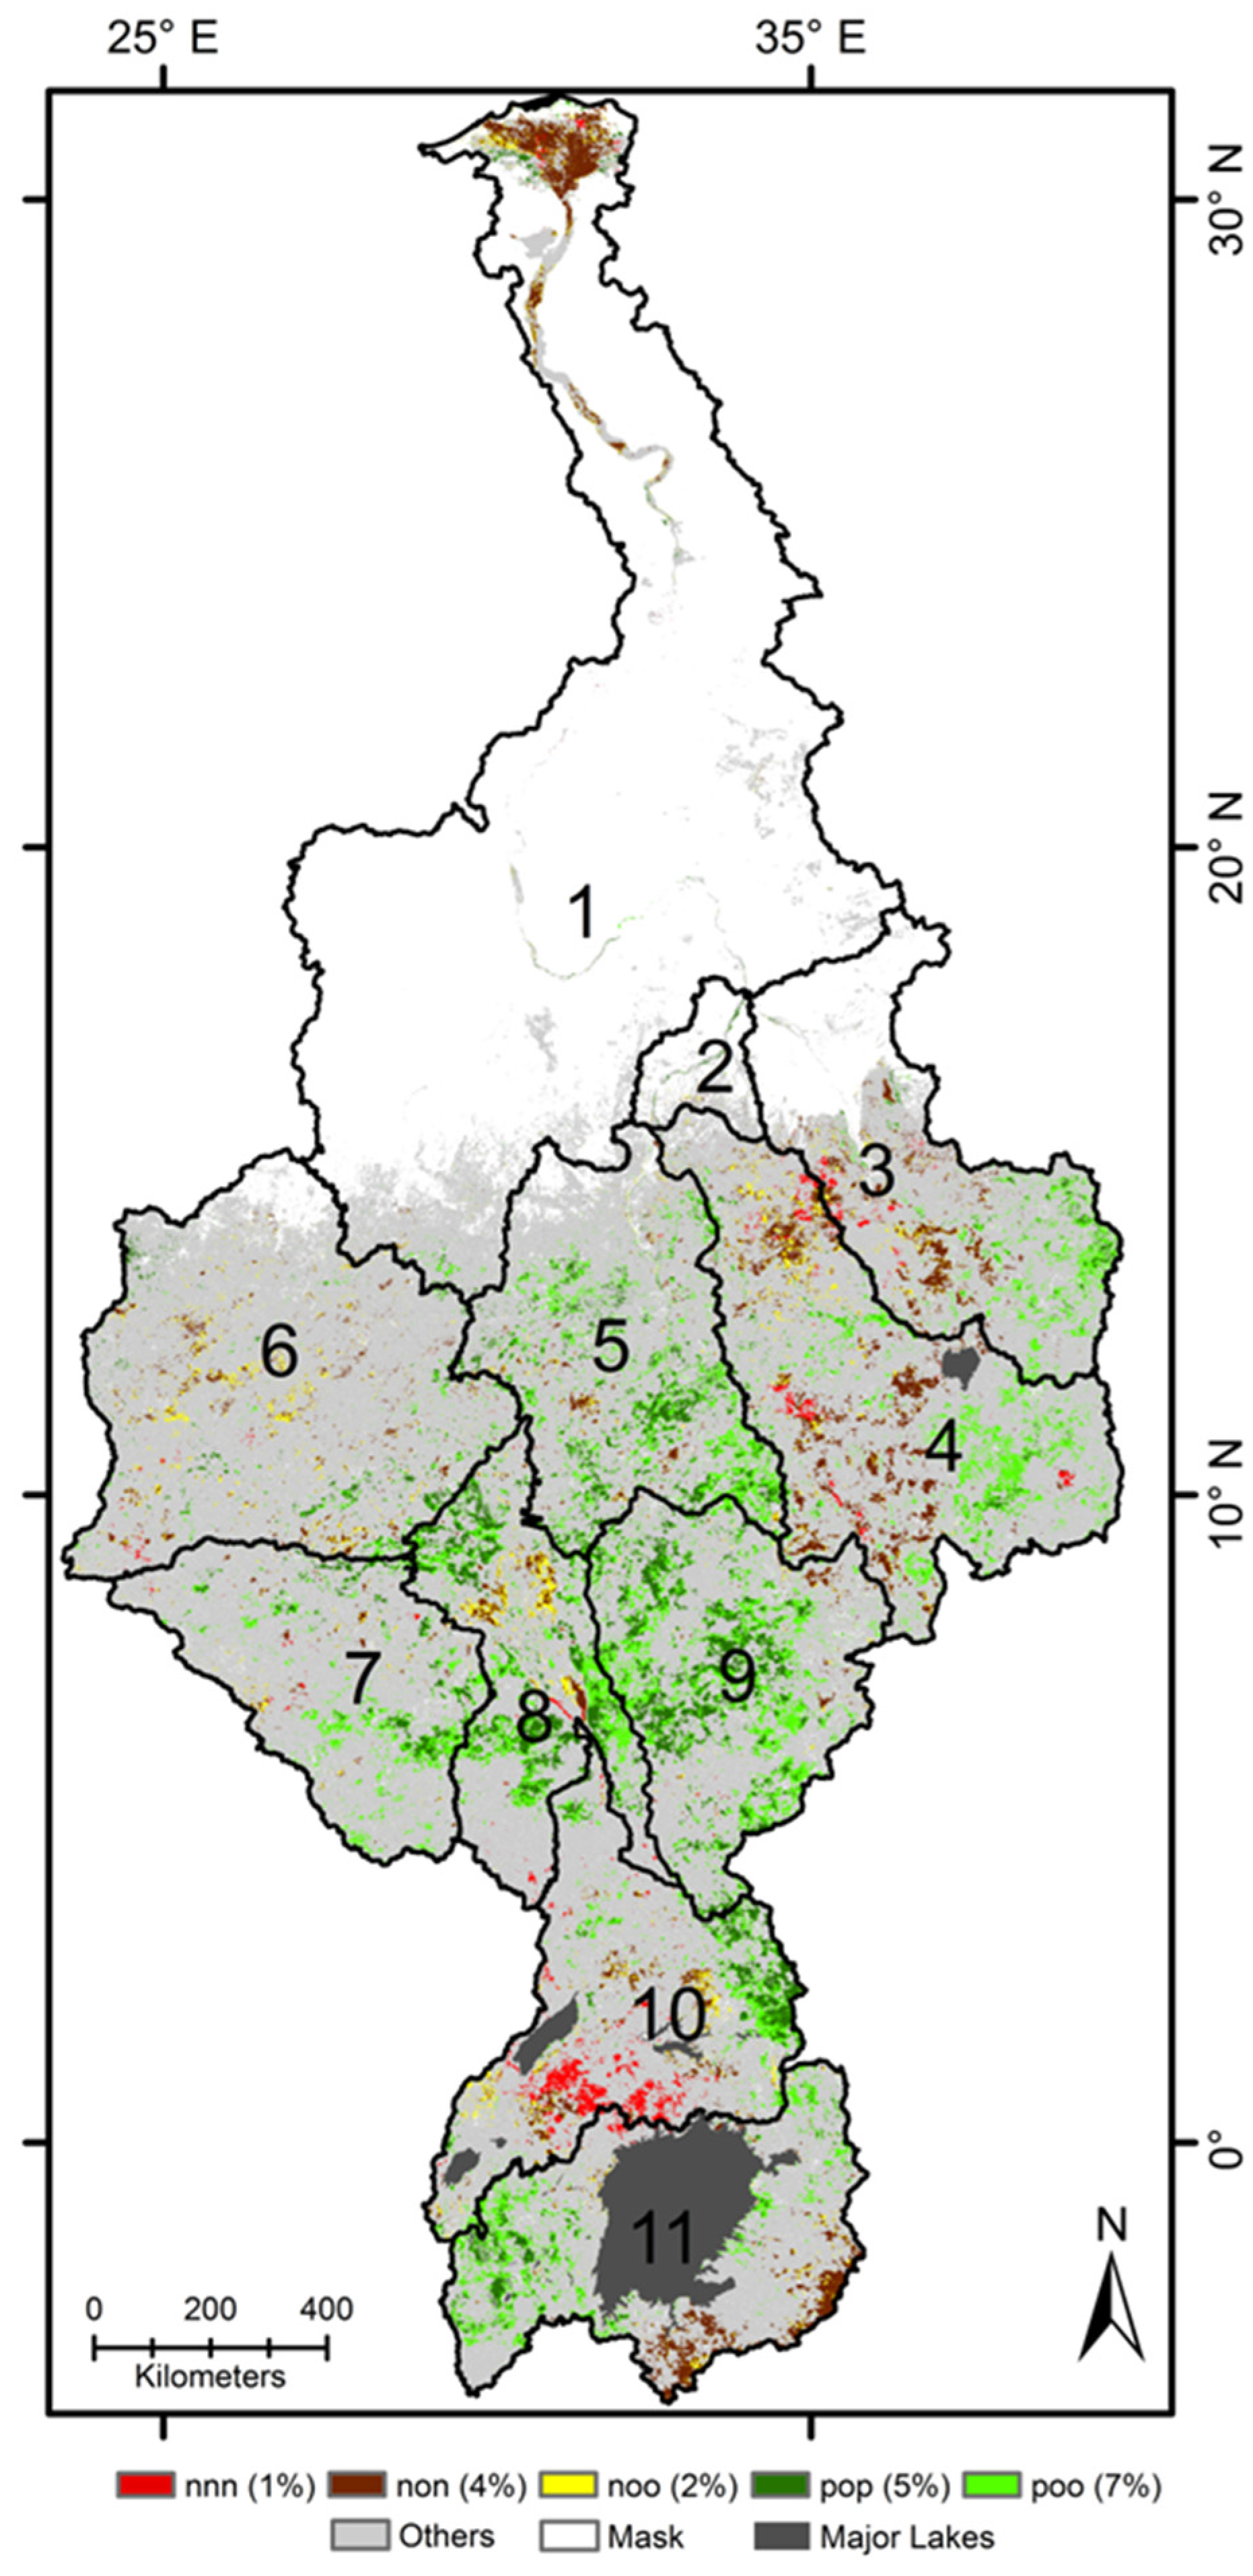
3.4. Synthesis of Individual Trends

4. Conclusions
Acknowledgments
Author Contributions
Conflicts of Interest
References
- Wang, K.; Dickinson, R.E. A review of global terrestrial evapotranspiration: Observation, modeling, climatology, and cimatic variability. Rev. Geophys. 2012, 50. [Google Scholar] [CrossRef]
- Glenn, E.P.; Huete, A.R.; Nagler, P.L.; Hirschboeck, K.K.; Brown, P. Integrating remote sensing and ground methods to estimate evapotranspiration. Crit. Rev. Plant. Sci. 2007, 26, 139–168. [Google Scholar] [CrossRef]
- Trenberth, K.E.; Fasullo, J.T.; Kiehl, J. Earth’s global energy budget. Bull. Am. Meteorol. Soc. 2009, 90, 311–323. [Google Scholar] [CrossRef]
- Van der Ent, R.J.; Savenije, H.H.G.; Schaefli, B.; Steele-Dunne, S.C. Origin and fate of atmospheric moisture over continents. Water Resour. Res. 2010, 46, W09525. [Google Scholar] [CrossRef]
- Mu, Q.; Zhao, M.; Running, S.W. Improvements to a MODIS global terrestrial evapotranspiration algorithm. Remote Sens. Environ. 2011, 115, 1781–1800. [Google Scholar] [CrossRef]
- Bastiaanssen, W.; Perry, C. Agriculture Water Use and Water Productivity in the Large Scale Irrigation Schemes of the Nile Basin; Nile Basin Initiative: Entebbe, Uganda, 2009. [Google Scholar]
- Mohamed, A.; van den Hurk, B.J.J.M.; Savenije, H.H.G.; Bastiaanssen, W.G.M. Impact of the Sudd Wetland on the Nile hydroclimatology. Water Resour. Res. 2005, 40, 1–14. [Google Scholar] [CrossRef]
- Fisher, J.B.; Whittaker, R.J.; Malhi, Y. ET come home: Potential evapotranspiration in geographical ecology. Glob. Ecol. Biogeogr. 2011, 20, 1–18. [Google Scholar] [CrossRef]
- Di Baldassarre, G.; Elshamy, M.; van Griensven, A.; Soliman, E.; Kigobe, M.; Ndomba, P.; Mutemi, J.; Mutua, F.; Moges, S.; Xuan, Y.; et al. Future hydrology and climate in the River Nile Basin: A Review. Hydrol. Sci. J. 2011, 56, 199–211. [Google Scholar] [CrossRef]
- Pricope, N.G.; Husak, G.; Lopez-Carr, D.; Funk, C.; Michaelsen, J. The climate-population nexus in the East African Horn: Emerging degradation trends in rangeland and pastoral livelihood zones. Glob. Environ. Chang. 2013, 23, 1525–1541. [Google Scholar] [CrossRef]
- Hoscilo, A.; Balzter, H.; Bartholomé, E.; Boschetti, M.; Brivio, P.A.; Brink, A.; Clerici, M.; Pekel, J.F. A conceptual model for assessing rainfall and vegetation trends in sub-Saharan Africa from satellite data. Int. J. Clim. 2014. [Google Scholar] [CrossRef]
- Jung, M.; Reichstein, M.; Ciais, P.; Seneviratne, S.I.; Sheffield, J.; Goulden, M.L.; Bonan, G.; Cescatti, A.; Chen, J.; de Jeu, R.; et al. Recent decline in the global land evapotranspiration trend due to limited moisture supply. Nature 2010, 467, 951–954. [Google Scholar] [CrossRef]
- Fensholt, R.; Langanke, T.; Rasmussen, K.; Reenberg, A.; Prince, S.D.; Tucker, C.; Scholes, R.J.; Le, Q.B.; Bondeau, A.; Eastman, R. Greenness in semi-arid areas across the globe 1981–2007—An Earth Observing Satellite based analysis of trends and drivers. Remote Sens. Environ. 2012, 121, 144–158. [Google Scholar] [CrossRef]
- Anyamba, A.; Tucker, C.J. Analysis of Sahelian vegetation dynamics using NOAA-AVHRR NDVI data from 1981–2003. J. Arid Environ. 2005, 63, 596–614. [Google Scholar] [CrossRef]
- Herrmann, S.M.; Anyamba, A.; Tucker, C.J. Recent trends in vegetation dynamics in the African Sahel and their relationship to climate. Glob. Environ. Chang. 2005, 15, 394–404. [Google Scholar] [CrossRef]
- Huber, S.; Fensholt, R.; Rasmussen, K. Water availability as the driver of vegetation dynamics in the African Sahel from 1982 to 2007. Glob. Planet. Chang. 2011, 76, 186–195. [Google Scholar] [CrossRef]
- Zeng, N.; Neelin, J.D.; Lau, K.-M.; Tucker, C.J. Enhancement of interdecadal climate variability in the Sahel by vegetation interaction. Science 1999, 286, 1537–1540. [Google Scholar] [CrossRef]
- Seaquist, J.; Hickler, T.; Eklundh, L.; Ardö, J.; Heumann, B. Disentangling the effects of climate and people on Sahel vegetation dynamics. Biogeosciences 2009, 6, 469–477. [Google Scholar] [CrossRef]
- Marshall, M.; Funk, C.; Michaelsen, J. Examining evapotranspiration trends in Africa. Clim. Dyn. 2012, 38, 1849–1865. [Google Scholar] [CrossRef]
- Alemu, H.; Senay, G.; Kaptue, A.; Kovalskyy, V. Evapotranspiration variability and its association with vegetation dynamics in the Nile Basin, 2002–2011. Remote Sens. 2014, 6, 5885–5908. [Google Scholar] [CrossRef]
- Bastiaanssen, W.; Karimi, P.; Rebelo, L.-M.; Duan, Z.; Senay, G.; Muthuwatte, L.; Smakhtin, V. Earth observation based assessment of the water production and water consumption of Nile Basin agro-ecosystems. Remote Sens. 2014, 6, 10306–10334. [Google Scholar] [CrossRef]
- Karimi, P.; Bastiaanssen, W. Spatial evapotranspiration, rainfall and land use data in water accounting–Part 1: Review of the accuracy of the remote sensing data. Hydrol. Earth Syst. Sci. Discuss. 2014, 11, 1073–1123. [Google Scholar] [CrossRef]
- Camberlin, P. Nile Basin Climates. In The Nile: Origin, Environments, Limnology and Human Use; Dumont, H.J., Ed.; Springer: Berlin, Germany, 2009; pp. 307–333. [Google Scholar]
- Friedl, M.A.; Sulla-Menashe, D.; Tan, B.; Schneider, A.; Ramankutty, N.; Sibley, A.; Huang, X. MODIS Collection 5 global land cover: Algorithm refinements and characterization of new datasets. Remote Sens. Environ. 2010, 114, 168–182. [Google Scholar] [CrossRef]
- Schaaf, C.B.; Gao, F.; Strahler, A.H.; Lucht, W.; Li, X.; Tsang, T.; Strugnell, N.C.; Zhang, X.; Jin, Y.; Muller, J.-P. First operational BRDF, albedo nadir reflectance products from MODIS. Remote Sens. Environ. 2002, 83, 135–148. [Google Scholar] [CrossRef]
- Kaptué Tchuenté, A.T.; Roujean, J.-L.; De Jong, S.M. Comparison and relative quality assessment of the GLC2000, GLOBCOVER, MODIS and ECOCLIMAP land cover data sets at the African continental scale. Int. J. Appl. Earth Obs. Geoinf. 2011, 13, 207–219. [Google Scholar] [CrossRef]
- NASA’s Next Generation Earth Science Discovery Tool (Reverb | Echo). Available online: reverb.echo.nasa.gov/reverb/ (accessed on 6 May 2014).
- Lehner, B.; Verdin, K.; Jarvis, A. HydroSHEDS Technical Documentation, Version 1.0; World Wildlife Fund: Washington, DC, USA, 2006. [Google Scholar]
- United Nations Food and Agriculture Organization (FAO). GEONETWORK Data Portal; FAO: Rome, Italy, 2013. [Google Scholar]
- Senay, G.B.; Bohms, S.; Singh, R.K.; Gowda, P.H.; Velpuri, N.M.; Alemu, H.; Verdin, J.P. Operational Evapotranspiration Mapping Using Remote Sensing and Weather Datasets: A New Parameterization for the SSEB Approach. J. Am. Water Resour. Assoc. 2013, 49, 577–591. [Google Scholar] [CrossRef]
- Senay, G.B.; Budde, M.; Verdin, J.P.; Melesse, A.M. A coupled remote sensing and simplified surface energy balance approach to estimate actual evapotranspiration from irrigated fields. Sensors 2007, 7, 979–1000. [Google Scholar] [CrossRef]
- Huffman, G.J.; Adler, R.F.; Stocker, E.; Bolvin, D.T.; Nelkin, E.J. Analysis of TRMM 3-Hourly Multi-Satellite Precipitation Estimates Computed in Both Real and Post-Real Time. In Proceedings of the 12th Conference on Satellite Meteorology and Oceanography, Long Beach, CA, USA, 8–13 February 2003; pp. 9–13.
- NASA-GSFC Tropical Rainfall Measuring Mission (TRMM). Available online: http://trmm.gsfc.nasa.gov/data_dir/data.html (accessed on 6 July 2013).
- McLeod, A.I. Kendall: Kendall Rank Correlation and Mann-Kendall Trend Test. R Package Version 2.2. 2011. Available online: http://CRAN.R-project.org/package=Kendall (accessed on 19 February 2015).
- De Beurs, K.; Henebry, G. Trend analysis of the Pathfinder AVHRR Land (PAL) NDVI data for the deserts of central Asia. Geosci. Remote Sens. Lett. IEEE 2004, 1, 282–286. [Google Scholar] [CrossRef]
- De Beurs, K.M.; Henebry, G.M. A statistical framework for the analysis of long image time series. Int. J. Remote Sens. 2005, 26, 1551–1573. [Google Scholar] [CrossRef]
- R Development Core Team. R: A Language and Environment for Statistical Computing; R Foundation for Statistical Computing: Vienna, Austria, 2014. [Google Scholar]
- Boschetti, M.; Nutini, F.; Brivio, P.A.; Bartholomé, E.; Stroppiana, D.; Hoscilo, A. Identification of environmental anomaly hot spots in West Africa from time series of NDVI and rainfall. ISPRS J. Photogramm. Remote Sens. 2013, 78, 26–40. [Google Scholar] [CrossRef]
- Tucker, C.J.; Vanpraet, C.L.; Sharman, M.J.; van Ittersum, G. Satellite remote sensing of total herbaceous biomass production in the Senegalese Sahel: 1980–1984. Remote Sens. Environ. 1985, 17, 233–249. [Google Scholar] [CrossRef]
- Nemani, R.R.; Keeling, C.D.; Hashimoto, H.; Jolly, W.M.; Piper, S.C.; Tucker, C.J.; Myneni, R.B.; Running, S.W. Climate-driven increases in global terrestrial net primary production from 1982 to 1999. Science 2003, 300, 1560–1563. [Google Scholar] [CrossRef]
- Karajeh, F.; Oweis, T.; Swelam, A.; El-Gindy, A.-G.; El-Quosy, D.E.D.; Khalifa, H.; El-Kholy, M.; El-Hafez, S.A.A. Water and Agriculture in Egypt; International Center for Agricultural Research in the Dry Areas (ICARDA): Beirut, Lebanon, 2011. [Google Scholar]
- Gersfelt, B. Allocating Irrigation Water in Egypt. In Food Policy for Developing Countries: Case Studies; Pinstrup-Andersen, P., Cheng, F., Eds.; Cornell University Library: Ithaca, NY, USA, 2007; p. 14. [Google Scholar]
- Wichelns, D.; Qadir, M. Achieving sustainable irrigation requires effective management of salts, soil salinity, and shallow groundwater. Agric. Water Manag. 2015, 157, 31–38. [Google Scholar] [CrossRef]
- El Baroudy, A.A.; Moghanm, F.S. Combined use of remote sensing and GIS for degradation risk assessment in some soils of the Northern Nile Delta, Egypt. Egypt J. Remote Sens. Space Sci. 2014, 17, 77–85. [Google Scholar] [CrossRef]
- Barnes, J. Mixing waters: The reuse of agricultural drainage water in Egypt. Geoforum 2014, 57, 181–191. [Google Scholar] [CrossRef]
- Hassanein, M.; Fahim, M.; Khalil, A.; Abolmaty, S.; Refaie, K.; Taqi, M.; Abou Hadid, A. Impact of urbanization on agricultural land losses and climate change Case study: Gharbiah Governorate, Egypt. J. Am. Sci. 2014, 10, 99–107. [Google Scholar]
- Khalil, A.; Essa, Y.; Hassanein, M. Monitoring Agricultural Land Degradation in Egypt Using MODIS NDVI Satellite Images. Nat. Sci. 2014, 12, 15–21. [Google Scholar]
- Bakr, N.; Weindorf, D.; Bahnassy, M.; Marei, S.; El-Badawi, M. Monitoring land cover changes in a newly reclaimed area of Egypt using multi-temporal Landsat data. Appl. Geogr. 2010, 30, 592–605. [Google Scholar] [CrossRef]
- El-Shirbeny, M.A.; Aboelghar, M.A.; Arafat, S.M.; El-Gindy, A.-G.M. Assessment of the mutual impact between climate and vegetation cover using NOAA-AVHRR and Landsat data in Egypt. Arab. J. Geosci. 2014, 7, 1287–1296. [Google Scholar] [CrossRef]
- Abd El-Kawy, O.R.; Rød, J.K.; Ismail, H.A.; Suliman, A.S. Land use and land cover change detection in the western Nile Delta of Egypt using remote sensing data. Appl. Geogr. 2011, 31, 483–494. [Google Scholar] [CrossRef]
- Johnston, R. Availability of water for agriculture in the Nile Basin. In The Nile River Basin, Water, Agriculture, Governance and Livelihoods; Awulachew, S.B., Smakhtin, V., Molden, D., Peden, D., Eds.; Routledge-Earthscan: Abingdon, UK, 2012; pp. 61–83. [Google Scholar]
- Mengistu, D.; Bewket, W.; Lal, R. Recent spatiotemporal temperature and rainfall variability and trends over the Upper Blue Nile River Basin, Ethiopia. Int. J. Clim. 2014, 34, 2278–2292. [Google Scholar] [CrossRef]
- Tesemma, Z.K.; Mohamed, Y.A.; Steenhuis, T.S. Trends in rainfall and runoff in the Blue Nile Basin: 1964–2003. Hydrol. Process. 2010, 24, 3747–3758. [Google Scholar] [CrossRef]
- Senay, G.B.; Asante, K.; Artan, G. Water balance dynamics in the Nile Basin. Hydrol. Process. 2009, 23, 3675–3681. [Google Scholar] [CrossRef]
© 2015 by the authors; licensee MDPI, Basel, Switzerland. This article is an open access article distributed under the terms and conditions of the Creative Commons Attribution license (http://creativecommons.org/licenses/by/4.0/).
Share and Cite
Alemu, H.; Kaptué, A.T.; Senay, G.B.; Wimberly, M.C.; Henebry, G.M. Evapotranspiration in the Nile Basin: Identifying Dynamics and Drivers, 2002–2011. Water 2015, 7, 4914-4931. https://doi.org/10.3390/w7094914
Alemu H, Kaptué AT, Senay GB, Wimberly MC, Henebry GM. Evapotranspiration in the Nile Basin: Identifying Dynamics and Drivers, 2002–2011. Water. 2015; 7(9):4914-4931. https://doi.org/10.3390/w7094914
Chicago/Turabian StyleAlemu, Henok, Armel T. Kaptué, Gabriel B. Senay, Michael C. Wimberly, and Geoffrey M. Henebry. 2015. "Evapotranspiration in the Nile Basin: Identifying Dynamics and Drivers, 2002–2011" Water 7, no. 9: 4914-4931. https://doi.org/10.3390/w7094914